Embed Size (px)
Citation preview
Date of Draft: 7/1/03
Neuronal Studies of Decision Making in the Visual-Saccadic System
Paul W. Glimcher and Michael Dorris
Center for Neural Science, New York University, New York, NY 10003, USA
Paul W. Glimcher, Ph.D.Center for Neural Science4 Washington Place, 809New York, NY 10013
Phone: 212-998-3904FAX: [email protected]

Glimcher, Paul W. / page 2
Introduction
Making a behaviorally relevant decision of any kind involves selecting, and
ultimately executing, a course of action. To accomplish this, organisms must combine
available sensory data with stored information about the structure of the environment in a
manner appropriate to the type of decision that they face. Over the last few decades
neuroscientists have examined decision making by focusing on conditions in which sensory
signals identify a single response as rewarded, or in which learned information about the
probabilities and magnitudes of rewards associated with each possible action specify the best
single response. These studies have yielded insights into the sensory-motor pathways and
computational processes that underlie these forms of decision making, and the basic outlines
of the circuits responsible for simple decision making are now beginning to emerge. We
have, however, only just begun to study the kinds of decisions that are made when
environmental conditions do not uniquely identify a best single response from amongst a set
of alternatives. It is at present unclear how the neural architecture produces decisions under
such free choice conditions. Some of the most promising research aimed at this problem has
begun to employ analytic techniques developed in the social sciences, and these studies have
begun to define a rigorous approach that can be used to study even the most complicated
forms of decision making. While real theoretical and experimental challenges remain, these
approaches are laying the biological foundations for studying one of the most elusive
properties of mind, the neural basis of voluntary choice.
Glimcher, Paul W. / page 3
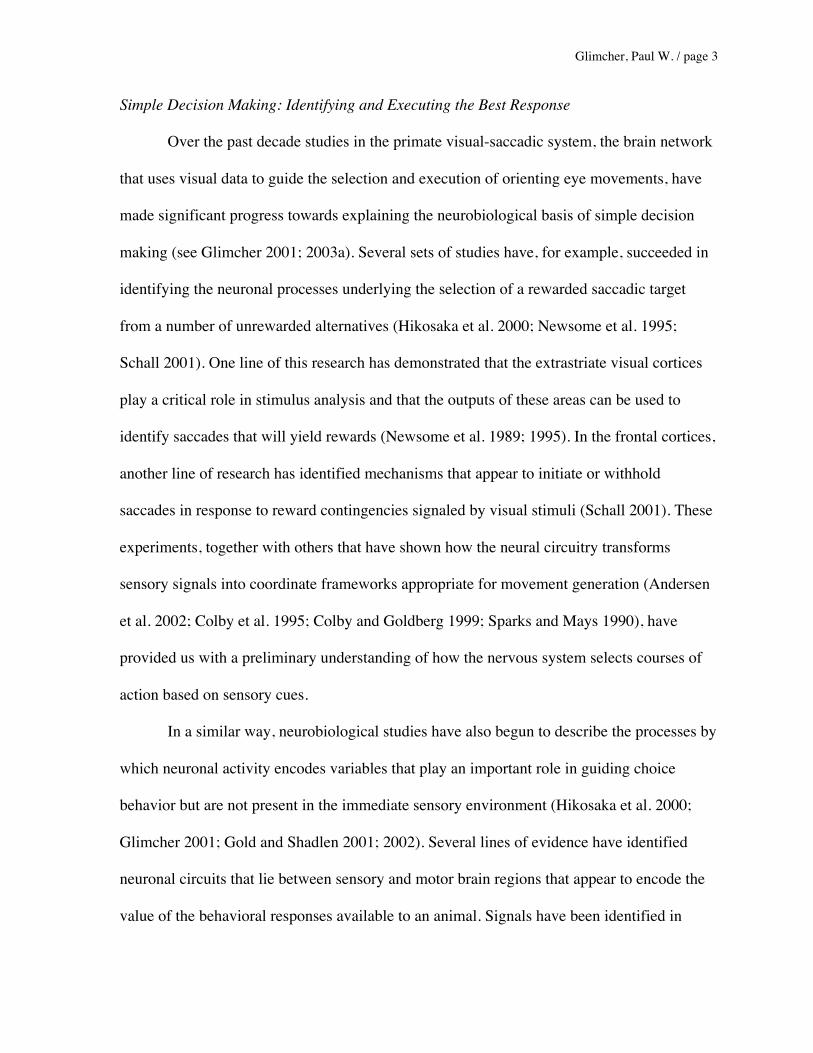
Simple Decision Making: Identifying and Executing the Best Response
Over the past decade studies in the primate visual-saccadic system, the brain network
that uses visual data to guide the selection and execution of orienting eye movements, have
made significant progress towards explaining the neurobiological basis of simple decision
making (see Glimcher 2001; 2003a). Several sets of studies have, for example, succeeded in
identifying the neuronal processes underlying the selection of a rewarded saccadic target
from a number of unrewarded alternatives (Hikosaka et al. 2000; Newsome et al. 1995;
Schall 2001). One line of this research has demonstrated that the extrastriate visual cortices
play a critical role in stimulus analysis and that the outputs of these areas can be used to
identify saccades that will yield rewards (Newsome et al. 1989; 1995). In the frontal cortices,
another line of research has identified mechanisms that appear to initiate or withhold
saccades in response to reward contingencies signaled by visual stimuli (Schall 2001). These
experiments, together with others that have shown how the neural circuitry transforms
sensory signals into coordinate frameworks appropriate for movement generation (Andersen
et al. 2002; Colby et al. 1995; Colby and Goldberg 1999; Sparks and Mays 1990), have
provided us with a preliminary understanding of how the nervous system selects courses of
action based on sensory cues.
In a similar way, neurobiological studies have also begun to describe the processes by
which neuronal activity encodes variables that play an important role in guiding choice
behavior but are not present in the immediate sensory environment (Hikosaka et al. 2000;
Glimcher 2001; Gold and Shadlen 2001; 2002). Several lines of evidence have identified
neuronal circuits that lie between sensory and motor brain regions that appear to encode the
value of the behavioral responses available to an animal. Signals have been identified in

Glimcher, Paul W. / page 4
parietal cortex and basal ganglia, for example, which encode either the amount of reward that
a movement will produce or the likelihood that a movement will produce a reward (Kawagoe
et al. 1998; Platt and Glimcher 1999; Handel and Glimcher 2000).
There are, however, classes of behavior that these studies have failed to engage,
behaviors in which a single most valuable response is not fully specified by the information
available in the stimulus or environment. It is not yet clear how the neural architecture
accomplishes movement selection under these free choice conditions. One problem faced by
these inquiries is that traditional physiological conceptualizations of the sensory-to-motor
process offer very few tools for describing such free choice behavior. This has recently led a
group of physiologists to turn to social scientific theories of decision making, which provide
a powerful corpus of mathematical techniques specifically designed for the study of these
classes of behavior.
Economic Models of Decision Making
A central goal of the social sciences has been to define the decision making process in
general. Economic models, in particular, have been quite successful in formally describing
simple decision making for over a century (e.g., Kreps 1990). It is only recently, however,
that these social scientists have developed tools for characterizing decision making under
conditions in which subjects are free to make any of several responses that have
incomppletely specified values. Of particular interest to economists, in this regard, are
situations in which humans interact with other decision makers whose behavior is
unpredictable (e.g., Fudenberg and Tirole 1991). Consider two opponents repeatedly playing
the childhood game of rock-paper-scissors. In each round, both players must simultaneously
choose either rock, paper or scissors; paper beats rock, scissors beats paper, and rock beats

Glimcher, Paul W. / page 5
scissors. The responses of the players are not constrained because no response is uniquely
correct. Without knowing in advance exactly how one’s opponent will behave, a subject
cannot produce a fixed single strategy that will always yield a maximal reward under a given
set of conditions.
The economic theory of games approaches the formal study of this type of behavior
by assuming that all players desire strategies that will maximize their gains given the
assumption that other players seek to do the same. Thus, when faced with a the opportunity
to make a decision, players are assumed to consider the sensory and environmental cues that
might influence the values of the options available to them, and then to adopt a behavioral
strategy that combines this information with a strategic consideration of their opponent’s
likely behavior. Economists refer to strategies of this type as rational. If two humans playing
rock-paper-scissors behave rationally, they each settle on the strategy of choosing each
possible action roughly one-third of the time.
Quantifying the Value of a Strategy
In games like rock-paper-scissors a stable behavioral strategy arises when the average
subjective value of each available option, rock, or paper or scissors, is rendered equivalent
by the behavior of one’s opponent. As long as one’s opponent is equally likely to choose
rock or paper or scissors, then choosing any response has an equal probability of winning,
and hence an equal subjective value. Economists employ two related but distinct measures to
estimate the value of any course of action. The first is an objective measure, known as
expected value, which is determined by multiplying the gain that could be realized from an
action by the probability that the gain would be realized. The second is a subjective measure,
expected utility, computed by adjusting the expected value to reflect subjective

Glimcher, Paul W. / page 6
considerations, typically an aversion to risky courses of action. In practice, economists
presume that it is this second measure which guides choice.
The rationale for the first of these measures derives from the work of Blaise Pascal
(Arnauld and Nicole 1662/1994; Pascal, 1670/1966). If one chooses rock, there is a 50%
chance of winning one dollar and a 50% chance of losing one dollar (assuming that if the
other player also picks rock the game is repeated). Therefore, over many repeated plays the
average value, or expected value, of rock is 0 cents. Behavioral studies (Bernoulli,
1738/1954; Stephens and Krebs, 1986; Kreps, 1990) have, however, demonstrated that in
many situations humans and animals reliably select courses of action that do not yield the
maximal expected value, particularly when the option yielding maximal expected value
involves significant risk. Under these conditions subjective and objective measures of value
can be shown to differ empirically. Consider choosing between two actions, one which offers
a 100% chance of earning $250,000 and a second which offers a 50% chance of earning
$500,000 and a 50% chance of earning nothing. Both actions have equal expected values
($250,000), but most humans do not view them as equally desirable, preferring the certain
gain of $250,000. Most humans, however, do find a 50% chance of winning $8,000,000
preferable to a guaranteed $250,000. The subjective value, or utility, of $500,000 is thus less
than twice the subjective value of $250,000 for most decision makers, whereas the subjective
value of $8,000,000 is significantly more than twice the subjective value of $250,000. The
subjective estimate of average value , or expected utility, is presumed to reflect, amongst
other things, a natural aversion to risk by human and animal decision makers. Thus a
decision maker’s utility function, which can vary with his internal state, provides a means for
Glimcher, Paul W. / page 7
combining sensory data and a representation of environmental uncertainty in a manner that
encapsulates subjective preference.
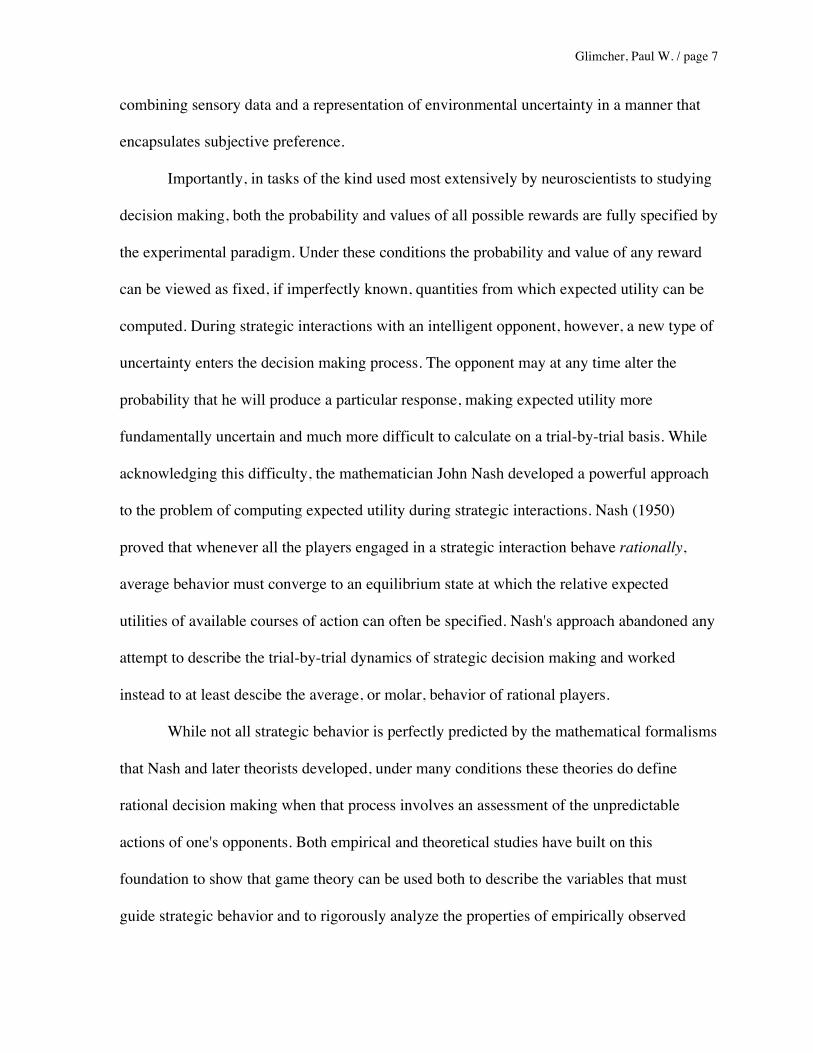
Importantly, in tasks of the kind used most extensively by neuroscientists to studying
decision making, both the probability and values of all possible rewards are fully specified by
the experimental paradigm. Under these conditions the probability and value of any reward
can be viewed as fixed, if imperfectly known, quantities from which expected utility can be
computed. During strategic interactions with an intelligent opponent, however, a new type of
uncertainty enters the decision making process. The opponent may at any time alter the
probability that he will produce a particular response, making expected utility more
fundamentally uncertain and much more difficult to calculate on a trial-by-trial basis. While
acknowledging this difficulty, the mathematician John Nash developed a powerful approach
to the problem of computing expected utility during strategic interactions. Nash (1950)
proved that whenever all the players engaged in a strategic interaction behave rationally,
average behavior must converge to an equilibrium state at which the relative expected
utilities of available courses of action can often be specified. Nash's approach abandoned any
attempt to describe the trial-by-trial dynamics of strategic decision making and worked
instead to at least descibe the average, or molar, behavior of rational players.
While not all strategic behavior is perfectly predicted by the mathematical formalisms
that Nash and later theorists developed, under many conditions these theories do define
rational decision making when that process involves an assessment of the unpredictable
actions of one's opponents. Both empirical and theoretical studies have built on this
foundation to show that game theory can be used both to describe the variables that must
guide strategic behavior and to rigorously analyze the properties of empirically observed

Glimcher, Paul W. / page 8
human voluntary actions. These observations suggest that approaches to the study of free
choice behavior rooted in economic theory may ultimately provide the theoretical leverage
necessary for a rigorous neurobiological study of unconstrained decision making.

Glimcher, Paul W. / page 9
Behavioral and Physiological Studies of Unconstrained Choice
Together, these observations led us to ask whether game theory could be used to
develop an animal model for examining how the economic variables that should guide free
choice toward behavioral equilibrium in strategic interactions might be represented in the
primate nervous system. The larger goal of this approach was to examine the neurobiological
substrate for decision making under conditions that begin to approximate human voluntary
choice behavior.
Our goal was to develop a behavioral task that i)!engaged humans in what could be
considered voluntary decision making, ii) could be well described by game theory, and
iii)!could also be employed in a neurophysiological setting with nonhuman primates. To this
end, we had both human and monkey subjects play the inspection game. In this game, two
players must each select one of two possible actions and the payoffs they receive on each
trial depend on both their own choice and that of their opponent (Fig. 1A). The experimental
subject played the role of the employee and decided either to work, which resulted in a
guaranteed payoff of one unit of reward, or to shirk, which resulted in either a reward twice
that size or in no reward at all, depending on the action of the employer. The role of the
employer was played by either another human or a dynamic computer algorithm that tracked
the employee’s behavior and tried to maximize its own virtual reward. The employer decided
whether to inspect or no inspect on each trial and the utility of this action depended on the
behavior of employee.
Like rock-paper-scissors, when this game is played repeatedly, rational players should
converge on an equilibrium solution in which each response is produced a certain proportion

Glimcher, Paul W. / page 10
of the time. However, unlike rock-paper-scissors as described above, the proportion of
choosing each response at equilibrium need not be always fixed at a single value but can be
manipulated experimentally. Somewhat counter-intuitively, the proportion of choices that the
employee should devote to each response at equilibrium is controlled, not by changing the
employee’s payoffs, but by changing those of the employer (Fudenberg and Tirole, 1991;
Glimcher, 2003b). This reflects the fact that altering the employer payoff changes the utility
of the options available to the employer and thus changes employer behavior, a change for
which the employee ultimately compensates. The employee uses his own behavior as a lever,
driving the employer back towards the equilibrium state. By holding the payoff structure for
the employee constant, we can therefore insure the employer's rational strategy will always
be to inspect 50% of the time (Figure 1A) while systematically varying the rational strategy
for the employee. In the inspection game the employee faces a task in which the payoffs
associated with each action remain constant while the proportion of responses that should be
devoted to each action varies whenever we manipulate the cost of inspection to the employer.
In games like this, trial-by-trial uncertainty derives, for both players, from incomplete
knowledge of the future actions of one’s opponent. The economic analysis presumes that
rational decision makers will choose the option with the highest expected utility, but on a
trial-by-trial basis there seems no obvious way for the choosers to compute this parameter.
The equilibrium approach addresses this problem more globally by presuming that if both
subjects act rationally, a stable average rate of working and shirking will be reached when on
average the expected utilities for working and shirking are driven towards equality over
many trials by the dynamic behavior of one’s opponent1.
1 Thus at Nash equilibrium for the employee:
EU(Shirk) = EU(Work) (1)

Glimcher, Paul W. / page 11
Studies of Human and Monkey Behavior
Across blocks of trials we varied the employer’s cost of inspection from 0.1 – 0.9 in
steps of 0.2, and according to the Nash formulation this should have had the effect of varying
the probability that the employee would shirk from roughly 10% to 90% in 20% steps.
Humans competed in the inspection game for real monetary rewards, which were delivered at
the end of the experiment, and in a typical session a subject would compete 300 times over
about 30 minutes. Figure 1B shows a 20-trial running average of the typical behavior of a
human employee playing a computer employer during two sequentially presented blocks of
trials. The Nash equilibrium predicts a 70% shirk rate in the first block of trials (payoff
matrix in Figure 1A middle panel) and a 30% shirk rate in the second block of trials (Figure
1A right panel). Although both players freely chose either of two actions on every trial, we
found that the overall behavior of our human subjects was well predicted by these Nash
equilibriums (gray lines)2.
During the last half of each block, once subjects had reached a stable strategy, we
determined the average shirk rate produced in response to changes in employer inspection
which given the payoff matrix (Fig. 1A, left panel) expands to
p(Inspect)*0 + (1-p(Inspect))*W = p(Inspect)*(W-C) + (1-p(Inspect))*(W-C) (2)solving for p(Inspect)
p(Inspect) = C/W (3)where EU(Shirk) is the expected utility for choosing to shirk, EU(Work) is the expected utility for choosing towork, p(Inspect) is the probability of the employer inspecting and 1-p(Inspect) is the probability of theemployer not inspecting when at equilibrium, W is the wage paid by the employer to the employee, and C is thecost of work to the employee.Similarly, at Nash equilibrium the expected utility for inspecting is equal to the expected utility for notinspecting for the employer. Solving for p(Shirk)
p(Shirk)=I/W (4)where p(Shirk) is the probability of the employee shirking when at equilibrium and I is the cost of inspection.
Unfortunately, using these equations to predict the behavior of rational players with precision requiresknowledge of the subjective functions that relate value to utility. The equilibrium points occur when expectedutilities are precisely equivalent, even though it is objective value that is most easily measured by anexperimenter. For the purposes of the computations presented here we assume a linear utility function in thesubsequent analysis. Although this would be expected to produce small metrical errors in our computations, itshould not have any effect on the ordinal representations we compute, which form the core of this presentation.

Glimcher, Paul W. / page 12
costs and plotted this against the shirk rate predicted at equilibrium (Figure 1C). We found
that the responses of humans generally tracked the theoretical shirk rate but tended to over-
shirk at the lowest predicted rates, a phenomenon that may reflect a sampling strategy
intended to maximize the accuracy with which employees estimate the rate at which their
employer inspects.
We then trained monkeys to play a version of the inspection game against our
computer employer and assessed whether their behavior was comparable to that of humans.
In these experiments, thirsty monkeys competed for a water reward and indicated their
choices on each trial with a saccadic eye movement directed to one of two eccentric visual
targets. On all trials, a red shirk target appeared in the center of the neuronal response field
(Gnadt and Andersen 1988; Platt and Glimcher 1998) and a green work target appeared
opposite the neuronal response field. Despite the difference in species and response modality,
monkeys tracked the Nash equilibrium solutions (Figure 1D and 1E) and deviated from those
solutions when shirking rates of 30% or less were efficient strategies, just like humans
playing the inspection game.
Studies of Neuronal Activity
We studied lateral intraparietal (area LIP) neurons with a mixture of inspection game
trials and instructed trials. In instructed trials, after an initial delay the color of the fixation
stimulus changed from yellow to either red or green with equal probability. The monkey was
rewarded for making a saccade to the eccentric target (work target or shirk target) that
matched the color of the fixation stimulus. By examining the same neurons with blocks of
both instructed trials and inspection game trials, we were able to examine LIP neurons both
inside and outside the context of a strategic game.
2 Given the assumptions about the relationship of value and utility stated in the preceding footnote.
Glimcher, Paul W. / page 13
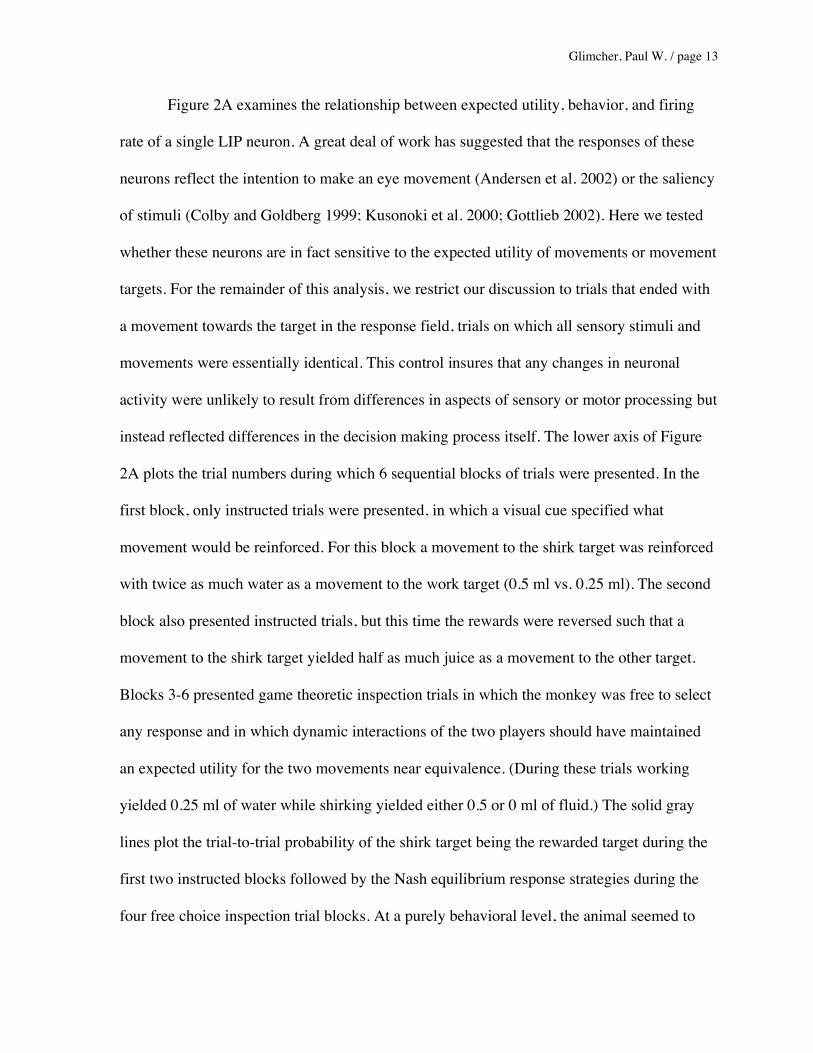
Figure 2A examines the relationship between expected utility, behavior, and firing
rate of a single LIP neuron. A great deal of work has suggested that the responses of these
neurons reflect the intention to make an eye movement (Andersen et al. 2002) or the saliency
of stimuli (Colby and Goldberg 1999; Kusonoki et al. 2000; Gottlieb 2002). Here we tested
whether these neurons are in fact sensitive to the expected utility of movements or movement
targets. For the remainder of this analysis, we restrict our discussion to trials that ended with
a movement towards the target in the response field, trials on which all sensory stimuli and
movements were essentially identical. This control insures that any changes in neuronal
activity were unlikely to result from differences in aspects of sensory or motor processing but
instead reflected differences in the decision making process itself. The lower axis of Figure
2A plots the trial numbers during which 6 sequential blocks of trials were presented. In the
first block, only instructed trials were presented, in which a visual cue specified what
movement would be reinforced. For this block a movement to the shirk target was reinforced
with twice as much water as a movement to the work target (0.5 ml vs. 0.25 ml). The second
block also presented instructed trials, but this time the rewards were reversed such that a
movement to the shirk target yielded half as much juice as a movement to the other target.
Blocks 3-6 presented game theoretic inspection trials in which the monkey was free to select
any response and in which dynamic interactions of the two players should have maintained
an expected utility for the two movements near equivalence. (During these trials working
yielded 0.25 ml of water while shirking yielded either 0.5 or 0 ml of fluid.) The solid gray
lines plot the trial-to-trial probability of the shirk target being the rewarded target during the
first two instructed blocks followed by the Nash equilibrium response strategies during the
four free choice inspection trial blocks. At a purely behavioral level, the animal seemed to

Glimcher, Paul W. / page 14
closely approximate the rational response strategies predicted by theory. Initially the
probability of looking at the shirk target was fixed at 50% during the instructed blocks, and
then shifted dynamically to each of the Nash equilibrium strategies in the subsequent 4
inspection trial blocks. The dots plot the running average of neuronal firing rate during the
visual epoch, a period shortly after target onset on each of these shirk trials. Note that when
the expected utility of the shirk target is high in the first block, firing rate is high. When the
expected utility is low in the second block, firing rate is low. Finally, when the expected
utility is assumed to be at equivalence, according to the Nash formulation, the firing rate is at
a fairly constant and intermediate level. This is the specific result that would be expected if
LIP neurons encode the expected utility of movements into their response fields.
The above result suggests that the activity of this LIP neuron is modulated by the
expected utilities of the available courses of action. To assess whether this was consistently
true across our neuronal sample we performed a similar analysis on the activity of our sample
of neurons. Once again we only analyzed those trials in which the monkeys were either
instructed (Figure 2B - instructed task) or freely chose (Figure 2C – inspection game) to look
at the shirk target which was placed inside the response field. Twenty neurons were tested in
two blocks of the instructed task with a high and low level of expected utility associated with
the shirk response, as in the first 2 blocks of Figure 2A. Average neuronal activity was high
when the expected utility associated with the shirk target was larger than the expected utility
of the work target (Figure 2B - black line). This average neuronal activity was low when the
expected utility associated with the shirk target was smaller than the expected utility of the
work target (Figure 2B - gray line). Forty-one neurons were tested in 5 blocks of trials of the
inspection game (Figure 2C) in which the strategy at Nash equilibrium ranged from

Glimcher, Paul W. / page 15
responding from 10% (lightest gray line) to 90% (darkest line) of the time in the neuronal
response field. Of these 41 neurons, 13 were also tested in the instructed task described
above. As discussed previously, at equilibrium the expected utilities are roughly equal
between the two targets regardless of the actual proportion of responses devoted to the target
in the neuronal response field. Correspondingly, we found that the average neuronal activity
remained unchanged as indicated by the superimposed post-stimulus time histograms that
plot the average population firing rate across different Nash equilibrium blocks.
Dissociating decision variables
In a subset of 20 neurons we also examined the effects of reversing the locations of
the work and shirk targets during 50% Nash equilibrium blocks of the inspection game each
of which was about 100 trials long (Figure 3A). This changed both the probability and
magnitude of reward associated with the target in the neuronal response field while the
relative expected utility remained constant. Firing rates should differ across blocks if they
reflect either probability of reward or magnitude of reward alone but they should remain
constant if they reflect expected utility. In fact, the firing rates did not change which bolsters
the hypothesis that LIP firing rates encode the expected utility of choices.
Encoding relative versus absolute expected utility
The preceding results suggest that neurons in LIP encode expected utility, the product
of probability and the subjective value of reward. It is not clear from these observations,
however, whether the firing rates of LIP neurons encode expected utility for the movement in
the response field or the relative expected utilities of all available options. A number of
authors have suggested that when humans and animals make decisions they consider the

Glimcher, Paul W. / page 16
relative expected utility of each available action rather than considering the absolute expected
utility of each action (Flaherty 1996; Herrnstein 1997). In order to test the hypothesis that
LIP neurons encode the relative expected utility of movements rather than the absolute
expected utility of movements, we examined 18 neurons while monkeys completed a block
of about 100 trials in which the magnitude of both working and shirking rewards was
doubled. If LIP activity is sensitive to absolute expected utility it should increase when the
rewards are doubled. If, however, LIP activity is only sensitive to relative expected utility,
then the firing rate should be the same for both blocks of trials. As Figure 3B shows there is
no change in the firing rate of LIP neurons when absolute reward magnitude is doubled. This
suggests that LIP neurons encode the relative expected utility of movements.
Relative Expected Utility versus Relative Expected Value
Throughout this discussion we have assumed that the expected utilities of the
monkeys’ actions are reasonably approximated by the expected values of those actions.
Although this may be reasonable, we did not test this assumption. It is critical to remember
that this lack of information renders a direct quantitative comparison between the instructed
task data and the inspection game data impossible. In the inspection game, according to the
Nash equilibrium prediction, the expected utilities of the two available movements are
roughly equal. However, in the instructed task we have no direct measure that would allow
us to determine the expected utility of each response. Instead we can only compute the
expected value of each response from the actual juice volumes and probabilities we
employed and then presume that the subjective values of these responses approximate that
objective measure. While it is probably reasonable to assume that the utility of juice is close
to the value of juice in the range of volumes and at the range of animal satiety selected for

Glimcher, Paul W. / page 17
these experiments, the inability to directly compare these two experiments highlights an
outstanding issue in most neurobiological studies of decision making. The underlying utility
functions, on which choices in decision making experiments are based, are rarely measured.
Instead, experimentalists report expected values, or closely related quantities. One exception
is work by Gallistel and colleagues, who have used elegant techniques based on Herrnstein’s
(1997) Matching Law to directly measure the utility of electrical stimulation of the medial
forebrain bundle in rats (reviewed in Gallistel, 1994). It seems clear that similar techniques
could also be used to quantify expected utility during decision making in other species.
Future studies of decision making will have to begin to include direct measurements of
utility.
Summary
One of the problems that some neurobiological studies of decision making have faced
is the absence of a theoretical framework for describing the computational process involved
in generating free choice behavior. This has been evident in studies of voluntary behavior
where the relationship between events in the outside world and internally generated decisions
often appears unpredictable. Social scientists working in economics and psychology have,
however, developed a theoretical corpus for describing choice behavior both when it is
predictable on a trial-by-trial basis and when it is predictable only on an average, or molar,
level.
The data discussed above suggest that we can begin to use game theoretic approaches
to examine the control of free choice behavior at the level of single neurons. Recently, a
number of other closely related techniques have also been used to achieve this same goal in
other electrophysiological studies. For example, Coe and colleagues (2002) used a dynamic,

Glimcher, Paul W. / page 18
free choice task to show that the activity of neurons in the frontal and supplementary eye
fields and area LIP predicted the choice a monkey would make well before the movement
was executed. Researchers using functional magnetic resonance imaging are also beginning
to adopt closely related approaches. In one experiment, Montague and Berns (2002) used a
free choice task to divide human subjects into two groups, risky and conservative, depending
on their willingness to accept negative payoffs. They were able to show that the nucleus
accumbens was differentially active in the risky and conservative subjects.
These examples present a small sample of the growing number of studies that are
beginning to use economic-style models and techniques for studying voluntary choice
behavior (Breiter et al. 2001; McCabe et al. 2001; Montague and Berns 2002; Montague et
al. 2002; Sugrue et al., 2001). Together, these parallel lines of inquiry suggest a growing
synthesis of social scientific and neuroscientific approaches that are beginning to define the
outlines of the neural system for unconstrained decision making.

Glimcher, Paul W. / page 19
Implications for the Neural Basis of Unconstrained Choice
These experiments suggest that we can begin to use theoretical approaches from the
social sciences to examine the macroscopic pattern of individual free choice behavior at a
neurobiological level, but they tell us very little about the trial-by-trial process from which
this aggregate behavior emerges. The inability of equilibrium formulations like these to
describe the dynamics of choice behavior is, however, hardly unique to neurophysiology.
Almost since the inception of equilibrium models, psychologists and economists have been
developing alternative frameworks that seek to complement the equilibrium approach with
explainations of how free choice behaviors are generated at a trial-by-trial level.
Unfortunately, even for the social scientists who have devoted significant resources to
achieving this goal, it is not yet possible to accurately predict whether a subject will select
rock, or paper, or scissors on the next round of play (see for example Bush and Mosteller
1955; Luce 1959; Herrnstein 1997; Erev and Roth 1998; Fudenberg and Levine 1998; Dragoi
and Staddon 1999; Camerer 2003; McKelvey and Palfrey; 1998). Does behavior produced
under these conditions defy trial-by-trial prediction because we still lack adequate models for
describing these processes or are some classes of behavior truly and irreducibly
unpredictable, defying trial-by-trial prediction in principle? Traditionally that has been a
difficult question to answer, but neurobiologists may now be able to engage this issue in a
novel way. It may now be possible to ask whether behavior can be driven by irreducibly
stochastic processes that operate at the neuronal or subneuronal level. We may now be able
to determine whether the apparent unpredictability with which a subject chooses to play rock,
reflects the action of a fundamentally stochastic underlying process.

Glimcher, Paul W. / page 20
Randomness at the Neuronal and SubNeuronal Level
One known source of stochasticity at the neuronal level is the mechanism by which
synaptic inputs give rise to action potentials in cortical neurons. Abundant evidence indicates
that when cortical neurons are repeatedly activated by precisely the same stimulus, the
neurons do not deterministically generate action potentials in precisely the same pattern.
Instead, the pattern of stimulation delivered to cortical neurons appears to determine only the
average firing rates of those neurons, the instant-by-instant dynamics of action potential
generation are highly variable and appear to defy precise prediction (Tolhurst et al., 1981;
Dean, 1981). The available data suggests that this moment-by-moment variation, the overall
variance in cortical firing rate, is related to mean firing rate by a roughly fixed constant of
proportionality that has a value near 1.07 over a very broad range of mean rates (Tolhurst et
al., 1981; Dean, 1981; Zohary, et al., 1994; Lee et al., 1998) and this seems to be true of
essentially all cortical areas that have been examined including parietal cortex (Lee et al.,
1998). This has led to the suggestion that action potential production can be described as
something like a stochastic Poisson process3, a truly probabalistic operation for which the
stimulus specifies an average rate but which generates action potentials in a fundamentally
stochastic manner.
More recently, there have even been several efforts to identify the biophysical source
of this Poisson-like stochasticity. Mainen and Sejnowski (1995), for example, sought to
determine whether the process of action potential generation in the cell body was the source
of this stochasticity. Their work led to the conculsion that action potential generation is quite
deterministically tied to membrane voltage, and thus that this process was not a source of
intrinsic action potential variability. Subsequent studies have begun to suggest that it may

Glimcher, Paul W. / page 21
instead be the process of synaptic transmission which imposes a stochastic pattern on cortical
action potential production (For review see Stevens, 1994). We now know, for example, that
presynaptic action potentials lead to post-synaptic depolarizations with surprisingly low
probabilities in many cortical synapses, and that the sizes of the post-synaptic depolarizations
that do occur can be quite variable. The actual pattern of instant-by-instant membrane voltage
seems thus to be influenced by irreducible stochasticity at the level of the synapse, a
stochasticity imposed by fluctuations in the amount of transmitter encapsulated by the kinetic
processes that fill synaptic vesicles and by the dynamics of calcium diffusion, amongst other
things. All of these data suggest that the precise pattern of activity in cortical neurons is
stochastic. Exactly when an action potential is generated seems to depend on apparently
random molecular and atomic-level processes. So the nervous system does seem to include
stochastic elements at a very low level. The times at which action potentials occur seem to be
fundamentally stochastic. What implications, if any, might this have for the generation of
behavior?
Randomness in Computational Systems
One of the most influential studies of how this randomness in the activity of
individual neurons might affect behavior is Shadlen and colleagues’ (1996) landmark model
of visual-saccadic decision making. Their model sought to explain, at a computational level,
a series of experiments (reviewed in Newsome et al. 1995) in which trained monkeys viewed
a display of chaotically moving spots of light. On any given trial, a subset of the spots moved
coherently in a single direction while the remaining spots moved randomly. The direction of
this coherent motion indicated which of two possible saccadic eye movements would yield a
reward and at the end of each trial animals were free to make a saccade. If they made the
3 To be more precise, the process of action potential generation appears to be a skewed Poisson process.

Glimcher, Paul W. / page 22
correct movement, they then received that reward. Physiological data from those experiments
indicated that the firing rates of single neurons in the middle temporal visual area (area MT)
were correlated with the fraction of spots that moved coherently in a particular direction and
thus with the movement produced by the subject at the end of the trial.
Shadlen and colleagues (1996) found, however, that the combination of signals from
as few as 50-100 of these area MT neurons could be used to identify the reinforced direction
of motion with greater accuracy than was actually evidenced by the choice behavior of the
monkeys. The trial-by-trial choices of the monkeys seemed to be slightly less accurate, or
more unpredictable, than might be expected from an analysis of the area MT firing rates. To
account for this finding Shadlen and colleagues proposed that the MT signal was, at a later
stage in the neuronal architecture, corrupted by a noise source that effectively placed an
upper limit on the efficiency with which the cortical signals could be combined during the
moving spot task. Their model proposed that the cortical targets of MT neurons further
randomized the behavior of the animals under the circumstances they had examined. From
this, one might speculate that the physiological cost of more deterministically generating
behavior from MT activity in later cortical areas may simply have been greater than the
benefits which could have been accrued by the animal had the stochasticity of those later
elements in the cortical architecture been reduced.
To further explore this notion that computational elements may impose quite specific
levels of unpredictability on behavior, consider a variant of Platt and Glimcher’s (1999) free
choice experiments that we recently performed. In this behavioral experiment, monkeys once
again chose to make one of two possible saccades and the expected utility of each movement
was manipulated by varying both the magnitude and probability of fluid reward (associated
Glimcher, Paul W. / page 23
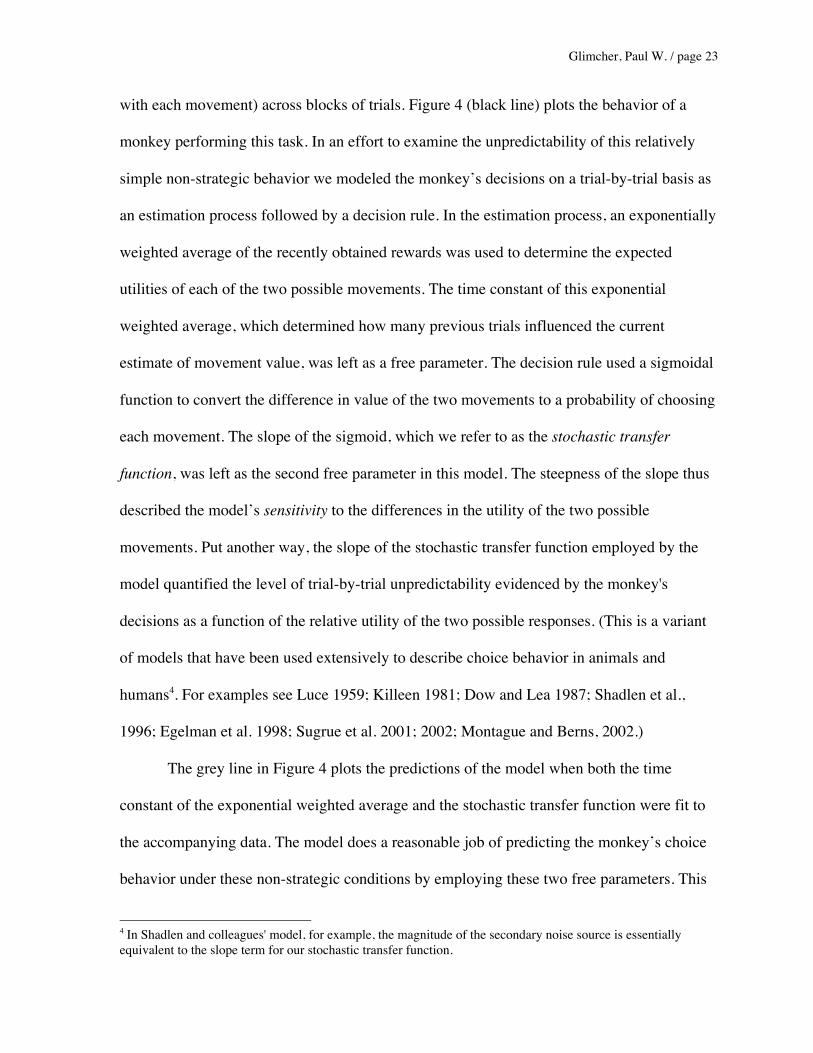
with each movement) across blocks of trials. Figure 4 (black line) plots the behavior of a
monkey performing this task. In an effort to examine the unpredictability of this relatively
simple non-strategic behavior we modeled the monkey’s decisions on a trial-by-trial basis as
an estimation process followed by a decision rule. In the estimation process, an exponentially
weighted average of the recently obtained rewards was used to determine the expected
utilities of each of the two possible movements. The time constant of this exponential
weighted average, which determined how many previous trials influenced the current
estimate of movement value, was left as a free parameter. The decision rule used a sigmoidal
function to convert the difference in value of the two movements to a probability of choosing
each movement. The slope of the sigmoid, which we refer to as the stochastic transfer
function, was left as the second free parameter in this model. The steepness of the slope thus
described the model’s sensitivity to the differences in the utility of the two possible
movements. Put another way, the slope of the stochastic transfer function employed by the
model quantified the level of trial-by-trial unpredictability evidenced by the monkey's
decisions as a function of the relative utility of the two possible responses. (This is a variant
of models that have been used extensively to describe choice behavior in animals and
humans4. For examples see Luce 1959; Killeen 1981; Dow and Lea 1987; Shadlen et al.,
1996; Egelman et al. 1998; Sugrue et al. 2001; 2002; Montague and Berns, 2002.)
The grey line in Figure 4 plots the predictions of the model when both the time
constant of the exponential weighted average and the stochastic transfer function were fit to
the accompanying data. The model does a reasonable job of predicting the monkey’s choice
behavior under these non-strategic conditions by employing these two free parameters. This
4 In Shadlen and colleagues' model, for example, the magnitude of the secondary noise source is essentiallyequivalent to the slope term for our stochastic transfer function.

Glimcher, Paul W. / page 24
suggests that under these circumstances decisions may be based on a dynamic estimate of
relative expected utility computed as a weighted average of recent reward history. But much
more interesting is the observation that the slope of the sigmoid, which stochastically relates
expected utility to behavior, is quite shallow. The model achieves the best possible prediction
by incorporating a significant degree of randomness which would, in principle, defy trial-by-
trial prediction.
Even given a biophysical basis for neural stochasticity, and that successful models
employ this stochasticity to generate behavior, should we actually believe that real animals
are unpredictable because stochastic neural elements make them so or is it more realistic to
assume that behavior is predictable and that with the appropriate model this predictability
will become obvious? At one level this is a philosophical question but at another it can
certainly be viewed as an evolutionary issue; could natural selection have preserved
stochastic neural mechanisms that produce unpredictable behaviors if unpredictable
behaviors yield greater evolutionary fitness? To begin to answer that question we need to be
able to more quantitatively determine the costs and benefits of behavioral stochasticity to real
animals.
Assessing the Costs and Benefits of Randomness
Consider once more the game of rock-paper-scissors. If one player uses a determinate
strategy of playing rock, then scissors, then paper repeatedly in that order, their opponent
could win every time by detecting this pattern and playing paper, then rock, then scissors. For
this reason the production of any trial-by-trial pattern, no matter how subtle, puts a player at a
potential disadvantage. This highlights the fact that an efficient mixed strategy equilibrium
of the type Nash described does not simply require specific proportions of each choice, but

Glimcher, Paul W. / page 25
also requires that dynamic process by which choices are allocated must be unpredictable.
Unlike the Newsome (1995), Shadlen et al., (1996), and Platt and Glimcher (1999)
experiments, under these specific conditions increasing the unpredictability of behavior
would increase the gains achieved by a player. This seems a critical point because if under
some conditions unpredictability is efficient, and we know of stochastic subneuronal
mechanisms which could generate unpredictable behavior, then we might usefully begin to
search for environmental conditions which call for specific levels of unpredictability. Under
these conditions we might measure the difference between observed levels of
unpredictability and efficient levels of unpredictability in order to begin to test the hypothesis
that unpredictability is an evolved feature of behavior.
Daeyeol Lee and his colleagues (Barraclough et al. 2002) have recently begun to
examine this issue by studying the decisions of monkeys playing a game called matching
pennies against a variable computer opponent. They found that the behavior of these
monkeys did indeed depend on the properties of the computer opponent they faced. If the
computer opponent was constructed with an ability to identify and exploit non-random
patterns in the behavior of the monkeys, the animals produced behaviors which were more
random. In contrast, if the computer opponent was only weakly able to detect patterns in the
trial-by-trial dynamics of the monkeys’ behavior, then the animals adopted a less random
strategy. These observations indicate that the level of trial-by-trial randomness produced by
an animal can reflect the task that it faces; the level of randomness expressed by behavior
may represent an adjustable process governed by an internal set of costs at each level of the
neural architecture that we have not yet measured.

Glimcher, Paul W. / page 26
Stochastic events occur at the subneuronal level. Models of behavior often must
employ stochastic components if they are to simulate behavior accurately. In order to be
efficient, some behaviors must be unpredictable. In sum, it seems that a number of elements
point towards true randomness as an important feature of vertebrate behavior. What remains
unclear, however, is how all of these processes are connected. How might largely fixed
stochastic subneuronal processes give rise to variably random behavior? The answer to that
critical last question in far from certain but there are some hints that we may be beginning to
uncover at least one basic mechanism that could accomplish this linkage. Whether this
mechanism actually serves to link neuronal stochasticity and behavioral unpredictability is
still very unclear, but the existence of a mechanism of this general type within the primate
neural architecture suggests that these linkages are at least possible.
Linking the Stochasticity of Neurons and Behavior
Shadlen and colleagues’ 1996 model demonstrated that relating neuronal firing rates
to behavior required a knowledge of two critical parameters; the intrinsic variance in
instantaneous firing rate evidenced by each cortical neuron (the Poisson-like variability of the
action potential generation process) and the correlation in action potential patterns between
the many neurons that participate in any neural computation (the inter-neuronal cross-
correlation). Shadlen and colleagues demonstrated that both of these properties contribute to
the unpredictability evidenced by behavior. The variability in the firing rate of each neuron
contributes to the unpredictability of behavior by producing an initial stochasticity in the
neuronal architecture and the degree to which that stochasticity influences behavior depends
on how tighly correlated are the firing patterns of the many neurons in a population.

Glimcher, Paul W. / page 27
To make this insight clear consider a population of 1000 neurons all of which fire
with the same mean rate and which have the same level of intrinsic variability, but are
generating action potentials independently of each other. The members of such a population
would be generating moment-by-moment patterns of action potentials that were completely
uncorrelated; the only thing that they would share is a common underlying mean firing rate.
Because of this independence, globally averaging the activity of all of these independent
neurons would allow one to recover the underlying mean rate at any instant. A cortical target
receiving diffuse inputs from these 1000 source neurons would therefore accurately and
instantaneously have access to the underlying mean rate at which the population was firing,
there would be nothing necessarily stochastic about the behavior of such a neuron. Consider,
as an alternative, a circuit in which a population of 1000 neurons all still fire with the same
mean rate and still have the same level of intrinsic variability, but in which each of the 1000
source neurons were tightly correlated in their activity patterns. Under these conditions, it is
the stochastic and synchronous pattern of activity shared by all of the neurons in the
population that is available to the target neuron at any moment, rather than the underlying
mean rate. In a highly correlated system of this type the output at any moment is irreducibly
stochastic. Of course these are just two extreme conditions along a continuum. Many levels
of correlation between neurons are possible and each would provide the target with a slightly
different level of access to the underlying mean rate, and a different level of instrinsic
randomness.
To address these issues of stochasticity in their original model, Shadlen and his
colleagues (1996) were able to use available data to estimate both the intrinsic stochasticity
of cortical neurons and the actual level of inter-neuronal correlation in area MT during the

Glimcher, Paul W. / page 28
moving dot task they studied. A number of studies had shown that the intrinsic variance in
the firing rates of cortical neurons, the cortical coefficient of variation, is largely fixed at 1.07
(Tolhurst, et al., 1981; Dean, 1981; Zohary, et al., 1994; Lee et al., 1999) and Zohary and
colleagues (1994) had demonstrated that under the behavioral conditions being modeled,
pairs of MT neurons that were close enough to be studied with he same electrode showed an
inter-neuronal correlation of about 0.19. It was by using this number and knowledge of the
unpredictability of the animal’s actual behavior that Shadlen and his colleagues were able to
estimate the magnitude of the later randomizing element that they believed intervened
between MT activity and the generation of behavior.
More recently Parker and colleagues (2002; Dodd et al., 2001) examined the activity
of this same population of MT neurons but in a different behavioral task that imposed
different environmental contingencies. Like Zohary and colleagues, they were also able to
record the activity of pairs of MT neurons and to determine both the coefficient of variation
and the inter-neuronal correlation between these pairs under their behavioral conditions.
They found that the coefficient of variation was essentially the same in their task but that the
inter-neuronal correlation was quite different, a correlation coefficient of 0.44. At a
behavioral level they also found that the stochastic firing rates of individual neurons were
more tightly correlated with the stochastic behavior of their subjects than in the Zohary study
(a choice probability of 0.67 rather than the 0.56 measured by Britten et al (1996)). In other
words, MT neurons in the Parker task showed a higher level of inter-neuronal correlation and
the behavior of the animals was more tightly coupled to the stochastic behavior of individual
neurons. Just as one might have predicted, the level of observed inter-neuronal correlation in
a single cortical area and the level of randomness in behavior appear to be related.
Glimcher, Paul W. / page 29
Futhermore, the level of inter-neuronal correlation appears to be variable, dependent on the
task which the animal is asked to perform.
These may be very important results, not because the definitively explain how
neurons and behavior are linked but because they demonstrate that such linkages are at least
conceptually possible. We now know that in order to be efficient some behaviors must be
unpredictable, and that the level of this unpredictability is, and should be, adjustable. We also
know that there are intrinsic sources of stochasticity in the vertebrate nervous system.
Evolution could, at least in principle, have yielded mechanisms that link these processes.
Summary
Over the last century social scientists have made significant progress towards
describing the underlying computational processes that guide decision making. While their
early successes focussed on predictable forms of decision making, more recent studies have
examined the kinds of unpredictable decision making that occur under conditions like
strategic interaction. The equilibrium approaches used in the social sciences to describe
unpredictable decision making have, however, been unable to determine the ultimate source
of the randomness evidenced in strategic behavior.
Over the last decade neuroscientists have begun to employ many of the mathematical
formulations developed by social scientists. Their rich set of computational mechanisms have
proven to be powerful tools for understanding the neural architecture. The most recent
studies of this architecture seem, however, to go beyond the insights available from the social
sciences. These newest studies suggest that some irreducible level of randomness may be an
essential feature of the vertebrate nervous system and may play a critical role in the
generation of behavior. If the mechanism by which neuronal firing rates yield behavior can

Glimcher, Paul W. / page 30
preserve a variable fraction of the neuronal stochasticity that we and others have observed,
then the level of unpredictability expressed by behavior could be a reflection of this variable
underlying physical process. Limitations imposed by that process could reflect an implicit
cost function against which behavior is optimized. These observations may thererfore hint
that the randomness captured in our neuroscientific models by elements like the stochastic
transfer function may be the instantiation of an intrinsic stochasticity in the neurobiological
architecture. Indeed, these observations may even suggest that the precise slope of the
stochastic transfer function under a given set of environmental conditions represents some
kind of adjustable neurophysiological process by which stochastic neuronal firing rates lead
to the efficient generation of unpredictable behavior. Neuroscience may thus soon be able to
provide a final answer to the social scientific question of whether some classes of behavior
are truly and irreducibly unpredictable. Under some conditions behavior may well be
irreducibly unpredictable and this ununpredictability may extend down to the molecular level
at which synapses operate.

Glimcher, Paul W. / page 31
Conclusions
The ultimate goal of neurobiological studies of decision making is to explain human
voluntary choice, a process often attributed to the agency of free will. When a real human
employee faces a real human employer she must make a voluntary decision about whether to
go to work or to stay at home and shirk. Many clear factors influence her decision; how
recently and how often she has been inspected, how much she stands to gain by successfully
shirking, and her own predispositions or biases. Were she, however, always to work and then
shirk and then work and then shirk, alternating deterministically between these two actions,
her behavior would seen less than voluntary. In large measure what makes the decision seem
voluntary to an outside observer is that her response defies prediction on a decision-by-
decision basis. Explaining the neurobiological source of that unpredictability will probably
pose the greatest challenge for students of this process and will yield fundamental insights
into the causal processes that underly human action.

Glimcher, Paul W. / page 32
Acknowledgements
The authors wish to thank Brian Lau for helpful discussions, thoughtful comments on earlier
drafts of the manuscript, and for providing the model fit illustrated in Figure 4. We would
also like to thank David Heeger, Hannah Bayer, Michael Platt, Daeyeol Lee, and Maggie
Grantner for helpful discussions. This work was supported by the Klingenstein Foundation
and the National Eye Institute.
Glimcher, Paul W. / page 33
References
Andersen, R. A. and C. A. Buneo (2002). Intentional maps in posterior parietal cortex.Annu Rev Neurosci 25: 189-220.
Arnauld, A. and P. Nicole (1994). Logic or the Art of Thinking. Cambridge, CambridgeUniversity Press.
Barraclough , D. J., M. L. Conroy, et al. (2002). Stochastic decision-making in a two-player competitive game. Society for Neuroscience Abstracts. 285.16.
Britten, K.H., Newsome, W.T., Shadlen, M.N. Celebrini, S., and Movshon, J.A. (1996) Arelationship between behavioral choice and the vsiual responses of neurons in macaquearea MT. Vis. Neurosci. 13: 87-100.
Bernoulli, D. (1954). Exposition on a new theory on the measurement of risk.Econometrica 22(1): 23-36.
Breiter, H. C., I. Aharon, et al. (2001). Functional imaging of neural responses toexpectancy and experience of monetary gains and losses. Neuron 30(2): 619-39.
Bush, R. R. and F. Mosteller (1955). Stochastic Models for Learning. New York, Wiley.
Camerer, C. F. (2003). Behavioral Game Theory: Experiments in Strategic Interaction.Princeton, Princeton University Press.
Coe, B., K. Tomihara, et al. (2002). Visual and anticipatory bias in three cortical eyefields of the monkey during an adaptive decision-making task. J Neurosci 22(12): 5081-90.
Colby, C. L., J. R. Duhamel, et al. (1995). Oculocentric spatial representation in parietalcortex. Cereb Cortex 5(5): 470-81.
Colby, C. L. and M. E. Goldberg (1999). Space and attention in parietal cortex. Annu RevNeurosci 22: 319-49.
Dean, A.F. (1981), The variability of discharge of simple cells in the cat striate cortex.Exp. Brain Res. 44:437-40.
Dodd, J. V., Krug, K., Cumming, B. G. and Parker, A. J. (2001) Perceptually bistable

Glimcher, Paul W. / page 34
figures lead to high choice probabilities in cortical area MT. J. Neurophys. 21: 4809-4821.
Dorris, M. C. and P. W. Glimcher. (2002) A neural correlate for the relative expectedvalue of choices in the lateral intraparietal area. Soc. Neurosci. Abstr. 28: 280.6
Dow, S. M. and S. E. G. Lea (1987). Foraging in a changing environment: simulations inthe operant laboratory. Quantitative Analyses of Behavior. M. L. Commons, A. Kacelnikand S. J. Shettleworth. Hillsdale, Lawrence Erlbaum Associates, Inc. VI.
Dragoi, V. and J. E. Staddon (1999). The dynamics of operant conditioning. Psychol Rev106(1): 20-61.
Egelman, D. M., C. Person, et al. (1998). A computational role for dopamine delivery inhuman decision-making. J Cogn Neurosci 10(5): 623-30.
Erev, I. and A. Roth (1998). Prediction how people play games: Reinforcement learningin games with unique strategy equilibrium. American Economic Review 88: 848-881.
Flaherty, C. F. (1996). Incentive Relativity. New York, Cambridge University Press.
Fudenberg, D. and D. K. Levine (1998). The Theory of Learning in Games. Cambridge,The MIT Press.
Fudenberg, D. and J. Tirole (1991). Game Theory. Cambridge, The MIT Press.
Gallistel, C. R. (1994). Foraging for brain stimulation: toward a neurobiology ofcomputation. Cognition 50(1-3): 151-70.
Glimcher, P. W. (2001). Making choices: the neurophysiology of visual-saccadicdecision making. Trends Neurosci 24(11): 654-9.
Glimcher, P. W. (2003a). Neural Correlates of Primate Decision-Making. AnnualReviews Neuroscience 26: in press.
Glimcher, P. W. (2003b). Decisions, Uncertainty, and the Brain: The Science ofNeuroeconomics. Cambridge, The MIT Press.
Gnadt, J. W. and R. A. Andersen (1988). Memory related motor planning activity inposterior parietal cortex of macaque. Exp Brain Res 70(1): 216-20.

Glimcher, Paul W. / page 35
Gold, J. I. and M. N. Shadlen (2001). Neural computations that underlie decisions aboutsensory stimuli. Trends Cogn Sci 5(1): 10-16.
Gottlieb, J. (2002). Parietal mechanisms of target representation. Curr Opin Neurobiol12(2): 134-40.
Handel, A. and P. W. Glimcher (2000). Contextual modulation of substantia nigra parsreticulata neurons. J Neurophysiol 83(5): 3042-8.
Herrnstein, R. J. (1997). The Matching Law: Papers in Psychology and Economics,Harvard University Press.
Hikosaka, O., Y. Takikawa, et al. (2000). Role of the basal ganglia in the control ofpurposive saccadic eye movements. Physiol Rev 80(3): 953-78.
Kawagoe, R., Y. Takikawa, et al. (1998). Expectation of reward modulates cognitivesignals in the basal ganglia. Nat Neurosci 1(5): 411-6.
Killeen, P. R. (1981). Averaging theory. Recent developments in the quantification ofsteady-state operant behavior. C. M. Bradshaw, E. Szabadi and C. F. Lowe, Elsevier.
Kreps, D. M. (1990). A Course in Microeconomic Theory. Princeton, PrincetonUniversity Press.
Kusunoki, M., J. Gottlieb, et al. (2000). The lateral intraparietal area as a salience map:the representation of abrupt onset, stimulus motion, and task relevance. Vision Res 40(10-12): 1459-68.
Lee, D., N. L. Port, W. Kruse and A. P. Georgopoulos. (1998) Variability and correlatednoise in the discharge of neurons in motor and parietal areas of the primate cortex. JNeurosci. 18(3):1161-70.
Luce, R. D. (1959). Individual Choice Behavior: A Theoretical Analysis. New York, JohnWiley & Sons.
Luce, R. D. and H. Raiffa (1957). Games and Decisions. New York, John Wiley & Sons.
McCabe, K., D. Houser, et al. (2001). A functional imaging study of cooperation in two-person reciprocal exchange. Proc Natl Acad Sci U S A 98(20): 11832-5.
McKelvey, R. D. and T. R. Palfrey (1998) Quantal response equilibria in extensive form

Glimcher, Paul W. / page 36
games. Experimental Economics. 1: 9-41.
Miller, G. F. (1997). Protean primates: The evolution of adaptive unpredictability incompetition and courtship. Machiavellian Intelligence II: Extensions and evaluations.
Whiten and R. W. Byrne. Cambridge, Cambridge University Press: 312-340.
Mainen, Z. F. and T. J. Sejnowski. (1995) Reliability of spike timing in neocorticalneurons. Science. 268(5216):1503-6.
Montague, P. R. and G. S. Berns (2002). Neural economics and the biological substratesof valuation. Neuron 36(2): 265-84.
Montague, P. R., G. S. Berns, et al. (2002). Hyperscanning: simultaneous fMRI duringlinked social interactions. Neuroimage 16(4): 1159-64.
Myers, J. L. (1976). Probability learning and sequence learning. Handbook of Learningand Cognitive Processes: Approaches to Human Learning and Motivation. W. K. Estes.Hillsdale, Lawrence Erlbaum. 3: 171-205.
Nash, J. F. (1950). Equilibrium points in N-Person Games. PNAS 36: 48-49.
Neuringer, A. (2002). Operant variability: evidence, functions, and theory. Psychon BullRev 9(4): 672-705.
Newsome, W. T., K. H. Britten, et al. (1989). Neuronal correlates of a perceptualdecision. Nature 341(6237): 52-4.
Newsome, W. T., M. N. Shadlen, et al. (1995). Visual motion: linking neuronal activityto psychophysical performance. The Cognitive Neurosciences. M. S. Gazzaniga.Cambridge, The MIT Press.
Parker, A.J., Krug, K. and Cumming, B.G. (2002) Neuronal activity and its links with theperception of multi-stable figures. Phil. Trans. R. Soc. Lond. B. 357: 1053-1062.
Pascal, B. (1966). Pensees. New York, Penguin Books.
Platt, M. L. and P. W. Glimcher (1998). Response fields of intraparietal neuronsquantified with multiple saccadic targets. Exp Brain Res 121(1): 65-75.
Platt, M. L. and P. W. Glimcher (1999). Neural correlates of decision variables in parietalcortex. Nature 400(6741): 233-8.

Glimcher, Paul W. / page 37
Rapoport, A. and D. V. Budescu (1992). Generation of random binary series in strictlycompetitive games. Journal of Experimental Psychology: General 121: 352-364.
Rapoport, A. and D. V. Budescu (1997). Randomization in individual choice behavior.Psychological Review 104: 603-617.
Schall, J. D. (2001). Neural basis of deciding, choosing and acting. Nat Rev Neurosci2(1): 33-42.
Shadlen, M. N., K. H. Britten, et al. (1996). A computational analysis of the relationshipbetween neuronal and behavioral responses to visual motion. J Neurosci 16(4): 1486-510.
Sparks, D. L. and L. E. Mays (1990). Signal transformations required for the generationof saccadic eye movements. Annu Rev Neurosci 13: 309-36.
Stevens, C. F. (1994) Neuronal communication. Cooperativity of unreliable neurons.Curr Biol. 4(3):268-9.
Stephens, D. W. and J. R. Krebs (1986). Foraging theory. Princeton, N.J., PrincetonUniversity Press.
Sugrue, L. P., W. T. Newsome, et al. (2001). Matching behavior in rhesus monkeys.Society for Neuroscience Abstracts. 59.3
Sugrue, L. P. and W. T. Newsome (2002). Neural correlates of experienced value in areaLIP of the rhesus monkey. Society for Neuroscience Abstracts. 121.5
Tolhurst D.J., Movshon J.A., and Dean A.F. (1981)The statistical reliability of signals insingle neurons in cat and monkey visual cortex. Vision. Res. 23: 775-785.
Zohary, E., Shadlen, M.N. and Newsome, W.T. (1994) Correlated neuronal discharge andits implications for psychophysical performance. Nature. 370: 140-143.

Glimcher, Paul W. / page 38
Figure Legends
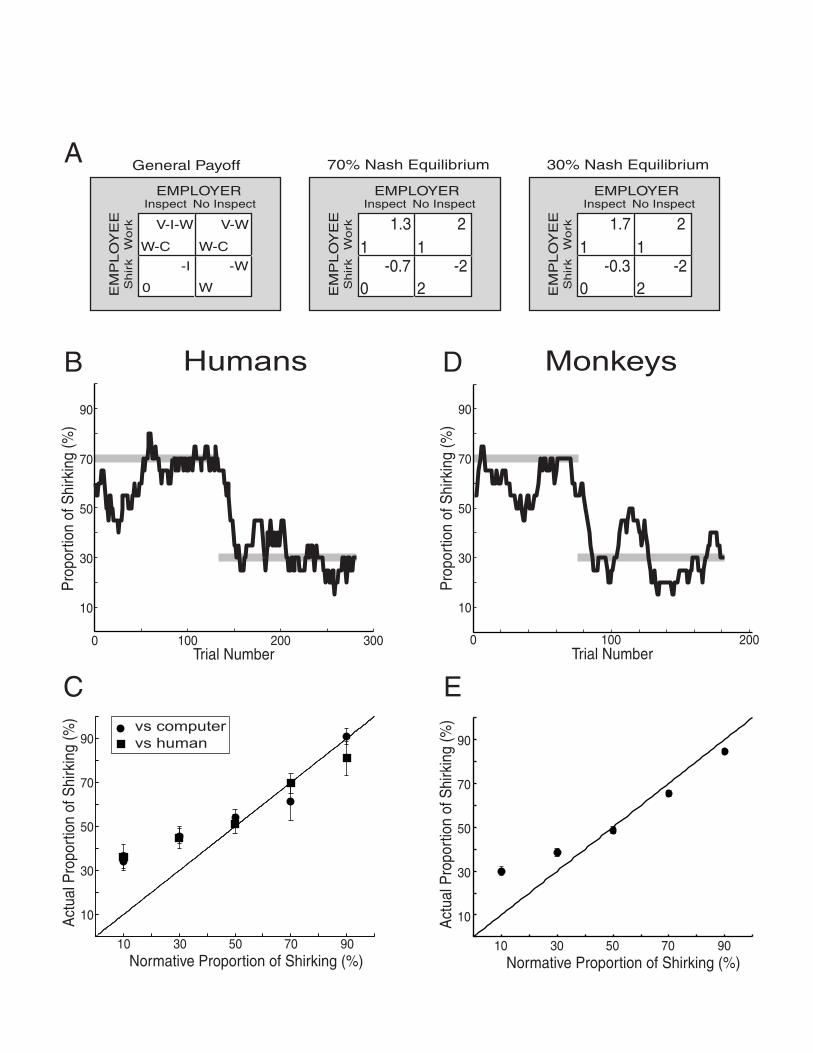
Figure 1. Behavior during the inspection game. A. (left panel) General form of the payoff
matrix for the inspection game for both the experimental subject (employee) and their
opponent (employer). The variables in the bottom left of each cell determine the employee’s
payoffs and the variables in the top right of each cell determine the employer’s payoffs for
each combination of player’s responses. V = value of hypothetical product to the employer,
fixed at 4; W = wage paid by employer to employee, fixed at 2; C = cost of working to
employee, fixed at 1; I = cost of inspection to the employer, varied from 0.1 to 0.9 in steps of
0.2. Middle and right panels show payoff matrices for 70% and 30% employee shirk rates.
The predicted equilibrium strategy for the employer remains constant at a 50% inspect for all
blocks of trials. 1 unit of payoff = 0.25mL of water for monkey = $0.05 for human. B. The
behavior of an individual human subject playing the role of employee during two Nash
equilibrium blocks of the inspection game. The jagged black line represents a running
average of the shirk choices over the last 20 trials. The gray bars represent the predicted Nash
equilibrium strategy. C. The average shirk rate (±sem) for human subjects calculated for the
last half of each Nash equilibrium block. The proportion of shirking predicted at Nash
equilibrium is denoted by the line of unity (black). Filled squares, human vs. human (N = 6
subjects); Filled circles, human vs. computer (N = 5 subjects). D. The same plot as (B) for an
individual monkey subject. E. Same plot as (C) for monkey subjects. 29 blocks/point: 13
blocks from monkey 1, 16 blocks from monkey 2.
Figure 2. Activity of LIP neurons during instructed and free choice tasks. A. Proportion of
monkey’s choices devoted to the shirking and corresponding activity of a single LIP neuron.
The monkey performed six successive blocks of trials; the first two were during the
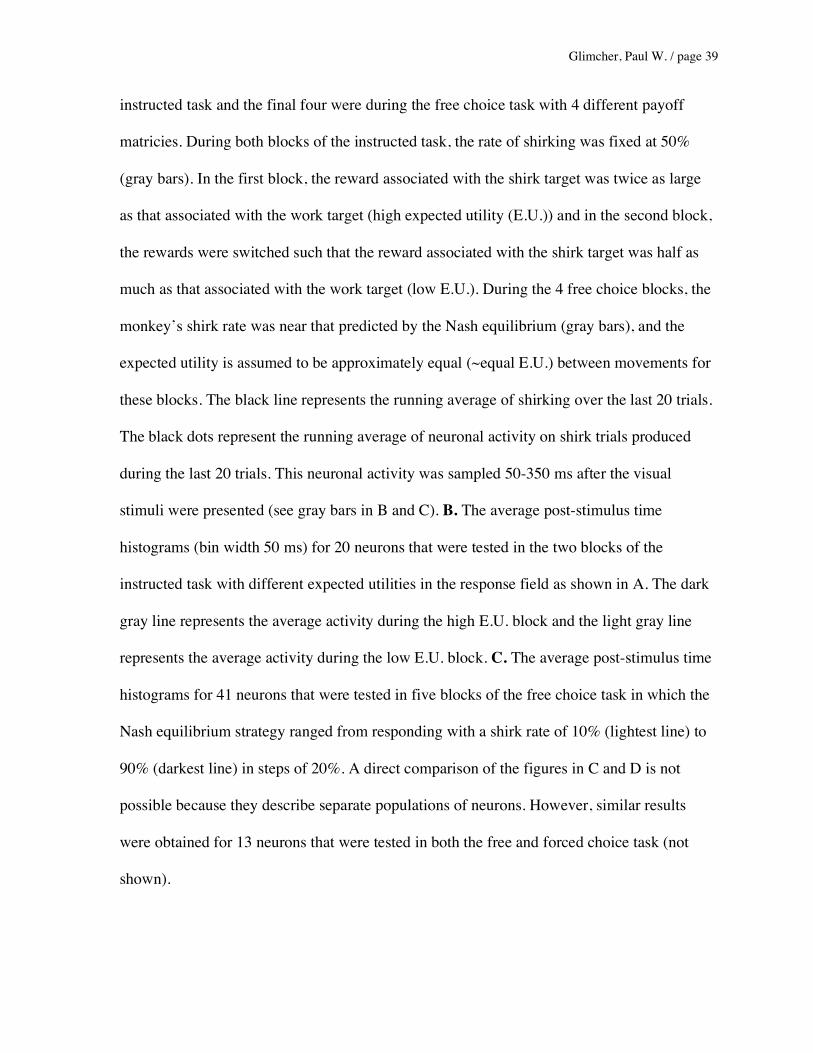
Glimcher, Paul W. / page 39
instructed task and the final four were during the free choice task with 4 different payoff
matricies. During both blocks of the instructed task, the rate of shirking was fixed at 50%
(gray bars). In the first block, the reward associated with the shirk target was twice as large
as that associated with the work target (high expected utility (E.U.)) and in the second block,
the rewards were switched such that the reward associated with the shirk target was half as
much as that associated with the work target (low E.U.). During the 4 free choice blocks, the
monkey’s shirk rate was near that predicted by the Nash equilibrium (gray bars), and the
expected utility is assumed to be approximately equal (~equal E.U.) between movements for
these blocks. The black line represents the running average of shirking over the last 20 trials.
The black dots represent the running average of neuronal activity on shirk trials produced
during the last 20 trials. This neuronal activity was sampled 50-350 ms after the visual
stimuli were presented (see gray bars in B and C). B. The average post-stimulus time
histograms (bin width 50 ms) for 20 neurons that were tested in the two blocks of the
instructed task with different expected utilities in the response field as shown in A. The dark
gray line represents the average activity during the high E.U. block and the light gray line
represents the average activity during the low E.U. block. C. The average post-stimulus time
histograms for 41 neurons that were tested in five blocks of the free choice task in which the
Nash equilibrium strategy ranged from responding with a shirk rate of 10% (lightest line) to
90% (darkest line) in steps of 20%. A direct comparison of the figures in C and D is not
possible because they describe separate populations of neurons. However, similar results
were obtained for 13 neurons that were tested in both the free and forced choice task (not
shown).
Glimcher, Paul W. / page 40
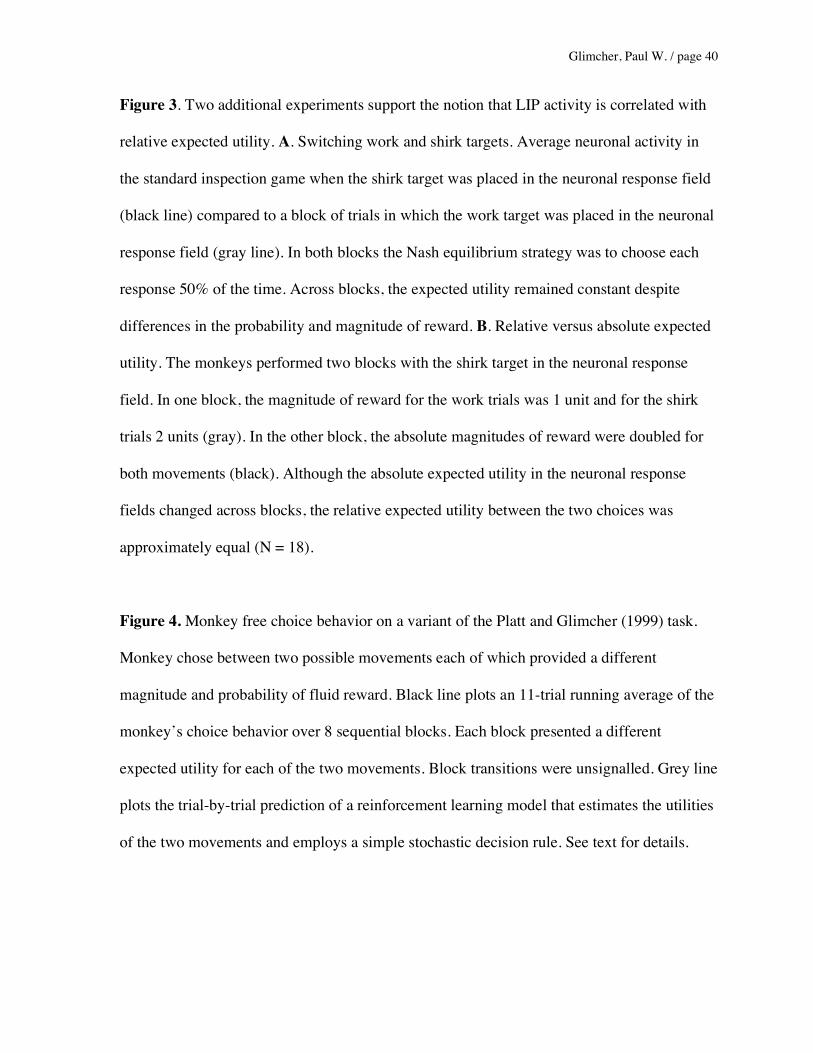
Figure 3. Two additional experiments support the notion that LIP activity is correlated with
relative expected utility. A. Switching work and shirk targets. Average neuronal activity in
the standard inspection game when the shirk target was placed in the neuronal response field
(black line) compared to a block of trials in which the work target was placed in the neuronal
response field (gray line). In both blocks the Nash equilibrium strategy was to choose each
response 50% of the time. Across blocks, the expected utility remained constant despite
differences in the probability and magnitude of reward. B. Relative versus absolute expected
utility. The monkeys performed two blocks with the shirk target in the neuronal response
field. In one block, the magnitude of reward for the work trials was 1 unit and for the shirk
trials 2 units (gray). In the other block, the absolute magnitudes of reward were doubled for
both movements (black). Although the absolute expected utility in the neuronal response
fields changed across blocks, the relative expected utility between the two choices was
approximately equal (N = 18).
Figure 4. Monkey free choice behavior on a variant of the Platt and Glimcher (1999) task.
Monkey chose between two possible movements each of which provided a different
magnitude and probability of fluid reward. Black line plots an 11-trial running average of the
monkey’s choice behavior over 8 sequential blocks. Each block presented a different
expected utility for each of the two movements. Block transitions were unsignalled. Grey line
plots the trial-by-trial prediction of a reinforcement learning model that estimates the utilities
of the two movements and employs a simple stochastic decision rule. See text for details.
0 100 200
10
30
50
70
90
Trial Number
Pro
port
ion
of S
hirk
ing
(%)
0 100 200
10
30
50
70
90
Trial Number
Pro
port
ion
of S
hirk
ing
(%)
300
A
C
Humans MonkeysD
Normative Proportion of Shirking (%)
Act
ual P
ropo
rtio
n of
Shi
rkin
g (%
)
10 30 50 70 90
10
30
50
70
90vs computervs human
Normative Proportion of Shirking (%)
Act
ual P
ropo
rtio
n of
Shi
rkin
g (%
)
10 30 50 70 90
10
30
50
70
90
B
EMPLOYER
EM
PL
OY
EE
Wo
rkS
hir
k
Inspect No Inspect
V-I-W V-W
W-C W-C
-I
0
-W
W
General Payoff
EMPLOYER
EM
PL
OY
EE
Wo
rkS
hir
k
Inspect No Inspect
1.31
21
-22
-0.70
70% Nash Equilibrium
EMPLOYER
EM
PL
OY
EE
Wo
rkS
hir
k
Inspect No Inspect
1.71
21
-22
-0.30
30% Nash Equilibrium
E

HighE.U.
LowE.U.
~EqualE.U.
200 400
50
0
100 100
50
0
Trial Number
Per
cent
Shi
rk (
%)
Shi
rk R
elat
ed A
ctiv
ity (
sp/s
)
Block1 2 3 4 5 6
0 1000 20000
50
100
Time from Target Presentation (ms)
Neu
rona
l Act
ivity
(sp
ikes
/s)
0 1000 20000
50
100
Time from Target Presentation (ms)
Neu
rona
l Act
ivity
(sp
ikes
/s)
A
B C

100
50
00 1000 2000
Neu
rona
l Act
ivity
(sp
/s)
Time from Target Presentation (ms)
A
100
50
01000 2000
Time from Target Presentation (ms)0
BN
euro
nal A
ctiv
ity (
sp/s
)
Target inResponse Field
ShirkWork
Reward Magnitudein Response Field
DoubleRegular

100 200 300 400 5000
0.2
0.4
0.6
0.8
1
Prop
ortio
n of
Cho
ice
1
Trial Number