Embed Size (px)
Citation preview
Neutral Hydrogen Gas in Star Forming Galaxies at z=0.24
Philip Lah
Frank Briggs (ANU)
Jayaram Chengalur (NCRA)
Matthew Colless (AAO)
Roberto De Propris (CTIO)
Michael Pracy (ANU)
Erwin de Blok (ANU)

Background
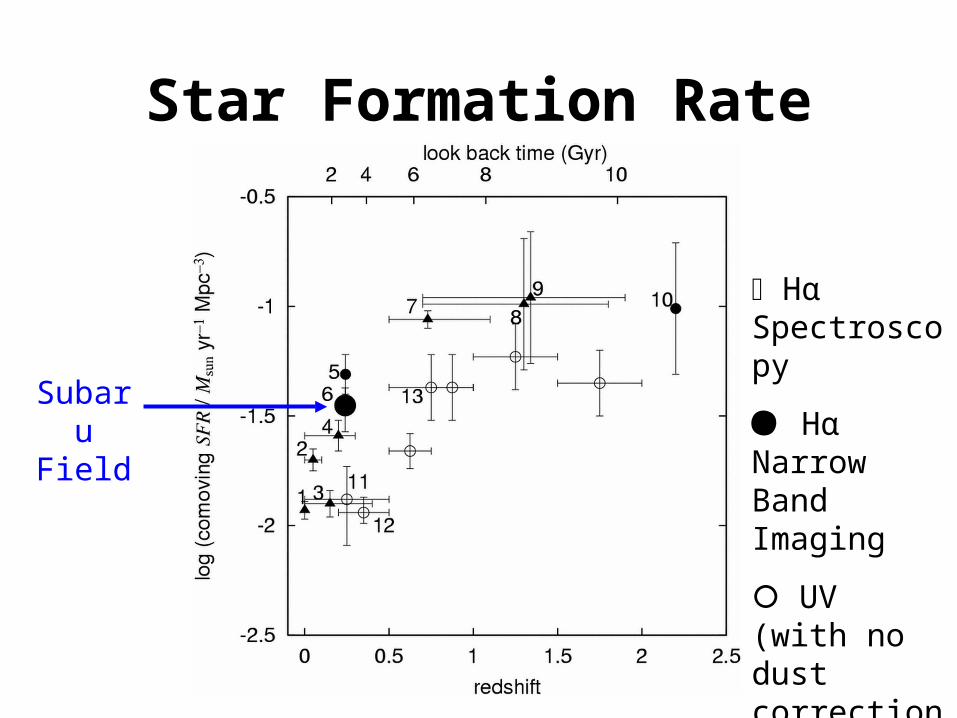
Star Formation Rate
SubaruField
Hα Spectroscopy
Hα Narrow Band Imaging
UV (with no dust correction)
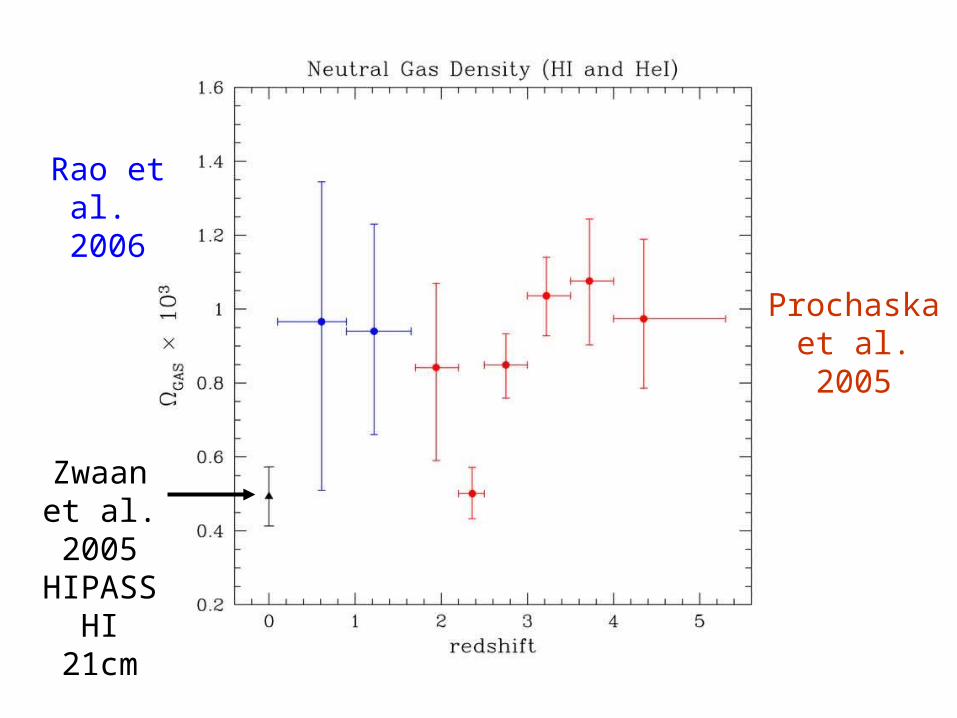
HI redshift
Zwaan et al. 2005HIPASSHI 21cm
Rao et al. 2006
Prochaska et al. 2005
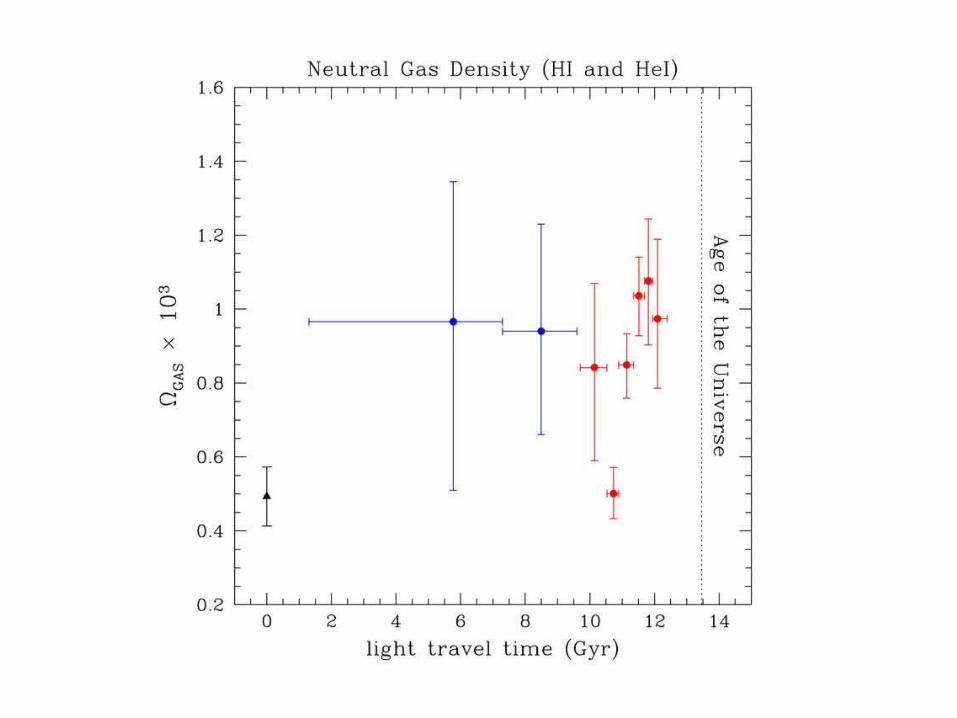
HI look back
HI 21cm Emission at
High Redshift
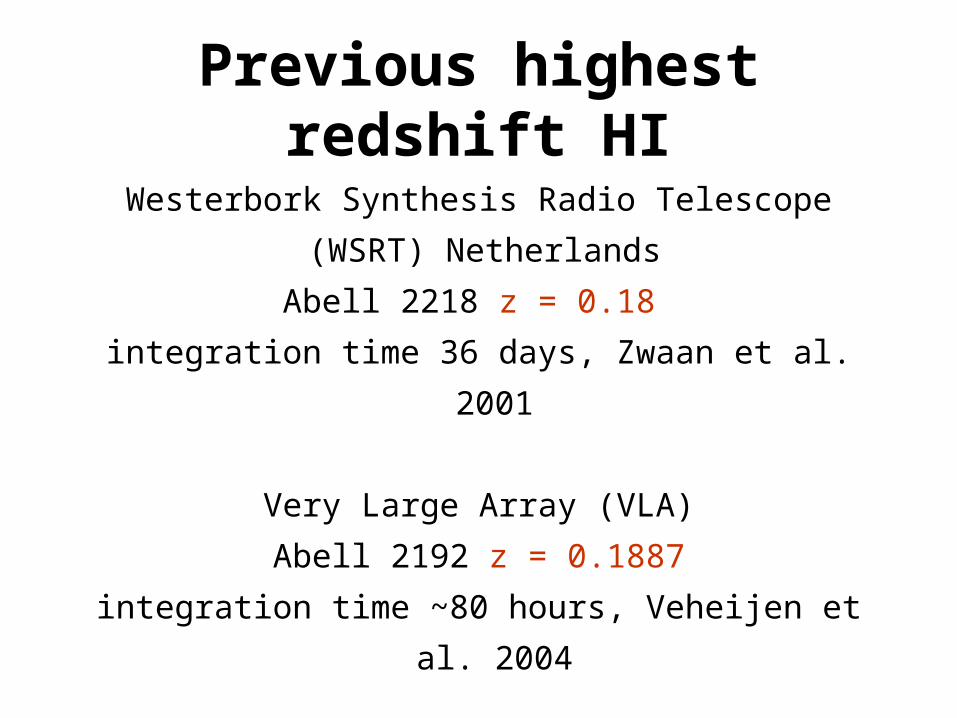
Previous highest redshift HI
Westerbork Synthesis Radio Telescope (WSRT)
Netherlands
Abell 2218 z = 0.18
integration time 36 days, Zwaan et al. 2001
Very Large Array (VLA)
Abell 2192 z = 0.1887
integration time ~80 hours, Veheijen et al. 2004
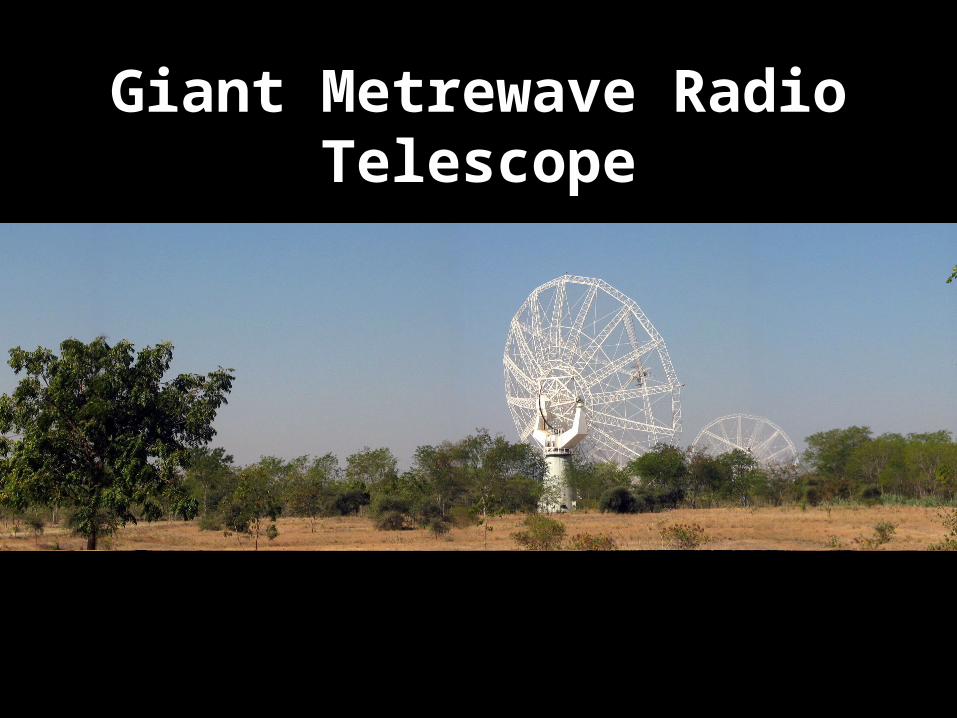
Giant Metrewave Radio Telescope
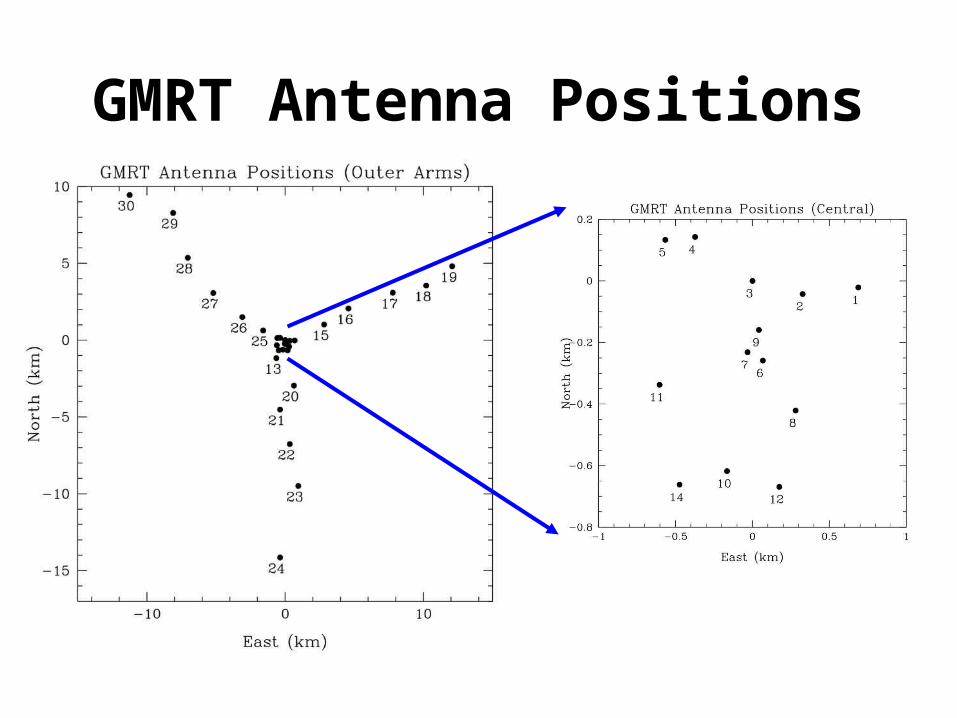
GMRT Antenna Positions
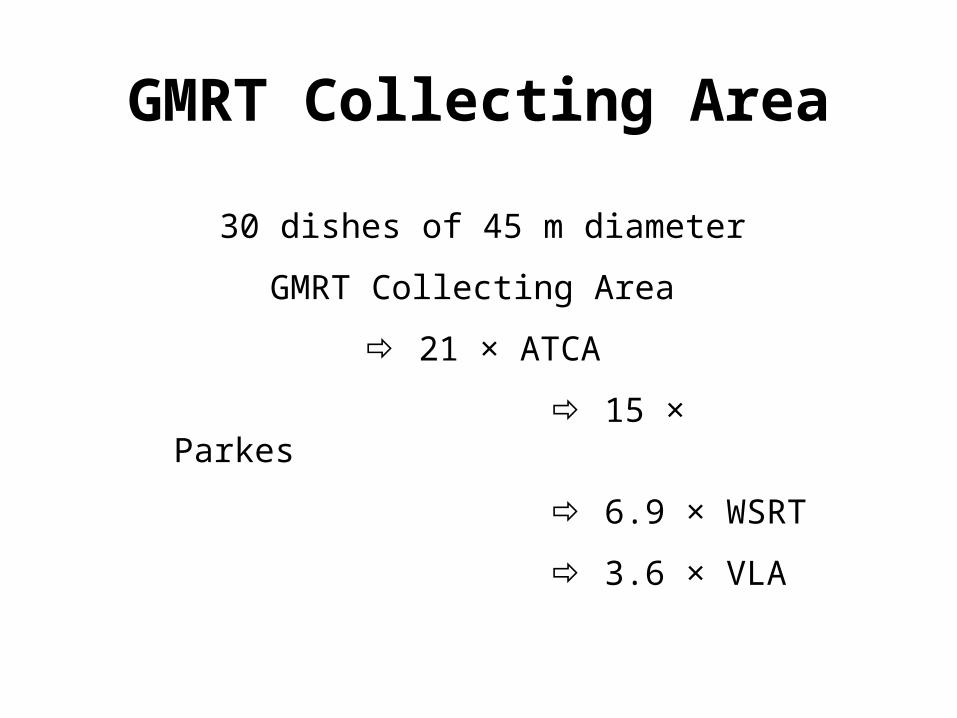
GMRT Collecting Area
30 dishes of 45 m diameter
GMRT Collecting Area
21 × ATCA
15 × Parkes
6.9 × WSRT
3.6 × VLA
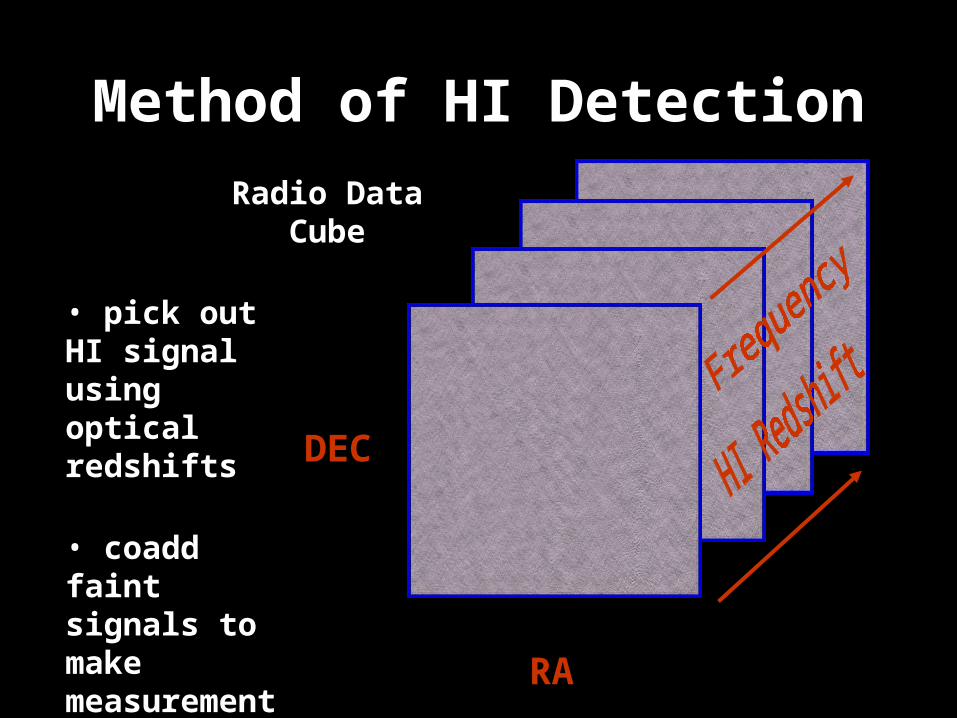
Method of HI Detection
RA
DEC
Radio Data Cube
• pick out HI signal using optical redshifts
• coadd faint signals to make measurement
The Subaru Field - H emission galaxies
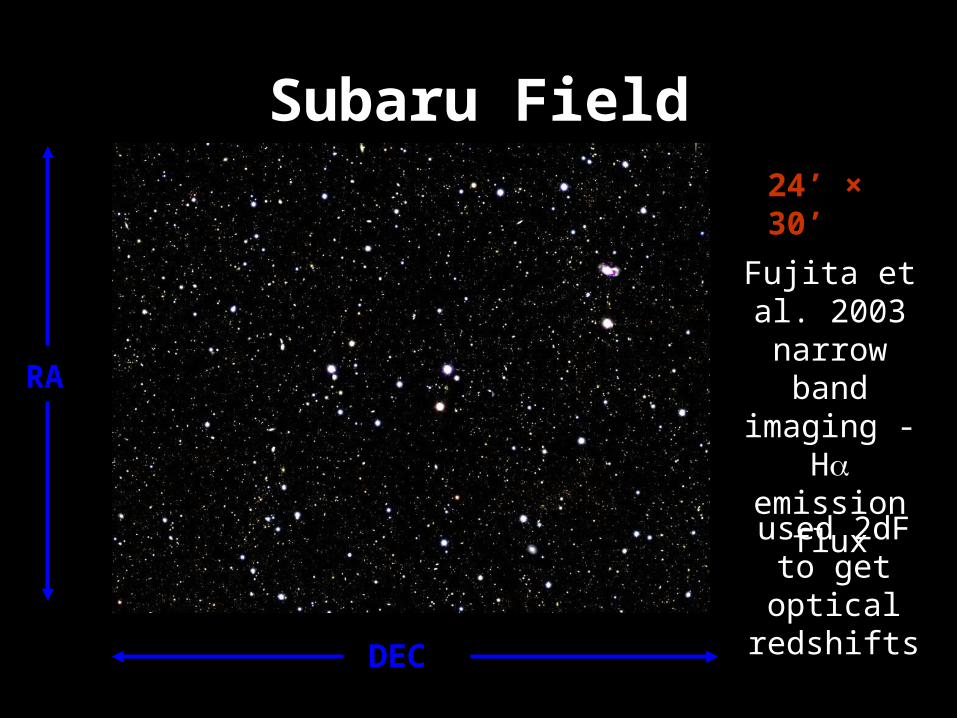
Subaru Field
RA
DEC
24’ × 30’
Fujita et al. 2003 narrow band imaging - H emission
flux
used 2dF to get optical
redshifts
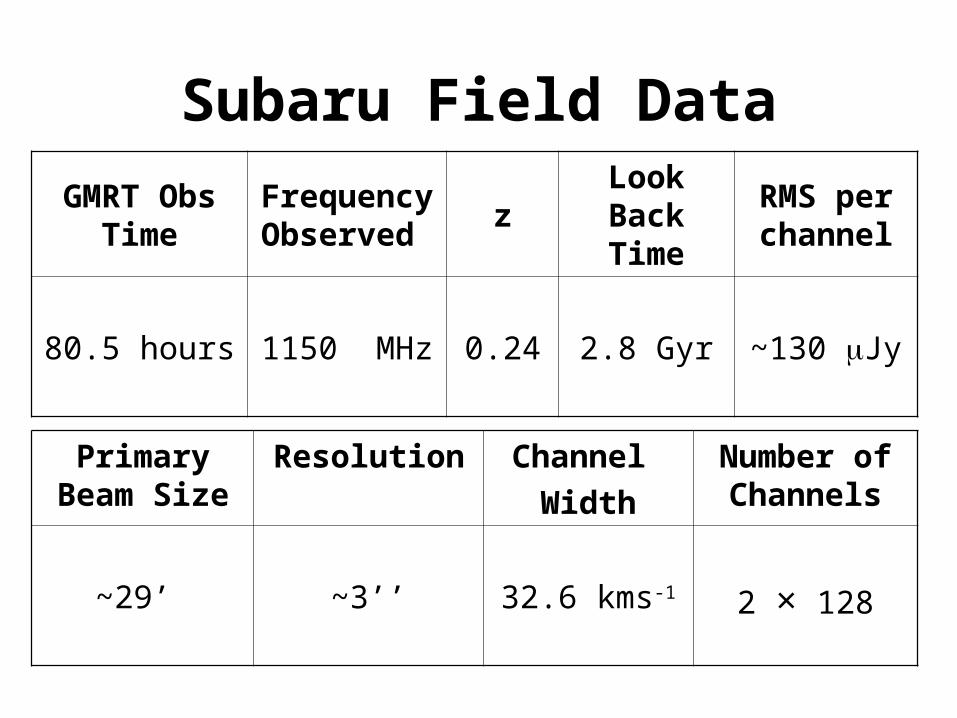
Subaru Field Data
GMRT Obs Time
Frequency Observed
zLook Back
TimeRMS per channel
80.5 hours 1150 MHz 0.24 2.8 Gyr ~130 Jy
Primary Beam Size
Resolution Channel
Width
Number of Channels
~29’ ~3’’ 32.6 kms-1 2 × 128
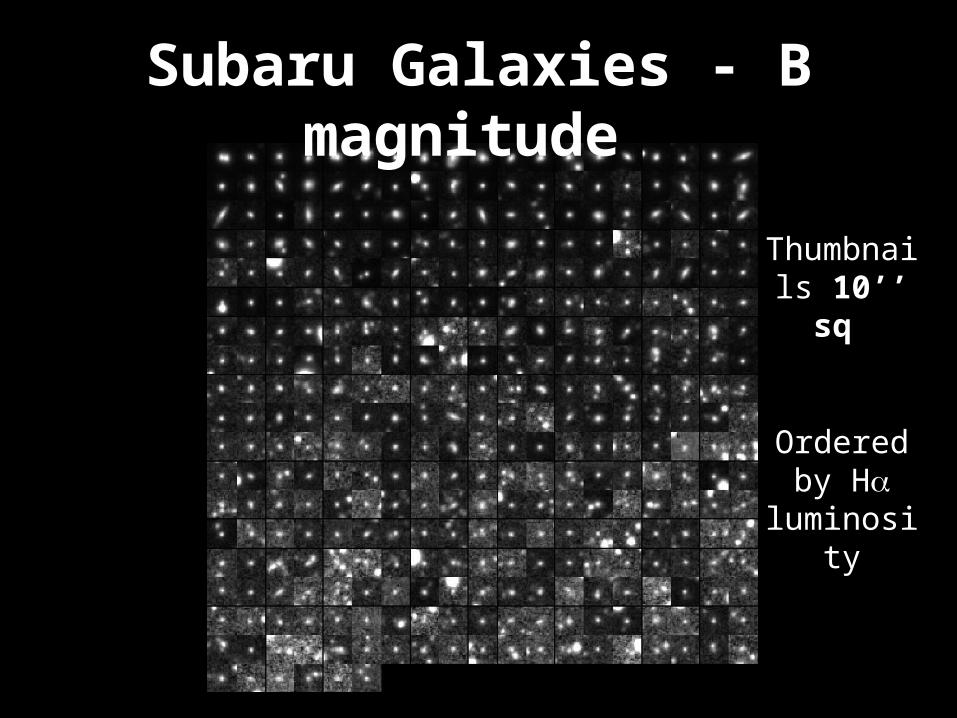
Subaru Galaxies - B magnitude
Thumbnails 10’’ sq
Ordered by H
luminosity
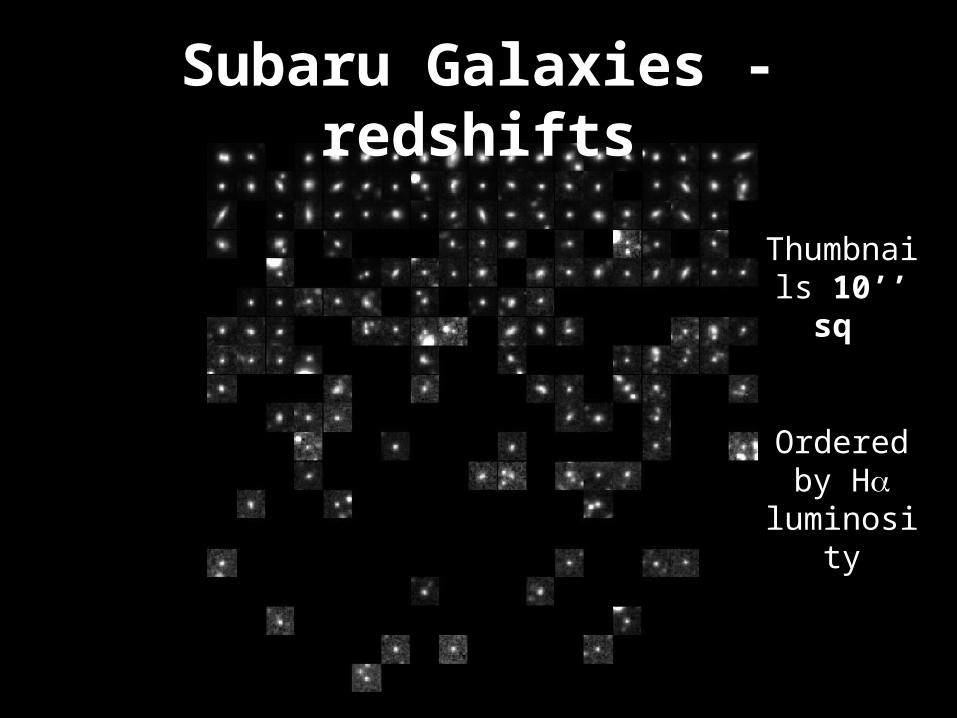
Subaru Galaxies - redshifts
Thumbnails 10’’ sq
Ordered by H
luminosity
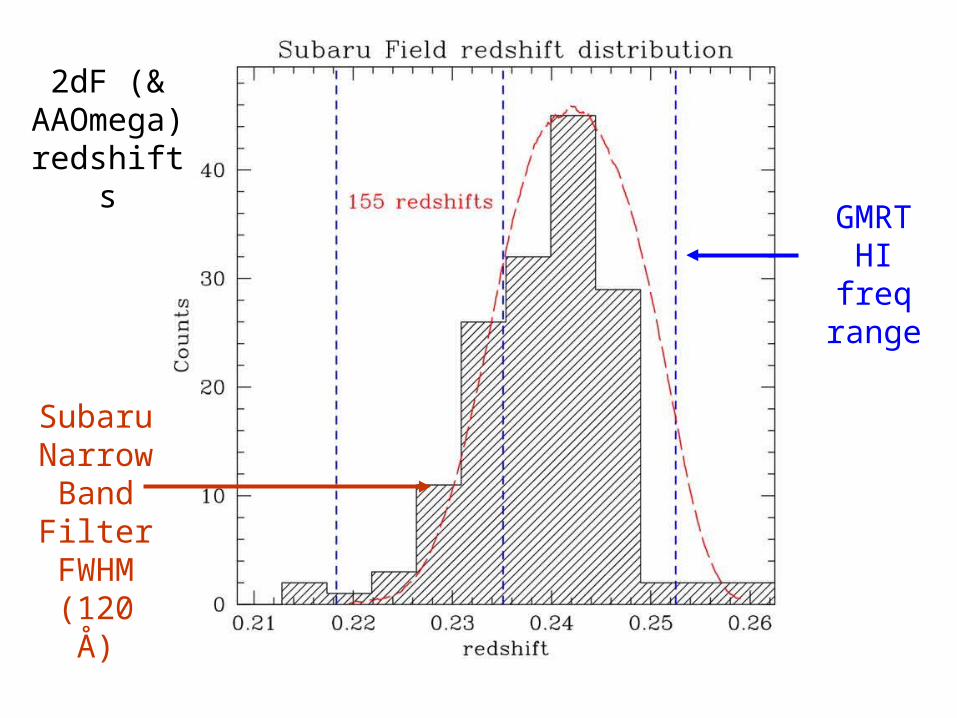
Redshift histogram
Subaru Narrow Band Filter
FWHM (120 Å)
GMRT HI freq range
2dF (& AAOmega) redshift
s
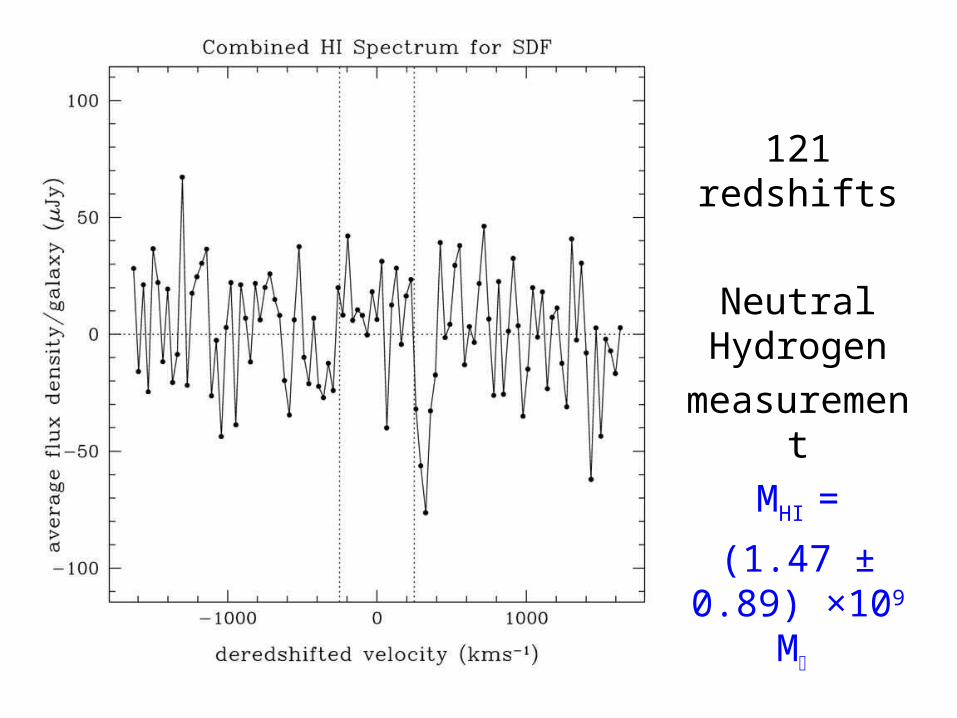
HI spectrum all
121 redshifts
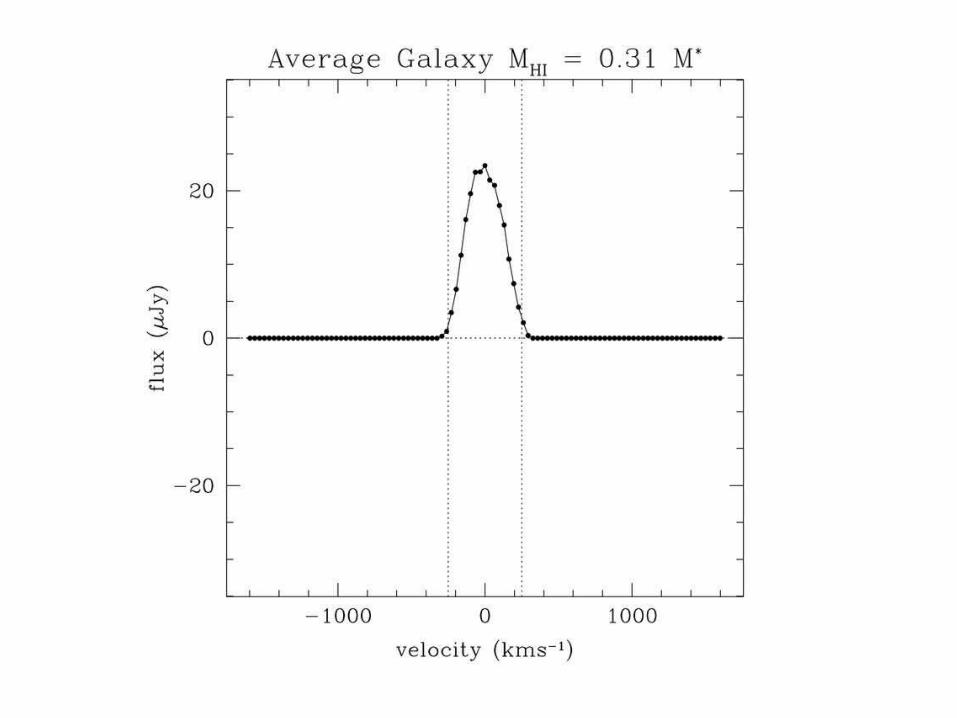
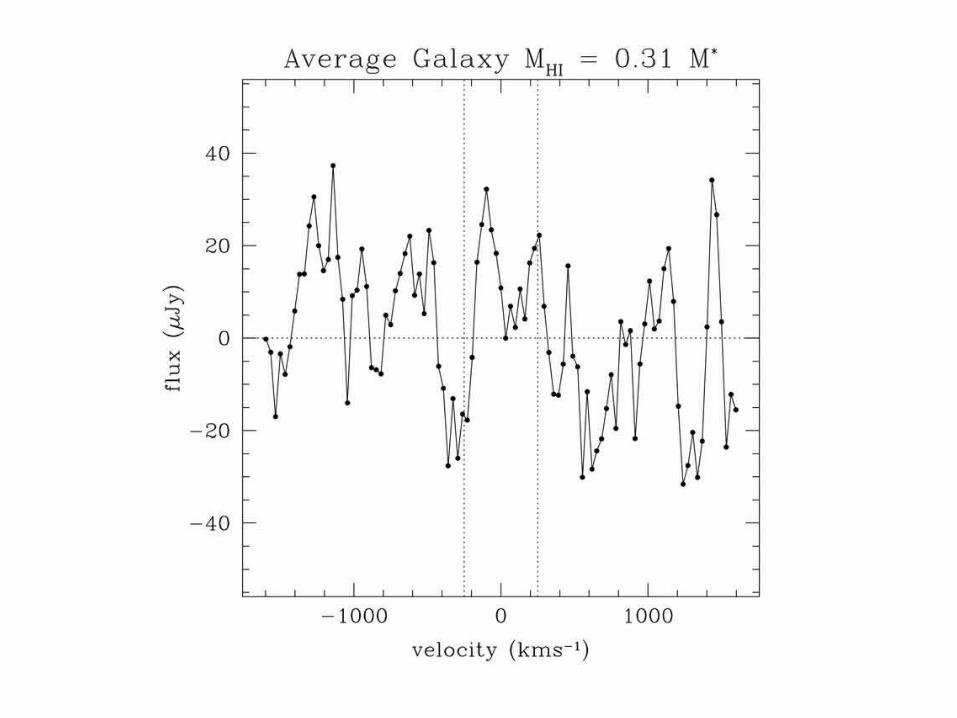
Neutral Hydrogen
measurement
MHI =
(1.47 ± 0.89) ×109 M

HI redshift mine all
• used the Fujita et al. 2003 H Luminosity
function for volume calculation
• comparable error to low z DLA
measurements but required less
observing effort (no need lots of
HST time)
Radio Continuum in the
Subaru Field
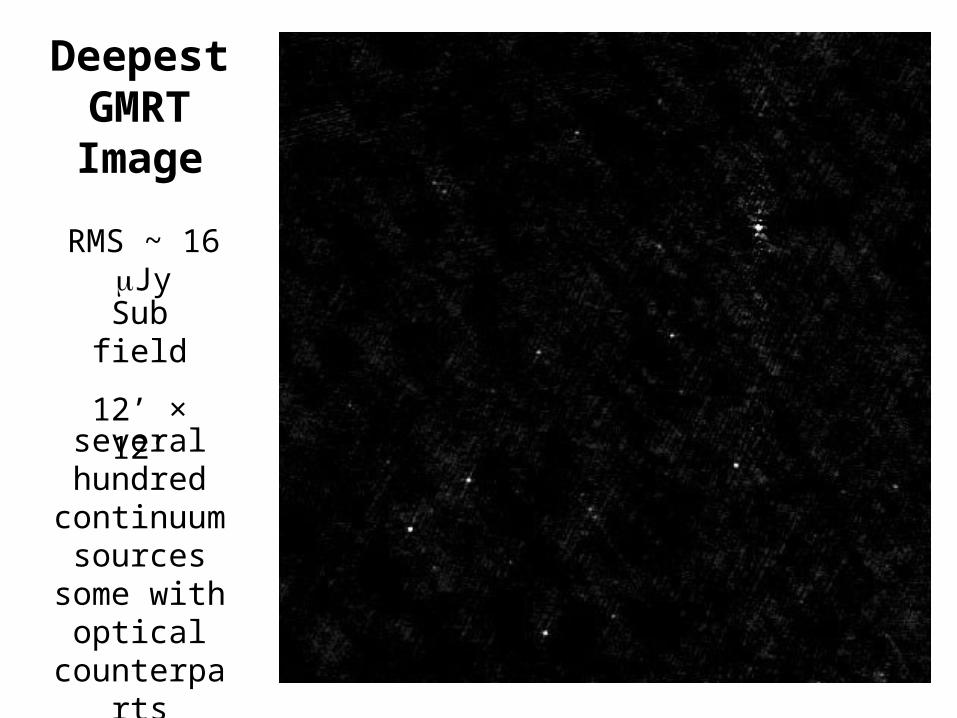
Deepest GMRT Image
Sub field
12’ × 12’
RMS ~ 16 Jy
several hundred
continuum sources some with optical counterparts
Sullivan et al. 2003
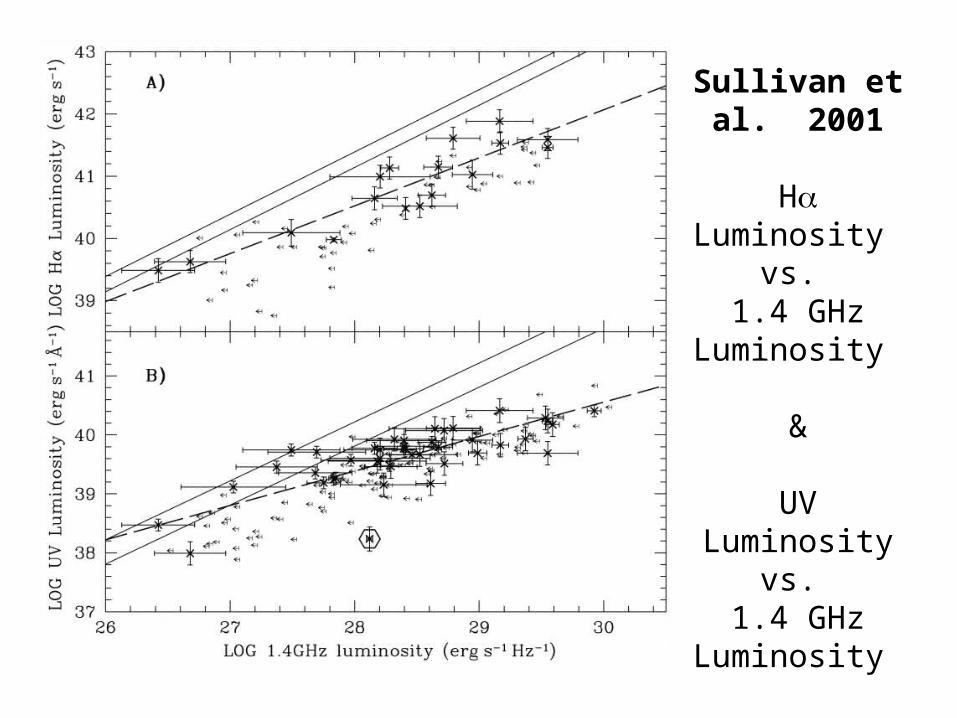
Sullivan et al. 2001
H Luminosity vs.
1.4 GHz Luminosity
&
UV Luminosity vs.
1.4 GHz Luminosity
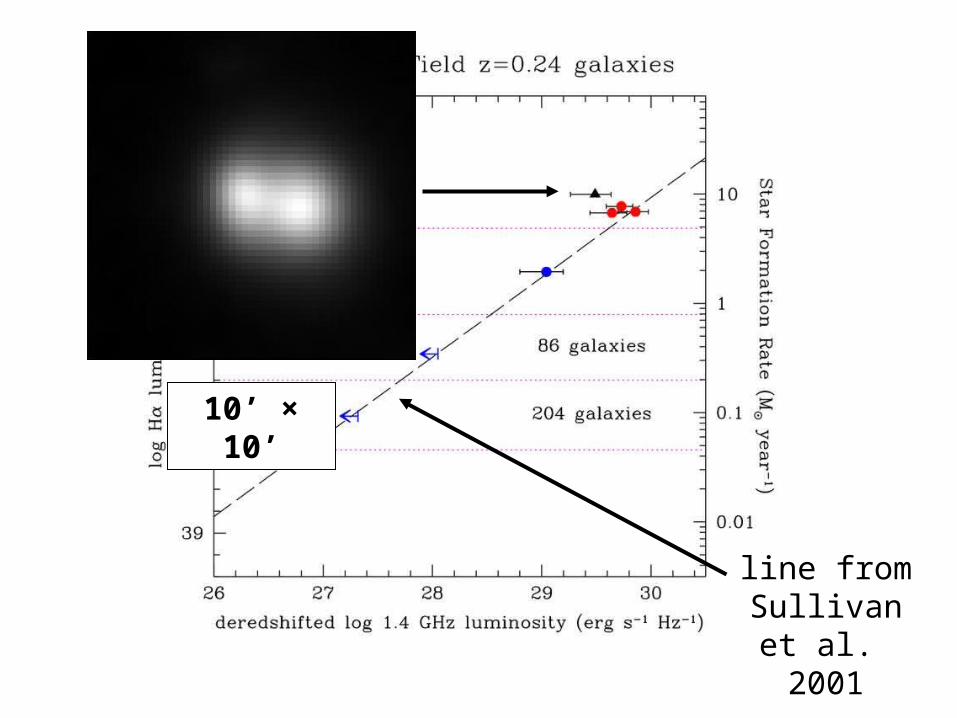
Halpha vs. RC
line from Sullivan et al.
2001
10’ × 10’
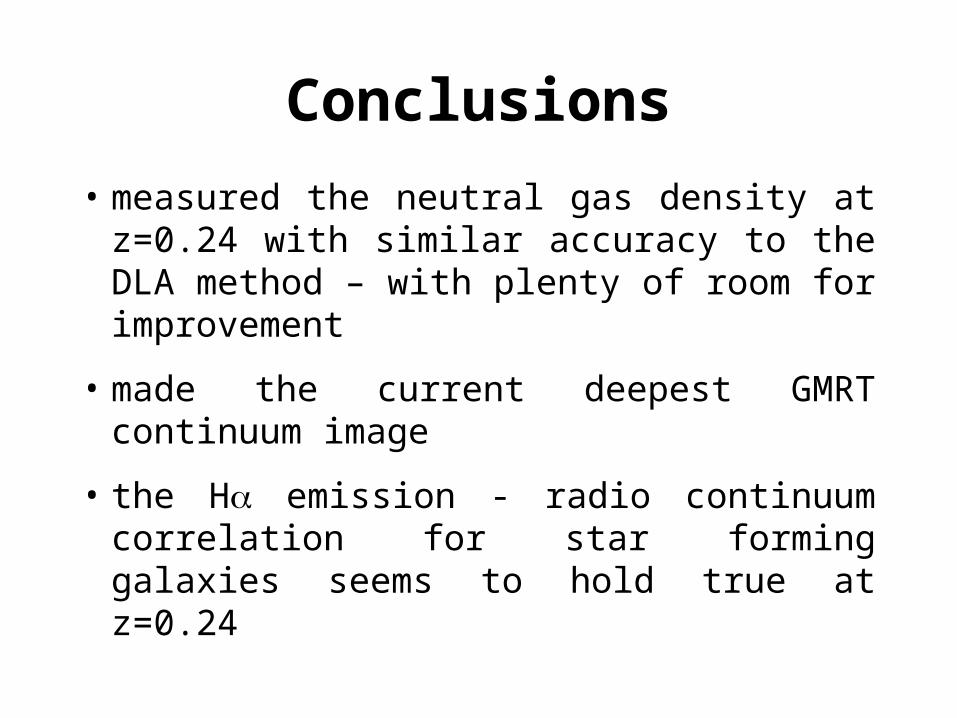
Conclusions
• measured the neutral gas density at z=0.24 with similar accuracy to the DLA method – with plenty of room for improvement
• made the current deepest GMRT continuum image
• the H emission - radio continuum correlation for star forming galaxies seems to hold true at z=0.24
The End

Additional Slides
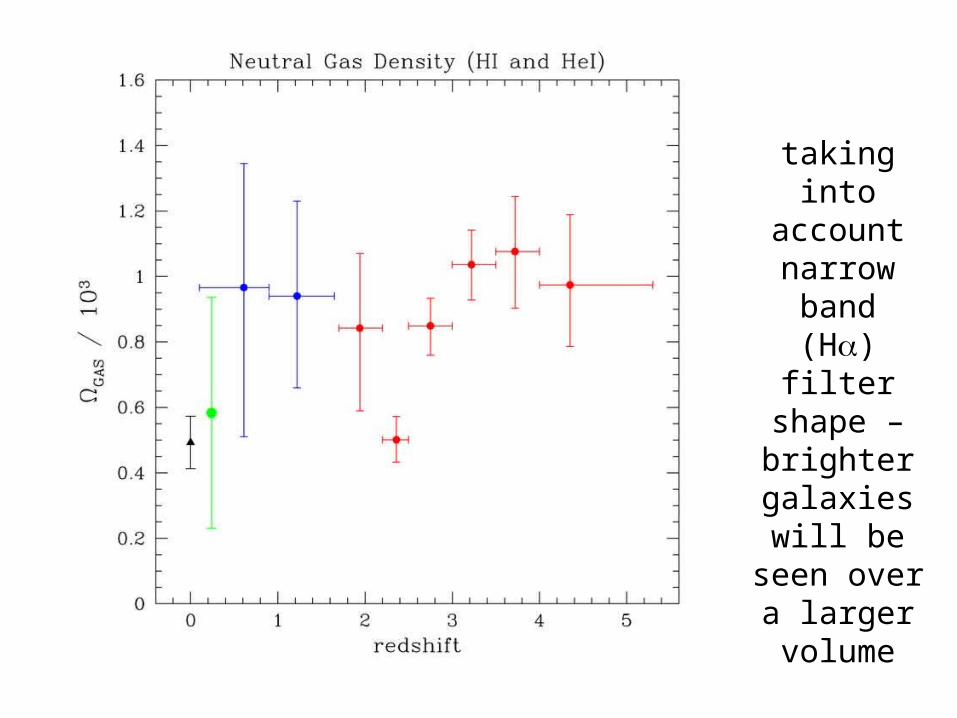
HI redshift mine all
taking into account
narrow band (H) filter
shape – brighter
galaxies will be seen over
a larger volume
Model no error
model

UV Plane
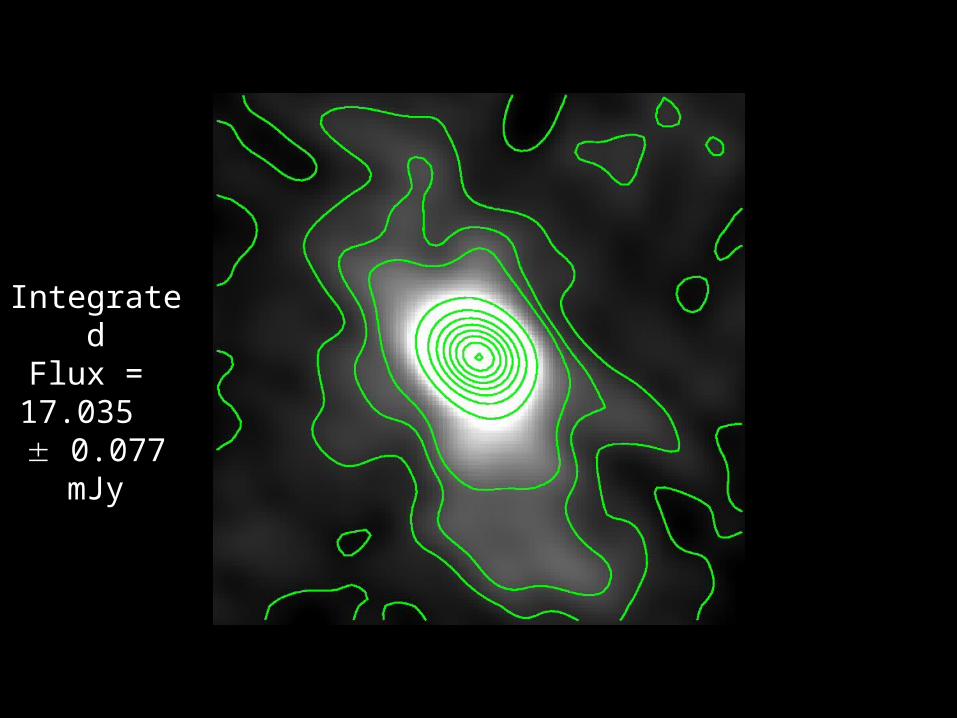
Fuzzy RC
IntegratedFlux = 17.035
0.077 mJy
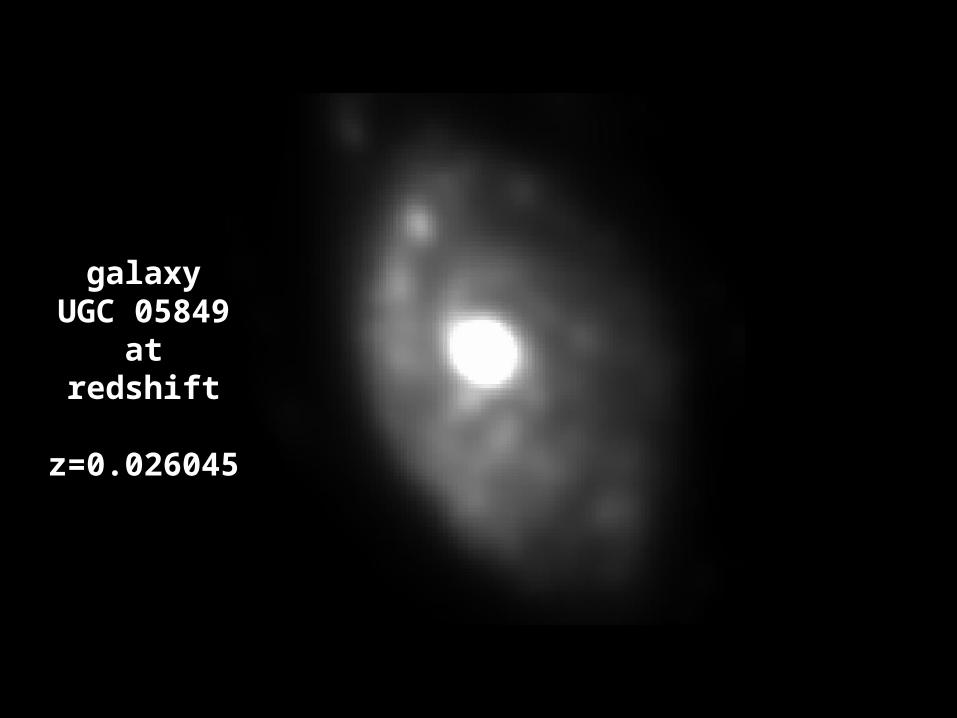
Fuzzy B
galaxyUGC 05849
atredshift
z=0.026045