Embed Size (px)
Citation preview
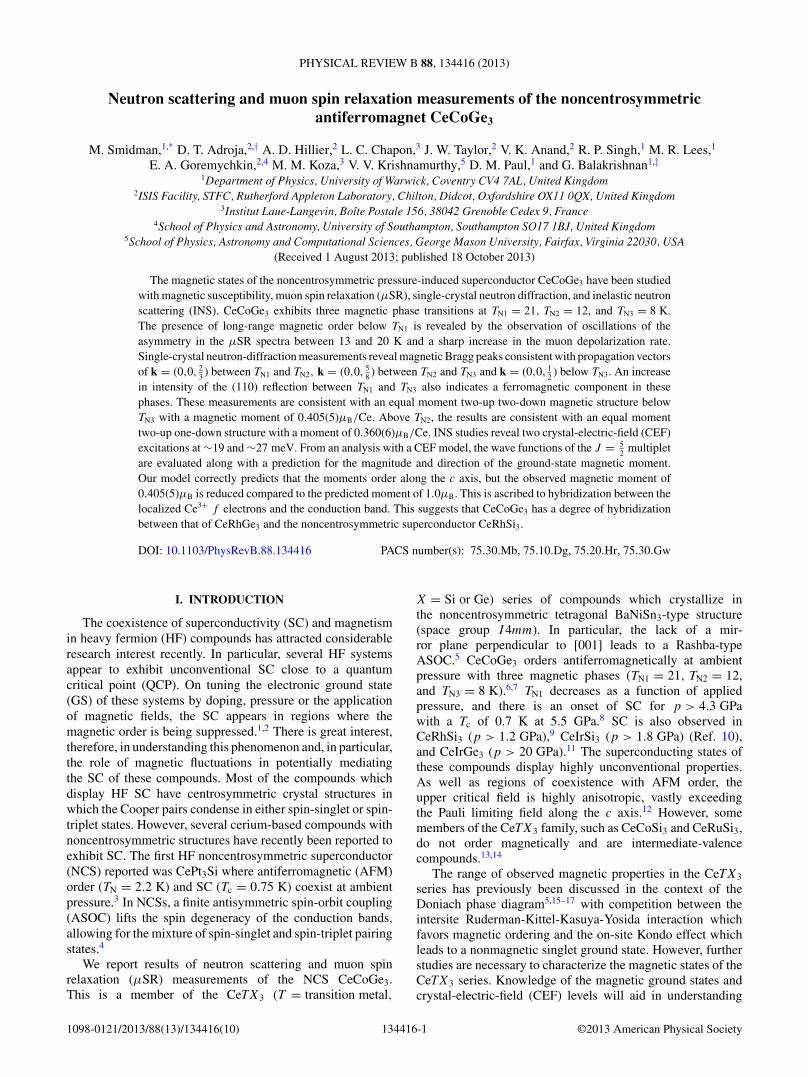
PHYSICAL REVIEW B 88, 134416 (2013)
Neutron scattering and muon spin relaxation measurements of the noncentrosymmetricantiferromagnet CeCoGe3
M. Smidman,1,* D. T. Adroja,2,† A. D. Hillier,2 L. C. Chapon,3 J. W. Taylor,2 V. K. Anand,2 R. P. Singh,1 M. R. Lees,1
E. A. Goremychkin,2,4 M. M. Koza,3 V. V. Krishnamurthy,5 D. M. Paul,1 and G. Balakrishnan1,‡1Department of Physics, University of Warwick, Coventry CV4 7AL, United Kingdom
2ISIS Facility, STFC, Rutherford Appleton Laboratory, Chilton, Didcot, Oxfordshire OX11 0QX, United Kingdom3Institut Laue-Langevin, Boıte Postale 156, 38042 Grenoble Cedex 9, France
4School of Physics and Astronomy, University of Southampton, Southampton SO17 1BJ, United Kingdom5School of Physics, Astronomy and Computational Sciences, George Mason University, Fairfax, Virginia 22030, USA
(Received 1 August 2013; published 18 October 2013)
The magnetic states of the noncentrosymmetric pressure-induced superconductor CeCoGe3 have been studiedwith magnetic susceptibility, muon spin relaxation (μSR), single-crystal neutron diffraction, and inelastic neutronscattering (INS). CeCoGe3 exhibits three magnetic phase transitions at TN1 = 21, TN2 = 12, and TN3 = 8 K.The presence of long-range magnetic order below TN1 is revealed by the observation of oscillations of theasymmetry in the μSR spectra between 13 and 20 K and a sharp increase in the muon depolarization rate.Single-crystal neutron-diffraction measurements reveal magnetic Bragg peaks consistent with propagation vectorsof k = (0,0, 2
3 ) between TN1 and TN2, k = (0,0, 58 ) between TN2 and TN3 and k = (0,0, 1
2 ) below TN3. An increasein intensity of the (110) reflection between TN1 and TN3 also indicates a ferromagnetic component in thesephases. These measurements are consistent with an equal moment two-up two-down magnetic structure belowTN3 with a magnetic moment of 0.405(5)μB/Ce. Above TN2, the results are consistent with an equal momenttwo-up one-down structure with a moment of 0.360(6)μB/Ce. INS studies reveal two crystal-electric-field (CEF)excitations at ∼19 and ∼27 meV. From an analysis with a CEF model, the wave functions of the J = 5
2 multipletare evaluated along with a prediction for the magnitude and direction of the ground-state magnetic moment.Our model correctly predicts that the moments order along the c axis, but the observed magnetic moment of0.405(5)μB is reduced compared to the predicted moment of 1.0μB. This is ascribed to hybridization between thelocalized Ce3+ f electrons and the conduction band. This suggests that CeCoGe3 has a degree of hybridizationbetween that of CeRhGe3 and the noncentrosymmetric superconductor CeRhSi3.
DOI: 10.1103/PhysRevB.88.134416 PACS number(s): 75.30.Mb, 75.10.Dg, 75.20.Hr, 75.30.Gw
I. INTRODUCTION
The coexistence of superconductivity (SC) and magnetismin heavy fermion (HF) compounds has attracted considerableresearch interest recently. In particular, several HF systemsappear to exhibit unconventional SC close to a quantumcritical point (QCP). On tuning the electronic ground state(GS) of these systems by doping, pressure or the applicationof magnetic fields, the SC appears in regions where themagnetic order is being suppressed.1,2 There is great interest,therefore, in understanding this phenomenon and, in particular,the role of magnetic fluctuations in potentially mediatingthe SC of these compounds. Most of the compounds whichdisplay HF SC have centrosymmetric crystal structures inwhich the Cooper pairs condense in either spin-singlet or spin-triplet states. However, several cerium-based compounds withnoncentrosymmetric structures have recently been reported toexhibit SC. The first HF noncentrosymmetric superconductor(NCS) reported was CePt3Si where antiferromagnetic (AFM)order (TN = 2.2 K) and SC (Tc = 0.75 K) coexist at ambientpressure.3 In NCSs, a finite antisymmetric spin-orbit coupling(ASOC) lifts the spin degeneracy of the conduction bands,allowing for the mixture of spin-singlet and spin-triplet pairingstates.4
We report results of neutron scattering and muon spinrelaxation (μSR) measurements of the NCS CeCoGe3.This is a member of the CeTX3 (T = transition metal,
X = Si or Ge) series of compounds which crystallize inthe noncentrosymmetric tetragonal BaNiSn3-type structure(space group I4mm). In particular, the lack of a mir-ror plane perpendicular to [001] leads to a Rashba-typeASOC.5 CeCoGe3 orders antiferromagnetically at ambientpressure with three magnetic phases (TN1 = 21, TN2 = 12,and TN3 = 8 K).6,7 TN1 decreases as a function of appliedpressure, and there is an onset of SC for p > 4.3 GPawith a Tc of 0.7 K at 5.5 GPa.8 SC is also observed inCeRhSi3 (p > 1.2 GPa),9 CeIrSi3 (p > 1.8 GPa) (Ref. 10),and CeIrGe3 (p > 20 GPa).11 The superconducting states ofthese compounds display highly unconventional properties.As well as regions of coexistence with AFM order, theupper critical field is highly anisotropic, vastly exceedingthe Pauli limiting field along the c axis.12 However, somemembers of the CeTX3 family, such as CeCoSi3 and CeRuSi3,do not order magnetically and are intermediate-valencecompounds.13,14
The range of observed magnetic properties in the CeTX3
series has previously been discussed in the context of theDoniach phase diagram5,15–17 with competition between theintersite Ruderman-Kittel-Kasuya-Yosida interaction whichfavors magnetic ordering and the on-site Kondo effect whichleads to a nonmagnetic singlet ground state. However, furtherstudies are necessary to characterize the magnetic states of theCeTX3 series. Knowledge of the magnetic ground states andcrystal-electric-field (CEF) levels will aid in understanding
134416-11098-0121/2013/88(13)/134416(10) ©2013 American Physical Society
M. SMIDMAN et al. PHYSICAL REVIEW B 88, 134416 (2013)
the relationship between SC and magnetism in the CeTX3
compounds and allows detailed comparisons between mem-bers of the series. In particular, the role of hybridization indetermining the phase diagram can be examined. CeCoGe3
can be considered a strongly correlated system with anelectronic specific heat coefficient of γ = 32 mJ mol−1 K−2
and an enhanced cyclotron mass of 10me, where me is the free-electron mass.7,18 The proximity of the compound to quantumcriticality has been studied in the CeCoGe3−xSix system wherethe substitution of Si increases the chemical pressure. Interest-ingly, although antiferromagnetism is suppressed for x = 1.2and a quantum critical region with non-Fermi-liquid behavioris observed for 1 < x < 1.5, no SC was reported down to0.5 K.13,19 This is in contrast to the superconducting behaviorobserved for the x = 0 compound with applied hydrostaticpressure.
As well as being an unconventional superconductor,12
CeCoGe3 has the highest magnetic ordering temperature(TN1 = 21 K) of any of the CeTX3 compounds and exhibitsa complex temperature-pressure phase diagram.20,21 Specificheat measurements of single crystals reveal that, under a pres-sure of p = 0.8 GPa, a fourth transition is observed at 15.3 Kin addition to those observed under ambient conditions.20 Thetemperature of this transition does not shift with pressure,whereas, TN1 is suppressed until it meets the pressure-inducedphase at p = 1.5 GPa. In turn, the transition temperature ofthis phase is suppressed upon further increasing pressure untilit merges with TN2. The T − P phase diagram shows a seriesof steplike decreases in the magnetic ordering temperature. Atotal of six phases in the phase diagram were suggested fromsingle-crystal measurements up to 7 GPa, whereas, eight wereobserved in polycrystalline samples up to 2 GPa.20 The mag-netic order is suppressed at p = 5.5 GPa, and there is a regionof coexistence with SC. The lack of steplike transitions above3.1 GPa could indicate a change in magnetic structure whichmay be important for understanding the emergence of SC in thesystem.
The magnetic structure of CeCoGe3 has previously beenstudied at ambient pressure using single-crystal neutrondiffraction in a zero field where two propagation vectorswere observed at 2.9 K, k1 = (0,0, 1
2 ) and k2 = (0,0, 34 ).22
Powder-neutron-diffraction measurements also indicate thepresence of k1 at 2 K.23 In this study, we have determinedthe magnetic propagation vector in a zero field for eachof the three magnetic phases using single-crystal neutrondiffraction. We are then able to propose magnetic structuresfor the phases above TN2 and below TN3. We report thetemperature dependence of magnetic Bragg reflections from2 to 35 K. The presence of long-range magnetic order isalso revealed by μSR measurements where oscillations areobserved in the spectra below TN1. Single-crystal susceptibilityand magnetization measurements were previously used tosuggest a CEF scheme with a ground-state doublet consistingof the | ± 1
2 〉 states.7 We use inelastic neutron scattering (INS)to directly measure transitions from the ground state to theexcited CEF levels and are able to find an energy-level schemeand a set of wave functions compatible with both INS andmagnetic-susceptibility measurements. We are also able tocompare the degree of hybridization in CeCoGe3 with othercompounds in the series.
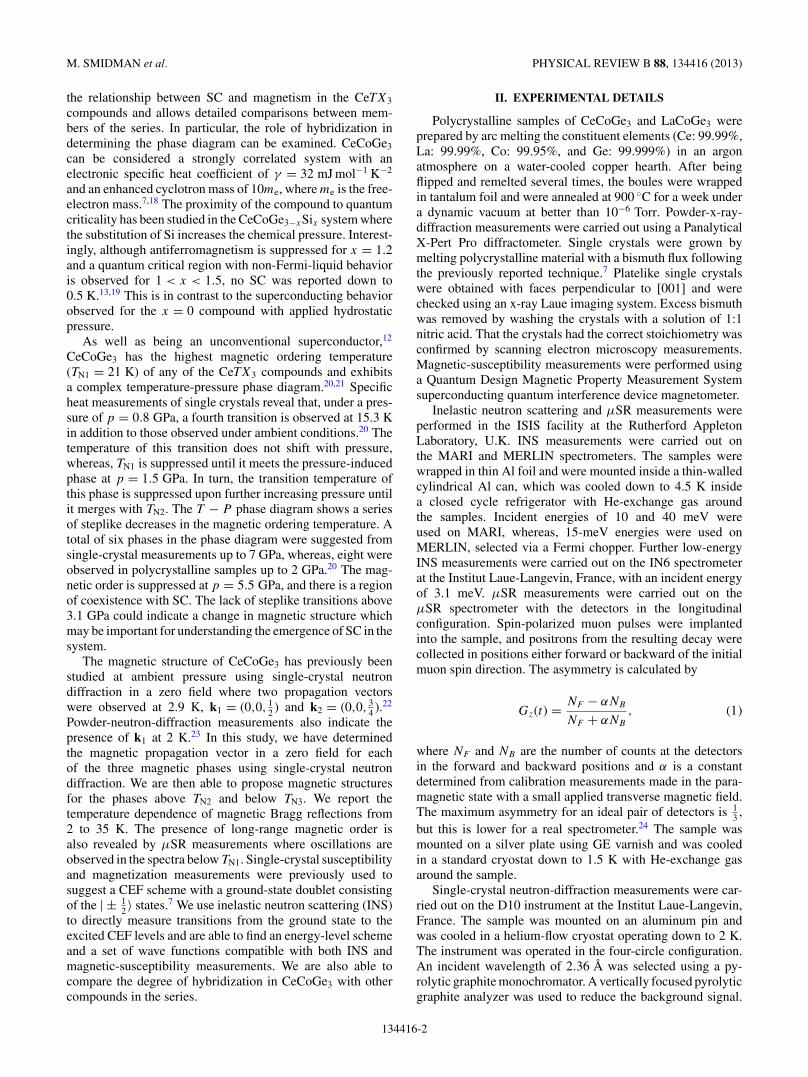
II. EXPERIMENTAL DETAILS
Polycrystalline samples of CeCoGe3 and LaCoGe3 wereprepared by arc melting the constituent elements (Ce: 99.99%,La: 99.99%, Co: 99.95%, and Ge: 99.999%) in an argonatmosphere on a water-cooled copper hearth. After beingflipped and remelted several times, the boules were wrappedin tantalum foil and were annealed at 900 ◦C for a week undera dynamic vacuum at better than 10−6 Torr. Powder-x-ray-diffraction measurements were carried out using a PanalyticalX-Pert Pro diffractometer. Single crystals were grown bymelting polycrystalline material with a bismuth flux followingthe previously reported technique.7 Platelike single crystalswere obtained with faces perpendicular to [001] and werechecked using an x-ray Laue imaging system. Excess bismuthwas removed by washing the crystals with a solution of 1:1nitric acid. That the crystals had the correct stoichiometry wasconfirmed by scanning electron microscopy measurements.Magnetic-susceptibility measurements were performed usinga Quantum Design Magnetic Property Measurement Systemsuperconducting quantum interference device magnetometer.
Inelastic neutron scattering and μSR measurements wereperformed in the ISIS facility at the Rutherford AppletonLaboratory, U.K. INS measurements were carried out onthe MARI and MERLIN spectrometers. The samples werewrapped in thin Al foil and were mounted inside a thin-walledcylindrical Al can, which was cooled down to 4.5 K insidea closed cycle refrigerator with He-exchange gas aroundthe samples. Incident energies of 10 and 40 meV wereused on MARI, whereas, 15-meV energies were used onMERLIN, selected via a Fermi chopper. Further low-energyINS measurements were carried out on the IN6 spectrometerat the Institut Laue-Langevin, France, with an incident energyof 3.1 meV. μSR measurements were carried out on theμSR spectrometer with the detectors in the longitudinalconfiguration. Spin-polarized muon pulses were implantedinto the sample, and positrons from the resulting decay werecollected in positions either forward or backward of the initialmuon spin direction. The asymmetry is calculated by
Gz(t) = NF − αNB
NF + αNB
, (1)
where NF and NB are the number of counts at the detectorsin the forward and backward positions and α is a constantdetermined from calibration measurements made in the para-magnetic state with a small applied transverse magnetic field.The maximum asymmetry for an ideal pair of detectors is 1
3 ,but this is lower for a real spectrometer.24 The sample wasmounted on a silver plate using GE varnish and was cooledin a standard cryostat down to 1.5 K with He-exchange gasaround the sample.
Single-crystal neutron-diffraction measurements were car-ried out on the D10 instrument at the Institut Laue-Langevin,France. The sample was mounted on an aluminum pin andwas cooled in a helium-flow cryostat operating down to 2 K.The instrument was operated in the four-circle configuration.An incident wavelength of 2.36 A was selected using a py-rolytic graphite monochromator. A vertically focused pyrolyticgraphite analyzer was used to reduce the background signal.
134416-2
NEUTRON SCATTERING AND MUON SPIN RELAXATION . . . PHYSICAL REVIEW B 88, 134416 (2013)
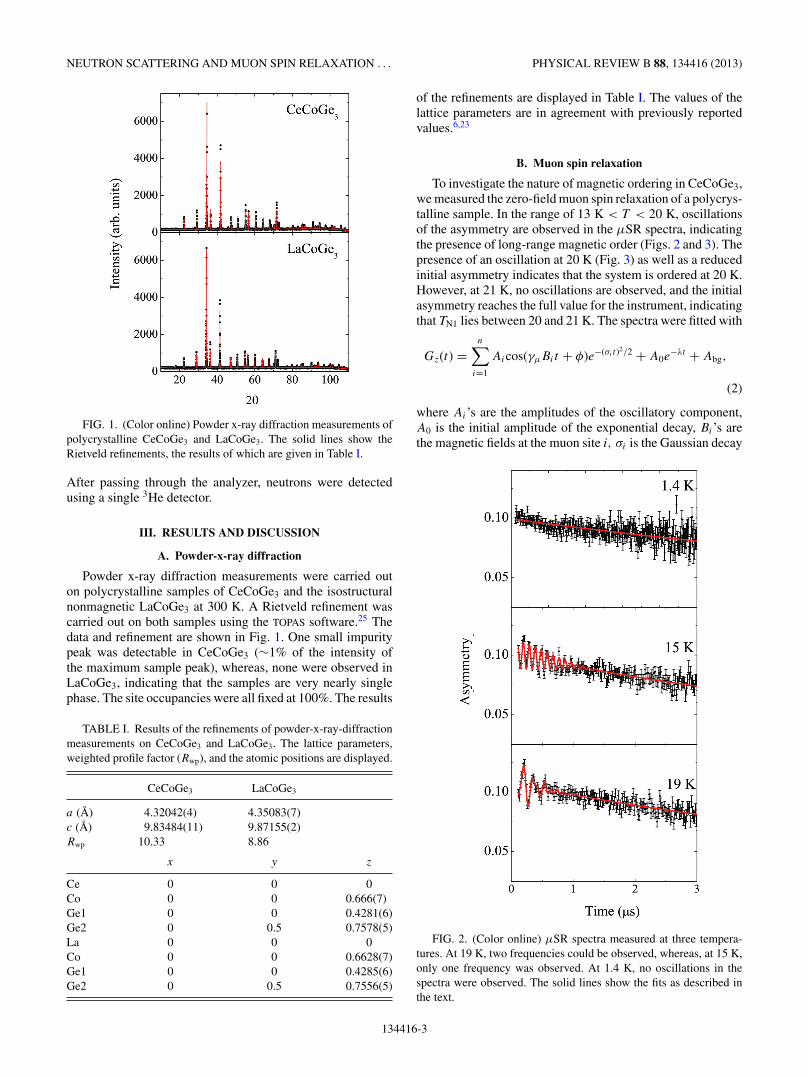
FIG. 1. (Color online) Powder x-ray diffraction measurements ofpolycrystalline CeCoGe3 and LaCoGe3. The solid lines show theRietveld refinements, the results of which are given in Table I.
After passing through the analyzer, neutrons were detectedusing a single 3He detector.
III. RESULTS AND DISCUSSION
A. Powder-x-ray diffraction
Powder x-ray diffraction measurements were carried outon polycrystalline samples of CeCoGe3 and the isostructuralnonmagnetic LaCoGe3 at 300 K. A Rietveld refinement wascarried out on both samples using the TOPAS software.25 Thedata and refinement are shown in Fig. 1. One small impuritypeak was detectable in CeCoGe3 (∼1% of the intensity ofthe maximum sample peak), whereas, none were observed inLaCoGe3, indicating that the samples are very nearly singlephase. The site occupancies were all fixed at 100%. The results
TABLE I. Results of the refinements of powder-x-ray-diffractionmeasurements on CeCoGe3 and LaCoGe3. The lattice parameters,weighted profile factor (Rwp), and the atomic positions are displayed.
CeCoGe3 LaCoGe3
a (A) 4.32042(4) 4.35083(7)c (A) 9.83484(11) 9.87155(2)Rwp 10.33 8.86
x y z
Ce 0 0 0Co 0 0 0.666(7)Ge1 0 0 0.4281(6)Ge2 0 0.5 0.7578(5)La 0 0 0Co 0 0 0.6628(7)Ge1 0 0 0.4285(6)Ge2 0 0.5 0.7556(5)
of the refinements are displayed in Table I. The values of thelattice parameters are in agreement with previously reportedvalues.6,23
B. Muon spin relaxation
To investigate the nature of magnetic ordering in CeCoGe3,we measured the zero-field muon spin relaxation of a polycrys-talline sample. In the range of 13 K < T < 20 K, oscillationsof the asymmetry are observed in the μSR spectra, indicatingthe presence of long-range magnetic order (Figs. 2 and 3). Thepresence of an oscillation at 20 K (Fig. 3) as well as a reducedinitial asymmetry indicates that the system is ordered at 20 K.However, at 21 K, no oscillations are observed, and the initialasymmetry reaches the full value for the instrument, indicatingthat TN1 lies between 20 and 21 K. The spectra were fitted with
Gz(t) =n∑
i=1
Aicos(γμBit + φ)e−(σi t)2/2 + A0e−λt + Abg,
(2)
where Ai’s are the amplitudes of the oscillatory component,A0 is the initial amplitude of the exponential decay, Bi’s arethe magnetic fields at the muon site i, σi is the Gaussian decay
FIG. 2. (Color online) μSR spectra measured at three tempera-tures. At 19 K, two frequencies could be observed, whereas, at 15 K,only one frequency was observed. At 1.4 K, no oscillations in thespectra were observed. The solid lines show the fits as described inthe text.
134416-3
M. SMIDMAN et al. PHYSICAL REVIEW B 88, 134416 (2013)
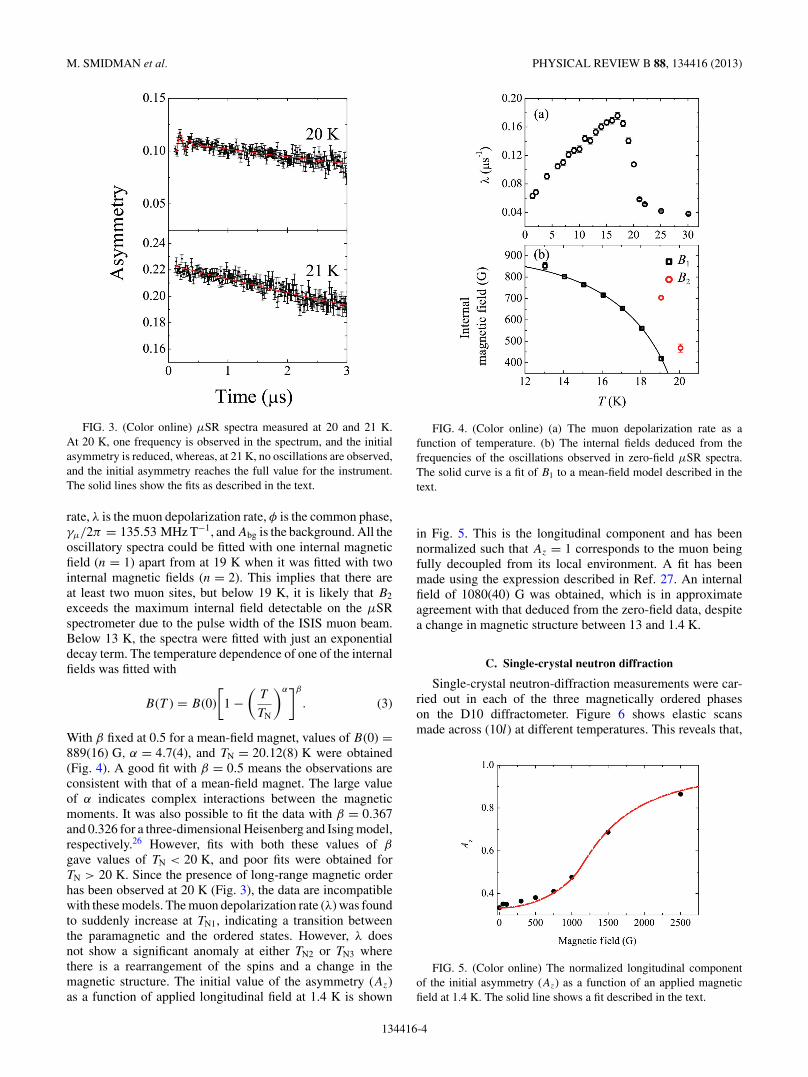
FIG. 3. (Color online) μSR spectra measured at 20 and 21 K.At 20 K, one frequency is observed in the spectrum, and the initialasymmetry is reduced, whereas, at 21 K, no oscillations are observed,and the initial asymmetry reaches the full value for the instrument.The solid lines show the fits as described in the text.
rate, λ is the muon depolarization rate, φ is the common phase,γμ/2π = 135.53 MHz T−1, and Abg is the background. All theoscillatory spectra could be fitted with one internal magneticfield (n = 1) apart from at 19 K when it was fitted with twointernal magnetic fields (n = 2). This implies that there areat least two muon sites, but below 19 K, it is likely that B2
exceeds the maximum internal field detectable on the μSRspectrometer due to the pulse width of the ISIS muon beam.Below 13 K, the spectra were fitted with just an exponentialdecay term. The temperature dependence of one of the internalfields was fitted with
B(T ) = B(0)
[1 −
(T
TN
)α]β
. (3)
With β fixed at 0.5 for a mean-field magnet, values of B(0) =889(16) G, α = 4.7(4), and TN = 20.12(8) K were obtained(Fig. 4). A good fit with β = 0.5 means the observations areconsistent with that of a mean-field magnet. The large valueof α indicates complex interactions between the magneticmoments. It was also possible to fit the data with β = 0.367and 0.326 for a three-dimensional Heisenberg and Ising model,respectively.26 However, fits with both these values of β
gave values of TN < 20 K, and poor fits were obtained forTN > 20 K. Since the presence of long-range magnetic orderhas been observed at 20 K (Fig. 3), the data are incompatiblewith these models. The muon depolarization rate (λ) was foundto suddenly increase at TN1, indicating a transition betweenthe paramagnetic and the ordered states. However, λ doesnot show a significant anomaly at either TN2 or TN3 wherethere is a rearrangement of the spins and a change in themagnetic structure. The initial value of the asymmetry (Az)as a function of applied longitudinal field at 1.4 K is shown
FIG. 4. (Color online) (a) The muon depolarization rate as afunction of temperature. (b) The internal fields deduced from thefrequencies of the oscillations observed in zero-field μSR spectra.The solid curve is a fit of B1 to a mean-field model described in thetext.
in Fig. 5. This is the longitudinal component and has beennormalized such that Az = 1 corresponds to the muon beingfully decoupled from its local environment. A fit has beenmade using the expression described in Ref. 27. An internalfield of 1080(40) G was obtained, which is in approximateagreement with that deduced from the zero-field data, despitea change in magnetic structure between 13 and 1.4 K.
C. Single-crystal neutron diffraction
Single-crystal neutron-diffraction measurements were car-ried out in each of the three magnetically ordered phaseson the D10 diffractometer. Figure 6 shows elastic scansmade across (10l) at different temperatures. This reveals that,
FIG. 5. (Color online) The normalized longitudinal componentof the initial asymmetry (Az) as a function of an applied magneticfield at 1.4 K. The solid line shows a fit described in the text.
134416-4
NEUTRON SCATTERING AND MUON SPIN RELAXATION . . . PHYSICAL REVIEW B 88, 134416 (2013)
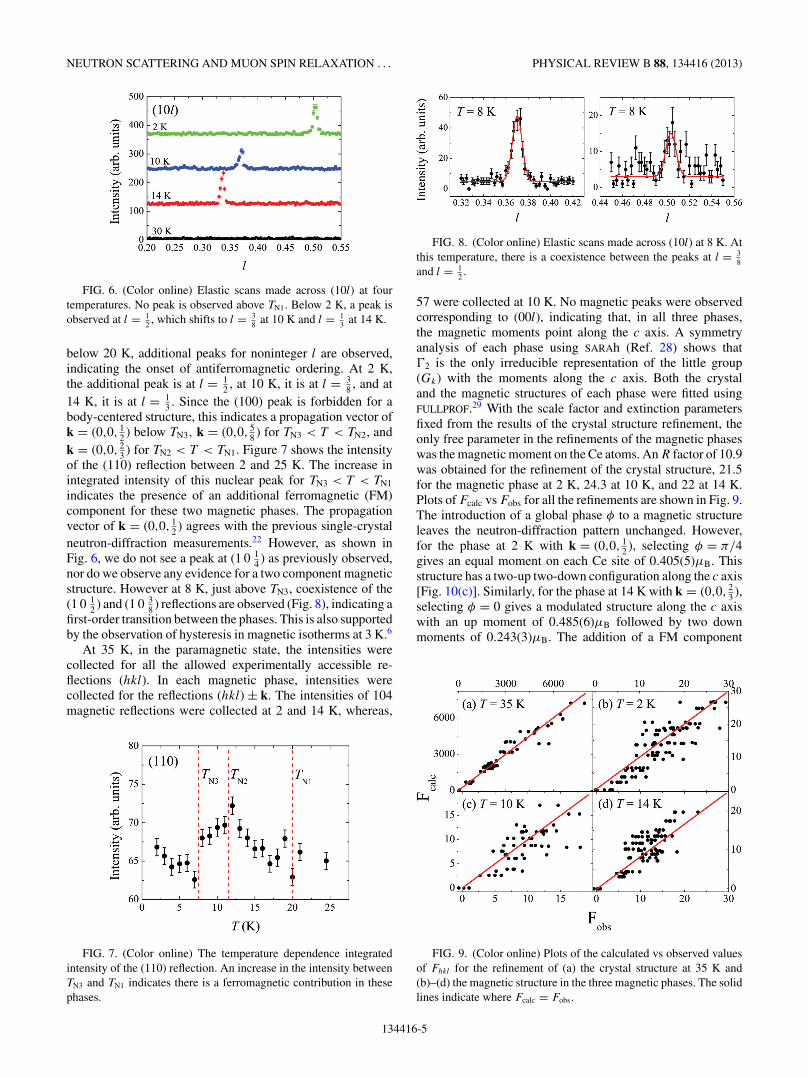
FIG. 6. (Color online) Elastic scans made across (10l) at fourtemperatures. No peak is observed above TN1. Below 2 K, a peak isobserved at l = 1
2 , which shifts to l = 38 at 10 K and l = 1
3 at 14 K.
below 20 K, additional peaks for noninteger l are observed,indicating the onset of antiferromagnetic ordering. At 2 K,the additional peak is at l = 1
2 , at 10 K, it is at l = 38 , and at
14 K, it is at l = 13 . Since the (100) peak is forbidden for a
body-centered structure, this indicates a propagation vector ofk = (0,0, 1
2 ) below TN3, k = (0,0, 58 ) for TN3 < T < TN2, and
k = (0,0, 23 ) for TN2 < T < TN1. Figure 7 shows the intensity
of the (110) reflection between 2 and 25 K. The increase inintegrated intensity of this nuclear peak for TN3 < T < TN1
indicates the presence of an additional ferromagnetic (FM)component for these two magnetic phases. The propagationvector of k = (0,0, 1
2 ) agrees with the previous single-crystalneutron-diffraction measurements.22 However, as shown inFig. 6, we do not see a peak at (1 0 1
4 ) as previously observed,nor do we observe any evidence for a two component magneticstructure. However at 8 K, just above TN3, coexistence of the(1 0 1
2 ) and (1 0 38 ) reflections are observed (Fig. 8), indicating a
first-order transition between the phases. This is also supportedby the observation of hysteresis in magnetic isotherms at 3 K.6
At 35 K, in the paramagnetic state, the intensities werecollected for all the allowed experimentally accessible re-flections (hkl). In each magnetic phase, intensities werecollected for the reflections (hkl) ± k. The intensities of 104magnetic reflections were collected at 2 and 14 K, whereas,
FIG. 7. (Color online) The temperature dependence integratedintensity of the (110) reflection. An increase in the intensity betweenTN3 and TN1 indicates there is a ferromagnetic contribution in thesephases.
FIG. 8. (Color online) Elastic scans made across (10l) at 8 K. Atthis temperature, there is a coexistence between the peaks at l = 3
8and l = 1
2 .
57 were collected at 10 K. No magnetic peaks were observedcorresponding to (00l), indicating that, in all three phases,the magnetic moments point along the c axis. A symmetryanalysis of each phase using SARAh (Ref. 28) shows that2 is the only irreducible representation of the little group(Gk) with the moments along the c axis. Both the crystaland the magnetic structures of each phase were fitted usingFULLPROF.29 With the scale factor and extinction parametersfixed from the results of the crystal structure refinement, theonly free parameter in the refinements of the magnetic phaseswas the magnetic moment on the Ce atoms. An R factor of 10.9was obtained for the refinement of the crystal structure, 21.5for the magnetic phase at 2 K, 24.3 at 10 K, and 22 at 14 K.Plots of Fcalc vs Fobs for all the refinements are shown in Fig. 9.The introduction of a global phase φ to a magnetic structureleaves the neutron-diffraction pattern unchanged. However,for the phase at 2 K with k = (0,0, 1
2 ), selecting φ = π/4gives an equal moment on each Ce site of 0.405(5)μB. Thisstructure has a two-up two-down configuration along the c axis[Fig. 10(c)]. Similarly, for the phase at 14 K with k = (0,0, 2
3 ),selecting φ = 0 gives a modulated structure along the c axiswith an up moment of 0.485(6)μB followed by two downmoments of 0.243(3)μB. The addition of a FM component
FIG. 9. (Color online) Plots of the calculated vs observed valuesof Fhkl for the refinement of (a) the crystal structure at 35 K and(b)–(d) the magnetic structure in the three magnetic phases. The solidlines indicate where Fcalc = Fobs.
134416-5
M. SMIDMAN et al. PHYSICAL REVIEW B 88, 134416 (2013)
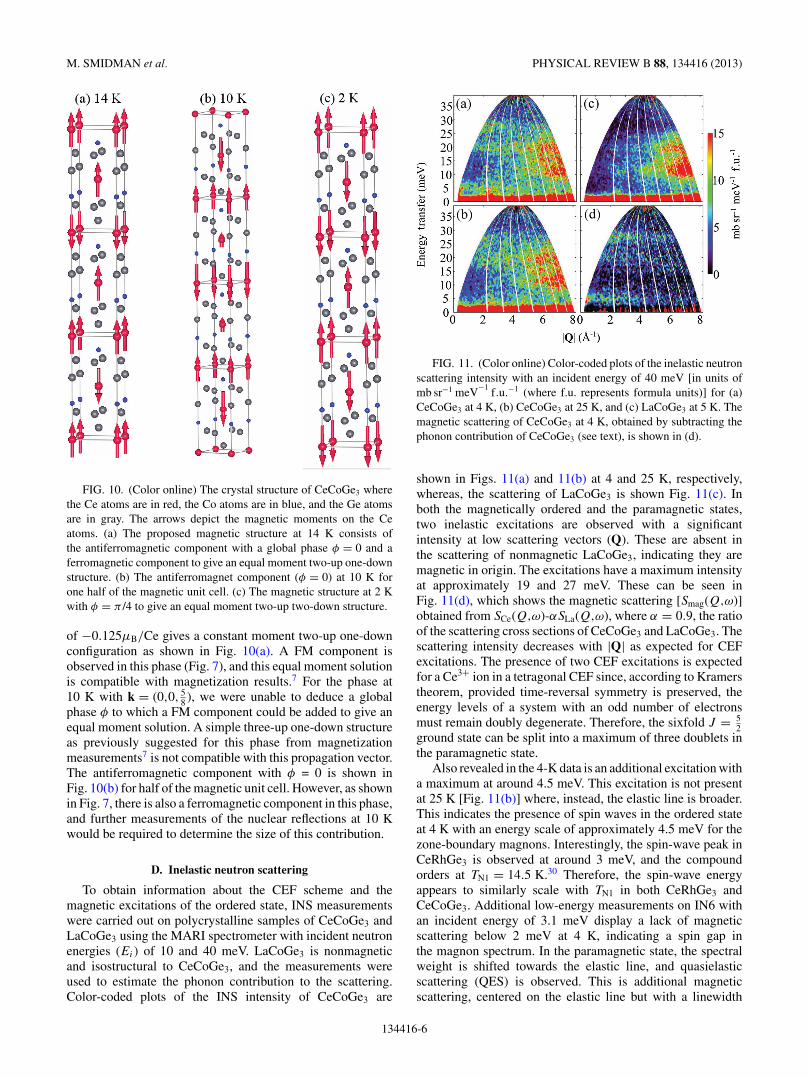
FIG. 10. (Color online) The crystal structure of CeCoGe3 wherethe Ce atoms are in red, the Co atoms are in blue, and the Ge atomsare in gray. The arrows depict the magnetic moments on the Ceatoms. (a) The proposed magnetic structure at 14 K consists ofthe antiferromagnetic component with a global phase φ = 0 and aferromagnetic component to give an equal moment two-up one-downstructure. (b) The antiferromagnet component (φ = 0) at 10 K forone half of the magnetic unit cell. (c) The magnetic structure at 2 Kwith φ = π /4 to give an equal moment two-up two-down structure.
of −0.125μB/Ce gives a constant moment two-up one-downconfiguration as shown in Fig. 10(a). A FM component isobserved in this phase (Fig. 7), and this equal moment solutionis compatible with magnetization results.7 For the phase at10 K with k = (0,0, 5
8 ), we were unable to deduce a globalphase φ to which a FM component could be added to give anequal moment solution. A simple three-up one-down structureas previously suggested for this phase from magnetizationmeasurements7 is not compatible with this propagation vector.The antiferromagnetic component with φ = 0 is shown inFig. 10(b) for half of the magnetic unit cell. However, as shownin Fig. 7, there is also a ferromagnetic component in this phase,and further measurements of the nuclear reflections at 10 Kwould be required to determine the size of this contribution.
D. Inelastic neutron scattering
To obtain information about the CEF scheme and themagnetic excitations of the ordered state, INS measurementswere carried out on polycrystalline samples of CeCoGe3 andLaCoGe3 using the MARI spectrometer with incident neutronenergies (Ei) of 10 and 40 meV. LaCoGe3 is nonmagneticand isostructural to CeCoGe3, and the measurements wereused to estimate the phonon contribution to the scattering.Color-coded plots of the INS intensity of CeCoGe3 are
FIG. 11. (Color online) Color-coded plots of the inelastic neutronscattering intensity with an incident energy of 40 meV [in units ofmb sr−1 meV−1 f.u.−1 (where f.u. represents formula units)] for (a)CeCoGe3 at 4 K, (b) CeCoGe3 at 25 K, and (c) LaCoGe3 at 5 K. Themagnetic scattering of CeCoGe3 at 4 K, obtained by subtracting thephonon contribution of CeCoGe3 (see text), is shown in (d).
shown in Figs. 11(a) and 11(b) at 4 and 25 K, respectively,whereas, the scattering of LaCoGe3 is shown Fig. 11(c). Inboth the magnetically ordered and the paramagnetic states,two inelastic excitations are observed with a significantintensity at low scattering vectors (Q). These are absent inthe scattering of nonmagnetic LaCoGe3, indicating they aremagnetic in origin. The excitations have a maximum intensityat approximately 19 and 27 meV. These can be seen inFig. 11(d), which shows the magnetic scattering [Smag(Q,ω)]obtained from SCe(Q,ω)-αSLa(Q,ω), where α = 0.9, the ratioof the scattering cross sections of CeCoGe3 and LaCoGe3. Thescattering intensity decreases with |Q| as expected for CEFexcitations. The presence of two CEF excitations is expectedfor a Ce3+ ion in a tetragonal CEF since, according to Kramerstheorem, provided time-reversal symmetry is preserved, theenergy levels of a system with an odd number of electronsmust remain doubly degenerate. Therefore, the sixfold J = 5
2ground state can be split into a maximum of three doublets inthe paramagnetic state.
Also revealed in the 4-K data is an additional excitation witha maximum at around 4.5 meV. This excitation is not presentat 25 K [Fig. 11(b)] where, instead, the elastic line is broader.This indicates the presence of spin waves in the ordered stateat 4 K with an energy scale of approximately 4.5 meV for thezone-boundary magnons. Interestingly, the spin-wave peak inCeRhGe3 is observed at around 3 meV, and the compoundorders at TN1 = 14.5 K.30 Therefore, the spin-wave energyappears to similarly scale with TN1 in both CeRhGe3 andCeCoGe3. Additional low-energy measurements on IN6 withan incident energy of 3.1 meV display a lack of magneticscattering below 2 meV at 4 K, indicating a spin gap inthe magnon spectrum. In the paramagnetic state, the spectralweight is shifted towards the elastic line, and quasielasticscattering (QES) is observed. This is additional magneticscattering, centered on the elastic line but with a linewidth
134416-6
NEUTRON SCATTERING AND MUON SPIN RELAXATION . . . PHYSICAL REVIEW B 88, 134416 (2013)
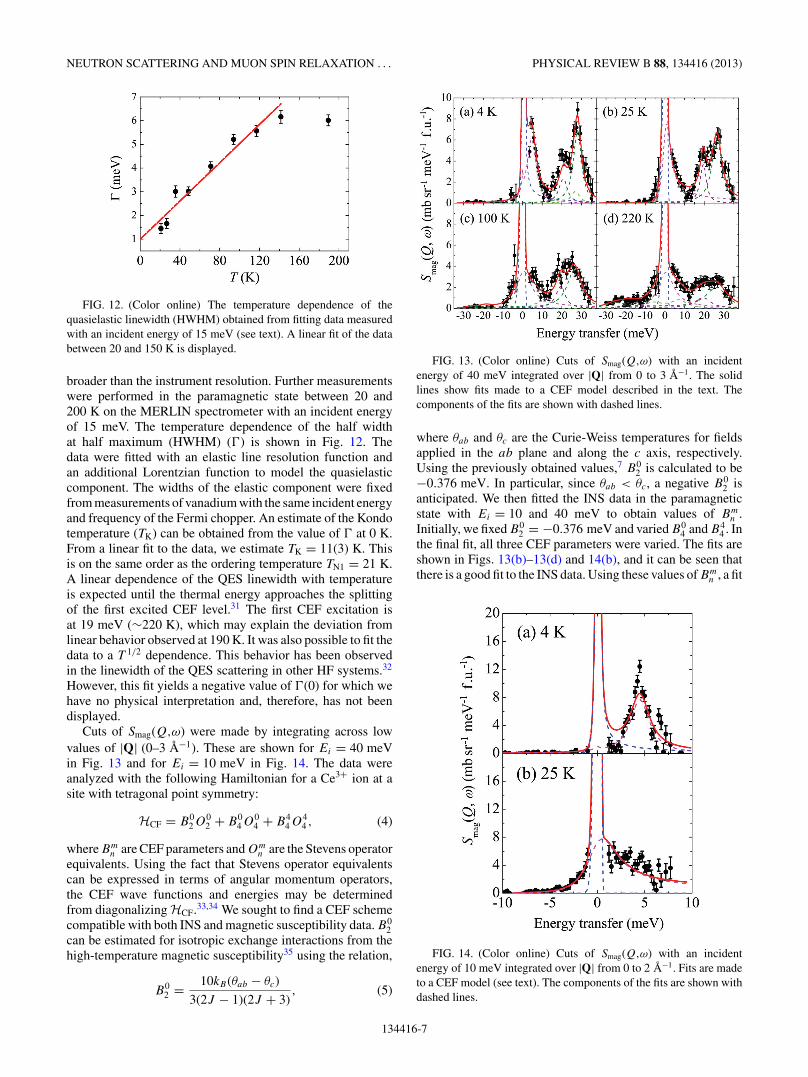
FIG. 12. (Color online) The temperature dependence of thequasielastic linewidth (HWHM) obtained from fitting data measuredwith an incident energy of 15 meV (see text). A linear fit of the databetween 20 and 150 K is displayed.
broader than the instrument resolution. Further measurementswere performed in the paramagnetic state between 20 and200 K on the MERLIN spectrometer with an incident energyof 15 meV. The temperature dependence of the half widthat half maximum (HWHM) () is shown in Fig. 12. Thedata were fitted with an elastic line resolution function andan additional Lorentzian function to model the quasielasticcomponent. The widths of the elastic component were fixedfrom measurements of vanadium with the same incident energyand frequency of the Fermi chopper. An estimate of the Kondotemperature (TK) can be obtained from the value of at 0 K.From a linear fit to the data, we estimate TK = 11(3) K. Thisis on the same order as the ordering temperature TN1 = 21 K.A linear dependence of the QES linewidth with temperatureis expected until the thermal energy approaches the splittingof the first excited CEF level.31 The first CEF excitation isat 19 meV (∼220 K), which may explain the deviation fromlinear behavior observed at 190 K. It was also possible to fit thedata to a T 1/2 dependence. This behavior has been observedin the linewidth of the QES scattering in other HF systems.32
However, this fit yields a negative value of (0) for which wehave no physical interpretation and, therefore, has not beendisplayed.
Cuts of Smag(Q,ω) were made by integrating across lowvalues of |Q| (0–3 A−1). These are shown for Ei = 40 meVin Fig. 13 and for Ei = 10 meV in Fig. 14. The data wereanalyzed with the following Hamiltonian for a Ce3+ ion at asite with tetragonal point symmetry:
HCF = B02O0
2 + B04O0
4 + B44O4
4 , (4)
where Bmn are CEF parameters and Om
n are the Stevens operatorequivalents. Using the fact that Stevens operator equivalentscan be expressed in terms of angular momentum operators,the CEF wave functions and energies may be determinedfrom diagonalizing HCF.33,34 We sought to find a CEF schemecompatible with both INS and magnetic susceptibility data. B0
2can be estimated for isotropic exchange interactions from thehigh-temperature magnetic susceptibility35 using the relation,
B02 = 10kB(θab − θc)
3(2J − 1)(2J + 3), (5)
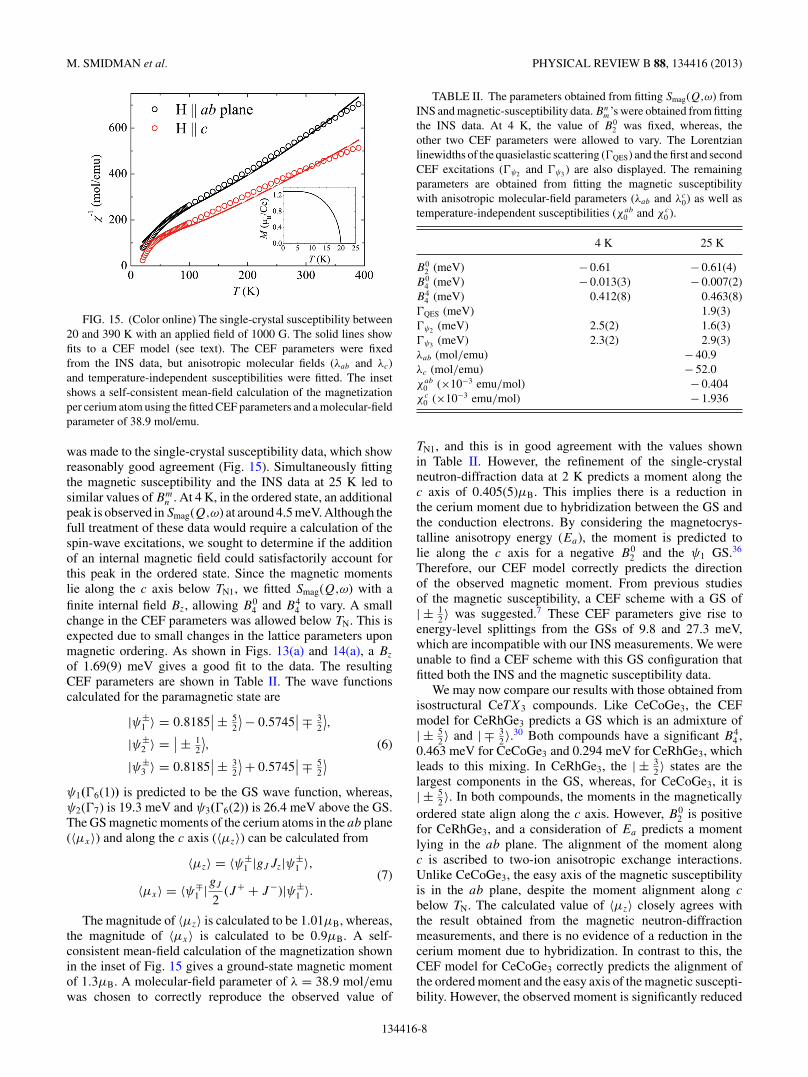
FIG. 13. (Color online) Cuts of Smag(Q,ω) with an incidentenergy of 40 meV integrated over |Q| from 0 to 3 A−1. The solidlines show fits made to a CEF model described in the text. Thecomponents of the fits are shown with dashed lines.
where θab and θc are the Curie-Weiss temperatures for fieldsapplied in the ab plane and along the c axis, respectively.Using the previously obtained values,7 B0
2 is calculated to be−0.376 meV. In particular, since θab < θc, a negative B0
2 isanticipated. We then fitted the INS data in the paramagneticstate with Ei = 10 and 40 meV to obtain values of Bm
n .Initially, we fixed B0
2 = −0.376 meV and varied B04 and B4
4 . Inthe final fit, all three CEF parameters were varied. The fits areshown in Figs. 13(b)–13(d) and 14(b), and it can be seen thatthere is a good fit to the INS data. Using these values of Bm
n , a fit
FIG. 14. (Color online) Cuts of Smag(Q,ω) with an incidentenergy of 10 meV integrated over |Q| from 0 to 2 A−1. Fits are madeto a CEF model (see text). The components of the fits are shown withdashed lines.
134416-7
M. SMIDMAN et al. PHYSICAL REVIEW B 88, 134416 (2013)
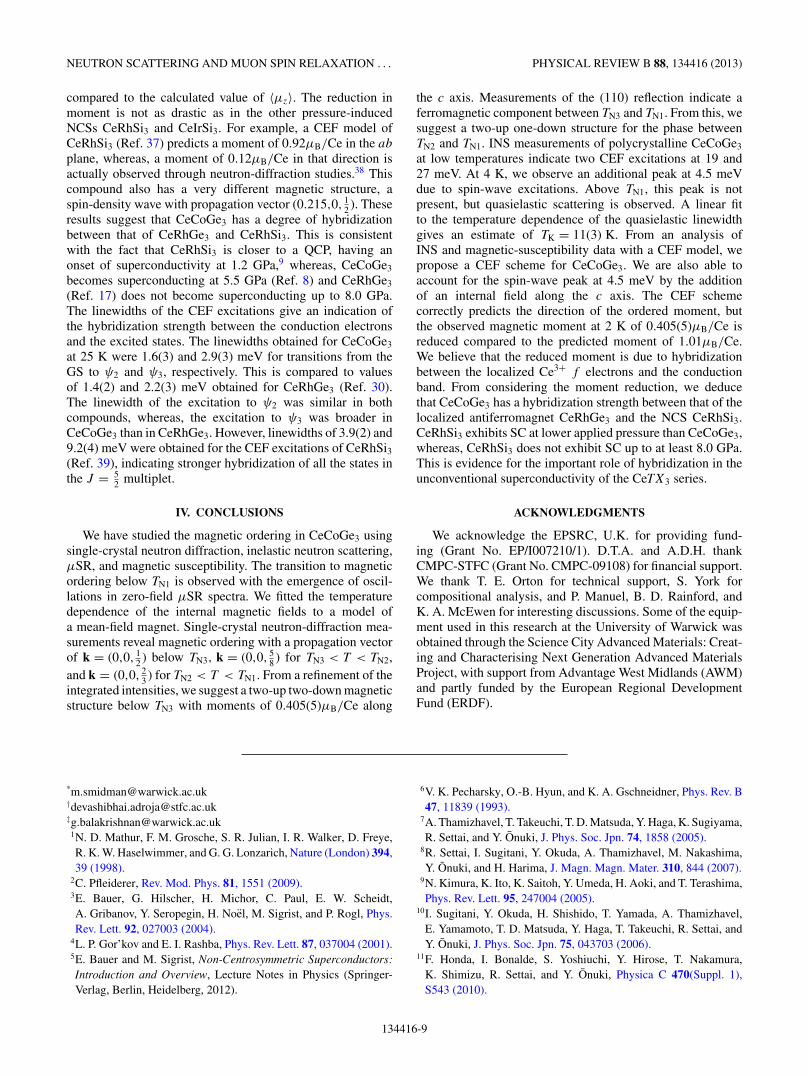
FIG. 15. (Color online) The single-crystal susceptibility between20 and 390 K with an applied field of 1000 G. The solid lines showfits to a CEF model (see text). The CEF parameters were fixedfrom the INS data, but anisotropic molecular fields (λab and λc)and temperature-independent susceptibilities were fitted. The insetshows a self-consistent mean-field calculation of the magnetizationper cerium atom using the fitted CEF parameters and a molecular-fieldparameter of 38.9 mol/emu.
was made to the single-crystal susceptibility data, which showreasonably good agreement (Fig. 15). Simultaneously fittingthe magnetic susceptibility and the INS data at 25 K led tosimilar values of Bm
n . At 4 K, in the ordered state, an additionalpeak is observed in Smag(Q,ω) at around 4.5 meV. Although thefull treatment of these data would require a calculation of thespin-wave excitations, we sought to determine if the additionof an internal magnetic field could satisfactorily account forthis peak in the ordered state. Since the magnetic momentslie along the c axis below TN1, we fitted Smag(Q,ω) with afinite internal field Bz, allowing B0
4 and B44 to vary. A small
change in the CEF parameters was allowed below TN. This isexpected due to small changes in the lattice parameters uponmagnetic ordering. As shown in Figs. 13(a) and 14(a), a Bz
of 1.69(9) meV gives a good fit to the data. The resultingCEF parameters are shown in Table II. The wave functionscalculated for the paramagnetic state are
|ψ±1 〉 = 0.8185
∣∣ ± 52
⟩ − 0.5745∣∣ ∓ 3
2
⟩,
|ψ±2 〉 = ∣∣ ± 1
2
⟩, (6)
|ψ±3 〉 = 0.8185
∣∣ ± 32
⟩ + 0.5745∣∣ ∓ 5
2
⟩ψ1(6(1)) is predicted to be the GS wave function, whereas,ψ2(7) is 19.3 meV and ψ3(6(2)) is 26.4 meV above the GS.The GS magnetic moments of the cerium atoms in the ab plane(〈μx〉) and along the c axis (〈μz〉) can be calculated from
〈μz〉 = 〈ψ±1 |gJ Jz|ψ±
1 〉,(7)
〈μx〉 = 〈ψ∓1 |gJ
2(J+ + J−)|ψ±
1 〉.
The magnitude of 〈μz〉 is calculated to be 1.01μB, whereas,the magnitude of 〈μx〉 is calculated to be 0.9μB. A self-consistent mean-field calculation of the magnetization shownin the inset of Fig. 15 gives a ground-state magnetic momentof 1.3μB. A molecular-field parameter of λ = 38.9 mol/emuwas chosen to correctly reproduce the observed value of
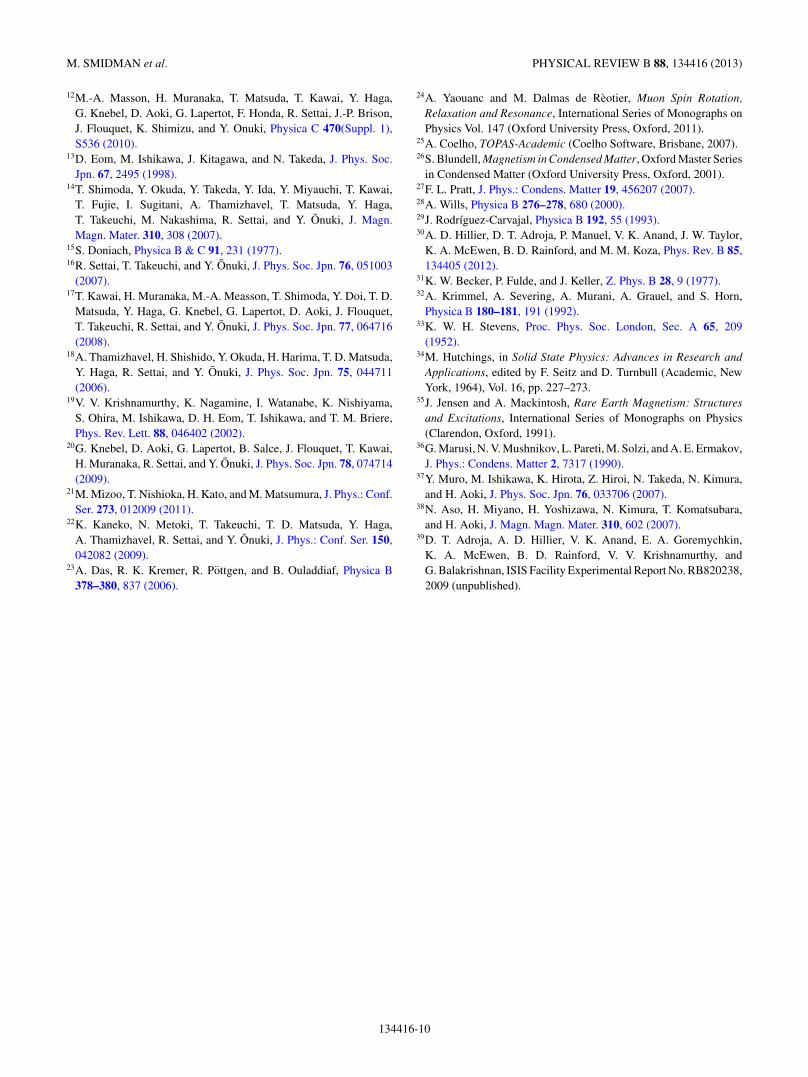
TABLE II. The parameters obtained from fitting Smag(Q,ω) fromINS and magnetic-susceptibility data. Bn
m’s were obtained from fittingthe INS data. At 4 K, the value of B0
2 was fixed, whereas, theother two CEF parameters were allowed to vary. The Lorentzianlinewidths of the quasielastic scattering (QES) and the first and secondCEF excitations (ψ2 and ψ3 ) are also displayed. The remainingparameters are obtained from fitting the magnetic susceptibilitywith anisotropic molecular-field parameters (λab and λc
0) as well astemperature-independent susceptibilities (χab
0 and χc0 ).
4 K 25 K
B02 (meV) − 0.61 − 0.61(4)
B04 (meV) − 0.013(3) − 0.007(2)
B44 (meV) 0.412(8) 0.463(8)
QES (meV) 1.9(3)ψ2 (meV) 2.5(2) 1.6(3)ψ3 (meV) 2.3(2) 2.9(3)λab (mol/emu) − 40.9λc (mol/emu) − 52.0χab
0 (×10−3 emu/mol) − 0.404χc
0 (×10−3 emu/mol) − 1.936
TN1, and this is in good agreement with the values shownin Table II. However, the refinement of the single-crystalneutron-diffraction data at 2 K predicts a moment along thec axis of 0.405(5)μB. This implies there is a reduction inthe cerium moment due to hybridization between the GS andthe conduction electrons. By considering the magnetocrys-talline anisotropy energy (Ea), the moment is predicted tolie along the c axis for a negative B0
2 and the ψ1 GS.36
Therefore, our CEF model correctly predicts the directionof the observed magnetic moment. From previous studiesof the magnetic susceptibility, a CEF scheme with a GS of| ± 1
2 〉 was suggested.7 These CEF parameters give rise toenergy-level splittings from the GSs of 9.8 and 27.3 meV,which are incompatible with our INS measurements. We wereunable to find a CEF scheme with this GS configuration thatfitted both the INS and the magnetic susceptibility data.
We may now compare our results with those obtained fromisostructural CeTX3 compounds. Like CeCoGe3, the CEFmodel for CeRhGe3 predicts a GS which is an admixture of| ± 5
2 〉 and | ∓ 32 〉.30 Both compounds have a significant B4
4 ,0.463 meV for CeCoGe3 and 0.294 meV for CeRhGe3, whichleads to this mixing. In CeRhGe3, the | ± 3
2 〉 states are thelargest components in the GS, whereas, for CeCoGe3, it is| ± 5
2 〉. In both compounds, the moments in the magneticallyordered state align along the c axis. However, B0
2 is positivefor CeRhGe3, and a consideration of Ea predicts a momentlying in the ab plane. The alignment of the moment alongc is ascribed to two-ion anisotropic exchange interactions.Unlike CeCoGe3, the easy axis of the magnetic susceptibilityis in the ab plane, despite the moment alignment along c
below TN. The calculated value of 〈μz〉 closely agrees withthe result obtained from the magnetic neutron-diffractionmeasurements, and there is no evidence of a reduction in thecerium moment due to hybridization. In contrast to this, theCEF model for CeCoGe3 correctly predicts the alignment ofthe ordered moment and the easy axis of the magnetic suscepti-bility. However, the observed moment is significantly reduced
134416-8
NEUTRON SCATTERING AND MUON SPIN RELAXATION . . . PHYSICAL REVIEW B 88, 134416 (2013)
compared to the calculated value of 〈μz〉. The reduction inmoment is not as drastic as in the other pressure-inducedNCSs CeRhSi3 and CeIrSi3. For example, a CEF model ofCeRhSi3 (Ref. 37) predicts a moment of 0.92μB/Ce in the ab
plane, whereas, a moment of 0.12μB/Ce in that direction isactually observed through neutron-diffraction studies.38 Thiscompound also has a very different magnetic structure, aspin-density wave with propagation vector (0.215,0, 1
2 ). Theseresults suggest that CeCoGe3 has a degree of hybridizationbetween that of CeRhGe3 and CeRhSi3. This is consistentwith the fact that CeRhSi3 is closer to a QCP, having anonset of superconductivity at 1.2 GPa,9 whereas, CeCoGe3
becomes superconducting at 5.5 GPa (Ref. 8) and CeRhGe3
(Ref. 17) does not become superconducting up to 8.0 GPa.The linewidths of the CEF excitations give an indication ofthe hybridization strength between the conduction electronsand the excited states. The linewidths obtained for CeCoGe3
at 25 K were 1.6(3) and 2.9(3) meV for transitions from theGS to ψ2 and ψ3, respectively. This is compared to valuesof 1.4(2) and 2.2(3) meV obtained for CeRhGe3 (Ref. 30).The linewidth of the excitation to ψ2 was similar in bothcompounds, whereas, the excitation to ψ3 was broader inCeCoGe3 than in CeRhGe3. However, linewidths of 3.9(2) and9.2(4) meV were obtained for the CEF excitations of CeRhSi3(Ref. 39), indicating stronger hybridization of all the states inthe J = 5
2 multiplet.
IV. CONCLUSIONS
We have studied the magnetic ordering in CeCoGe3 usingsingle-crystal neutron diffraction, inelastic neutron scattering,μSR, and magnetic susceptibility. The transition to magneticordering below TN1 is observed with the emergence of oscil-lations in zero-field μSR spectra. We fitted the temperaturedependence of the internal magnetic fields to a model ofa mean-field magnet. Single-crystal neutron-diffraction mea-surements reveal magnetic ordering with a propagation vectorof k = (0,0, 1
2 ) below TN3, k = (0,0, 58 ) for TN3 < T < TN2,
and k = (0,0, 23 ) for TN2 < T < TN1. From a refinement of the
integrated intensities, we suggest a two-up two-down magneticstructure below TN3 with moments of 0.405(5)μB/Ce along
the c axis. Measurements of the (110) reflection indicate aferromagnetic component between TN3 and TN1. From this, wesuggest a two-up one-down structure for the phase betweenTN2 and TN1. INS measurements of polycrystalline CeCoGe3
at low temperatures indicate two CEF excitations at 19 and27 meV. At 4 K, we observe an additional peak at 4.5 meVdue to spin-wave excitations. Above TN1, this peak is notpresent, but quasielastic scattering is observed. A linear fitto the temperature dependence of the quasielastic linewidthgives an estimate of TK = 11(3) K. From an analysis ofINS and magnetic-susceptibility data with a CEF model, wepropose a CEF scheme for CeCoGe3. We are also able toaccount for the spin-wave peak at 4.5 meV by the additionof an internal field along the c axis. The CEF schemecorrectly predicts the direction of the ordered moment, butthe observed magnetic moment at 2 K of 0.405(5)μB/Ce isreduced compared to the predicted moment of 1.01μB/Ce.We believe that the reduced moment is due to hybridizationbetween the localized Ce3+ f electrons and the conductionband. From considering the moment reduction, we deducethat CeCoGe3 has a hybridization strength between that of thelocalized antiferromagnet CeRhGe3 and the NCS CeRhSi3.CeRhSi3 exhibits SC at lower applied pressure than CeCoGe3,whereas, CeRhSi3 does not exhibit SC up to at least 8.0 GPa.This is evidence for the important role of hybridization in theunconventional superconductivity of the CeTX3 series.
ACKNOWLEDGMENTS
We acknowledge the EPSRC, U.K. for providing fund-ing (Grant No. EP/I007210/1). D.T.A. and A.D.H. thankCMPC-STFC (Grant No. CMPC-09108) for financial support.We thank T. E. Orton for technical support, S. York forcompositional analysis, and P. Manuel, B. D. Rainford, andK. A. McEwen for interesting discussions. Some of the equip-ment used in this research at the University of Warwick wasobtained through the Science City Advanced Materials: Creat-ing and Characterising Next Generation Advanced MaterialsProject, with support from Advantage West Midlands (AWM)and partly funded by the European Regional DevelopmentFund (ERDF).
*[email protected]†[email protected]‡[email protected]. D. Mathur, F. M. Grosche, S. R. Julian, I. R. Walker, D. Freye,R. K. W. Haselwimmer, and G. G. Lonzarich, Nature (London) 394,39 (1998).
2C. Pfleiderer, Rev. Mod. Phys. 81, 1551 (2009).3E. Bauer, G. Hilscher, H. Michor, C. Paul, E. W. Scheidt,A. Gribanov, Y. Seropegin, H. Noel, M. Sigrist, and P. Rogl, Phys.Rev. Lett. 92, 027003 (2004).
4L. P. Gor’kov and E. I. Rashba, Phys. Rev. Lett. 87, 037004 (2001).5E. Bauer and M. Sigrist, Non-Centrosymmetric Superconductors:Introduction and Overview, Lecture Notes in Physics (Springer-Verlag, Berlin, Heidelberg, 2012).
6V. K. Pecharsky, O.-B. Hyun, and K. A. Gschneidner, Phys. Rev. B47, 11839 (1993).
7A. Thamizhavel, T. Takeuchi, T. D. Matsuda, Y. Haga, K. Sugiyama,R. Settai, and Y. Onuki, J. Phys. Soc. Jpn. 74, 1858 (2005).
8R. Settai, I. Sugitani, Y. Okuda, A. Thamizhavel, M. Nakashima,Y. Onuki, and H. Harima, J. Magn. Magn. Mater. 310, 844 (2007).
9N. Kimura, K. Ito, K. Saitoh, Y. Umeda, H. Aoki, and T. Terashima,Phys. Rev. Lett. 95, 247004 (2005).
10I. Sugitani, Y. Okuda, H. Shishido, T. Yamada, A. Thamizhavel,E. Yamamoto, T. D. Matsuda, Y. Haga, T. Takeuchi, R. Settai, andY. Onuki, J. Phys. Soc. Jpn. 75, 043703 (2006).
11F. Honda, I. Bonalde, S. Yoshiuchi, Y. Hirose, T. Nakamura,K. Shimizu, R. Settai, and Y. Onuki, Physica C 470(Suppl. 1),S543 (2010).
134416-9
M. SMIDMAN et al. PHYSICAL REVIEW B 88, 134416 (2013)
12M.-A. Masson, H. Muranaka, T. Matsuda, T. Kawai, Y. Haga,G. Knebel, D. Aoki, G. Lapertot, F. Honda, R. Settai, J.-P. Brison,J. Flouquet, K. Shimizu, and Y. Onuki, Physica C 470(Suppl. 1),S536 (2010).
13D. Eom, M. Ishikawa, J. Kitagawa, and N. Takeda, J. Phys. Soc.Jpn. 67, 2495 (1998).
14T. Shimoda, Y. Okuda, Y. Takeda, Y. Ida, Y. Miyauchi, T. Kawai,T. Fujie, I. Sugitani, A. Thamizhavel, T. Matsuda, Y. Haga,T. Takeuchi, M. Nakashima, R. Settai, and Y. Onuki, J. Magn.Magn. Mater. 310, 308 (2007).
15S. Doniach, Physica B & C 91, 231 (1977).16R. Settai, T. Takeuchi, and Y. Onuki, J. Phys. Soc. Jpn. 76, 051003
(2007).17T. Kawai, H. Muranaka, M.-A. Measson, T. Shimoda, Y. Doi, T. D.
Matsuda, Y. Haga, G. Knebel, G. Lapertot, D. Aoki, J. Flouquet,T. Takeuchi, R. Settai, and Y. Onuki, J. Phys. Soc. Jpn. 77, 064716(2008).
18A. Thamizhavel, H. Shishido, Y. Okuda, H. Harima, T. D. Matsuda,Y. Haga, R. Settai, and Y. Onuki, J. Phys. Soc. Jpn. 75, 044711(2006).
19V. V. Krishnamurthy, K. Nagamine, I. Watanabe, K. Nishiyama,S. Ohira, M. Ishikawa, D. H. Eom, T. Ishikawa, and T. M. Briere,Phys. Rev. Lett. 88, 046402 (2002).
20G. Knebel, D. Aoki, G. Lapertot, B. Salce, J. Flouquet, T. Kawai,H. Muranaka, R. Settai, and Y. Onuki, J. Phys. Soc. Jpn. 78, 074714(2009).
21M. Mizoo, T. Nishioka, H. Kato, and M. Matsumura, J. Phys.: Conf.Ser. 273, 012009 (2011).
22K. Kaneko, N. Metoki, T. Takeuchi, T. D. Matsuda, Y. Haga,A. Thamizhavel, R. Settai, and Y. Onuki, J. Phys.: Conf. Ser. 150,042082 (2009).
23A. Das, R. K. Kremer, R. Pottgen, and B. Ouladdiaf, Physica B378–380, 837 (2006).
24A. Yaouanc and M. Dalmas de Reotier, Muon Spin Rotation,Relaxation and Resonance, International Series of Monographs onPhysics Vol. 147 (Oxford University Press, Oxford, 2011).
25A. Coelho, TOPAS-Academic (Coelho Software, Brisbane, 2007).26S. Blundell, Magnetism in Condensed Matter, Oxford Master Series
in Condensed Matter (Oxford University Press, Oxford, 2001).27F. L. Pratt, J. Phys.: Condens. Matter 19, 456207 (2007).28A. Wills, Physica B 276–278, 680 (2000).29J. Rodrıguez-Carvajal, Physica B 192, 55 (1993).30A. D. Hillier, D. T. Adroja, P. Manuel, V. K. Anand, J. W. Taylor,
K. A. McEwen, B. D. Rainford, and M. M. Koza, Phys. Rev. B 85,134405 (2012).
31K. W. Becker, P. Fulde, and J. Keller, Z. Phys. B 28, 9 (1977).32A. Krimmel, A. Severing, A. Murani, A. Grauel, and S. Horn,
Physica B 180–181, 191 (1992).33K. W. H. Stevens, Proc. Phys. Soc. London, Sec. A 65, 209
(1952).34M. Hutchings, in Solid State Physics: Advances in Research and
Applications, edited by F. Seitz and D. Turnbull (Academic, NewYork, 1964), Vol. 16, pp. 227–273.
35J. Jensen and A. Mackintosh, Rare Earth Magnetism: Structuresand Excitations, International Series of Monographs on Physics(Clarendon, Oxford, 1991).
36G. Marusi, N. V. Mushnikov, L. Pareti, M. Solzi, and A. E. Ermakov,J. Phys.: Condens. Matter 2, 7317 (1990).
37Y. Muro, M. Ishikawa, K. Hirota, Z. Hiroi, N. Takeda, N. Kimura,and H. Aoki, J. Phys. Soc. Jpn. 76, 033706 (2007).
38N. Aso, H. Miyano, H. Yoshizawa, N. Kimura, T. Komatsubara,and H. Aoki, J. Magn. Magn. Mater. 310, 602 (2007).
39D. T. Adroja, A. D. Hillier, V. K. Anand, E. A. Goremychkin,K. A. McEwen, B. D. Rainford, V. V. Krishnamurthy, andG. Balakrishnan, ISIS Facility Experimental Report No. RB820238,2009 (unpublished).
134416-10