Embed Size (px)
Citation preview

546
Nuclear Instruments and Methods in Physics Research A279 (1989) 546-554North-Holland, Amsterdam
NEUTRON SPECTROSCOPY IN THE 1-30 keV ENERGY RANGE
William H. MILLER333 Electrical Engineering Building, University of Missouri, Columbia, Missouri 65211, USA
Received 13 December 1988 and in revised form 6 March 1989
A spherical, hydrogen-filled, proton recoil neutron spectrometer (Benjamin detector) has been implemented for spectralmeasurements down to 1 keV in energy (with primary emphasis in the 1-30 keV range) . It is generally acknowledged that gas-filledproton recoil spectrometers are capable of detecting neutron spectra down to an energy of about 1 keV, but few data are availablewhich experimentally verify this claim. To confirm the capability of gas-filled proton recoil spectrometers to accurately measureneutron energies in this energy range, a system has been designed and tested . In the development of this system, careful attention hasbeen given to gamma-ray discrimination techniques, fill-gas and quench-gas partial pressure, detector high voltage, and noisereduction techniques to obtain accurate spectra. Experimental measurements have been made of neutron beams and scatteredneutron spectra in the 1-30 keV range to verify the accuracy of the detector system .
1. Introduction
The physical bases for proton recoil spectrometersand the features of neutron-proton scattering are wellknown [1] . This understanding has led to the develop-ment of two principal types of proton recoil spectrome-ters : hydrogen gas-filled spectrometers and liquidorganic scintillation spectrometers. Hydrogen gas-filled,proton recoil, neutron spectrometers have been used formany years for neutron measurements from 2 MeVdown to approximately 1 keV [2-15] . As such, theyhave complemented measurements made with liquidorganic scintillators which, in most cases, have a lowerenergy limit of approximately 0.8 MeV.
Gas-filled detectors are of two varieties: cylindrical(or Bennett) detectors [2-4] and spherical (or Benjamin)detectors [5]. These two systems differ primarily in theelectric field lines developed in the detector volume .However, the basic principles of operation are the same.Other systems are available to measure neutrons in thekeV energy range. 3He detectors [16] have been usedextensively and have a lower energy threshold of ap-proximately 30 keV. An NE110 detector has been devel-oped for detection in the 5 keV to 1 MeV energy range[17] . NE213 spectrometer results have been reporteddown to 30 keV [18] . Compared to these systems, thegas-filled proton spectrometer, with a lower energy de-tection limit of approximately 1 keV, represents thesystem capable of detecting the lowest possible neutronenergy .A series of research projects at the University of
Missouri Research Reactor have provided the motiva-tion for accurately measuring neutron spectrometrydown to 1 keV in energy. These measurements include :
0168-9002/89/$03 .50 O Elsevier Science Publishers B.V.(North-Holland Physics Publishing Division)
(1) the characterization of filtered beams from Sc (at 2keV), Fe (at 24 keV) and Al-S (a broad keV spectrum);(2) the detection of small amounts of hydrogen in steelby neutron scattering [19] ; (3) spectral measurements ofneutrons for personnel dosimetry purposes ; and (4)transmission measurements of keV neutrons throughsamples of boron carbide. Some measurements on thefiltered beams have been made [12,20]. However, refine-ments and improvements in the detection system arenecessary to make other measurements of interest .
2. System design
For the work reported here, a spherical proton recoildetector from LND [21] was used . The detector is 2.54cm (1 inch) in diameter and is typically filled to aspecified pressure of hydrogen or other fill gas. Thedetector used here is fitted with a gas filling valve sothat the gas composition and gas pressure can bechanged as necessary.
To operate at the lowest possible neutron energy, thedetector system must maximize gas multiplication andminimize electronic noise while discriminating againstgamma-ray induced events.
2.1 . Gamma-ray discrimination
The traditional means for discriminating againstgamma-ray induced events in hydrogen gas-filled, pro-ton recoil detectors is to vary the pressure of gas in thedetector . By lowering the gas pressure, the maximumgamma-ray induced, recoil electron energy which can be

left in the detector is decreased below the neutronenergy range of interest. For example, the stoppingpower of hydrogen at 4 atm of pressure is such that
electrons at 0 .5 MeV will deposit approximately 5-10keV of energy in a 5 cm detector, depending upon the
path of the electron during the slowing down process .However, as the energy of the electron decreases, thestopping power increases such that electron energies of50 keV or greater can be deposited in the detector .
There are also limits to lowering the pressure of thegas in the detector . First, the efficiency of the detectordecreases as the gas pressure decreases . Secondly, theefficiency of neutron detection decreases more rapidlythan that for gamma rays since the principal gamma-rayinteraction is with the walls of the detector. If electronicpulse shape discrimination is available to separate neu-tron from gamma-ray events, higher gas pressures canbe used, increasing the neutron detection efficiency .This, in turn, increases the signal (neutron) to noise(gamma-ray) ratio .
Bennett [2-4] developed a system for gamma-raydiscrimination. This system takes advantage of the dif-ferent specific ionization rates of neutron induced pro-tons and gamma-ray induced electrons . Low energyproton-recoil tracks have small spatial range . The result-ing ionization charge is collected on the anode of thedetector at essentially the same time, resulting in arelatively short pulse rise time . Gamma-ray inducedelectron tracks have a much longer range, typicallylarger than the dimensions of the detector, resulting in alonger pulse rise time . This scheme works until theenergy of both the proton and electron become so lowthat the range of both particles is small compared to thedetector dimensions and the resulting pulse rise timesare very similar . For typically sized detectors and gaspressures, this is around 1 keV . (Additionally, the en-ergy expended per ion pair for either protons or gammarays increases rapidly below about 1 keV whichterminates detector response .)
The gamma-ray discrimination circuit implementedin this work is shown in fig. 1 . It relies heavily onBennett's basic design. A commercially available Ortec109PC is used as the preamplifier, which has a suffi-ciently fast response time to provide the necessary risetime information for the discrimination circuit . Larsonpreamplifiers [22] are often used for this applicationsince they have the ability to recover rapidly from highenergy events that tend to saturate the amplifier cir-cuits, which require some time to again stabilize . Forthe count rates experienced in the work reported here(less than 2000 counts per second (cps)), this has notbeen a problem.
The signal is then split into two amplifier paths, oneusing "slow" time constants (on the order of 5 ws) andthe other using "fast" time constants (on the order of0.25 ws). Canberra 1413 or Ortec 450 research ampli-
W.H Miller / Neutron spectroscopy in the 1-30 keV energy range
Fig . 1 . Circuit diagram .
54 7
fiers are used . The slow side integrates the detectorpulse and provides energy information. The fast sideproduces a pulse that is related to the rise time of thedetector pulse . These two outputs are fed to two North-ern Scientific analog-to-digital convertors (ADCs) forconversion to digital form . A simple TTL logic circuit isused to sense coincidence between the two ADCs andproduce a "store" pulse for the computer . This circuitalso resets the two ADCs if one ADC senses a pulseand coincidence is not obtained .
The computer used in this system is an IBM-XTcompatible with a 24 digital line input/output port tosense the coincidence flag, store 8-bit data from the twoADCs and output a reset pulse to the ADCs . A 1 MHzclock board is also added to the computer to provide a"live" time clock function . The software is written incompiled BASIC which has proven adequate for countrates up to 2000 cps . A machine language routine toacquire the ADC data is being developed to increase thespeed of the system . Computer software has been writ-ten to generate a rise time parameter (fast ADC outputdivided by slow ADC output) versus energy (slow ADCoutput) and to store this data in matrix form. This issubsequently analyzed off-line with a Gaussian curvefitting and stripping routine.
Overall, this system has performed well in dis-criminating against gamma-ray induced pulses in thedetector, as will be discussed in section 3 . It usescommercially available components (with the exceptionof the coincidence circuit, which is composed of eightTTL chips) .
548
2.2. Detector fill-gas
Several different gas compositions and pressures wereanalyzed to obtain the best result in the 1-30 keVrange. A relatively high pressure (compared to the gaspressure typically used for low neutron energy measure-ments) of 4 atm of high purity hydrogen (99.999%) waschosen . (Approximately 1% of methane was added as aquenching agent due to the high gas multiplicationbeing used .) The 4 atm of hydrogen provide a reasona-ble efficiency (2%) for neutrons in a 2.54 cm radiusdetector . The higher pressure optimizes the neutron togamma-ray detection efficiency . A pressure higher than4 atm was not used for two reasons. First, the range oflow energy, gamma-ray induced electrons becomesshorter as the pressure is increased, making it difficultto discriminate between proton and electron recoils.Although precise range data is not available belowapproximately 10 keV, it appears that the range of 1keV electron becomes small compared to the size of thedetector at hydrogen gas pressures above 4 atm, limitingthe lower energy range of discrimination . Secondly,previous research with these detectors [14] has indicatedthat small amounts of gas impurities at pressures aboveapproximately 5 atm can cause nonlinear responses inthe detector . Instead of using very high gas purity andextremely clean gas-filling systems (with their associatedcost and complexity), a pressure of 4 atm was chosen .
2.3 . Detector high voltage
Since the objective is to detect low energy neutrons,the gas multiplication (and thus the high voltage) mustbe as large as possible . A Diethorn [23] plot of gasmultiplication versus high voltage was developed toensure that the detector was operating in a linear range.This test indicated that the detector could be operatedup to a voltage of 5000 V. Subsequent tests with mono-energetic neutron spectra indicated, however, that dis-tortions were occurring which caused the ionizationfrom different energy proton recoils to be collected in anonlinear fashion. These results (see section 3.3) indi-cate that a maximum voltage of 4500 V could be usedfor the detector filled to a pressure of 4 atm.
2 .4. Noise reduction
Low energy detection systems always require carefulattention to electronic noise reduction . As discussed insection 2.2, the first technique used to reduce noise is toprovide as much gas multiplication as possible . Therelatively high voltage required for maximum gas multi-plication created a problem with high voltage arcing .Although the Ortec 109PC preamplifier was rated at6000 V, spontaneous arcing across capacitors and otherelectronic components occurred . This was alleviated by
W.H. Miller / Neutron spectroscopy in the 1-30 keV energy range
placing the outside of the detector at a negative voltage,modifying the input coupling of the preamplifier toallow the connection of the anode of the detector di-rectly to the input of the first stage preamplifier fieldeffect transistor (FET), and carefully insulating theoutside of the detector from ground potential. Thepreamplifier was also mounted directly on the end ofthe detector to eliminate noise induced in transmittingthe signal from the detector to the preamplifier . Theresulting signal path is only 3 cm in length from detec-tor output to FET input. Using these noise eliminationtechniques, low neutron energy detection is limited bythe ability to discriminate between the track lengths oflow energy protons and electrons, not by electronicnoise.
3. Experimental measurements
A series of experimental measurements were per-formed to test the spectral accuracy of the system usingquasimonoenergetic beams produced by filtered neu-tron beams at the University of Missouri ResearchReactor [12] . The results are discussed below.
3 .1 . Pulse discrimination tests
A series of experiments were performed to analyzethe capabilities of the gamma-ray discrimination sys-tem. Fig. 2 shows four rise time distributions at protonrecoil energies corresponding to 1, 3, 10 and 200 keV.Starting with the data for 10 keV (fig. 2c), the data showa typical rise time distribution caused by both neutronsand gamma-ray induced events . The well-resolved peakon the right side of the graph corresponds to the rapidrise time of the short range (0 .02 cm) proton events.Corresponding gamma-ray induced events have pathlengths greater than the 5.0 cm diameter of the detector,resulting in much longer pulse rise times and appear asa broad peak on the left side of the graph. At thisneutron energy (and for this particular measurement),gamma-ray contamination of the proton recoil spectrumis not large, but would result in a 25% discrepancy inthe number of protons recorded if gamma-ray dis-crimination were not included .
At the highest proton energy (fig . 2d ; 200 keV),essentially no gamma rays are present in the spectrumand the peak is due only to neutron induced protonrecoils . The peak has become skewed toward longer risetimes since the range of the protons is now 0.2 cm,leaving a significantly long track in the detector .
At 3 keV the rise time distributions (fig . 2b) forgamma rays and neutrons are beginning to overlap.Although the range of the protons is very short, theresulting rise time distributions for protons is not aswell resolved due to electronic noise. Accurate dis-

1 keV
W.H. Miller / Neutron spectroscopy in the 1-30 keV energy range
Decreasing Rise Time Decreasing Rise Time
200 keV
3 keV
Decreasing Rise Time
Decreasing Rise Time
crimination between the two events is still possible byusing a Gaussian fitting and stripping routine. A tech-nique developed by Seck [24] for an NE213 liquidscintillation system was modified to analyze these spec-tra. The procedure alternatively fits the gamma-rayinduced peak and the neutron induced peak, subtract-ing each from the initial rise time spectrum . Iteration iscontinued until convergence is realized. The smoothcurves shown on the graphs are the result of this routine .The number of proton recoils in the spectrum at thisenergy is taken as the area under that portion of thecurve .
Data at 1 keV are shown in fig. l a . Two distinctpeaks are shown, although the gamma-ray induced peakis very small . At this energy, the range of both electronsand protons is small compared to the size of the detec-tor and discrimination becomes more difficult. How-ever, the two peaks are distinct . As the range of theelectrons starts to approach the range of the protons (incomparison to the size of the detector), the proton rise
Fig. 2 . Pulse rise time spectra for proton recoil energies corresponding to 1, 3, 10 and 200 keV .
54 9
time peak would tend to be broadened and skew towardthe left . The fact that there are still two distinct peaksindicates that discrimination is still possible, and thesmall number of electron recoils noted is an indicationthat there is a low probability of leaving 1 keV of theelectron's energy in the detector volume .
3 .2 . Effect of gamma-ray discrimination on iron filteredspectra
As an initial test of the gamma-ray discriminationcircuit, neutron spectra were measured for an ironfiltered beam containing 50.8 cm of iron, 20.3 cm ofaluminum and 5.0 cm of sulfur. This filter has a windowin the iron cross section that produces a quasi-monoen-ergetic beam at 24 keV [12] . This beam has been shownto have a relatively low gamma-ray component of about104 gamma-rays/cm2s compared to a neutron flux of107 neutrons/cm2 s . Fig . 3 shows the measurement ofthis beam without gamma-ray discrimination and fig. 4

55 0
\_EcU oç
Z
WZ
4
shows data with gamma-ray discrimination . The contri-bution of gamma-ray induced events to the spectrumbelow approximately 10 keV is evident.
The results shown in figs . 3 and 4 were obtainedusing the SPEC4 unfolding code [25,26) . This code,
v
EU
E cU OÇX
V_Z
FWZ
3 -
W.H. Miller / Neutron spectroscopy in the I -30keV energy range
20
ENERGY :keV
Fig. 3 . Iron beam without gamma-ray discrimination.
-1 +_
-
T,
0
4
8
12
0 - 4500V
ä
Fig . 4 . Tests of detector high voltage.
written by Benjamin et al ., is particularly adapted to theanalysis of neutron spectra measured with sphericalproton recoil spectrometers. It has been modified slightlyand implemented on an IBM-XT compatible computerfor this analysis .
ENERGY (keV)" - 4700V
-
-
as - 5000V

3.3. Detector high voltage tests
The effect of the high voltage on the iron filteredbeam spectra gives an empirical test for spectral dis-tortions due to nonlinear gas multiplication, most likelycaused by space charge effects . The iron filtered beamwas measured at detector high voltages from 4000 to5000 V. The amplifier gain was varied as the highvoltage was changed to produce the same total gain forthe system . Spectra at 4500, 4700 and 5000 V are shownin fig . 4. In all cases, the peak in the spectrum at 24 keVis evident. The energy resolution of the peak tends toimprove as the high voltage is increased, as would beexpected . The spectrum at energies below the peak,however, tends to become negative as the high voltageincreases, also resulting in an increase in the flux at 24keV. It is apparent that the ionization produced byprotons is being multiplied in a nonlinear fashion at thehigher voltages . For detector high voltages below 4500V, this trend was no longer evident. Based upon thistest, an operating voltage of 4500 V was selected for thedetector containing 4 atm of pressure .
3.4. Scattered neutron spectra
In preparation for measuring hydrogen content insteels by neutron scattering [18], samples of hydrogen,pure iron and mixtures of hydrogen and iron have beenfabricated. These samples are placed in the iron filteredneutron beam, and the spectra scattered at various
Uda
U i,\"aEcu M\ 0Ç OXH
V.
rwz
2 .-
1.9
1 .8
1 .7
1.6
1 .5 -'
1 .4 -~
1 .3
1.2
L1 -
0 .9
0 .8
0 .7
0 .6 JI0 .5 -
40 .4 -
0 .3
0.2
0 .1 JI0 4-
W.H. Miller / Neutron spectroscopy in the 1- 30 keV energy range
12
16
ENERGY (kaV)
Fig. 5 . Hydrogen scattered at 60 ° .
551
angles have been analyzed. In the experiment reportedhere, a 0.02 cm (0.008 in .) thick sheet of polyethylenewas placed in the beam and the detector was placed at a60 ° angle to the beam line at a distance of approxi-mately 20 cm; the resulting scattering neutron flux wasmeasured and analyzed.
Fig. 5 shows the results for this measurement. Thepeak at 7 keV corresponds to the energy of neutronsscattered from hydrogen at an angle of 60 °. A smallincrease in the flux at 24 keV shows the presence of abackground of 24 keV neutrons from the beam. Theincrease in the flux below 2 keV is also due to neutronbackground.
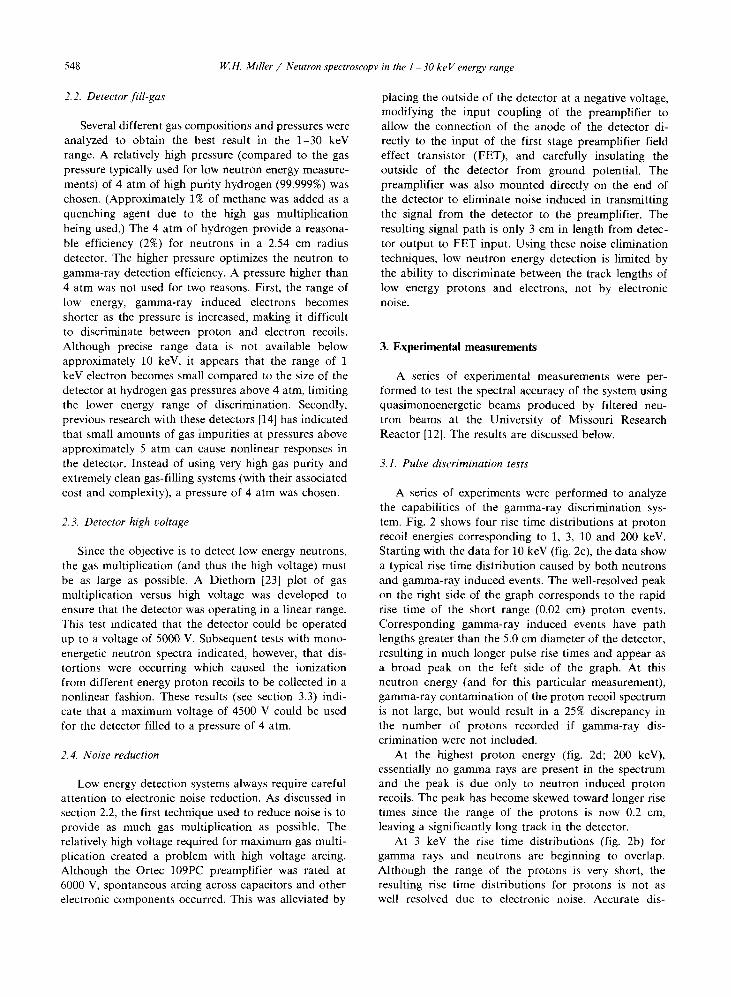
3.5. Scandium filtered beam spectra
Measurements of a scandium filtered beam (contain-ing 80 cm of Sc, 4.8 cm of Co and 2.9 cm of 6°Ni) havealso been made . Scandium, similar to iron, has a windowin the cross section at 2 keV, which provides an excel-lent test of the lower energy range ability of this detec-tor system . The results are shown in fig . 6, with theexpected peak at 2 keV.
The energy resolution for both this peak and the ironfiltered monoenergetic peak at 24 keV is relatively large,being 85% and 40% respectively . Bennett [2] has calcu-lated the intrinsic statistical uncertainty associated withthe initial production of ion pairs in a detector of thistype . These are 65% and 15% respectively. Thus, thereappears to be an additional energy resolution uncer-
552
W .N N
CU W\ 7CL
900
800
700 -
600
500 ~I
Z cz M
O ôUF
200 ,
100 -
tainty associated with imperfections in the detector,electronic noise in the preamplifier and the spectrumunfolding process.
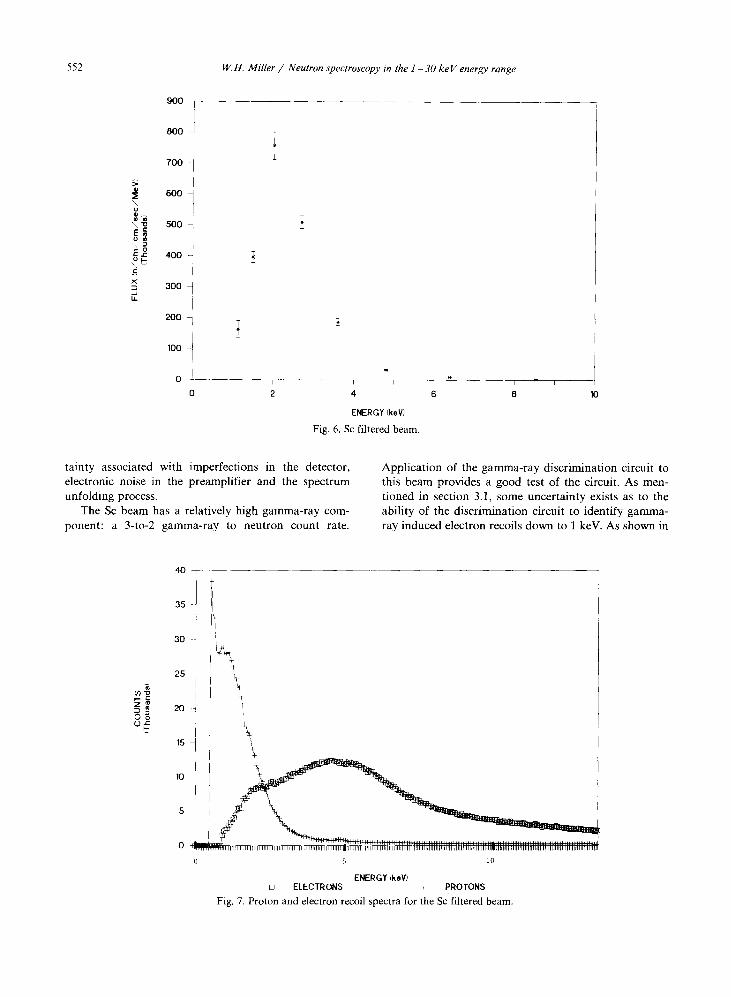
The Sc beam has a relatively high gamma-ray com-ponent : a 3-to-2 gamma-ray to neutron count rate .
W.H. Miller / Neutron spectroscopy in the 1-30 keV energy range
2 4
ENERGY (keV)
Fig. 6 . Sc filtered beam .
ENERGY (keV)ELECTRONS
+ PROTONS
10
uFig. 7 . Proton and electron recoil spectra for the Sc filtered beam .
Application of the gamma-ray discrimination circuit tothis beam provides a good test of the circuit . As men-tioned in section 3.1, some uncertainty exists as to theability of the discrimination circuit to identify gamma-ray induced electron recoils down to 1 keV. As shown in

fig. 2, the gamma-ray contribution at 1 keV appears tobe quite small . Fig. 7 shows both the electron recoilspectrum and the proton recoil spectrum for thescandium filter measurements .
The electron recoil spectrum in fig. 7 peaks at 5 keV,corresponding to the amount of energy lost by electronsin the 0.5-2.0 MeV range crossing about 5 cm ofhydrogen at 4 atm of pressure. Electrons in this energyrange emerge from the wall of the detector into the gasvolume as a result of gamma-ray interactions in thewalls . Electrons in the spectrum above approximately 5keV are due to two possible effects. First, electronsslowing down in the detector can be scattered such thattheir slowing down path length is larger than 5 cm,resulting in greater energy loss . Secondly, electronsliberated in the wall may lose much of their energy inthe wall and enter the gas at an energy less than theirinitial energy . At low energies (up to approximately 40keV), all of the energy of the electron will typically bestopped in the detector volume which causes the longtail in fig . 7 . Above this energy, the energy lost by theelectron becomes less as the stopping power decreaseswith increasing electron energy.
There are also two mechanisms by which electronscan deposit less than 5 keV in the detector volume .Electrons which emerge from the wall with less than 5keV of their initial energy left will also deposit thisamount of energy in the detector . However, the chanceof an electron emerging from the wall at this energy isrelatively small. The more likely effect is the path lengthof high energy electrons traversing cord lengths lessthan the diameter of the detector . For example, ap-proximately 40% of the cord lengths across a 5 cmdetector are between 4 and 5 cm (corresponding to 4-5keV of energy loss for this detector) . Another 30% liebetween 3 and 4 cm (3-4 keV) . Only about 5% lie below1 cm . This correlates with the shape of the electronenergy spectrum in fig . 7, and explains why few elec-trons are detected in the 1 keV energy range . Thus thediscrimination circuit appears to be accurately separat-ing neutron and gamma-ray induced events in thisenergy range and the curve in fig. 7 is an accuraterepresentation of the energy deposited in the gas of thedetector by electrons produced by gamma-ray interac-tions in the walls of the detector.
The resulting spectrum in fig . 6 is at a maximum at 2keV and decreases below 2 keV, which also indicatesthat there is no gamma-ray contamination of the neu-tron spectrum at lower energies. This spectrum confirmsthat accurate results can be obtained down to an energyof 1 keV .
4 . Conclusions
A spherical, hydrogen gas-filled, proton recoil detec-tor and associated spectrometer system was designed
W.H. Miller / Neutron spectroscopy in the 1-30 keV energy range 553
and tested with special emphasis on verifying accurateneutron energy measurements down to 1 keV . Aftercarefully optimizing the detector with respect to fill-gasand gas pressure, detector high voltage, noise reductionand gamma-ray discrimination, the system was testedwith a series of experimental measurements . Spectrarepresenting neutron energies at 24, 7 and 2 keV havebeen accurately measured . It is evident that gamma-raydiscrimination capabilities become limited at about 1keV . Lowering the pressure of the gas (at the expense ofoverall detector efficiency) could possibly increasegamma-ray discrimination capabilities to slightly lowerenergies . However, 1 keV is also the physical lower limitof detector usefulness since the amount of energy re-quired to produce an ion pair increases rapidly at thisenergy.
The system uses commercially available componentsand is relatively simple to fabricate . Addition of aLarson-type preamplifier and data acquisition softwareprogrammed in machine language could be used toincrease the data acquisition rate above the presentlimit of about 2000 counts per second .
These experiments have demonstrated, using knownenergy spectra, that accurate neutron spectroscopy ispossible in the 1-30 keV energy range using a hydrogengas-filled proton recoil detector .
Acknowledgements
Support for this work has been provided by the USArmy Research Office, Material Science Division, Dr .Robert Reeber, Contracting Officer's Representative,through a subcontract from Syracuse University. Dr.Walter Meyer, Director of the Institute for EnergyResearch, College of Engineering, Syracuse University,is Co-Principal Investigator for this grant, and his assis-tance is acknowledged .
References
[1] G.C . Hanna et al ., Phys . Rev. 75 (1949) 985 .[2] E .F . Bennett, Nucl . Instr . and Meth . 27 (1967) 16.[3] E.F. Bennett et al., ANI-7394 (1968).[4] E .F . Bennett and T.J . Yule, ANL-7763 (1971) .[51 P.W. Benjamin et al., Nucl. Instr. and Meth. 52 (1968) 59 .[6] S. Azad et al ., IAEA-SM-185/40 .[7] C.O . Slater, ORNL-5551 (1979) .[8] D.R . Slaughter et al ., UCRL-52415 (1978) .[91 V.V. Verbinski et al., Nucl . Sci. Eng . 52 (1973) 330.
[10] M . Jermann, EIR-310 (1977) p . 72 .[111 C.M. Estes, Master's Thesis, Kansas State University
(1971) .[121 F.Y. Tsang and R.M. Brugger, Nucl . Instr . and Meth . 134
(1976)441 .[13] Y . Fujita et al., J . Nucl. Sci . Tech . 20 (1983) 983 .

554 W.H. Miller l Neutron spectroscopy in the 1-30 keV energy range
[14] M. Taeb, Ph.D. Dissertation, University of Missouri-Col-umbia (1985) .
[15] I. Urabe, Proc . on Measurements of Neutron EnergySpectra Using Recoil Proton Proportional Counters,
[20] H. Aminfar, Nucl. Instr . and Meth . 188 (1981) 597.[21] Series #270 Spherical Detectors, LND Inc., Oceanside,
New York, USA.[22] J.M . Larson and J.E . Powell, Nucl. Instr. and Meth. 71
KURRI-TR-273 (1986) . (1969) 157.[16] G. Knoll, Radiation Detection and Measurement (Wiley, [23] W. Diethorn, NYO-6628 (1956).
New York, 1979). [24] R. Seck, Master's Thesis, Kansas State University (1971) .[17] N.W. Hill et al., IEEE Trans. Nucl . Sci. NS-32 (1975) 367. [25] P.W . Benjamin et al ., AWRE-09/68 .[18] A. Chalupka, Nucl. Instr. and Meth . 150 (1978) 209. [261 J.O . Johnson and D.T . Ingersoll, ORNL/TM-7384 (1980) .[19] W. Meyer and W.H . Miller, in preparation .


![arXiv:0803.4170v1 [physics.ins-det] 28 Mar 2008 · neutron spin echo techniques, a large fraction of slow neutron scattering spec-trometers of interest for neutron spectroscopy can](https://img.pdfslide.net/doc/110x75/6001651b431a684e12181272/arxiv08034170v1-28-mar-2008-neutron-spin-echo-techniques-a-large-fraction.jpg)