Embed Size (px)
Citation preview
Nevada County Population Projections 2017 to 2036
Final Draft As October 1 for Main Report Appendices to Follow
Prepared By: Jeff Hardcastle, AICP Nevada State Demographer Nevada Department of Taxation Reno Office: 4600 Kietzke Lane, Building L Suite 235 Reno, NV 89502 (Direct) (775) 687-9961 (Phone) (775) 687-9999 (Fax) (775) 688-1303 [email protected]
http://tax.nv.gov/Publications/Population_Statistics_and_Reports/ www.nvdemography.org Carson Office: 1550 College Parkway, Suite115 Carson City, NV 89706 (Phone) (775) 684-2000 (Fax) (775) 684-2020
October 1, 2017

Introduction to the 2017 Population Projections The full projections by year and county are at the end of this document. Unlike previous reports, the projections are summarized below instead of at the end. There is additional background information presented after that section that may help in reviewing the projections and considering where Nevada is at on a number of topics. There is also a brief discussion of risks to the projections. A baseline projection is presented as well as a projection that includes the Tesla Gigafactory project in keeping with the 2014 projections through this current edition. The projection with the Gigafactory will still be used as the control total for the age, sex, race, and Hispanic origin estimates and projections. Supplemental tables will again be provided in the appendices from the REMI model including projections for the population from the age of 5 to 19 in the final report when posted to the Department of Taxation’s website. These tables are provided to aid local governments and economic development officials. Results are reported for a baseline forecast, that is, without including Tesla, for the five counties likely to see the greatest impact and information is also presented to show what the additional impact of Tesla may be on those counties. The supplemental tables should not be considered definitive estimates or projections. For instance, the Department of Employment Training and Rehabilitation produces employment projections and this office also produces the Age, Sex, Race, and Hispanic Origin (ASRHO) Estimates and Projections as a separate set of projections The 2017 Projections: The Regional Economics Models, Inc. (REMI) model was used for these projections. The REMI model provides information for all 17 counties by 23 major economic sectors. The REMI model looks at the interaction between the economic and demographic characteristics of a county. It looks at the dynamic economic and demographic relationships between the 17 counties and the United States as a total. The 20 year projections are produced annually and will change as historic data becomes available or is revised and information about future developments becomes available. Because REMI looks at the relationship between changes in the economy and in population, it is a useful tool for looking at how changes in the structure of the population or the economy can impact each other. The 2017 Projections were prepared using the REMI PI+ 2.1 model, which has 2015 as the last year of historic data in it. The 2016 Projections were produced with the REMI PI+ 1.7 model with history through 2014. Two projections were prepared for this year’s projections. One is the baseline forecast. The other included the Tesla project and its impacts. This project was first modeled in 2014 with information from the Governor’s Office of Economic Development. There is still interest in understanding the direct and indirect impact of this project. Modeling it separately from the baseline forecast allows for understanding these impacts. It will become part of the baseline forecast as it progresses and the development becomes part of the economic history in the model. Changes to the out-of-the-box model (the model as shipped with no additional information from the user) included the additional years of history for 2014 and 2015 as well as any revisions to the data for the earlier years. Both the Census Bureau and the Bureau of Economic Analysis revise their data given new information. They also revise it after reviewing their data and correcting or updating methods. The biggest revision was by the Bureau of Economic Analysis where they corrected geocoding issues and reallocated employment by county.1 For the baseline forecast the following alterations were made to the out-of-the-box REMI model.
1.) The first one was to update the employment for the national projection. This was done by applying the growth rates from the Bureau of Labor Statistics’ (BLS) Current Employment Series (CES) to the Bureau of Economic Analysis data from 2015 to estimate it for 2016 and 2017. The growth of the health care sector was reviewed and there was not a need for adjusting that compared to previous years.
2.) For Clark and Washoe Counties, the county employment was updated for 2015 to 2017 with the CES data. For the other counties, employment was only updated through 2016 using the BLS’s Quarterly Census of Employment and Wages data because of data availability.
3.) Hotel employment for Clark County was based on existing hotels and proposed projects as reported by the Las Vegas Convention and Visitors Authority.
4.) The mining sector no longer loses employment in the out-of-the-box model. So previous changes to constrain those loses to historic averages were no longer used. The model has two years of history and uses data history since 2001 instead of from 1990, which may account for more robust mining forecasts than earlier versions of the model.
5.) In the past, as growth has occurred in the Tahoe Regional Industrial Center in Storey County, it was assumed that those jobs would be filled by commuters from Lyon and Washoe Counties.
6.) Announced manufacturing projects were included for Douglas and Lyon Counties.
1
For the projection that includes Tesla, the following assumptions were made: 1.) The recent history in the 2.1 model, as well as the information from the employment update, has increased the
model’s response to manufacturing employment for Northwestern Nevada. Tesla continues to meet overall objectives as set forth in 2014. Employment has not fully matched their original proposal and current reports are that the facility is at 28% of its original proposed employment for 2016 with construction continuing to expand the site. Employment was annualized to reach full capacity by 2024 of their original contracted amount of 6,500 employees.
2.) With the 2016 projections, the assumption was made that there would be housing and commercial development proposed in Storey County that could house some of the employees. At that time, it was assumed that the project would build out at 3,500 units over the next 20 years. At this time, it is not known when and to what extent housing might be developed in that area of Storey County.
3.) Faraday Future, which was to be developed in Clark County, is no longer moving forward and has ended their status as a qualified project.
4.) Housing prices were reviewed for Clark and Washoe Counties for how they compare to the U.S. (Zillow.com Market Overviews). The baseline forecast has a 2017 relative housing price for Clark County of 0.81 and Washoe County of 1.01 of the national housing price. The estimate that was derived using Zillow indicates that the relative housing prices might be 1.00 for Clark County, almost equal to national prices, and 1.37 for Washoe County. The housing and land price variable was adjusted for 2017 and 2018 to reflect these relative price levels as a one-time shock to the two counties.
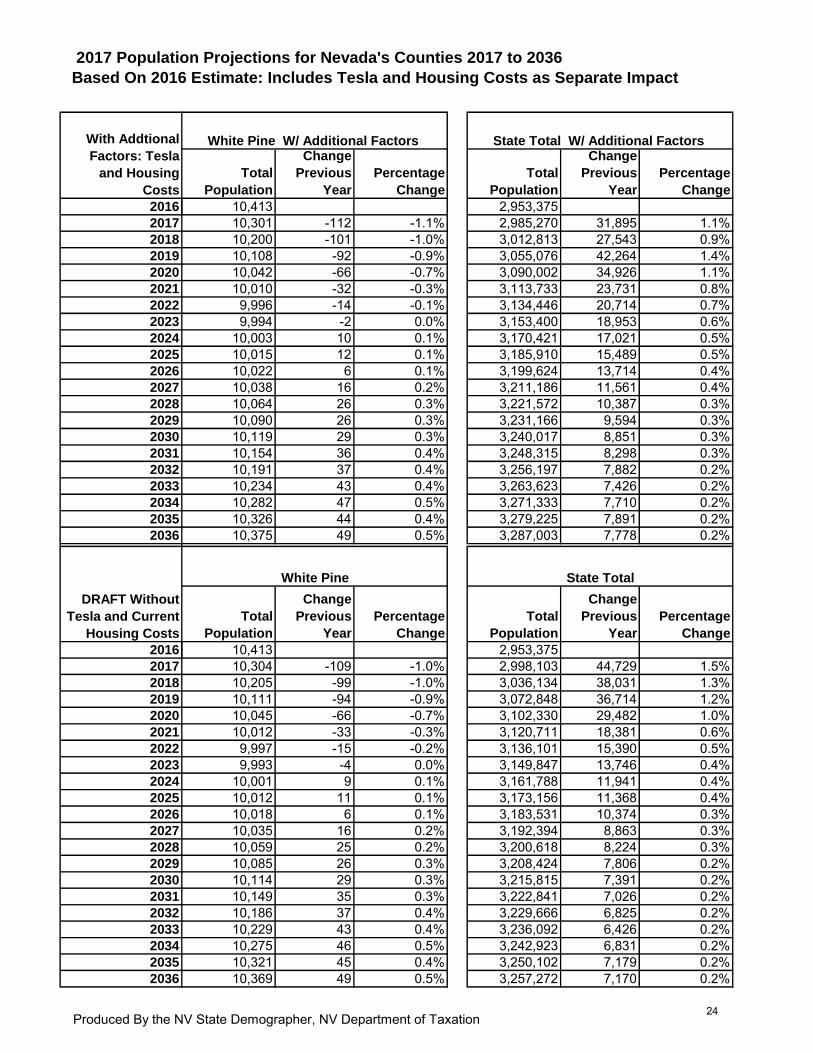
Table 1 compares the projections for 2030 by the year that they were released. Since 2013, the projections have fluctuated between 3,200,000 and just over 3,257,000 statewide. Greater differences are seen across the county projections.
Table 1: Comparing Nevada's Annual Population Projections for 2030 Year Projection Released Projection for 2030 2011 3,363,704 2012 3,338,269 2013 3,222,107 2014 3,251,664 2015 3,204,979 2016 3,257,762 2017 DRAFT 3,240,017
Table 2 compares the last year of the 2016 edition of the projections with the current 2017 DRAFT projections for the same year by county. The last year of the 2016 projections was 2035 so that is used to compare the two projections for their long-term differences. Both go out 20 years, and this is the last year in common between the two. This provides a summary comparison of the two projections from the 2016 estimate as well as against each other. The major differences are for Churchill, Clark, Pershing, and Storey Counties. The difference for Churchill County was the changes in the Bureau of Economic Analysis for how data was geocoded. That improved the allocation, but it impacted the relationship between employment and population more than was anticipated. The difference for Clark County is primarily the loss of Faraday Future. For Pershing County, there is slightly less mining employment projected, and there is also an impact of the geocoding as well for the finance sector. The difference for Storey County is that housing is no longer assumed to be part of the Tahoe Regional Industrial Center area. Table 2: Comparison of Projections for 2035 from the final 2016 Projections and the Current 2017 DRAFT Projections With Tesla Projections 2016
Estimate 2016 Projection for 2035
2016 Projection for 2035 Less 2016 Estimate
2017 DRAFT Projection for 2035
2017 Projection for 2034 Less 2016 Estimate
Difference 2017 DRAFT Projection Less 2016 Projection For 2035
Carson City 55,182 60,844 5,661 59,006 3,824 -1,837 Churchill 25,266 32,018 6,752 28,310 3,044 -3,708 Clark 2,166,181 2,437,854 271,673 2,392,595 226,414 -45,259 Douglas 48,235 51,838 3,603 51,647 3,412 -192 Elko 53,997 53,476 -521 58,380 4,383 4,904
2
Table 2: Comparison of Projections for 2035 from the final 2016 Projections and the Current 2017 DRAFT Projections With Tesla Projections 2016
Estimate 2016 Projection for 2035
2016 Projection for 2035 Less 2016 Estimate
2017 DRAFT Projection for 2035
2017 Projection for 2034 Less 2016 Estimate
Difference 2017 DRAFT Projection Less 2016 Projection For 2035
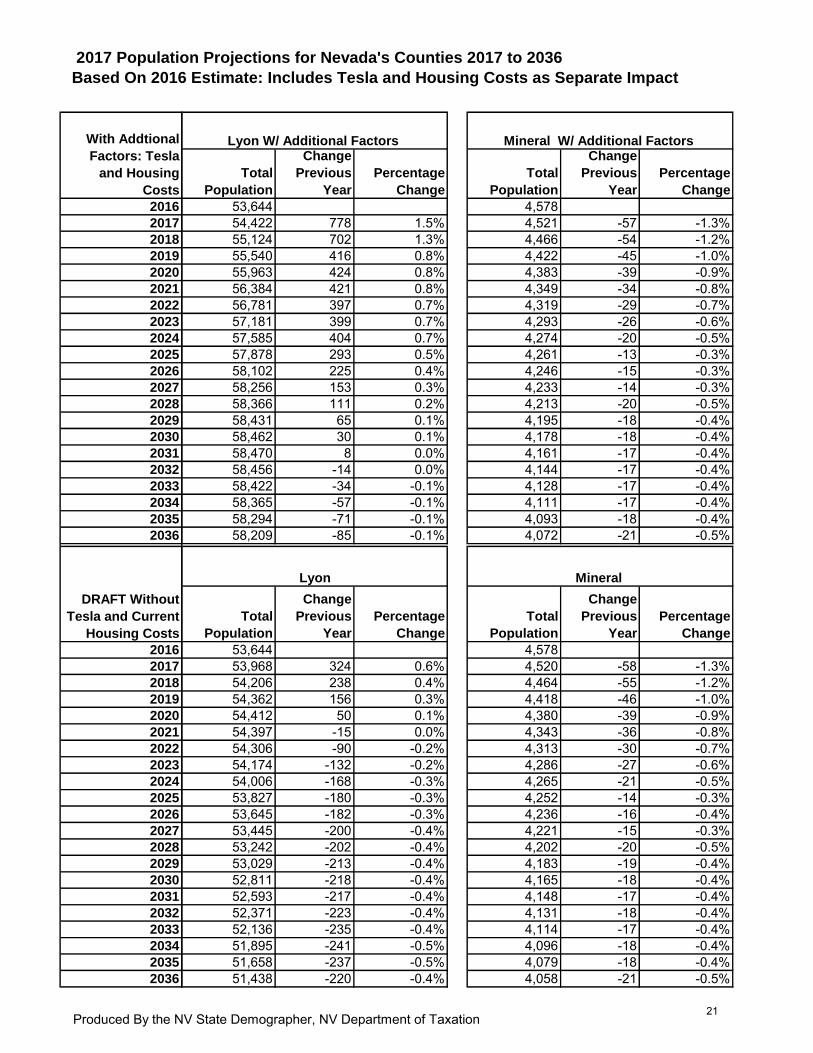
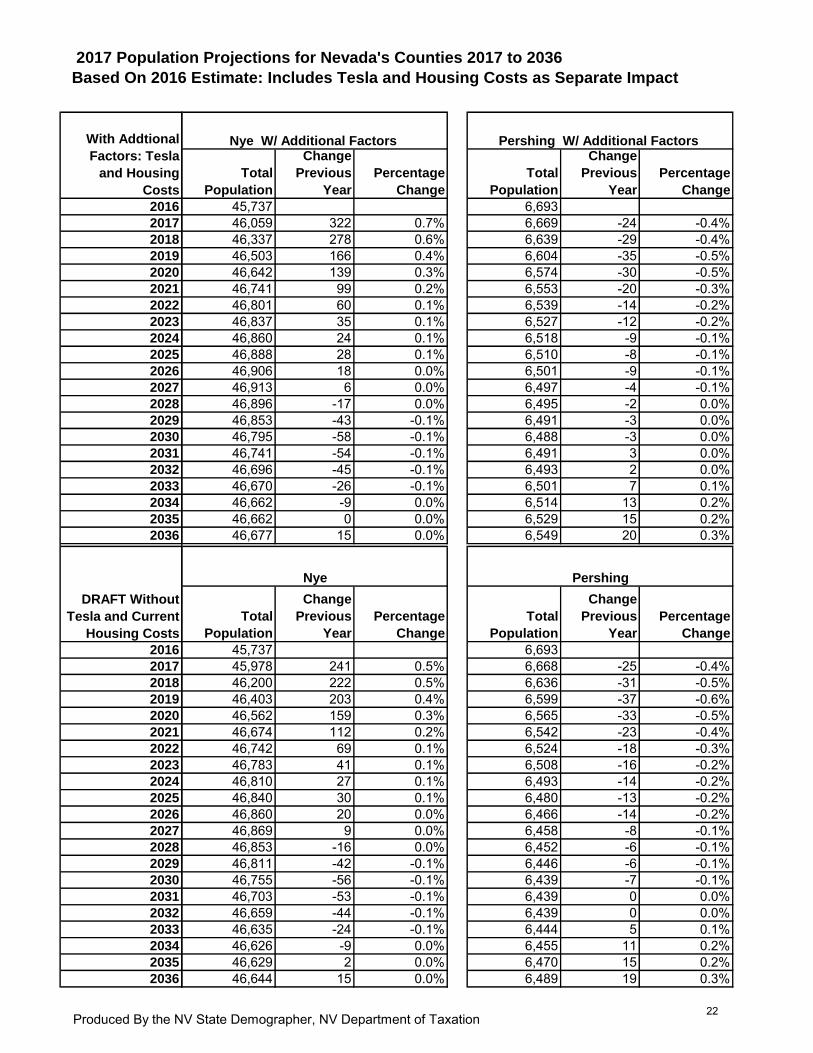
Esmeralda 964 753 -211 1,009 45 256 Eureka 1,959 2,093 135 2,563 604 469 Humboldt 16,853 15,580 -1,273 17,446 593 1,866 Lander 6,257 5,689 -568 6,598 341 908 Lincoln 5,057 5,068 11 4,259 -798 -809 Lyon 53,644 56,611 2,967 58,294 4,651 1,683 Mineral 4,578 4,747 169 4,093 -485 -654 Nye 45,737 45,481 -256 46,662 925 1,181 Pershing 6,693 8,118 1,425 6,529 -164 -1,589 Storey 4,043 9,242 5,199 5,419 1,376 -3,823 Washoe 448,316 525,872 77,556 526,090 77,774 218 White Pine 10,413 8,161 -2,252 10,326 -87 2,165 State Total 2,953,375 3,323,447 370,072 3,279,224 325,850 -44,222
Tables 3 and 4 compare the 2016 (1.7) and 2017 (2.1) version of the models for the U.S. and Nevada. Nationally, the topics that are compared are population, labor force, total employment, and Gross Domestic Product (GDP). Nationally, the biggest differences are in employment and GDP. More employment is projected, but GDP is less than the previous projection. For Nevada, in the historic data, population, labor force, and employment are greater than the 2016 estimate from 2014 and 2015, while state GDP is lower and the relative housing price increased between the two models. Table 3. Comparison of the Historic and Projected Data for the United States for Selected Years from the 2016 (1.7) and the 2017 (2.1) REMI Models (Bold = Historic Data)
Population
(in Thousands) Labor Force
(in Thousands) 2016 2017 2016 2017
2013 316,128.844 316,427.406 155,333.035 155,578.898 2014 318,391.352 318,907.406 156,443.444 156,231.011 2015 320,682.730 321,418.813 158,427.992 157,236.297 2016 323,003.712 323,934.473 160,308.712 157,669.605 2017 325,351.780 326,466.513 160,915.652 159,070.403 2022 337,383.166 339,234.924 164,068.869 165,935.873 2027 349,532.554 351,748.252 169,462.491 171,310.280 2032 361,216.481 363,428.357 175,411.139 177,700.316 2035 367,675.243 369,832.440 179,127.817 181,686.475
16.3% 16.9% 15.3% 16.8%
Total Employment (in Thousands)
Gross Domestic Product (in Billions of Fixed (2009) Dollars)
2016 2017 2016 2017 2013 182,278.203 182,408.094 $15,773.799 $15,732.880 2014 185,684.192 186,168.109 $16,163.189 $16,131.430 2015 189,363.851 190,195.406 $16,712.432 $16,583.563 2016 192,536.064 193,442.423 $17,317.143 $16,885.080 2017 194,933.040 196,478.564 $17,826.475 $17,367.027 2022 197,465.883 200,758.530 $19,822.681 $19,054.470 2027 198,366.331 204,121.464 $21,903.763 $20,884.386
3
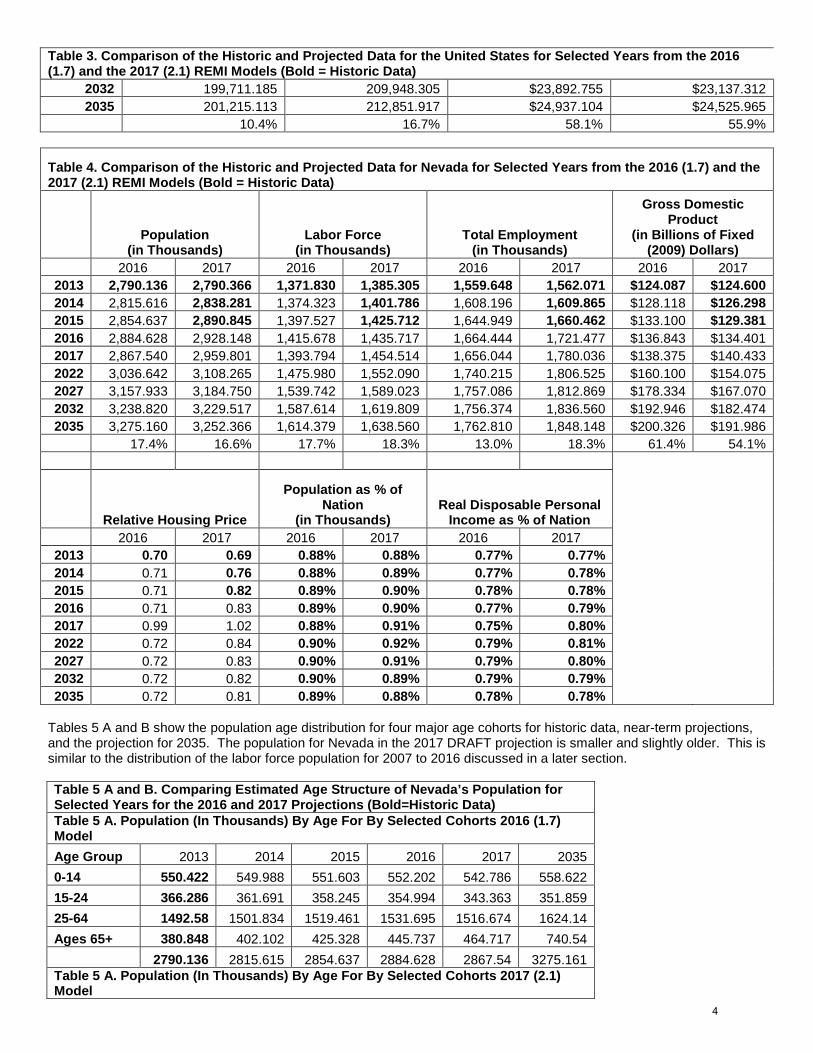
Table 3. Comparison of the Historic and Projected Data for the United States for Selected Years from the 2016 (1.7) and the 2017 (2.1) REMI Models (Bold = Historic Data)
2032 199,711.185 209,948.305 $23,892.755 $23,137.312 2035 201,215.113 212,851.917 $24,937.104 $24,525.965
10.4% 16.7% 58.1% 55.9%
Table 4. Comparison of the Historic and Projected Data for Nevada for Selected Years from the 2016 (1.7) and the 2017 (2.1) REMI Models (Bold = Historic Data)
Population
(in Thousands) Labor Force
(in Thousands) Total Employment
(in Thousands)
Gross Domestic Product
(in Billions of Fixed (2009) Dollars)
2016 2017 2016 2017 2016 2017 2016 2017 2013 2,790.136 2,790.366 1,371.830 1,385.305 1,559.648 1,562.071 $124.087 $124.600 2014 2,815.616 2,838.281 1,374.323 1,401.786 1,608.196 1,609.865 $128.118 $126.298 2015 2,854.637 2,890.845 1,397.527 1,425.712 1,644.949 1,660.462 $133.100 $129.381 2016 2,884.628 2,928.148 1,415.678 1,435.717 1,664.444 1,721.477 $136.843 $134.401 2017 2,867.540 2,959.801 1,393.794 1,454.514 1,656.044 1,780.036 $138.375 $140.433 2022 3,036.642 3,108.265 1,475.980 1,552.090 1,740.215 1,806.525 $160.100 $154.075 2027 3,157.933 3,184.750 1,539.742 1,589.023 1,757.086 1,812.869 $178.334 $167.070 2032 3,238.820 3,229.517 1,587.614 1,619.809 1,756.374 1,836.560 $192.946 $182.474 2035 3,275.160 3,252.366 1,614.379 1,638.560 1,762.810 1,848.148 $200.326 $191.986
17.4% 16.6% 17.7% 18.3% 13.0% 18.3% 61.4% 54.1%
Relative Housing Price
Population as % of Nation
(in Thousands) Real Disposable Personal
Income as % of Nation 2016 2017 2016 2017 2016 2017 2013 0.70 0.69 0.88% 0.88% 0.77% 0.77% 2014 0.71 0.76 0.88% 0.89% 0.77% 0.78% 2015 0.71 0.82 0.89% 0.90% 0.78% 0.78% 2016 0.71 0.83 0.89% 0.90% 0.77% 0.79% 2017 0.99 1.02 0.88% 0.91% 0.75% 0.80% 2022 0.72 0.84 0.90% 0.92% 0.79% 0.81% 2027 0.72 0.83 0.90% 0.91% 0.79% 0.80% 2032 0.72 0.82 0.90% 0.89% 0.79% 0.79% 2035 0.72 0.81 0.89% 0.88% 0.78% 0.78%
Tables 5 A and B show the population age distribution for four major age cohorts for historic data, near-term projections, and the projection for 2035. The population for Nevada in the 2017 DRAFT projection is smaller and slightly older. This is similar to the distribution of the labor force population for 2007 to 2016 discussed in a later section. Table 5 A and B. Comparing Estimated Age Structure of Nevada’s Population for Selected Years for the 2016 and 2017 Projections (Bold=Historic Data) Table 5 A. Population (In Thousands) By Age For By Selected Cohorts 2016 (1.7) Model Age Group 2013 2014 2015 2016 2017 2035 0-14 550.422 549.988 551.603 552.202 542.786 558.622 15-24 366.286 361.691 358.245 354.994 343.363 351.859 25-64 1492.58 1501.834 1519.461 1531.695 1516.674 1624.14 Ages 65+ 380.848 402.102 425.328 445.737 464.717 740.54 2790.136 2815.615 2854.637 2884.628 2867.54 3275.161 Table 5 A. Population (In Thousands) By Age For By Selected Cohorts 2017 (2.1) Model
4
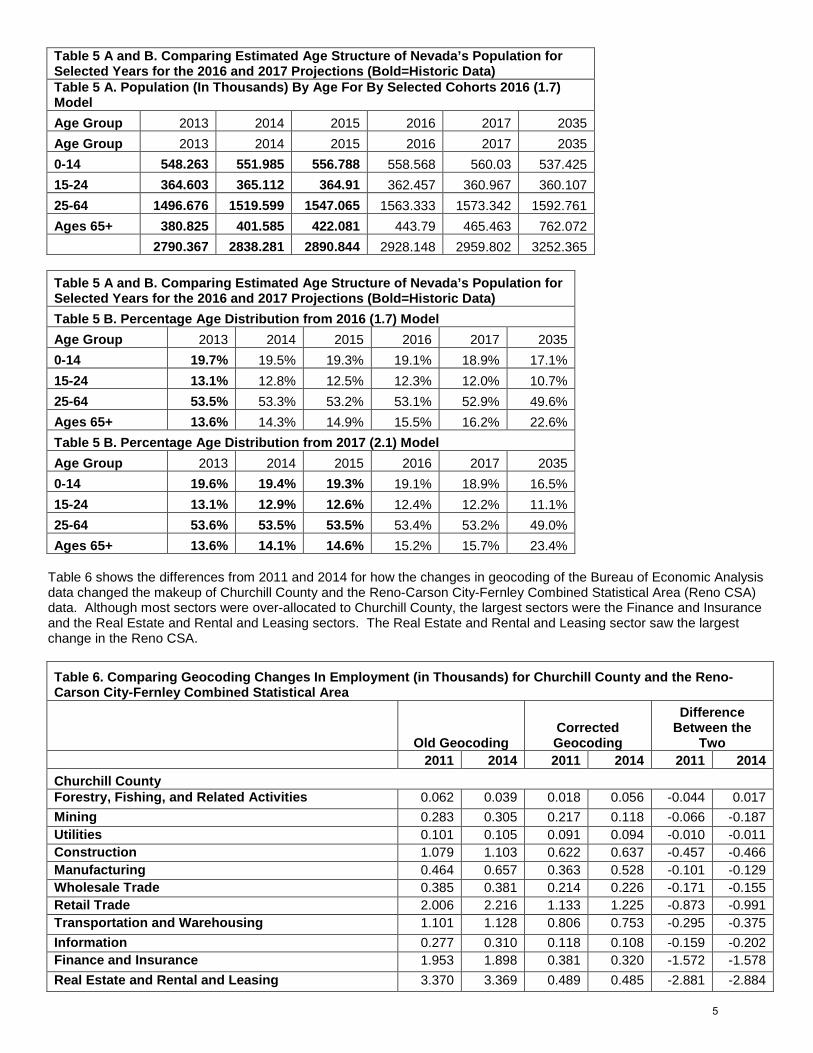
Table 5 A and B. Comparing Estimated Age Structure of Nevada’s Population for Selected Years for the 2016 and 2017 Projections (Bold=Historic Data) Table 5 A. Population (In Thousands) By Age For By Selected Cohorts 2016 (1.7) Model Age Group 2013 2014 2015 2016 2017 2035 Age Group 2013 2014 2015 2016 2017 2035 0-14 548.263 551.985 556.788 558.568 560.03 537.425 15-24 364.603 365.112 364.91 362.457 360.967 360.107 25-64 1496.676 1519.599 1547.065 1563.333 1573.342 1592.761 Ages 65+ 380.825 401.585 422.081 443.79 465.463 762.072 2790.367 2838.281 2890.844 2928.148 2959.802 3252.365
Table 5 A and B. Comparing Estimated Age Structure of Nevada’s Population for Selected Years for the 2016 and 2017 Projections (Bold=Historic Data) Table 5 B. Percentage Age Distribution from 2016 (1.7) Model Age Group 2013 2014 2015 2016 2017 2035 0-14 19.7% 19.5% 19.3% 19.1% 18.9% 17.1% 15-24 13.1% 12.8% 12.5% 12.3% 12.0% 10.7% 25-64 53.5% 53.3% 53.2% 53.1% 52.9% 49.6% Ages 65+ 13.6% 14.3% 14.9% 15.5% 16.2% 22.6% Table 5 B. Percentage Age Distribution from 2017 (2.1) Model Age Group 2013 2014 2015 2016 2017 2035 0-14 19.6% 19.4% 19.3% 19.1% 18.9% 16.5% 15-24 13.1% 12.9% 12.6% 12.4% 12.2% 11.1% 25-64 53.6% 53.5% 53.5% 53.4% 53.2% 49.0% Ages 65+ 13.6% 14.1% 14.6% 15.2% 15.7% 23.4%
Table 6 shows the differences from 2011 and 2014 for how the changes in geocoding of the Bureau of Economic Analysis
data changed the makeup of Churchill County and the Reno-Carson City-Fernley Combined Statistical Area (Reno CSA) data. Although most sectors were over-allocated to Churchill County, the largest sectors were the Finance and Insurance and the Real Estate and Rental and Leasing sectors. The Real Estate and Rental and Leasing sector saw the largest change in the Reno CSA.
Table 6. Comparing Geocoding Changes In Employment (in Thousands) for Churchill County and the Reno-Carson City-Fernley Combined Statistical Area
Old Geocoding Corrected Geocoding
Difference Between the
Two 2011 2014 2011 2014 2011 2014 Churchill County Forestry, Fishing, and Related Activities 0.062 0.039 0.018 0.056 -0.044 0.017 Mining 0.283 0.305 0.217 0.118 -0.066 -0.187 Utilities 0.101 0.105 0.091 0.094 -0.010 -0.011 Construction 1.079 1.103 0.622 0.637 -0.457 -0.466 Manufacturing 0.464 0.657 0.363 0.528 -0.101 -0.129 Wholesale Trade 0.385 0.381 0.214 0.226 -0.171 -0.155 Retail Trade 2.006 2.216 1.133 1.225 -0.873 -0.991 Transportation and Warehousing 1.101 1.128 0.806 0.753 -0.295 -0.375 Information 0.277 0.310 0.118 0.108 -0.159 -0.202 Finance and Insurance 1.953 1.898 0.381 0.320 -1.572 -1.578 Real Estate and Rental and Leasing 3.370 3.369 0.489 0.485 -2.881 -2.884
5
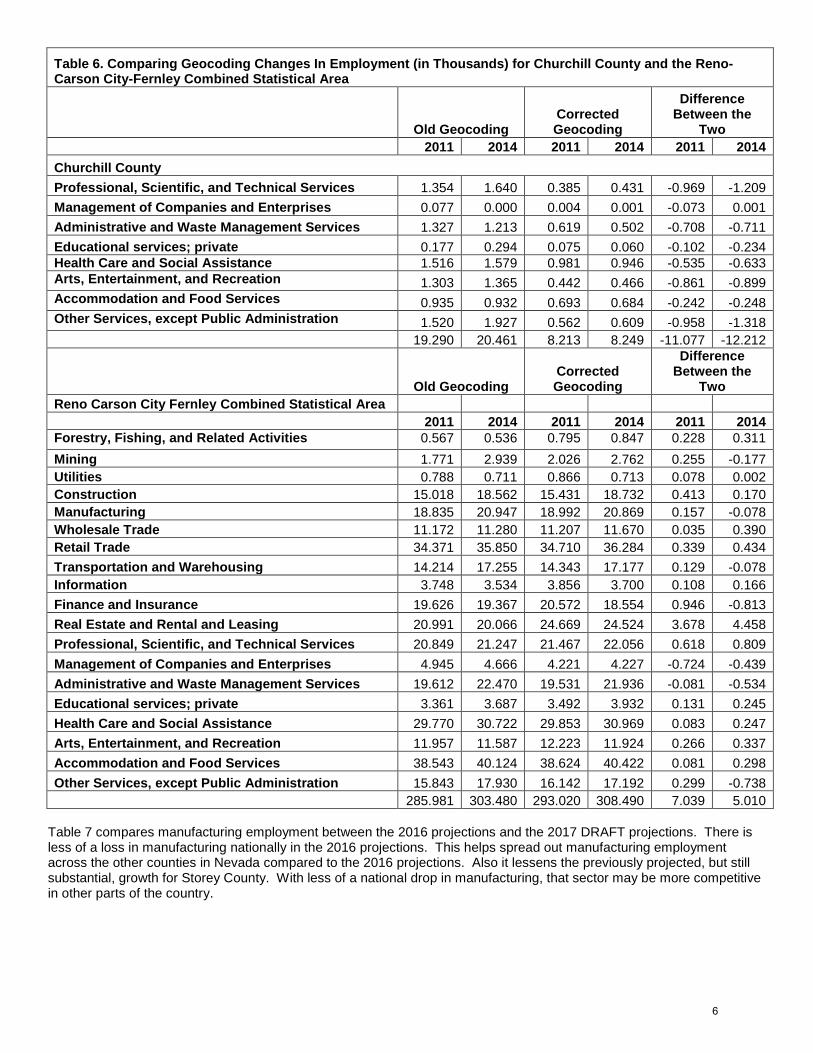
Table 6. Comparing Geocoding Changes In Employment (in Thousands) for Churchill County and the Reno-Carson City-Fernley Combined Statistical Area
Old Geocoding Corrected Geocoding
Difference Between the
Two 2011 2014 2011 2014 2011 2014 Churchill County Professional, Scientific, and Technical Services 1.354 1.640 0.385 0.431 -0.969 -1.209 Management of Companies and Enterprises 0.077 0.000 0.004 0.001 -0.073 0.001 Administrative and Waste Management Services 1.327 1.213 0.619 0.502 -0.708 -0.711 Educational services; private 0.177 0.294 0.075 0.060 -0.102 -0.234 Health Care and Social Assistance 1.516 1.579 0.981 0.946 -0.535 -0.633 Arts, Entertainment, and Recreation 1.303 1.365 0.442 0.466 -0.861 -0.899 Accommodation and Food Services 0.935 0.932 0.693 0.684 -0.242 -0.248 Other Services, except Public Administration 1.520 1.927 0.562 0.609 -0.958 -1.318 19.290 20.461 8.213 8.249 -11.077 -12.212
Old Geocoding Corrected Geocoding
Difference Between the
Two Reno Carson City Fernley Combined Statistical Area 2011 2014 2011 2014 2011 2014 Forestry, Fishing, and Related Activities 0.567 0.536 0.795 0.847 0.228 0.311 Mining 1.771 2.939 2.026 2.762 0.255 -0.177 Utilities 0.788 0.711 0.866 0.713 0.078 0.002 Construction 15.018 18.562 15.431 18.732 0.413 0.170 Manufacturing 18.835 20.947 18.992 20.869 0.157 -0.078 Wholesale Trade 11.172 11.280 11.207 11.670 0.035 0.390 Retail Trade 34.371 35.850 34.710 36.284 0.339 0.434 Transportation and Warehousing 14.214 17.255 14.343 17.177 0.129 -0.078 Information 3.748 3.534 3.856 3.700 0.108 0.166 Finance and Insurance 19.626 19.367 20.572 18.554 0.946 -0.813 Real Estate and Rental and Leasing 20.991 20.066 24.669 24.524 3.678 4.458 Professional, Scientific, and Technical Services 20.849 21.247 21.467 22.056 0.618 0.809 Management of Companies and Enterprises 4.945 4.666 4.221 4.227 -0.724 -0.439 Administrative and Waste Management Services 19.612 22.470 19.531 21.936 -0.081 -0.534 Educational services; private 3.361 3.687 3.492 3.932 0.131 0.245 Health Care and Social Assistance 29.770 30.722 29.853 30.969 0.083 0.247 Arts, Entertainment, and Recreation 11.957 11.587 12.223 11.924 0.266 0.337 Accommodation and Food Services 38.543 40.124 38.624 40.422 0.081 0.298 Other Services, except Public Administration 15.843 17.930 16.142 17.192 0.299 -0.738 285.981 303.480 293.020 308.490 7.039 5.010
Table 7 compares manufacturing employment between the 2016 projections and the 2017 DRAFT projections. There is less of a loss in manufacturing nationally in the 2016 projections. This helps spread out manufacturing employment across the other counties in Nevada compared to the 2016 projections. Also it lessens the previously projected, but still substantial, growth for Storey County. With less of a national drop in manufacturing, that sector may be more competitive in other parts of the country.
6
Table 7. Comparing Manufacturing Employment (in Thousands) from 2013 and 2035 for the United States and Nevada Counties from the 2016 and 2017 Projections 1.7 2.1
2013 2035 Percent Change 2013 2035
Percent Change
U.S. Total 12747.100 10880.219 -14.6% 12760.200 12109.357 -5.1% Clark 23.573 23.586 0.1% 23.797 19.202 -19.3% Douglas 1.843 1.517 -17.7% 1.895 1.889 -0.3% Lyon 2.166 2.295 6.0% 2.203 2.517 14.3% Storey 0.605 9.590 1485.1% 0.570 7.869 1280.5% Washoe 12.614 10.835 -14.1% 12.810 11.746 -8.3% Carson City 2.700 2.674 -1.0% 2.842 3.16 11.2% Balance of State 1.831 2.237 22.2% 1.691 1.456 -13.9% This concludes the overview of the projections and what has changed between the models for the 2016 and 2017 projections. The following provides general contextual information about Nevada andsurrounding states to illustrate how these projections may fit as part of larger national or regional context. An Overview of National and Regional Data As shown in Figure 1, research by William H. Frey shows that the United States’ growth rate has been slowing down since 2001. This is mainly due to slowing birth rates since approximately 2006. At the same time, migration decreased through 2010 and, while there is an increase, it is still not at the peak level of 2001. If these trends hold up it will slow Nevada’s growth and there will be a smaller pool of potential migrants into Nevada. Also, Nevada’s birth rates have been falling and approaching the national rate. Figure 1. U.S. rate of growth (Source: Frey: William H.: U.S. Growth Rate hits new low as migration to the Sun Belt continues: Brookings Institute - The Avenue; December 16, 2016
Figure 2 Nevada Crude Birth, Death, and Migration Rates and Jobs-to-Population Ratio 1971 to 2015 shows the crude birth, death and migration rates for Nevada as well as the Jobs-to-Population ratio. The crude rate is the number of births, deaths, or migrants per 1,000 in total population. It is not cohort-specific such as rate of births per women of child-bearing age. The jobs-to-population ratio shows the ability of the economy to create jobs. Nevada’s immigration could be
7
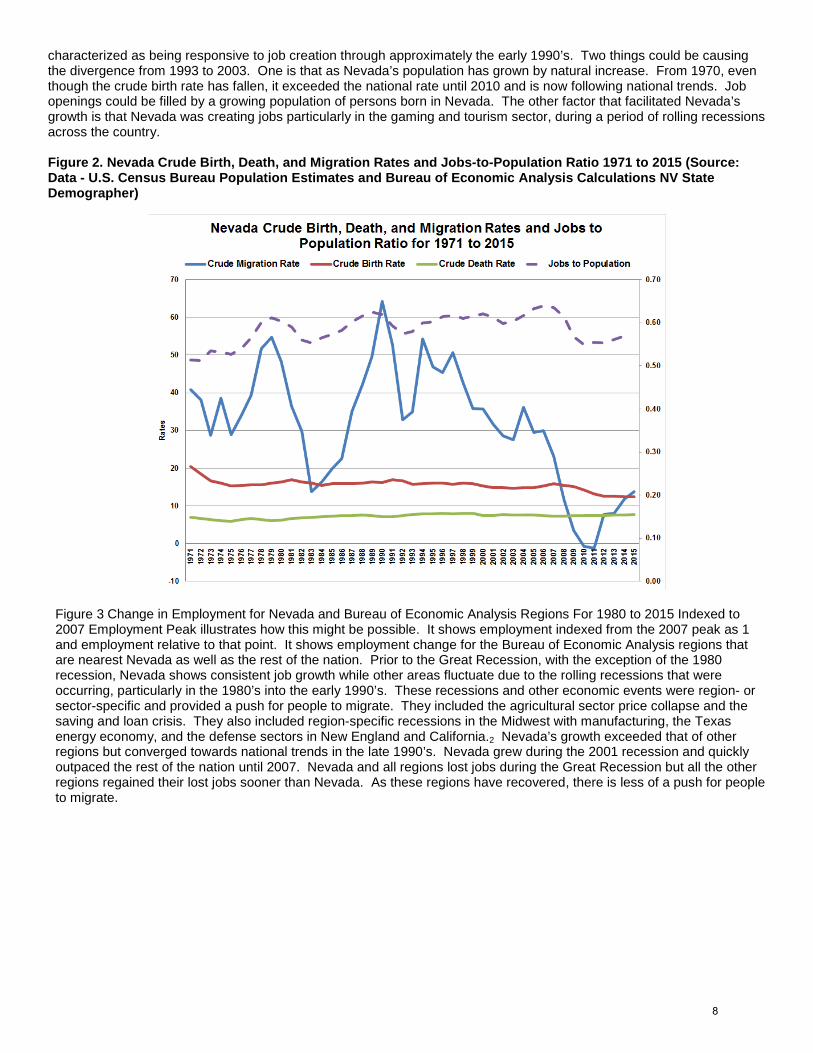
characterized as being responsive to job creation through approximately the early 1990’s. Two things could be causing the divergence from 1993 to 2003. One is that as Nevada’s population has grown by natural increase. From 1970, even though the crude birth rate has fallen, it exceeded the national rate until 2010 and is now following national trends. Job openings could be filled by a growing population of persons born in Nevada. The other factor that facilitated Nevada’s growth is that Nevada was creating jobs particularly in the gaming and tourism sector, during a period of rolling recessions across the country. Figure 2. Nevada Crude Birth, Death, and Migration Rates and Jobs-to-Population Ratio 1971 to 2015 (Source: Data - U.S. Census Bureau Population Estimates and Bureau of Economic Analysis Calculations NV State Demographer)
Figure 3 Change in Employment for Nevada and Bureau of Economic Analysis Regions For 1980 to 2015 Indexed to 2007 Employment Peak illustrates how this might be possible. It shows employment indexed from the 2007 peak as 1 and employment relative to that point. It shows employment change for the Bureau of Economic Analysis regions that are nearest Nevada as well as the rest of the nation. Prior to the Great Recession, with the exception of the 1980 recession, Nevada shows consistent job growth while other areas fluctuate due to the rolling recessions that were occurring, particularly in the 1980’s into the early 1990’s. These recessions and other economic events were region- or sector-specific and provided a push for people to migrate. They included the agricultural sector price collapse and the saving and loan crisis. They also included region-specific recessions in the Midwest with manufacturing, the Texas energy economy, and the defense sectors in New England and California.2 Nevada’s growth exceeded that of other regions but converged towards national trends in the late 1990’s. Nevada grew during the 2001 recession and quickly outpaced the rest of the nation until 2007. Nevada and all regions lost jobs during the Great Recession but all the other regions regained their lost jobs sooner than Nevada. As these regions have recovered, there is less of a push for people to migrate.
8
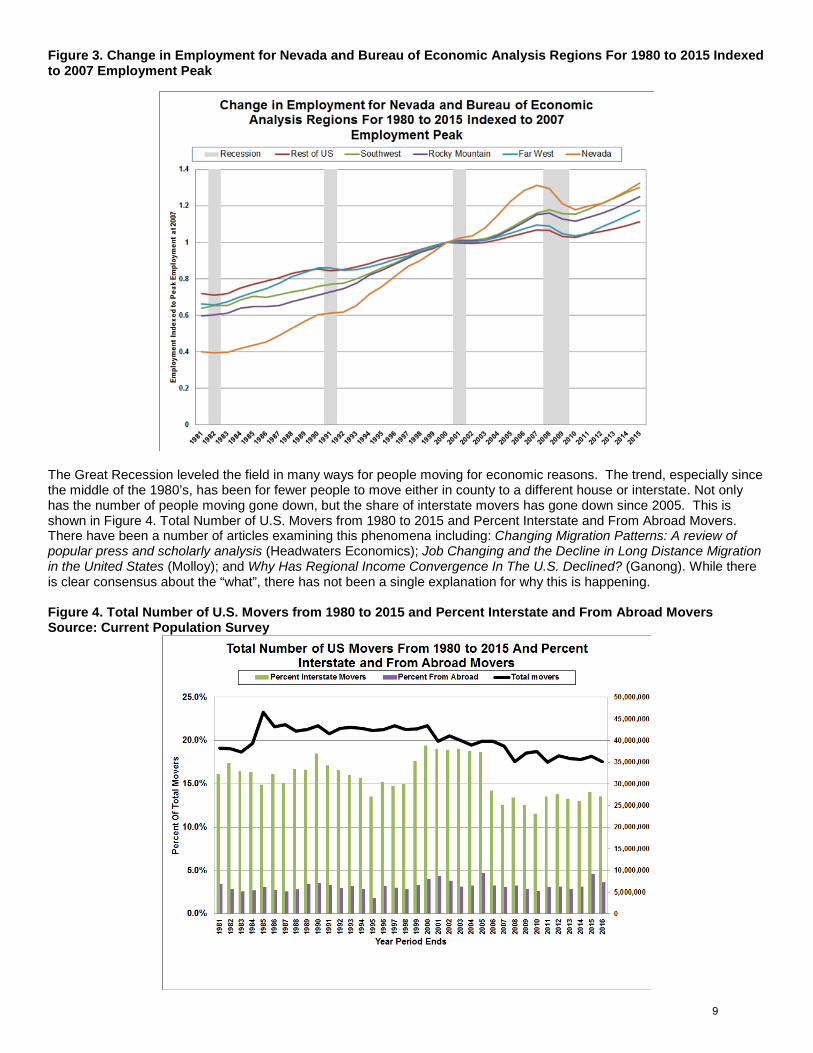
Figure 3. Change in Employment for Nevada and Bureau of Economic Analysis Regions For 1980 to 2015 Indexed to 2007 Employment Peak
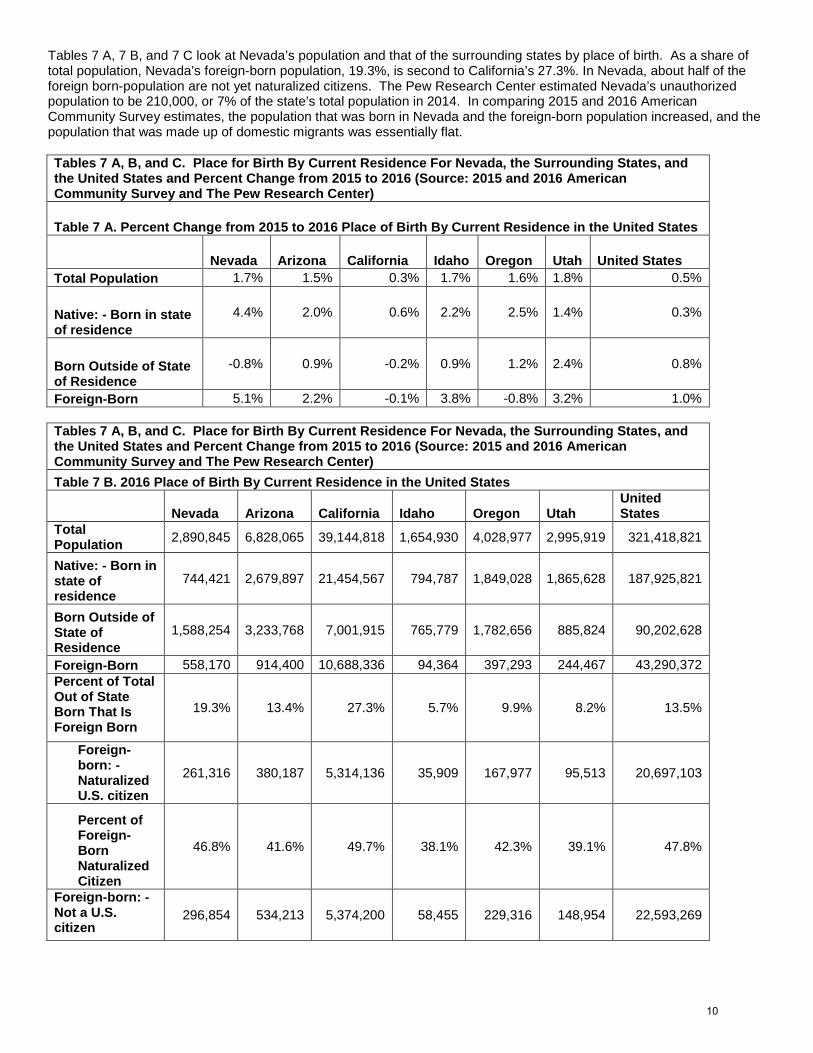
The Great Recession leveled the field in many ways for people moving for economic reasons. The trend, especially since the middle of the 1980’s, has been for fewer people to move either in county to a different house or interstate. Not only has the number of people moving gone down, but the share of interstate movers has gone down since 2005. This is shown in Figure 4. Total Number of U.S. Movers from 1980 to 2015 and Percent Interstate and From Abroad Movers. There have been a number of articles examining this phenomena including: Changing Migration Patterns: A review of popular press and scholarly analysis (Headwaters Economics); Job Changing and the Decline in Long Distance Migration in the United States (Molloy); and Why Has Regional Income Convergence In The U.S. Declined? (Ganong). While there is clear consensus about the “what”, there has not been a single explanation for why this is happening. Figure 4. Total Number of U.S. Movers from 1980 to 2015 and Percent Interstate and From Abroad Movers Source: Current Population Survey
9
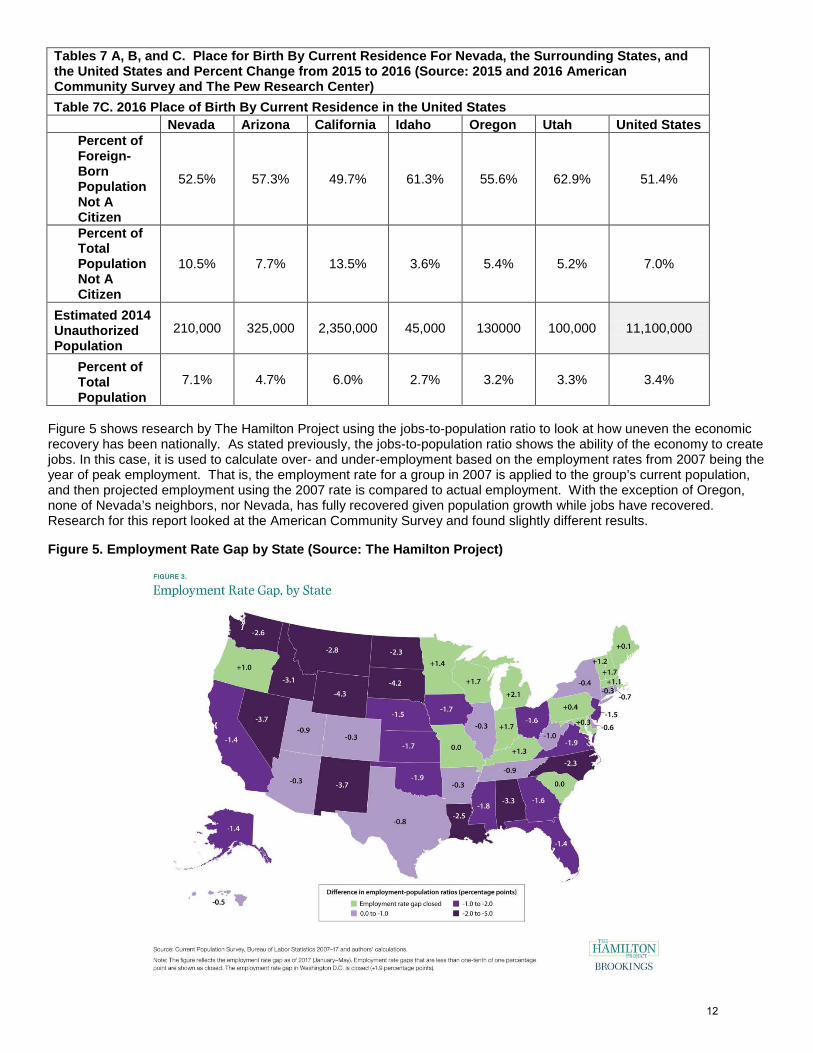
Tables 7 A, 7 B, and 7 C look at Nevada’s population and that of the surrounding states by place of birth. As a share of total population, Nevada’s foreign-born population, 19.3%, is second to California’s 27.3%. In Nevada, about half of the foreign born-population are not yet naturalized citizens. The Pew Research Center estimated Nevada’s unauthorized population to be 210,000, or 7% of the state’s total population in 2014. In comparing 2015 and 2016 American Community Survey estimates, the population that was born in Nevada and the foreign-born population increased, and the population that was made up of domestic migrants was essentially flat. Tables 7 A, B, and C. Place for Birth By Current Residence For Nevada, the Surrounding States, and the United States and Percent Change from 2015 to 2016 (Source: 2015 and 2016 American Community Survey and The Pew Research Center)
Table 7 A. Percent Change from 2015 to 2016 Place of Birth By Current Residence in the United States
Nevada Arizona California Idaho Oregon Utah United States Total Population 1.7% 1.5% 0.3% 1.7% 1.6% 1.8% 0.5%
Native: - Born in state of residence
4.4% 2.0% 0.6% 2.2% 2.5% 1.4% 0.3%
Born Outside of State of Residence
-0.8% 0.9% -0.2% 0.9% 1.2% 2.4% 0.8%
Foreign-Born 5.1% 2.2% -0.1% 3.8% -0.8% 3.2% 1.0% Tables 7 A, B, and C. Place for Birth By Current Residence For Nevada, the Surrounding States, and the United States and Percent Change from 2015 to 2016 (Source: 2015 and 2016 American Community Survey and The Pew Research Center) Table 7 B. 2016 Place of Birth By Current Residence in the United States
Nevada Arizona California Idaho Oregon Utah United States
Total Population 2,890,845 6,828,065 39,144,818 1,654,930 4,028,977 2,995,919 321,418,821
Native: - Born in state of residence
744,421 2,679,897 21,454,567 794,787 1,849,028 1,865,628 187,925,821
Born Outside of State of Residence
1,588,254 3,233,768 7,001,915 765,779 1,782,656 885,824 90,202,628
Foreign-Born 558,170 914,400 10,688,336 94,364 397,293 244,467 43,290,372 Percent of Total Out of State Born That Is Foreign Born
19.3% 13.4% 27.3% 5.7% 9.9% 8.2% 13.5%
Foreign-born: - Naturalized U.S. citizen
261,316 380,187 5,314,136 35,909 167,977 95,513 20,697,103
Percent of Foreign-Born Naturalized Citizen
46.8% 41.6% 49.7% 38.1% 42.3% 39.1% 47.8%
Foreign-born: - Not a U.S. citizen
296,854 534,213 5,374,200 58,455 229,316 148,954 22,593,269
10
Tables 7 A, B, and C. Place for Birth By Current Residence For Nevada, the Surrounding States, and the United States and Percent Change from 2015 to 2016 (Source: 2015 and 2016 American Community Survey and The Pew Research Center) Table 7 B. 2016 Place of Birth By Current Residence in the United States
Nevada Arizona California Idaho Oregon Utah United States
Percent of Foreign-Born Population Not A Citizen
53.2% 58.4% 50.3% 61.9% 57.7% 60.9% 52.2%
Percent of Total Population Not A Citizen
10.3% 7.8% 13.7% 3.5% 5.7% 5.0% 7.0%
Estimated 2014 Unauthorized Population
210,000 325,000 2,350,000 45,000 130000 100,000 11,100,000
Percent of Total Population
7.3% 4.8% 6.0% 2.7% 3.2% 3.3% 3.5%
Tables 7 A, B, and C. Place for Birth By Current Residence For Nevada, the Surrounding States, and the United States and Percent Change from 2015 to 2016 (Source: 2015 and 2016 American Community Survey and The Pew Research Center) Table 7C. 2016 Place of Birth By Current Residence in the United States Nevada Arizona California Idaho Oregon Utah United States Total Population 2,940,058 6,931,071 39,250,017 1,683,140 4,093,465 3,051,217 323,127,515
Native: - Born in state of residence
777,124 2,734,815 21,582,633 812,432 1,895,097 1,892,243 188,468,321
Born Outside of State of Residence
1,576,135 3,261,373 6,989,721 772,755 1,804,151 906,641 90,919,849
Foreign-Born 586,799 934,883 10,677,663 97,953 394,217 252,333 43,739,345 Percent of Total Out of State Born That Is Foreign Born
20.0% 13.5% 27.2% 5.8% 9.6% 8.3% 13.5%
Foreign born: - Naturalized U.S. citizen
278,711 399,036 5,369,508 37,899 174,922 93,582 21,238,372
Percent of Foreign-Born Naturalized Citizen
47.5% 42.7% 50.3% 38.7% 44.4% 37.1% 48.6%
Foreign-born: - Not a U.S. citizen
308,088 535,847 5,308,155 60,054 219,295 158,751 22,500,973
11
Tables 7 A, B, and C. Place for Birth By Current Residence For Nevada, the Surrounding States, and the United States and Percent Change from 2015 to 2016 (Source: 2015 and 2016 American Community Survey and The Pew Research Center) Table 7C. 2016 Place of Birth By Current Residence in the United States Nevada Arizona California Idaho Oregon Utah United States
Percent of Foreign-Born Population Not A Citizen
52.5% 57.3% 49.7% 61.3% 55.6% 62.9% 51.4%
Percent of Total Population Not A Citizen
10.5% 7.7% 13.5% 3.6% 5.4% 5.2% 7.0%
Estimated 2014 Unauthorized Population
210,000 325,000 2,350,000 45,000 130000 100,000 11,100,000
Percent of Total Population
7.1% 4.7% 6.0% 2.7% 3.2% 3.3% 3.4%
Figure 5 shows research by The Hamilton Project using the jobs-to-population ratio to look at how uneven the economic recovery has been nationally. As stated previously, the jobs-to-population ratio shows the ability of the economy to create jobs. In this case, it is used to calculate over- and under-employment based on the employment rates from 2007 being the year of peak employment. That is, the employment rate for a group in 2007 is applied to the group’s current population, and then projected employment using the 2007 rate is compared to actual employment. With the exception of Oregon, none of Nevada’s neighbors, nor Nevada, has fully recovered given population growth while jobs have recovered. Research for this report looked at the American Community Survey and found slightly different results.
Figure 5. Employment Rate Gap by State (Source: The Hamilton Project)
12
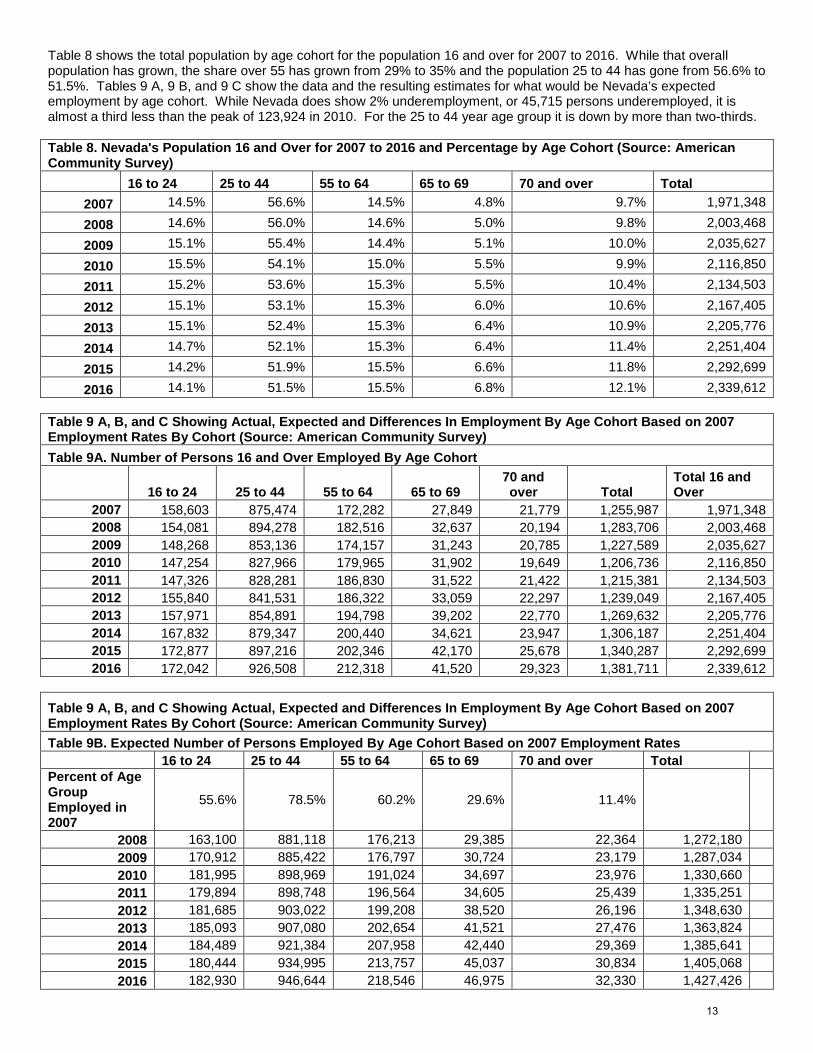
Table 8 shows the total population by age cohort for the population 16 and over for 2007 to 2016. While that overall population has grown, the share over 55 has grown from 29% to 35% and the population 25 to 44 has gone from 56.6% to 51.5%. Tables 9 A, 9 B, and 9 C show the data and the resulting estimates for what would be Nevada’s expected employment by age cohort. While Nevada does show 2% underemployment, or 45,715 persons underemployed, it is almost a third less than the peak of 123,924 in 2010. For the 25 to 44 year age group it is down by more than two-thirds. Table 8. Nevada's Population 16 and Over for 2007 to 2016 and Percentage by Age Cohort (Source: American Community Survey) 16 to 24 25 to 44 55 to 64 65 to 69 70 and over Total
2007 14.5% 56.6% 14.5% 4.8% 9.7% 1,971,348
2008 14.6% 56.0% 14.6% 5.0% 9.8% 2,003,468
2009 15.1% 55.4% 14.4% 5.1% 10.0% 2,035,627
2010 15.5% 54.1% 15.0% 5.5% 9.9% 2,116,850
2011 15.2% 53.6% 15.3% 5.5% 10.4% 2,134,503
2012 15.1% 53.1% 15.3% 6.0% 10.6% 2,167,405
2013 15.1% 52.4% 15.3% 6.4% 10.9% 2,205,776
2014 14.7% 52.1% 15.3% 6.4% 11.4% 2,251,404
2015 14.2% 51.9% 15.5% 6.6% 11.8% 2,292,699
2016 14.1% 51.5% 15.5% 6.8% 12.1% 2,339,612 Table 9 A, B, and C Showing Actual, Expected and Differences In Employment By Age Cohort Based on 2007 Employment Rates By Cohort (Source: American Community Survey) Table 9A. Number of Persons 16 and Over Employed By Age Cohort
16 to 24 25 to 44 55 to 64 65 to 69 70 and over Total
Total 16 and Over
2007 158,603 875,474 172,282 27,849 21,779 1,255,987 1,971,348 2008 154,081 894,278 182,516 32,637 20,194 1,283,706 2,003,468 2009 148,268 853,136 174,157 31,243 20,785 1,227,589 2,035,627 2010 147,254 827,966 179,965 31,902 19,649 1,206,736 2,116,850 2011 147,326 828,281 186,830 31,522 21,422 1,215,381 2,134,503 2012 155,840 841,531 186,322 33,059 22,297 1,239,049 2,167,405 2013 157,971 854,891 194,798 39,202 22,770 1,269,632 2,205,776 2014 167,832 879,347 200,440 34,621 23,947 1,306,187 2,251,404 2015 172,877 897,216 202,346 42,170 25,678 1,340,287 2,292,699 2016 172,042 926,508 212,318 41,520 29,323 1,381,711 2,339,612
Table 9 A, B, and C Showing Actual, Expected and Differences In Employment By Age Cohort Based on 2007 Employment Rates By Cohort (Source: American Community Survey) Table 9B. Expected Number of Persons Employed By Age Cohort Based on 2007 Employment Rates 16 to 24 25 to 44 55 to 64 65 to 69 70 and over Total Percent of Age Group Employed in 2007
55.6% 78.5% 60.2% 29.6% 11.4%
2008 163,100 881,118 176,213 29,385 22,364 1,272,180 2009 170,912 885,422 176,797 30,724 23,179 1,287,034 2010 181,995 898,969 191,024 34,697 23,976 1,330,660 2011 179,894 898,748 196,564 34,605 25,439 1,335,251 2012 181,685 903,022 199,208 38,520 26,196 1,348,630 2013 185,093 907,080 202,654 41,521 27,476 1,363,824 2014 184,489 921,384 207,958 42,440 29,369 1,385,641 2015 180,444 934,995 213,757 45,037 30,834 1,405,068 2016 182,930 946,644 218,546 46,975 32,330 1,427,426
13
Table 9 A, B, and C Showing Actual, Expected and Differences In Employment By Age Cohort Based on 2007 Employment Rates By Cohort (Source: American Community Survey) Table 9C. Difference of Expected Employment Less Actual By Age Cohort Based on 2007 Employment Rates
16 to 24 25 to 44 55 to 64 65 to 69 70 and over Total Percentage of Total 16 and Over Population
2008 -9,019 13,160 6,303 3,252 -2,170 11,526 0.6% 2009 -22,644 -32,286 -2,640 519 -2,394 -59,445 -2.9% 2010 -34,741 -71,003 -11,059 -2,795 -4,327 -123,924 -5.9% 2011 -32,568 -70,467 -9,734 -3,083 -4,017 -119,870 -5.6% 2012 -25,845 -61,491 -12,886 -5,461 -3,899 -109,581 -5.1% 2013 -27,122 -52,189 -7,856 -2,319 -4,706 -94,192 -4.3% 2014 -16,657 -42,037 -7,518 -7,819 -5,422 -79,454 -3.5% 2015 -7,567 -37,779 -11,411 -2,867 -5,156 -64,781 -2.8% 2016 -10,888 -20,136 -6,228 -5,455 -3,007 -2% or -2.0%
Table 10 looks at the Great Recession and its aftermath by looking at when employment peaked for Nevada and the surrounding states, when bottom employment occurred, and when each state returned to approximately the previous peak of employment. It also includes total population changes for those same time periods and the rate of appreciation for purchased homes. For Nevada and the neighboring states, population grew even as there was significant job loss. Nevada had the biggest difference, with job losses being 14.4% and population gained by 3.9%. For Nevada and the states around it, population has increased less than the rate of increase in jobs since that period. Table 10. Comparison of Nevada Job and Population Changes to Surrounding States and United States Total From Peak Employment to July 2016 (Preliminary) For Total Non-Farm Employment
State Nevada Arizona California Idaho Oregon Utah U.S. Total Peak Date May-07 Oct-07 Jul-07 Jun-07 Dec-07 Dec-07 Jan-08
Peak Employment 1,297,600 2,686,300 15,502,800 657,500 1,737,500 1,265,200 138,365,000 Peak Population 2,601,072 6,167,681 36,250,311 1,505,105 3,722,417 2,597,746 301,231,207
Bottom Employment Date Sep-10 Sep-10 Feb-10 Jan-10 Jan-10 Feb-10 Feb-10
Bottom Employment 1,111,200 2,372,600 14,186,500 598,500 1,590,800 1,173,200 129,649,000 Bottom Population 2,703,284 6,408,312 37,332,685 1,571,010 3,838,048 2,775,326 309,348,193
Bottom Less Peak Employment
-186,400 -313,700 -1,316,300 -59,000 -146,700 -92,000 -8,716,000
Bottom Less Peak Population
102,212 240,631 1,082,374 65,905 115,631 177,580 8,116,986
Years from Peak to Bottom
3.3 2.9 2.6 2.6 2.2 2.2 2.1
Percent Change Employment
-14.4% -11.7% -8.5% -9.0% -8.4% -7.3% -6.3%
Percent Change Population
3.9% 3.9% 3.0% 4.4% 3.1% 6.8% 2.7%
Date Back to Approximate Peak Level
Jun-16 Mar-16 Apr-14 Oct-14 Oct-14 Nov-12 Apr-14
Jobs Back at Peak Level 1,293,400 2,685,000 15,497,100 657,800 1,736,700 1,267,800 138,316,000
Population When Back at Approximate Peak Level
2,940,058 6,931,071 38,680,810 1,633,532 3,968,371 2,941,836 318,563,456
Years Back to Peak Level 5.8 5.5 4.2 4.8 4.8 2.8 4.2
Annual Percent Change Employment Bottom Back to Peak
2.7% 2.3% 2.1% 2.0% 1.9% 5.5% 1.6%
14
Table 10. Comparison of Nevada Job and Population Changes to Surrounding States and United States Total From Peak Employment to July 2016 (Preliminary) For Total Non-Farm Employment
State Nevada Arizona California Idaho Oregon Utah U.S. Total Annual Percent Change Population Bottom Back to Peak
1.5% 1.4% 0.9% 0.8% 0.7% 2.1% 0.7%
Employment as of June 2017
1,342,100 2,753,400 16,703,300 709,200 1,880,000 1,468,100 146,404,000
Jobs Gained - June 2017 less Bottom
230,900 380,800 2,516,800 110,700 289,200 294,900 16,755,000
Percent of Lost Jobs Recovered
123.9% 121.4% 191.2% 187.6% 197.1% 320.5% 192.2%
Years from Approximate Peak to June 2017
1.0 1.3 3.2 2.7 2.7 4.6 3.2
Annual Percent Growth From Bottom To Approximate Peak
2.7% 2.3% 2.1% 2.0% 1.9% 2.9% 1.6%
Annual Approximate Peak to June 2017
3.8% 2.0% 2.4% 2.9% 3.0% 3.3% 1.8%
Year of Bottom of Housing Market
2012 2011 2012 2012 2012 2011 2012
Annual Appreciation Since Bottom to June 2017
62.0% 44.6% 43.6% 26.4% 38.6% 27.4% 20.8%
Source: U.S. Bureau of Labor Statistics: Current Employment Series - Seasonally Adjusted, Bureau of Economic Analysis, and Federal Housing Finance Agency.
This concludes the Overview of National and Regional Data section. The following section discusses four main risks to the projections. Risks to the Projections: There are four areas of risk to the current projections that could slow Nevada’s growth: 1.) Unsettled trends and policy in international migration could impact the projections. The Migration Policy Institute
reports that while there was an increase in total migration from 2014 to 2015, the migrant population has been made up of fewer migrants from Mexico, and India and China are now the largest countries of origin. This could lead to new settlement patterns from the immigrant population. Also, with Nevada’s sizable unauthorized population, efforts at deportation may lead to a loss of population and lower employment both due to a loss of employees as well as consumer spending. Most recently, the Reforming American Immigration for Strong Employment Act or the RAISE Act would limit legal immigration to half of current levels.
2.) Potential impacts from automation could pose a risk to employment over time. A study from the University of Redlands has estimated that up to 65% of the jobs in Clark County are at risk of being automated. This is based on work by Frey and Osborne that looked at the likelihood of occupations being automated in total or in part based on the skill set for the occupation. Arntz and Zierahn, in a paper for the Organization for Economic Cooperation and Development, found that up to 9% of jobs could be automated for most developed economies. There is no clear consensus on the timing or full impact of automation in the literature.
3.) Climate change could have mixed impacts on Nevada’s growth. For instance, work by Matthew Hauer examines sea level rise and potential migration impacts given historic migration trends and found that population would increase for Nevada. In contrast, works by David Albouy (Climate Amenities, Climate Change, and American Quality of Life) and Solomon Hsiang (Estimating economic damage from climate change in the United States) look not at migration impacts but on the economic impact. In the work by Hsiang, the impacts vary by county and some parts of Nevada could benefit and some could be negatively impacted.
4.) Funding of health care from reforming the Affordable Care Act to changes in Medicare and other programs continues to be uncertain for how costs paid by consumers and various insurance programs. Changes to the current situation could impact consumer spending and the health care sector with unknown consequences depending on any details of any new plan.
15

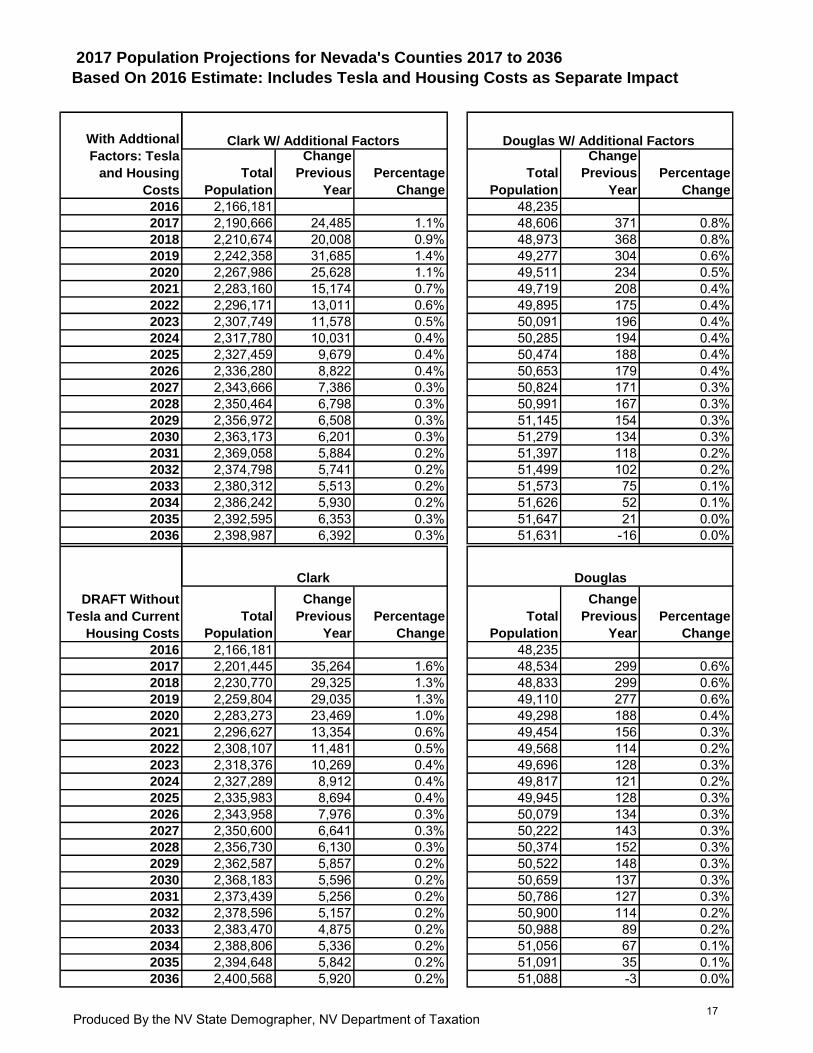
2017 Population Projections for Nevada's Counties 2017 to 2036
Based On 2016 Estimate: Includes Tesla and Housing Costs as Separate Impact
Total
Population
Change
Previous
Year
Percentage
Change
Total
Population
Change
Previous
Year
Percentage
Change
2016 55,182 25,2662017 55,533 350 0.6% 25,561 295 1.2%2018 55,885 353 0.6% 25,844 283 1.1%2019 56,128 242 0.4% 26,087 243 0.9%2020 56,322 195 0.3% 26,273 186 0.7%2021 56,523 201 0.4% 26,452 179 0.7%2022 56,744 220 0.4% 26,617 165 0.6%2023 57,002 259 0.5% 26,790 173 0.6%2024 57,276 274 0.5% 26,953 163 0.6%2025 57,503 227 0.4% 27,126 173 0.6%2026 57,713 210 0.4% 27,293 167 0.6%2027 57,904 191 0.3% 27,451 158 0.6%2028 58,074 170 0.3% 27,607 156 0.6%2029 58,226 153 0.3% 27,755 148 0.5%2030 58,374 147 0.3% 27,892 137 0.5%2031 58,520 146 0.3% 28,014 122 0.4%2032 58,665 144 0.2% 28,116 102 0.4%2033 58,793 128 0.2% 28,198 82 0.3%2034 58,911 118 0.2% 28,262 64 0.2%2035 59,006 95 0.2% 28,310 48 0.2%2036 59,088 82 0.1% 28,376 66 0.2%
Total
Population
Change
Previous
Year
Percentage
Change
Total
Population
Change
Previous
Year
Percentage
Change
2016 55,182 25,2662017 55,330 147 0.3% 25,537 271 1.1%2018 55,462 132 0.2% 25,792 255 1.0%2019 55,566 104 0.2% 26,019 227 0.9%2020 55,580 14 0.0% 26,185 166 0.6%2021 55,556 -24 0.0% 26,341 156 0.6%2022 55,507 -48 -0.1% 26,482 141 0.5%2023 55,465 -42 -0.1% 26,630 148 0.6%2024 55,423 -42 -0.1% 26,766 136 0.5%2025 55,407 -15 0.0% 26,920 154 0.6%2026 55,429 21 0.0% 27,075 155 0.6%2027 55,477 48 0.1% 27,227 152 0.6%2028 55,545 68 0.1% 27,381 154 0.6%2029 55,626 81 0.1% 27,531 150 0.5%2030 55,730 104 0.2% 27,670 139 0.5%2031 55,853 123 0.2% 27,796 126 0.5%2032 55,989 136 0.2% 27,902 106 0.4%2033 56,121 132 0.2% 27,990 88 0.3%2034 56,251 129 0.2% 28,059 68 0.2%2035 56,362 111 0.2% 28,109 51 0.2%2036 56,462 100 0.2% 28,174 65 0.2%
With Addtional
Factors: Tesla
and Housing
Costs
Carson City W/ Additional Factors Churchill W/ Additional Factors
DRAFT Without
Tesla and Current
Housing Costs
Carson City Churchill
Produced By the NV State Demographer, NV Department of Taxation16
2017 Population Projections for Nevada's Counties 2017 to 2036
Based On 2016 Estimate: Includes Tesla and Housing Costs as Separate Impact
2016
2017
2018
2019
2020
2021
2022
2023
2024
2025
2026
2027
2028
2029
2030
2031
2032
2033
2034
2035
2036
2016
2017
2018
2019
2020
2021
2022
2023
2024
2025
2026
2027
2028
2029
2030
2031
2032
2033
2034
2035
2036
With Addtional
Factors: Tesla
and Housing
Costs
DRAFT Without
Tesla and Current
Housing Costs
Total
Population
Change
Previous
Year
Percentage
Change
Total
Population
Change
Previous
Year
Percentage
Change
2,166,181 48,2352,190,666 24,485 1.1% 48,606 371 0.8%2,210,674 20,008 0.9% 48,973 368 0.8%2,242,358 31,685 1.4% 49,277 304 0.6%2,267,986 25,628 1.1% 49,511 234 0.5%2,283,160 15,174 0.7% 49,719 208 0.4%2,296,171 13,011 0.6% 49,895 175 0.4%2,307,749 11,578 0.5% 50,091 196 0.4%2,317,780 10,031 0.4% 50,285 194 0.4%2,327,459 9,679 0.4% 50,474 188 0.4%2,336,280 8,822 0.4% 50,653 179 0.4%2,343,666 7,386 0.3% 50,824 171 0.3%2,350,464 6,798 0.3% 50,991 167 0.3%2,356,972 6,508 0.3% 51,145 154 0.3%2,363,173 6,201 0.3% 51,279 134 0.3%2,369,058 5,884 0.2% 51,397 118 0.2%2,374,798 5,741 0.2% 51,499 102 0.2%2,380,312 5,513 0.2% 51,573 75 0.1%2,386,242 5,930 0.2% 51,626 52 0.1%2,392,595 6,353 0.3% 51,647 21 0.0%2,398,987 6,392 0.3% 51,631 -16 0.0%
Total
Population
Change
Previous
Year
Percentage
Change
Total
Population
Change
Previous
Year
Percentage
Change
2,166,181 48,2352,201,445 35,264 1.6% 48,534 299 0.6%2,230,770 29,325 1.3% 48,833 299 0.6%2,259,804 29,035 1.3% 49,110 277 0.6%2,283,273 23,469 1.0% 49,298 188 0.4%2,296,627 13,354 0.6% 49,454 156 0.3%2,308,107 11,481 0.5% 49,568 114 0.2%2,318,376 10,269 0.4% 49,696 128 0.3%2,327,289 8,912 0.4% 49,817 121 0.2%2,335,983 8,694 0.4% 49,945 128 0.3%2,343,958 7,976 0.3% 50,079 134 0.3%2,350,600 6,641 0.3% 50,222 143 0.3%2,356,730 6,130 0.3% 50,374 152 0.3%2,362,587 5,857 0.2% 50,522 148 0.3%2,368,183 5,596 0.2% 50,659 137 0.3%2,373,439 5,256 0.2% 50,786 127 0.3%2,378,596 5,157 0.2% 50,900 114 0.2%2,383,470 4,875 0.2% 50,988 89 0.2%2,388,806 5,336 0.2% 51,056 67 0.1%2,394,648 5,842 0.2% 51,091 35 0.1%2,400,568 5,920 0.2% 51,088 -3 0.0%
Clark W/ Additional Factors Douglas W/ Additional Factors
Clark Douglas
Produced By the NV State Demographer, NV Department of Taxation17
2017 Population Projections for Nevada's Counties 2017 to 2036
Based On 2016 Estimate: Includes Tesla and Housing Costs as Separate Impact
2016
2017
2018
2019
2020
2021
2022
2023
2024
2025
2026
2027
2028
2029
2030
2031
2032
2033
2034
2035
2036
2016
2017
2018
2019
2020
2021
2022
2023
2024
2025
2026
2027
2028
2029
2030
2031
2032
2033
2034
2035
2036
With Addtional
Factors: Tesla
and Housing
Costs
DRAFT Without
Tesla and Current
Housing Costs
Total
Population
Change
Previous
Year
Percentage
Change
Total
Population
Change
Previous
Year
Percentage
Change
53,997 96454,498 500 0.9% 958 -6 -0.6%54,890 393 0.7% 957 -1 -0.1%55,061 171 0.3% 954 -2 -0.2%55,235 174 0.3% 957 2 0.2%55,407 173 0.3% 962 5 0.5%55,560 153 0.3% 967 6 0.6%55,725 164 0.3% 973 6 0.6%55,926 202 0.4% 978 5 0.5%56,104 178 0.3% 982 4 0.4%56,266 161 0.3% 984 2 0.2%56,457 191 0.3% 990 6 0.6%56,670 213 0.4% 996 6 0.6%56,892 222 0.4% 999 4 0.4%57,106 214 0.4% 1,002 2 0.2%57,338 232 0.4% 1,004 2 0.2%57,575 237 0.4% 1,005 1 0.1%57,835 261 0.5% 1,006 1 0.1%58,112 277 0.5% 1,008 1 0.1%58,380 268 0.5% 1,009 1 0.1%58,648 268 0.5% 1,012 4 0.4%
Total
Population
Change
Previous
Year
Percentage
Change
Total
Population
Change
Previous
Year
Percentage
Change
53,997 96454,364 367 0.7% 956 -8 -0.9%54,661 297 0.5% 953 -2 -0.2%54,880 219 0.4% 952 -1 -0.1%55,071 191 0.3% 956 4 0.4%55,256 185 0.3% 960 5 0.5%55,417 160 0.3% 966 6 0.6%55,584 168 0.3% 972 6 0.6%55,791 207 0.4% 977 5 0.5%55,975 184 0.3% 980 4 0.4%56,146 171 0.3% 983 2 0.2%56,350 205 0.4% 989 6 0.6%56,580 230 0.4% 993 5 0.5%56,820 240 0.4% 998 5 0.5%57,053 234 0.4% 1,000 2 0.2%57,304 250 0.4% 1,003 2 0.2%57,559 255 0.4% 1,003 0 0.0%57,837 278 0.5% 1,005 2 0.2%58,131 294 0.5% 1,006 1 0.1%58,414 283 0.5% 1,008 1 0.1%58,695 281 0.5% 1,011 4 0.4%
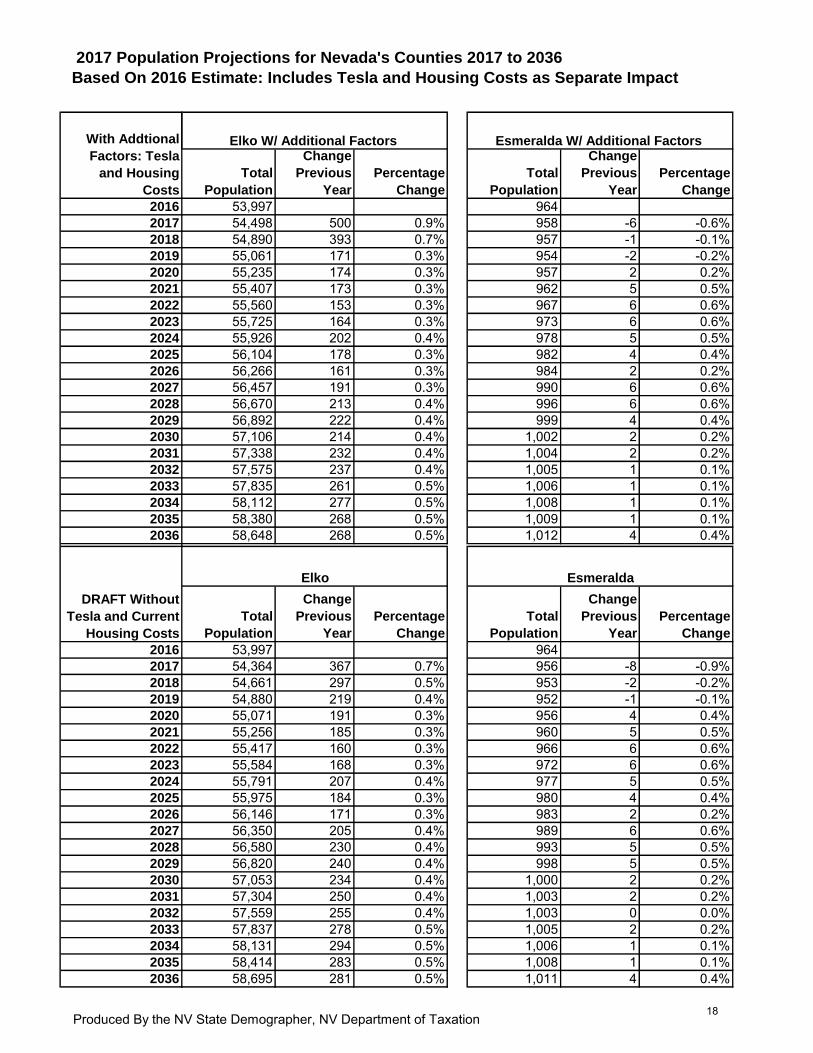
Elko W/ Additional Factors Esmeralda W/ Additional Factors
Elko Esmeralda
Produced By the NV State Demographer, NV Department of Taxation18
2017 Population Projections for Nevada's Counties 2017 to 2036
Based On 2016 Estimate: Includes Tesla and Housing Costs as Separate Impact
2016
2017
2018
2019
2020
2021
2022
2023
2024
2025
2026
2027
2028
2029
2030
2031
2032
2033
2034
2035
2036
2016
2017
2018
2019
2020
2021
2022
2023
2024
2025
2026
2027
2028
2029
2030
2031
2032
2033
2034
2035
2036
With Addtional
Factors: Tesla
and Housing
Costs
DRAFT Without
Tesla and Current
Housing Costs
Total
Population
Change
Previous
Year
Percentage
Change
Total
Population
Change
Previous
Year
Percentage
Change
1,959 16,8531,899 -60 -3.0% 16,885 32 0.2%1,873 -26 -1.4% 16,906 22 0.1%1,927 54 2.9% 16,904 -2 0.0%1,966 39 2.0% 16,909 5 0.0%2,007 40 2.1% 16,929 20 0.1%2,044 37 1.9% 16,944 15 0.1%2,083 38 1.9% 16,971 27 0.2%2,121 38 1.8% 17,002 31 0.2%2,160 39 1.9% 17,029 27 0.2%2,198 37 1.7% 17,051 23 0.1%2,238 40 1.8% 17,082 31 0.2%2,280 41 1.8% 17,116 34 0.2%2,321 41 1.8% 17,149 33 0.2%2,364 43 1.9% 17,185 37 0.2%2,406 42 1.8% 17,229 44 0.3%2,446 39 1.6% 17,275 46 0.3%2,484 38 1.6% 17,329 55 0.3%2,525 41 1.7% 17,388 59 0.3%2,563 37 1.5% 17,446 58 0.3%2,599 37 1.4% 17,510 65 0.4%
Total
Population
Change
Previous
Year
Percentage
Change
Total
Population
Change
Previous
Year
Percentage
Change
1,959 16,8531,982 23 1.2% 16,872 19 0.1%2,006 24 1.2% 16,883 11 0.1%2,032 26 1.3% 16,881 -2 0.0%2,062 31 1.5% 16,885 4 0.0%2,099 37 1.8% 16,900 16 0.1%2,135 37 1.7% 16,910 10 0.1%2,172 37 1.7% 16,931 21 0.1%2,207 36 1.6% 16,956 25 0.1%2,243 36 1.6% 16,978 22 0.1%2,275 32 1.4% 16,998 20 0.1%2,305 31 1.4% 17,027 29 0.2%2,338 33 1.4% 17,059 33 0.2%2,367 29 1.2% 17,091 32 0.2%2,399 32 1.3% 17,128 37 0.2%2,429 31 1.3% 17,173 45 0.3%2,457 28 1.1% 17,219 47 0.3%2,483 26 1.1% 17,275 56 0.3%2,512 29 1.2% 17,335 61 0.4%2,539 27 1.1% 17,394 59 0.3%2,564 25 1.0% 17,460 66 0.4%
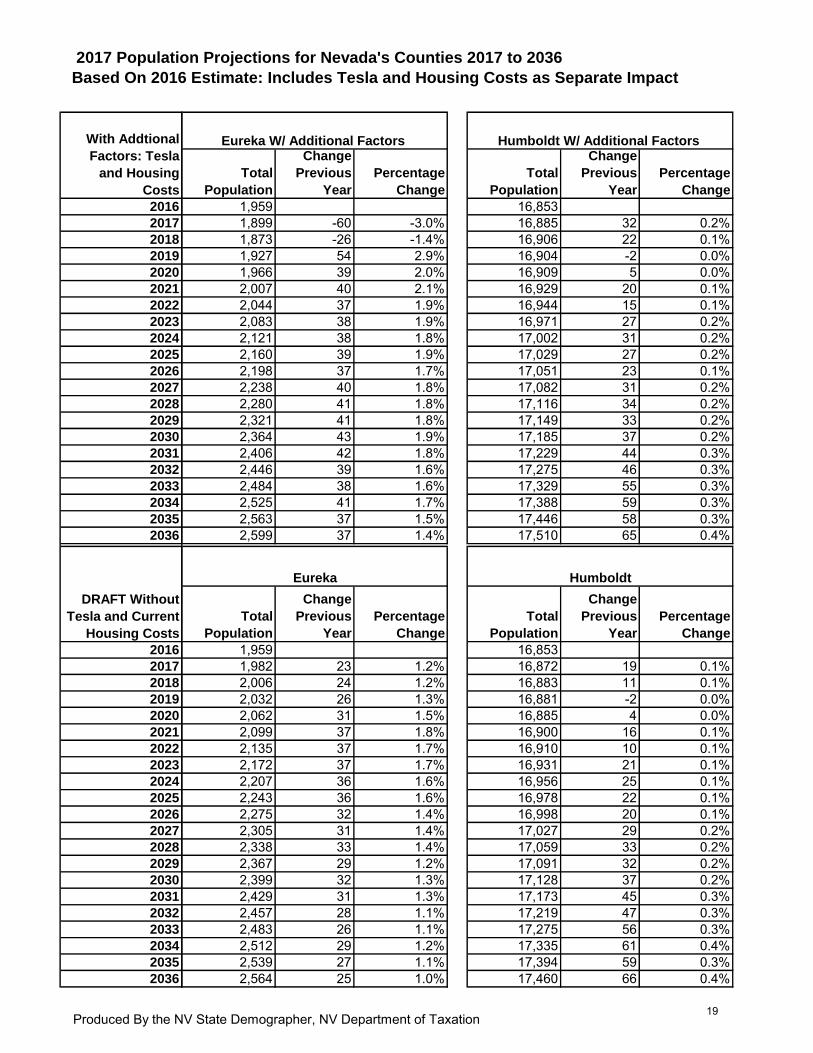
Eureka W/ Additional Factors Humboldt W/ Additional Factors
Eureka Humboldt
Produced By the NV State Demographer, NV Department of Taxation19
2017 Population Projections for Nevada's Counties 2017 to 2036
Based On 2016 Estimate: Includes Tesla and Housing Costs as Separate Impact
2016
2017
2018
2019
2020
2021
2022
2023
2024
2025
2026
2027
2028
2029
2030
2031
2032
2033
2034
2035
2036
2016
2017
2018
2019
2020
2021
2022
2023
2024
2025
2026
2027
2028
2029
2030
2031
2032
2033
2034
2035
2036
With Addtional
Factors: Tesla
and Housing
Costs
DRAFT Without
Tesla and Current
Housing Costs
Total
Population
Change
Previous
Year
Percentage
Change
Total
Population
Change
Previous
Year
Percentage
Change
6,257 5,0576,222 -34 -0.5% 4,995 -62 -1.2%6,194 -28 -0.4% 4,935 -59 -1.2%6,189 -5 -0.1% 4,872 -63 -1.3%6,203 14 0.2% 4,807 -65 -1.3%6,231 28 0.4% 4,741 -66 -1.4%6,259 28 0.4% 4,672 -69 -1.5%6,291 32 0.5% 4,608 -63 -1.4%6,318 27 0.4% 4,546 -62 -1.3%6,339 21 0.3% 4,487 -59 -1.3%6,353 14 0.2% 4,430 -57 -1.3%6,372 19 0.3% 4,379 -51 -1.1%6,399 27 0.4% 4,349 -31 -0.7%6,415 16 0.3% 4,329 -19 -0.4%6,434 18 0.3% 4,316 -13 -0.3%6,457 24 0.4% 4,310 -6 -0.1%6,485 28 0.4% 4,299 -11 -0.3%6,518 33 0.5% 4,281 -17 -0.4%6,556 38 0.6% 4,268 -13 -0.3%6,598 42 0.6% 4,259 -9 -0.2%6,649 51 0.8% 4,249 -10 -0.2%
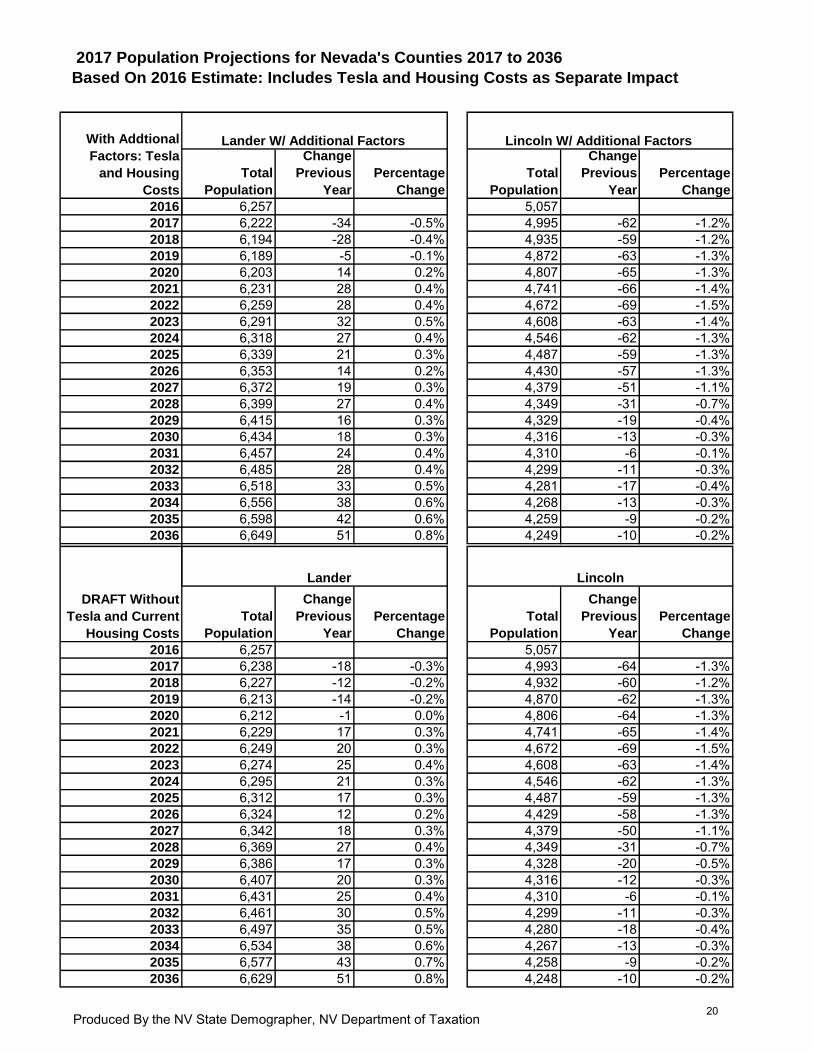
Lander
Total
Population
Change
Previous
Year
Percentage
Change
Total
Population
Change
Previous
Year
Percentage
Change
6,257 5,0576,238 -18 -0.3% 4,993 -64 -1.3%6,227 -12 -0.2% 4,932 -60 -1.2%6,213 -14 -0.2% 4,870 -62 -1.3%6,212 -1 0.0% 4,806 -64 -1.3%6,229 17 0.3% 4,741 -65 -1.4%6,249 20 0.3% 4,672 -69 -1.5%6,274 25 0.4% 4,608 -63 -1.4%6,295 21 0.3% 4,546 -62 -1.3%6,312 17 0.3% 4,487 -59 -1.3%6,324 12 0.2% 4,429 -58 -1.3%6,342 18 0.3% 4,379 -50 -1.1%6,369 27 0.4% 4,349 -31 -0.7%6,386 17 0.3% 4,328 -20 -0.5%6,407 20 0.3% 4,316 -12 -0.3%6,431 25 0.4% 4,310 -6 -0.1%6,461 30 0.5% 4,299 -11 -0.3%6,497 35 0.5% 4,280 -18 -0.4%6,534 38 0.6% 4,267 -13 -0.3%6,577 43 0.7% 4,258 -9 -0.2%6,629 51 0.8% 4,248 -10 -0.2%
Lander W/ Additional Factors Lincoln W/ Additional Factors
Lincoln
Produced By the NV State Demographer, NV Department of Taxation20
2017 Population Projections for Nevada's Counties 2017 to 2036
Based On 2016 Estimate: Includes Tesla and Housing Costs as Separate Impact
2016
2017
2018
2019
2020
2021
2022
2023
2024
2025
2026
2027
2028
2029
2030
2031
2032
2033
2034
2035
2036
2016
2017
2018
2019
2020
2021
2022
2023
2024
2025
2026
2027
2028
2029
2030
2031
2032
2033
2034
2035
2036
With Addtional
Factors: Tesla
and Housing
Costs
DRAFT Without
Tesla and Current
Housing Costs
Total
Population
Change
Previous
Year
Percentage
Change
Total
Population
Change
Previous
Year
Percentage
Change
53,644 4,57854,422 778 1.5% 4,521 -57 -1.3%55,124 702 1.3% 4,466 -54 -1.2%55,540 416 0.8% 4,422 -45 -1.0%55,963 424 0.8% 4,383 -39 -0.9%56,384 421 0.8% 4,349 -34 -0.8%56,781 397 0.7% 4,319 -29 -0.7%57,181 399 0.7% 4,293 -26 -0.6%57,585 404 0.7% 4,274 -20 -0.5%57,878 293 0.5% 4,261 -13 -0.3%58,102 225 0.4% 4,246 -15 -0.3%58,256 153 0.3% 4,233 -14 -0.3%58,366 111 0.2% 4,213 -20 -0.5%58,431 65 0.1% 4,195 -18 -0.4%58,462 30 0.1% 4,178 -18 -0.4%58,470 8 0.0% 4,161 -17 -0.4%58,456 -14 0.0% 4,144 -17 -0.4%58,422 -34 -0.1% 4,128 -17 -0.4%58,365 -57 -0.1% 4,111 -17 -0.4%58,294 -71 -0.1% 4,093 -18 -0.4%58,209 -85 -0.1% 4,072 -21 -0.5%
Total
Population
Change
Previous
Year
Percentage
Change
Total
Population
Change
Previous
Year
Percentage
Change
53,644 4,57853,968 324 0.6% 4,520 -58 -1.3%54,206 238 0.4% 4,464 -55 -1.2%54,362 156 0.3% 4,418 -46 -1.0%54,412 50 0.1% 4,380 -39 -0.9%54,397 -15 0.0% 4,343 -36 -0.8%54,306 -90 -0.2% 4,313 -30 -0.7%54,174 -132 -0.2% 4,286 -27 -0.6%54,006 -168 -0.3% 4,265 -21 -0.5%53,827 -180 -0.3% 4,252 -14 -0.3%53,645 -182 -0.3% 4,236 -16 -0.4%53,445 -200 -0.4% 4,221 -15 -0.3%53,242 -202 -0.4% 4,202 -20 -0.5%53,029 -213 -0.4% 4,183 -19 -0.4%52,811 -218 -0.4% 4,165 -18 -0.4%52,593 -217 -0.4% 4,148 -17 -0.4%52,371 -223 -0.4% 4,131 -18 -0.4%52,136 -235 -0.4% 4,114 -17 -0.4%51,895 -241 -0.5% 4,096 -18 -0.4%51,658 -237 -0.5% 4,079 -18 -0.4%51,438 -220 -0.4% 4,058 -21 -0.5%
Lyon W/ Additional Factors Mineral W/ Additional Factors
Lyon Mineral
Produced By the NV State Demographer, NV Department of Taxation21
2017 Population Projections for Nevada's Counties 2017 to 2036
Based On 2016 Estimate: Includes Tesla and Housing Costs as Separate Impact
2016
2017
2018
2019
2020
2021
2022
2023
2024
2025
2026
2027
2028
2029
2030
2031
2032
2033
2034
2035
2036
2016
2017
2018
2019
2020
2021
2022
2023
2024
2025
2026
2027
2028
2029
2030
2031
2032
2033
2034
2035
2036
With Addtional
Factors: Tesla
and Housing
Costs
DRAFT Without
Tesla and Current
Housing Costs
Total
Population
Change
Previous
Year
Percentage
Change
Total
Population
Change
Previous
Year
Percentage
Change
45,737 6,69346,059 322 0.7% 6,669 -24 -0.4%46,337 278 0.6% 6,639 -29 -0.4%46,503 166 0.4% 6,604 -35 -0.5%46,642 139 0.3% 6,574 -30 -0.5%46,741 99 0.2% 6,553 -20 -0.3%46,801 60 0.1% 6,539 -14 -0.2%46,837 35 0.1% 6,527 -12 -0.2%46,860 24 0.1% 6,518 -9 -0.1%46,888 28 0.1% 6,510 -8 -0.1%46,906 18 0.0% 6,501 -9 -0.1%46,913 6 0.0% 6,497 -4 -0.1%46,896 -17 0.0% 6,495 -2 0.0%46,853 -43 -0.1% 6,491 -3 0.0%46,795 -58 -0.1% 6,488 -3 0.0%46,741 -54 -0.1% 6,491 3 0.0%46,696 -45 -0.1% 6,493 2 0.0%46,670 -26 -0.1% 6,501 7 0.1%46,662 -9 0.0% 6,514 13 0.2%46,662 0 0.0% 6,529 15 0.2%46,677 15 0.0% 6,549 20 0.3%
Total
Population
Change
Previous
Year
Percentage
Change
Total
Population
Change
Previous
Year
Percentage
Change
45,737 6,69345,978 241 0.5% 6,668 -25 -0.4%46,200 222 0.5% 6,636 -31 -0.5%46,403 203 0.4% 6,599 -37 -0.6%46,562 159 0.3% 6,565 -33 -0.5%46,674 112 0.2% 6,542 -23 -0.4%46,742 69 0.1% 6,524 -18 -0.3%46,783 41 0.1% 6,508 -16 -0.2%46,810 27 0.1% 6,493 -14 -0.2%46,840 30 0.1% 6,480 -13 -0.2%46,860 20 0.0% 6,466 -14 -0.2%46,869 9 0.0% 6,458 -8 -0.1%46,853 -16 0.0% 6,452 -6 -0.1%46,811 -42 -0.1% 6,446 -6 -0.1%46,755 -56 -0.1% 6,439 -7 -0.1%46,703 -53 -0.1% 6,439 0 0.0%46,659 -44 -0.1% 6,439 0 0.0%46,635 -24 -0.1% 6,444 5 0.1%46,626 -9 0.0% 6,455 11 0.2%46,629 2 0.0% 6,470 15 0.2%46,644 15 0.0% 6,489 19 0.3%
Nye W/ Additional Factors Pershing W/ Additional Factors
PershingNye
Produced By the NV State Demographer, NV Department of Taxation22

2017 Population Projections for Nevada's Counties 2017 to 2036
Based On 2016 Estimate: Includes Tesla and Housing Costs as Separate Impact
2016
2017
2018
2019
2020
2021
2022
2023
2024
2025
2026
2027
2028
2029
2030
2031
2032
2033
2034
2035
2036
2016
2017
2018
2019
2020
2021
2022
2023
2024
2025
2026
2027
2028
2029
2030
2031
2032
2033
2034
2035
2036
With Addtional
Factors: Tesla
and Housing
Costs
DRAFT Without
Tesla and Current
Housing Costs
Total
Population
Change
Previous
Year
Percentage
Change
Total
Population
Change
Previous
Year
Percentage
Change
4,043 448,3164,115 72 1.8% 453,362 5,046 1.1%4,206 91 2.2% 458,707 5,345 1.2%4,296 89 2.1% 467,846 9,139 2.0%4,382 86 2.0% 475,845 8,000 1.7%4,471 88 2.0% 483,094 7,249 1.5%4,560 89 2.0% 489,576 6,483 1.3%4,655 95 2.1% 495,630 6,054 1.2%4,753 97 2.1% 501,243 5,613 1.1%4,847 94 2.0% 505,849 4,606 0.9%4,945 98 2.0% 509,680 3,831 0.8%5,047 102 2.1% 512,838 3,158 0.6%5,143 95 1.9% 515,450 2,613 0.5%5,225 83 1.6% 517,676 2,225 0.4%5,291 66 1.3% 519,559 1,883 0.4%5,338 47 0.9% 521,226 1,667 0.3%5,372 33 0.6% 522,682 1,457 0.3%5,394 23 0.4% 523,943 1,260 0.2%5,409 15 0.3% 525,093 1,150 0.2%5,419 10 0.2% 526,090 997 0.2%5,424 5 0.1% 526,949 858 0.2%
Total
Population
Change
Previous
Year
Percentage
Change
Total
Population
Change
Previous
Year
Percentage
Change
4,043 448,3164,107 64 1.6% 456,309 7,993 1.8%4,181 74 1.8% 463,723 7,414 1.6%4,244 63 1.5% 470,383 6,660 1.4%4,296 52 1.2% 475,741 5,357 1.1%4,342 46 1.1% 480,237 4,496 0.9%4,380 38 0.9% 483,824 3,587 0.7%4,417 36 0.8% 486,979 3,155 0.7%4,448 31 0.7% 489,697 2,718 0.6%4,474 26 0.6% 492,041 2,345 0.5%4,499 26 0.6% 494,111 2,070 0.4%4,524 25 0.5% 495,924 1,813 0.4%4,540 17 0.4% 497,551 1,627 0.3%4,557 17 0.4% 499,057 1,506 0.3%4,568 11 0.2% 500,418 1,361 0.3%4,577 9 0.2% 501,709 1,291 0.3%4,586 9 0.2% 502,911 1,201 0.2%4,592 6 0.1% 503,995 1,084 0.2%4,595 4 0.1% 505,023 1,028 0.2%4,596 1 0.0% 505,950 927 0.2%4,595 -1 0.0% 506,781 831 0.2%
Storey W/ Additional Factors Washoe W/ Additional Factors
WashoeStorey
Produced By the NV State Demographer, NV Department of Taxation23
2017 Population Projections for Nevada's Counties 2017 to 2036
Based On 2016 Estimate: Includes Tesla and Housing Costs as Separate Impact
2016
2017
2018
2019
2020
2021
2022
2023
2024
2025
2026
2027
2028
2029
2030
2031
2032
2033
2034
2035
2036
2016
2017
2018
2019
2020
2021
2022
2023
2024
2025
2026
2027
2028
2029
2030
2031
2032
2033
2034
2035
2036
With Addtional
Factors: Tesla
and Housing
Costs
DRAFT Without
Tesla and Current
Housing Costs
Total
Population
Change
Previous
Year
Percentage
Change
Total
Population
Change
Previous
Year
Percentage
Change
10,413 2,953,37510,301 -112 -1.1% 2,985,270 31,895 1.1%10,200 -101 -1.0% 3,012,813 27,543 0.9%10,108 -92 -0.9% 3,055,076 42,264 1.4%10,042 -66 -0.7% 3,090,002 34,926 1.1%10,010 -32 -0.3% 3,113,733 23,731 0.8%9,996 -14 -0.1% 3,134,446 20,714 0.7%9,994 -2 0.0% 3,153,400 18,953 0.6%
10,003 10 0.1% 3,170,421 17,021 0.5%10,015 12 0.1% 3,185,910 15,489 0.5%10,022 6 0.1% 3,199,624 13,714 0.4%10,038 16 0.2% 3,211,186 11,561 0.4%10,064 26 0.3% 3,221,572 10,387 0.3%10,090 26 0.3% 3,231,166 9,594 0.3%10,119 29 0.3% 3,240,017 8,851 0.3%10,154 36 0.4% 3,248,315 8,298 0.3%10,191 37 0.4% 3,256,197 7,882 0.2%10,234 43 0.4% 3,263,623 7,426 0.2%10,282 47 0.5% 3,271,333 7,710 0.2%10,326 44 0.4% 3,279,225 7,891 0.2%10,375 49 0.5% 3,287,003 7,778 0.2%
Total
Population
Change
Previous
Year
Percentage
Change
Total
Population
Change
Previous
Year
Percentage
Change
10,413 2,953,37510,304 -109 -1.0% 2,998,103 44,729 1.5%10,205 -99 -1.0% 3,036,134 38,031 1.3%10,111 -94 -0.9% 3,072,848 36,714 1.2%10,045 -66 -0.7% 3,102,330 29,482 1.0%10,012 -33 -0.3% 3,120,711 18,381 0.6%9,997 -15 -0.2% 3,136,101 15,390 0.5%9,993 -4 0.0% 3,149,847 13,746 0.4%
10,001 9 0.1% 3,161,788 11,941 0.4%10,012 11 0.1% 3,173,156 11,368 0.4%10,018 6 0.1% 3,183,531 10,374 0.3%10,035 16 0.2% 3,192,394 8,863 0.3%10,059 25 0.2% 3,200,618 8,224 0.3%10,085 26 0.3% 3,208,424 7,806 0.2%10,114 29 0.3% 3,215,815 7,391 0.2%10,149 35 0.3% 3,222,841 7,026 0.2%10,186 37 0.4% 3,229,666 6,825 0.2%10,229 43 0.4% 3,236,092 6,426 0.2%10,275 46 0.5% 3,242,923 6,831 0.2%10,321 45 0.4% 3,250,102 7,179 0.2%10,369 49 0.5% 3,257,272 7,170 0.2%
White Pine W/ Additional Factors State Total W/ Additional Factors
White Pine State Total
Produced By the NV State Demographer, NV Department of Taxation24
2017 Population Projections for Nevada's Counties 2017 to 2036
Based On 2016 Estimate: Includes Tesla and Housing Costs as Separate Impact
2016
2017
2018
2019
2020
2021
2022
2023
2024
2025
2026
2027
2028
2029
2030
2031
2032
2033
2034
2035
2036
2016
2017
2018
2019
2020
2021
2022
2023
2024
2025
2026
2027
2028
2029
2030
2031
2032
2033
2034
2035
2036
With Addtional
Factors: Tesla
and Housing
Costs
DRAFT Without
Tesla and Current
Housing Costs
Total
Population
Change
Previous
Year
Percentage
Change
609,420616,037 6,617 1.1%622,896 6,858 1.1%633,086 10,190 1.6%642,024 8,938 1.4%650,191 8,167 1.3%657,556 7,365 1.1%664,560 7,004 1.1%671,142 6,582 1.0%676,551 5,409 0.8%681,094 4,543 0.7%684,869 3,775 0.6%688,025 3,156 0.5%690,704 2,679 0.4%692,965 2,261 0.3%694,951 1,986 0.3%696,673 1,722 0.2%698,126 1,452 0.2%699,404 1,278 0.2%700,456 1,052 0.2%701,300 844 0.1%
Total
Population
Change
Previous
Year
Percentage
Change
609,420618,248 8,827 1.4%626,405 8,157 1.3%633,665 7,261 1.2%639,327 5,662 0.9%643,985 4,659 0.7%647,586 3,601 0.6%650,730 3,144 0.5%653,391 2,660 0.4%655,694 2,303 0.4%657,762 2,068 0.3%659,591 1,829 0.3%661,253 1,661 0.3%662,791 1,538 0.2%664,185 1,394 0.2%665,518 1,333 0.2%666,755 1,238 0.2%667,832 1,076 0.2%668,819 988 0.1%669,657 838 0.1%670,364 706 0.1%
Reno Carson City Fernly Combined
Statistical Area W/ Additional Factors
Reno Carson City Fernly Combined
Statistical Area Tesla and Housing Cost
Produced By the NV State Demographer, NV Department of Taxation25


![IS 2036 (1995): Phenolic Laminated Sheets · IS 2036 (1995): Phenolic Laminated Sheets [PCD 12: Plastics] Title: IS 2036 (1995): Phenolic Laminated Sheets Author: Bureau of Indian](https://img.pdfslide.net/doc/110x75/5f0c31707e708231d434331d/is-2036-1995-phenolic-laminated-sheets-is-2036-1995-phenolic-laminated-sheets.jpg)