Embed Size (px)
Citation preview
January, 2014
Dismal snowpack outside USFS Lake Tahoe Mgmt. Unit Office, ~6,300” elev. January 8, 2014
Photo by Brian Hansen, USFS
Nevada Water Supply Outlook Report
For more water supply and resource management information, contact:
Snow Survey Staff, 245 N Jimmy Doolittle Rd, SLC Utah, 84116 - Phone: (801)524-5213 x116 NRCS Nevada, 1365 Corporate Blvd., Reno, NV 89502 – Phone: (775)857-8500 x152 Internet Address: http://www.nrcs.usda.gov/wps/portal/nrcs/main/nv/snow/
Water Supply Outlook Reports Federal - State - Private Cooperative Snow Surveys
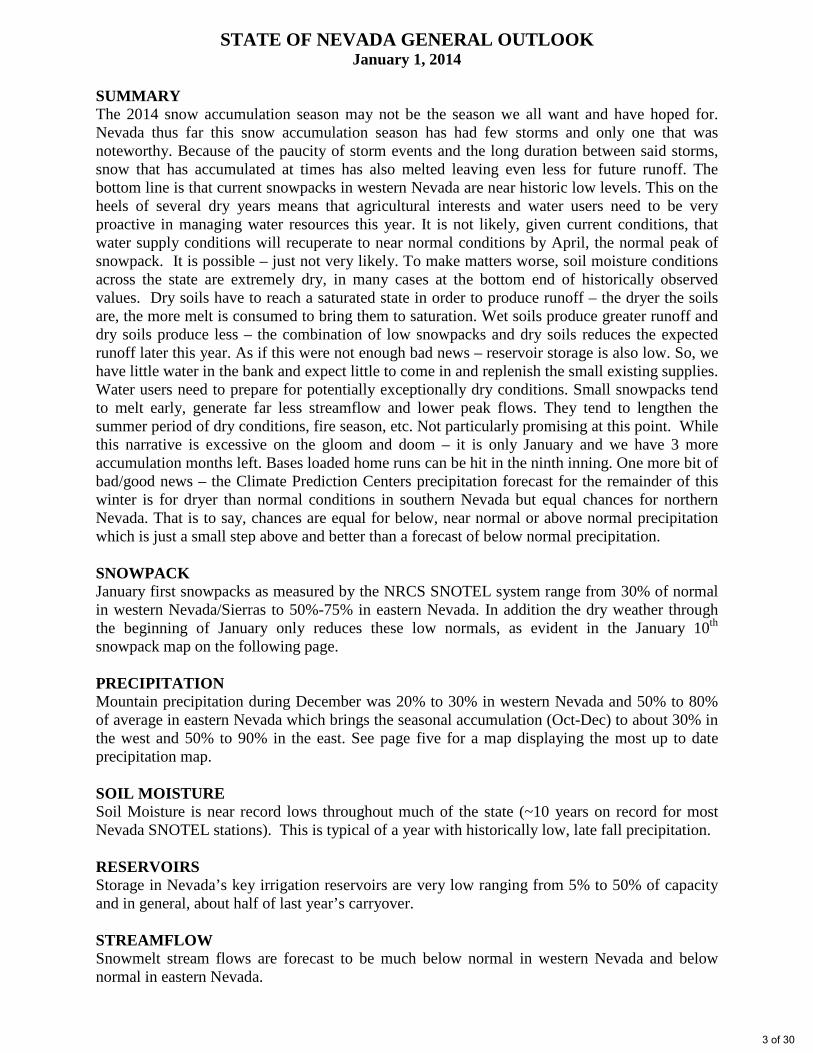
How forecasts are made
Most of the annual streamflow in the western United States originates as snowfall that has accumulated in the mountains during the winter and early spring. As the snowpack accumulates, hydrologists estimate the runoff that will occur when it melts. Measurements of snow water equivalent at selected manual snowcourses and automated SNOTEL sites, along with precipitation, antecedent streamflow, and indices of the El Niño / Southern Oscillation are used in computerized statistical and simulation models to prepare runoff forecasts. These forecasts are coordinated between hydrologists in the Natural Resources Conservation Service and the National Weather Service. Unless otherwise specified, all forecasts are for flows that would occur naturally without any upstream influences.
Forecasts of any kind, of course, are not perfect. Streamflow forecast uncertainty arises from three primary sources: (1) uncertain knowledge of future weather conditions, (2) uncertainty in the forecasting procedure, and (3) errors in the data. The forecast, therefore, must be interpreted not as a single value but rather as a range of values with specific probabilities of occurrence. The middle of the range is expressed by the 50% exceedance probability forecast, for which there is a 50% chance that the actual flow will be above, and a 50% chance that the actual flow will be below, this value. To describe the expected range around this 50% value, four other forecasts are provided, two smaller values (90% and 70% exceedance probability) and two larger values (30%, and 10% exceedance probability). For example, there is a 90% chance that the actual flow will be more than the 90% exceedance probability forecast. The others can be interpreted similarly.
The wider the spread among these values, the more uncertain the forecast. As the season progresses, forecasts become more accurate, primarily because a greater portion of the future weather conditions become known; this is reflected by a narrowing of the range around the 50% exceedance probability forecast. Users should take this uncertainty into consideration when making operational decisions by selecting forecasts corresponding to the level of risk they are willing to assume about the amount of water to be expected. If users anticipate receiving a lesser supply of water, or if they wish to increase their chances of having an adequate supply of water for their operations, they may want to base their decisions on the 90% or 70% exceedance probability forecasts, or something in between. On the other hand, if users are concerned about receiving too much water (for example, threat of flooding), they may want to base their decisions on the 30% or 10% exceedance probability forecasts, or something in between. Regardless of the forecast value users choose for operations, they should be prepared to deal with either more or less water. (Users should remember that even if the 90% exceedance probability forecast is used, there is still a 10% chance of receiving less than this amount.) By using the exceedance probability information, users can easily determine the chances of receiving more or less water.
The U.S. Department of Agriculture (USDA) prohibits discrimination against its customers. If you believe you experienced discrimination when obtaining services from USDA, participating in a USDA program, or participating in a program that receives financial assistance from USDA, you may file a complaint with USDA. Information about how to file a discrimination complaint is available from the Office of the Assistant Secretary for Civil Rights. USDA prohibits discrimination in all its programs and activities on the basis of race, color, national origin, age, disability, and where applicable, sex (including gender identity and expression), marital status, familial status, parental status, religion, sexual orientation, political beliefs, genetic information, reprisal, or because all or part of an individual’s income is derived from any public assistance program. (Not all prohibited bases apply to all programs.) To file a complaint of discrimination, complete, sign, and mail a program discrimination complaint form, available at any USDA office location or online at www.ascr.usda.gov, or write to: USDA Office of the Assistant Secretary for Civil Rights 1400 Independence Avenue, SW. Washington, DC 20250-9410 Or call toll free at (866) 632-9992 (voice) to obtain additional information, the appropriate office or to request documents. Individuals who are deaf, hard of hearing, or have speech disabilities may contact USDA through the Federal Relay service at (800) 877-8339 or (800) 845-6136 (in Spanish). USDA is an equal opportunity provider, employer, and lender. Persons with disabilities who require alternative means for communication of program information (e.g., Braille, large print, audiotape, etc.) should contact USDA's TARGET Center at (202) 720-2600 (voice and TDD).
2 of 30
STATE OF NEVADA GENERAL OUTLOOK January 1, 2014
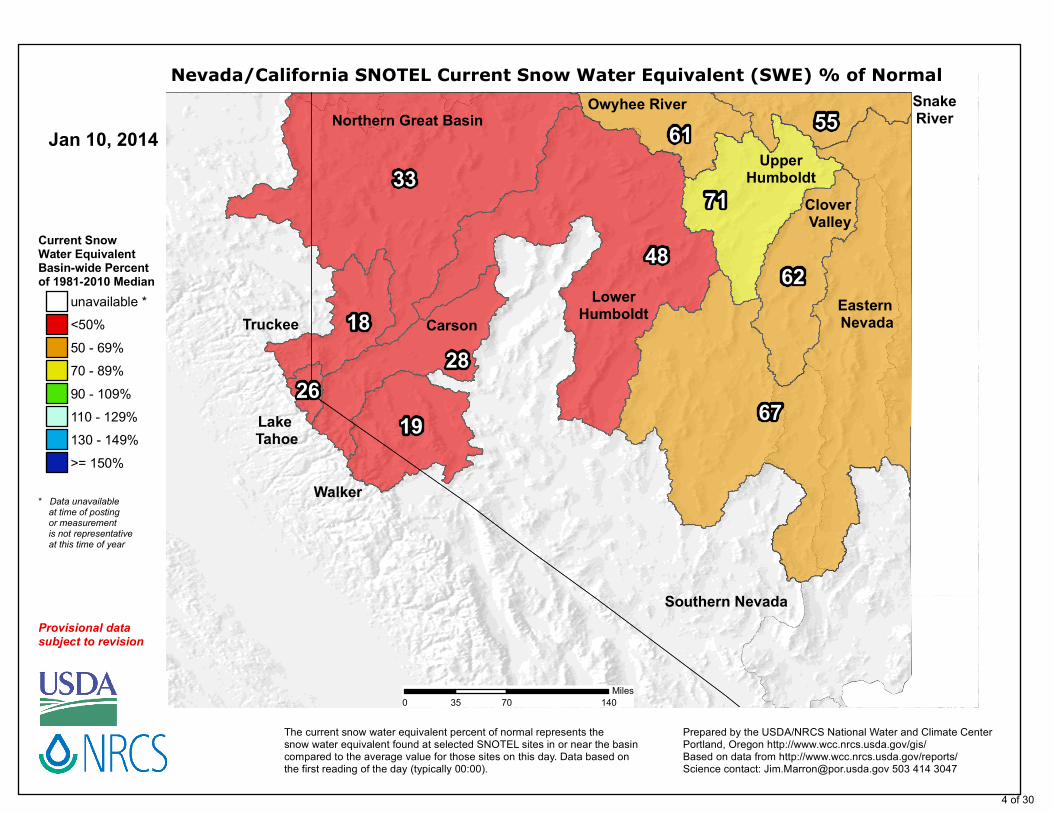
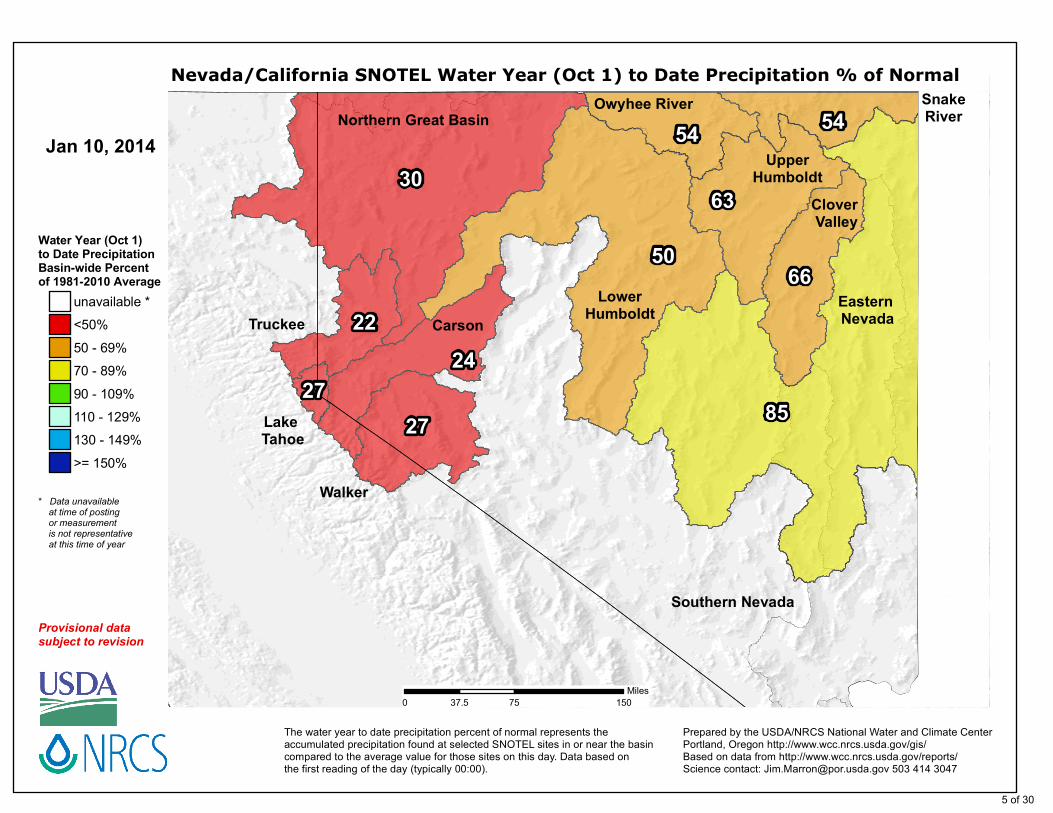
SUMMARY The 2014 snow accumulation season may not be the season we all want and have hoped for. Nevada thus far this snow accumulation season has had few storms and only one that was noteworthy. Because of the paucity of storm events and the long duration between said storms, snow that has accumulated at times has also melted leaving even less for future runoff. The bottom line is that current snowpacks in western Nevada are near historic low levels. This on the heels of several dry years means that agricultural interests and water users need to be very proactive in managing water resources this year. It is not likely, given current conditions, that water supply conditions will recuperate to near normal conditions by April, the normal peak of snowpack. It is possible – just not very likely. To make matters worse, soil moisture conditions across the state are extremely dry, in many cases at the bottom end of historically observed values. Dry soils have to reach a saturated state in order to produce runoff – the dryer the soils are, the more melt is consumed to bring them to saturation. Wet soils produce greater runoff and dry soils produce less – the combination of low snowpacks and dry soils reduces the expected runoff later this year. As if this were not enough bad news – reservoir storage is also low. So, we have little water in the bank and expect little to come in and replenish the small existing supplies. Water users need to prepare for potentially exceptionally dry conditions. Small snowpacks tend to melt early, generate far less streamflow and lower peak flows. They tend to lengthen the summer period of dry conditions, fire season, etc. Not particularly promising at this point. While this narrative is excessive on the gloom and doom – it is only January and we have 3 more accumulation months left. Bases loaded home runs can be hit in the ninth inning. One more bit of bad/good news – the Climate Prediction Centers precipitation forecast for the remainder of this winter is for dryer than normal conditions in southern Nevada but equal chances for northern Nevada. That is to say, chances are equal for below, near normal or above normal precipitation which is just a small step above and better than a forecast of below normal precipitation. SNOWPACK January first snowpacks as measured by the NRCS SNOTEL system range from 30% of normal in western Nevada/Sierras to 50%-75% in eastern Nevada. In addition the dry weather through the beginning of January only reduces these low normals, as evident in the January 10th snowpack map on the following page. PRECIPITATION Mountain precipitation during December was 20% to 30% in western Nevada and 50% to 80% of average in eastern Nevada which brings the seasonal accumulation (Oct-Dec) to about 30% in the west and 50% to 90% in the east. See page five for a map displaying the most up to date precipitation map. SOIL MOISTURE Soil Moisture is near record lows throughout much of the state (~10 years on record for most Nevada SNOTEL stations). This is typical of a year with historically low, late fall precipitation. RESERVOIRS Storage in Nevada’s key irrigation reservoirs are very low ranging from 5% to 50% of capacity and in general, about half of last year’s carryover. STREAMFLOW Snowmelt stream flows are forecast to be much below normal in western Nevada and below normal in eastern Nevada.
3 of 30
Eastern Nevada
Northern Great Basin
Lower Humboldt
Southern Nevada
Walker
Carson
Owyhee River SnakeRiver
Clover Valley
Upper Humboldt
Truckee
Lake Tahoe
67
33
48
71
62
28
19
61
18
55
26
Current Snow Water EquivalentBasin-wide Percent of 1981-2010 Median
unavailable *<50%50 - 69%70 - 89%90 - 109%110 - 129%130 - 149%>= 150%
Prepared by the USDA/NRCS National Water and Climate Center Portland, Oregon http://www.wcc.nrcs.usda.gov/gis/Based on data from http://www.wcc.nrcs.usda.gov/reports/Science contact: [email protected] 503 414 3047
Provisional data subject to revision
Nevada/California SNOTEL Current Snow Water Equivalent (SWE) % of Normal
0 70 14035Miles
* Data unavailable at time of posting or measurement is not representative at this time of year
The current snow water equivalent percent of normal represents the snow water equivalent found at selected SNOTEL sites in or near the basin compared to the average value for those sites on this day. Data based on the first reading of the day (typically 00:00).
Jan 10, 2014
4 of 30
Eastern Nevada
Northern Great Basin
Lower Humboldt
Southern Nevada
Walker
Carson
Owyhee River SnakeRiver
Clover Valley
Upper Humboldt
Truckee
Lake Tahoe
85
30
50
63
66
24
27
54
22
54
27
Water Year (Oct 1)to Date PrecipitationBasin-wide Percent of 1981-2010 Average
unavailable *<50%50 - 69%70 - 89%90 - 109%110 - 129%130 - 149%>= 150%
Prepared by the USDA/NRCS National Water and Climate Center Portland, Oregon http://www.wcc.nrcs.usda.gov/gis/Based on data from http://www.wcc.nrcs.usda.gov/reports/Science contact: [email protected] 503 414 3047
Provisional data subject to revision
Nevada/California SNOTEL Water Year (Oct 1) to Date Precipitation % of Normal
0 75 15037.5Miles
* Data unavailable at time of posting or measurement is not representative at this time of year
The water year to date precipitation percent of normal represents the accumulated precipitation found at selected SNOTEL sites in or near the basin compared to the average value for those sites on this day. Data based on the first reading of the day (typically 00:00).
Jan 10, 2014
5 of 30
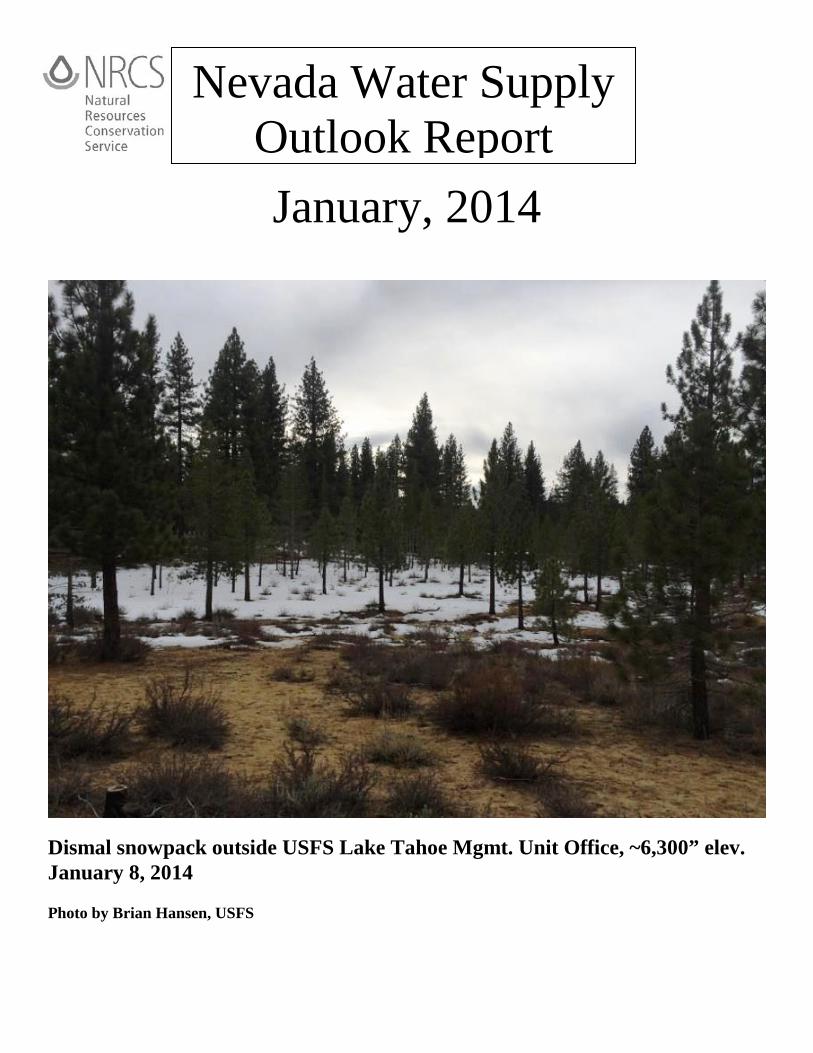
Carson River Basin
June
July
August
September
Current Forecasts
10309000103100001031100010336715103111001031200010311200
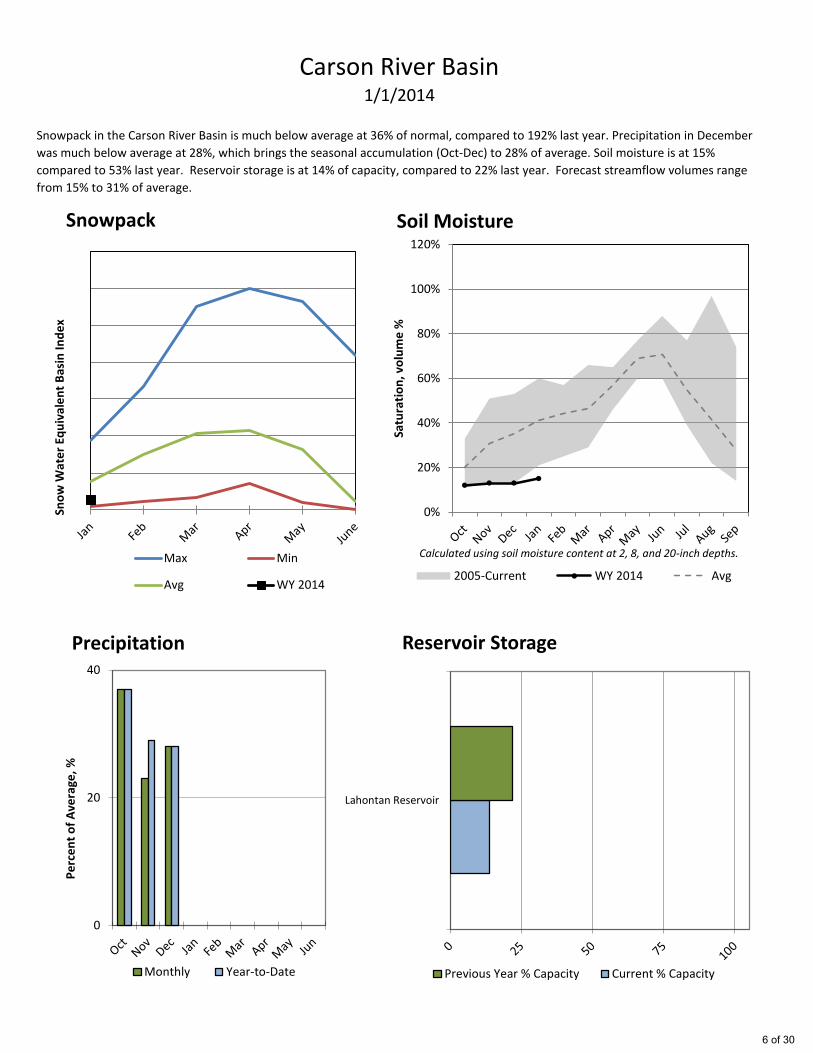
Snowpack in the Carson River Basin is much below average at 36% of normal, compared to 192% last year. Precipitation in December
was much below average at 28%, which brings the seasonal accumulation (Oct-Dec) to 28% of average. Soil moisture is at 15%
compared to 53% last year. Reservoir storage is at 14% of capacity, compared to 22% last year. Forecast streamflow volumes range
from 15% to 31% of average.
1/1/2014
Lahontan Reservoir
Reservoir Storage
Previous Year % Capacity Current % Capacity
0
20
40
Pe
rce
nt
of
Ave
rage
, %
Precipitation
Monthly Year-to-Date
Sno
w W
ate
r Eq
uiv
ale
nt
Bas
in In
de
x
Snowpack
Max Min
Avg WY 2014
0%
20%
40%
60%
80%
100%
120%
Satu
rati
on
, vo
lum
e %
Soil Moisture
2005-Current WY 2014 Avg
Calculated using soil moisture content at 2, 8, and 20-inch depths.
6 of 30
Data Current as of: 1/8/2014 8:37:23 AMCarson River
Streamflow Forecasts - January 1, 2014
Forecast Exceedance Probabilities for Risk AssessmentChance that actual volume will exceed forecast
Carson River Forecast Period
90%(KAF)
70%(KAF)
50%(KAF) % Avg 30%
(KAF)10%
(KAF)30yr Avg
(KAF)
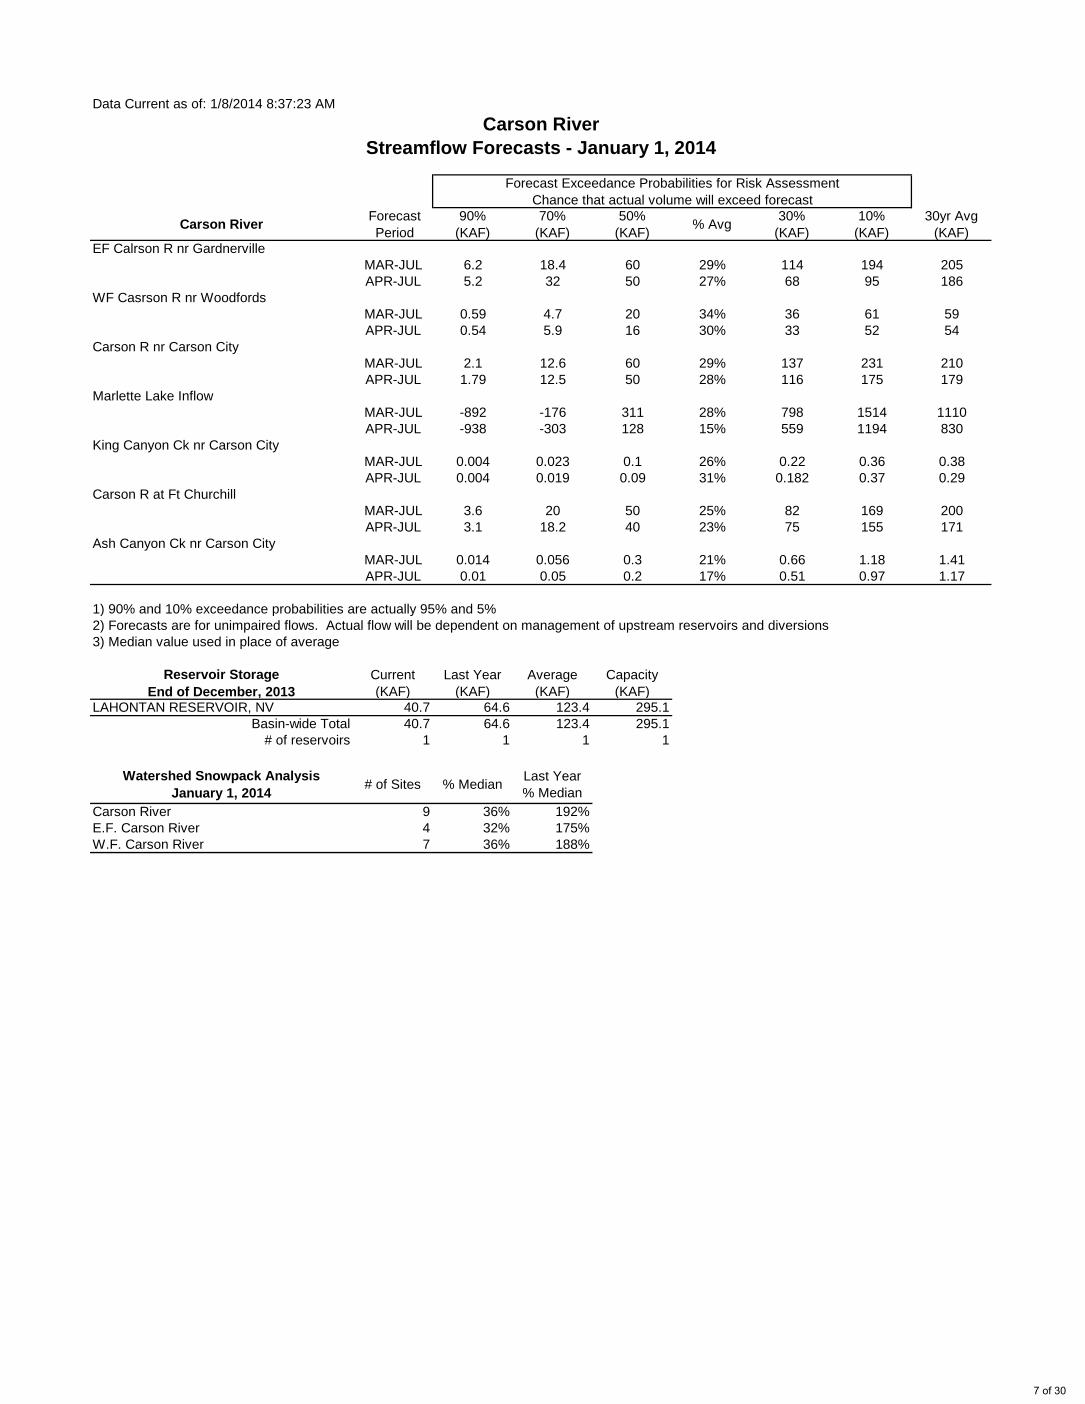
MAR-JUL 6.2 18.4 60 29% 114 194 205APR-JUL 5.2 32 50 27% 68 95 186
MAR-JUL 0.59 4.7 20 34% 36 61 59APR-JUL 0.54 5.9 16 30% 33 52 54
MAR-JUL 2.1 12.6 60 29% 137 231 210APR-JUL 1.79 12.5 50 28% 116 175 179
MAR-JUL -892 -176 311 28% 798 1514 1110APR-JUL -938 -303 128 15% 559 1194 830
MAR-JUL 0.004 0.023 0.1 26% 0.22 0.36 0.38APR-JUL 0.004 0.019 0.09 31% 0.182 0.37 0.29
MAR-JUL 3.6 20 50 25% 82 169 200APR-JUL 3.1 18.2 40 23% 75 155 171
MAR-JUL 0.014 0.056 0.3 21% 0.66 1.18 1.41APR-JUL 0.01 0.05 0.2 17% 0.51 0.97 1.17
1) 90% and 10% exceedance probabilities are actually 95% and 5%2) Forecasts are for unimpaired flows. Actual flow will be dependent on management of upstream reservoirs and diversions3) Median value used in place of average
Reservoir StorageEnd of December, 2013
Current(KAF)
Last Year(KAF)
Average(KAF)
Capacity(KAF)
LAHONTAN RESERVOIR, NV 40.7 64.6 123.4 295.1Basin-wide Total 40.7 64.6 123.4 295.1
# of reservoirs 1 1 1 1
Watershed Snowpack AnalysisJanuary 1, 2014 # of Sites % Median Last Year
% MedianCarson River 9 36% 192%E.F. Carson River 4 32% 175%W.F. Carson River 7 36% 188%
Ash Canyon Ck nr Carson City
EF Calrson R nr Gardnerville
WF Casrson R nr Woodfords
Carson R nr Carson City
Marlette Lake Inflow
King Canyon Ck nr Carson City
Carson R at Ft Churchill
7 of 30
Clover Valley & Franklin River Basin
June
July
August
September
Current Forecasts
10244720
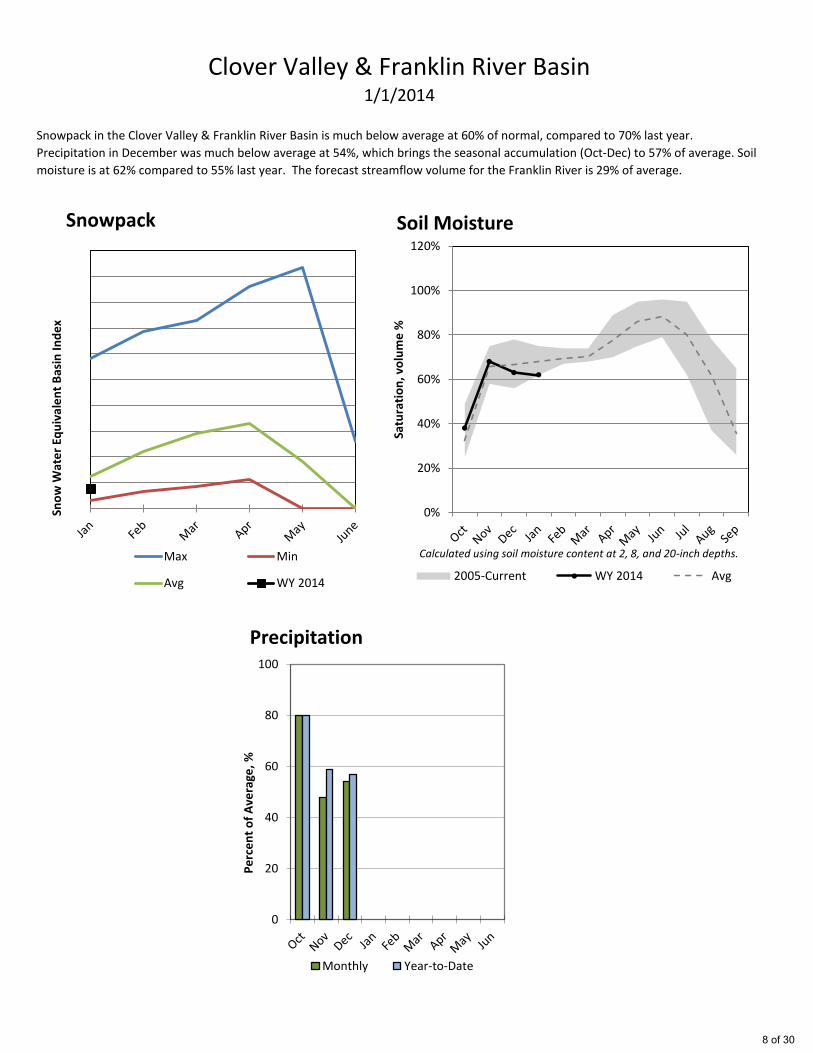
Snowpack in the Clover Valley & Franklin River Basin is much below average at 60% of normal, compared to 70% last year.
Precipitation in December was much below average at 54%, which brings the seasonal accumulation (Oct-Dec) to 57% of average. Soil
moisture is at 62% compared to 55% last year. The forecast streamflow volume for the Franklin River is 29% of average.
1/1/2014
0
20
40
60
80
100
Pe
rce
nt
of
Ave
rage
, %
Precipitation
Monthly Year-to-Date
Sno
w W
ate
r Eq
uiv
ale
nt
Bas
in In
de
x
Snowpack
Max Min
Avg WY 2014
0%
20%
40%
60%
80%
100%
120%
Satu
rati
on
, vo
lum
e %
Soil Moisture
2005-Current WY 2014 Avg
Calculated using soil moisture content at 2, 8, and 20-inch depths.
8 of 30
Data Current as of: 1/8/2014 8:37:33 AM
Clover Valley & Franklin River
Streamflow Forecasts - January 1, 2014
Forecast Exceedance Probabilities for Risk AssessmentChance that actual volume will exceed forecast
Clover Valley & Franklin River Forecast Period
90%(KAF)
70%(KAF)
50%(KAF) % Avg 30%
(KAF)10%
(KAF)30yr Avg
(KAF)
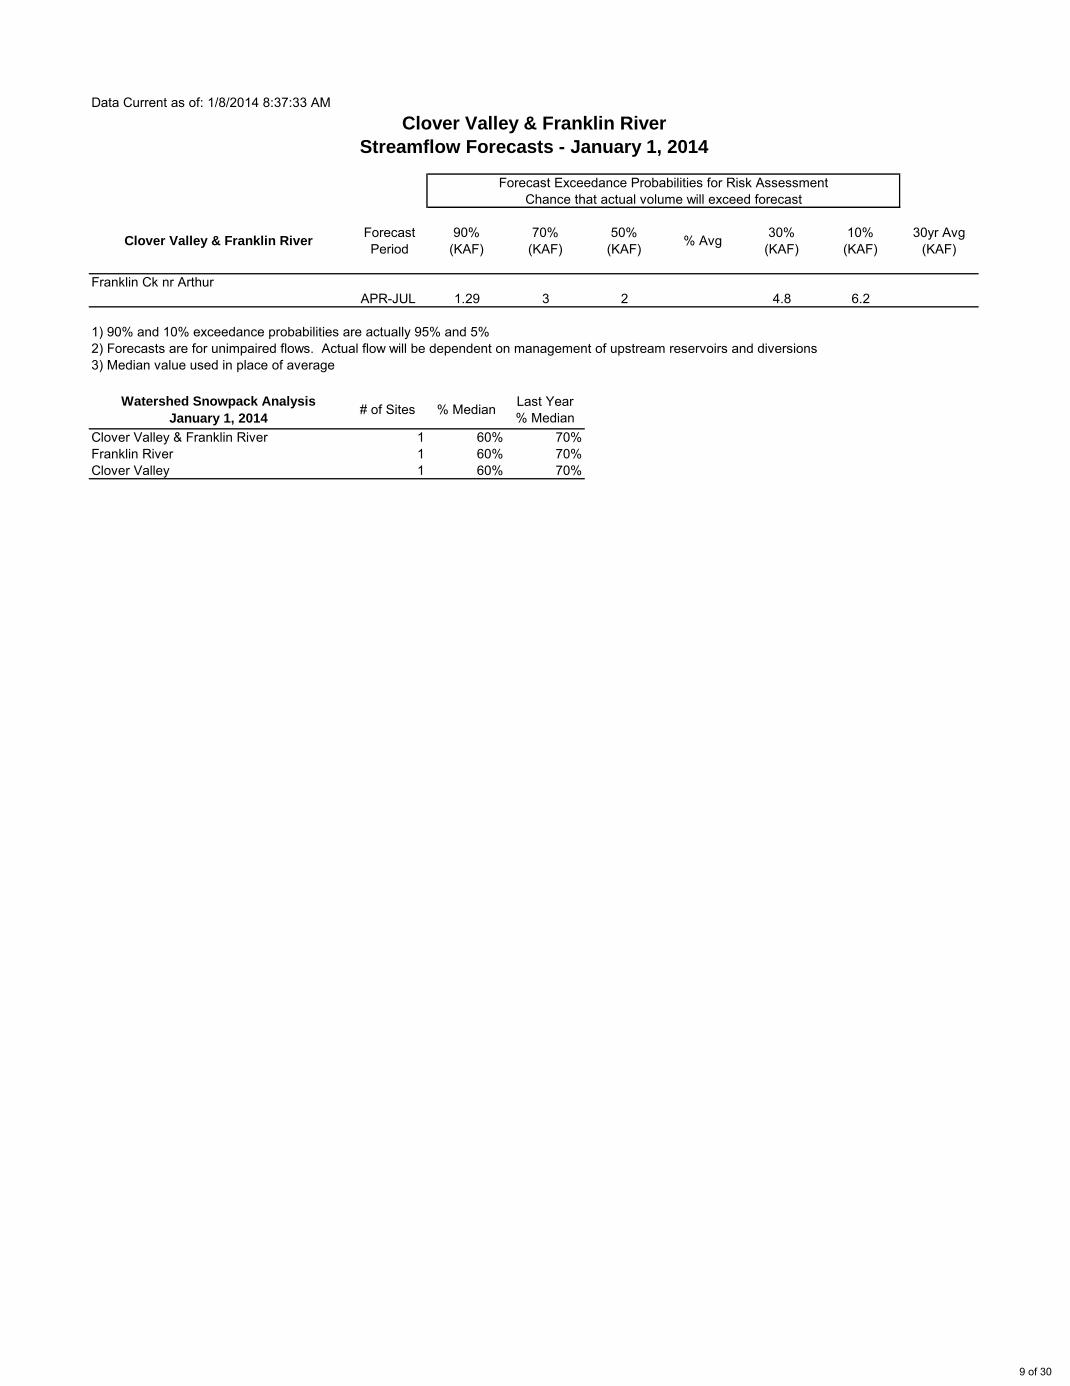
APR-JUL 1.29 3 2 4.8 6.2
1) 90% and 10% exceedance probabilities are actually 95% and 5%2) Forecasts are for unimpaired flows. Actual flow will be dependent on management of upstream reservoirs and diversions3) Median value used in place of average
Watershed Snowpack Analysis
January 1, 2014# of Sites % Median Last Year
% MedianClover Valley & Franklin River 1 60% 70%Franklin River 1 60% 70%Clover Valley 1 60% 70%
Franklin Ck nr Arthur
9 of 30
Eastern Nevada Basin
June
July
August
September
Current Forecasts
10249280102432601024370010244950
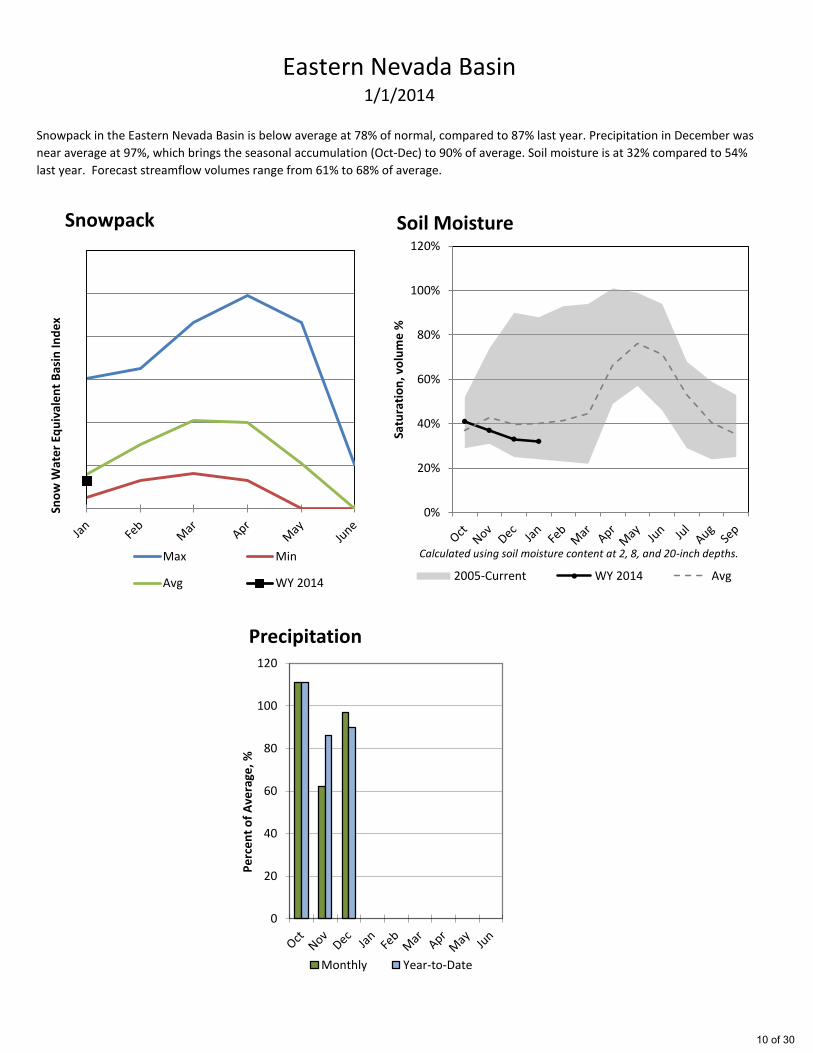
Snowpack in the Eastern Nevada Basin is below average at 78% of normal, compared to 87% last year. Precipitation in December was
near average at 97%, which brings the seasonal accumulation (Oct-Dec) to 90% of average. Soil moisture is at 32% compared to 54%
last year. Forecast streamflow volumes range from 61% to 68% of average.
1/1/2014
0
20
40
60
80
100
120
Pe
rce
nt
of
Ave
rage
, %
Precipitation
Monthly Year-to-Date
Sno
w W
ate
r Eq
uiv
ale
nt
Bas
in In
de
x
Snowpack
Max Min
Avg WY 2014
0%
20%
40%
60%
80%
100%
120%
Satu
rati
on
, vo
lum
e %
Soil Moisture
2005-Current WY 2014 Avg
Calculated using soil moisture content at 2, 8, and 20-inch depths.
10 of 30
Data Current as of: 1/8/2014 8:37:38 AM
Eastern Nevada
Streamflow Forecasts - January 1, 2014
Forecast Exceedance Probabilities for Risk AssessmentChance that actual volume will exceed forecast
Eastern Nevada Forecast Period
90%(KAF)
70%(KAF)
50%(KAF) % Avg 30%
(KAF)10%
(KAF)30yr Avg
(KAF)
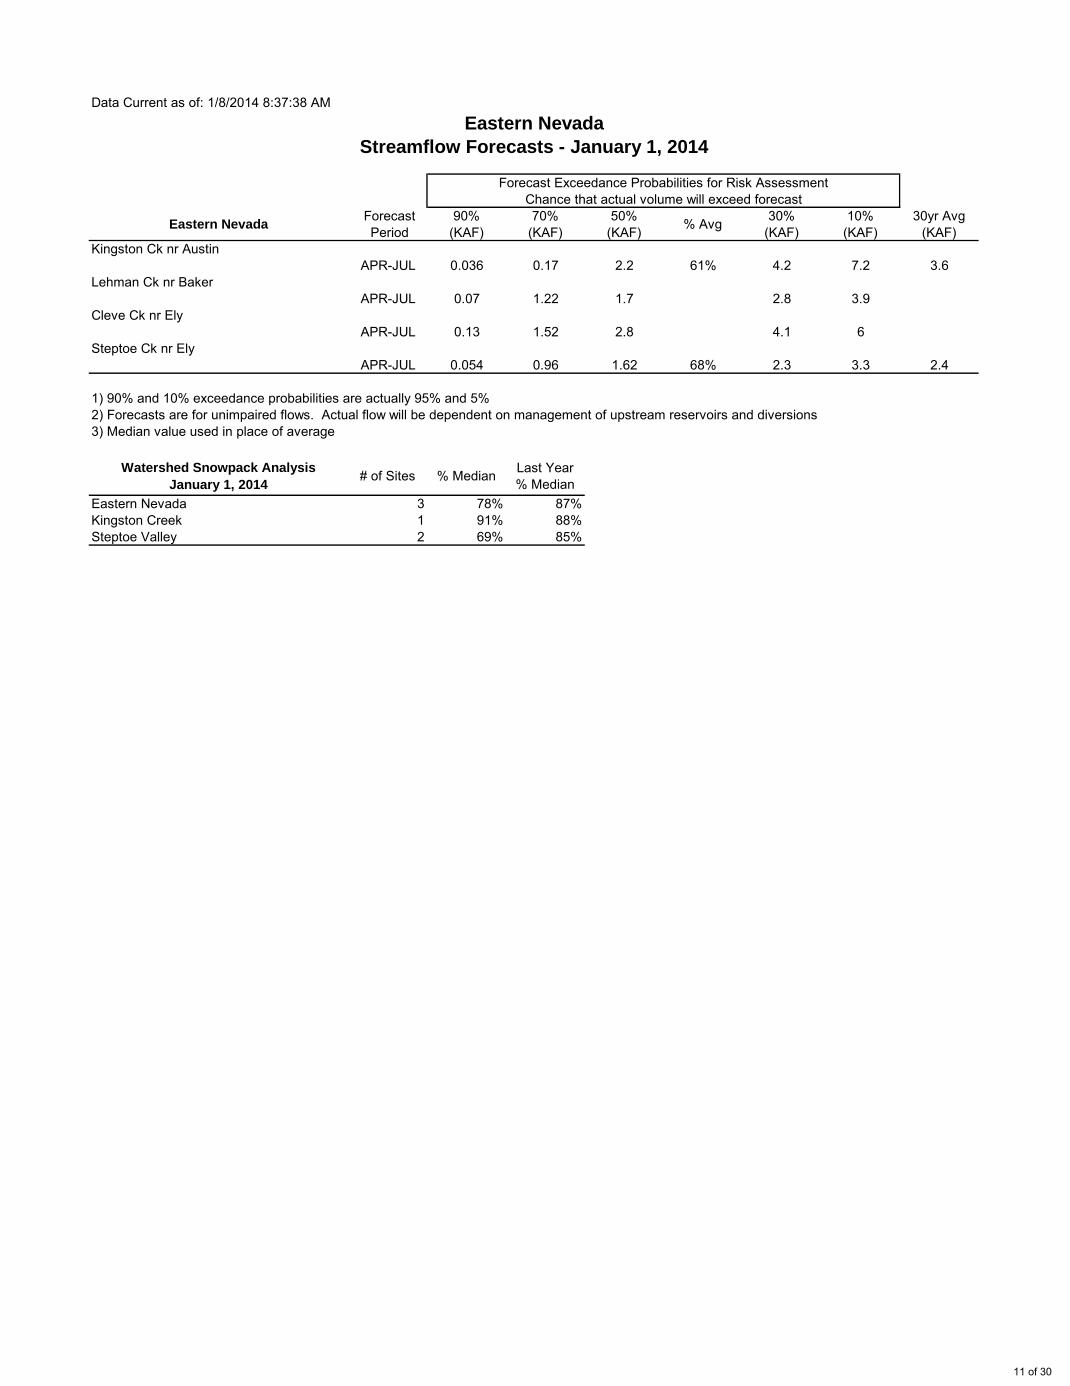
APR-JUL 0.036 0.17 2.2 61% 4.2 7.2 3.6
APR-JUL 0.07 1.22 1.7 2.8 3.9
APR-JUL 0.13 1.52 2.8 4.1 6
APR-JUL 0.054 0.96 1.62 68% 2.3 3.3 2.4
1) 90% and 10% exceedance probabilities are actually 95% and 5%2) Forecasts are for unimpaired flows. Actual flow will be dependent on management of upstream reservoirs and diversions3) Median value used in place of average
Watershed Snowpack Analysis
January 1, 2014# of Sites % Median Last Year
% MedianEastern Nevada 3 78% 87%Kingston Creek 1 91% 88%Steptoe Valley 2 69% 85%
Kingston Ck nr Austin
Lehman Ck nr Baker
Cleve Ck nr Ely
Steptoe Ck nr Ely
11 of 30
Lake Tahoe Basin
June
July
August
September
Current Forecasts
1033671510337000
1/1/2014
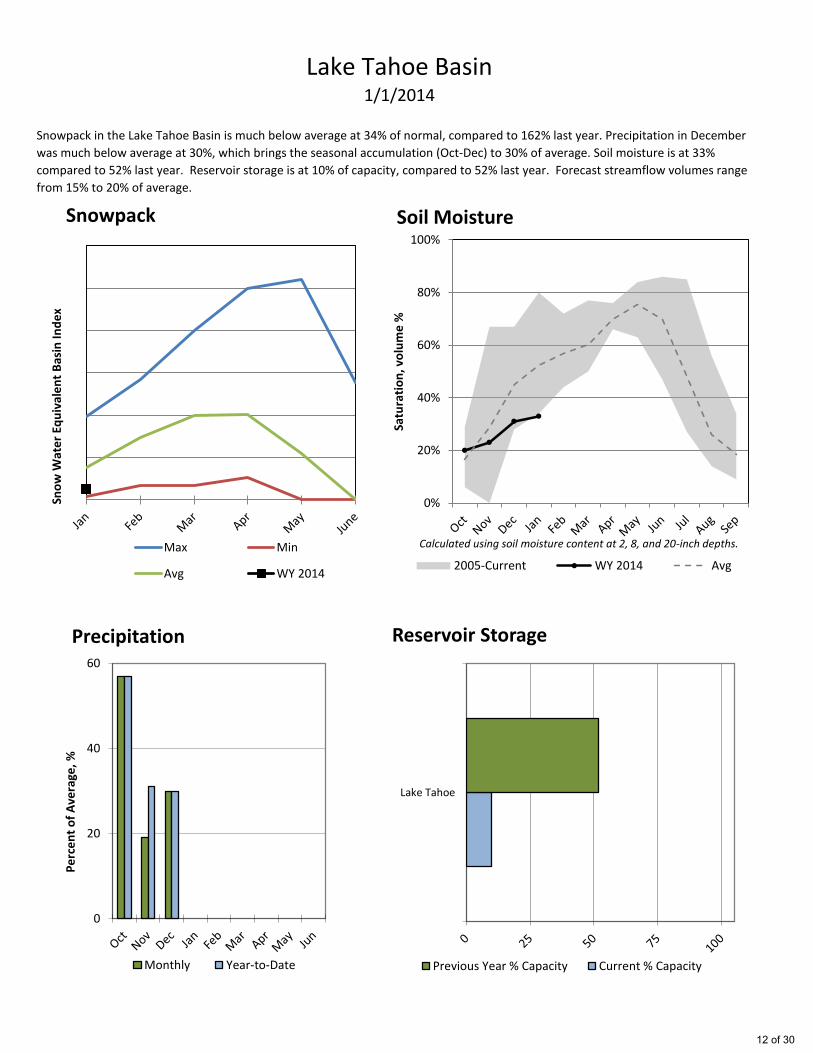
Snowpack in the Lake Tahoe Basin is much below average at 34% of normal, compared to 162% last year. Precipitation in December
was much below average at 30%, which brings the seasonal accumulation (Oct-Dec) to 30% of average. Soil moisture is at 33%
compared to 52% last year. Reservoir storage is at 10% of capacity, compared to 52% last year. Forecast streamflow volumes range
from 15% to 20% of average.
Previous Year % Capacity Current % Capacity
Lake Tahoe
Reservoir Storage
Previous Year % Capacity Current % Capacity
0
20
40
60
Pe
rce
nt
of
Ave
rage
, %
Precipitation
Monthly Year-to-Date
Sno
w W
ate
r Eq
uiv
ale
nt
Bas
in In
de
x
Snowpack
Max Min
Avg WY 2014
0%
20%
40%
60%
80%
100%
Satu
rati
on
, vo
lum
e %
Soil Moisture
2005-Current WY 2014 Avg
Calculated using soil moisture content at 2, 8, and 20-inch depths.
12 of 30
Data Current as of: 1/8/2014 8:37:19 AMLake Tahoe
Streamflow Forecasts - January 1, 2014Forecast Exceedance Probabilities for Risk Assessment
Chance that actual volume will exceed forecast
Lake Tahoe Forecast Period
90%(KAF)
70%(KAF)
50%(KAF) % Avg 30%
(KAF)10%
(KAF)30yr Avg
(KAF)
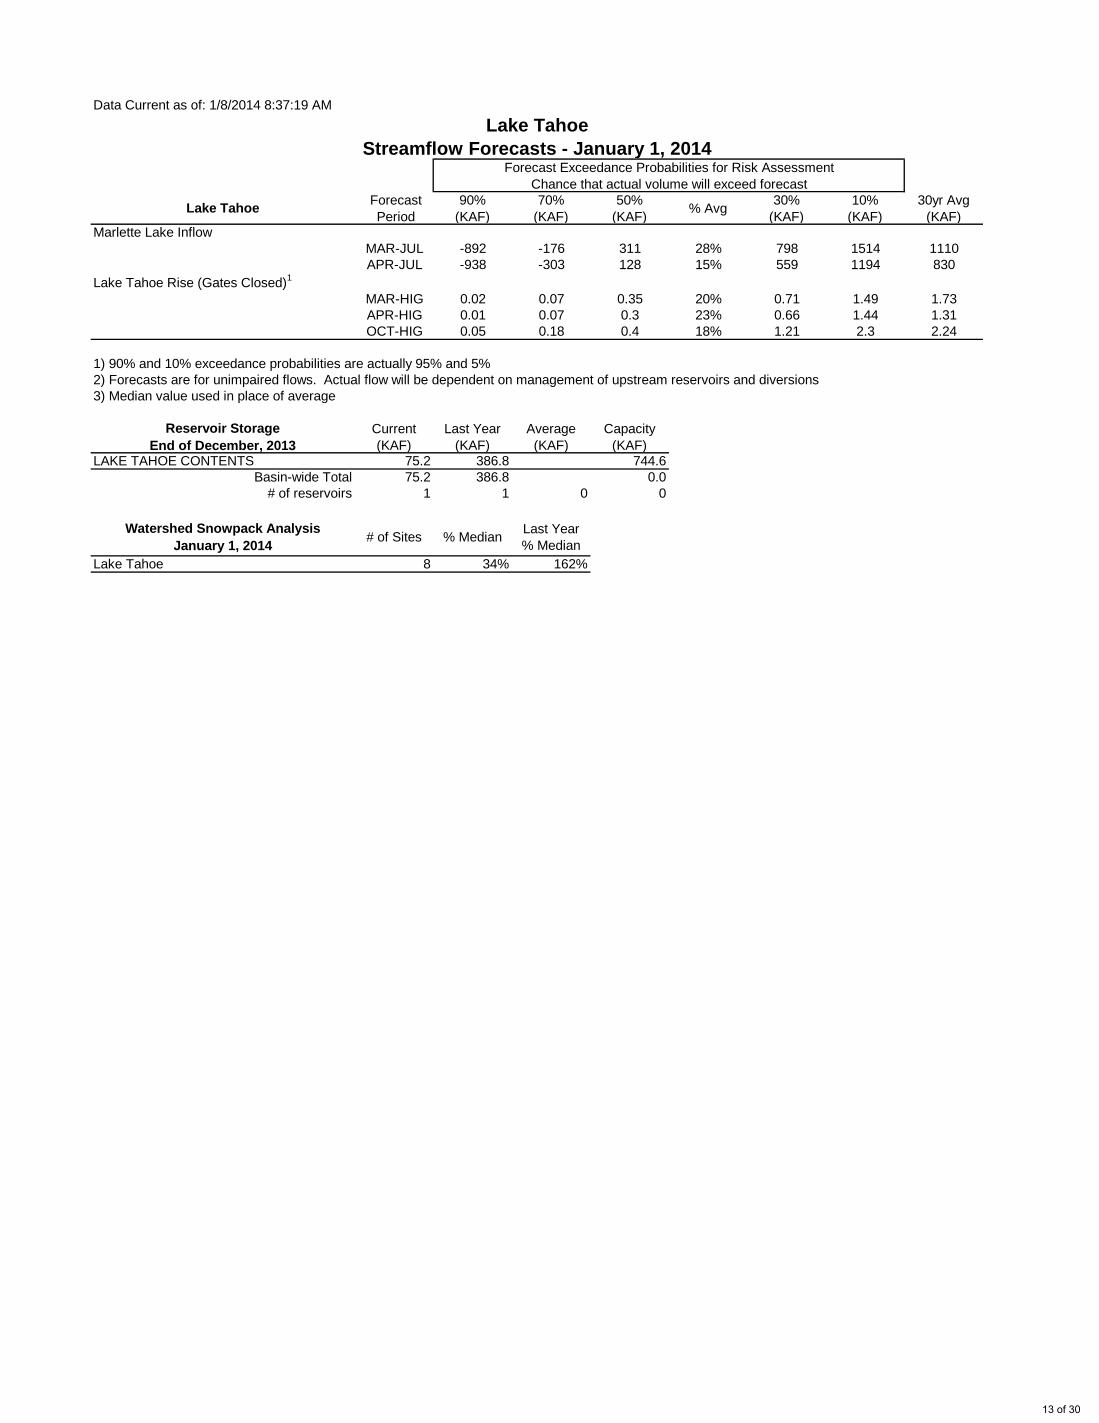
MAR-JUL -892 -176 311 28% 798 1514 1110APR-JUL -938 -303 128 15% 559 1194 830
MAR-HIG 0.02 0.07 0.35 20% 0.71 1.49 1.73APR-HIG 0.01 0.07 0.3 23% 0.66 1.44 1.31OCT-HIG 0.05 0.18 0.4 18% 1.21 2.3 2.24
1) 90% and 10% exceedance probabilities are actually 95% and 5%2) Forecasts are for unimpaired flows. Actual flow will be dependent on management of upstream reservoirs and diversions3) Median value used in place of average
Reservoir StorageEnd of December, 2013
Current(KAF)
Last Year(KAF)
Average(KAF)
Capacity(KAF)
LAKE TAHOE CONTENTS 75.2 386.8 744.6Basin-wide Total 75.2 386.8 0.0
# of reservoirs 1 1 0 0
Watershed Snowpack AnalysisJanuary 1, 2014 # of Sites % Median Last Year
% MedianLake Tahoe 8 34% 162%
Marlette Lake Inflow
Lake Tahoe Rise (Gates Closed)1
13 of 30
Lower Colorado River Basin
June
July
August
September
Current Forecasts
094150000937990009408150
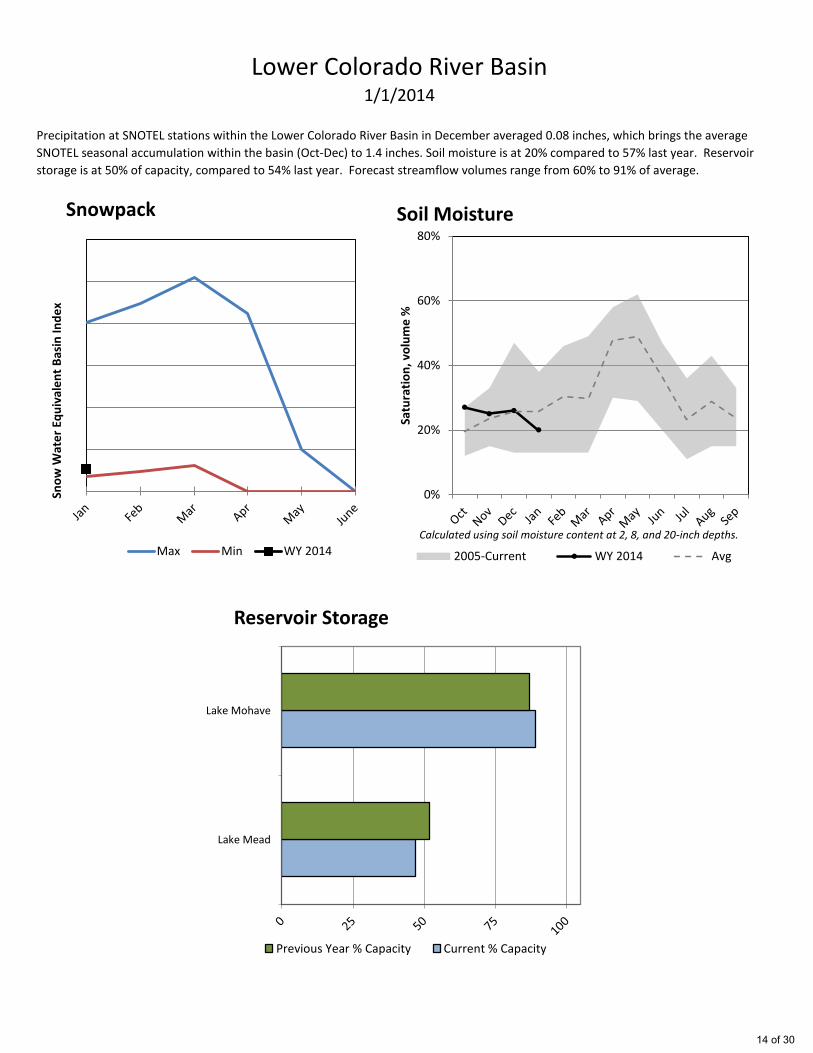
Precipitation at SNOTEL stations within the Lower Colorado River Basin in December averaged 0.08 inches, which brings the average
SNOTEL seasonal accumulation within the basin (Oct-Dec) to 1.4 inches. Soil moisture is at 20% compared to 57% last year. Reservoir
storage is at 50% of capacity, compared to 54% last year. Forecast streamflow volumes range from 60% to 91% of average.
1/1/2014
Lake Mead
Lake Mohave
Reservoir Storage
Previous Year % Capacity Current % Capacity
Sno
w W
ate
r Eq
uiv
ale
nt
Bas
in In
de
x
Snowpack
Max Min WY 2014
0%
20%
40%
60%
80%
Satu
rati
on
, vo
lum
e %
Soil Moisture
2005-Current WY 2014 Avg
Calculated using soil moisture content at 2, 8, and 20-inch depths.
14 of 30
Data Current as of: 1/8/2014 8:37:40 AMLower Colorado River Basin
Streamflow Forecasts - January 1, 2014
Forecast Exceedance Probabilities for Risk AssessmentChance that actual volume will exceed forecast
Lower Colorado River Basin Forecast Period
90%(KAF)
70%(KAF)
50%(KAF) % Avg 30%
(KAF)10%
(KAF)30yr Avg
(KAF)
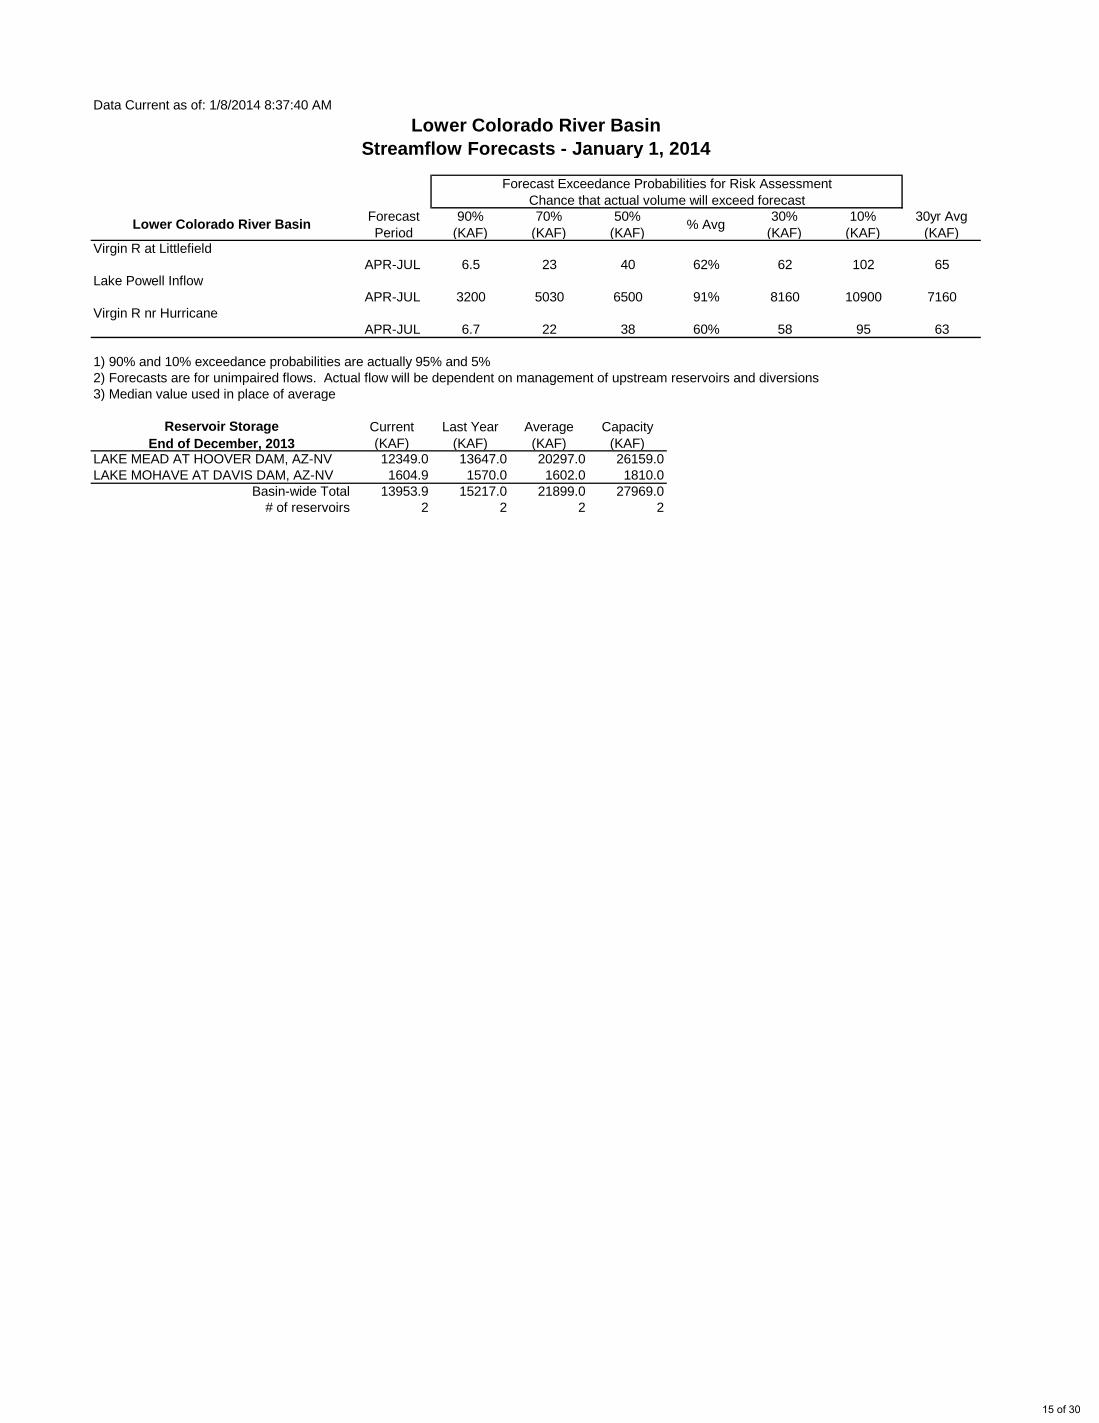
APR-JUL 6.5 23 40 62% 62 102 65
APR-JUL 3200 5030 6500 91% 8160 10900 7160
APR-JUL 6.7 22 38 60% 58 95 63
1) 90% and 10% exceedance probabilities are actually 95% and 5%2) Forecasts are for unimpaired flows. Actual flow will be dependent on management of upstream reservoirs and diversions3) Median value used in place of average
Reservoir StorageEnd of December, 2013
Current(KAF)
Last Year(KAF)
Average(KAF)
Capacity(KAF)
LAKE MEAD AT HOOVER DAM, AZ-NV 12349.0 13647.0 20297.0 26159.0LAKE MOHAVE AT DAVIS DAM, AZ-NV 1604.9 1570.0 1602.0 1810.0
Basin-wide Total 13953.9 15217.0 21899.0 27969.0# of reservoirs 2 2 2 2
Virgin R at Littlefield
Lake Powell Inflow
Virgin R nr Hurricane
15 of 30
Lower Humboldt River Basin
June
July
August
September
Current Forecasts
1032450010327500103290001032950010333000
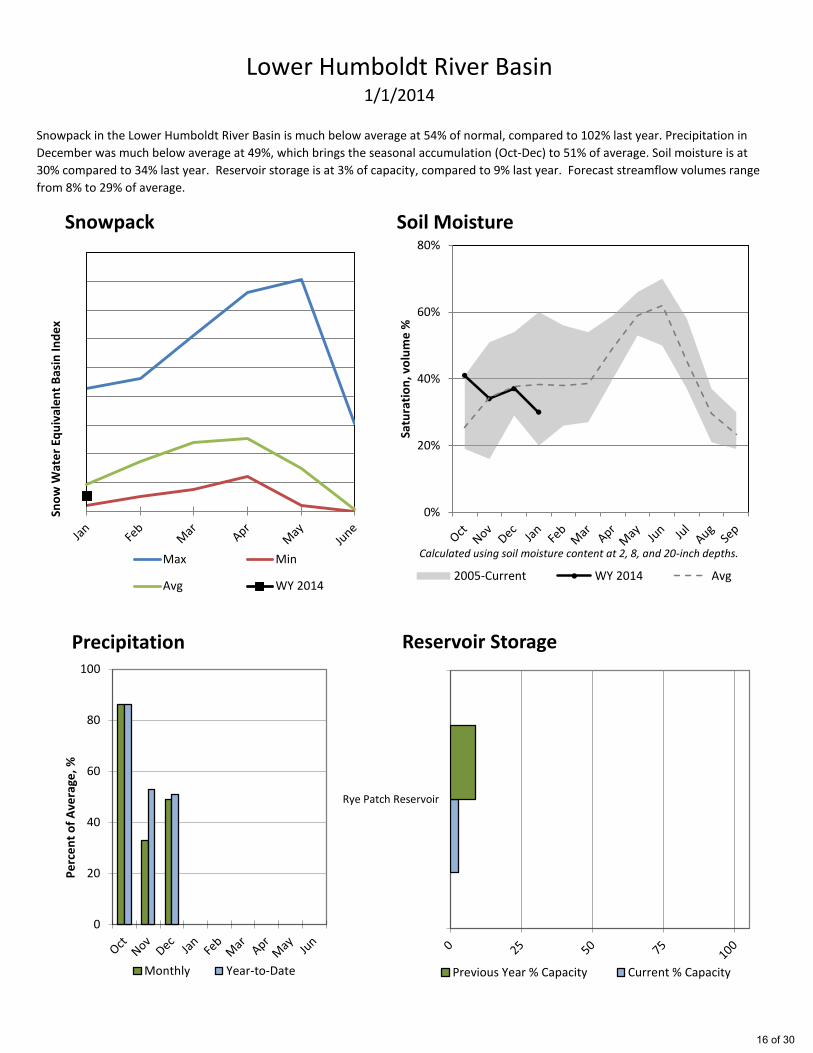
Snowpack in the Lower Humboldt River Basin is much below average at 54% of normal, compared to 102% last year. Precipitation in
December was much below average at 49%, which brings the seasonal accumulation (Oct-Dec) to 51% of average. Soil moisture is at
30% compared to 34% last year. Reservoir storage is at 3% of capacity, compared to 9% last year. Forecast streamflow volumes range
from 8% to 29% of average.
1/1/2014
Rye Patch Reservoir
Reservoir Storage
Previous Year % Capacity Current % Capacity
0
20
40
60
80
100
Pe
rce
nt
of
Ave
rage
, %
Precipitation
Monthly Year-to-Date
Sno
w W
ate
r Eq
uiv
ale
nt
Bas
in In
de
x
Snowpack
Max Min
Avg WY 2014
0%
20%
40%
60%
80%
Satu
rati
on
, vo
lum
e %
Soil Moisture
2005-Current WY 2014 Avg
Calculated using soil moisture content at 2, 8, and 20-inch depths.
16 of 30
Data Current as of: 1/8/2014 8:37:31 AMLower Humboldt River
Streamflow Forecasts - January 1, 2014
Forecast Exceedance Probabilities for Risk AssessmentChance that actual volume will exceed forecast
Lower Humboldt River Forecast Period
90%(KAF)
70%(KAF)
50%(KAF) % Avg 30%
(KAF)10%
(KAF)30yr Avg
(KAF)
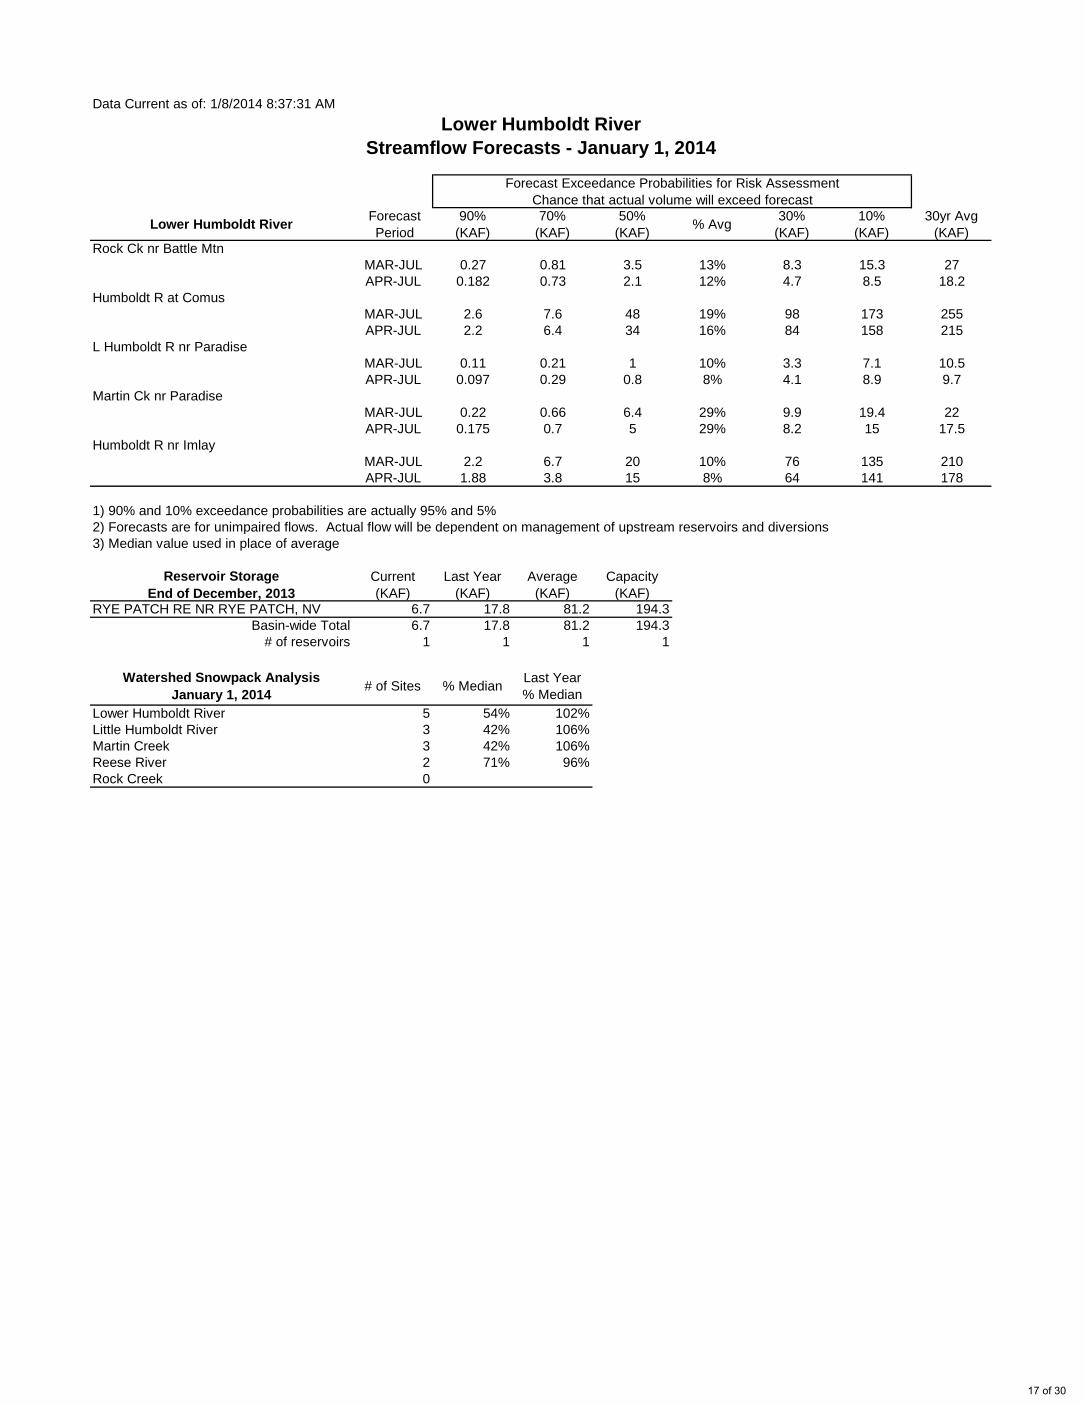
MAR-JUL 0.27 0.81 3.5 13% 8.3 15.3 27APR-JUL 0.182 0.73 2.1 12% 4.7 8.5 18.2
MAR-JUL 2.6 7.6 48 19% 98 173 255APR-JUL 2.2 6.4 34 16% 84 158 215
MAR-JUL 0.11 0.21 1 10% 3.3 7.1 10.5APR-JUL 0.097 0.29 0.8 8% 4.1 8.9 9.7
MAR-JUL 0.22 0.66 6.4 29% 9.9 19.4 22APR-JUL 0.175 0.7 5 29% 8.2 15 17.5
MAR-JUL 2.2 6.7 20 10% 76 135 210APR-JUL 1.88 3.8 15 8% 64 141 178
1) 90% and 10% exceedance probabilities are actually 95% and 5%2) Forecasts are for unimpaired flows. Actual flow will be dependent on management of upstream reservoirs and diversions3) Median value used in place of average
Reservoir StorageEnd of December, 2013
Current(KAF)
Last Year(KAF)
Average(KAF)
Capacity(KAF)
RYE PATCH RE NR RYE PATCH, NV 6.7 17.8 81.2 194.3Basin-wide Total 6.7 17.8 81.2 194.3
# of reservoirs 1 1 1 1
Watershed Snowpack AnalysisJanuary 1, 2014 # of Sites % Median Last Year
% MedianLower Humboldt River 5 54% 102%Little Humboldt River 3 42% 106%Martin Creek 3 42% 106%Reese River 2 71% 96%Rock Creek 0
Rock Ck nr Battle Mtn
Humboldt R at Comus
L Humboldt R nr Paradise
Martin Ck nr Paradise
Humboldt R nr Imlay
17 of 30
Northern Great Basin
June
July
August
September
Current Forecasts
103602301036090010352500DAVISCK
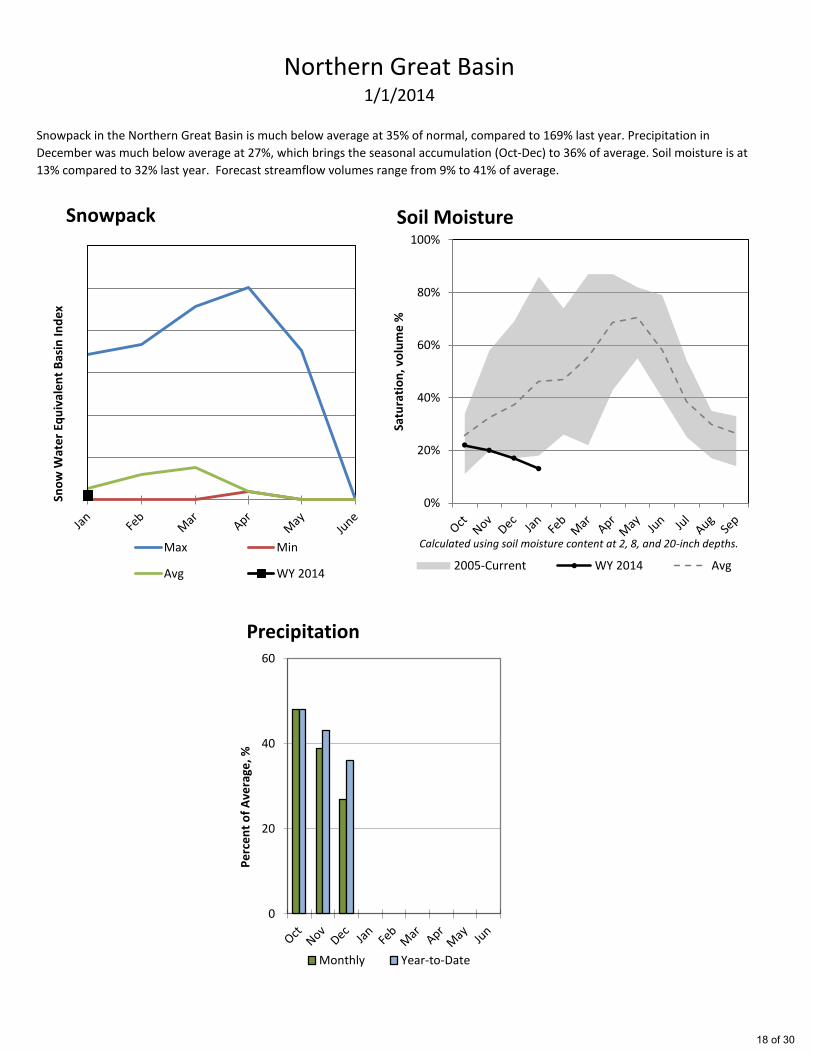
Snowpack in the Northern Great Basin is much below average at 35% of normal, compared to 169% last year. Precipitation in
December was much below average at 27%, which brings the seasonal accumulation (Oct-Dec) to 36% of average. Soil moisture is at
13% compared to 32% last year. Forecast streamflow volumes range from 9% to 41% of average.
1/1/2014
0
20
40
60
Pe
rce
nt
of
Ave
rage
, %
Precipitation
Monthly Year-to-Date
Sno
w W
ate
r Eq
uiv
ale
nt
Bas
in In
de
x
Snowpack
Max Min
Avg WY 2014
0%
20%
40%
60%
80%
100%
Satu
rati
on
, vo
lum
e %
Soil Moisture
2005-Current WY 2014 Avg
Calculated using soil moisture content at 2, 8, and 20-inch depths.
18 of 30
Data Current as of: 1/8/2014 8:37:27 AM
Northern Great Basin
Streamflow Forecasts - January 1, 2014
Forecast Exceedance Probabilities for Risk AssessmentChance that actual volume will exceed forecast
Northern Great Basin Forecast Period
90%(KAF)
70%(KAF)
50%(KAF) % Avg 30%
(KAF)10%
(KAF)30yr Avg
(KAF)
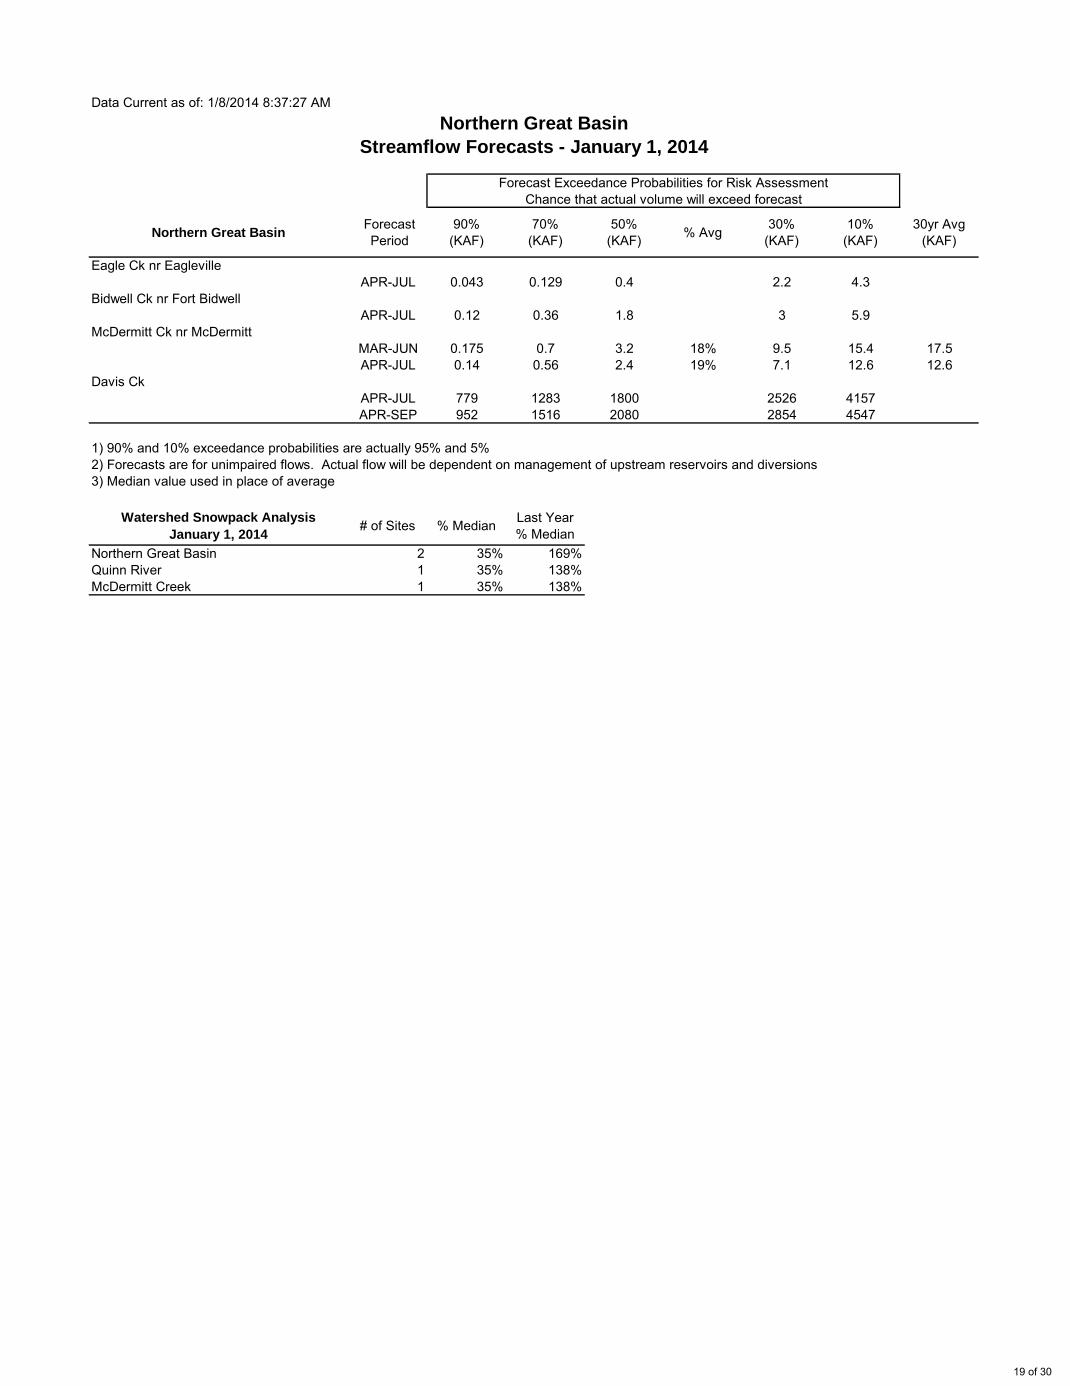
APR-JUL 0.043 0.129 0.4 2.2 4.3
APR-JUL 0.12 0.36 1.8 3 5.9
MAR-JUN 0.175 0.7 3.2 18% 9.5 15.4 17.5APR-JUL 0.14 0.56 2.4 19% 7.1 12.6 12.6
APR-JUL 779 1283 1800 2526 4157APR-SEP 952 1516 2080 2854 4547
1) 90% and 10% exceedance probabilities are actually 95% and 5%2) Forecasts are for unimpaired flows. Actual flow will be dependent on management of upstream reservoirs and diversions3) Median value used in place of average
Watershed Snowpack Analysis
January 1, 2014# of Sites % Median Last Year
% MedianNorthern Great Basin 2 35% 169%Quinn River 1 35% 138%McDermitt Creek 1 35% 138%
Eagle Ck nr Eagleville
Bidwell Ck nr Fort Bidwell
McDermitt Ck nr McDermitt
Davis Ck
19 of 30
Owyhee River Basin
June
July
August
September
Current Forecasts
13174500
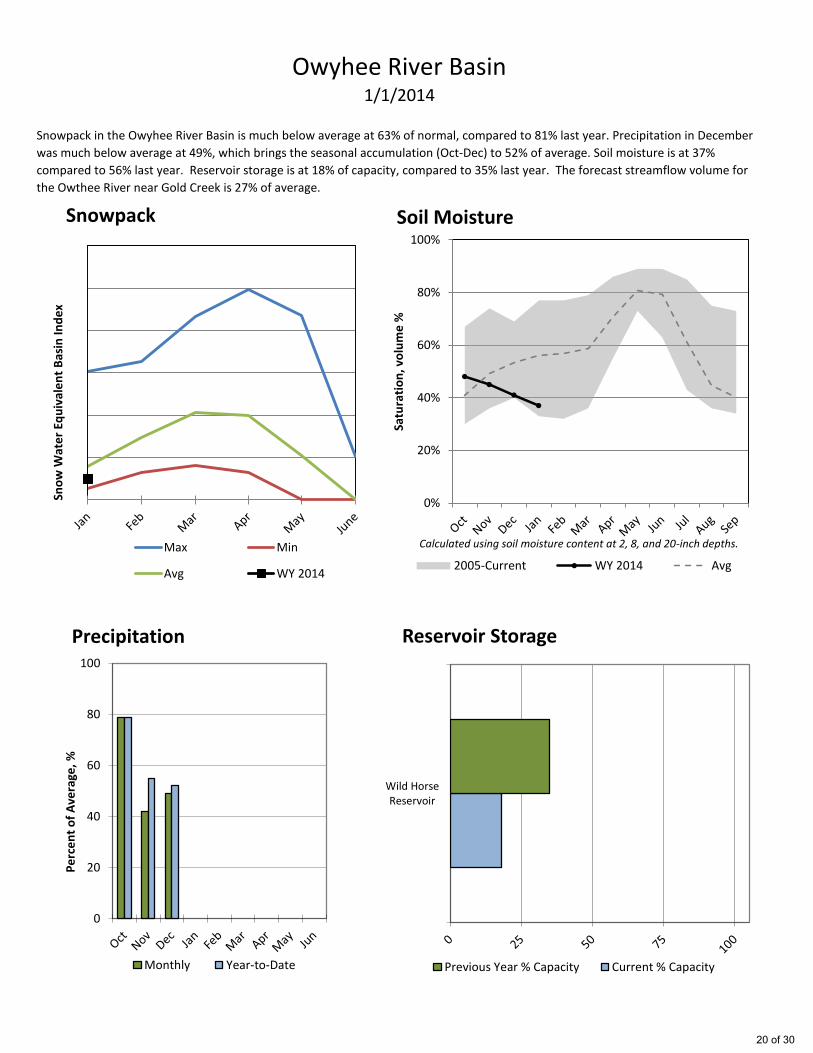
Snowpack in the Owyhee River Basin is much below average at 63% of normal, compared to 81% last year. Precipitation in December
was much below average at 49%, which brings the seasonal accumulation (Oct-Dec) to 52% of average. Soil moisture is at 37%
compared to 56% last year. Reservoir storage is at 18% of capacity, compared to 35% last year. The forecast streamflow volume for
the Owthee River near Gold Creek is 27% of average.
1/1/2014
Wild HorseReservoir
Reservoir Storage
Previous Year % Capacity Current % Capacity
0
20
40
60
80
100
Pe
rce
nt
of
Ave
rage
, %
Precipitation
Monthly Year-to-Date
Sno
w W
ate
r Eq
uiv
ale
nt
Bas
in In
de
x
Snowpack
Max Min
Avg WY 2014
0%
20%
40%
60%
80%
100%
Satu
rati
on
, vo
lum
e %
Soil Moisture
2005-Current WY 2014 Avg
Calculated using soil moisture content at 2, 8, and 20-inch depths.
20 of 30
Data Current as of: 1/8/2014 8:37:36 AMOwyhee River Basin
Streamflow Forecasts - January 1, 2014
Forecast Exceedance Probabilities for Risk AssessmentChance that actual volume will exceed forecast
Owyhee River Basin Forecast Period
90%(KAF)
70%(KAF)
50%(KAF) % Avg 30%
(KAF)10%
(KAF)30yr Avg
(KAF)
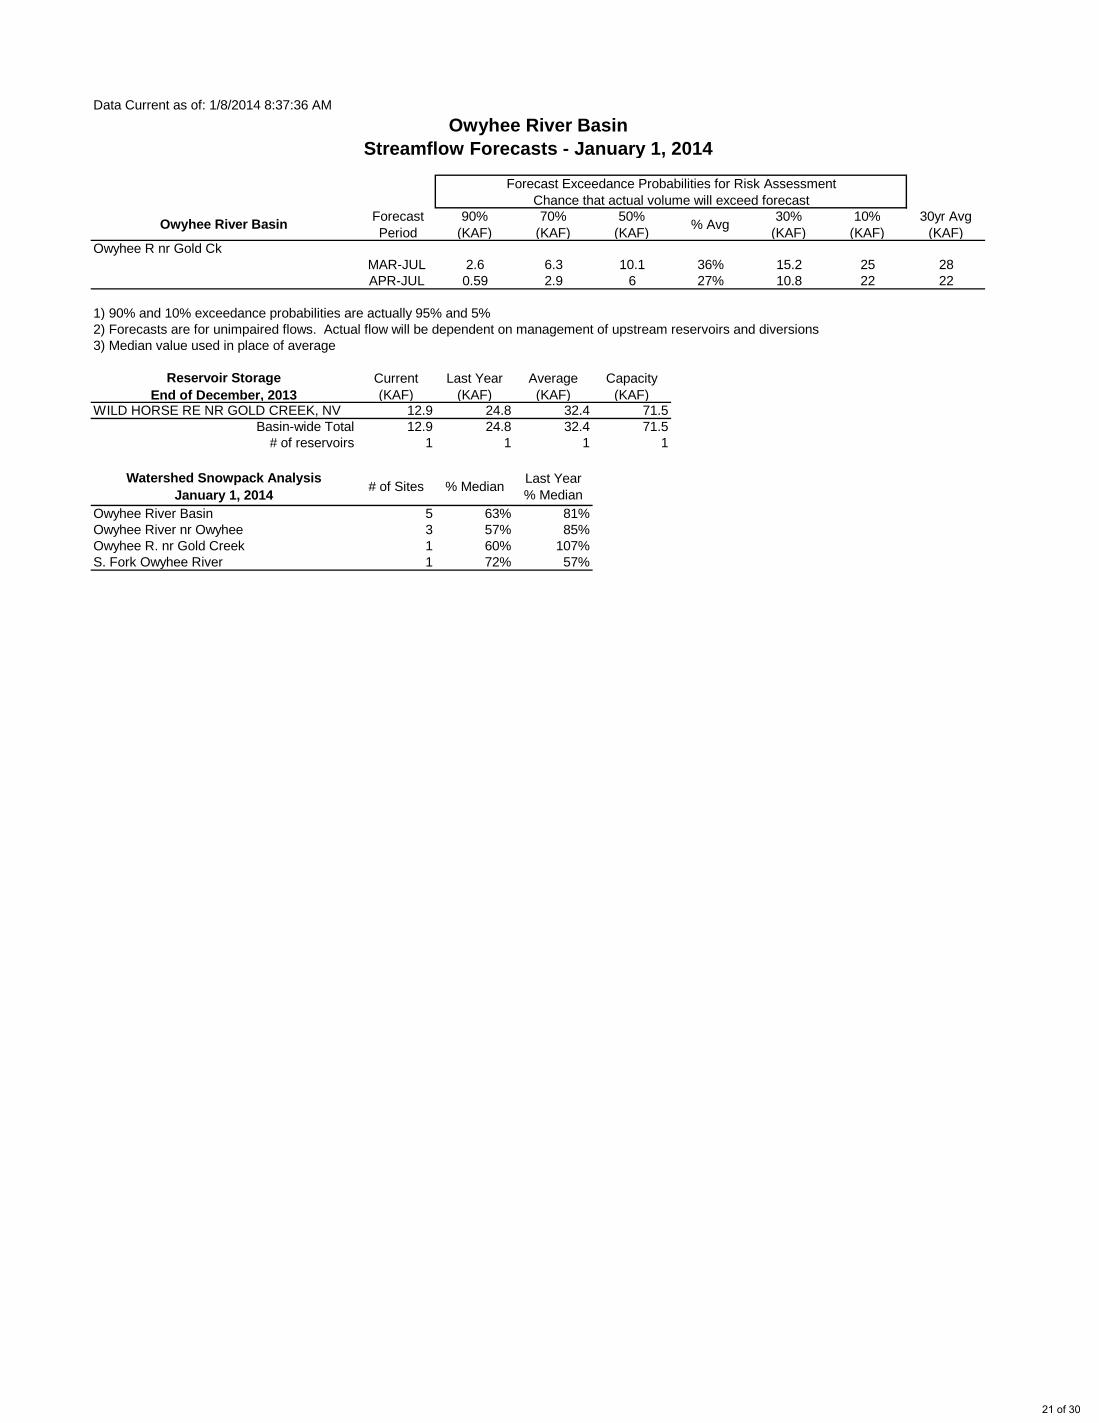
MAR-JUL 2.6 6.3 10.1 36% 15.2 25 28APR-JUL 0.59 2.9 6 27% 10.8 22 22
1) 90% and 10% exceedance probabilities are actually 95% and 5%2) Forecasts are for unimpaired flows. Actual flow will be dependent on management of upstream reservoirs and diversions3) Median value used in place of average
Reservoir StorageEnd of December, 2013
Current(KAF)
Last Year(KAF)
Average(KAF)
Capacity(KAF)
WILD HORSE RE NR GOLD CREEK, NV 12.9 24.8 32.4 71.5Basin-wide Total 12.9 24.8 32.4 71.5
# of reservoirs 1 1 1 1
Watershed Snowpack AnalysisJanuary 1, 2014 # of Sites % Median Last Year
% MedianOwyhee River Basin 5 63% 81%Owyhee River nr Owyhee 3 57% 85%Owyhee R. nr Gold Creek 1 60% 107%S. Fork Owyhee River 1 72% 57%
Owyhee R nr Gold Ck
21 of 30
Snake River Basin
June
July
August
September
Current Forecasts
13105000
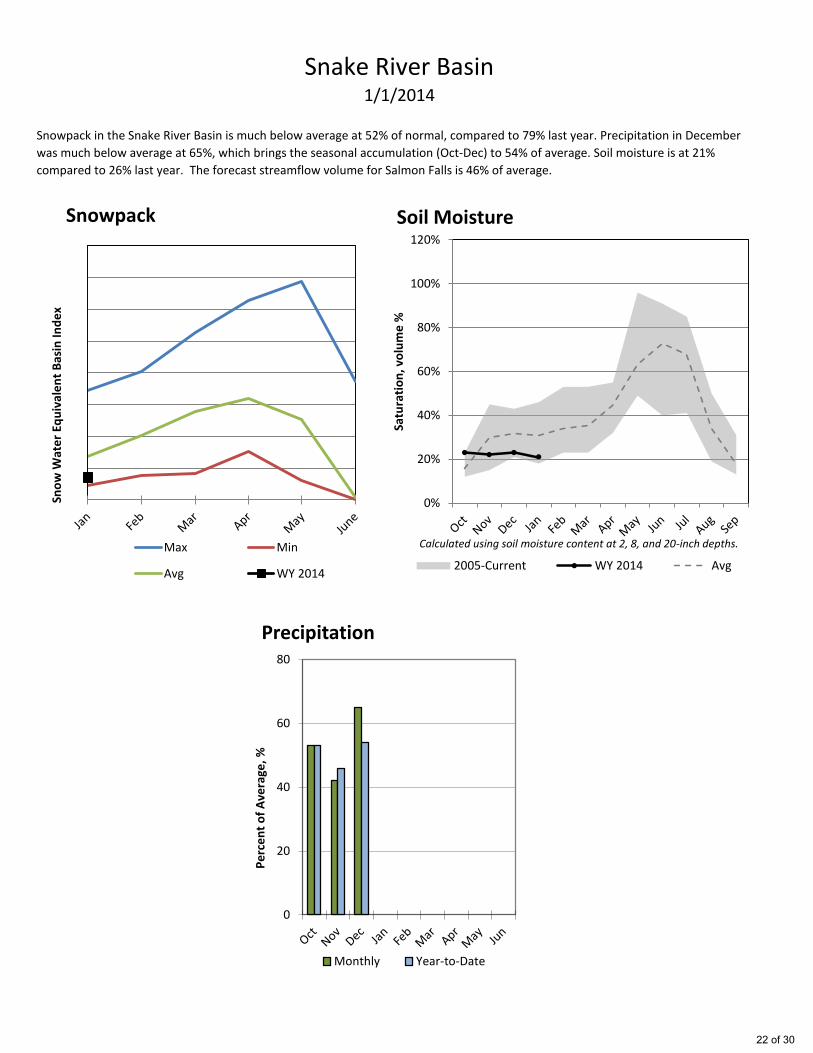
Snowpack in the Snake River Basin is much below average at 52% of normal, compared to 79% last year. Precipitation in December
was much below average at 65%, which brings the seasonal accumulation (Oct-Dec) to 54% of average. Soil moisture is at 21%
compared to 26% last year. The forecast streamflow volume for Salmon Falls is 46% of average.
1/1/2014
0
20
40
60
80
Pe
rce
nt
of
Ave
rage
, %
Precipitation
Monthly Year-to-Date
Sno
w W
ate
r Eq
uiv
ale
nt
Bas
in In
de
x
Snowpack
Max Min
Avg WY 2014
0%
20%
40%
60%
80%
100%
120%
Satu
rati
on
, vo
lum
e %
Soil Moisture
2005-Current WY 2014 Avg
Calculated using soil moisture content at 2, 8, and 20-inch depths.
22 of 30
Data Current as of: 1/8/2014 8:37:34 AM
Snake River Basin
Streamflow Forecasts - January 1, 2014
Forecast Exceedance Probabilities for Risk AssessmentChance that actual volume will exceed forecast
Snake River Basin Forecast Period
90%(KAF)
70%(KAF)
50%(KAF) % Avg 30%
(KAF)10%
(KAF)30yr Avg
(KAF)
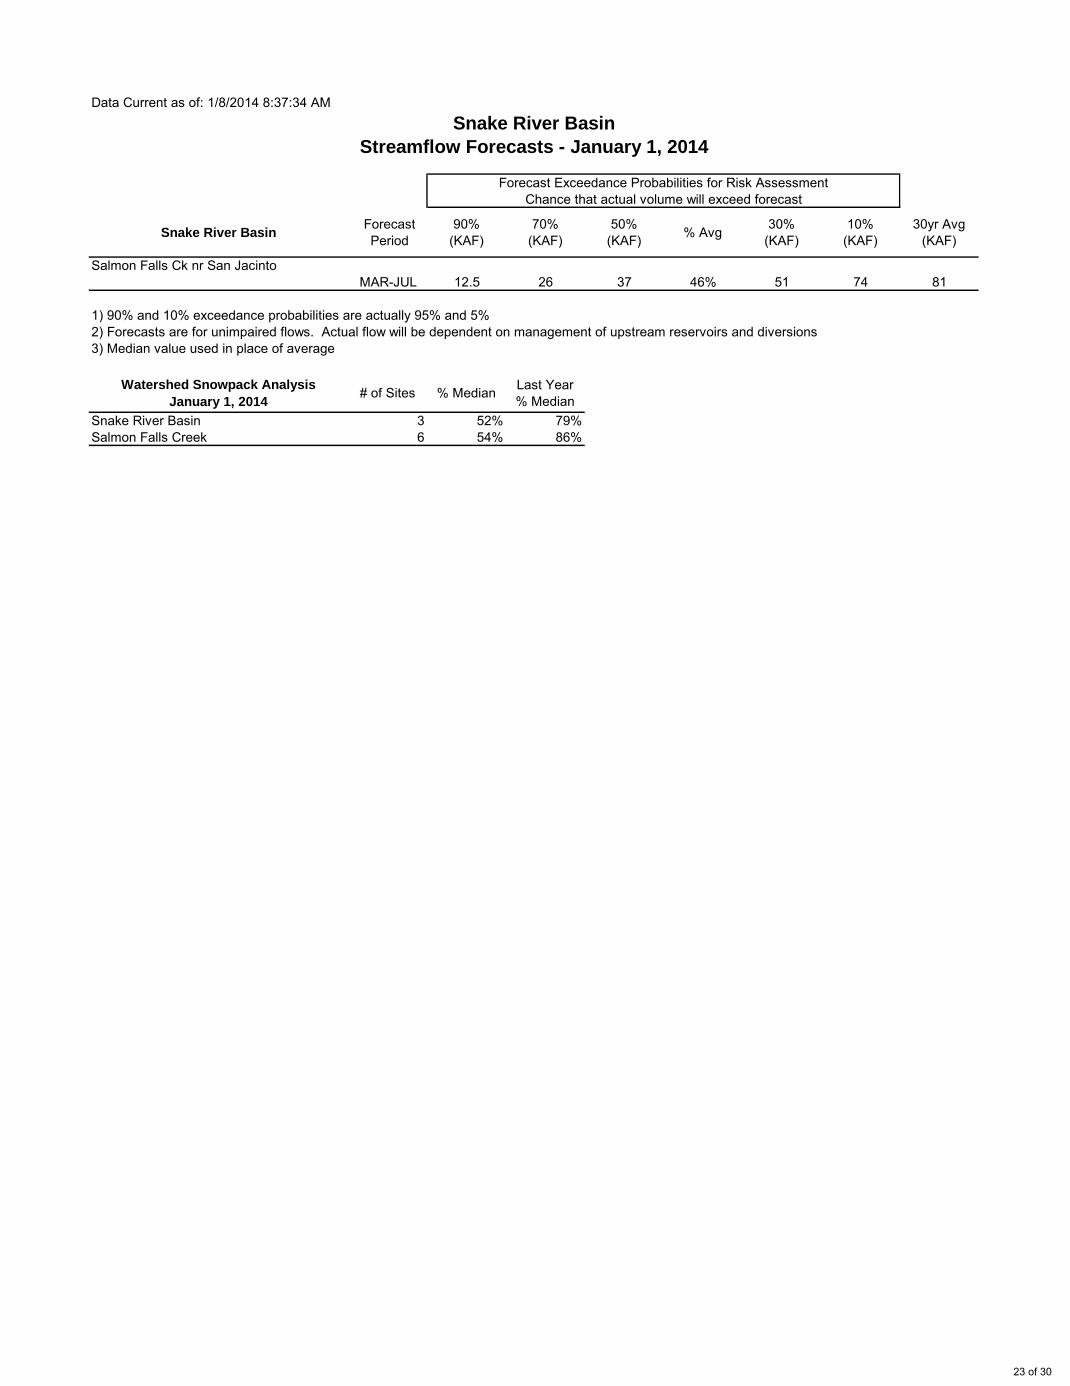
MAR-JUL 12.5 26 37 46% 51 74 81
1) 90% and 10% exceedance probabilities are actually 95% and 5%2) Forecasts are for unimpaired flows. Actual flow will be dependent on management of upstream reservoirs and diversions3) Median value used in place of average
Watershed Snowpack Analysis
January 1, 2014# of Sites % Median Last Year
% MedianSnake River Basin 3 52% 79%Salmon Falls Creek 6 54% 86%
Salmon Falls Ck nr San Jacinto
23 of 30
Truckee River Basin
June
July
August
September
Current Forecasts
103435001034440010346000103493001034885010336500
10348900
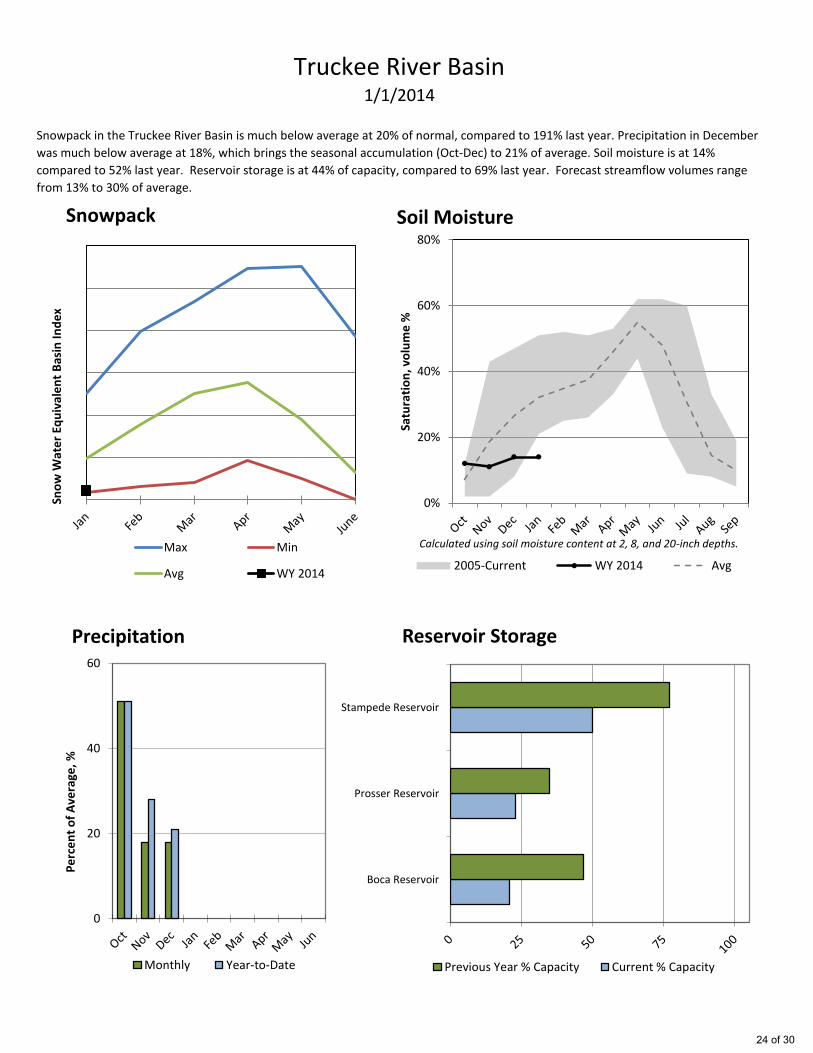
Snowpack in the Truckee River Basin is much below average at 20% of normal, compared to 191% last year. Precipitation in December
was much below average at 18%, which brings the seasonal accumulation (Oct-Dec) to 21% of average. Soil moisture is at 14%
compared to 52% last year. Reservoir storage is at 44% of capacity, compared to 69% last year. Forecast streamflow volumes range
from 13% to 30% of average.
1/1/2014
Previous Year % Capacity Current % Capacity
Boca Reservoir
Prosser Reservoir
Stampede Reservoir
Reservoir Storage
Previous Year % Capacity Current % Capacity
0
20
40
60
Pe
rce
nt
of
Ave
rage
, %
Precipitation
Monthly Year-to-Date
Sno
w W
ate
r Eq
uiv
ale
nt
Bas
in In
de
x
Snowpack
Max Min
Avg WY 2014
0%
20%
40%
60%
80%
Satu
rati
on
, vo
lum
e %
Soil Moisture
2005-Current WY 2014 Avg
Calculated using soil moisture content at 2, 8, and 20-inch depths.
24 of 30
Data Current as of: 1/8/2014 8:37:21 AMTruckee River
Streamflow Forecasts - January 1, 2014
Forecast Exceedance Probabilities for Risk AssessmentChance that actual volume will exceed forecast
Truckee River Forecast Period
90%(KAF)
70%(KAF)
50%(KAF) % Avg 30%
(KAF)10%
(KAF)30yr Avg
(KAF)
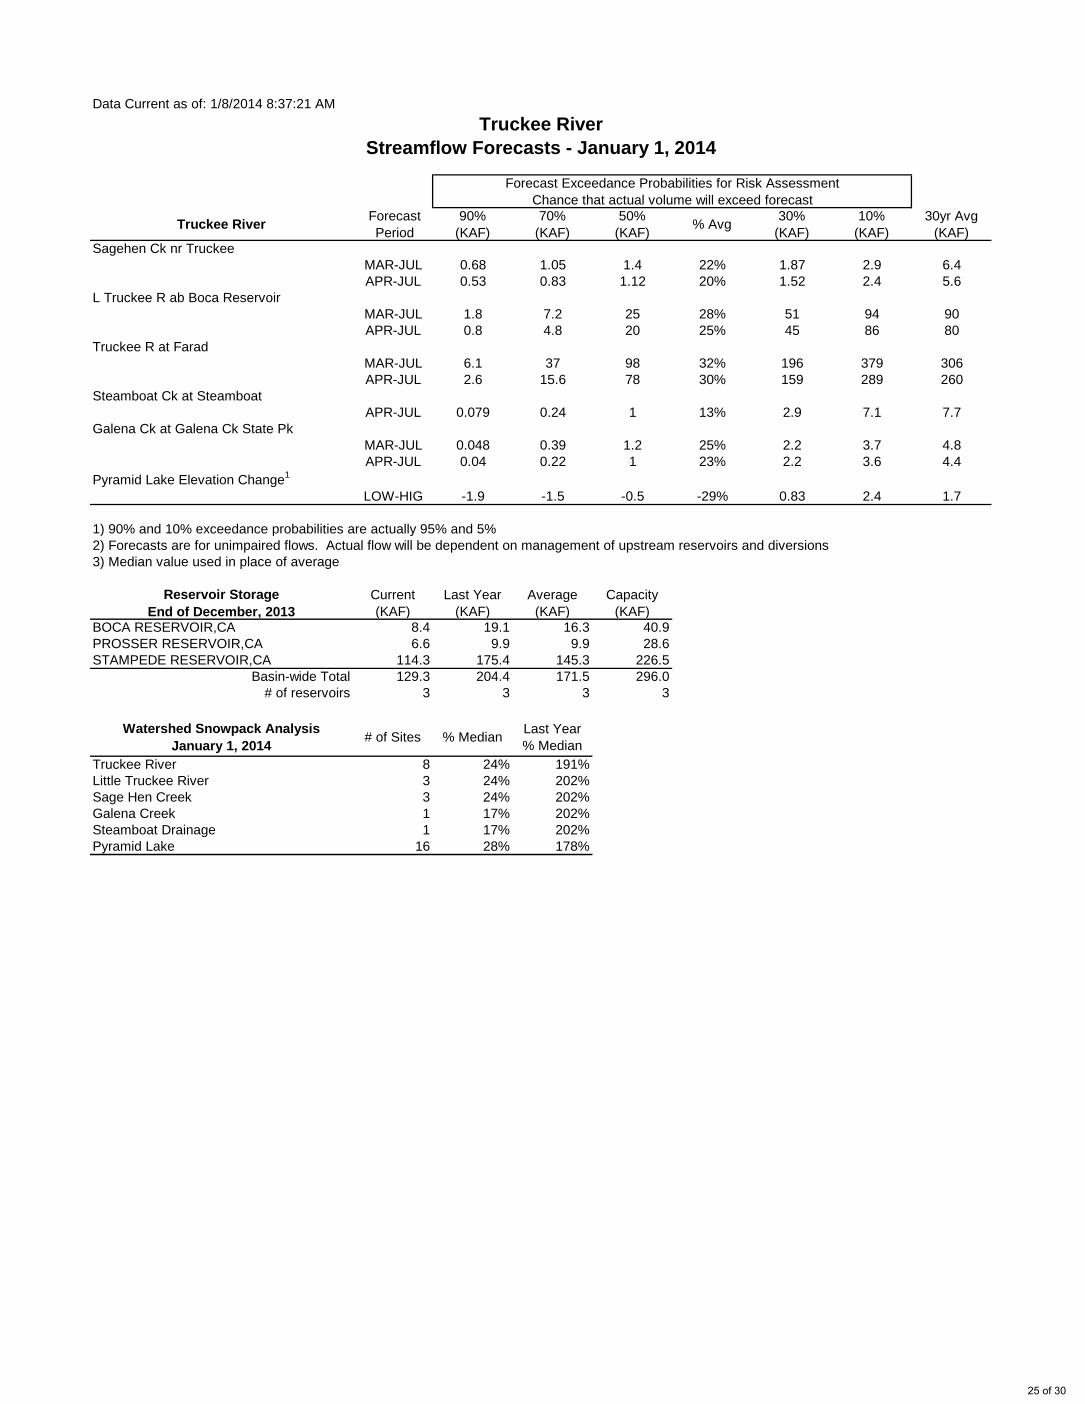
MAR-JUL 0.68 1.05 1.4 22% 1.87 2.9 6.4APR-JUL 0.53 0.83 1.12 20% 1.52 2.4 5.6
MAR-JUL 1.8 7.2 25 28% 51 94 90APR-JUL 0.8 4.8 20 25% 45 86 80
MAR-JUL 6.1 37 98 32% 196 379 306APR-JUL 2.6 15.6 78 30% 159 289 260
APR-JUL 0.079 0.24 1 13% 2.9 7.1 7.7
MAR-JUL 0.048 0.39 1.2 25% 2.2 3.7 4.8APR-JUL 0.04 0.22 1 23% 2.2 3.6 4.4
LOW-HIG -1.9 -1.5 -0.5 -29% 0.83 2.4 1.7
1) 90% and 10% exceedance probabilities are actually 95% and 5%2) Forecasts are for unimpaired flows. Actual flow will be dependent on management of upstream reservoirs and diversions3) Median value used in place of average
Reservoir StorageEnd of December, 2013
Current(KAF)
Last Year(KAF)
Average(KAF)
Capacity(KAF)
BOCA RESERVOIR,CA 8.4 19.1 16.3 40.9PROSSER RESERVOIR,CA 6.6 9.9 9.9 28.6STAMPEDE RESERVOIR,CA 114.3 175.4 145.3 226.5
Basin-wide Total 129.3 204.4 171.5 296.0# of reservoirs 3 3 3 3
Watershed Snowpack AnalysisJanuary 1, 2014 # of Sites % Median Last Year
% MedianTruckee River 8 24% 191%Little Truckee River 3 24% 202%Sage Hen Creek 3 24% 202%Galena Creek 1 17% 202%Steamboat Drainage 1 17% 202%Pyramid Lake 16 28% 178%
Pyramid Lake Elevation Change1
Sagehen Ck nr Truckee
L Truckee R ab Boca Reservoir
Truckee R at Farad
Steamboat Ck at Steamboat
Galena Ck at Galena Ck State Pk
25 of 30
Upper Humboldt River Basin
June
July
August
September
Current Forecasts
10315500103165001031750010318500103200001032100010322500
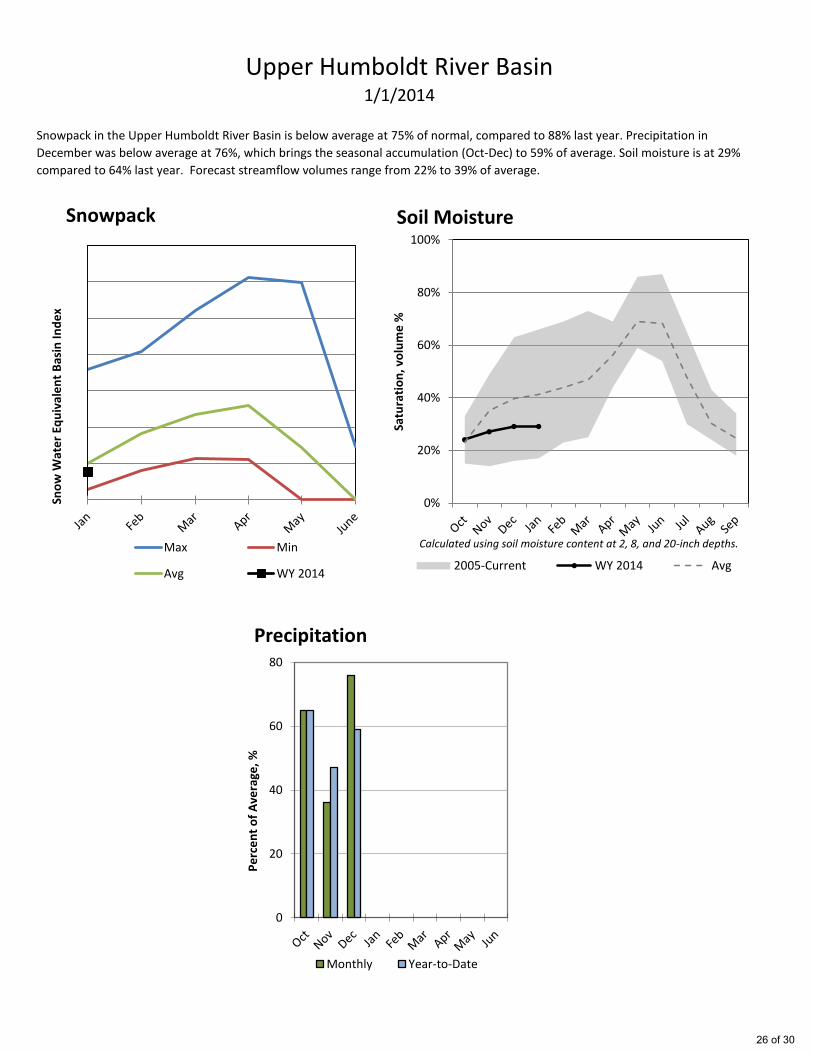
Snowpack in the Upper Humboldt River Basin is below average at 75% of normal, compared to 88% last year. Precipitation in
December was below average at 76%, which brings the seasonal accumulation (Oct-Dec) to 59% of average. Soil moisture is at 29%
compared to 64% last year. Forecast streamflow volumes range from 22% to 39% of average.
1/1/2014
0
20
40
60
80
Pe
rce
nt
of
Ave
rage
, %
Precipitation
Monthly Year-to-Date
Sno
w W
ate
r Eq
uiv
ale
nt
Bas
in In
de
x
Snowpack
Max Min
Avg WY 2014
0%
20%
40%
60%
80%
100%
Satu
rati
on
, vo
lum
e %
Soil Moisture
2005-Current WY 2014 Avg
Calculated using soil moisture content at 2, 8, and 20-inch depths.
26 of 30
Data Current as of: 1/8/2014 8:37:29 AM
Upper Humboldt River
Streamflow Forecasts - January 1, 2014
Forecast Exceedance Probabilities for Risk AssessmentChance that actual volume will exceed forecast
Upper Humboldt River Forecast Period
90%(KAF)
70%(KAF)
50%(KAF) % Avg 30%
(KAF)10%
(KAF)30yr Avg
(KAF)
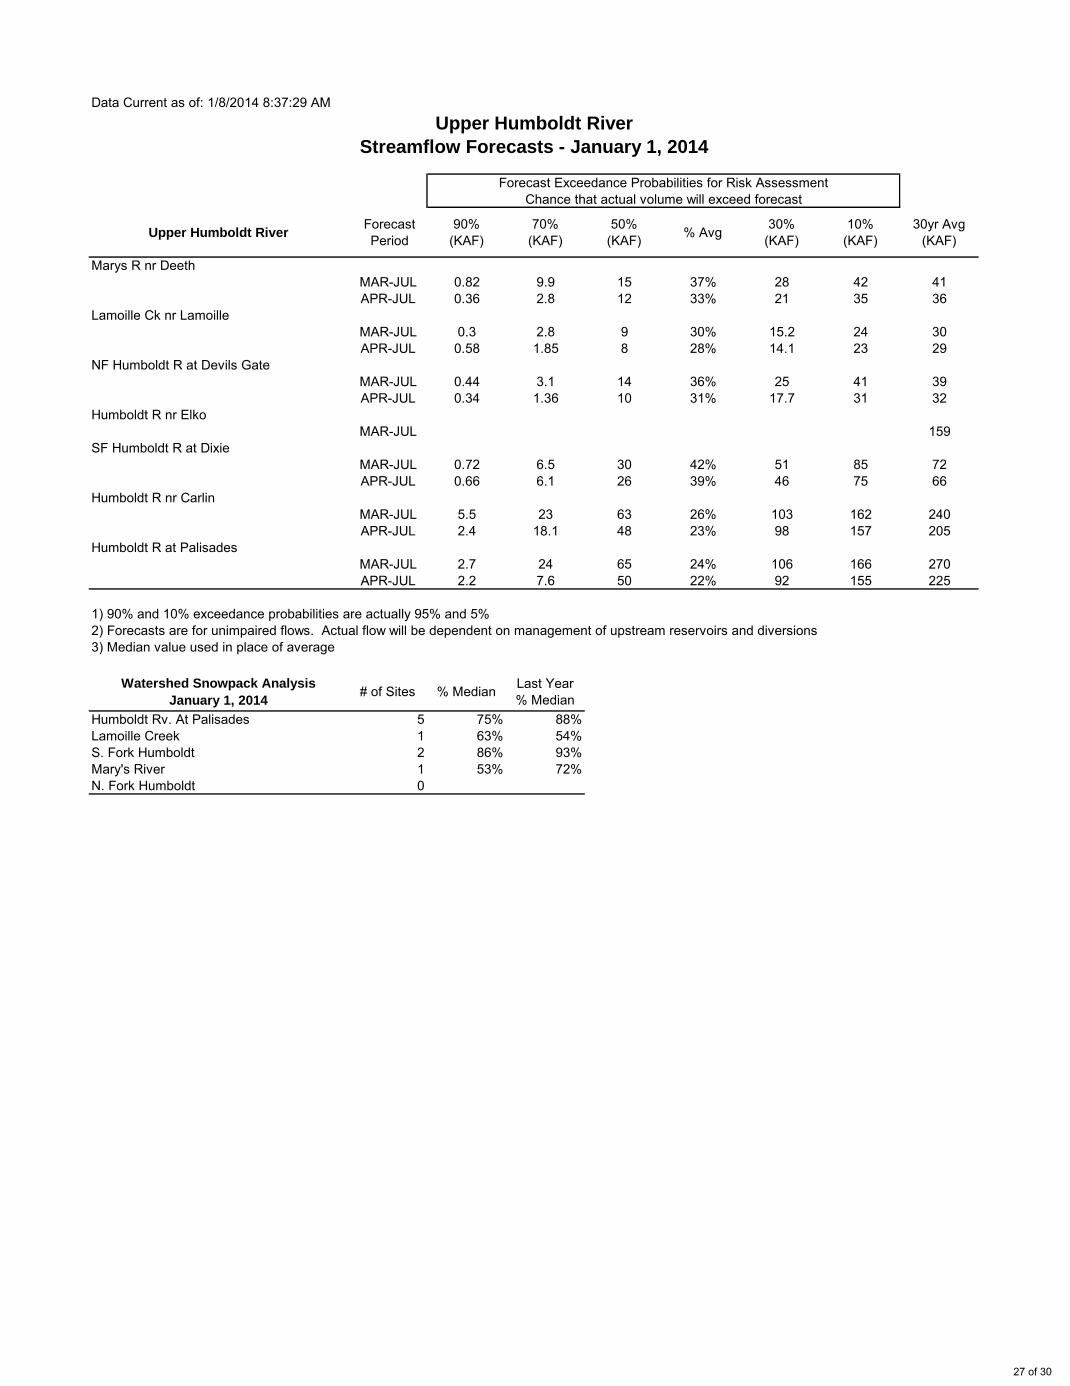
MAR-JUL 0.82 9.9 15 37% 28 42 41APR-JUL 0.36 2.8 12 33% 21 35 36
MAR-JUL 0.3 2.8 9 30% 15.2 24 30APR-JUL 0.58 1.85 8 28% 14.1 23 29
MAR-JUL 0.44 3.1 14 36% 25 41 39APR-JUL 0.34 1.36 10 31% 17.7 31 32
MAR-JUL 159
MAR-JUL 0.72 6.5 30 42% 51 85 72APR-JUL 0.66 6.1 26 39% 46 75 66
MAR-JUL 5.5 23 63 26% 103 162 240APR-JUL 2.4 18.1 48 23% 98 157 205
MAR-JUL 2.7 24 65 24% 106 166 270APR-JUL 2.2 7.6 50 22% 92 155 225
1) 90% and 10% exceedance probabilities are actually 95% and 5%2) Forecasts are for unimpaired flows. Actual flow will be dependent on management of upstream reservoirs and diversions3) Median value used in place of average
Watershed Snowpack Analysis
January 1, 2014# of Sites % Median Last Year
% MedianHumboldt Rv. At Palisades 5 75% 88%Lamoille Creek 1 63% 54%S. Fork Humboldt 2 86% 93%Mary's River 1 53% 72%N. Fork Humboldt 0
Humboldt R at Palisades
Marys R nr Deeth
Lamoille Ck nr Lamoille
NF Humboldt R at Devils Gate
Humboldt R nr Elko
SF Humboldt R at Dixie
Humboldt R nr Carlin
27 of 30
Walker River Basin
June
July
August
September
Current Forecasts
10293000102960001029650010288500
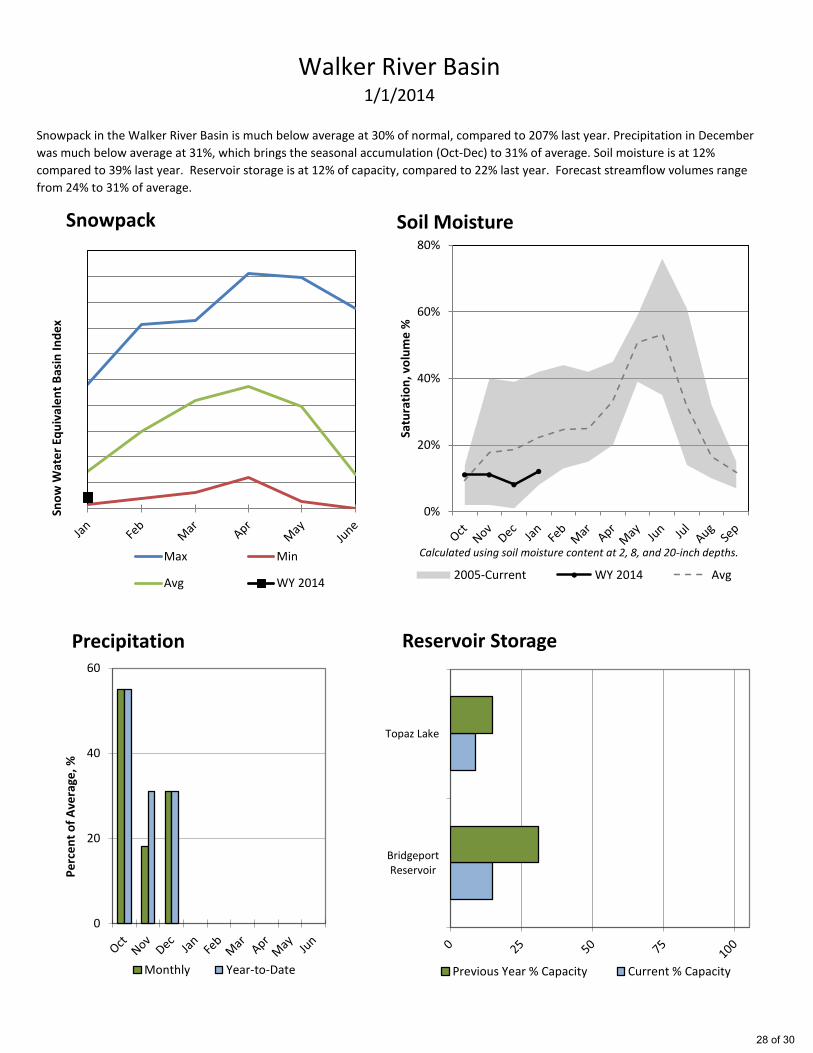
Snowpack in the Walker River Basin is much below average at 30% of normal, compared to 207% last year. Precipitation in December
was much below average at 31%, which brings the seasonal accumulation (Oct-Dec) to 31% of average. Soil moisture is at 12%
compared to 39% last year. Reservoir storage is at 12% of capacity, compared to 22% last year. Forecast streamflow volumes range
from 24% to 31% of average.
1/1/2014
BridgeportReservoir
Topaz Lake
Reservoir Storage
Previous Year % Capacity Current % Capacity
0
20
40
60
Pe
rce
nt
of
Ave
rage
, %
Precipitation
Monthly Year-to-Date
Sno
w W
ate
r Eq
uiv
ale
nt
Bas
in In
de
x
Snowpack
Max Min
Avg WY 2014
0%
20%
40%
60%
80%
Satu
rati
on
, vo
lum
e %
Soil Moisture
2005-Current WY 2014 Avg
Calculated using soil moisture content at 2, 8, and 20-inch depths.
28 of 30
Data Current as of: 1/8/2014 8:37:25 AMWalker River
Streamflow Forecasts - January 1, 2014
Forecast Exceedance Probabilities for Risk AssessmentChance that actual volume will exceed forecast
Walker River Forecast Period
90%(KAF)
70%(KAF)
50%(KAF) % Avg 30%
(KAF)10%
(KAF)30yr Avg
(KAF)
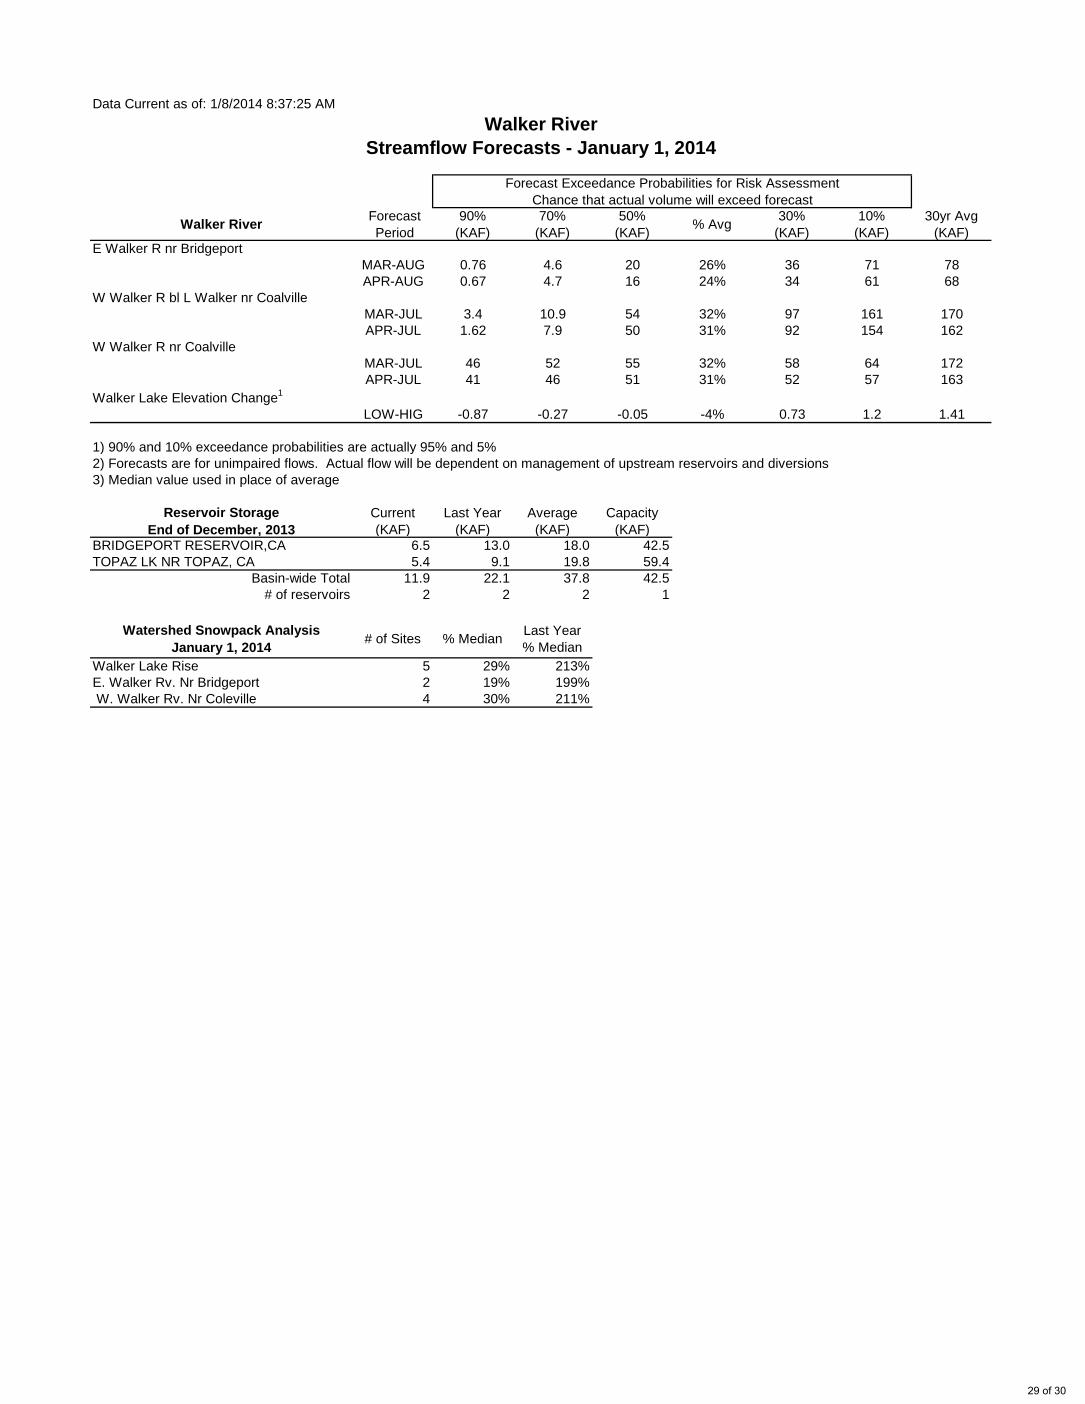
MAR-AUG 0.76 4.6 20 26% 36 71 78APR-AUG 0.67 4.7 16 24% 34 61 68
MAR-JUL 3.4 10.9 54 32% 97 161 170APR-JUL 1.62 7.9 50 31% 92 154 162
MAR-JUL 46 52 55 32% 58 64 172APR-JUL 41 46 51 31% 52 57 163
LOW-HIG -0.87 -0.27 -0.05 -4% 0.73 1.2 1.41
1) 90% and 10% exceedance probabilities are actually 95% and 5%2) Forecasts are for unimpaired flows. Actual flow will be dependent on management of upstream reservoirs and diversions3) Median value used in place of average
Reservoir StorageEnd of December, 2013
Current(KAF)
Last Year(KAF)
Average(KAF)
Capacity(KAF)
BRIDGEPORT RESERVOIR,CA 6.5 13.0 18.0 42.5TOPAZ LK NR TOPAZ, CA 5.4 9.1 19.8 59.4
Basin-wide Total 11.9 22.1 37.8 42.5# of reservoirs 2 2 2 1
Watershed Snowpack AnalysisJanuary 1, 2014 # of Sites % Median Last Year
% MedianWalker Lake Rise 5 29% 213%E. Walker Rv. Nr Bridgeport 2 19% 199% W. Walker Rv. Nr Coleville 4 30% 211%
E Walker R nr Bridgeport
W Walker R bl L Walker nr Coalville
W Walker R nr Coalville
Walker Lake Elevation Change1
29 of 30
Issued by Released by Jason Weller Bruce Petersen Chief State Conservationist Natural Resources Conservation Service Natural Resources Conservation Service U.S. Department of Agriculture Reno, Nevada Prepared by Beau Uriona, Hydrologist Randy Julander, Data Collection Officer Jeff O’Connell, Hydrologist YOU MAY OBTAIN THIS PRODUCT AS WELL AS CURENT SNOW, PRECIPITATION, TEMPERATURE AND SOIL MOISTURE, RESERVOIR, SURFACE WATER SUPPLY INDEX, AND OTHER DATA BY VISITING OUR WEB SITE @: http://www.nrcs.usda.gov/wps/portal/nrcs/main/nv/snow/ Snow Survey, NRCS, USDA 245 North Jimmy Doolittle Road Salt Lake City, UT 84116 (801) 524-5213 x116
Nevada Water Supply Outlook Report
Natural Resources Conservation Service Reno, NV
30 of 30