Embed Size (px)
Citation preview

How the Silver State can lead on renewables, energy efficiency, and electric vehicles
NEVADA’S CLEAN ENERGY FUTURE

ACKNOWLEDGEMENTSAuthored and reviewed by
Bob Keefe, E2Jeff Benzak, E2Grant Carlisle, E2
Noah Long, NRDCCatherine Schmidt, NRDCDylan Sullivan, NRDC
Designed by
Hudson Studio
ABOUT E2Environmental Entrepreneurs (E2) is a national, nonpartisan group of business leaders, investors, and professionals from every sector of the economy who advocate for smart policies that are good for the economy and good for the environment. Our members have founded or funded more than 2,500 companies, created more than 600,000 jobs, and manage more than $100 billion in venture and private equity capital.
For more information, see www.e2.org, follow us on Twitter at @e2org, or contact [email protected].
Cover photos
Left: Crescent Dune’s 1.1 gigawatt-hour storage capability alone is about equal to all of the world’s utility scale batteries combined.
Photo courtesy of SolarReserve
Top Right: Utility-scale renewable energy projects in Nevada are capable of creating more than 1,000 jobs during construction.
Photo courtesy of SolarReserve
Bottom Right: The Don A. Campbell geothermal project in Nevada generates 19 megawatts of electricity.
Piyush Bakane photo via Geothermal Resources Council

1N E V A D A ’ S C L E A N E N E R G Y F U T U R E
E X E C U T I V E S U M M A R Y
SOME PROBLEMS…AND SOLUTIONSGovernor Brian Sandoval has expressed support for
clean energy, and recent legislatures have enacted
policies that support clean energy.3 In 2013, the
Governor helped pass legislation that provided a
framework for NV Energy to close the Reid Gardner
coal-fired power plant, exit the coal-fired Navajo
Generating Station, and replace this power plant
capacity with natural gas and renewable energy
resources.
Lately, though, while policymakers have been
overwhelmed with important budgetary
matters, Nevada’s energy policy has lagged big
advancements in renewable energy, energy
efficiency and EV technology.
The current Renewable Portfolio Standard
(RPS), which requires electric utilities to buy a
certain amount of renewable energy, is failing to
spur new solar and geothermal power projects.
The Public Utilities Commission of Nevada
(PUCN), meanwhile, terminated three important
customer-facing clean energy programs — net
metering (the policy undergirding rooftop
solar), a program that encouraged customers to
install efficient pool pumps, and a program that
A MAJOR ECONOMIC OPPORTUNITY Clean energy presents Nevada with a big opportunity to grow its economy and create jobs in renewable
energy, energy efficiency, and electric vehicles (EVs).
By tapping into some of the nation’s most abundant solar resources, electricity providers are purchasing
renewable energy from large-scale solar projects at lower costs than ever before.1,2 In some cases, it may
even be cheaper to build a new solar farm than to operate an existing natural gas plant. Complementing
this growth of Nevada’s solar industry is an abundance of geothermal resources.
Increasingly, businesses and home owners are also embracing energy efficiency. Thanks to advances in
energy efficiency — from lighting technologies like Light Emitting Diodes (LEDs) to successful efficiency
programs run by utilities across the country — businesses and homeowners are saving thousands of
dollars on annual electric bills.
Meanwhile, automakers are busy introducing next-generation EVs whose range and price appeals to a
broad consumer base. And what’s powering this growing fleet of EVs? Nevada sunshine.
reduced the price of efficient LED light bulbs.
And car buyers aren’t incentivized to purchase
EVs, despite the wide-ranging economic and
environmental benefits they deliver to the state.
Now is the time to sharpen Nevada’s economic
edge and update its clean energy policies. Nevada
policymakers should:
→ Increase the minimum amount of electricity
energy providers get from renewable energy
sources like solar and geothermal.
→ Require electric utilities to run programs
that help customers save energy, while
raising the amount of energy that utilities
are required to save.
→ Put in place tax rebates for EV purchasers;
spur utilities to invest in EV charging
infrastructure in market segments critical to
EV adoption, including apartment buildings
and workplaces; and ensure that electricity
rates encourage customers to charge EVs at
optimal times.
The result would be a fresh, forward-looking
energy policy that can drive the state and its
economy into the next decade.

2 N E V A D A ’ S C L E A N E N E R G Y F U T U R E
R E N E W A B L E E N E R G YDECLINING SOLAR COSTS, AND A ROLE FOR GEOTHERMAL
Solar costs have declined quickly, due to substantial private
and public investment in research and development,
and increased manufacturing capacity. According to the
investment firm Lazard, the cost to generate electricity from
solar has decreased by 78 percent since 2009,4 and many
analysts believe costs will continue to fall.
In 2010, the U.S. Department of Energy (DOE) started its
Sunshot program, with an ambitious goal of helping the
solar industry by 2020 reach the low cost of $1 per-watt, or 6
cents per-kilowatt-hour (kWh). That’s low enough for solar
to directly compete with coal and natural gas. This year,
DOE released a progress report, finding that five years into
the program, the industry is already three-quarters of the
way toward reaching the goal,5 and a recent industry report
concluded that it will hit the target by 2020.6
These price declines are evident in Nevada, where NV Energy
has contracted for electricity from large solar projects at
record-low prices. In July 2015, NV Energy received power
purchase agreement (PPA) offers from large solar power
projects at less than 4 cents per-kWh.8 At prices this low,
energy from new solar projects in Nevada is cheaper than
energy from new natural gas-fired power plants; in some
cases it may be cheaper to build a new solar farm than to
operate and fuel an existing natural gas plant.
This report focuses on policies that
support utility-scale solar installations,
not rooftop solar, partially because so
much has already been written on the
issue. E2 and its affiliate NRDC support
the continuation of net-metering in
Nevada, for both existing and new
customers, because the energy, grid,
and environmental benefits rooftop solar
provides are likely sufficient to justify the
incentive provided by net-metering, given
Nevada’s retail electricity rates.7
WHAT ABOUT ROOFTOP SOLAR?
In December 2015, Congress passed a multi-year
extension of federal tax credits for wind and solar,
providing near-term market certainty for the renewable
energy industry.9,10
Additionally, Nevada has strong geothermal resources
that can complement solar growth. In today’s cost
environment, geothermal electricity is more expensive
than solar, and the integration costs of solar are low.
However, as the percentage of electricity Nevada
generates from solar increases, geothermal can play an
important role as a zero-carbon technology that can help
balance the grid.
ENERGY FROM NEW SOLAR PROJECTS IN NEVADA CAN BE CHEAPER THAN ENERGY FROM NEW
NATURAL GAS-FIRED POWER PLANTS
THE COST TO GENERATE ELECTRICITY FROM SOLAR HAS DECREASED BY
78 PERCENT SINCE 2009

3N E V A D A ’ S C L E A N E N E R G Y F U T U R E
GRID CAN HANDLE EXPANSIONNevada can confidently expand its renewable energy commitment: incorporating significant amounts
of renewables into the grid is both feasible and cheap, according to recent studies and experiences
elsewhere.11,12,13,14 For example, in Texas, wind has surpassed 45 percent of hourly load on multiple
occasions,15 and Iowa now generates 31 percent of its total annual power from wind.16 Detailed analysis of
the Western Interconnect has found that variable renewables can provide up to 30 percent of total annual
generation with proper system planning and only minor adjustments to the existing grid.17
Improving electricity market coordination across the western region, through an expanded Independent
System Operator, would make integrating more clean, renewable electricity into the grid even easier.18
Balancing electricity uses and power plants over larger areas and more population centers allows for
easier renewable resource integration. “Non-correlated” projects that do not operate under the same
weather conditions can balance each other.19 Customers in neighboring states could use some of Nevada’s
electricity production when it exceeds the state’s own electricity needs, or vice-versa.
NEVADA RENEWABLE ENERGY PURCHASES NOT ACCURATELY REFLECTED IN RPSNevada has a “25 percent by 2025” RPS, but the law allows resources other than renewable energy
resources — such as energy efficiency — to be used for compliance, and some renewable energy resources
earn more than one credit for each unit of energy produced.
The result: NV Energy is able to comply with the 20 percent standard for 2015 even though only 13 percent
of its electricity comes from renewable sources.20
Utility 2015 retail sales (MWh)
2015 energy from owned renewable energy capacity (MWh)
2015 energy from long-term, short term renewable energy contracts, net metered systems (MWh)
2015 total renewable energy (MWh)
2015 total renewable energy (% of retail sales)
Nevada Power 21,665,971 3,046 3,025,540 3,028,586 14%
Sierra Pacific Power 8,246,177 215 938,921 939,136 11.4%
Total NV Energy 29,912,148 3,261 3,964,461 3,967,722 13.3%

4 N E V A D A ’ S C L E A N E N E R G Y F U T U R E
A B C D E F
Utility Portfolio Energy Credit need, 2016–202022 (MWh)
Forecast credit generation from owned, contracted renewable energy resources, 2016–202023 (MWh)
Portfolio Energy Credit carry-over from 201524
Remaining need, MWh (B – C – D)
Remaining need, percent of Portfolio Energy Credit need (E/B *100)
Nevada Power 22,099,290 17,774,060 3,750,305 574,925 2.6%
Sierra Pacific Power 8,411,100 4,695,680 1,705,491 2,009,930 23.9%
Total NV Energy 30,510,391 22,469,740 5,455,796 2,584,855 8.5%
Nevada’s RPS stays at 20 percent through 2019, then increases to 22 percent. Nationally, a lot of solar is
likely to be built between today and 2020, because of the federal ITC extension.21 But Nevadans may not
see the benefits of this development.
As the table below shows, NV Energy’s existing investments, contracts, and bank of old portfolio energy
credits means it’s already 91 percent of the way to meeting its renewable energy obligations through 2020.
To be clear, large-scale solar projects are being developed in Nevada. But these are being constructed for
the benefit of large energy users that have made corporate (e.g., Switch, Apple) or political (e.g., City of Las
Vegas) commitments to renewable energy.25
While the projects are large, they are a small percentage of NV Energy’s overall load. Only aggressive
policies can deliver renewable energy at-scale, and only renewable energy purchased on behalf of
Nevadans can reduce the state’s risky dependence on out-of-state fossil fuels for electricity.

5N E V A D A ’ S C L E A N E N E R G Y F U T U R E
POLICY RECOMMENDATION:
EXPAND, STRENGTHEN THE RPS Twenty-nine states and the District of Columbia currently have RPS
policies. A number of states have recently increased their Renewable
Portfolio Standards, partially to capture the benefit of the federal wind
and solar tax credit extension.
A recent report from DOE and Lawrence Berkeley National Laboratory
found that RPSs provide a wide range of economic, health, and climate
benefits. The report concluded that, in 2013 alone, RPSs across the
country saved customers up to $1.2 billion from reduced wholesale
electric prices and $1.3 to $3.7 billion from lower natural gas prices
(as a result of lower demand for natural gas across the power sector).
Additionally, RPSs have supported nearly 200,000 renewable energy-
related jobs, provided $5.2 billion worth of health benefits through
improved air quality, and resulted in global climate benefits of
$2.2 billion.26
Nevada should expand its RPS to require at least an additional 25 percent of electricity needs be met with
renewable resources by 2030.27
An expanded RPS, along with a new energy
efficiency resource standard (EERS), should be
designed to work if the market for electricity
generation becomes competitive; i.e., even if
customers could pick an energy supplier other
than NV Energy.
Policymakers should recognize that if
customers can switch providers, providers
will be uncertain about how much electricity
they need to serve and could be reluctant to sign long-term agreements to buy renewable energy. This has
made the Illinois RPS difficult to meet, even though the state has abundant wind energy.28 Nevada must
consider policies to avoid this outcome.
Updating and strengthening Nevada’s RPS would allow the state to serve its energy needs with emission-
free, abundant, and low-cost solar resources, while also reducing the amount of fossil fuels Nevada must
import from other states.
NEVADA SHOULD EXPAND ITS RPS TO REQUIRE AT LEAST AN ADDITIONAL 25 PERCENT
OF ELECTRICITY NEEDS BE MET WITH RENEWABLE RESOURCES BY 2030

6 N E V A D A ’ S C L E A N E N E R G Y F U T U R E
E N E R G Y E F F I C I E N C YTECHNOLOGIES, PROGRAMS SAVE UTILITIES MONEY
Since the 1970s, electric utilities have run programs to help
customers save energy. In the last decade, states and utilities
have expanded these efforts.
In 2006, for instance, total spending on customer-funded
electric energy efficiency programs was $1.6 billion, and
only three states’ efforts achieved savings of greater than 0.8
percent of retail sales.29 By 2014, however, program spending
quadrupled to nearly $6 billion and 18 states achieved first-
year savings of greater than 0.8 percent of retail sales.30
These increases were driven by several factors, including the
spread to more states of Energy Efficiency Resource Standards
(or EERS, which are policies analogous to Renewable Portfolio
Standards that require utilities to save a certain amount of
electricity each year); program expansions in the Midwest
and Mid-Atlantic; and switching to fluorescent lighting from
inefficient technologies like metal halide and incandescent
light bulbs.
By comparison, NV Energy in 2009 saved 1.5 percent of retail
sales. But after programs were cut, NV Energy in 2013 saved
just 0.6 percent of retail sales.
Nevada Lags Neighbors
Nevada now lags peer states like Arizona, Utah, and New
Mexico in energy efficiency policies and programs. The
former two states spent around $20 per-person on electric
utility energy efficiency programs in 2014; Nevada spent less
than half that amount.31
Arizona requires32 electric utilities to install energy efficiency
measures that save around 2.5 percent of annual sales.
Nevada law, meanwhile, currently does not require NV Energy
to offer programs that help customers save energy. In fact, the
PUCN recently terminated two cost-effective energy efficiency
programs — for LED light bulbs and energy efficient pool
pumps33 — based on little evidence.
POLICY RECOMMENDATIONS:
BOOST EERS TO 2 PERCENT, IMPLEMENT ‘DECOUPLING,’ UPDATE BUILDING CODESNevada should establish an EERS requiring electric
utilities save the equivalent of 2 percent annual sales,
ramping up to this level from current savings levels of less
than 1 percent. NV Energy should be allowed to recover
program costs and receive a performance-based reward if
it performs well in delivering energy savings.
The PUCN should be required to implement ‘decoupling’
— a policy that supports energy efficiency by adjusting
rates to ensure the utility recovers its authorized fixed
costs, no less and no more — to ensure the utility is not
financially harmed by implementing energy efficiency
programs.
The state should also update its building energy codes to
the latest available, and Las Vegas should fully apply this
latest code, for now the 2015 IECC.
NV ENERGY IN 2009 SAVED 1.5 PERCENT OF RETAIL SALES. BUT AFTER PROGRAMS
WERE CUT, NV ENERGY IN 2013 SAVED JUST 0.6 PERCENT OF RETAIL SALES

BETTER, CHEAPER LED LIGHTSAn LED replacement for an old 60-watt incandescent bulb needs only 10 watts to produce the same amount of light, and lasts 10 to 25
years instead of one. Customers are noticing these advantages, and the market is changing quickly.
LEDs grew from 5.7 percent of lamp shipments in the first quarter of 2015 to 26.1 percent one year later, but this growth has mainly come
at the expense of Compact Fluorescent Lightbulbs (CFLs), the other efficient lamp-type. Overall efficient lamp sales have stagnated:
CFLs and LEDs together accounted for 45 percent of lamp sales in the first quarter of 2015, and 45.3 percent of lamp sales one year
later.34 Inefficient incandescent and halogen lamps account for the majority of lamp shipments today, meaning there is a big opportunity
for utility energy efficiency programs that reduce the price of LEDs while helping retailers increase sales.
OPTIMIZING VOLTAGEUtilities must supply power to end-users within power quality standards set by the American National Standards Institute. These include
standards for voltage — analogous to water pressure in a pipe — the “pressure” at which electrons move through a power line and
into a device. Utilities generally over-supply voltage to customers, using engineering rules-of-thumb to ensure customers at the end-of-
the-line have acceptable voltage because of losses that occur as power flows to the edge of the distribution system.
To save energy, utilities are increasingly deploying Conservation Voltage Reduction (CVR) programs, a strategy that reduces customer
service voltages in order to achieve a corresponding reduction in energy consumption. Better-dispersed voltage sensors allow utilities
to see voltage in real-time and ensure customers receive the minimum amount of voltage necessary for safe and efficient operation of
electricity-consuming devices. These CVR programs are often implemented system-wide or on large portions of a utility’s distribution
grid, saving up to 4 percent of customer energy consumption on any distribution circuit.35
HEAT PUMPSInstead of creating heat by directly burning natural gas — as happens in a gas water heater — or sending electricity through a
resistance element — as happens in a toaster, hairdryer, or baseboard heater — heat pumps move and concentrate heat in the ambient
air. Heat pumps are now competitive with the most efficient natural gas alternatives, and much more efficient than appliances that use
electric resistance elements, because of technological advances.
Heat pump water heaters, clothes dryers, and HVAC units are all readily available, creating new opportunities for energy efficiency
programs to increase the sales of these appliances.
‘DEEP-DIVES’In their paper on the feasibility of reducing electricity use 30 percent in ten years, authors Chris Neme and Jim Grevatt highlight the
success of energy efficiency program administrators who use a strategy called “deep-dives.” In this strategy, administrators focus on
specific, important industries in a service territory, understand their business needs and how they use electricity and natural gas, and
use account management approaches to uncover opportunities for deep savings. The authors cite Efficiency Vermont’s success in
transforming the market for ski area snow guns in Vermont,36 an important end-use for those large customers.
CONTINUOUS ENERGY IMPROVEMENTEven energy-intensive businesses often treat their energy bill as a fixed cost, rather than something that can be changed. Continuous
Energy Improvement (CEI) programs, also known as Strategic Energy Management programs, help businesses implement a process to
continually reduce energy use, akin to quality improvement programs like Six Sigma or ISO 50001. Such programs require a business to
recruit an executive-level sponsor, develop an energy baseline and reduction goal, and put in place an energy team.37 The business then
gets help from a utility or third party program administrator in implementing a plan to reach the goal.
CEI programs work well with “deep-dive” programs because they help build trust and relationships between a utility or third-party
energy efficiency program administrators and businesses. These relationships are useful in better understanding a business’s
objectives and upcoming capital investments. A knowledgeable program administrator can then help the business add energy efficiency
features to these investments.
WHAT DOES ENERGY EFFICIENCY LOOK LIKE?
8 N E V A D A ’ S C L E A N E N E R G Y F U T U R E
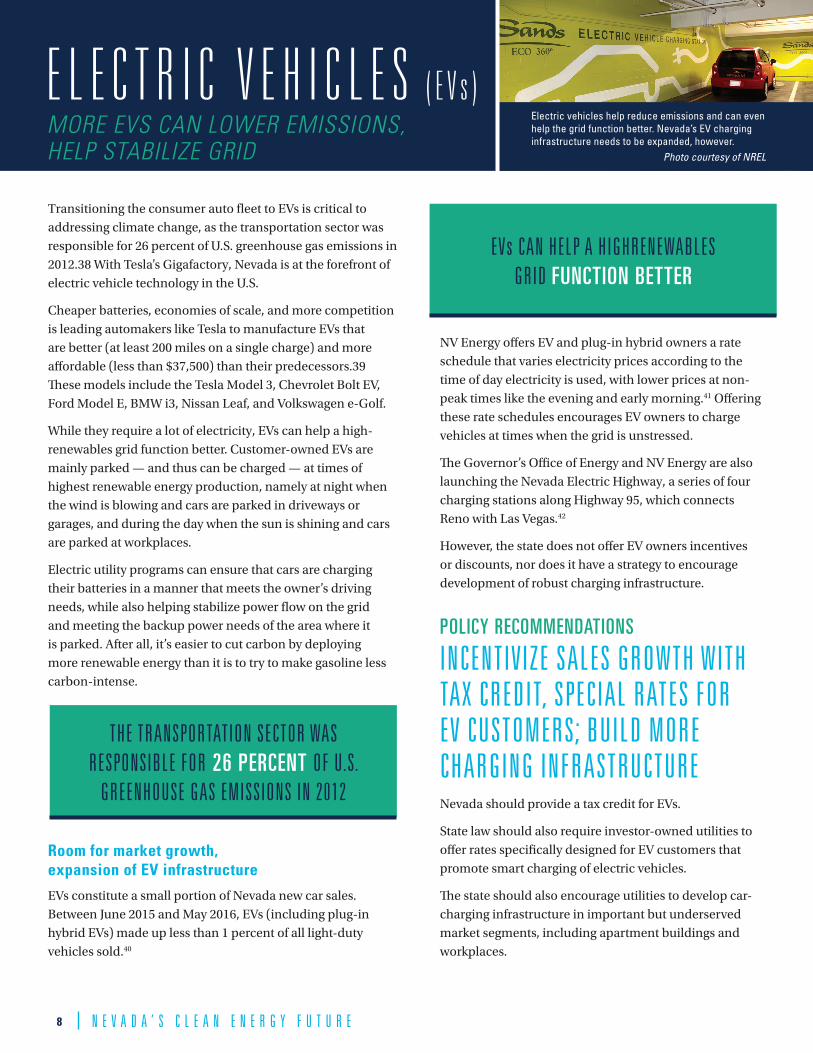
E L E C T R I C V E H I C L E S ( E V s )MORE EVS CAN LOWER EMISSIONS, HELP STABILIZE GRID
Transitioning the consumer auto fleet to EVs is critical to
addressing climate change, as the transportation sector was
responsible for 26 percent of U.S. greenhouse gas emissions in
2012.38 With Tesla’s Gigafactory, Nevada is at the forefront of
electric vehicle technology in the U.S.
Cheaper batteries, economies of scale, and more competition
is leading automakers like Tesla to manufacture EVs that
are better (at least 200 miles on a single charge) and more
affordable (less than $37,500) than their predecessors.39
These models include the Tesla Model 3, Chevrolet Bolt EV,
Ford Model E, BMW i3, Nissan Leaf, and Volkswagen e-Golf.
While they require a lot of electricity, EVs can help a high-
renewables grid function better. Customer-owned EVs are
mainly parked — and thus can be charged — at times of
highest renewable energy production, namely at night when
the wind is blowing and cars are parked in driveways or
garages, and during the day when the sun is shining and cars
are parked at workplaces.
Electric utility programs can ensure that cars are charging
their batteries in a manner that meets the owner’s driving
needs, while also helping stabilize power flow on the grid
and meeting the backup power needs of the area where it
is parked. After all, it’s easier to cut carbon by deploying
more renewable energy than it is to try to make gasoline less
carbon-intense.
Room for market growth, expansion of EV infrastructure
EVs constitute a small portion of Nevada new car sales.
Between June 2015 and May 2016, EVs (including plug-in
hybrid EVs) made up less than 1 percent of all light-duty
vehicles sold.40
NV Energy offers EV and plug-in hybrid owners a rate
schedule that varies electricity prices according to the
time of day electricity is used, with lower prices at non-
peak times like the evening and early morning.41 Offering
these rate schedules encourages EV owners to charge
vehicles at times when the grid is unstressed.
The Governor’s Office of Energy and NV Energy are also
launching the Nevada Electric Highway, a series of four
charging stations along Highway 95, which connects
Reno with Las Vegas.42
However, the state does not offer EV owners incentives
or discounts, nor does it have a strategy to encourage
development of robust charging infrastructure.
POLICY RECOMMENDATIONS
INCENTIVIZE SALES GROWTH WITH TAX CREDIT, SPECIAL RATES FOR EV CUSTOMERS; BUILD MORE CHARGING INFRASTRUCTURENevada should provide a tax credit for EVs.
State law should also require investor-owned utilities to
offer rates specifically designed for EV customers that
promote smart charging of electric vehicles.
The state should also encourage utilities to develop car-
charging infrastructure in important but underserved
market segments, including apartment buildings and
workplaces.
Electric vehicles help reduce emissions and can even help the grid function better. Nevada’s EV charging infrastructure needs to be expanded, however.
Photo courtesy of NREL
EVs CAN HELP A HIGHRENEWABLESGRID FUNCTION BETTER
THE TRANSPORTATION SECTOR WAS RESPONSIBLE FOR 26 PERCENT OF U.S.
GREENHOUSE GAS EMISSIONS IN 2012

E N D N O T E S1 Nevada is 12th in the nation in the amount of solar photovoltaic technical potential, and
second in the amount of geothermal technical potential. National Renewable Energy Laboratory, U.S. Renewable Energy Technical Potentials: A GIS-Based Analysis, July 2012.
2 Bloomberg News, “Buffett Scores Cheapest Electricity Rate with Nevada Solar Farms,” by Christopher Martin, July 7, 2015, available at: http://www.bloomberg.com/news/articles/2015-07-07/buffett-scores-cheapest-electricity-rate-with-nevada-solar-farms.
3 http://gov.nv.gov/News-and-Media/Press/2016/Sandoval-Reconvenes-New-Energy-Industry-Task-Force/
4 Lazard, “Levelized Cost of Energy Analysis 9.0”, November 2015, available at: https://www.lazard.com/perspective/levelized-cost-of-energy-analysis-90/.
5 Department of Energy, “On the Path to Sunshot,” May 2016, available at: http://energy.gov/eere/sunshot/path-sunshot.
6 Greentech Media Research, “U.S. Solar PV Price Brief H1 2016: System Pricing, Breakdowns and Forecasts,” June 2016, available at http://www.greentechmedia.com/research/report/us-solar-pv-price-brief-h1-2016.
7 http://www.solarcity.com/sites/default/files/SolarCity-Distributed_Energy_Resources_in_Nevada.pdf
8 Ibid, Bloomberg News.
9 Congress extended the renewable energy tax credits as part of the Consolidated Appropriations Act of 2016. The Production Tax Credit (PTC) for onshore wind projects was extended at its full value of 2.3 cents/kWh through the end of 2016, and then will phase down to 80 percent of its full value in 2017, 60 percent in 2018, and 40 percent in 2019. The Investment Tax Credit (ITC) for solar projects has been extended at its full value of 30 percent of project investment costs through the end of 2019, and will drop down to 26 percent in 2020 and 22 percent in 2021. Without additional legislation, the PTC will expire after 2019, and after 2022 the ITC will drop to 10 percent of investment costs for utility-scale and commercial projects, and will expire for residential projects.
10 Rhodium Group, “Renewable Tax Extenders: The Bridge to the Clean Power Plan,” January 2016, available at: http://rhg.com/notes/renewable-tax-extenders-the-bridge-to-the-clean-power-plan.
11 GE Energy Consulting, PJM Renewable Integration Study (March 31, 2014) available at http://www.pjm.com/~/media/committees-groups/task-forces/irtf/postings/pris-executive-summary.ashx.
12 GE Energy Consulting, Eastern Renewable Generation Integration Study, performed for NREL (2010) available at: http://www.nrel.gov/electricity/transmission/eastern_renewable.html.
13 Southwest Power Pool, “2016 Wind Integration Study,” January 2016, available at: https://www.spp.org/documents/34200/2016%20wind%20integration%20study%20(wis)%20final.pdf.
14 White House Council of Economic Advisors, “Incorporating Renewables into the Electric Grid: Opportunities for Smart Markets and Energy Storage,” June 2016, available at: https://www.whitehouse.gov/sites/default/files/page/files/20160616_cea_renewables_electricgrid.pdf.
15 Utility Dive, “With another generation record, Texas edges closer to 50% wind penetration,” by Herman K. Trabish, April 8, 2016, available at: http://www.utilitydive.com/news/with-another-generation-record-texas-edges-closer-to-50-wind-penetration-1/417089/.
16 Energy Information Administration, “State Profiles: Iowa,” March 17, 2016, available at: http://www.eia.gov/state/?sid=IA.
17 GE Energy Consulting, Western Wind and Solar Integration Study, performed for NREL, September 2013, available at http://www.nrel.gov/electricity/transmission/western_wind.html
18 http://www.caiso.com/Documents/SB350Study-Volume11RenewableIntegrationandReliability.pdf
19 National Renewable Energy Laboratory, “On the Path to Sunshot: Emerging Issues and Challenges in Integrating High Levels of Solar into the Electrical Generation and Transmission System,” May 2016, available at: http://www.nrel.gov/docs/fy16osti/65800.pdf.
20 NV Energy Portfolio Standard Annual Report for Compliance Year 2015, April 1, 2016, Section
3.6 and 4.7, Table 3-2 and 4-4, Table 3-3 and 4-5, pdf pages 28-29 and 41-43, available at:
http://pucweb1.state.nv.us/PDF/AxImages/DOCKETS_2015_THRU_PRESENT/2016-4/10708.
pdf.
21 Ibid Rhodium Group.
22 Assuming load is the same.
23 Assuming 500,000 MWh/year from Crescent Dunes and 22 percent capacity factor at Nellis
II,
24 Ibid NV Energy, Tables 3-5 and 4-7, pdf pages 30 and 44.
25 Public Utilities Commission of Nevada Docket No. 15-11026 and 15-11025.
26 Lawrence Berkeley National Laboratory (LBNL) and National Renewable Energy Laboratory
(NREL), “A Retrospective Analysis of the Benefits and Impacts of U.S. Renewable Portfolio
Standards”, January 2016, available at: http://www.nrel.gov/docs/fy16osti/65005.pdf.
27 Assuming Nevada gets 6.5 percent of national solar development, the amount the state
received in the first half of 2014 and one percent less than it received in 2015, the state could
expect an additional 15 or 24 percent of its electricity to come from new solar installations
by 2021, from, respectively, NREL, Impacts of Federal Tax Credit Extensions on Renewable
Deployment and Power Sector Emissions, February 2016; Bloomberg New Energy Finance,
Impact of Tax Credit Extensions for Wind and Solar, December 16, 2016.
28 Illinois Department of Commerce and Economic Opportunity, State of Illinois: Goal Status
Report for Energy Efficiency and Renewable Energy, 2016, page 67, available at: https://sites.
google.com/site/illinoisenergyroadmap/documents-and-comments/Illinois%20Energy%20
Roadmap_Goals%20Status%20Report.pdf?attredirects=0&d=1.
29 Measured on a “first-year” basis: the savings, in the year after installation, of all the devices
and projects the program administrator funded in the given year (in this case, 2006).
30 Neme, C., and Grevatt, J., The Next Quantum Leap in Energy Efficiency: 30 Percent Electric
Savings in Ten Years, Regulatory Assistance Project, February 2016, Page 3-4.
31 New Mexico utilities spent around $15 per-person. Consortium for Energy Efficiency,
Efficiency Program Industry by State and Region Appendices, 2015, March 15, 2016, Table
5, “Total Efficiency” column. NST-EST2014-01, https://www.census.gov/popest/data/state/
totals/2014/tables/NST-EST2014-01.xlsx
32 http://images.edocket.azcc.gov/docketpdf/0000116125.pdf
33 http://www.swenergy.org/press-release?PressID=124
34 http://www.nema.org/Intelligence/Pages/Lamp-Indices.aspx
35 Evaluation of Conservation Voltage Reduction on a National Level”, Schneider, Fuller, Tuffner,
and Singh, Pacific Northwest National Laboratory for the US Department of Energy, July
2010. http://www.pnl.gov/main/publications/external/technical_reports/PNNL-19596.pdf.
36 Ibid at 40.
37 http://beccconference.org/wp-content/uploads/2014/12/presentation_Sullivan.pdf
38 https://www.epa.gov/ghgemissions/us-greenhouse-gas-inventory-report-1990-2014
39 FleetCarma, http://www.fleetcarma.com/next-generation-electric-vehicles/.
40 Alliance of Automobile Manufacturers, in collaboration with the Center for Sustainable
Energy, http://www.zevfacts.com/sales-dashboard.html
41 https://www.nvenergy.com/renewablesenvironment/EV/electricVehicle.cfm
42 http://energy.nv.gov/Programs/Nevada_Electric_Vehicle_Programs_and_Resources/