Embed Size (px)
Citation preview
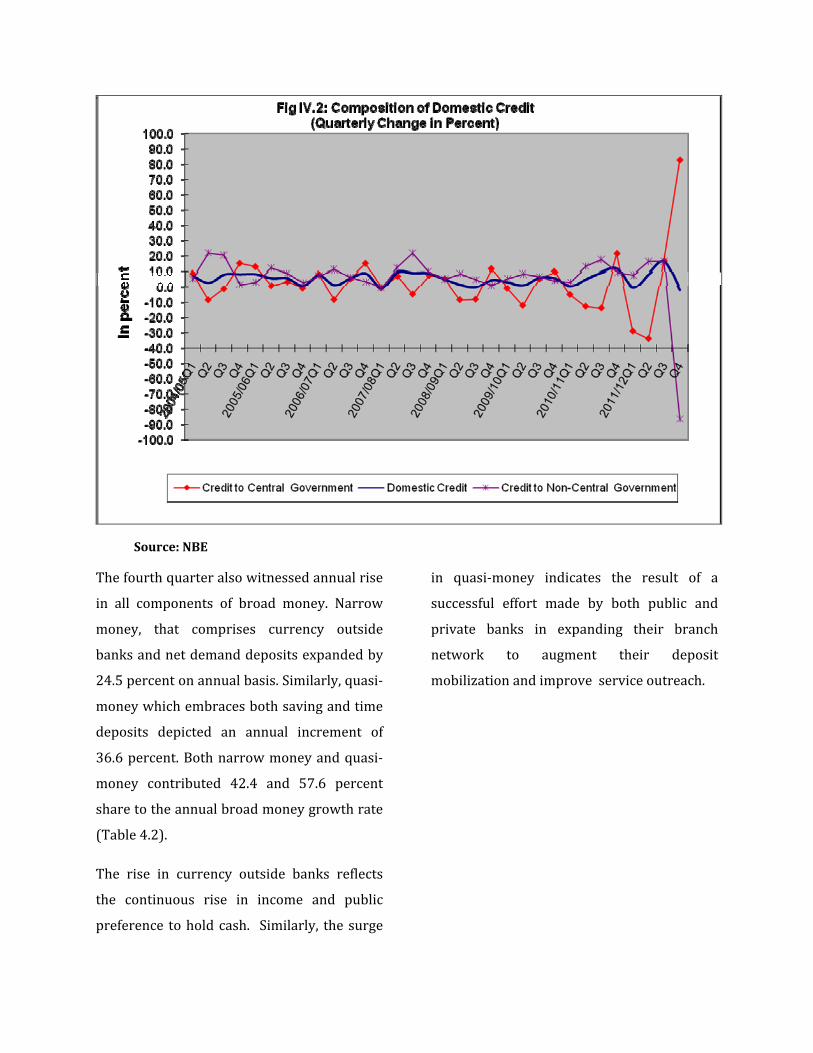
IV.MONETARY DEVELOPMENT
4.1. Money supply and credit
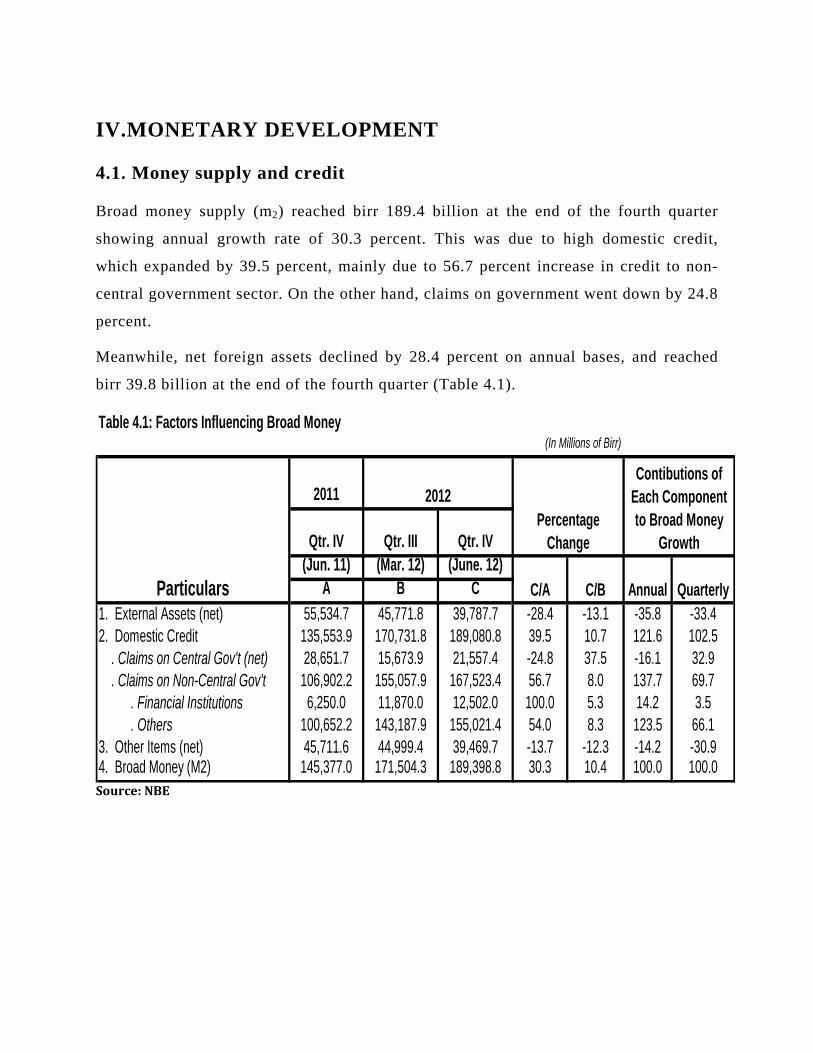
Broad money supply (m2) reached birr 189.4 billion at the end of the fourth quarter
showing annual growth rate of 30.3 percent. This was due to high domestic credit,
which expanded by 39.5 percent, mainly due to 56.7 percent increase in credit to non-
central government sector. On the other hand, claims on government went down by 24.8
percent.
Meanwhile, net foreign assets declined by 28.4 percent on annual bases, and reached
birr 39.8 billion at the end of the fourth quarter (Table 4.1).
Table 4.1: Factors Influencing Broad Money (In Millions of Birr)
2011
Qtr. IV Qtr. III Qtr. IV(Jun. 11) (Mar. 12) (June. 12)
A B C
1. External Assets (net) 55,534.7 45,771.8 39,787.7 -28.4 -13.1 -35.8 -33.42. Domestic Credit 135,553.9 170,731.8 189,080.8 39.5 10.7 121.6 102.5 . Claims on Central Gov't (net) 28,651.7 15,673.9 21,557.4 -24.8 37.5 -16.1 32.9 . Claims on Non-Central Gov't 106,902.2 155,057.9 167,523.4 56.7 8.0 137.7 69.7 . Financial Institutions 6,250.0 11,870.0 12,502.0 100.0 5.3 14.2 3.5 . Others 100,652.2 143,187.9 155,021.4 54.0 8.3 123.5 66.13. Other Items (net) 45,711.6 44,999.4 39,469.7 -13.7 -12.3 -14.2 -30.94. Broad Money (M2) 145,377.0 171,504.3 189,398.8 30.3 10.4 100.0 100.0
Particulars
Percentage Change
Contibutions of Each Component to Broad Money
Growth
C/A C/B Annual Quarterly
2012
Source:NBE
Source:NBE
Source:NBE
Thefourthquarteralsowitnessedannualrise
in all components of broad money. Narrow
money, that comprises currency outside
banksandnetdemanddepositsexpandedby
24.5percentonannualbasis.Similarly,quasi‐
moneywhichembracesbothsavingandtime
deposits depicted an annual increment of
36.6percent.Bothnarrowmoneyandquasi‐
money contributed 42.4 and 57.6 percent
sharetotheannualbroadmoneygrowthrate
(Table4.2).
The rise in currency outside banks reflects
the continuous rise in income and public
preference toholdcash. Similarly, thesurge
in quasi‐money indicates the result of a
successful effort made by both public and
private banks in expanding their branch
network to augment their deposit
mobilizationandimproveserviceoutreach.

Table 4.2: Components of Broad Money
(In Millions of Birr)
2011
Qtr. IV Qtr. III Qtr. IV(Jun. 11) (Mar. 12) (June. 12)
A B C
1. Narrow Money Supply 76,171.0 84,974.1 94,849.9 24.5 11.6 42.4 55.2 . Currency outside banks 32,574.9 37,727.7 38,537.1 18.3 2.1 13.5 4.5 . Demand Deposits (net) 43,596.1 47,246.4 56,312.7 29.2 19.2 28.9 50.72. Quasi-Money 69,206.0 86,530.1 94,548.9 36.6 9.3 57.6 44.8 . Savings Deposits 64,539.6 76,393.8 82,487.8 27.8 35.8 40.8 34.1 . Time Deposits 4,666.4 10,136.4 12,061.1 158.5 19.0 16.8 10.83. Broad Money Supply 145,377.0 171,504.3 189,398.8 30.3 10.4 100.0 100.0
Contibution of Each Component to Broad Money
Growth
C/A C/B Annual Quarter
ly
Percentage Change
2012
Particulars
Source:NBE
SOURCE:NBE
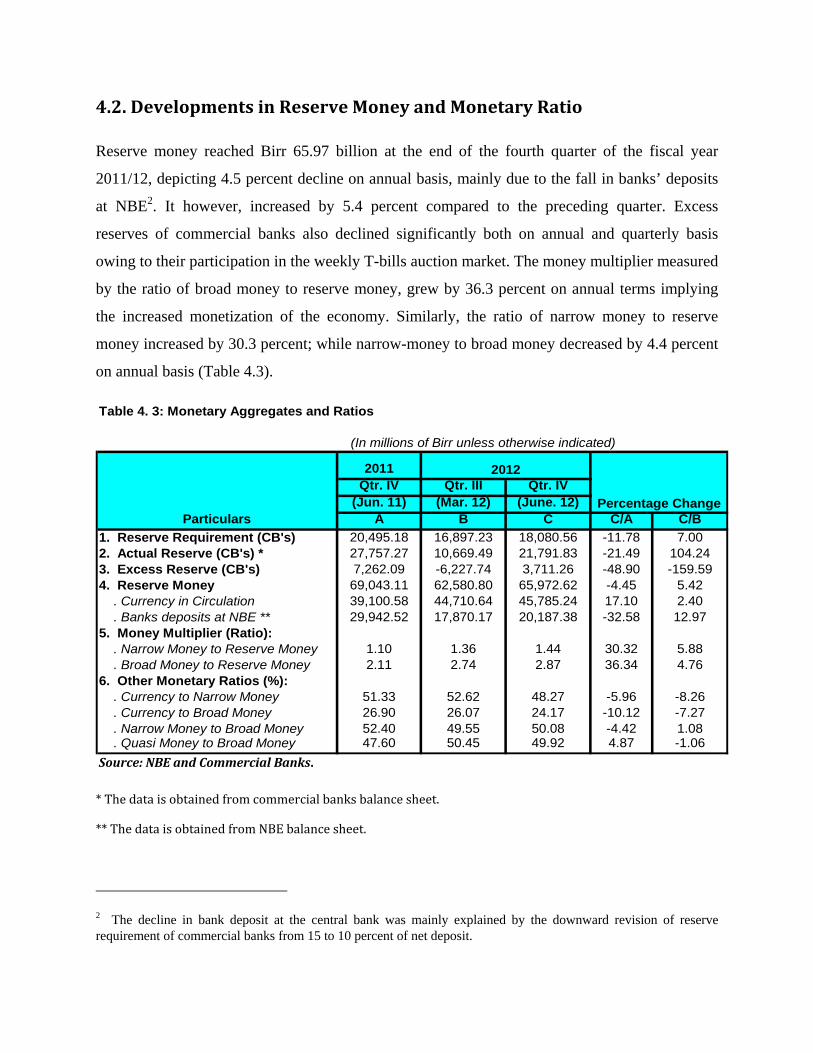
4.2.DevelopmentsinReserveMoneyandMonetaryRatio
Reserve money reached Birr 65.97 billion at the end of the fourth quarter of the fiscal year
2011/12, depicting 4.5 percent decline on annual basis, mainly due to the fall in banks’ deposits
at NBE2. It however, increased by 5.4 percent compared to the preceding quarter. Excess
reserves of commercial banks also declined significantly both on annual and quarterly basis
owing to their participation in the weekly T-bills auction market. The money multiplier measured
by the ratio of broad money to reserve money, grew by 36.3 percent on annual terms implying
the increased monetization of the economy. Similarly, the ratio of narrow money to reserve
money increased by 30.3 percent; while narrow-money to broad money decreased by 4.4 percent
on annual basis (Table 4.3).
Table 4. 3: Monetary Aggregates and Ratios
(In millions of Birr unless otherwise indicated)
2011Qtr. IV Qtr. III Qtr. IV
(Jun. 11) (Mar. 12) (June. 12)Particulars A B C C/A C/B
1. Reserve Requirement (CB's) 20,495.18 16,897.23 18,080.56 -11.78 7.002. Actual Reserve (CB's) * 27,757.27 10,669.49 21,791.83 -21.49 104.243. Excess Reserve (CB's) 7,262.09 -6,227.74 3,711.26 -48.90 -159.594. Reserve Money 69,043.11 62,580.80 65,972.62 -4.45 5.42 . Currency in Circulation 39,100.58 44,710.64 45,785.24 17.10 2.40 . Banks deposits at NBE ** 29,942.52 17,870.17 20,187.38 -32.58 12.975. Money Multiplier (Ratio): . Narrow Money to Reserve Money 1.10 1.36 1.44 30.32 5.88 . Broad Money to Reserve Money 2.11 2.74 2.87 36.34 4.766. Other Monetary Ratios (%): . Currency to Narrow Money 51.33 52.62 48.27 -5.96 -8.26 . Currency to Broad Money 26.90 26.07 24.17 -10.12 -7.27 . Narrow Money to Broad Money 52.40 49.55 50.08 -4.42 1.08 . Quasi Money to Broad Money 47.60 50.45 49.92 4.87 -1.06
Percentage Change
2012
Source:NBEandCommercialBanks.
*Thedataisobtainedfromcommercialbanksbalancesheet.
**ThedataisobtainedfromNBEbalancesheet.
2 The decline in bank deposit at the central bank was mainly explained by the downward revision of reserve requirement of commercial banks from 15 to 10 percent of net deposit.

Source:NBE

‐10,000.0
‐5,000.0
0.0
5,000.0
10,000.0
15,000.0
20,000.0
25,000.0
30,000.0
2004/05Q1
Q2
Q3
Q4
2005/06Q1
Q2
Q3
Q4
2006/07Q1
Q2
Q3
Q4
2007/08Q1
Q2
Q3
Q4
2008/09Q1
Q2
Q3
Q4
2009/10Q1
Q2
Q3
Q4
2010/11Q1
Q2
Q3
Q4
2011/12Q1
Q2
Q3
Q4
In millions of Birr
Fig IV.5: Monetary Aggregates(Fourth Quarter of 2011/12)
Required Reserve
Actual Reserve
Excess Reserve
Source:NBE
4.3.InterestRateDevelopments
Average saving deposit rate and average
lending rates remained at 5.4 and 11.88
percent, respectively, on quarterly and
annual basis. Weighted average time
deposit rate, however, registered annual
decline of 5.6 percent. On the other hand,
the weighted yearly average yield on T-
bills increased from 1.067 to 1.621
percent. However, considering annual
headline inflation of 20.9 percent during
the quarter under review, all deposit rates,
lending rates and T-bill yields remained
negative in real terms (Table 4.4).

Table4.4:‐InterestRateStructureofCommercialBanks(Percentperannum)
2010/11 2011/12PercentageChanges
QIV QIII QIV Annual Quarterly
1.SavingsDepositRate
Minimum 5 5 5 0.0 0.0
Maximum 5.75 5.75 5.75 0.0 0.0
AverageSavingRate 5.4 5.4 5.4 0.0 0.0
2.TimeDeposits
Upto1yr 5.71 5.61 5.65 ‐1.0 0.7
1‐2years 5.85 5.71 5.74 ‐1.8 0.5
Over2yrs 5.91 5.76 5.79 ‐2.1 0.5
AverageTimeDep.Rate(Weighted) 5.82 5.70 5.73 ‐1.6 0.6
3.DemandDeposit(Weighted) 0.04 0.03 0.03 ‐27.4 ‐1.9
4.LendingRate
Minimum 7.5 7.5 7.5 0.0 0.0
Maximum 16.25 16.25 16.25 0.0 0.0
AverageLendingRate 11.88 11.88 11.88 0.0 0.0
5.T‐billsRate(Weighted) 1.067 1.935 1.621 51.9 ‐16.2
6.BondYield(SimpleAverage) 3.67 3.67 3.67 0.0 0.0
7.HeadlineInflation 38.10 32.50 20.90 ‐45.1 ‐35.7
8.FoodInflation 45.30 40.90 21.50 ‐52.5 ‐47.4
9.Core/non‐foodInflation 27.90 20.40 19.80 ‐29.0 ‐2.9
Source:NBEandcommercialbanks

Source:NBEandCommercialBank
Source:NBEstaffcompilation
4.4. Developments in the Financial Sector
Banks, insurance companies and
microfinance institutions are the main
financial institutions in Ethiopia. The
number of banks operating in the country
reached 17 at the end of June 2012 of which
14 banks were privately owned.
During the review quarter, 108 new bank
branches were opened, raising the total
number of bank branches to 1289. As a
result, the ratio of total bank branch to total
population went down to 62,063 from
67,739 in the preceding quarter, reflecting
an improvement in financial service
outreach.
About 33.4 percent of the total bank
branches were located in Addis Ababa,
depicting relatively high concentration of
branches in the capital. Of the total bank
branches, the share of private banks
decreased to 47.6 percent from 48.6 percent
in the preceding quarter due to the opening
of 68 new branches by public banks during
the review quarter.
Computedbasedontheassumptionthattotalpopulationwas80million
Meanwhile, the total capital of the banking
system reached Birr 18.0 billion at the end
of the fourth quarter of the fiscal year
2011/12, of which private banks together
accounted for49.3 percent. Commercial
Bank of Ethiopia, the biggest state owned
bank, has 34.6 percent of the total capital of
the banking system. (Table 4.5)
The total number of insurance companies
operating in the country reached 15 during
the review quarter, of which 14 were
privately owned. The number of branches
increased to 243 from 221 the same period
last year. About 53.1 percent of the total
branches were located in Addis Ababa.
During the review quarter, the total capital
of the insurance industry surged by 25.6
percent on annual basis and reached Birr
1200.1 million, of which 73.3 percent
changed to private insurance companies
(Table 4.6). On the other hand, there were
31 micro-finance institutions (MFIs)
operating in the country. These MFIs
mobilized a total saving deposit of Birr 5.5
billion, which was 44.2 percent higher than
last year. Similarly, credit outstanding of
MFIs scaled up by 32.9 percent on annual
basis to reach Birr 9.3 billion. Their total

assets also increased by 31.0 percent to Birr
13.3 billion by the end of June 2012 (Table
4.7). The top five largest MFIs (Amhara
Credit & Saving, Dedebit Credit & Saving,
Oromia Credit & Saving, Omo Credit &
Saving institute and Addis credit & savings)
alone accounted for 86.6 percent of the total
capital, 94.0 percent of the savings, 89.7
percent of the credit and 90.3 percent of the
total assets of the industry.

Source:BanksupervisionDirectorate,NBE
3 Although, Zemen Bank follows a “one brach” strategy, it also includes (comprise) banking kiosk network in different locations.
Table4.5:CapitalandBranchNetworkofBankingSystematEndofJune30,2012(BranchinNumberandCapitalinMillionsofBirr)
BranchNetwork Capital
2010/11 2011/122010/11 2011/12
QuarterIV QuarterIII QuarterIVBanks
Reg. A.A Total %Share
Reg A.A Total %Share
Reg. A.A Total %Share
QuarterIV
QuarterIII
QuarterIV
1.PublicBanks CommercialBankofEthiopia 323 94 417 43.0 395 103 498 42.2 448 111 559 43.4 6,262.0 6,231.0 6,231.0Construction&BusinessBank 17 17 34 3.5 48 29 77 6.5 53 31 84 6.5 277.0 364.0 363.0DevelopmentBankofEthiopia 31 1 32 3.3 31 1 32 2.7 31 1 32 2.5 2,179.0 2,454.0 2,540.0TotalPublicBanks 371 112 483 49.8 474 133 607 51.4 532 143 675 52.4 8718 9049 91342.PrivateBanks
AwashIntern.Bank 36 34 70 7.2 37 44 81 6.9 39 47 86 6.7 1,104.0 1,254.0 1,257.0DashenBank 31 34 65 6.7 36 37 73 6.2 38 37 75 5.8 1,152.0 1,157.0 1,381.0
AbyssiniaBank 25 32 57 5.9 29 32 61 5.2 29 32 61 4.7 532.0 687.0 691.0
WegagenBank 29 24 53 5.5 33 27 60 5.1 33 27 60 4.7 1,093.0 1,267.0 1,269.0
UnitedBank 18 32 50 5.2 26 36 62 5.2 29 40 69 5.4 748.0 785.0 785.0
NibIntern.Bank 19 32 51 5.3 19 34 53 4.5 20 38 58 4.5 983.0 1,241.0 1,242.0
CooperativeBankofOromiya
38 5 43 4.4 44 6 50 4.2 45 6 51 4.0 207.0 287.0 338.0
LionIntern.Bank 17 13 30 3.1 17 13 30 2.5 19 17 36 2.8 318.0 341.0 357.0
OromiaInternationalBank
25 11 36 3.7 28 11 39 3.3 29 12 41 3.2 265.0 374.0 393.0
ZemenBank3 0 3 3 0.3 2 4 6 0.5 3 4 7 0.5 193.0 290.0 290.0
BunaInternationalBank
2 9 11 1.1 11 10 21 1.8 14 11 25 1.9 220.0 236.0 257.0
BerhanIntern.Bank 3 7 10 1.0 6 8 14 1.2 7 8 15 1.2 138.0 170.0 211.0
AbayBank 7 1 8 0.8 18 2 20 1.7 21 4 25 1.9 161.0 204.0 250.0AddisInterationalBank
n/a n/a 0 0.0 1 3 4 0.0 1 4 5 0.4 117.0 137.0 155.0
TotalPrivateBanks
250 237 487 50.2 307 267 574 48.6 327 287 614 47.6 7,231.0 8,430.0 8,876.0
3.GrandTotalBanks
621 349 970 100.0 781 400 1181 100.0 859 430 1289 100.0 15,949.0 17,479.0 18,010.0
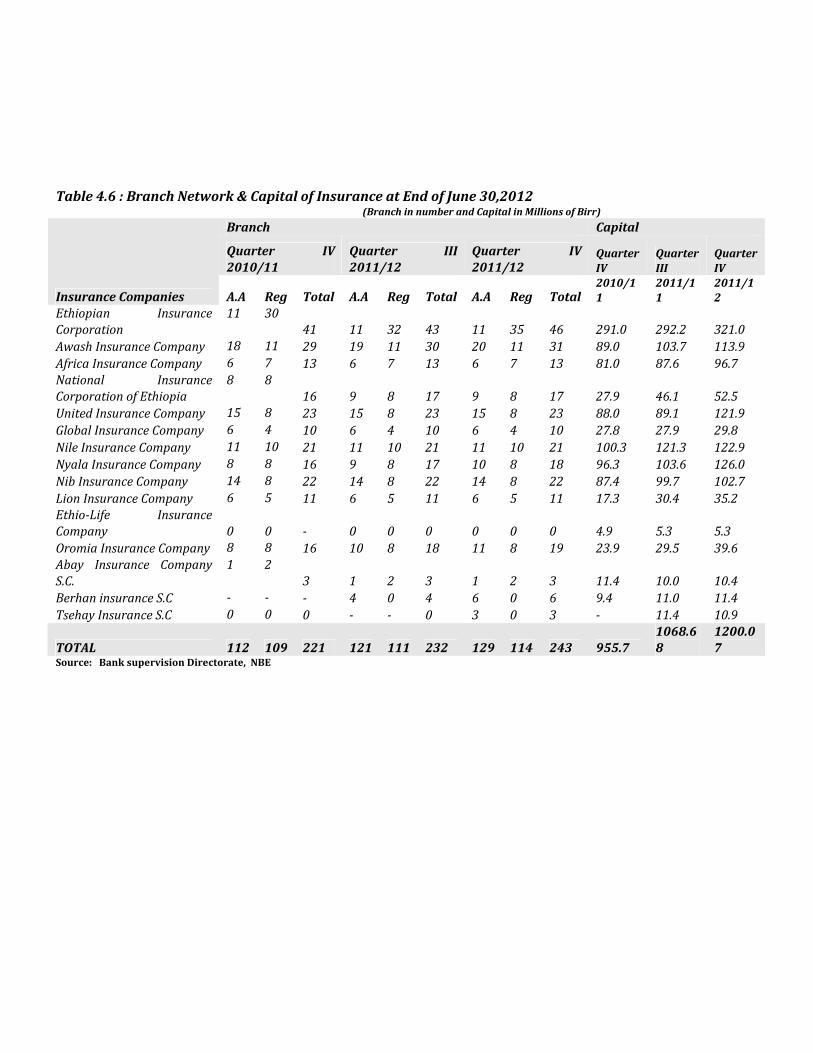
Table4.6:BranchNetwork&CapitalofInsuranceatEndofJune30,2012(BranchinnumberandCapitalinMillionsofBirr)
Branch Capital
Quarter IV2010/11
Quarter III2011/12
Quarter IV2011/12
QuarterIV
QuarterIII
QuarterIV
InsuranceCompanies A.A Reg Total A.A Reg Total A.A Reg Total2010/11
2011/11
2011/12
Ethiopian InsuranceCorporation
11 3041 11 32 43 11 35 46 291.0 292.2 321.0
AwashInsuranceCompany 18 11 29 19 11 30 20 11 31 89.0 103.7 113.9AfricaInsuranceCompany 6 7 13 6 7 13 6 7 13 81.0 87.6 96.7National InsuranceCorporationofEthiopia
8 816 9 8 17 9 8 17 27.9 46.1 52.5
UnitedInsuranceCompany 15 8 23 15 8 23 15 8 23 88.0 89.1 121.9GlobalInsuranceCompany 6 4 10 6 4 10 6 4 10 27.8 27.9 29.8NileInsuranceCompany 11 10 21 11 10 21 11 10 21 100.3 121.3 122.9NyalaInsuranceCompany 8 8 16 9 8 17 10 8 18 96.3 103.6 126.0NibInsuranceCompany 14 8 22 14 8 22 14 8 22 87.4 99.7 102.7LionInsuranceCompany 6 5 11 6 5 11 6 5 11 17.3 30.4 35.2Ethio‐Life InsuranceCompany 0 0 ‐ 0 0 0 0 0 0 4.9 5.3 5.3OromiaInsuranceCompany 8 8 16 10 8 18 11 8 19 23.9 29.5 39.6Abay Insurance CompanyS.C.
1 23 1 2 3 1 2 3 11.4 10.0 10.4
BerhaninsuranceS.C ‐ ‐ ‐ 4 0 4 6 0 6 9.4 11.0 11.4TsehayInsuranceS.C 0 0 0 ‐ ‐ 0 3 0 3 ‐ 11.4 10.9
TOTAL 112 109 221 121 111 232 129 114 243 955.71068.68
1200.07
Source:BanksupervisionDirectorate,NBE
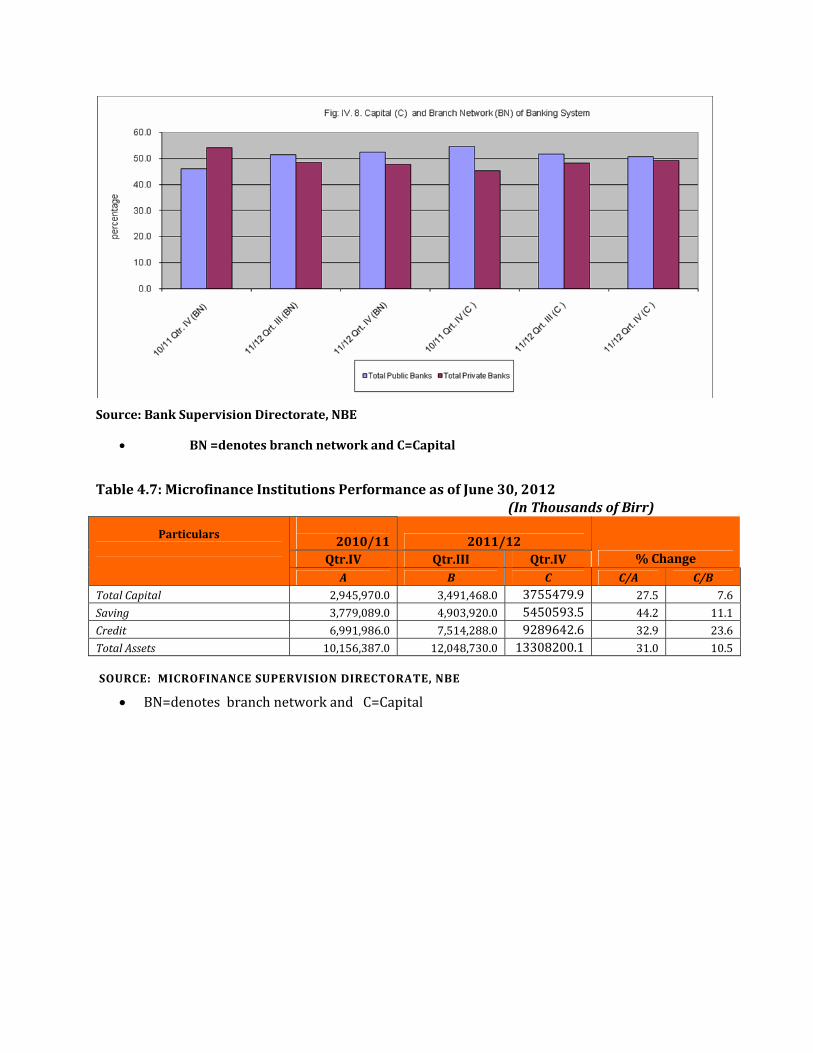
Source:BankSupervisionDirectorate,NBE
BN=denotesbranchnetworkandC=Capital
SOURCE:MICROFINANCESUPERVISIONDIRECTORATE,NBE
BN=denotesbranchnetworkandC=Capital
Table4.7:MicrofinanceInstitutionsPerformanceasofJune30,2012(InThousandsofBirr)
2010/11 2011/12
Qtr.IV Qtr.III Qtr.IV %Change
Particulars
A B C C/A C/B
TotalCapital 2,945,970.0 3,491,468.0 3755479.9 27.5 7.6
Saving 3,779,089.0 4,903,920.0 5450593.5 44.2 11.1
Credit 6,991,986.0 7,514,288.0 9289642.6 32.9 23.6
TotalAssets 10,156,387.0 12,048,730.0 13308200.1 31.0 10.5
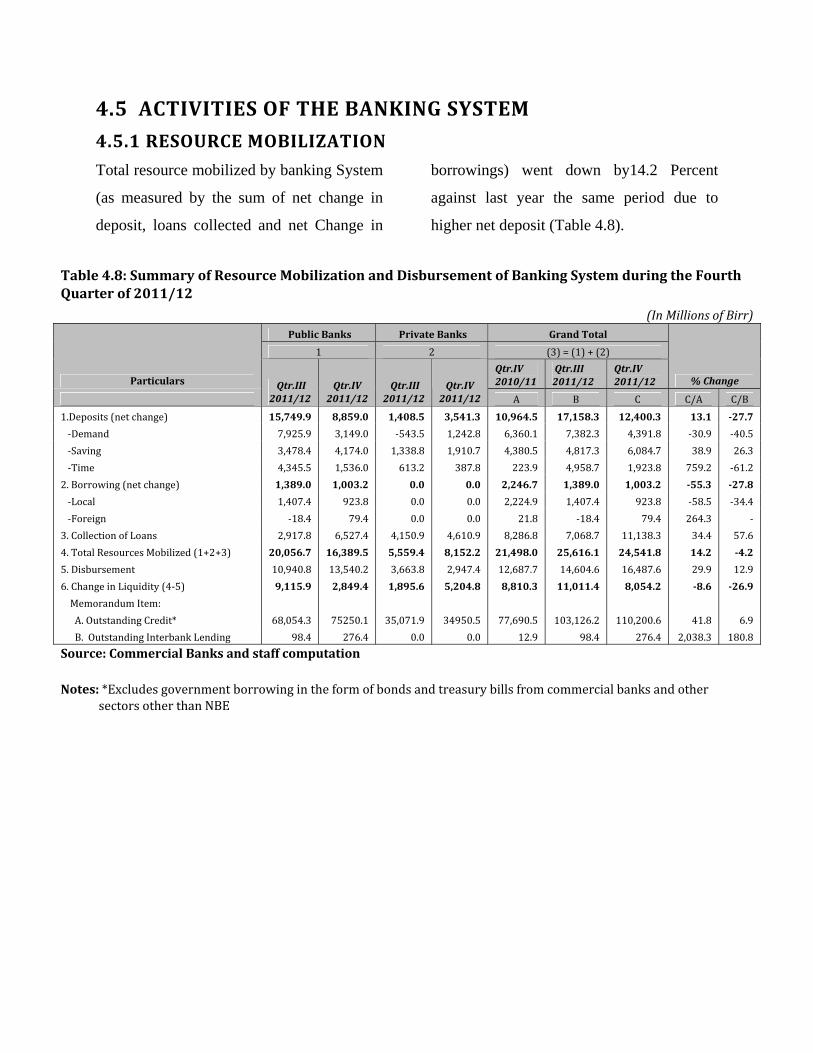
4.5ACTIVITIESOFTHEBANKINGSYSTEM
4.5.1RESOURCEMOBILIZATION
Total resource mobilized by banking System
(as measured by the sum of net change in
deposit, loans collected and net Change in
borrowings) went down by14.2 Percent
against last year the same period due to
higher net deposit (Table 4.8).
Table4.8:SummaryofResourceMobilizationandDisbursementofBankingSystemduringtheFourthQuarterof2011/12
(InMillionsofBirr)PublicBanks PrivateBanks GrandTotal
1 2 (3)=(1)+(2)
ParticularsQtr.IV2010/11
Qtr.III2011/12
Qtr.IV2011/12 %Change
Qtr.III2011/12
Qtr.IV2011/12
Qtr.III2011/12
Qtr.IV2011/12 A B C C/A C/B
1.Deposits(netchange) 15,749.9 8,859.0 1,408.5 3,541.3 10,964.5 17,158.3 12,400.3 13.1 ‐27.7
‐Demand 7,925.9 3,149.0 ‐543.5 1,242.8 6,360.1 7,382.3 4,391.8 ‐30.9 ‐40.5
‐Saving 3,478.4 4,174.0 1,338.8 1,910.7 4,380.5 4,817.3 6,084.7 38.9 26.3
‐Time 4,345.5 1,536.0 613.2 387.8 223.9 4,958.7 1,923.8 759.2 ‐61.2
2.Borrowing(netchange) 1,389.0 1,003.2 0.0 0.0 2,246.7 1,389.0 1,003.2 ‐55.3 ‐27.8
‐Local 1,407.4 923.8 0.0 0.0 2,224.9 1,407.4 923.8 ‐58.5 ‐34.4
‐Foreign ‐18.4 79.4 0.0 0.0 21.8 ‐18.4 79.4 264.3 ‐
3.CollectionofLoans 2,917.8 6,527.4 4,150.9 4,610.9 8,286.8 7,068.7 11,138.3 34.4 57.6
4.TotalResourcesMobilized(1+2+3) 20,056.7 16,389.5 5,559.4 8,152.2 21,498.0 25,616.1 24,541.8 14.2 ‐4.2
5.Disbursement 10,940.8 13,540.2 3,663.8 2,947.4 12,687.7 14,604.6 16,487.6 29.9 12.9
6.ChangeinLiquidity(4‐5) 9,115.9 2,849.4 1,895.6 5,204.8 8,810.3 11,011.4 8,054.2 ‐8.6 ‐26.9
MemorandumItem:
A.OutstandingCredit* 68,054.3 75250.1 35,071.9 34950.5 77,690.5 103,126.2 110,200.6 41.8 6.9
B.OutstandingInterbankLending 98.4 276.4 0.0 0.0 12.9 98.4 276.4 2,038.3 180.8
Source:CommercialBanksandstaffcomputation Notes:*ExcludesgovernmentborrowingintheformofbondsandtreasurybillsfromcommercialbanksandothersectorsotherthanNBE

Source:NBE
4.5.1.1 Deposit Mobilization
Total deposit liabilities of the banking
system reached Birr 187.3billion at the end
of the fourth quarter of the fiscal year
2011/12, indicating a quarterly and annual
growth rate of 7.1 and 33.3 percent,
respectively. The growth in deposit
mobilization was partly attributed to the rise
in the number of bank branches opened by
commercial banks and improvements in
economic activities. Component wise,
demand deposits, which accounted for 49.3
percent of the total deposits, reached Birr
92.3 billion, showing quarterly and annual
growth rates of 5.0 and 30.2 percent,
respectively. Similarly, saving deposits, with
44.0 percent share in total deposits increased
by 8.0 and 27.8 percent during same period.
Time deposits, which constituted 6.7 percent
of the total deposit liabilities surged by
143.0 percent over same period last year.
The share of public banks in total deposits
mobilization increased marginally to 68.1
percent from 64.5 percent last year, while
the share of private banks decreased from
35.5 to 31.9 percent (Table 4.9).
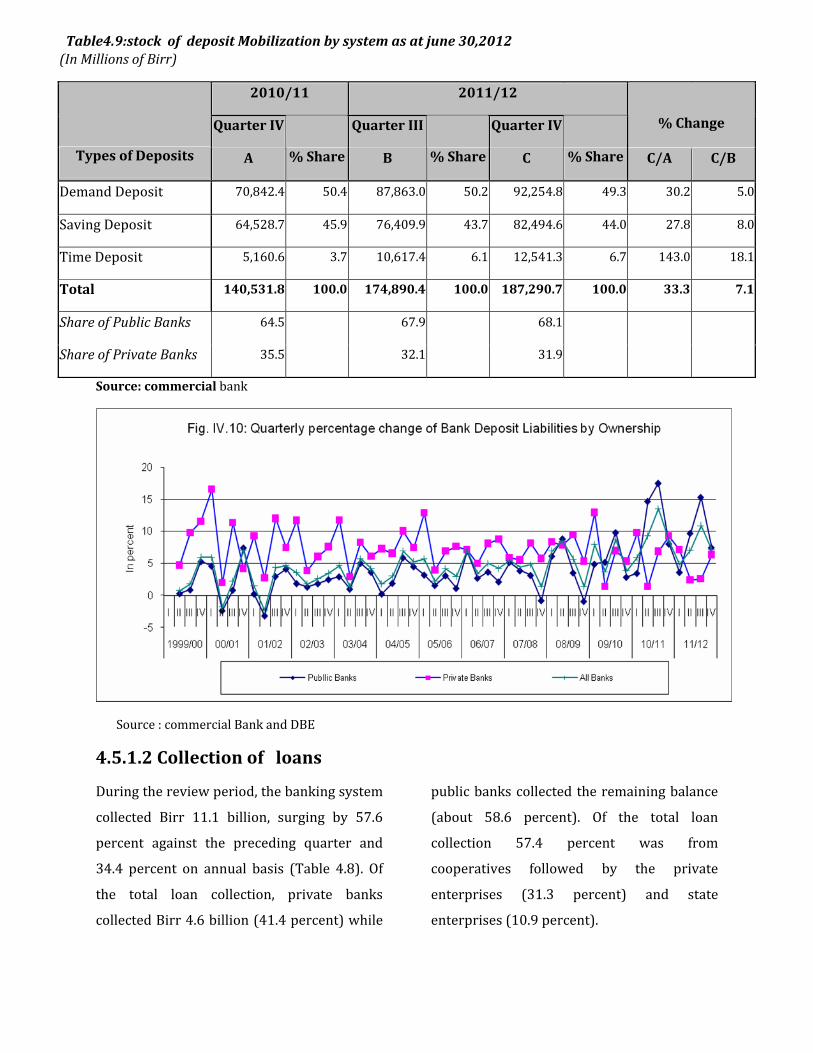
Source:commercialbank
Source:commercialBankandDBE
4.5.1.2Collectionofloans
Duringthereviewperiod,thebankingsystem
collected Birr 11.1 billion, surging by 57.6
percent against the preceding quarter and
34.4 percent on annual basis (Table 4.8). Of
the total loan collection, private banks
collectedBirr4.6billion(41.4percent)while
publicbankscollectedtheremainingbalance
(about 58.6 percent). Of the total loan
collection 57.4 percent was from
cooperatives followed by the private
enterprises (31.3 percent) and state
enterprises(10.9percent).
Table4.9:stockofdepositMobilizationbysystemasatjune30,2012(InMillionsofBirr)
2010/11 2011/12
QuarterIV QuarterIII QuarterIV %Change
TypesofDeposits A %Share B %Share C %Share C/A C/B
DemandDeposit 70,842.4 50.4 87,863.0 50.2 92,254.8 49.3 30.2 5.0
SavingDeposit 64,528.7 45.9 76,409.9 43.7 82,494.6 44.0 27.8 8.0
TimeDeposit 5,160.6 3.7 10,617.4 6.1 12,541.3 6.7 143.0 18.1
Total 140,531.8 100.0 174,890.4 100.0 187,290.7 100.0 33.3 7.1
ShareofPublicBanks 64.5 67.9 68.1
ShareofPrivateBanks 35.5 32.1 31.9
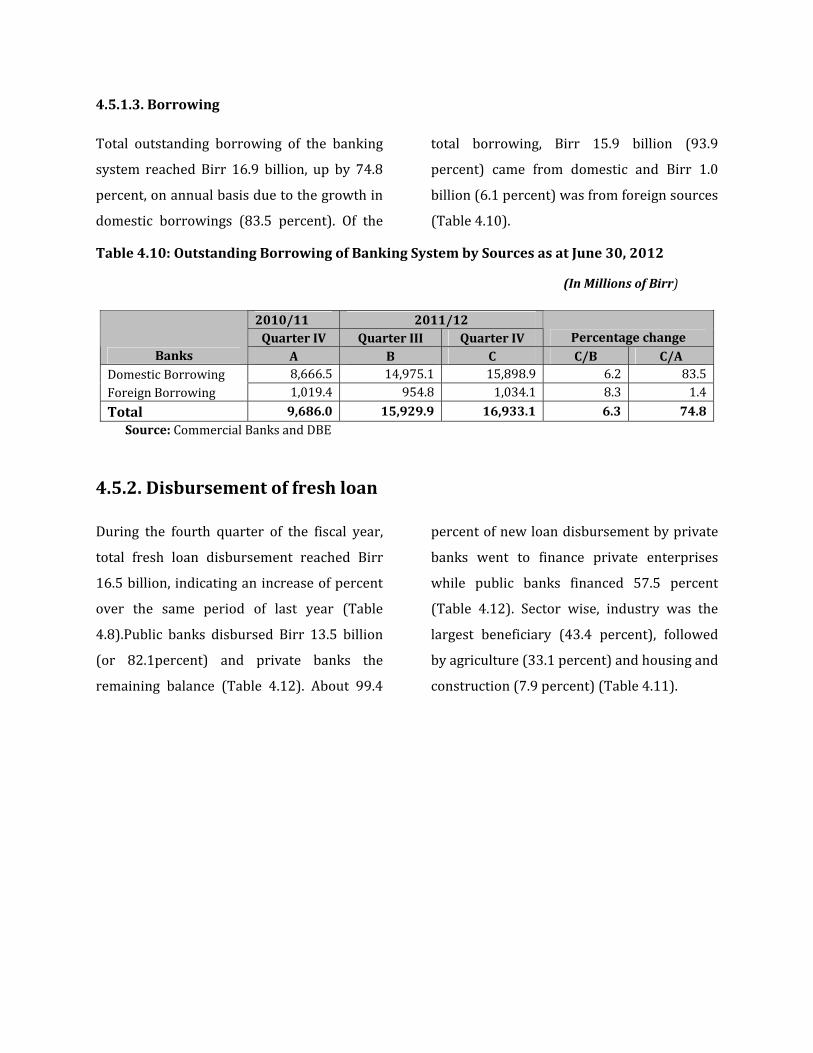
4.5.1.3.Borrowing
Total outstanding borrowing of the banking
system reached Birr 16.9 billion, up by 74.8
percent,onannualbasisduetothegrowthin
domestic borrowings (83.5 percent). Of the
total borrowing, Birr 15.9 billion (93.9
percent) came from domestic and Birr 1.0
billion(6.1percent)wasfromforeignsources
(Table4.10).
Table4.10:OutstandingBorrowingofBankingSystembySourcesasatJune30,2012
(InMillionsofBirr)
Source:CommercialBanksandDBE
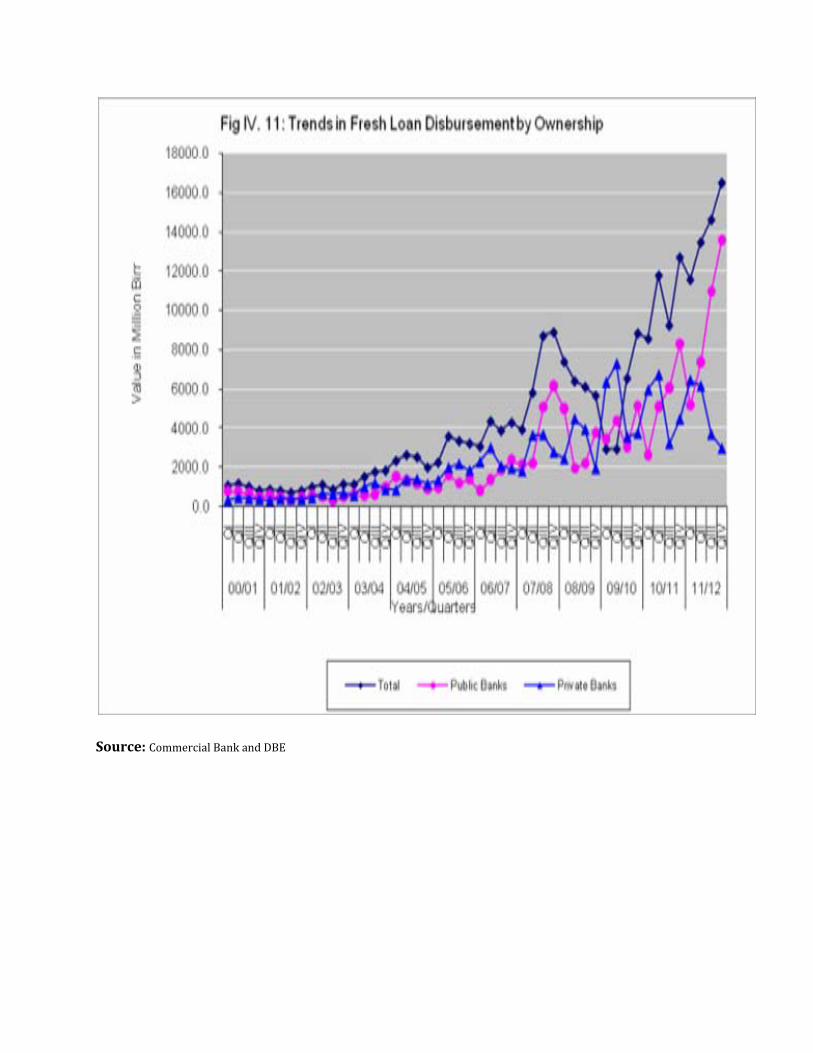
4.5.2.Disbursementoffreshloan
During the fourth quarter of the fiscal year,
total fresh loan disbursement reached Birr
16.5billion, indicatinganincreaseofpercent
over the same period of last year (Table
4.8).Public banks disbursed Birr 13.5 billion
(or 82.1percent) and private banks the
remaining balance (Table 4.12). About 99.4
percentofnewloandisbursementbyprivate
banks went to finance private enterprises
while public banks financed 57.5 percent
(Table 4.12). Sector wise, industry was the
largest beneficiary (43.4 percent), followed
byagriculture(33.1percent)andhousingand
construction(7.9percent)(Table4.11).
2010/11 2011/12QuarterIV QuarterIII QuarterIV Percentagechange
Banks A B C C/B C/ADomesticBorrowing 8,666.5 14,975.1 15,898.9 6.2 83.5ForeignBorrowing 1,019.4 954.8 1,034.1 8.3 1.4
Total 9,686.0 15,929.9 16,933.1 6.3 74.8
Source:CommercialBankandDBE
4.5.3.OutstandingCredit
Total outstanding credit of the banking
system (excluding credit to government)
increased toBirr110.2billionat theend
ofJune2012,up41.8percenthigherthan
lastyear(Table4.8).
Of the total outstanding loan, Birr 34.1
billion (43.7 percent) was claims on
privateenterprises,35.5percentonstate
enterprises and 16.9 percent on
cooperatives (Table 4.12). Sector wise,
credit to industry sector stood firstwith
30.5 percent share followed by
international trade (22.7 percent),
agriculture (15.6 percent), housing &
construction(11.2percent)anddomestic
trade (11.0 percent), refer Table 4.11
above.
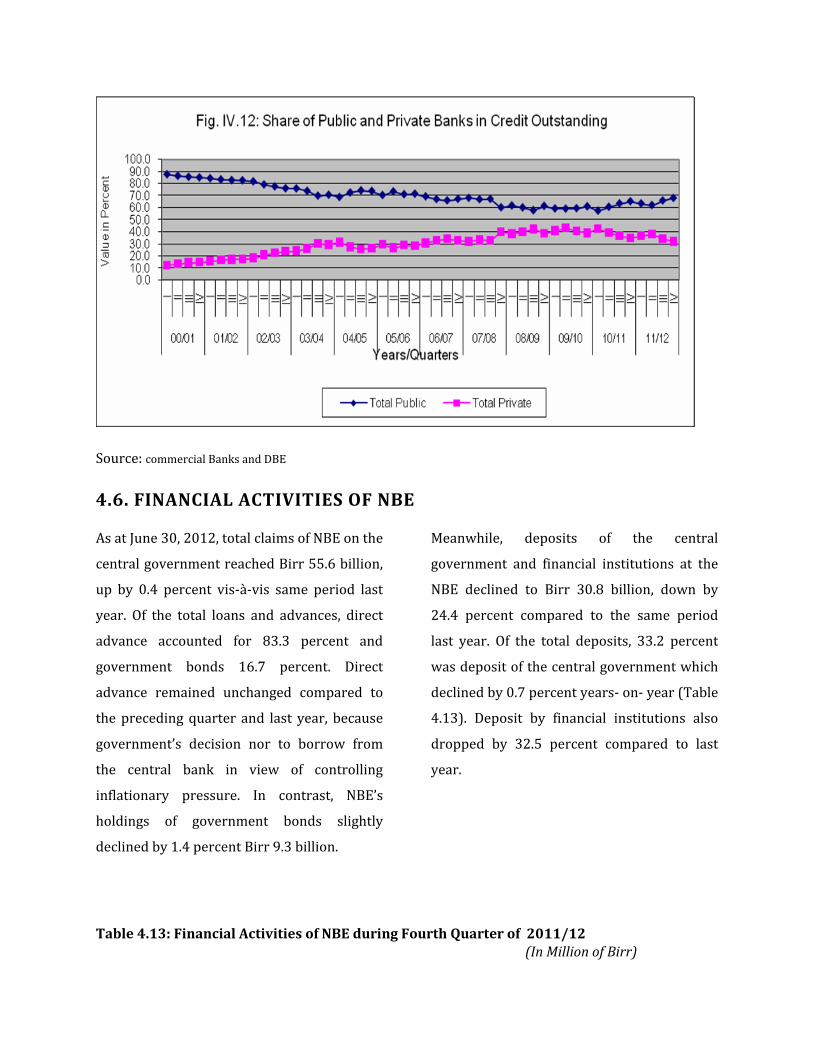
The share of private banks in total
outstanding loan was 32.0 percent
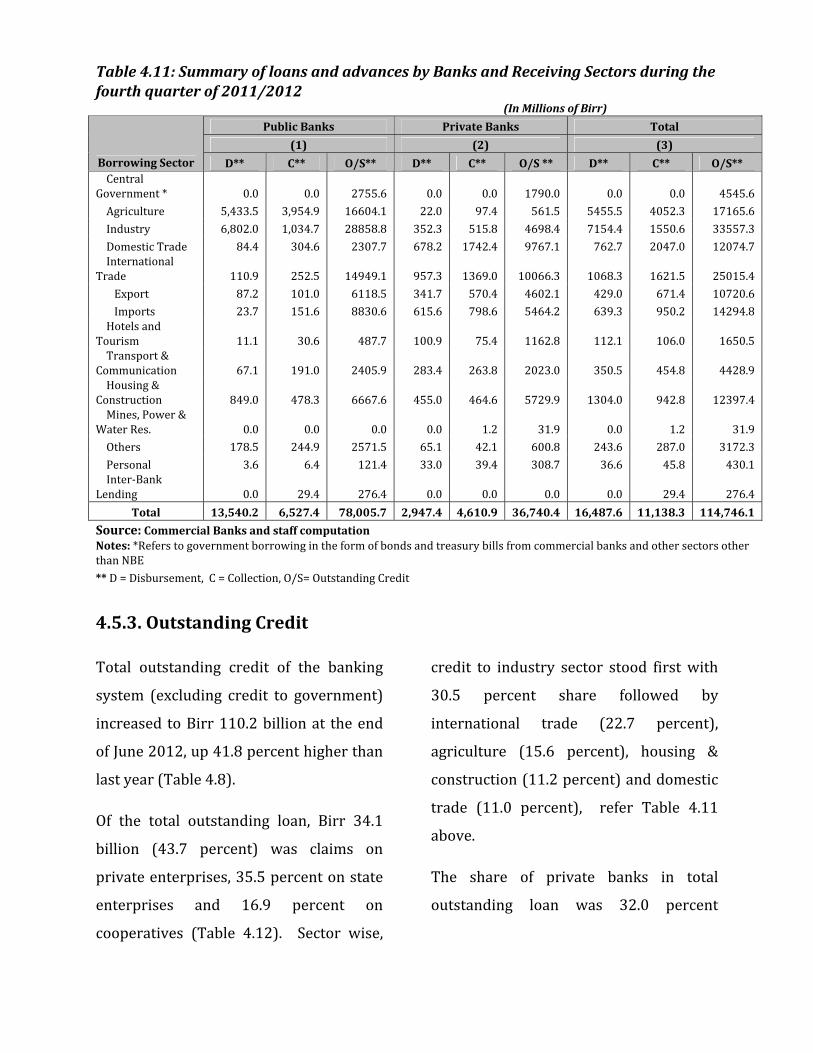
Table4.11:SummaryofloansandadvancesbyBanksandReceivingSectorsduringthefourthquarterof2011/2012(InMillionsofBirr)
PublicBanks PrivateBanks Total
(1) (2) (3)
BorrowingSector D** C** O/S** D** C** O/S** D** C** O/S**CentralGovernment* 0.0 0.0 2755.6 0.0 0.0 1790.0 0.0 0.0 4545.6
Agriculture 5,433.5 3,954.9 16604.1 22.0 97.4 561.5 5455.5 4052.3 17165.6
Industry 6,802.0 1,034.7 28858.8 352.3 515.8 4698.4 7154.4 1550.6 33557.3
DomesticTrade 84.4 304.6 2307.7 678.2 1742.4 9767.1 762.7 2047.0 12074.7InternationalTrade 110.9 252.5 14949.1 957.3 1369.0 10066.3 1068.3 1621.5 25015.4
Export 87.2 101.0 6118.5 341.7 570.4 4602.1 429.0 671.4 10720.6
Imports 23.7 151.6 8830.6 615.6 798.6 5464.2 639.3 950.2 14294.8HotelsandTourism 11.1 30.6 487.7 100.9 75.4 1162.8 112.1 106.0 1650.5Transport&Communication 67.1 191.0 2405.9 283.4 263.8 2023.0 350.5 454.8 4428.9Housing&Construction 849.0 478.3 6667.6 455.0 464.6 5729.9 1304.0 942.8 12397.4Mines,Power&WaterRes. 0.0 0.0 0.0 0.0 1.2 31.9 0.0 1.2 31.9
Others 178.5 244.9 2571.5 65.1 42.1 600.8 243.6 287.0 3172.3
Personal 3.6 6.4 121.4 33.0 39.4 308.7 36.6 45.8 430.1Inter‐BankLending 0.0 29.4 276.4 0.0 0.0 0.0 0.0 29.4 276.4
Total 13,540.2 6,527.4 78,005.7 2,947.4 4,610.9 36,740.4 16,487.6 11,138.3 114,746.1
Source:CommercialBanksandstaffcomputationNotes:*ReferstogovernmentborrowingintheformofbondsandtreasurybillsfromcommercialbanksandothersectorsotherthanNBE
**D=Disbursement,C=Collection,O/S=OutstandingCredit
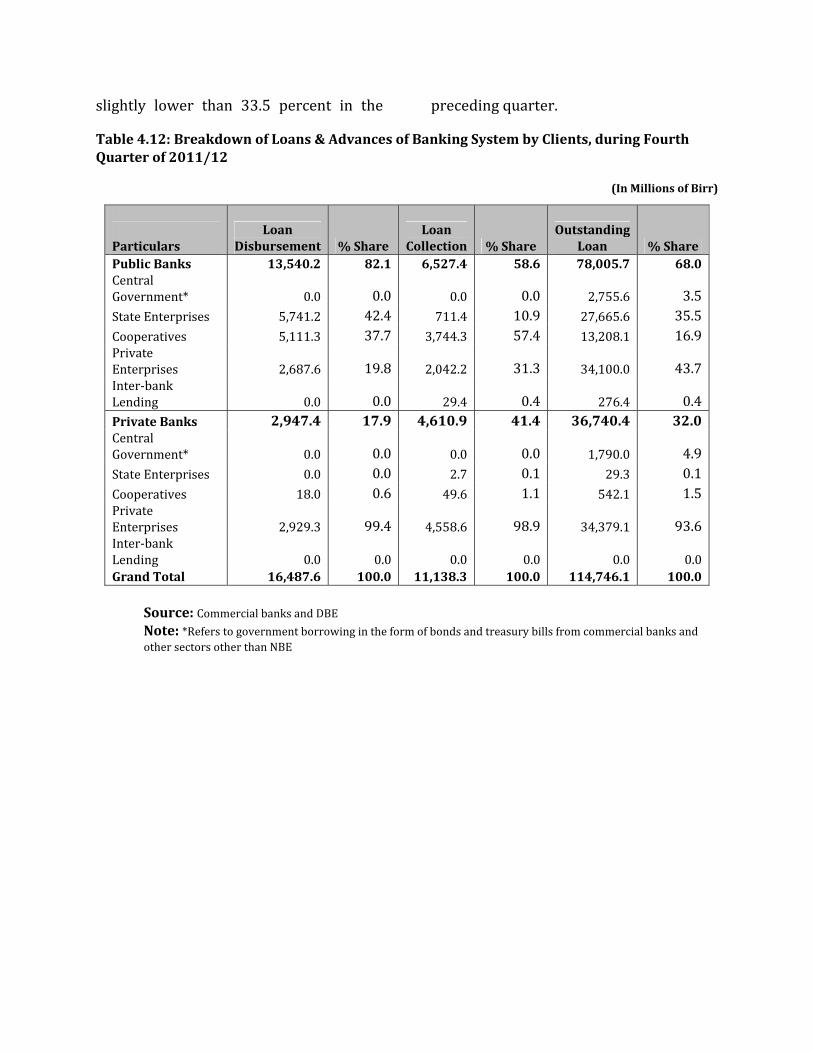
slightly lower than 33.5 percent in the precedingquarter.
Table4.12:BreakdownofLoans&AdvancesofBankingSystembyClients,duringFourthQuarterof2011/12
(InMillionsofBirr)
Source:CommercialbanksandDBENote:*ReferstogovernmentborrowingintheformofbondsandtreasurybillsfromcommercialbanksandothersectorsotherthanNBE
Particulars
LoanDisbursement %Share
LoanCollection %Share
OutstandingLoan %Share
PublicBanks 13,540.2 82.1 6,527.4 58.6 78,005.7 68.0CentralGovernment* 0.0 0.0 0.0 0.0 2,755.6 3.5StateEnterprises 5,741.2 42.4 711.4 10.9 27,665.6 35.5Cooperatives 5,111.3 37.7 3,744.3 57.4 13,208.1 16.9PrivateEnterprises 2,687.6 19.8 2,042.2 31.3 34,100.0 43.7Inter‐bankLending 0.0 0.0 29.4 0.4 276.4 0.4PrivateBanks 2,947.4 17.9 4,610.9 41.4 36,740.4 32.0CentralGovernment* 0.0 0.0 0.0 0.0 1,790.0 4.9StateEnterprises 0.0 0.0 2.7 0.1 29.3 0.1Cooperatives 18.0 0.6 49.6 1.1 542.1 1.5PrivateEnterprises 2,929.3 99.4 4,558.6 98.9 34,379.1 93.6Inter‐bankLending 0.0 0.0 0.0 0.0 0.0 0.0GrandTotal 16,487.6 100.0 11,138.3 100.0 114,746.1 100.0
Source:commercialBanksandDBE
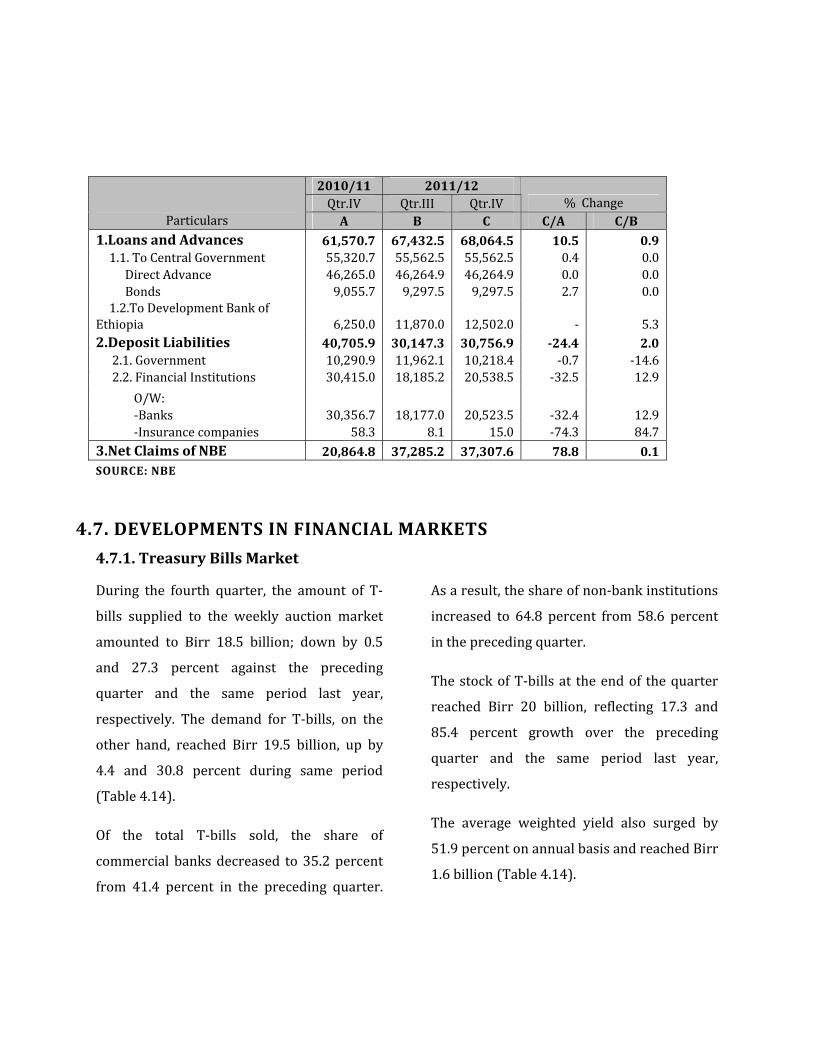
4.6.FINANCIALACTIVITIESOFNBE
AsatJune30,2012,totalclaimsofNBEonthe
centralgovernmentreachedBirr55.6billion,
up by 0.4 percent vis‐à‐vis same period last
year. Of the total loans and advances, direct
advance accounted for 83.3 percent and
government bonds 16.7 percent. Direct
advance remained unchanged compared to
theprecedingquarter and last year, because
government’s decision nor to borrow from
the central bank in view of controlling
inflationary pressure. In contrast, NBE’s
holdings of government bonds slightly
declinedby1.4percentBirr9.3billion.
Meanwhile, deposits of the central
government and financial institutions at the
NBE declined to Birr 30.8 billion, down by
24.4 percent compared to the same period
last year. Of the total deposits, 33.2 percent
wasdepositofthecentralgovernmentwhich
declinedby0.7percentyears‐on‐year(Table
4.13). Deposit by financial institutions also
dropped by 32.5 percent compared to last
year.
Table4.13:FinancialActivitiesofNBEduringFourthQuarterof2011/12
(InMillionofBirr)
SOURCE:NBE
4.7.DEVELOPMENTSINFINANCIALMARKETS
4.7.1.TreasuryBillsMarket
During the fourth quarter, the amount of T‐
bills supplied to the weekly auction market
amounted to Birr 18.5 billion; down by 0.5
and 27.3 percent against the preceding
quarter and the same period last year,
respectively. The demand for T‐bills, on the
other hand, reached Birr 19.5 billion, up by
4.4 and 30.8 percent during same period
(Table4.14).
Of the total T‐bills sold, the share of
commercialbanksdecreased to35.2percent
from 41.4 percent in the preceding quarter.
Asaresult,theshareofnon‐bankinstitutions
increased to 64.8 percent from 58.6 percent
intheprecedingquarter.
ThestockofT‐billsat theendof thequarter
reached Birr 20 billion, reflecting 17.3 and
85.4 percent growth over the preceding
quarter and the same period last year,
respectively.
The average weighted yield also surged by
51.9percentonannualbasisandreachedBirr
1.6billion(Table4.14).
2010/11 2011/12Qtr.IV Qtr.III Qtr.IV %Change
Particulars A B C C/A C/B1.LoansandAdvances 61,570.7 67,432.5 68,064.5 10.5 0.91.1.ToCentralGovernment 55,320.7 55,562.5 55,562.5 0.4 0.0
DirectAdvance 46,265.0 46,264.9 46,264.9 0.0 0.0Bonds 9,055.7 9,297.5 9,297.5 2.7 0.01.2.ToDevelopmentBankof
Ethiopia 6,250.0 11,870.0 12,502.0 ‐ 5.32.DepositLiabilities 40,705.9 30,147.3 30,756.9 ‐24.4 2.02.1.Government 10,290.9 11,962.1 10,218.4 ‐0.7 ‐14.62.2.FinancialInstitutions 30,415.0 18,185.2 20,538.5 ‐32.5 12.9
O/W: ‐Banks 30,356.7 18,177.0 20,523.5 ‐32.4 12.9‐Insurancecompanies 58.3 8.1 15.0 ‐74.3 84.73.NetClaimsofNBE 20,864.8 37,285.2 37,307.6 78.8 0.1
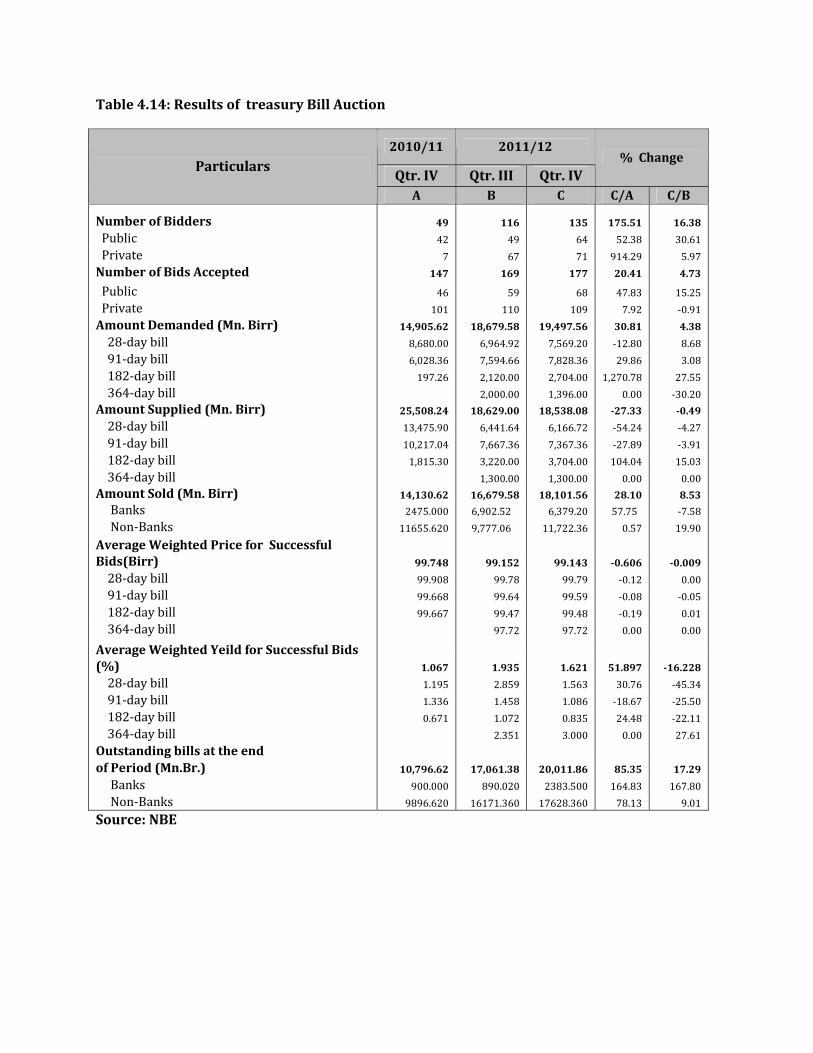
Table4.14:ResultsoftreasuryBillAuction
Source:NBE
2010/11 2011/12
Qtr.IV Qtr.III Qtr.IV%Change
Particulars
A B C C/A C/B
NumberofBidders 49 116 135 175.51 16.38
Public 42 49 64 52.38 30.61
Private 7 67 71 914.29 5.97
NumberofBidsAccepted 147 169 177 20.41 4.73
Public 46 59 68 47.83 15.25
Private 101 110 109 7.92 ‐0.91
AmountDemanded(Mn.Birr) 14,905.62 18,679.58 19,497.56 30.81 4.38
28‐daybill 8,680.00 6,964.92 7,569.20 ‐12.80 8.68
91‐daybill 6,028.36 7,594.66 7,828.36 29.86 3.08
182‐daybill 197.26 2,120.00 2,704.00 1,270.78 27.55
364‐daybill 2,000.00 1,396.00 0.00 ‐30.20
AmountSupplied(Mn.Birr) 25,508.24 18,629.00 18,538.08 ‐27.33 ‐0.49
28‐daybill 13,475.90 6,441.64 6,166.72 ‐54.24 ‐4.27
91‐daybill 10,217.04 7,667.36 7,367.36 ‐27.89 ‐3.91
182‐daybill 1,815.30 3,220.00 3,704.00 104.04 15.03
364‐daybill 1,300.00 1,300.00 0.00 0.00
AmountSold(Mn.Birr) 14,130.62 16,679.58 18,101.56 28.10 8.53
Banks 2475.000 6,902.52 6,379.20 57.75 ‐7.58
Non‐Banks 11655.620 9,777.06 11,722.36 0.57 19.90
AverageWeightedPriceforSuccessfulBids(Birr) 99.748 99.152 99.143 ‐0.606 ‐0.009
28‐daybill 99.908 99.78 99.79 ‐0.12 0.00
91‐daybill 99.668 99.64 99.59 ‐0.08 ‐0.05
182‐daybill 99.667 99.47 99.48 ‐0.19 0.01
364‐daybill 97.72 97.72 0.00 0.00
AverageWeightedYeildforSuccessfulBids(%) 1.067 1.935 1.621 51.897 ‐16.228
28‐daybill 1.195 2.859 1.563 30.76 ‐45.34
91‐daybill 1.336 1.458 1.086 ‐18.67 ‐25.50
182‐daybill 0.671 1.072 0.835 24.48 ‐22.11
364‐daybill 2.351 3.000 0.00 27.61
Outstandingbillsattheend
ofPeriod(Mn.Br.) 10,796.62 17,061.38 20,011.86 85.35 17.29
Banks 900.000 890.020 2383.500 164.83 167.80
Non‐Banks 9896.620 16171.360 17628.360 78.13 9.01


4.7.3.CorporateBondMarket
Corporate bond market is not developed in
Ethiopia; the big players are few public
institutions and regional governments. The
purchaserofthesebondsistheCommercialBank
ofEthiopia(CBE).
Duringthequarterunderreview,CBEpurchased
corporatebondsworthBirr6.6billion,ofwhich
76.3 percent were issued by public enterprises
and the rest by the Addis Ababa City
Administrationtofinancehousingproject.
At the end of June 31, 2012, the stock of
corporate bonds held by the CBE stood at Birr
61.8billion,ofwhich82.2percentwasclaimson
publicenterprisesandtheremainingbalance,on
regional states (Table 4.15). Corporate bonds
issued by EEPCO accounted for 79.1 percent of
thetotaloutstandingcorporatebondbalanceand
96.3 percent of the bonds issued by public
enterprises.
2010/11 2011/12
QIV QIII QIVIssueroftheBond
NP Red O/S NP Red O/S NP Red O/S
1.PuplicEnterprises 2,800.0 4,318.6 31,400.0 6,100.0 0.0 45,800.0 5,000.0 4,318.6 50,770.9
EEPCO 2,600.0 0.0 29,600.0 6,000.0 0.0 43,900.0 5,000.0 0.0 48,900.0
ETC 0.0 0.0 0.0 0.0 0.0 0.0 0.0 0.0 0.0
DBE 200.0 4,318.6 1,800.0 100.0 0.0 1,900.0 0.0 4,318.6 1,870.9
2.RegionalGovernments
1,091.0 451.5 8,858.3 1,350.0 449.5 10,222.5 1,550.0 753.9 11,015.8
Oromia 164.0 25.6 2,004.2 0.0 0.0 1993.3 0.0 0.4 1993.0
Amhara 169.0 31.4 1,393.1 0.0 213.0 1080.0 0.0 329.0 751.1
Tigray 85.0 15.0 774.0 0.0 34.1 724.1 0.0 2.4 721.7
SNNPRS 23.0 52.2 988.8 0.0 38.3 821.0 0.0 29.5 791.5
DireDawa 40.0 16.2 213.7 0.0 4.8 216.0 0.0 5.6 210.4
Harari 10.0 16.2 148.9 0.0 12.8 109.6 0.0 14.7 94.8
AddiaAbaba 600.0 294.9 3,335.6 1350.0 146.5 5278.5 1550.0 372.3 6453.4
3.GrandTotal(1+2) 3,891.0 4,770.1 40,258.3 7,450.0 449.5 56,022.5 6,550.0 5,072.5 61,786.7
Source: NBE Note:NP=NewPurchase,Red.=Redemption,O/S=outstanding