Embed Size (px)
Citation preview

New Approach to Design Capillary Pressure Curves, which Would Improve Simulation Models
Initialization and Shorten History Match Processes Time Consume.
Qatar 2012
SPE-ATW “Reservoir Modeling: Strategies forOptimizing Business Decisions”
Faisal [email protected]
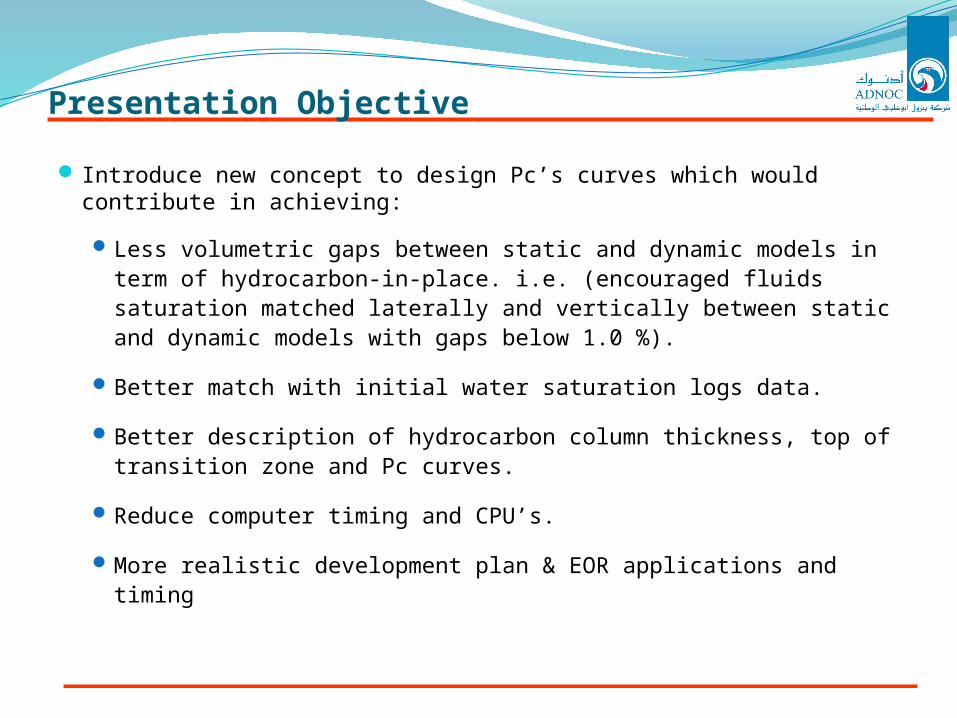
Introduce new concept to design Pc’s curves which would contribute in achieving:
Less volumetric gaps between static and dynamic models in term of hydrocarbon-in-place. i.e. (encouraged fluids saturation matched laterally and vertically between static and dynamic models with gaps below 1.0 %).
Better match with initial water saturation logs data.
Better description of hydrocarbon column thickness, top of transition zone and Pc curves.
Reduce computer timing and CPU’s.
More realistic development plan & EOR applications and timing
Presentation Objective
Presentation Outline
To address the current issues of main concern issues with the simulation modeling.
To address alternative Pc’s curves design to enhance simulation models accuracy.
History Case Studies.
Finding and Conclusions.

Presentation Outline
To address the current issues of main concern issues with the simulation modeling.
To address alternative Pc’s curves design to enhance simulation models accuracy.
History Case Studies.
Finding and Conclusions.

Current Pc’s Curves Design Concern Issues
SW_PC (%)
Hei
ght A
bove
FW
L D
epth
(ft
)
Hei
ght A
bove
FW
L D
epth
(ft
)
RT’sTop
Bottom
SW_LOG (%)
Krw << 0
Water is not allow to move below Swcr’s values … !!Where is top of the transition Zone … !!

Current Pc’s Curves Design Concern Issues
Sw_log data are still scattered per geological rock type classificationSingle Pc curve might not be able to present Sw_log data

Current Pc’s Curves Design Concern Issues
Top of the transition zones in the current simulation models, are usually presented with high Pc’s curves values just to match Sw_log wells profiles, although the water is considered as
immobile in the simulation models until cell Sw values reached above selected Swcr or/and reasonable Krw’s values e.g.
(>0.00001)
Thus, is it possible that top of the transition zone is very low and at higher Sw, with respect of existing many wells that produced
dry oil at high rate during production tests and for couple months before started water cut, while they perforated at nearby FWL
depth.
Because of continued changing water saturation with depthwhich might be due to wettability issue
Currently many engineers are using best fit or/and height above FWL function or/and J-Function Pc’s
curves with high values, which assuming the whole reservoir is in the transition zone ... !!?
Consequently, in order to slow down watermovement in transition zone, either by use:
(1) Unphysical Swcr’s “Simulator Parameter”(2) Very low Krw’s values
(3) Unsupported permeability multiplier
FWL depth100% water
Krw
Kro
Swirr Sor
Top of transition zone i.e. (oil dry limit)
0.0
1.0
Swcr
Is this part of the transition zone?? where no water is allow to move between Swirr & Swcr ranges!!
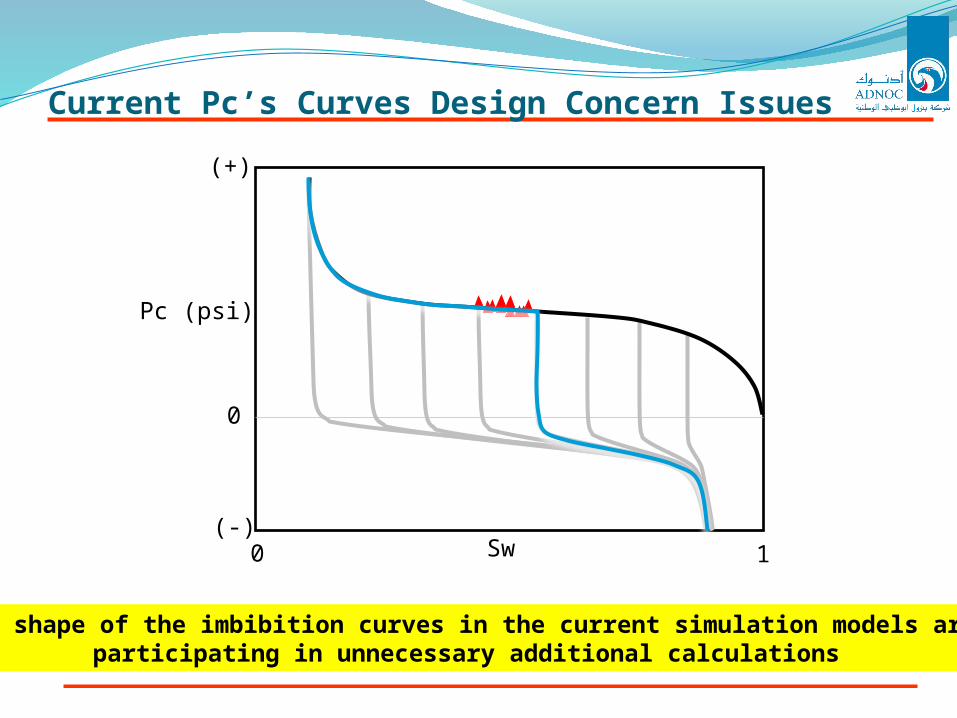
Current Pc’s Curves Design Concern Issues
The shape of the imbibition curves in the current simulation models areparticipating in unnecessary additional calculations
Sw
Pc (psi)
0
(-)
(+)
0 1

Current Pc’s Curves Design Concern Issues
Main Questions:
• How to generate drainage Pc’s curves that would replicate wells Sw_log profiles in the dynamic models at high resolution level?
• How to introduce thin transition zone definition into dynamic models while honoring wells Sw_log profiles?
• How to slowdown water movement in dynamic in transition zone model without using Swcr’s values or lowering Krw’s values or applying permeability multipliers?
• and how to improve dynamic models running performance and stability?
Presentation Outline
To address the current issues of main concern issues with the simulation modeling.
To address alternative Pc’s curves design to enhance simulation models accuracy.
History Case Studies.
Finding and Conclusions.

New PC’s Curves Design Concept (SPE-117894)
Facts:
• Many wells which reported with high Sw_log data have produced dry oil during production test although they were completed nearby water zone.
• High porosity & permeability rock type will have lower capillarity force i.e. (Pc curve) than low porosity & permeability rock type.
• Due to high heterogeneity in carbonate reservoir, single Pc curve per rock type might not be enough to reflect Sw_log data.

New PC’s Curves Design Concept (SPE-117894)
SW
Heig
ht
ab
ove
FW
L d
ep
th (
ft)
0 1
Water Zone
Transition Zone
Oil Zone
High POROHigh PERM
Low POROLow PERM
Oil Dry Limit
FWL Depth

New PC’s Curves Design Concept (SPE-117894)
PC’s Curves Should:
• address the thickness of the transition zone.
• provide excellent match with initial Sw_log data.
• assist in achieving better history match.
• contribute in model stability.
• optimize saturation tables.
• eliminate Swcr’s usage.
• address wettability issues.SW
Heig
ht
ab
ove
FW
L d
ep
th (
ft)
0 1
Water Zone
Transition Zone
Oil Zone
High POROHigh PERM
Low POROLow PERM
Oil Dry Limit
FWL Depth

PC’s Curves Design Setup
1 Water Zone Transition Zone Oil Zone2 3
1
2
Sw
PC
Sw
Kr’s
Used Swc
Number of Saturation Tables = 162 (case study)Use Swc’s & permeability multipliers to control water movement
CurrentApproach
1
2
3
Sw
PC
oil dry limit
Sw
Kr’s
Swirr1Swirr2
Swirr3
Swirr2 Swirr3Swirr1
Number of Saturation Tables = 14 (case study)Good match with Sw_log @ time zero
NewApproach

New PC’s Curves Design Concept
Wettability Change with Depth
HydrocarbonZone
WaterZone
Many simulation studies showed improvement in history match profiles after introduced wettability change with depth concept.
Used “Try & Error” to define each interval depth, then used cut-off depth approach to signed Pc’s curves to each interval.

New PC’s Curves Design Concept
Wettability Change with Depth
HydrocarbonZone
WaterZone
KrwKro
Sw Sw
Pc Kr’s
KrwKro
Sw Sw
Pc Kr’s
KrwKro
Sw Sw
Pc Kr’s
Oil Wet System
Mix Wet System
Water Wet System
“RRT- X”
Many simulation studies showed improvement in history match profiles after introduced wettability change with depth concept.
Used “Try & Error” to define each interval depth, then used cut-off depth approach to signed Pc’s curves to each interval.

New PC’s Curves Design Concept
Wettability Change with Depth
HydrocarbonZone
WaterZone
SWH
eig
ht
ab
ove
FW
L d
ep
th (
ft)
0 1
Water Zone
Transition Zone
Oil Zone
Oil WetSystem
Water WetSystem
Oil Dry Limit
FWL Depth
With the new Pc design concept, the wettability changes with depth can be used as optional to reflect difference wet system in the simulation model with minimum number of saturation table.

Presentation Outline
To address the current issues of main concern issues with the simulation modeling.
To address alternative Pc’s curves design to enhance simulation models accuracy.
History Case Studies.
Finding and Conclusions.

Sw Matching @ InitializationReservoir-A Case Study, (Average Zonal Sw Map)
Current Simulation
Model using 164 Saturation Tables
Updated Simulation Model with New
Approach using 14 Saturation Tables
Excellent match was achieved with implement new approach to design Pc’s curves which contributed in model enhancement and boost model reliability. The difference gap between the current simulation and the new simulation models is less than 1.0 %.

Stability TestReservoir-A Case Study
Simulation model running time
the lower is better
Time steps performance
the higher is better
Convergent problems indicator, less frequency is better.
Time consumed per each time step, the lower is better.

History Match Performance Profiles of 50 YearsReservoir-A Case Study
Simulation model running time the lower is
better
Time steps performance
the higher is better
Convergent problems indicator, less frequency is
better.
Time consumed per each time step, the lower is better.

History Match Performance Profiles of 50 YearsReservoir-A Case Study
Comparable water breakthrough time was met

General Remarks:
There is no history match processes were implemented during model update i.e. (no permeability multipliers have been used), the only change take place was in saturation tables setup.
The history match profiles have not been lost or changed after introduced the new PC’s curves design approach, which support the newly approach capability in reducing convergences problems and speed-up running time.
Simple with very optimized saturation tables input data that can be applied to any model.
Summary Results Table

Sw Matching @ InitializationReservoir-B Case Study, (Sw at Layer#1, Cross-Section)
CurrentSimulation
Model
UpdatedSimulation Model with
NewApproach
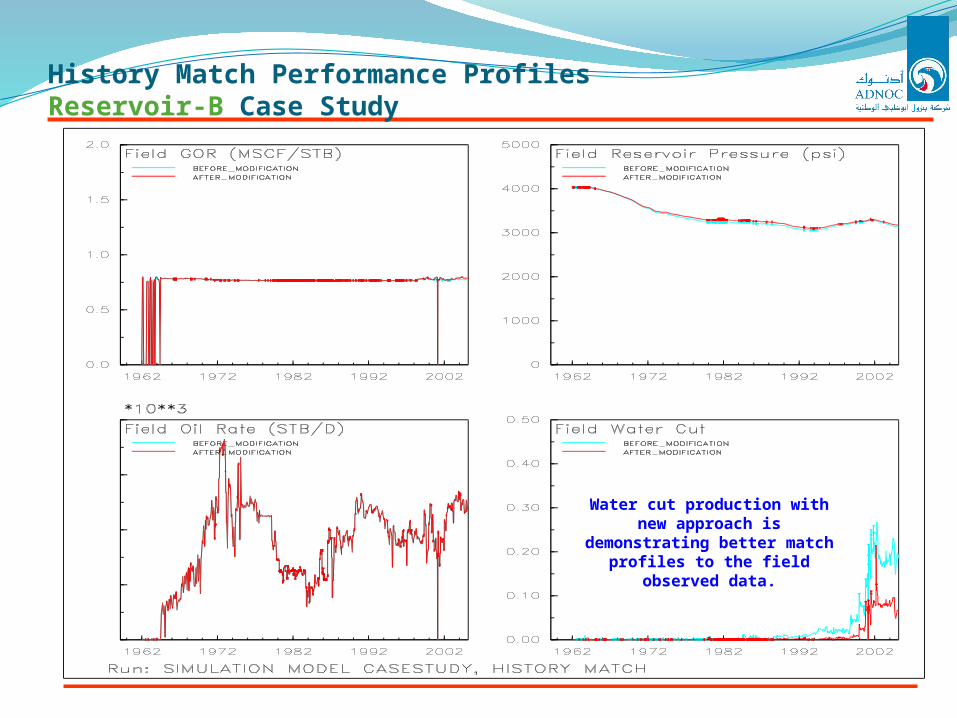
History Match Performance ProfilesReservoir-B Case Study
Water cut production with new approach is
demonstrating better match profiles to the field
observed data.

General Remarks:
The simulated water cut using new approach is presenting more match with field observed data.
With using new approach, less number of saturation tables were used that demonstrate similar history match trends.
Summary Results Table

Current Approach
New Approach
Sw Matching @ InitializationReservoir-C Case Study, (Sw at Layer#1, Cross-Section)

History Match Performance ProfilesReservoir-C Case Study
Field water cut production reported low. The new approach demonstrate better match with measured data.

General Remarks:
Although, the reservoir transition zone was estimated very thick, however; the simulated water cut with new approach was more reflect to field measurement.
The injected water rate was improved with implement new approach, where the original model didn’t achieve it.
Summary Results Table

Sw log Profile Sw Pc Profile
GeologicalModel
(Sw Map)
SimulationModel
(Sw Map)
Sw Matching @ InitializationReservoir-D Case Study

SW ModelStatic Model
SW ModelDynamic Model
Sw Matching @ InitializationReservoir-E Case Study
A-634 H-201 K-312
N-144 K-423 B-542
Sw log
Sw_pc

Sw_log vs. Sw_Pc MatchingReservoir-F Case Study
The new methodology, which was applied to redesign the saturation model has contribute in achieving excellent match between Sw_logs data and Sw_pc that enhance simulation model in terms of fluids distribution and fluids in place calculation i.e. (OIP’s & GIP’s), and reduce the volumetric gap in between the static and the dynamic models to less than 1.0 %.

Presentation Outline
To address the current issues of main concern issues with the simulation modeling.
To address alternative Pc’s curves design to enhance simulation models accuracy.
History Case Studies.
Finding and Conclusions.

Finding and Conclusions (1/2)
The new approach to design Pc’s curves can provide and contribute in the following points:
Efficient and practical procedure that can be easily implemented and updated while achieving high quality match with observed measured data.
Excellent match with logs-derived water saturation profiles per well and per layer.
Excellent match with less volumetric gaps (OIP & GIP) between the static and dynamic models that can be reduced to below 1.0 %.
More representative definition to the top transition zone thickness which would assist further to control water and gas breakthroughs timing and trends.
Eliminate using unsupported parameters such as permeability multipliers and usage of unmeasured Swcr’s values.
Allow to implement more ideal relative permeability curves shapes.

Finding and Conclusions (2/2)
Improve simulation model stability which would accelerate computer running time and reduce convergences problems.
Practical to address the wettability change with depth. (Assign oil-wet wettability to top of structure and water-wet wettability nearby transition zone interval).
Minimize the number of saturation table that can be managed in the simulation model.
More reliable results for predicted reservoir production potential required for management decisions in order to select the most optimum development scheme based on techno-economic evaluation with enhanced oil recovery methods (EOR) for long term full field development plan.

Thank You


![Capillary thermostatting in capillary electrophoresis · Capillary thermostatting in capillary electrophoresis ... 75 µm BF 3 Injection: ... 25-µm id BF 5 capillary. Voltage [kV]](https://img.pdfslide.net/doc/110x75/5c176ff509d3f27a578bf33a/capillary-thermostatting-in-capillary-electrophoresis-capillary-thermostatting.jpg)