Embed Size (px)
Citation preview

New Approaches Indicate Constant Viral Diversity despite Shifts inAssemblage Structure in an Australian Hypersaline Lake
Joanne B. Emerson,a* Brian C. Thomas,a Karen Andrade,b Karla B. Heidelberg,c Jillian F. Banfielda,b
Department of Earth and Planetary Science, University of California, Berkeley, Berkeley, California, USAa; Department of Environmental Science, Policy, and Management,University of California, Berkeley, Berkeley, California, USAb; Department of Biological Sciences, University of Southern California, Los Angeles, California, USAc
It is widely stated that viruses represent the most significant source of biodiversity on Earth, yet characterizing the diversity ofviral assemblages in natural systems remains difficult. Viral diversity studies are challenging because viruses lack universallypresent, phylogenetically informative genes. Here, we developed an approach to estimate viral diversity using a series of func-tional and novel conserved genes. This approach provides direct estimates of viral assemblage diversity while retaining resolu-tion at the level of individual viral populations in a natural system. We characterized viral assemblages in eight samples fromhypersaline Lake Tyrrell (LT), Victoria, Australia, using 39,636 viral contigs. We defined viral operational taxonomic units(OTUs) in two ways. First, we used genes with three different functional predictions that were abundantly represented in thedata set. Second, we clustered proteins of unknown function based on sequence similarity, and we chose genes represented bythree clusters with numerous members to define OTUs. In combination, diversity metrics indicated between 412 and 735 sam-pled populations, and the number of populations remained relatively constant across samples. We determined the relative repre-sentation of each viral OTU in each sample and found that viral assemblage structures correlate with salinity and solution chem-istry. LT viral assemblages were near-replicates from the same site sampled a few days apart but differed significantly on otherspatial and temporal scales. The OTU definition approach proposed here paves the way for metagenomics-based analyses of viralassemblages using ecological models previously applied to bacteria and archaea.
Viruses are abundant and ubiquitous, and they influence nutri-ent cycling, host evolution, and community structure (1). De-
spite an appreciation for their enormous diversity, viruses are theleast well characterized biological entities (2). All-inclusive molec-ular surveys commonly applied to microbial systems are not pos-sible for viruses, owing to the lack of a universal marker gene, soother techniques have been employed to characterize the diversityand dynamics of viral assemblages. For example, viral counts andpulsed-field gel electrophoresis (PFGE) have demonstrated sea-sonal shifts in viral abundance and genome size diversity in Ches-apeake Bay sediments and surface waters (3, 4). The amplificationof target genes known to be conserved within specific viral groupshas shown, for example, that single-stranded DNA (ssDNA) viraldiversity generally changes on a time scale of months in marinesystems (5), that cyanophage genetic diversity varied over 3 yearsin marine coastal waters (6), and that marine myoviral assem-blages near the coast of California exhibited seasonal dynamics(7). However, the inherently high conservation of some geneschosen for such surveys may limit the extent to which ecologicallyrelevant parameters, such as host range or habitat, can be corre-lated with viral biogeography and dynamics (8). In addition, thebiggest limitations of such studies are amplification biases thatmay preclude accurate representation of natural abundances (9)and the fact that these analyses can only be used to estimate thediversity of relatively small groups of known viruses.
Statistical modeling of assembly success, developed for analy-ses of Sanger viral metagenomic data (10, 11), has been used toestimate the structure and alpha- and beta-diversity of viral as-semblages from metagenomic data. However, given that the algo-rithm uses a relatively computationally intensive overlap-layout-consensus assembly approach, it is not designed to handle thelarge data sets generated from new sequencing technologies (par-ticularly Illumina). The models also require average genome size
as input, which can be estimated from another model (12) butcannot be directly assessed. Most importantly, without a means tomore directly estimate viral assemblage diversity, it is impossibleto validate the models. For the relatively small portion of viralmetagenomic data with similarity to sequences in public databases(2), BLAST searches have been used to infer taxonomy and/orgenerate functional predictions, which can then be used to com-pare samples, estimate richness, and/or estimate functional diver-sity (13, 14). However, many such studies rely on analyses of shortreads that can potentially yield inaccurate BLAST results (15, 16),and our previous work showed that BLAST searches from singlereads can result in false-positive identification of viral types (17).One recently reported approach, based on protein clustering, of-fers the potential for quantitative comparisons of viral functionaldiversity from metagenomic data (18, 19). However, since thisapproach is based on protein sequences, it cannot resolve popu-lations at the nucleotide level, so a complementary approach withresolution at the level of viral operational taxonomic units(OTUs) is necessary.
Hypersaline environments are ideal model systems for study-ing viral assemblages, because geochemical conditions remain rel-
Received 11 June 2013 Accepted 23 August 2013
Published ahead of print 30 August 2013
Address correspondence to Joanne B. Emerson, [email protected].
* Present address: Joanne B. Emerson, Cooperative Institute for Research inEnvironmental Sciences, University of Colorado, Boulder, Boulder, Colorado, USA.
Supplemental material for this article may be found at http://dx.doi.org/10.1128/AEM.01946-13.
Copyright © 2013, American Society for Microbiology. All Rights Reserved.
doi:10.1128/AEM.01946-13
November 2013 Volume 79 Number 21 Applied and Environmental Microbiology p. 6755– 6764 aem.asm.org 6755

atively constant, and the community is strictly microbial, elimi-nating complex interactions with higher (metazoan) trophiclevels. Many studies of haloviral isolates and assemblages havebeen conducted previously (reviewed in references 20 to 23),showing, for example, a decrease in the diversity and an increase inthe abundance of viruses with increasing salinity (24, 25). Previ-ously, we tracked 35 complete and near-complete virus and virus-like genomes in hypersaline Lake Tyrrell (LT), Victoria, Australia,and we showed that most populations were stable over days butdynamic over years (17). Here, we comprehensively investigatedthe diversity, genetic composition, and dynamics of LT viral as-semblages (hundreds of populations, relative to 35 in our previousanalysis of the same samples). We developed new methods forcharacterizing and comparing viral assemblages of unknown phy-logeny and genetic composition, including the identification ofcommon genes to represent OTUs, and we investigated the influ-ence of environmental parameters on LT viral assemblage com-position.
MATERIALS AND METHODSLT sample collection and DNA extraction, sequencing, and assembly.As described previously, eight viral concentrates were recovered from10-liter surface water samples collected from hypersaline Lake Tyrrell(LT), Victoria, Australia, from two sites (A and B) between 2007 and 2010(Table 1 and reference 17). Sampling, DNA extraction, and sequencingmethods were described previously (17, 26–28). Briefly, water sampleswere sequentially filtered through 3.0-, 0.8-, and 0.1-�m polyethersulfonefilters, and filtrates that had been put through 0.1-�m filters were concen-trated through tangential flow filtration for virome recovery.
In this study, we use the same eight viral concentrate libraries andassemblies from our previous publication (17), and we expand our anal-yses to include all contigs � 500 bp (39,636 contigs, relative to 35 contigsanalyzed previously). Assembly parameters and assembly verificationwere discussed in detail in reference 17, but briefly, 454-sequenced sam-ples were assembled with Newbler (29) (samples 2010Bt1 and 2010Bt4),and two assemblers were tested on each of the Illumina-sequenced sam-ples, with the best assembly chosen for each sample (briefly, the bestassembly retained a balance between a large number of long contigs andrelatively uniform coverage depth across contigs, as described in detail inreference 17). Samples 2007At1, 2007At2, 2010Bt2, 2010Bt4, and 2010Awere assembled with ABySS (30), and sample 2009B was assembled withVelvet (31). Because fragment recruitment to all assemblies was used foreach sample (see below), differences in assembly parameters should not
significantly affect the results. Unless otherwise noted, all analyses beyondassembly, beginning with pulling contigs � 500 bp, are new and specific tothis study. Sequencing reads were uploaded to GenBank previously (Bio-Project identification [ID] PRJNA81851), and the 30,525 gene sequencesfrom the current analysis (described shortly) are available throughMG-RAST (ID 4529512.3) (32).
Statistical analyses. Unless otherwise noted, statistical analyses wereperformed in the R programming language, and the software functionsmentioned for each analysis (i.e., anosim, hclust, bioenv, mantel, andrarefy) are part of the vegan package (33). Unless otherwise mentioned, allprotein and nucleic acid sequence-based clustering was performed usingUCLUST version 4.2.66 (34), with identity for proteins set at 0.4 andnucleic acids set at 0.95.
Generation of reference gene sequences and estimates of viral abun-dance. In order to generate reference gene sequences for fragment recruit-ment, we used Prodigal (35) to predict genes on all contigs � 500 bp. Toincrease the possibility that genes present in the system would be detectedthrough fragment recruitment in downstream analyses, we removed allpredicted genes � 300 bp. We recognize that small viral genes would beexcluded from this analysis. We then made the gene sequences nonredun-dant by clustering at 95% nucleotide identity, yielding 30,525 genes. Forabundance estimates, reads from each sample were recruited to these ref-erence gene sequences, and the number of reads recruited to a given genein a given sample was retained as the “mapping count.” In accordancewith the cutoff used for clustering, fragment recruitment was carried outusing gsMapper (29) with a minimum of 95% nucleotide identity and anoverlap length of at least 70 bp. We chose the 95% nucleotide identitythreshold for clustering and fragment recruitment to be representative ofa viral population, based on tests across 70, 80, 90, and 95% nucleotideidentity (see supplemental material). However, we acknowledge that,without isolates, we cannot accurately define a nucleotide threshold for aviral population, and the threshold likely differs across genes and viralgroups. Therefore, we use the terms “population” and “OTU” loosely tomean a group of viruses that we expect to be genetically similar, based onhigh (95%) nucleotide sequence identity across a single gene.
Functional predictions and selection of signature gene groups. Weused InterProScan (36) to predict functional domains in predicted pro-tein sequences. Additionally, all predicted protein sequences were clus-tered at 40% amino acid identity, under the assumption that each clusterwould be likely to contain proteins of similar function. It is generallyaccepted that �30% amino acid identity tends to yield robust proteinalignments and indicate similar protein function (37), and as one specificexample, �20 to 40% amino acid identity suggests similar function inreoviruses (38). Using this as a guideline, we chose 40% as an amino acid
TABLE 1 Description of Lake Tyrrell (Victoria, Australia) samples
SampleSample collectiondate (mo/day/yr)
Samplecollectiontime Sitea
TDSb
(% [by wt])Temp(°C) pH
Sequencingtype
Sequencing(Mb)
Viral richness(no. of viralpopulationsper sample)
% abundanceof the mostabundantpopulation
No. of populationsat 0.1% abundanceor higher
2007At1 1/23/2007 15:00 A 31 22 7.23 Illumina PE 356 502 2.3 2942007At2 1/25/2007 15:00 A 31 28 7.09 Illumina PE 845 589 1.8 3082009Bc 1/5/2009 7:21 B 24 18 6.86 Illumina PE 2,162 652 3.8 236
12:37 26 30 7.1318:00 27 36 7.02
2010Bt1 1/7/2010 7:45 B 32 20 7.23 454-Ti 248 562 3.4 3142010Bt2 1/7/2010 20:00 B 36 32 7.25 Illumina PE 425 628 2.4 2942010Bt3 1/8/2010 8:00 B 34 21 7.2 454-Ti 239 588 2.4 3362010Bt4 1/10/2010 0:36 B 32 33 7.16 Illumina PE 1,039 672 3.4 2962010A 1/10/2010 12:50 A 35 37 7.05 Illumina PE 1,103 663 2.1 312a Sites A and B are isolated pools �300 m apart.b TDS, total dissolved solids (salinity).c 2009B is a combination of three samples collected on the same day, pooled after DNA extraction.
Emerson et al.
6756 aem.asm.org Applied and Environmental Microbiology

identity threshold, which is on the conservative end of these previous reports.However, it should be noted that no reoviruses—or members of any previ-ously recognized viral group—were detected in the LT system, and we ac-knowledge that this cutoff does not guarantee similar function. In fact, 0.3%of our clusters contained mixtures of predicted functions, and it is likely thatmore mixtures exist in clusters of unknown function.
In lieu of a universal marker gene, seven sets of viral genes (seven“signature gene groups”) were chosen for analyses of diversity and dy-namics, with sequences in each signature gene group representing indi-vidual OTUs (viral populations). Specific descriptions of each signaturegene group are given in the next two paragraphs, but in general, althoughno gene is present in each viral population, we consider sequence variantswithin each signature gene group to be representative of individual pop-ulations. We chose seven signature gene groups under the assumptionthat the combination of these groups would (i) maximize the number ofviruses included in community analyses and (ii) minimize biases associ-ated with each signature gene group. In order to accomplish these goals,we did not require all signature gene groups to be functionally or phylo-genetically cohesive.
The first signature gene group includes all 30,525 genes from the LTmetagenomes, and as such, it is the best signature gene group for maxi-mizing the number of viruses included. However, because there is no limitto the number of genes from a given genome that can be present in the30,525 genes (“all genes”) signature gene group, this group contains mul-tiple genes per genome (up to whole genomes in some cases). The secondsignature gene group includes all LT genes annotated as any type of“methyltransferase,” including amino acid, nucleic acid, and other meth-yltransferases. This group was chosen because methyltransferase is themost common annotation in the data set and is therefore likely to repre-sent a large number of viruses. Methyltransferase is also the most commonannotation in the seven complete viral genomes previously reported fromLT (17). However, we know from our previous work that some LT viralgenomes contain multiple methyltransferases, whereas others contain nomethyltransferases (there were two copies in two genomes, one copy intwo genomes, and no copies in three genomes, with an average of 6/7methyltransferases per genome), so this group will sample some virusesmore than once and others not at all. The third and fourth signature genegroups (concanavalin A-like glucanases/lectins, henceforth referred to as“glucanases,” and “major capsid proteins”) were similarly defined basedon common annotation and relatively high abundance and because theyare functions likely to be associated with viruses (glucanases are predictedto be involved in host cell binding and entry [39], while major capsidproteins are structural components of the virion).
The final three signature gene groups were chosen as the largest clus-ters of unknown function (clusters 261, 667, and 1435), grouped by aminoacid identity. Together with the 30,525-gene group, these three groupswere chosen in order to ensure that our OTU-based analyses were notbiased to include only viral genes with representatives in public databases.Within each signature gene group, a threshold of 95% nucleotide similar-ity was used to define OTUs, according to the clustering and fragmentrecruitment approaches described above. The presence/absence and rela-tive abundance of each OTU were calculated for each sample throughfragment recruitment as described above.
Hierarchical clustering. Several normalizations and transformationswere tested in order to determine the most reasonable parameters forgenerating distance matrices (see the supplemental material). Based onthe results of these tests, mapping counts were normalized by gene length(dividing the average length of all genes by a given gene length and usingthat as a multiplier for all mapping counts for that gene) and by thesequencing effort (dividing the average number of reads in all samples bythe number of reads in a given sample and using that as a multiplier for allmapping counts for that sample). For each signature gene group, normal-ized mapping counts for each OTU and sample are provided in the sup-plemental material as Tables S1 to S7. We generated Bray-Curtis dissim-ilarity matrices from the normalized mapping counts and used ANOSIM
(40) with 1,000 permutations to test for statistically significant differencesbetween sample groups. Samples were grouped for ANOSIM analysis byyear and location, i.e., four groups, group 2007A (two samples), 2009B(one sample), 2010B (four samples), and 2010A (one sample). Hierarchi-cal clusters were generated for each signature gene group, using the pro-gram MeV (41) with a Pearson correlation and average linkage clustering.
Diversity measurements. Using the normalized mapping counts, wecalculated Shannon’s diversity index (42), Simpson’s diversity index (43),richness (number of OTUs detected), and Pielou’s evenness (44) for LTsamples, and we ranked samples for each index and signature gene group(Fig. 1). We also developed richness and dominance estimates based onour data. For one estimate, we divided the total number of genes (30,525genes) by the average number of predicted genes (74 genes) in the sevenviral genomes from our previous work (17). To generate the richnessvalues in Table 1, we multiplied the number of methyltransferases in eachsample by 7/6, based on the representation of methyltransferases in theseven previously reported genomes. That calculation was also applied toall methyltransferases in the data set to predict total richness across sam-ples. Those calculations were not applied to any of the other signaturegene groups because of the relatively low representation (or nondetec-tion) of the other groups in the seven sequenced LT genomes, preventingnormalization according to genomic representation. On the basis of therelative abundance of each methyltransferase gene within each sample, wealso estimated the percent abundance of the most dominant OTU and thenumber of populations at 0.1% abundance or higher in each sample (Ta-ble 1).
Correlations with environmental data. We correlated LT viral as-semblage structures with environmental parameters (temperature, totaldissolved solids, pH, and solution chemistry; see Table 1 and previouslyreported geochemical data [17]). 2009B is a pool of DNA from threesamples collected on the same day, so we used the average of three mea-surements for each environmental variable for that sample. Using nor-malized mapping counts for each viral OTU, we used the bioenv function(33) to do the following: (i) calculate a Bray-Curtis community dissimi-larity matrix, (ii) select all possible combinations of up to 6 subsets of the13 environmental variables, (iii) calculate a Euclidean distance matrix foreach subset of environmental variables across samples, and (iv) use Spear-man correlations to identify the subset of environmental variables withthe best rank correlation with the viral community dissimilarity matrix.To generate P values, we tested 1,000 permutations of the distance matrixfor environmental data, using the mantel function (33).
RESULTSAnnotation and protein cluster analyses. Methyltransferaseswere the most abundant annotation in the data set, and gluca-nases, predicted to be involved in archaeal host cell recognition(39), were also relatively abundant (Fig. 2). Integrases, which arecommon markers for temperate viruses, were relatively rare(0.02% of LT viral concentrate reads mapped to integrases). Of the11 largest protein clusters, 10 are of unknown function (Table 2).However, only one large cluster had no match in the GenBank nrdatabase. Nine had highly significant BLAST hits to proteins ofunknown function predicted from other hypersaline systems, andone is a putative terminase with significant BLAST hits to termi-nases from five different haloviruses from Spain (45).
We also compared our protein clusters to existing protein clus-ters reported in an analysis of Pacific Ocean Virome (POV) data,which included protein clusters from Global Ocean Sampling(GOS) data (46, 47), proteins from complete phage genomes, andnew clusters from POV metagenomes (18). Because the UCLUSTalgorithm was updated between our LT analyses and this compar-ison of LT and POV protein clusters, we used the updated version(v6) (34) for the comparison. There were originally 4,238,638clusters in the POV data set (18). To make the POV data compa-
Diversity and Dynamics of Haloviral Assemblages
November 2013 Volume 79 Number 21 aem.asm.org 6757

rable to ours, we first removed any protein sequences less than 100amino acids in length, which reduced the number of clusters to1,912,551. We then reclustered the sequences at 40% amino acididentity, resulting in 637,619 POV clusters for our analysis. Wethen clustered these POV clusters with our 14,927 LT protein clus-ters (for consistency, these LT clusters were regenerated from theoriginal 30,525 LT protein sequences, using UCLUST v6). In total,we generated 651,107 clusters, representing an overlap of only1,439 clusters between the two data sets and an addition of 13,488new clusters from LT, meaning that 90% of the LT protein clustersare novel.
Viral assemblages across LT samples. We found significantcorrelations between the structures of LT viral assemblages andenvironmental factors, particularly salinity and potassium con-centration (Table 3). Comparisons of the viral assemblages viahierarchical clustering resulted in the same sample groupings, re-gardless of which signature gene group was chosen to define theOTUs (Fig. 3; see Fig. S1 in the supplemental material). Samplesfrom the same site and year consistently grouped together andseparately from samples collected during different years and/orfrom the other site (of the two sites). Specifically, the two samplesfrom the 2007 2-day time series (2007At1 and 2007At2) groupedtogether, as did the four samples from the 2010 4-day series(2010Bt1 to 2010Bt4), and samples 2009B and 2010A groupedseparately from the other two groups. These groups were sup-ported by ANOSIM analyses, which revealed high within-groupsimilarity (r � 0.93 to 1) and highly significant P values (�0.006)
for all signature gene groups, except for cluster 261 (r � 0.5; Pvalue, 0.06). Within the 2010 4-day time series at site B, the sam-ples grouped in different orders, depending on the signature genegroup analyzed, so any patterns in viral assemblage structures onthe time scale of days could not be resolved.
The methyltransferase hierarchical cluster is representative ofhierarchical clustering analyses across signature gene groups andis shown in Fig. 3 (clustering of other signature gene groups isshown in Fig. S1 in the supplemental material). In addition torelationships among viral assemblages across samples, which areshown in the tree topology at the top of Fig. 3, the presence/ab-sence and relative abundance of individual viral OTUs can beinferred from each horizontal row of the heat map. Importantly,this hierarchical cluster is a visual representation of viral assem-blage structure that retains resolution of the behavior of individ-ual populations. While overarching differences at the viral assem-blage level could not be resolved on the time scale of days, asdescribed above, dynamics are clearly visible at the level of indi-vidual populations on all temporal and spatial scales included inthis study (days to years, two sites separated by �300 m).
Diversity of LT viral assemblages. We calculated four univar-iate diversity indices for each of the seven LT viral signature genegroups and ranked samples for each index and gene group (Fig. 1).Sample rankings were highly variable across both gene groups andindices, and for each index, the range of values for each gene groupwas different, particularly for Shannon’s diversity index (42). Fewpatterns were discernible, though sample 2007At1 was consis-
All Genes Meth. Gluc. Capsids C667 C261 C14358.596 5.288 4.411 2.289 3.615 3.152 3.1468.960 5.511 4.491 2.638 3.673 3.737 3.1788.979 5.566 4.548 2.901 3.675 3.766 3.5758.983 5.590 4.554 3.040 3.677 3.791 3.6179.054 5.609 4.962 3.065 3.681 3.802 3.6779.131 5.669 5.090 3.114 3.707 3.817 3.7099.144 5.716 5.110 3.124 3.748 3.825 3.7249.365 5.749 5.163 3.556 3.785 3.836 3.753
0.9997 0.9906 0.9654 0.8004 0.9556 0.9344 0.91960.9998 0.9935 0.9698 0.8496 0.9611 0.9656 0.95030.9995 0.9936 0.9723 0.8819 0.9633 0.9708 0.96370.9997 0.9938 0.9732 0.9247 0.9652 0.9712 0.96480.9997 0.9944 0.9989 0.9268 0.9667 0.9715 0.9690.9998 0.9946 0.9903 0.9296 0.9668 0.9723 0.96980.9998 0.9948 0.9905 0.9298 0.9673 0.9738 0.97010.9998 0.9953 0.9908 0.9603 0.9675 0.9745 0.9705
0.8489 0.834 0.7816 0.559 0.8481 0.7607 0.77950.8956 0.890 0.7822 0.697 0.8754 0.9125 0.85250.9001 0.897 0.7907 0.711 0.8809 0.9243 0.89460.9008 0.900 0.8185 0.760 0.8833 0.9248 0.90960.9068 0.903 0.8780 0.761 0.8853 0.9267 0.91390.9085 0.905 0.8839 0.773 0.8909 0.9285 0.91650.9163 0.908 0.9040 0.809 0.8976 0.9293 0.91740.9198 0.917 0.9305 0.849 0.9028 0.9296 0.9261
18101 434 207 41 59 57 5020900 487 259 47 60 59 5321284 510 281 51 64 60 5522621 510 285 56 65 62 5723618 546 293 60 69 62 5724991 566 317 61 69 62 5925819 575 339 64 70 62 6026403 583 358 66 71 63 60
2007At12007At22009B2010Bt12010Bt22010Bt32010Bt42010A
Shannon's
Simpson's
Pielou's Evenness
Richness
0.99950.99970.99970.99970.99980.99980.99980.9998
FIG 1 Lake Tyrrell (LT) (located in Victoria, Australia) viral diversity index calculations and sample rankings. Viral signature gene groups are shown in columns, andindices are shown in four horizontal blocks. The viral signature gene groups are all genes, methylases (Meth.), glucanases (Gluc.), major capsid proteins (capsids), andprotein clusters 667 (C667), 261 (C261), and 1435 (C1435). There is one calculation per sample (eight samples) per index (four indices) per viral gene group (sevengroups), and these calculations are the numbers in the table. Richness is a measure of the number of OTUs detected, and the other indices are measured according to thereferences provided in the text. Colors indicate specific samples (legend on the left), ranked in ascending vertical order within each index and signature gene group.
Emerson et al.
6758 aem.asm.org Applied and Environmental Microbiology

tently the least rich and sample 2009B was often the least diverseand least even, despite being among the most rich. However, forthe glucanase group, sample 2009B was among the most diverseand most even, so the significance of these trends is unclear.
Richness and dominance calculations developed specificallyfor this study, as described in Materials and Methods, are in Table1. Richness estimates ranged from 502 to 672 viral populations persample, and estimates of dominance (the number of OTUs at0.1% abundance or higher) ranged from 236 to 336 per sample.For the entire LT viral community (all samples), the all-genessignature gene group calculation predicted 412 viral populations,and the methyltransferase signature gene group predicted 735populations. Together with the richness data from Table 1, thissuggests that 68 to 91% of the total viral richness that we were ableto capture across the eight samples was present in each sample. We
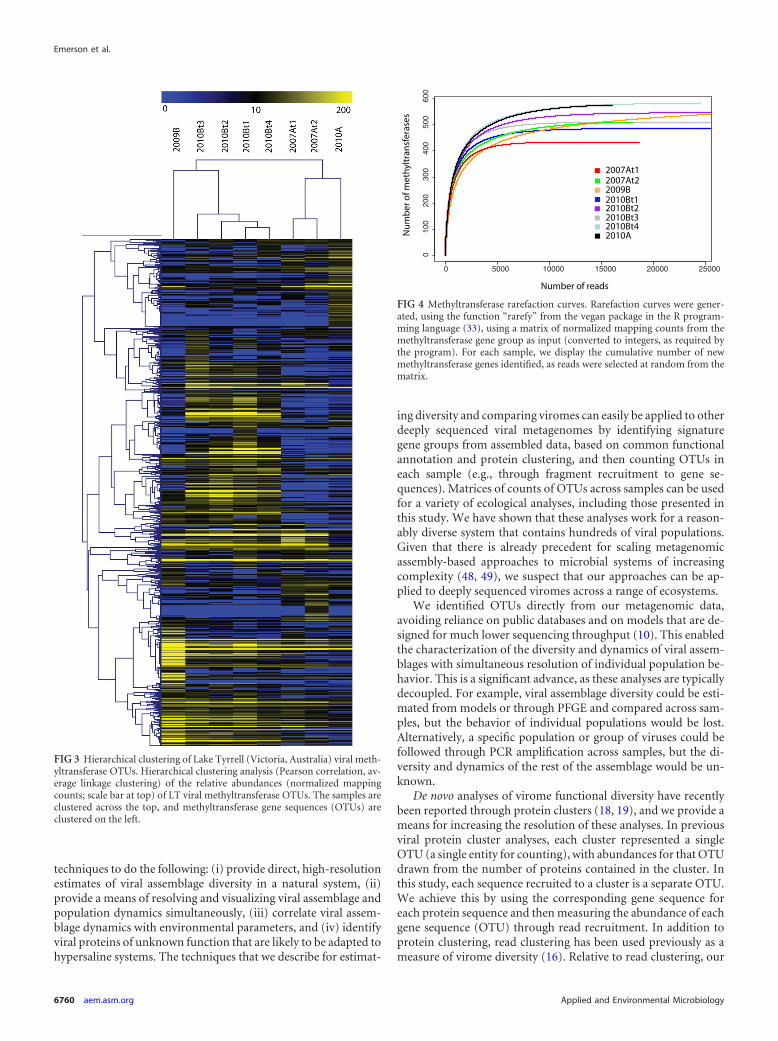
also used rarefaction curves from the methyltransferase signaturegene group (Fig. 4), the all-genes group (see Fig. S2a in the sup-plemental material), and across protein clusters (Fig. S2b) to as-sess the amount of diversity that we were able to capture across LTsamples. Curves for all samples, except for 2009B, become nearlyflat as they approach an asymptote, suggesting that we have sam-pled most of the diversity in the LT system. 2009B is the onlypooled sample, representing three samples collected on the sameday, which could explain the difference in its rarefaction curve. Itshould be noted that these analyses do not account for reads thatmay belong to genes that were not assembled, so they are estimatesof the amount of diversity captured for moderate- to high-abun-dance viral populations. Interestingly, despite the population andassemblage dynamics just described, the diversity remained rela-tively constant across samples (between 434 and 583 methyltrans-ferase genes per sample, Fig. 1 and 4; also see the richness values inTable 1).
DISCUSSION
In this study, we developed new metagenomic assembly-basedtechniques for comparing viral assemblages, and we used these
FIG 2 Abundance of predicted functions in Lake Tyrrell (Victoria, Australia) viral concentrates. The most common predicted functions in Lake Tyrrell areshown on the x axis in order of their abundance. The percentage of total genes (all 30,525 genes, including genes with no annotation) is on the y axis. Asterisksalong the x axis indicate viral signature gene groups. NTP, nucleoside triphosphate; acyl-CoA, acyl coenzyme A.
TABLE 2 Largest LT protein clusters (40% amino acid identity) andBLAST hits
Clustera
No. ofproteins Top BLAST hit E valueb
No. ofhalovirushitsb
667* 71 eHP-36 halovirus 2.00E�28 2261* 63 eHP-32 halovirus 1.00E�39 61435* 60 eHP-36 halovirus 6.00E�77 1214 50 eHP-36 halovirus 2.00E�40 1342 49 eHP-36 halovirus 9.00E�72 1271 45 eHP-36 halovirus 8.00E�83 5369 42 Uncultured halovirus 4.00E�42 3356 41 None N/A N/A157 41 eHP-32 halovirus,
terminase3.00E�71 5
210 41 eHP-36 halovirus 3.00E�68 524 40 eHP-36 halovirus 3.00E�80 5a Clusters with an asterisk are also LT viral signature gene groups.b N/A, not applicable.
TABLE 3 Correlations between LT viral community structure andenvironmental factors
Viral gene group Environmental factorsa
Spearman’scorrelationcoefficient P value
All 30,525 genes TDS, pH, K, F 0.6716 0.068Methyltransferases TDS, K, Mg, F, Br, SO4 0.7252 0.038Glucanases TDS, temp, pH, K, F 0.5534 0.052Capsid proteins F, Br, SO4 0.8079 0.095a Subset of factors with the most significant correlations in bioenv analysis. TDS, totaldissolved solids (% by weight); temp, temperature (°C); SO4, sulfate concentration. Thechemical symbols (K, F, Mg, etc.) indicate the concentration of that ion in solution.
Diversity and Dynamics of Haloviral Assemblages
November 2013 Volume 79 Number 21 aem.asm.org 6759
techniques to do the following: (i) provide direct, high-resolutionestimates of viral assemblage diversity in a natural system, (ii)provide a means of resolving and visualizing viral assemblage andpopulation dynamics simultaneously, (iii) correlate viral assem-blage dynamics with environmental parameters, and (iv) identifyviral proteins of unknown function that are likely to be adapted tohypersaline systems. The techniques that we describe for estimat-
ing diversity and comparing viromes can easily be applied to otherdeeply sequenced viral metagenomes by identifying signaturegene groups from assembled data, based on common functionalannotation and protein clustering, and then counting OTUs ineach sample (e.g., through fragment recruitment to gene se-quences). Matrices of counts of OTUs across samples can be usedfor a variety of ecological analyses, including those presented inthis study. We have shown that these analyses work for a reason-ably diverse system that contains hundreds of viral populations.Given that there is already precedent for scaling metagenomicassembly-based approaches to microbial systems of increasingcomplexity (48, 49), we suspect that our approaches can be ap-plied to deeply sequenced viromes across a range of ecosystems.
We identified OTUs directly from our metagenomic data,avoiding reliance on public databases and on models that are de-signed for much lower sequencing throughput (10). This enabledthe characterization of the diversity and dynamics of viral assem-blages with simultaneous resolution of individual population be-havior. This is a significant advance, as these analyses are typicallydecoupled. For example, viral assemblage diversity could be esti-mated from models or through PFGE and compared across sam-ples, but the behavior of individual populations would be lost.Alternatively, a specific population or group of viruses could befollowed through PCR amplification across samples, but the di-versity and dynamics of the rest of the assemblage would be un-known.
De novo analyses of virome functional diversity have recentlybeen reported through protein clusters (18, 19), and we provide ameans for increasing the resolution of these analyses. In previousviral protein cluster analyses, each cluster represented a singleOTU (a single entity for counting), with abundances for that OTUdrawn from the number of proteins contained in the cluster. Inthis study, each sequence recruited to a cluster is a separate OTU.We achieve this by using the corresponding gene sequence foreach protein sequence and then measuring the abundance of eachgene sequence (OTU) through read recruitment. In addition toprotein clustering, read clustering has been used previously as ameasure of virome diversity (16). Relative to read clustering, our
FIG 3 Hierarchical clustering of Lake Tyrrell (Victoria, Australia) viral meth-yltransferase OTUs. Hierarchical clustering analysis (Pearson correlation, av-erage linkage clustering) of the relative abundances (normalized mappingcounts; scale bar at top) of LT viral methyltransferase OTUs. The samples areclustered across the top, and methyltransferase gene sequences (OTUs) areclustered on the left.
0 5000 10000 15000 20000 25000
010
020
030
040
050
060
0
Number of reads
Num
ber
of m
ethy
ltra
nsfe
rase
s
2007At12007At22009B2010Bt12010Bt22010Bt3
2010A2010Bt4
FIG 4 Methyltransferase rarefaction curves. Rarefaction curves were gener-ated, using the function “rarefy” from the vegan package in the R program-ming language (33), using a matrix of normalized mapping counts from themethyltransferase gene group as input (converted to integers, as required bythe program). For each sample, we display the cumulative number of newmethyltransferase genes identified, as reads were selected at random from thematrix.
Emerson et al.
6760 aem.asm.org Applied and Environmental Microbiology

analyses add organization into genes and OTUs to give more con-text to the measurements, and we add longer reference sequencelengths (�300 bp, as opposed to 100 bp) for more robust cluster-ing and read recruitment.
We appreciate, particularly for all the genes and methyltrans-ferase signature gene groups, that we may be counting an individ-ual (in this case, a viral genome) more than once while usingecological techniques that assume that each individual will becounted only once. Where possible, we have accounted for this bynormalizing by the average number of genes (all-genes group) orcopies of methyltransferases per genome. Similarly, we acknowl-edge that we will not be able to account for all individuals in allsignature gene analyses because not all signature genes will bepresent in all viruses. We have attempted to account for this bychoosing a variety of signature gene groups and comparing resultsacross groups. Presumably, our most robust results are those thatare consistent across signature gene groups and are therefore likelyto represent most of the viral assemblage.
We acknowledge that metagenomic assembly algorithms arenot perfect, and our assemblies could contain errors, even after thecareful manual assembly curation that we reported previously forthese samples (17, 50, 51). However, we stress a number of pointsin support of this approach. (i) Metagenomic libraries were pre-pared without multiple-displacement amplification, reducing bi-ases in the sequencing data prior to assembly (9, 52). (ii) Becauseno reference haloviral genomes were detected in LT metag-enomes, a de novo method for characterizing these assemblageswas required. (iii) Our assemblies were carefully manually curated(17), and similar manual curation methods have resulted in sig-nificant metagenomic assembly of bacteria and archaea in a vari-ety of systems (i.e., genomes have been accurately reconstructed,based on coverage and the presence of single-copy marker genes,among other measures) (48, 49, 53–56). (iv) Longer reads (and, byinference, contigs) allow for more reliable BLAST searches andannotation (15), and the annotation supports the identification ofvirus-like genes (Fig. 2). (v) Any assembly errors will be the sameacross samples, because the assemblies were not directly com-pared (reads were recruited to a nonredundant set of genes col-lated from all assemblies), and because we are “splitting” the as-semblies into individual genes, any contig-scale assembly errorsshould be minimized.
It should be noted that we cannot rule out the possibility of asmall amount of contamination from plasmids and other freeDNA in our viral concentrate libraries, due to the lack of a DNasetreatment prior to virion lysis (a DNase treatment was attemptedbut resulted in complete degradation of all DNA [17]). Throughcomparisons to 16S rRNA gene sequences and known plasmidsequences, along with searches for plasmid genes in our libraries,we demonstrated previously that our libraries are dominated byviruses and that any such contamination is likely to be minimal(17). All of our viral signature gene groups are consistent with viralsequences, and two groups (glucanases and major capsid pro-teins) were chosen specifically because they are likely to containviral sequences exclusively.
Diversity and dynamics of LT viral assemblages. Persistenceof viral populations over days but variation over the 3-year studyperiod and between isolated pools separated by �300 m is consis-tent with our previous report of dynamics in most virus and virus-like populations from the same LT samples on the same temporaland spatial scales (17). Together, these two studies indicate that
the LT viral populations that were abundant enough to assembleinto contigs � 500 bp (the cutoff for this study) tended to exhibitsimilar dynamics to populations that assembled into contigs � 10kb (the cutoff for the previous study, presumed to represent themost abundant populations in these assemblages, given their sig-nificant assembly). We take this to mean that viral populations ofboth moderate and high abundance exhibit similar dynamics inthe LT system.
The timescales on which LT viral assemblages tended to bestable (days) or dynamic (years) are generally consistent with pre-vious studies of both viral and microbial communities in othersystems. For example, marine myoviruses off the California coastexhibited both dynamics and persistence, with myoviral assem-blages most similar during adjacent months (the shortest timescale in the study) (7). Similarly, at a nearby site, the dominantmembers of myoviral and bacterial assemblages tended to remaindominant on the time scale of days to weeks (57). However, inter-estingly, nearly all microbial OTUs found across 72 16S rRNAgene amplicon samples collected over 6 years in the western Eng-lish Channel (and many from sites throughout the global oceans)were present in a single, very deeply sequenced sample, suggestingthat most bacterial taxa are always present but shift in relativeabundance (58, 59). This suggests that, while most LT viral pop-ulations appear absent (below detection limits) in at least somesamples over 3 years, it is possible that they are actually present atlow abundance. Spatially, our results are consistent with a study of32 samples from two freshwater lakes, which revealed high within-lake similarity relative to between-lake similarity (60). We alsoobserved similarities at the same site (across the four 2010B as-semblages) and differences between sites (between the 2010A and2010B assemblages).
Since viral diversity within LT remained relatively constantthroughout the 3-year study (e.g., see the richness calculations inTable 1), we infer that viral population and assemblage dynamicsoccur over relatively short timescales (�3 years), while the totaldiversity of the system remains relatively constant over time andspace. In model form, this would be conceptually similar to theconstant diversity dynamics model (61) and other similar models(14, 62), which predict stability of viral and microbial populationswith dynamics at the subpopulation (strain) level. However, wewould change the scale to indicate constant diversity at the viralassemblage level with dynamics at the level of individual viral pop-ulations.
Although analyses of viral assemblage structure grouped sam-ples collected at similar times from the same location (regardlessof which of the seven LT viral signature gene groups was used), thefour univariate diversity indices indicate that samples collectedfrom the same location over days have somewhat different diver-sity levels. However, it is concerning that the diversity level rank-ings varied, based on which signature gene group was used for theanalysis. This suggests that these widely used univariate diversityindices (designed originally for macroecological data and morerecently applied to microbial ecological data [for example, refer-ence 63]) may not be appropriate for comparing viral assem-blages. This may be because the LT samples are from the sameecosystem and have relatively constant diversity, and/or becausethese indices were designed for use with phylogenetic markergenes, which are lacking in viruses. For viruses, we are necessarilyrestricted to functional genes, each of which potentially provides adifferent measure of functional diversity that does not necessarily
Diversity and Dynamics of Haloviral Assemblages
November 2013 Volume 79 Number 21 aem.asm.org 6761
equate to phylogenetic diversity. To reduce potential biases asso-ciated with analyses based on functional genes, we included a nor-malization factor in our richness and dominance estimates, basedon the relative representation of our OTU genes in sequencedgenomes from LT. Although this correction factor can only beused in systems from which representative whole-genome se-quences can be reconstructed, viral genome assembly is becomingmore facile in a variety of systems through Illumina metagenomicsequencing (17, 64).
Functional predictions in LT viral assemblages. Althoughonly �15% of the 30,525 genes from LT could be assigned a func-tion, and the most abundant functional annotation (methyltrans-ferase) represented only �2% of LT reads (Fig. 2), some infer-ences can be made from the functional annotation. Theprevalence and diversity of glucanases in LT suggest that halovi-ruses, probably targeting the abundant archaea (75 to 95% of themicrobial community across LT samples [65]), have evolved avariety of surface receptors for host cell recognition (39). Thepresence of a number of twin-arginine translocation (TAT) signalsequences, which likely serve to target proteins for secretion in analready folded state (66), suggests that haloviruses have evolvedmeans of ensuring that proteins rapidly folded under high intra-cellular salt concentrations can still be embedded in or secretedfrom host membranes (e.g., in preparation for the generation ofviral envelopes). The identification of relatively few capsid pro-teins suggests either that haloviral structural genes are poorly rep-resented in public databases and/or that such proteins are highlyconserved across diverse viral groups. In the case of the latter, wewould expect to encounter stability in major capsid proteinsacross time and space in the LT system, which we did not see, so wehypothesize that many more haloviral structural genes remain tobe discovered and therefore are likely to be good targets for futureproteomic studies. Consistent with some other studies (for in-stance, reference 67), the relatively small number of integrases(less than 0.02% of LT reads) suggests that temperate viruses maynot be abundant members of planktonic haloviral assemblages,though given the novelty of LT viruses, we cannot discount thepossibility that novel integrase genes were not recognized or thattemperate viruses could be abundant under conditions not sam-pled by this study.
Correlations between LT viral assemblages and environmen-tal factors. Significant correlations with LT viral assemblagestructures were identified for various combinations of environ-mental factors, with the most highly correlated factors generallydiffering by viral signature gene group (Table 3). Environmentalfactors may indirectly drive shifts in specific viral populations,presumably by influencing the relative abundances of their hosts(68, 69). It is also conceivable that some environmental factorscould directly select for different viral groups, for example, bypromoting or reducing viral decay (68, 70–72). Significant corre-lations with LT viral assemblage structure were associated withsubtle shifts in both salinity (total dissolved solids [TDS]) andpotassium concentrations for three viral gene groups (all 30,525genes, methyltransferases, and glucanases), consistent with previ-ous observations across more extreme differences in salinity (25).These observations likely reflect different adaptations of host pop-ulations to solution chemistry, which changes with the extent ofevaporative concentration.
Conclusions. In this direct estimate of viral assemblage diver-sity in a natural system, we show that viral assemblages in hyper-
saline Lake Tyrrell, Victoria, Australia, are diverse, containing�412 to 735 populations at moderate-to-high abundance. Al-though some LT viral populations were dynamic over days, viralassemblages were generally stable at the same site over days anddynamic over years, and viral assemblage diversity remained rel-atively constant throughout the study. Salinity was shown to cor-relate with viral assemblage structure, and we infer that salinitymay be a driver of host population dynamics. The techniques thatwe describe for estimating diversity, comparing viromes, and de-termining potential environmental influences on viral assem-blages should be broadly applicable to deeply sequenced viromesacross ecosystems. In addition, we provide a means of countingviral OTUs across samples to generate a simple data matrix thatcan be used as the foundation for many ecological analyses, po-tentially linking environmental virologists to tools from the well-developed fields of macroecology and microbial ecology.
ACKNOWLEDGMENTS
Funding for this work was provided by National Science Foundationaward 0626526 and Department of Energy award DE-FG02-07ER64505.
We thank Cheetham Salt Works (Victoria, Australia) for site access;John Moreau, Jochen Brocks, Eric Allen, and Mike Dyall-Smith for fieldassistance; Shannon Williamson and Doug Fadrosh for training J.B.E. invirus-related laboratory techniques; and members of the University ofCalifornia (UC) Berkeley Dimensions of Biodiversity Distributed Gradu-ate Seminar (National Science Foundation award 1050680) for helpfuldiscussions. We also thank three anonymous reviewers for thoughtfulcomments that improved the manuscript.
REFERENCES1. Suttle CA. 2007. Marine viruses—major players in the global ecosystem.
Nat. Rev. Microbiol. 5:801– 812.2. Rosario K, Breitbart M. 2011. Exploring the viral world through metag-
enomics. Curr. Opin. Virol. 1:289 –297.3. Helton RR, Wang K, Kan J, Powell DH, Wommack KE. 2012. Interan-
nual dynamics of viriobenthos abundance and morphological diversity inChesapeake Bay sediments. FEMS Microbiol. Ecol. 79:474 – 486.
4. Wommack KE, Bench SR, Bhavsar J, Mead D, Hanson T, Clokie MRJ,Kropinski AM. 2009. Isolation independent methods of characterizingphage communities 2: characterizing a metagenome. Methods Mol. Biol.502:279 –289.
5. Tucker KP, Parsons R, Symonds EM, Breitbart M. 2011. Diversity anddistribution of single-stranded DNA phages in the North Atlantic Ocean.ISME J. 5:822– 830.
6. Marston MF, Sallee JL. 2003. Genetic diversity and temporal variation inthe cyanophage community infecting marine Synechococcus species inRhode Island’s coastal waters. Appl. Environ. Microbiol. 69:4639 – 4647.
7. Chow C-ET, Fuhrman JA. 2012. Seasonality and monthly dynamics ofmarine myovirus communities. Environ. Microbiol. 14:2171–2183.
8. Sullivan MB, Coleman ML, Quinlivan V, Rosenkrantz JE, DeFrancescoAS, Tan G, Fu R, Lee JA, Waterbury JB, Bielawski JP, Chisholm SW.2008. Portal protein diversity and phage ecology. Environ. Microbiol. 10:2810 –2823.
9. Duhaime MB, Sullivan MB. 2012. Ocean viruses: rigorously evaluatingthe metagenomic sample-to-sequence pipeline. Virology 434:181–186.
10. Angly F, Rodriguez-Brito B, Bangor D, McNairnie P, Breitbart M,Salamon P, Felts B, Nulton J, Mahaffy J, Rohwer F. 2005. PHACCS, anonline tool for estimating the structure and diversity of uncultured viralcommunities using metagenomic information. BMC Bioinformatics 6:41.doi:10.1186/1471-2105-6-41.
11. Breitbart M, Salamon P, Andresen B, Mahaffy JM, Segall AM, Mead D,Azam F, Rohwer F. 2002. Genomic analysis of uncultured marine viralcommunities. Proc. Natl. Acad. Sci. U. S. A. 99:14250 –14255.
12. Angly FE, Willner D, Prieto-Davo A, Edwards RA, Schmieder R, Vega-Thurber R, Antonopoulos DA, Barott K, Cottrell MT, Desnues C,Dinsdale EA, Furlan M, Haynes M, Henn MR, Hu Y, Kirchman DL,McDole T, McPherson JD, Meyer F, Miller RM, Mundt E, Naviaux RK,
Emerson et al.
6762 aem.asm.org Applied and Environmental Microbiology

Rodriguez-Mueller B, Stevens R, Wegley L, Zhang L, Zhu B, Rohwer F.2009. The GAAS metagenomic tool and its estimations of viral and micro-bial average genome size in four major biomes. PLoS Comput. Biol.5:e1000593. doi:10.1371/journal.pcbi.1000593.
13. Dinsdale EA, Edwards RA, Hall D, Angly F, Breitbart M, Brulc JM,Furlan M, Desnues C, Haynes M, Li L, McDaniel L, Moran MA, NelsonKE, Nilsson C, Olson R, Paul J, Brito BR, Ruan Y, Swan BK, Stevens R,Valentine DL, Thurber RV, Wegley L, White BA, Rohwer F. 2008.Functional metagenomic profiling of nine biomes. Nature 452:629 – 632.
14. Rodriguez-Brito B, Li L, Wegley L, Furlan M, Angly F, Breitbart M,Buchanan J, Desnues C, Dinsdale E, Edwards R, Felts B, Haynes M, LiuH, Lipson D, Mahaffy J, Martin-Cuadrado AB, Mira A, Nulton J, PasicL, Rayhawk S, Rodriguez-Mueller J, Rodriguez-Valera F, Salamon P,Srinagesh S, Thingstad TF, Tran T, Thurber RV, Willner D, Youle M,Rohwer F. 2010. Viral and microbial community dynamics in fouraquatic environments. ISME J. 4:739 –751.
15. Wommack KE, Bhavsar J, Ravel J. 2008. Metagenomics: read lengthmatters. Appl. Environ. Microbiol. 74:1453–1463.
16. Roux S, Enault F, Robin A, Ravet V, Personnic S, Theil S, Colombet J,Sime-Ngando T, Debroas D. 2012. Assessing the diversity and specificityof two freshwater viral communities through metagenomics. PLoS One7:e33641. doi:10.1371/journal.pone.0033641.
17. Emerson JB, Thomas BC, Andrade K, Allen EE, Heidelberg KB, Ban-field JF. 2012. Dynamic viral populations in hypersaline systems as re-vealed by metagenomic assembly. Appl. Environ. Microbiol. 78:6309 –6320.
18. Hurwitz BL, Sullivan MB. 2013. The Pacific Ocean virome (POV): amarine viral metagenomic dataset and associated protein clusters forquantitative viral ecology. PLoS One 8:e57355. doi:10.1371/journal.pone.0057355.
19. Hurwitz BL, Deng L, Poulos BT, Sullivan MB. 2013. Evaluation ofmethods to concentrate and purify ocean virus communities throughcomparative, replicated metagenomics. Environ. Microbiol. 15:1428 –1440.
20. Dyall-Smith M, Tang S-L, Bath C. 2003. Haloarchaeal viruses: howdiverse are they? Res. Microbiol. 154:309 –313.
21. Porter K, Russ BE, Dyall-Smith ML. 2007. Virus-host interactions in saltlakes. Curr. Opin. Microbiol. 10:418 – 424.
22. Pina M, Bize A, Forterre P, Prangishvili D. 2011. The archeoviruses.FEMS Microbiol. Rev. 6:1035–1054.
23. Santos F, Yarza P, Parro V, Meseguer I, Rossello-Mora R, Anton J.2012. Culture-independent approaches for studying viruses from hyper-saline environments. Appl. Environ. Microbiol. 6:1635–1643.
24. Sandaa R-A, Foss Skjoldal E, Bratbak G. 2003. Virioplankton commu-nity structure along a salinity gradient in a solar saltern. Extremophiles7:347–351.
25. Bettarel Y, Bouvier T, Bouvier C, Carré C, Desnues A, Domaizon I,Jacquet S, Robin A, Sime-Ngando T. 2011. Ecological traits of planktonicviruses and prokaryotes along a full-salinity gradient. FEMS Microbiol.Ecol. 76:360 –372.
26. Heidelberg KB, Nelson WC, Holm JB, Eisenkolb N, Andrade K, Em-erson JB. 2013. Characterization of eukaryotic microbial diversity in hy-persaline Lake Tyrrell, Australia. Front. Microbiol. 4:115. doi:10.3389/fmicb.2013.00115.
27. Narasingarao P, Podell S, Ugalde JA, Brochier-Armanet C, Emerson JB,Brocks JJ, Heidelberg KB, Banfield JF, Allen EE. 2012. De novo metag-enomic assembly reveals abundant novel major lineage of Archaea in hy-persaline microbial communities. ISME J. 6:81–93.
28. Podell S, Ugalde JA, Narasingarao P, Banfield JF, Heidelberg KB, AllenEE. 2013. Assembly-driven community genomics of a hypersaline micro-bial ecosystem. PLoS One 8:e61692. doi:10.1371/journal.pone.0061692.
29. Margulies M, Egholm M, Altman WE, Attiya S, Bader JS, Bemben LA,Berka J, Braverman MS, Chen Y-J, Chen Z, Dewell SB, Du L, Fierro JM,Gomes XV, Godwin BC, He W, Helgesen S, Ho CH, Irzyk GP, JandoSC, Alenquer MLI, Jarvie TP, Jirage KB, Kim J-B, Knight JR, Lanza JR,Leamon JH, Lefkowitz SM, Lei M, Li J, Lohman KL, Lu H, MakhijaniVB, McDade KE, McKenna MP, Myers EW, Nickerson E, Nobile JR,Plant R, Puc BP, Ronan MT, Roth GT, Sarkis GJ, Simons JF, SimpsonJW, Srinivasan M, Tartaro KR, Tomasz A, Vogt KA, Volkmer GA,Wang SH, Wang Y, Weiner MP, Yu P, Begley RF, Rothberg JM. 2005.Genome sequencing in microfabricated high-density picolitre reactors.Nature 437:376 –380.
30. Simpson JT, Wong K, Jackman SD, Schein JE, Jones SJM, Birol I. 2009.
ABySS: a parallel assembler for short read sequence data. Genome Res.19:1117–1123.
31. Zerbino DR, Birney E. 2008. Velvet: algorithms for de novo short readassembly using de Bruijn graphs. Genome Res. 18:821– 829.
32. Meyer F, Paarmann D, D’Souza M, Olson R, Glass E, Kubal M, PaczianT, Rodriguez A, Stevens R, Wilke A, Wilkening J, Edwards R. 2008. Themetagenomics RAST server—a public resource for the automatic phylo-genetic and functional analysis of metagenomes. BMC Bioinformatics9:386. doi:10.1186/1471-2105-9-386.
33. Oksanen J, Blanchet FG, Kindt R, Legendre P, Minchin PR, O’Hara RB,Simpson GL, Solymos P, Stevens MHH, Wagner H. 2011. vegan: Com-munity Ecology Package. R package version 2.0-2. http://CRAN.R-project.org/package�vegan.
34. Edgar RC. 2010. Search and clustering orders of magnitude faster thanBLAST. Bioinformatics 19:2460 –2461.
35. Hyatt D, Chen G-L, LoCascio P, Land M, Larimer F, Hauser L. 2010.Prodigal: prokaryotic gene recognition and translation initiation site iden-tification. BMC Bioinformatics 11:119. doi:10.1186/1471-2105-11-119.
36. Quevillon E, Silventoinen V, Pillai S, Harte N, Mulder N, Apweiler R,Lopez R. 2005. InterProScan: protein domains identifier. Nucleic AcidsRes. 33:W116 –W120.
37. Feng DF, Johnson MS, Doolittle WF. 1985. Aligning amino acid se-quences: comparison of commonly used methods. J. Mol. Evol. 21:112–125.
38. Mohd Jaafar F, Attoui H, Mertens PPC, de Micco P, de Lamballerie X.2005. Structural organization of an encephalitic human isolate of Bannavirus (genus Seadornavirus, family Reoviridae). J. Gen. Virol. 86:1147–1157.
39. Gorlas A, Koonin EV, Bienvenu N, Prieur D, Geslin C. 2012. TPV1, thefirst virus isolated from the hyperthermophilic genus Thermococcus. En-viron. Microbiol. 14:503–516.
40. Clarke KR. 1993. Non-parametric multivariate analyses of changes incommunity structure. Aust. J. Ecol. 18:117–143.
41. Saeed AI, Bhagabati NK, Braisted JC, Liang W, Sharon V, Howe EA, LiJ, Thiagarajan M, White JA, Quackenbush J. 2006. TM4 microarraysoftware suite. Methods Enzymol. 411:134 –193.
42. Shannon CE, Weaver W. 1964. The mathematical theory of communi-cation. University of Illinois Press, Urbana, IL.
43. Simpson EH. 1949. Measurement of diversity. Nature 163:688.44. Pielou EC. 1966. The measurement of diversity in different types of bio-
logical collections. J. Theor. Biol. 13:131–144.45. Garcia-Heredia I, Martin-Cuadrado A-B, Mojica FJM, Santos F, Mira
A, Anton J, Rodriguez-Valera F. 2012. Reconstructing viral genomesfrom the environment using fosmid clones: the case of haloviruses. PLoSOne 7:e33802. doi:10.1371/journal.pone.0033802.
46. Yooseph S, Sutton G, Rusch DB, Halpern AL, Williamson SJ, Reming-ton K, Eisen JA, Heidelberg KB, Manning G, Li W, Jaroszewski L,Cieplak P, Miller CS, Li H, Mashiyama ST, Joachimiak MP, van BelleC, Chandonia J-M, Soergel DA, Zhai Y, Natarajan K, Lee S, Raphael BJ,Bafna V, Friedman R, Brenner SE, Godzik A, Eisenberg D, Dixon JE,Taylor SS, Strausberg RL, Frazier M, Venter JC. 2007. The Sorcerer IIGlobal Ocean Sampling expedition: expanding the universe of proteinfamilies. PLoS Biol. 5:e16. doi:10.1371/journal.pbio.0050016.
47. Rusch DB, Halpern AL, Sutton G, Heidelberg KB, Williamson S,Yooseph S, Wu D, Eisen JA, Hoffman JM, Remington K, Beeson K,Tran B, Smith H, Baden-Tillson H, Stewart C, Thorpe J, Freeman J,Andrews-Pfannkoch C, Venter JE, Li K, Kravitz S, Heidelberg JF,Utterback T, Rogers Y-H, Falcon LI, Souza V, Bonilla-Rosso G, Egui-arte LE, Karl DM, Sathyendranath S, Platt T, Bermingham E, GallardoV, Tamayo-Castillo G, Ferrari MR, Strausberg RL, Nealson K, Fried-man R, Frazier M, Venter JC. 2007. The Sorcerer II Global Ocean Sam-pling expedition: northwest Atlantic through eastern tropical Pacific.PLoS Biol. 5:e77. doi:10.1371/journal.pbio.0050077.
48. Tyson GW, Chapman J, Hugenholtz P, Allen EE, Ram RJ, RichardsonPM, Solovyev VV, Rubin EM, Rokhsar DS, Banfield JF. 2004. Commu-nity structure and metabolism through reconstruction of microbial ge-nomes from the environment. Nature 428:37– 43.
49. Wrighton KC, Thomas BC, Sharon I, Miller CS, Castelle CJ, VerBerk-moes NC, Wilkins MJ, Hettich RL, Lipton MS, Williams KH, Long PE,Banfield JF. 2012. Fermentation, hydrogen, and sulfur metabolism inmultiple uncultivated bacterial phyla. Science 337:1661–1665.
50. Charuvaka A, Rangwala H. 2011. Evaluation of short read metagenomicassembly. BMC Genomics 12(Suppl 2):S8. doi:10.1186/1471-2164-12-S2-S8.
Diversity and Dynamics of Haloviral Assemblages
November 2013 Volume 79 Number 21 aem.asm.org 6763
51. Nagarajan N, Pop M. 2013. Sequence assembly demystified. Nat. Rev.Genet. 14:157–167.
52. Duhaime MB, Deng L, Poulos BT, Sullivan MB. 2012. Towards quan-titative metagenomics of wild viruses and other ultra-low concentrationDNA samples: a rigorous assessment and optimization of the linker am-plification method. Environ. Microbiol. 14:2526 –2537.
53. Baker BJ, Tyson GW, Webb RI, Flanagan J, Hugenholtz P, Allen EE,Banfield JF. 2006. Lineages of acidophilic archaea revealed by communitygenomic analysis. Science 314:1933–1935.
54. Allen EE, Tyson GW, Whitaker RJ, Detter JC, Richardson PM, BanfieldJF. 2007. Genome dynamics in a natural archaeal population. Proc. Natl.Acad. Sci. U. S. A. 104:1883–1888.
55. Andersson AF, Banfield JF. 2008. Virus population dynamics and ac-quired virus resistance in natural microbial communities. Science 320:1047–1050.
56. Morowitz MJ, Denef VJ, Costello EK, Thomas BC, Poroyko V, RelmanDA, Banfield JF. 2011. Strain-resolved community genomic analysis ofgut microbial colonization in a premature infant. Proc. Natl. Acad. Sci.U. S. A. 108:1128 –1133.
57. Needham DM, Chow C-ET, Cram JA, Sachdeva R, Parada A, FuhrmanJA. 2013. Short-term observations of marine bacterial and viral commu-nities: patterns, connections and resilience. ISME J. 7:1274 –1285.
58. Caporaso JG, Paszkiewicz K, Field D, Knight R, Gilbert JA. 2012. TheWestern English Channel contains a persistent microbial seed bank. ISMEJ. 6:1089 –1093.
59. Gibbons SM, Caporaso JG, Pirrung M, Field D, Knight R, Gilbert JA.2013. Evidence for a persistent microbial seed bank throughout the globalocean. Proc. Natl. Acad. Sci. U. S. A. 110:4651– 4655.
60. Jones SE, Cadkin TA, Newton RJ, McMahon KD. 2012. Spatial andtemporal scales of aquatic bacterial beta diversity. Front. Microbiol. 3:318.doi:10.3389/fmicb.2012.00318.
61. Rodriguez-Valera F, Martin-Cuadrado A-B, Rodriguez-Brito B, Pasic L,
Thingstad TF, Rohwer F, Mira A. 2009. Explaining microbial populationgenomics through phage predation. Nat. Rev. Microbiol. 7:828 – 836.
62. Banfield JF, Young M. 2009. Variety, the splice of life, in microbialcommunities. Science 326:1198 –1199.
63. Shaw AK, Halpern AL, Beeson K, Tran B, Venter JC, Martiny JBH.2008. It’s all relative: ranking the diversity of aquatic bacterial communi-ties. Environ. Microbiol. 10:2200 –2210.
64. Minot S, Grunberg S, Wu GD, Lewis JD, Bushman FD. 2012. Hyper-variable loci in the human gut virome. Proc. Natl. Acad. Sci. U. S. A.109:3962–3966.
65. Emerson JB, Andrade K, Thomas BC, Norman A, Allen EE, HeidelbergKB, Banfield JF. 2013. Virus-host and CRISPR dynamics in Archaea-dominated hypersaline Lake Tyrrell, Victoria, Australia. Archaea 2013:370871. doi:10.1155/2013/370871.
66. Bolhuis A. 2002. Protein transport in the halophilic archaeon Halobacte-rium sp. NRC-1: a major role for the twin-arginine translocation pathway?Microbiology 148:3335–3346.
67. Santos F, Yarza P, Parro V, Briones C, Antón J. 2010. The metaviromeof a hypersaline environment. Environ. Microbiol. 12:2965–2976.
68. Fuhrman JA. 1999. Marine viruses and their biogeochemical and ecolog-ical effects. Nature 399:541–548.
69. Lozupone CA, Knight R. 2007. Global patterns in bacterial diversity.Proc. Natl. Acad. Sci. U. S. A. 104:11436 –11440.
70. Hewson I, Barbosa JG, Brown JM, Donelan RP, Eaglesham JB, Egg-leston EM, LaBarre BA. 2012. Temporal dynamics and decay of puta-tively allochthonous and autochthonous viral genotypes in contrastingfreshwater lakes. Appl. Environ. Microbiol. 78:6583– 6591.
71. Corinaldesi C, Dell’Anno A, Magagnini M, Danovaro R. 2010. Viraldecay and viral production rates in continental-shelf and deep-sea sedi-ments of the Mediterranean Sea. FEMS Microbiol. Ecol. 72:208 –218.
72. Wommack KE, Hill RT, Muller TA, Colwell RR. 1996. Effects of sunlighton bacteriophage viability and structure. Appl. Environ. Microbiol. 62:1336 –1341.
Emerson et al.
6764 aem.asm.org Applied and Environmental Microbiology