Embed Size (px)
Citation preview

HAL Id: hal-01689081https://hal.archives-ouvertes.fr/hal-01689081
Submitted on 11 Apr 2018
HAL is a multi-disciplinary open accessarchive for the deposit and dissemination of sci-entific research documents, whether they are pub-lished or not. The documents may come fromteaching and research institutions in France orabroad, or from public or private research centers.
L’archive ouverte pluridisciplinaire HAL, estdestinée au dépôt et à la diffusion de documentsscientifiques de niveau recherche, publiés ou non,émanant des établissements d’enseignement et derecherche français ou étrangers, des laboratoirespublics ou privés.
New characterization aspects of carbonate accumulationhorizons in Chalky Champagne (NE of the Paris Basin,
France)Damien Linoir, Céline Thomachot-Schneider, Maxime Gommeaux, Gilles
Fronteau, Vincent Barbin
To cite this version:Damien Linoir, Céline Thomachot-Schneider, Maxime Gommeaux, Gilles Fronteau, Vincent Barbin.New characterization aspects of carbonate accumulation horizons in Chalky Champagne (NE of theParis Basin, France). Comptes Rendus Géoscience, Elsevier Masson, 2016, 348 (5), pp.368 - 378.�10.1016/j.crte.2015.11.005�. �hal-01689081�

Linoir D., Thomachot-Schneider C., Fronteau G., Gommeaux M., Barbin V. 2016. New characterization aspects
of carbonate accumulation horizons in Chalky Champagne (NE of Paris Basin, France). Comptes Rendus
Geoscience. 348, p. 368-378. doi.org/10.1016/j.crte.2015.11.005
1
New characterization aspects of carbonate accumulation horizons in Chalky
Champagne (NE of the Paris Basin, France)
Damien Linoir *, Céline Thomachot-Schneider, Maxime Gommeaux, Gilles Fronteau, Vincent Barbin
GEGENAA (EA3795), Université de Reims Champagne-Ardenne (URCA), 2 Esplanade Roland Garros, 51100 Reims, France
* corresponding author: Damien Linoir. [email protected]
Abstract:
The soil profiles of the Champagne area (NE of Paris Basin, France) occasionally show carbonate
accumulation horizons (CAHs). From the top to the bottom, these soil profiles include a rendic leptosol
horizon, a Quaternary cryoturbated paleosol (QCP), and a chalky substratum. The CAHs are located in
the top part of the QCP. This study is aimed at highlighting the specific characteristics of CAHs
compared to other soil profile horizons using geophysics, geochemistry, micromorphology, and
mercury injection porosimetry. It is the first essential step for understanding the impact of CAHs on
water transfers into the Champagne soil profiles. Our analyses show that Champagne CAHs are not
systematically characterized by a typical induration unlike generally put forward in the regional
literature. They are more porous and heterogeneous than their parent material (QCP). Carbonate
accumulation horizons are also characterized by singular colorimetric parameters that are linked to
their geochemical specific content, even if they bear a signature of the initial QCP before the pedogenic
modification.
Keywords: Chalky Champagne / Carbonate accumulation horizons / Cryoturbated paleosol /
Micromorphology / Mercury intrusion porosimetry.
1. Introduction
Pedogenic carbonate accumulation horizons (CAHs) are typical features of soil formation in arid and
semiarid environments, and occur in a variety of forms (Wright and Tucker, 1991). They are mainly
formed under Mediterranean to subarid conditions (Alonso-Zarza, 1999; AlonsoZarza and Wright,
2010; Hamidi et al., 2001). However, CAHs also occur in the various climatic conditions of tropical
(Goudie, 1973), subdesert (Schlesinger, 1985), Arctic (Lauriol and Clark, 1999), and semicontinental
(Loisy et al., 1999) environments.
In the Paris Basin, several French authors found pedogenetic CAHs (Bruand et al., 1997; Che´ry et al.,
1999; Hommeril et al., 1974; Nicoullaud et al., 1995; Ould and Bruand, 1993). They are located in the
upper part of a Quaternary superficial formation originating from cryoturbation of the Cretaceous
chalky substratum under periglacial climate (Allouc and Le Roux, 1995, 2000; Ballif, 1994; Ballif et al.,
1995; Bouttemy, 1966; Laurain et al., 1981; Loisy, 1997; Loisy and Pascal, 1998; Loisy et al., 1999;
Spanneut, 1997) and immediately under the organomineral horizon. These Champagne-Ardenne CAHs
appear as conglomerates of cryoclastic chalky sands and gravels coated with limey-clayey silts. They
are 5–20 cm thick, with occasionally a slab detachment, and they seem, sometimes, lighter colored
than the cryoturbated paleosol.

Linoir D., Thomachot-Schneider C., Fronteau G., Gommeaux M., Barbin V. 2016. New characterization aspects
of carbonate accumulation horizons in Chalky Champagne (NE of Paris Basin, France). Comptes Rendus
Geoscience. 348, p. 368-378. doi.org/10.1016/j.crte.2015.11.005
2
Previous studies showed that the formation of the Champagne CAHs began at the end of the Lateglacial
(14,000 years BP) under a periglacial climate and that it continues in the current period under
temperate and continental climates (Durand, 1979, 1980; Loisy, 1997; Loisy and Pascal, 1998).
However, if these studies give descriptions of CAHs, they only focus on the carbonate CAHs and do not
take into account the QCP, which is considered as the CAH host level (Loisy, 1997; Loisy et al., 1999).
The present study aims at highlighting the characteristics specific to the CAHs by comparing them to
other soil profile horizons and particularly to QCP, in which they may be formed. It is based not only
on in situ analyses (dynamic penetrometry and colorimetric tests), but also on micromorphological
observation (optical and SEM), geochemical content study, and mercury injection porosimetry. In
addition to allowing the establishment of a precise and specific CAH definition, this characterization
will allow a better understanding of the CAHs impact on water transfers within soil profiles or lateral
fluxes (Banwart et al., 2012), or the lack of carbon sequestration horizon (Robert and Saugier, 2003),
which are particularly vital in this region where the chalk aquifer is submitted to high agroindustrial
pressures.
Fig. 1. Location of the studied site: the Mont du Me´nil (commune of Aussonce, Champagne-Ardenne region)
and studied profile photography. A, rendosol A horizon; CAH, carbonate accumulation horizon; QCP,
quaternary cryoturbated paleosol; C, chalk.
2. Materials and methods
2.1. Study site
The study site, a former Santonian chalk quarry, is located in Chalky Champagne, at Mont du Me´nil
(on the commune of Aussonce: 4982103800 N, 481800800 E), about twenty kilometers north-east of

Linoir D., Thomachot-Schneider C., Fronteau G., Gommeaux M., Barbin V. 2016. New characterization aspects
of carbonate accumulation horizons in Chalky Champagne (NE of Paris Basin, France). Comptes Rendus
Geoscience. 348, p. 368-378. doi.org/10.1016/j.crte.2015.11.005
3
the city of Reims (Northeast of the Paris Basin) (Fig. 1). This site offers good conditions for observation
and sampling of CAHs and of other soil profile horizons. The study site is located at the top of a slope,
under a vegetation cover containing herbaceous plants and shrubs.
The studied profile extends over 4 linear meters at the top of a slope (Fig. 1). It can be divided, from
the bottom to the top, into four formations, which are: (1) a massive chalk (C) covered with (2) a
Quaternary cryoturbated paleosol (QCP), (3) a carbonate accumulation horizon (CAH), and (4) a rendic
leptosol (A) following the FAO WRB classification (2006), with a thickness ranging from 20 to 45 cm
(Fig. 1) and high organic matter content. The rendic leptosol is hereafter considered as a single
formation, notwithstanding the different horizons that might be described therein.
The QCP is a truncated polygonal paleosol formed by chalk alteration under periglacial climate up to
14,000 years BP (Ballantyne and Harris, 1994; Ballif et al., 1995). Its composition results from the
fragmentation of chalk material, the formation of pocket-shaped structures by cryoclasty and
cryosuction phenomena (Laurain et al., 1995; Murton et al., 2003). The thickness of the cryoturbated
material on the site varies from 70 to 120 cm and its upper limit with the CAH is very clear (Fig. 1).
A description of the CAH found at this site is given by Loisy and Pascal (1998) and Loisy et al. (1999).
This CAH results from calcite impregnation of the upper part of the QCP. The thickness of the CAH
varies from 20 cm in the northwestern zone to 5 cm in the southeastern zone (Fig. 1). The morphology
of this horizon also varies along the profile. It is mostly homogeneous and massive in the northwestern
zone and shows a slab detachment in the southeastern zone. The upper limit of this CAH with the
rendic leptosol is also well defined.
2.2. Colorimetry
On the field, CAHs sometimes seem to differ from the QCP, showing a lighter color. Colorimetry tests
were carried out in order to propose field colorimetric measurements as a CAH recognition
technique. Twenty measurements of colorimetry were taken at random on each horizon of the entire
profile (A, CAH, QCP, and C). No subdivision was noticed in the rendic leptosol.
We chose the L*a*b* color system, which quantifies a color by a light intensity parameter, L*, and
two other parameters, a* and b*, corresponding respectively to color variation on green/red and
blue/yellow axes.
In this color system, the calculation of the Euclidean distance allows one to obtain the global color
difference between two objects, generally noted as ΔE* (Moreau, 2008). The calculation of ΔE* is
performed according to the Eq. (1):
where L*c1, a*c1 and b*c1 are the coordinates of the first color and L*c2, a*c2 and b*c2 are the
coordinates of the second color in the L*a*b* color system. Moreau (2008) indicates that a color
difference 3 is not discernible to the naked eye.
2.3. Geochemical overview
Major element composition was analyzed by ICP-AES and the results are given in weight percentage
of oxide. The total carbonate content was obtained by using a calcimeter (Bernard type), and the

Linoir D., Thomachot-Schneider C., Fronteau G., Gommeaux M., Barbin V. 2016. New characterization aspects
of carbonate accumulation horizons in Chalky Champagne (NE of Paris Basin, France). Comptes Rendus
Geoscience. 348, p. 368-378. doi.org/10.1016/j.crte.2015.11.005
4
results were expressed in g kg1. The geochemical study was conducted on 17 samples taken from the
soil profile: four for the rendic leptosol, five for the CAH, six for the QCP, and two for the chalk. Each
sample weighed 10 g.
2.4. Dynamic cone penetrometry
Dynamic cone penetrometry was used in order to determine first the strength of the different horizons
of the soil profile, and second, to validate or not the characterization of Champagne-Ardenne CAHs by
higher resistance compared to the other horizons. Five profiles were tested along the 4 linear meters
of the studied area.
The device consists of a drill string provided with a conical penetrating tip. Penetration into the soil is
done by manual pounding of a strain gauge ram head by a hammer ballasted with lead (Sanglerat,
2012). For each hammer blow, the dialog terminal calculates the tip resistance Qd (MPa) using the
Dutch equation (Sanglerat, 2012) (2):
where m is the hammering mass (kg m2 s2), v is the hammering velocity (m s1), A is the tip section
(m2), e is the drill string penetration (m), and P is the hammered mass (kg).
2.5. Micromorphology
Thin sections (4.5 cm vertical by 3 cm horizontal) were carried out in quincunx along the blocks
sampled from the profiles (10 thin sections for 20 cm of the vertical profile). Micromorphological
analyses were performed both on fragments and on thin sections of the CAH, QCP, and chalk.
Observations were performed by using a polarizing petrographic microscope (Olympus BX51). A
scanning electron microscope (Hitachi TM-1000 Table Top) equipped with an energy-dispersive X-ray
spectrometer was also used in back-scattered electron mode. Observations were carried out with a
15-kV accelerating voltage and a 6mm working distance.
2.6. Mercury injection porosimetry
Mercury intrusion porosimetry (MIP) quantifies both the value of total porosity NHg and the pore
access distribution in a porous material (Cérépi et al., 2009; Galle´, 2001; Hildenbrand and Urai, 2003;
Yven et al., 2007). The relationship between the applied mercury capillary pressures and the pore
access radius is given by the Young– Laplace equation:
where P is the capillary pressure (Pa), s the mercury surface tension (0.485 N m1), u the contact angle
between mercury and the contact surface (1408), and r the pore access radius (m). According to this
relationship, each applied pressure corresponds to a pore access radius.
Analyses were carried out with a Micromeritics AutoPores IV 9500 apparatus. The measured pore
access radii ranged from 180 mm (0.004 MPa) to 0.003 mm (274 MPa). The soil pores’ dispersion is
characterized by the scatter coefficient Cd:
Linoir D., Thomachot-Schneider C., Fronteau G., Gommeaux M., Barbin V. 2016. New characterization aspects
of carbonate accumulation horizons in Chalky Champagne (NE of Paris Basin, France). Comptes Rendus
Geoscience. 348, p. 368-378. doi.org/10.1016/j.crte.2015.11.005
5
where P20, P50, and P80 are the intrusion pressures, which correspond respectively to the filling of
20%, 50%, and 80% of the porous network (Wardlaw et al., 1988). A value of Cd lower than 1
corresponds to a distribution centered around a pore access radius value, while a Cd> 1 characterizes
a moderate to high dispersion in the distribution of the values of the pore access radius (Remy, 1993;
Wardlaw et al., 1988).
MIP analyses were carried out on 1.5-cm samples systematically collected every 2 cm along the soil
profile.
3. Results
3.1. Colorimetric characterization
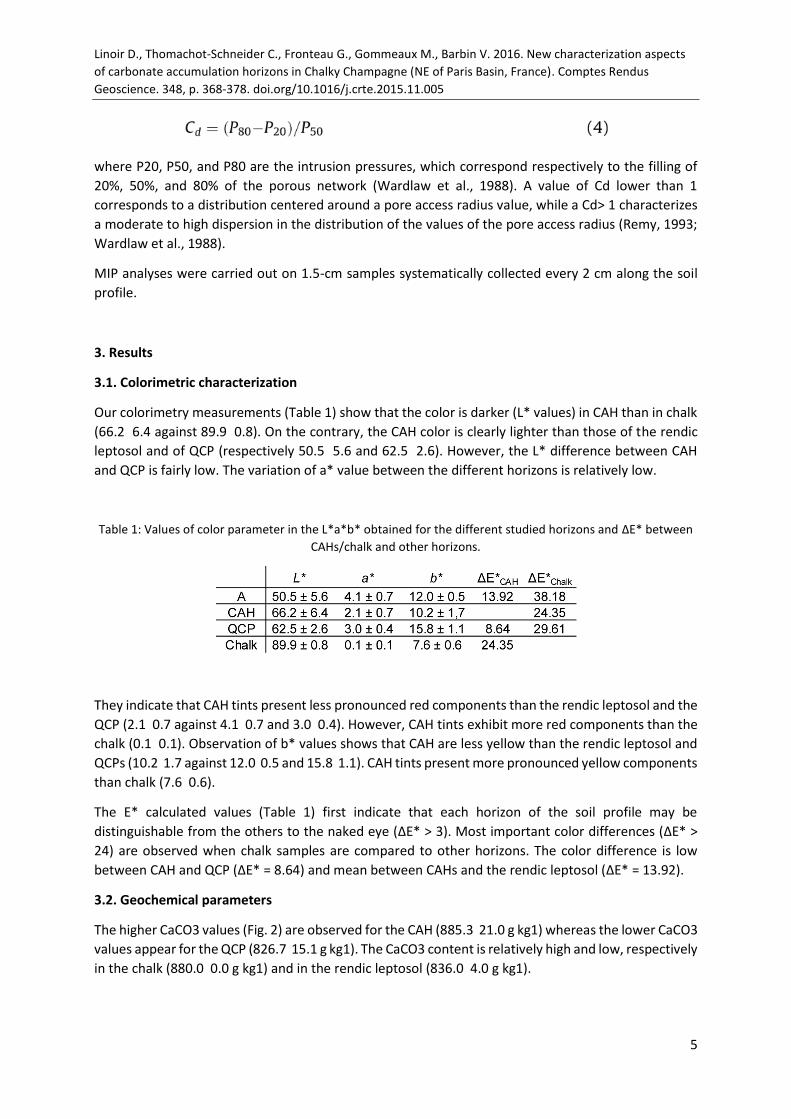
Our colorimetry measurements (Table 1) show that the color is darker (L* values) in CAH than in chalk
(66.2 6.4 against 89.9 0.8). On the contrary, the CAH color is clearly lighter than those of the rendic
leptosol and of QCP (respectively 50.5 5.6 and 62.5 2.6). However, the L* difference between CAH
and QCP is fairly low. The variation of a* value between the different horizons is relatively low.
Table 1: Values of color parameter in the L*a*b* obtained for the different studied horizons and ΔE* between
CAHs/chalk and other horizons.
They indicate that CAH tints present less pronounced red components than the rendic leptosol and the
QCP (2.1 0.7 against 4.1 0.7 and 3.0 0.4). However, CAH tints exhibit more red components than the
chalk (0.1 0.1). Observation of b* values shows that CAH are less yellow than the rendic leptosol and
QCPs (10.2 1.7 against 12.0 0.5 and 15.8 1.1). CAH tints present more pronounced yellow components
than chalk (7.6 0.6).
The E* calculated values (Table 1) first indicate that each horizon of the soil profile may be
distinguishable from the others to the naked eye (ΔE* > 3). Most important color differences (ΔE* >
24) are observed when chalk samples are compared to other horizons. The color difference is low
between CAH and QCP (ΔE* = 8.64) and mean between CAHs and the rendic leptosol (ΔE* = 13.92).
3.2. Geochemical parameters
The higher CaCO3 values (Fig. 2) are observed for the CAH (885.3 21.0 g kg1) whereas the lower CaCO3
values appear for the QCP (826.7 15.1 g kg1). The CaCO3 content is relatively high and low, respectively
in the chalk (880.0 0.0 g kg1) and in the rendic leptosol (836.0 4.0 g kg1).

Linoir D., Thomachot-Schneider C., Fronteau G., Gommeaux M., Barbin V. 2016. New characterization aspects
of carbonate accumulation horizons in Chalky Champagne (NE of Paris Basin, France). Comptes Rendus
Geoscience. 348, p. 368-378. doi.org/10.1016/j.crte.2015.11.005
6
The most important part of the major oxides present within the soil profile horizons is represented by
CaO (about 80% in the rendic leptosol and QCP, about 90% in the CAH and 97% in the chalk). In the
rest of the major oxides, the major part is represented by SiO2 (14.3%, 11.7%, 6.4%, and 1.7%
respectively for QCP, rendic leptosol, CAH, and chalk). Al2O3 represents 3.2%, 2.7%, 2.2%, and 0.7% of
the rendic leptosol, QCP, CAH, and chalk, respectively, whereas 1.3%, 1.1%, 1.0%, and 0.3% of the
rendic leptosol, QCP, CAH, and chalk, respectively, are represented by Fe2O3.
3.3. Vertical resistance profile
In thin CAH typical profiles, the rendic leptosol exhibited low tip resistance values ranging between 0.2
and 2 MPa, and while the CAH was not clearly defined, it showed the same tip resistance values as the
QCP (between 2 and 9 MPa) (Fig. 2). In a thick CAH typical profile, the tip resistance values started to
increase in the basal part of the rendic leptosol (3.5 MPa against <1 for the top part of the rendic
leptosol) (Fig. 2). The CAH exhibited the same tip resistance values as the basal part of the rendic
leptosol. The beginning of the QCP was characterized by an increase in the tip resistance values (8–10
MPa) (Fig. 2).
Even though the limit between the rendic leptosol and the CAHs was very clear on the field (color
change), no clearly defined limit allows us to clearly distinguish the different horizons of the soil profile
by dynamic penetrometry.
Fig. 2. Penetrometric characteristics of the thin and thick CAH soil profile and CaCO3 mean contents (and
standard deviations) of the different horizons of the soil profile.

Linoir D., Thomachot-Schneider C., Fronteau G., Gommeaux M., Barbin V. 2016. New characterization aspects
of carbonate accumulation horizons in Chalky Champagne (NE of Paris Basin, France). Comptes Rendus
Geoscience. 348, p. 368-378. doi.org/10.1016/j.crte.2015.11.005
7
Fig. 3. Microstructures of the CAH and the QCP in thin sections (polarized light). Views of A: large chalk
cryoclast (CR) coated with a thin layer of plasmic fabric (PF) and calcite needles (n) that can form arch-shaped
bridges (b), interpedal curved planes (Icp) within QCP; B: a typical spheroidal to blocky ped (P) containing small
cryoclast occurrences (cr) within QCP; C: typical QCP interpedal curved planes (Icp) presenting numerous
constrictions; D: typical larger CAH interpedal curved planes (Icp) generally well connected; E: star-shaped vugh
observed in QCP; F: wide star-shaped vugh that exhibits a complexity of structure observed in the CAH

Linoir D., Thomachot-Schneider C., Fronteau G., Gommeaux M., Barbin V. 2016. New characterization aspects
of carbonate accumulation horizons in Chalky Champagne (NE of Paris Basin, France). Comptes Rendus
Geoscience. 348, p. 368-378. doi.org/10.1016/j.crte.2015.11.005
8
Fig. 4. Microstructures of the CAH and the QCP observed with SEM. Views of A: ped (P) containing small chalk
cryoclasts (cr); B: star-shaped vugh that exhibits pore access radii (arrows); C: calcite needle bridge (b) within the
intrapedal curved plane between large chalk cryoclasts (CR) coated with calcite needle layer (n) and D: calcite
needle disorganized mass in the CAH chamber.
Table 2 : Differences observed between QCP and CAH macrofeatures, voids, and calcite needles.

Linoir D., Thomachot-Schneider C., Fronteau G., Gommeaux M., Barbin V. 2016. New characterization aspects
of carbonate accumulation horizons in Chalky Champagne (NE of Paris Basin, France). Comptes Rendus
Geoscience. 348, p. 368-378. doi.org/10.1016/j.crte.2015.11.005
9
3.4. Micromorphological characterization
SEM observations show that chalk has a conventional composition. It contains coccoliths fragments,
which fill the spaces between whole or slightly dismantled coccoliths. It also contains some quartz
grains and clay minerals. However, a very thin and homogenous porosity (Ø of about 0.7 mm) can be
observable between all these components.
The skeleton grains of QCP mainly consist of chalk cryoclasts. These cryoclasts exhibits two main
morphologies:
• large chalk cryoclasts (Ø > 0.5 mm) exhibit circular to ovoid shapes. They can show a well
defined outline or a clear alteration pellicle (Fig. 3A and Figure 5, CR);
• small chalk cryoclasts (200 µm < Ø < 600 µm) also exhibit circular to ovoid shapes but their
outline is not clearly defined (Fig. 3B and Figure 5, cr).
The spatial distribution of cryoclasts is that of a random basic distribution pattern. Their color ranging
from white to beige is due to their chalky nature and to their alteration intensity. The skeleton of QCP
and CAH also shows to a lesser extent aeolian originated quartz (10 µm < Ø < 600 µm), feldspar grains
(10 µm < Ø < 50 µm) and some glauconite occurrences (40 µm < Ø < 60 µm).
The plasmic fabric is mainly composed of calcite which is represented by residual micrite and sparitic
and/or microsparitic cements. It also contains a clay assemblage (illite, smecite and illite/smectite
mixed-layer clays). The plasmic fabric exhibits some inorganic residues of biological origin: coccolithes,
foraminifers and shells. The color of the plasmic fabric is dark beige to brown. Plasmic fabric appears
in two forms:
• it is first systematically composed of a thin coating (20 to 50 µm) around large chalk cryoclasts
(Fig. 3A and Figure 1, n);
• it is also composed of spheroidal to blocky peds (Soil Survey Staff, 1993) which exhibit a mean
diameter of 2 mm, some of them 3 mm wide. These peds contain the major part of the small chalk
cryoclasts (Fig. 3B, Fig. 4A and Figure 5).
Large chalk cryoclasts and spheroidal to blocky peds constitute the macrofeatures of QCP. These
macrofeatures are partially accommodated to unaccommodated and are highly to moderately
separated (Bullock et al., 1985). This arrangement defines two major types of voids:
• interpedal curved planes (Stoops, 2003) are about 60 µm large and display numerous
constrictions (Plate 1-A; B and C and Figure 5);
• star-shaped vughs (Stoops, 2003) with a mean diameter of 3 mm. Some secondary spheroidal
peds (Bullock and Murphy, 1976) can be found inside star-shaped vughs. These peds have a diameter
ranging from 10 to 500 µm. Star-shaped vughs can also can contain some small chalk cryoclasts.
However, QCP star-shaped vughs exhibit high values of macroporosity (Fig. 3E, Fig. 4B and Figure 5).
The entire pore walls are lined with acicular calcite coating approximately 13 µm thick (Fig. 3A, Fig. 4B
and Figure 5). Calcite needles have a length of 10 to 100 µm and a diameter smaller than 2 µm. Their
size and their pair-wise association allow to classify them in the smooth paired rods category: MA1
(Verrecchia and Verrecchia, 1994). This needle fiber calcite is also agglomerated to form arch-shaped
bridges over the voids (Fig. 3A, Fig. 4-C and Figure 5) and thus can exceptionally shrink the star shaped
vughs.

Linoir D., Thomachot-Schneider C., Fronteau G., Gommeaux M., Barbin V. 2016. New characterization aspects
of carbonate accumulation horizons in Chalky Champagne (NE of Paris Basin, France). Comptes Rendus
Geoscience. 348, p. 368-378. doi.org/10.1016/j.crte.2015.11.005
10
The CAH exhibit the same types of macrofeatures, voids and calcite needle coating. However, the
distribution and the size of these features show some differences which allow to characterize the CAH
singularity (Table 2). The spheroidal to blocky peds within the CAH exhibit a smaller diameter than in
the QCP (800 µm to 1.5 mm). Moreover, they are not systematically well-defined unlike peds observed
in the QCP. Interpedal curved planes of the CAH are larger than in the QCP (width up to 140 µm) and
are generally well-connected contrary to what is observed in the QCP (Plate 1-D and Figure 5). The
mean star-shaped vughs observed in the CAH are about two times larger than those present in the
QCP (6 mm) (Fig. 3D and Figure 5). Moreover, some occurrences exhibit a diameter reaching up to 8
mm. As in the QCP, CAH star-shaped vughs present arch-shaped bridges of calcite needles. However,
calcite needles form less disordered aggregates (Fig. 3F and Figure 5).
Figure 5: Schematic representation of the QCP and CAH micromorphologies.

Linoir D., Thomachot-Schneider C., Fronteau G., Gommeaux M., Barbin V. 2016. New characterization aspects
of carbonate accumulation horizons in Chalky Champagne (NE of Paris Basin, France). Comptes Rendus
Geoscience. 348, p. 368-378. doi.org/10.1016/j.crte.2015.11.005
11
3.5. Pore system geometry
Total porosity by mercury intrusion (NHg) obtained on CAH is 51.6 ± 5.0 %. These values of NHg are
significantly higher than that of QCP and chalk samples (respectively 41.0 ± 3.4 and 42.3 ± 0.2 %).
Regarding the pore access distribution given by the spread of MIP curves, CAH are highly
heterogeneous. No dominant pore access radius could be distinguished but there was rather a large
range of pore access radii from micro to macroporosity (Figure 6-A). This heterogeneity is reflected by
the high values of the Cd, i.e. 8.5 ± 4.7.
All the porosimetric curves of QCP are characterized by two well-defined pore access families also
present in CAH but better defined in QCP (Figure 6-B). The access radii of these two pore families are
centered on 0.26 µm for the first one and 30.79 µm for the second one. The corresponding Cd obtained
for QCP is 3.3 ± 1.8.
The chalk porosimetric curve shows a unique and very well defined mode centered on 0.33 µm (Figure
6-C) close to one of the pore families identified in QCP and CAH. The calculated dispersion coefficient
Cd is 0.6 ± 0.1.
Fig. 6. Mercury intrusion porosimetry curves for (A) Carbonate Accumulation Horizons (CAHs), (B) Quaternary
Cryoturbated Paleosol (QCP) and for the chalk (C).

Linoir D., Thomachot-Schneider C., Fronteau G., Gommeaux M., Barbin V. 2016. New characterization aspects
of carbonate accumulation horizons in Chalky Champagne (NE of Paris Basin, France). Comptes Rendus
Geoscience. 348, p. 368-378. doi.org/10.1016/j.crte.2015.11.005
12
4. Discussion
CAHs colorimetric characterization is rarely discussed in the specific literature specialized on this type
of horizons (e.g., Alonso-Zarza and Wright, 2010; Wright and Tucker, 1991). The macroscopic
structures of Champagne-Ardenne CAHs and QCPs are relatively identical on the field, and so the
distinction between these two horizons is sometimes difficult. The colorimetric study carried out in the
L*a*b* color space shows that CAHs exhibit higher L* than QCPs, possibly because of a higher total
carbonate content. However, the L* difference between CAHs and QCPs is less important than those
observed between QCPs/CAHs and the rendic leptosol and the chalk. This explains why it is sometimes
difficult to identify clearly.
QCPs result from the periglacial alteration of the chalk (Durand, 1979; Loisy and Pascal, 1998). The
formation of this type of paleosol is synchronous with the formation of decalcification clay minerals
(Harris and Ellis, 1980; Matsuoka, 2001); this could account for higher Al2O3 and SiO2 contents than
in the CAHs and chalk. Higher clay mineral contents could explain the redder and yellower tints of QCPs
compared to those of the other horizons. As for the rendic leptosol, its redder and yellower tints could
be explained by high organic matter content.
If the distinction between CAHs and QCPs is sometimes difficult to the naked eye on the field, the ΔE*
calculation (which takes into account the three L*a*b* colorimetric parameters) shows that CAHs and
QCPs distinction can be supported by colorimetric measurement. It is however important to bear in
mind that this kind of study is dependent on soil humidity.
Also, for the first time, a penetrometric study carried out here was done with a view to characterizing
CAHs within a soil profile. Dynamic penetrometry tests performed through the depth of the soil profile
depth show that notwithstanding the carbonate precipitations that they present, CAHs exhibit a low
induration that is directly linked to high total porosity values (51.6%). These new data seem to
contradict the ideas generally advanced in the literature, which usually defines CAHs as being hard
levels (only Durand (1979) nuances this by qualifying CAHs as irregularly cemented). However,
induration is not characteristic of CAHs compared to other horizons, and finally, it is not a means by
which CAHs can be identified within the soil profile. The absence of a well-discernible characteristic
signature of CAHs in the soil profile also does not allow the use of a dynamic penetrometer as a CAHs
prospecting method in the soil of Champagne as Maquaire et al. (2002) did within the badlands of the
Draix research catchments in order to estimate and map the large spatial variations in the thickness of
weathered marl profile.
Previous micromorphological studies focused solely on CAHs levels in order to understand their
formation modes (Durand, 1979; Loisy and Pascal, 1998; Loisy et al., 1999).
The comparison with other levels of soil profiles (especially QCPs) permits to show that differences
exist between CAHs and QCPs. Although CAHs and QCPs present the same micromorphologic entities
and void types, the morphological variations of these entities are responsible for the structural
differences between CAHs and QCPs.
Mercury intrusion porosimetry curves obtained on QCPs showed a bimodal trend with pore access
families ranging between 24.6 and 30.8 mm and between 0.21 and 0.26 mm. Compared to the thin
section observations, the first pores family was related to the voids accessible by the interpedal curved
planes. The second pore family is too small to correspond to a type of voids observed on thin sections.
Some similarities were found between this pore family (Fig. 4B) with the monomodal repartition of the
pore access radii of chalk, typically characterized by a pore mean value of 0.33 mm (which corresponds

Linoir D., Thomachot-Schneider C., Fronteau G., Gommeaux M., Barbin V. 2016. New characterization aspects
of carbonate accumulation horizons in Chalky Champagne (NE of Paris Basin, France). Comptes Rendus
Geoscience. 348, p. 368-378. doi.org/10.1016/j.crte.2015.11.005
13
to the spaces between the coccoliths; Price et al., 2000). This pore family also corresponds to the
microporosity of the plasmic fabric and the disordered aggregates of needle fiber calcite.
Within the QCPs, the second family (0.21–0.26 mm) is more extensive and takes into account the
internal porosity of the plasmic fabric in addition to the porosity of chalk cryoclasts. On the contrary,
the mercury intrusion porosimetry curves of the CAHs generally exhibit plurimodal porous network
marked by a dispersion coefficient (Cd) greater than those of the QCP curves (around 10). As in the
QCPs, the interpedal curved planes observed in thin sections are visible on CAH mercury intrusion
porosimetry curves. However, they cover more important pore access radii intervals. In thin sections,
CAH interpedal curved planes exhibit fewer constrictions than in the QCPs. This network included
interpedal curved planes and intraparticle pores similar to those found in QCPs. If CAHs resulted from
a modification of the QCPs, the presence of such voids may be inferred from the genetic relationship
between these two horizons. However, the two horizons showed important differences in pores
system with regard to interpedal curved planes and star-shaped vughs. These porosities are more
prevalent and more connected in the CAHs than in the QCPs. Access radii affiliated to QCP interpedal
curved planes and star-shaped vughs are also observed on CAHs mercury intrusion porosimetry curves.
QCP porosimetric signature is recognizable in the CAHs and both horizons show the same
micromorphologic entity types. These two new observations tend to confirm the hypothesis of Loisy
(1997), who describes the CAH establishment within the QCPs.
It is clearly admitted that calcite needles (NFC) have a biologic origin (Cailleau et al., 2009; Loisy et al.,
1999; Verrecchia and Verrecchia, 1994). Although calcite needles are also some of CAH and QCP
ubiquitous micromorphological entities, they are much more numerous and appear less clearly
organized in star-shaped vughs of the CAHs than in those of the QCPs. This CAHs’ characteristic is found
in their mercury injection porosimetry curves by the spread of the pore access family to low values.
Microscopic observations coupled with the mercury injection porosimetry and the study of CAHs in
their global context within the soil profile allow us to see that the CAHs have present characteristics
inherited from their host formations (QCPs). However, their deposition allows them to acquire their
own characteristics. Because an important part of these characteristics is relative to porous networks,
it is possible to predict that CAHs have an important role within the soil profiles of Champagne. CAHs
may indeed induce a more important drainage of the rendic leptosol and the porous network
differences between horizons. Moreover, they will induce the presence of hydraulic discontinuity at
the soil profiles scale and maybe a lateralization of lateral water transfers.
5. Conclusion
Carbonate accumulation horizons (CAHs) are particular types of horizons deposited within some soil
profiles of Champagne-Ardenne (Northeast of France). When present, these levels of carbonate
redistribution are located in the top part of Quaternary cryoturbated paleosols (QCPs) and under the
organomineral horizon. Although direct discrimination on the field can be quite difficult, the
comparison of CAH characteristics to the other horizons of the soil profiles analyzed in this study
showed that CAHs have their own characteristics. This study showed that field colorimetric
measurements can be used to identify CAHs and particularly to discriminate them from QCPs. Even
though the literature suggests that CAHs have a strong induration, and hence the usual qualification
of ‘‘crusts,’’ the dynamic penetrometer tests showed that they are not characterized by high hardness
compared to other horizons of the soil profiles. This low induration is connected with the very high
total porosity they present. Thus, this nondestructive method cannot be used to indicate the presence

Linoir D., Thomachot-Schneider C., Fronteau G., Gommeaux M., Barbin V. 2016. New characterization aspects
of carbonate accumulation horizons in Chalky Champagne (NE of Paris Basin, France). Comptes Rendus
Geoscience. 348, p. 368-378. doi.org/10.1016/j.crte.2015.11.005
14
of CAHs. The study also shows that if CAHs have the porosimetric signature of their host material (QCP)
and the same major types of micromorphological features, they differ by a singular structure and
heterogeneity of the porous networks. This study highlighted that CAHs exhibit a unique nature within
the soil profiles of Champagne. It is an essential first step that will allow the study in greater detail of
the impact of CAHs on water transfers or lateral fluxes into the Champagne soil profile.
Acknowledgements
The AQUAL program financially supported this work and the authors wish to thank the Champagne-
Ardenne region for the PhD grant, which permitted this study. We also would like to thank Julien
Hubert and Alexandra Conreux for their help during the block sampling in the field and carbonate
content analyzes.
References
Allouc, J., Le Roux, J., 1995. Mourmelon-le-Grand (133), Cartes Géol. France (1/50000). BRGM, Orléans.
Allouc, J., Le Roux, J., 2000. Suippes (159), Cartes Géol. France (1/50000). BRGM, Orléans.
Alonso-Zarza, A.M., 1999. Initial stages of laminar calcrete formation by roots: examples from the Neogene of
central Spain. Sedimentary Geology, 126, 177-191.
Alonso-Zarza, A.M., Wright, V.P., 2010. Chapter 5 Calcretes. in: Alonso-Zarza, A.M., Tanner, L.H. (Eds.),
Developments in Sedimentology. Elsevier, pp. 225-267.
Ballantyne, C.K., Harris, C., 1994. The Periglaciation of Great Britain. Cambridge University Press.
Ballif, J.-L., 1994. Etude pédo-agronomique de nouvelles parcelles du domaine du Lycée Agricole de la Marne.
Ferme de la Poste à Somme-Vesle. Carte des sols du domaine, Travaux de la Station d'Agronomie de Châlons-
sur-Marne. I.N.R.A., Châlons-sur-Marne, pp. 11.
Ballif, J.-L., Guérin, H., Muller, J.-C., 1995. Eléments d'agronomie champenoise ; connaissances des sols et de leur
fonctionnement ; rendzines sur craie et sols associés ; esquisse géomorphopédologique. I.N.R.A ed, Versailles.
Banwart, S., Menon, M., Bernasconi, S.M., Bloem, J., Blum, W.E.H., Maia de Souza, D., Davidsdotir, B., Duffy, C.,
Lair, G.J., Kram, P., Lamacova, A., Lundin, L., Nikolaidis, N.P., Novak, M., Panagos, P., Ragnarsdottir, K.V.,
Reynolds, B., Robinson, D., Rousseva, S., de Ruiter, P., van Gaans, P., Weng, L., White, T., Zhang, B., 2012. Soil
processes and functions across an international network of Critical Zone Observatories: Introduction to
experimental methods and initial results. C. R. Geoscience 344 (11–12), 758–772.
Bouttemy, R., 1966. Craonne 3/4-7/8, Asfeld-la-Ville 1/2-5/6. Service de Cartographie des Sols de la Chambre
d'Agriculture de l'Aisne, Laon.
Bruand, A., Creuzot, G., Quétin, P., Darthout, R., Raison, L., Courtemanche, P. and Gaillard, H., 1997. Variabilité
de la recharge de la nappe de Beauce. Etude et Gestion des Sols, 4, 4, 229-245.
Bullock, P., Fedoroff, N., Jongerius, A., Stoops, G., Tursina, T. and Babel, U., 1985. Handbook for Soil Thin Section
Description. Wane Research Publications, Wolverhampton, United Kingdom, 152 p.
Bullock, P. and Murphy, C., 1976. The microscopic examination of sub-surface horizon of soils. Outlook on
Agriculture, 8, pp. 348-354.

Linoir D., Thomachot-Schneider C., Fronteau G., Gommeaux M., Barbin V. 2016. New characterization aspects
of carbonate accumulation horizons in Chalky Champagne (NE of Paris Basin, France). Comptes Rendus
Geoscience. 348, p. 368-378. doi.org/10.1016/j.crte.2015.11.005
15
Cailleau, G., Verrecchia, E.P., Braissant, O., Emmanuel, L., 2009. The biogenic origin of needle fibre calcite.
Sedimentology, 56, 1858-1875.
Cérépi, A., Loisy, C., Burlot, R., 2009. Monitoring of water and heat transfer in the vadose zone of a carbonate
formation: an example of an underground quarry in Gironde, France. C. R. Geoscience 341, 473–485.
Chéry, P., Lavialle, O., Bourennane, H., King, D., Bruand, A., 1999. Variabilité verticale de la composition
granulométrique des limons de Patite Beauce (France). Etude et Gestion des Sols, 6, 4, 185-196.
Durand, R., 1979. La pédogenèse en pays calcaire dans le nord-est de la France, Université Louis Pasteur,
Strasbourg, 198 pp.
Durand, R., 1980. Variations saisonnières de la concentration des solutions et des gaz du sol en milieu crayeux.
Science du Sol, 3, 217-230.
FAO, IUSS, ISRIC, 2006. World Reference Base for Soil Resources 2006: A Framework for International
Classification, Correlation and Communication. Food and Agriculture Organization of the United Nations,
Rome.
Gallé, C., 2001. Effect of drying on cement-based materials pore structure as identified by mercury intrusion
porosimetry - A comparative study between oven-, vacuum-, and freeze-drying. Cement and Concrete
Research, 31, 1467-1477.
Goudie, A.S., 1973. Duricrusts in tropical landscape. Clarendon Press, Oxford.
Hamidi, E.M., Colin, F., Michard, A., Boulangé, B., Nahon, D., 2001. Isotopic tracers of the origin of Ca in a
carbonate crust from the Middle Atlas, Morocco. Chemical Geology, 176, 93-104.
Harris, C. and Ellis, S., 1980. Micromorphology of soils in soliflucted materials, Okstindan, Northern Norway.
Geoderma, 23, 11-29.
Hildenbrand, A., Urai, J.L., 2003. Investigation of the morphology of pore space in mudstones-first results. Marine
and Petroleum Geology, 20, 1185-1200.
Hommeril, P., Martin, P., Puissegur, J.-J., 1974. Les nappes alluviales de la Seine à Cléon (près de Rouen) et leurs
intercallations saumâtres. Bulletin de l'Association Française pour l'Etude du Quaternaire, 11, N°3-4, 202-207.
Laurain, M., Guérin, H., Barta, L., Monciardini, C., Allouc, J., 1981. Reims (158), Cartes Géol. France (1/50000).
BRGM, Orléans.
Laurain, M., Guérin, H., Marre, A., Richard, J., 1995. Processus génétiques à l'origine des formations de pente à
graviers de craie en Champagne. Permafrost and Periglacial Processes, 6, 103-108.
Lauriol, B., Clark, I., 1999. Fissure calcretes in the arctic: a paleohydrologic indicator. Applied Geochemistry, 14,
775-785.
Loisy, C., 1997. Les encroûtements carbonatés quaternaires en substrat crayeux (Est du Bassin de Paris) : rôles
de la diagenèse et des actions biologiques, Université de Reims Champagne-Ardenne, Reims, 387 pp.
Loisy, C., Pascal, A., 1998. Indurated carbonate horizon in chalky Champagne: Function of diagenesis and
biological effects under temperate climate. Les encroûtements carbonatés («calcrètes») en Champagne
crayeuse: Rôles de la diagenèse et des actions biologiques sous climat tempéré, 169, 189-201.
Loisy, C., Verrecchia, E.P., Dufour, P., 1999. Microbial origin for pedogenic micrite associated with a carbonate
paleosol (Champagne, France). Sedimentary Geology, 126, 193-204.
Maquaire, O., Ritzenthaler, A., Fabre, D., Ambroise, B., Thiery, Y., Truchet, E., Malet, J.-P. and Monnet, J., 2002.
Caractérisation des profils de formations superficielles par pénétrométrie dynamique à énergie variable :

Linoir D., Thomachot-Schneider C., Fronteau G., Gommeaux M., Barbin V. 2016. New characterization aspects
of carbonate accumulation horizons in Chalky Champagne (NE of Paris Basin, France). Comptes Rendus
Geoscience. 348, p. 368-378. doi.org/10.1016/j.crte.2015.11.005
16
application aux marnes noires de Draix (Alpes-de-Haute-Provence, France). Comptes Rendus de Géosciences,
334, 835-841.
Matsuoka, N., 2001. Solifluction rates, processes and landforms: a global review. Earth-Science Review, 55, (1-
2), 107-134.
Moreau, C., 2008. Vieillissement en milieu naturel de pierres calcaires hydrofugées : Evaluation de la durabilité
des traitements et de leur impact sur le nettoyage. Université de Reims Champagne-Ardenne, Reims, 377 pp.
Murton, J.B., Bateman, M.D., Baker, C.A., Knox, R., Whiteman, C.A., 2003. The Devensian periglacial record on
Thanet, Kent, UK. Permafrost and Periglacial Processes, 14, 217-246.
Nicoullaud, B., Darthout, R., Duval, O., 1995. Etude de l'enracinement du blé tendre d'hiver et du maïs dans les
sols argilo-limoneux de petite Beauce. Etude et Gestion des Sols, 2, 3, 183-200.
Ould Mohamed, S., Bruand, A., 1993. Morphology and origin of secondary calcite in soils from Beauce, France.
in: Ringrose-Voase, A.J., Humphreys, G.S. (Eds.), Developments in Soil Science. Elsevier, pp. 27-36.
Price, M., Low, R.G., McCann, C., 2000. Mechanisms of water storage and flow in the unsaturated zone of the
Chalk aquifer. Journal of Hydrology, 233, 54-71.
Remy, J.M., 1993. Influence de la structure du milieu poreux carbonaté sur les transferts d'eau et les
changements de phase eau-glace. Application à la durabilité au gel de roches calcaires de Lorraine, Institut
National Polytechnique de Lorraine, Nancy, 327 pp.
Robert, M., Saugier, B., 2003. Contribution des écosystèmes continentaux à la séquestration du carbone. C. R.
Geoscience 335, 577–595.
Sanglerat, G., 2012. The Penetrometer and Soil Exploration. Elsevier Science.
Schlesinger, W.H., 1985. The formation of caliche in soils of the Mojave Desert, California. Geochimica et
Cosmochimica Acta, 49, 57-66.
Soil Survey Staff, 1993. Soil Survey Manual, Department Of Agriculture, United States of America, Governmental
Printing Office, Washington DC., 503 p..
Spanneut, B., 1997. Tourbe Eau Pure, fonctionnement hydrogéologique du bassin versant de la Tourbe, Rapport
d'activités de la Chambre d'Agriculture de la Marne, pp. 24.
Stoops, G., 2003. Guideline for analysis and description of soil and regolith thin sections. Soil Science Society of
America, Inc., Madison.
Stoops, G., 1998. Key to the ISSS “Handbook for Soil Thin Section Description”. Natuurwet. Tijdschrift. 78. pp.
193-203.
Verrecchia, E.P., Verrecchia, K.E., 1994. Needle-fiber calcite; a critical review and a proposed classification.
Journal of Sedimentary Research, 64, 650-664.
Wardlaw, N.C., McKellar, M., Li, Y., 1988. Pore and throat size distribution determined by mercury porosimetry
and by direct observations. Carbonates and Evaporites, 3, 1, 1-15.
Wright, V.P., Tucker, M.E., 1991. Calcretes: an introduction. in: Wright, V.P., Tucker, M. E. (Ed.), Calcretes.
Blackwell Scientific Publications, Oxford, pp. 1-22.
Yven, B., Sammartino, S., Géraud, Y., Homand, F., Villiéras, F., 2007. Mineralogy, texture and porosity of Callovo-
Oxfordian argillites of the Meuse/Haute-Marne region (eastern Paris basin). Mémoires de la Société
Géologique de France, 178, 73-90.