Embed Size (px)
Citation preview

Consolidated Financial Results For Fiscal 2013 Ended March 31, 2014 (Japan GAAP)
May 12, 2014 Company name : Azbil CorporationURL : http://www.azbil.com/Stock exchange listing : Tokyo Stock Exchange 1st Section (CODE 6845) Representative : Hirozumi Sone, President and Chief Executive Officer Contact : Takayuki Yokota, Executive Officer, Head of Group Management
HeadquartersTelephone Planned date of general shareholders meeting
: :
+81-3-6810-1009June 26, 2014
Planned date of cash dividends : June 27, 2014Planned date to file annual security report : June 26, 2014Supplementary materials prepared : YesFinancial results information meeting held : Yes (for investors and analysts,etc.)
Notes: 1. The Japanese financial accounting standards are applied for this statement of accounts. Notes: 2. Amounts indicated are rounded down.
1. Results for fiscal 2013 ended March 31, 2014 (April 1, 2013 to March 31, 2014) (1) Consolidated financial results
(Percentage shows the increase (decrease) from the previous period.)
Net sales Operating income Ordinary income Net income Millions of yen % Millions of yen % Millions of yen % Millions of yen %
Fiscal year 2013 248,416 9.2 13,903 3.7 14,599 0.2 7,669 (7.7)Fiscal year 2012 227,584 1.8 13,410 (6.5) 14,569 (0.2) 8,308 (2.5)Note : Comprehensive income As of March 31, 2014 10,892 million yen 3.3% Note : Shareholders’ equity As of March 31, 2013 10,540 million yen 18.3%
Net income per share
Diluted net income per share
Net income to shareholders’
equity
Ordinary income to
total assets
Operating income ratio
Yen Yen % % %
Fiscal year 2013 103.85 - 5.4 5.9 5.6Fiscal year 2012 112.50 - 6.1 6.2 5.9Reference : Equity in earnings (losses) of affiliates As of March 31, 2014 (6) million yen
As of March 31, 2013 - million yen (2) Consolidated financial position
Total assets Net assets Shareholder’s equity ratio
Net assets per share
Millions of yen Millions of yen % Yen
As of March 31, 2014 253,448 144,978 56.5 1,940.56
As of March 31, 2013 243,418 141,197 57.1 1,882.66
Note : Shareholders’ equity As of March 31, 2014 143,316 million yen Note : Shareholders’ equity As of March 31, 2013 139,041 million yen
(3) Consolidated cash flows
Cash flows
from operating activities
Cash flowsfrom investing
activities
Cash flowsfrom financing
activities
Cash andcash
equivalents Millions of yen Millions of yen Millions of yen Millions of yen
Fiscal year 2013 15,835 (10,669) (6,939) 55,844Fiscal year 2012 15,010 (12,716) (2,486) 56,050
2. Dividends
Dividends per share Total dividends (Annual)
Payout ratio
(Consol.)
Dividends on equity (Consol.) 1Q 2Q 3Q Year-end Total
Yen Yen Yen Yen Yen Millions of yen % %
Fiscal year 2012 - 31.50 - 31.50 63.00 4,652 56.0 3.4Fiscal year 2013 - 31.50 - 31.50 63.00 4,652 60.7 3.3Fiscal year 2014
(Forecast) - 31.50 - 31.50 63.00 54.7

3. Forecast of consolidated financial results for fiscal year ending March 31, 2015 (April 1, 2014 to March 31, 2015)
(Percentage shows the increase (decrease) from the previous fiscal year.)
Net sales Operating income Ordinary income Net income Net income per share
Millions of yen % Millions of yen % Millions of yen % Millions of yen % Yen
Six months ending September 30, 2014 116,000 4.2 3,400 38.3 3,200 15.9 1,600 56.7 21.66
Fiscal year 2014 260,000 4.7 15,500 11.5 15,000 2.7 8,500 10.8 115.09 * Notes
(1) Changes in significant subsidiaries during the period(1) (Changes in specified subsidiaries due to changes in the scope of consolidation) : No New consolidation : None (Company name: ) Exclusion : None (Company name : ) (2) Changes in accounting policies, accounting estimates, and retrospective restatements
1. Changes associated with revision in accounting standards2. Other changes 3. Changes in accounting estimates
: Yes: No : No
4. Retrospective restatements : No(Note) For details, please refer to “4. Consolidated financial Statements (5) Notes to the consolidated financial
statements (Changes in accounting standards) on page 26 of the appendix. (3) Number of shares issued (common stock)
1. Number of shares issued (including treasury stock) As of March 31, 2014 75,116,101 shares As of March 31, 2013 75,116,101 shares 2. Number of Treasury stock As of March 31, 2014 1,263,194 shares As of March 31, 2013 1,262,123 shares 3. Average number of shares As of March 31, 2014 73,853,357 shares As of March 31, 2013 73,854,399 shares
* Description of the situation of the procedures for audit results
This financial results is not subject to the audit procedures specified in the Financial Instruments and Exchange Act. As of the disclosure of this financial results, the procedures for auditing consolidated financial statements are in progress.
* Regarding the appropriate use of forecast and other special matters
(Attention to the description of the future) Sales for the azbil Group tend to be concentrated in the second quarter and the fourth quarter consolidated accounting periods, while fixed costs are generated constantly. This means that profits in the first quarter and the third quarter consolidated accounting periods are typically lower than those in the other two quarters. Sales for the azbil Group tend to be more concentrated in the fourth quarter consolidated accounting period than in the second quarter. For a similar reason, profits in the first half (combining first & second quarter consolidated accounting periods) tend to be lower than in the second half (combining third & fourth quarter consolidated accounting periods). The projections of azbil Group are based on currently available information and some reasonable assumptions. Due to various factors, actual results may differ from those discussed in this document. Please see “Analysis of financial results” on page 2 of the financial results (appendix) for preconditions underlying these projections and precautions to follow in using these projections.
(How to obtain supplementary information on the settlement of accounts) Supplementary information on the settlement of accounts will be published on the company’s homepage on the same day.

Accompanying Materials Contents
1. Financial Results ···················································································································· 2
(1) Analysis of financial results ······························································································· 2
(2) Analysis of financial position ······························································································· 7
(3) Basic policy regarding profit sharing and the dividends for the current and next accounting period ····· 8
2. Activities (Present situation) of the azbil Group ·············································································· 9
3. Management Policy ············································································································· 12
(1) Basic policy for corporate management ··············································································· 12
(2) Management metrics ······································································································· 12
(3) Medium- to long-term management strategies ····································································· 12
(4) Issues to be tackled ······································································································· 13
4. Consolidated financial statements ···························································································· 17
(1) Consolidated balance sheets ··························································································· 17
(2) Consolidated statements of income and Consolidated statements of comprehensive income ········· 20
(3) Consolidated statements of changes in net assets ································································ 22
(4) Consolidated statements of cash flows ··············································································· 24
(5) Notes to the consolidated financial statements ····································································· 26
(Notes regarding assumptions of continuing operations) ······················································· 26
(Changes in accounting standards) ··················································································· 26
(Segment information) ·································································································· 27
(Per share information) ································································································· 31
(Events after the reporting period) ··················································································· 31
5. Others ······························································································································ 32
(1) Management Changes ···································································································· 32
(2) Other information
Orders received condition ······························································································· 33
- 1 -

1. Financial Results
(1) Analysis of financial results
1) Financial results for the current fiscal year
In the current fiscal year, Japan’s economy has continued a moderate recovery that began at the
start of the period, spurred by the Japanese government’s economic policies and the Bank of
Japan’s monetary easing measures. There has been an improvement in corporate financial
results – especially those of export-related businesses, which have benefitted from the lower
value of the yen – and signs of a pickup in both capital expenditure and consumer spending have
been evident. The general picture overseas has also been promising: despite the slackening of
growth in China and other emerging economies, the US economy has been gradually recovering
and in Europe too there has been an upward momentum. Overall, therefore, there has been a
continued recovery.
As for the business environment of the azbil Group, this continues to be better in some markets
than others, but nonetheless there are clear indications of recovery.
Against this backdrop, aiming to achieve the targets of the medium-term plan, the azbil Group
has adopted the following three initiatives: (1) becoming a long-term partner for both the customer
and the community through offering solutions based on azbil technologies and products; (2)
implementing global initiative aimed at expansion into new regions and a qualitative change of
focus (3) aiming to become a corporate organization that never stops learning so that it can
continuously strengthen its corporate structure. The business plan targets three growth fields:
next-generation solutions, energy management solutions, and safety solutions. For this, progress
is being made, in Japan and overseas, to implement distinctively azbil solutions utilizing our
products, technologies and services. In the current fiscal year, progress has been made not only
with reinforcing the business structure, but also with developing new business fields in Japan and
overseas.
Overall orders received for the current fiscal year were 252,435 million yen, up 9.2% on the
previous fiscal year. This increase follows the launch, as a new solutions initiative, of the Life
Science Engineering (LSE) business Note in the first quarter of the current consolidated accounting
period and the inclusion of the Azbil Telstar and its subsidiaries in the results of the Life
Automation (LA) business. In addition to the resulting sharp growth in orders received for the LA
business, orders were also up for the Building Automation (BA) business and the Advanced
Automation (AA) business. In sales too, all three businesses achieved increases, with the LA
business taking the lead. The overall figure for net sales was 248,416 million yen, up 9.2% on the
previous fiscal year.
Overseas sales increased significantly with the addition to the LA business of new LSE
operations in Europe, Asia and Central and South America. In addition, exchange rates
- 2 -

contributed to robust growth in existing regions and markets, and as a result sales doubled.
Overseas sales now represent 18.6% of the total (current fiscal year), compared to 10.1% in the
previous year.
Profits have been impacted not only by a transient increase in the cost of retirement benefits,
but also by the increased goodwill amortization costs associated with the addition of several new
subsidiaries. Nevertheless, sales were up for each business, and steady progress has been
achieved with improving profitability by reinforcing the business structure. Consequently, there
was an operating income of 13,903 million yen (up 3.7% on previous fiscal year). Ordinary
income was 14,599 million yen (up 0.2% on previous fiscal year) primarily due to foreign
exchange gains; and net income was 7,669 million yen (down 7.7% on previous fiscal year),
reflecting an increase in the amount of income taxes - deferred following a reduction in deferred
tax assets resulting from a revision of the tax system.
Note : As of January 2013, the azbil Group acquired a stake in Telstar, S.A. (located in Spain), which develops, manufactures and markets manufacturing and environmental equipment for pharmaceutical formulation plants, research labs and hospitals. This is now a subsidiary with the new name Azbil Telstar, S.L. In conjunction with this acquisition, the Group launched a LSE business designed to serve markets that contribute to people’s health, providing next-generation solutions inspired by automation technologies that integrate manufacturing equipment with environmental systems.
The results for the individual reportable segments are as follows.
Building Automation (BA) Business
There was a slight decrease in domestic sales, but thanks to an increase in overseas sales,
revenue grew for the BA business as a whole.
On the domestic scene, the service business continued to perform well, thanks to a steadily
growing track record. In addition, there was been increasing investment in energy management
solutions designed to achieve power/energy savings and, thanks to proactive marketing that
draws on our engineering experience and long-term accumulated data, sales were up for projects
involving existing buildings. However, sales for the market for new buildings decreased by trend
of sales in large-scale development projects. Domestically, overall sales declined.
Abroad, sales grew in Singapore, Vietnam and Taiwan as a result of measures focused on
developing local building markets. Also, there was significant sales growth in China resulting from
the first full-year contribution made by a subsidiary involved in construction and engineering that
was acquired part way through the previous fiscal year.
Accordingly, BA business sales for the current fiscal year were 109,566 million yen, up 2.0% on
the previous fiscal year. Profits were adversely affected by a transient increase in the cost of
retirement benefits and the addition of an overseas subsidiary with the associated goodwill
amortization costs. However, profitability increased thanks to on-site cost improvements and
- 3 -

improved job management; additionally, sales grew in the existing building and service fields.
Consequently, segment profit (operating income) was 10,593 million yen, up 4.3% on the
previous fiscal year.
Advanced Automation (AA) Business
As a result of the decline in capital investment among Japan’s manufacturing industries, there
was a fall in domestic sales. However, overseas sales grew, so for the AA business overall there
was an increase in sales.
In Japan, demand has recovered in the market for equipment manufacturers such as industrial
furnace. In addition, business development has progressed, offering new products and solutions
to companies in the food, pharmaceutical and automobile markets. This has led to growth in the
sales of control products to equipment manufacturers. On the other hand, despite investments
and replacement demand being brisk in markets related to the energy field involving LNG and for
plant operational safety, sales were adversely affected by curbs on new capital investment in the
chemical market, particularly related to functional materials, where demand has hitherto been
robust. Consequently, there was a fall in sales of field instruments, control valves and system
products to plants. Domestically, overall sales declined.
In overseas markets, there was growth in sales of control products to equipment manufacturers
in Europe, the US, China and Korea. Also, a North American subsidiary was newly consolidated–
a company that develops and sells flowmeters – and sales of field instruments and control valves
to plants throughout Asia continued to be robust. Overseas revenue thus increased overall.
As a result, AA business sales for the fiscal year were 90,826 million yen, up 3.6% on the
previous fiscal year.
Profits were impacted not only by a transient increase in the cost of retirement benefits, but also
by the increased goodwill amortization costs associated with the new consolidation. However,
thanks to increased sales and efforts to improve the cost rate, segment profit (operating income)
was 3,966 million yen, up 8.8% on the previous fiscal year.
Life Automation (LA) Business
In the gas and water meter field, efforts have been made to develop solutions for energy supply
lines, but sales fell mainly due to the demand cycle of gas meters. As regards water meters,
thanks to efforts aimed at enhancing profitability and proactively developing the market, the
profitability improved.
In the nursing care and health support field, the market is growing as Japan’s population ages;
however, with cutbacks in welfare budgets by local governments, etc., the business environment
continues to be challenging. In response, various measures have been adopted – such as
increasing the number of care centers and offering a new comprehensive service – and as a
- 4 -

result sales have increased.
As regards residential central air-conditioning systems, we continue to strengthen our
development and sales capabilities, adopting an aggressive strategy targeting both house
builders and individual owners. This approach has succeeded in increasing sales.
The Life Science Engineering (LSE) business serves overseas pharmaceutical markets, and
these are doing well. The Azbil Telstar and its subsidiaries that is now included in the consolidated
results supplies a variety of equipment to these markets, and consequently sales have risen
significantly.
As a result, LA business sales for the current fiscal year were 49,597 million yen, up 45.9% on
the previous fiscal year.
As regards profit for the LA business as a whole, however, despite improved profitability in the
gas and water meter field, owing to the cost of reinforcing and expanding the business foundation,
and also the generation of goodwill amortization costs associated with the new consolidation,
there was a segment loss (operating loss) of 671 million yen; for comparison a loss of 399 million
yen was recorded for the previous fiscal year.
Other In the Other business, sales of 66 million yen were recorded for the current fiscal year; in the
previous fiscal year sales were 73 million yen. Segment profit (operating income) was 17 million
yen; in the previous fiscal year there was a segment profit (operating income) of 9 million yen.
2) Forecast for the next period
As shown in the table below, business performance for the next period is forecast as follows: net
sales of 260,000 million yen, an increase of 4.7% on the previous fiscal year; operating income of
15,500 million yen (up 11.5%); ordinary income of 15,000 million yen (up 2.7%); and net income
of 8,500 million yen (up 10.8%).
Guided by the philosophy of “human-centered automation,” the azbil Group is developing its
business based on the three initiatives listed below. Already steady progress is being made with
business reforms in the domestic market, expansion of overseas business, and strengthening the
business structure.
<Three initiatives>
(1) Becoming a long-term partner for both the customer and the community through offering
solutions based on azbil technologies and products
(2) Implementing global initiatives aimed at expansion into new regions and a qualitative
change of focus
- 5 -

(3) Aiming to become a corporate organization that never stops learning so that it can
continuously strengthen its corporate structure
As regards the economic environment in the next period, although there are concerns about a
temporary slowdown in Japan’s economy following the increase in consumption tax – a result of the
government’s economic policies – a gradual recovery is expected. Overseas, the economies of
some Asian countries will remain stagnant, and there is uncertainty regarding the outlook for
China’s economy. However, the upturn seen in Europe and the US is expected to continue, and, as
with Japan, a gradual recovery is forecast.
The year ending March 31, 2015 (FY2014) is the second year in the current 4-year medium-term
plan, and in it we will continue to pursue the three initiatives to realize growth at home and abroad
by implementing business reforms and strengthening the corporate structure, aiming at achieving
our performance forecast.
These projections are based on management's assumptions, intent and expectations in light of
the information currently available to it, and therefore these statements are not guarantees of future
performance. Due to various factors, actual results may differ from those discussed in this
document.
Fiscal year 2013Actual
Fiscal year 2014 Forecast
Difference %
Building
Automation
Sales 1,095 1,140 44 4.0
Operating income 105 111 5 4.8
Advanced
Automation
Sales 908 950 41 4.6
Operating income 39 46 6 16.0
Life
Automation
Sales 495 530 34 6.9
Operating income (6) (2) 4 -
Other Sales 0 1 0 49.4
Operating income 0 0 0 -
Consolidated
Net Sales 2,484 2,600 115 4.7
Operating income 139 155 15 11.5
Ordinary income 145 150 4 2.7
Net income 76 85 8 10.8
- 6 -

(2) Analysis of financial position
Analysis of assets, liabilities, net assets and cash flows
(Assets)
Total assets at the end of the current fiscal year were 253,448 million yen, an increase of 10,029
million yen from the previous fiscal year-end. The increase in current assets was due to (1) the fact
that the last day of the previous period was a national holiday, so accounts receivable-trade was
recorded for the current period, leading to an increase compared to the previous fiscal year of 3,991
million yen in cash and deposits; and (2) inventories rose by 1,691 million yen as a result of growth
in orders. As regards the growth in noncurrent assets, this was primarily due to investment
securities increasing by 1,536 million yen with the rise in the stock market.
(Liabilities)
Total liabilities at the end of the current fiscal year were 108,469 million yen, an increase of 6,247
million yen from the previous fiscal year-end. This was mainly due to an increase of 3,916 million
yen in net defined benefit liability resulting from changes in accounting standards, and also the fact
that purchase liabilities increased by 907 million yen and the provision for bonuses increased by
761 million yen.
(Net assets)
Net assets at the end of the current fiscal year were 144,978 million yen, an increase of 3,781
million yen from the previous fiscal year-end. This was mainly owing to an increase in retained
earnings due to the addition of net income of the current fiscal year.
(Cash flows from operating activities)
Cash and cash equivalents (hereinafter, net cash) provided by operating activities in the current
fiscal year ended March 31, 2014 were 15,835 million yen, an increase of 825 million yen compared
with the previous fiscal year. Net cash provided by operating activities in the current fiscal year was
on the same level with the previous fiscal year.
(Cash flows from investing activities)
Net cash used in investing activities (net increase (decrease)) in the current fiscal year were 10,669
million yen, a decrease of 2,046 million yen compared with the previous fiscal year. Although there
was an increase in net cash resulting from the acquisition of securities, the total sum fell compared
to the previous fiscal year when there were expenditures to acquire shares of subsidiaries.
(Cash flows from financing activities)
Net cash used in financing activities (net increase (decrease)) in the current fiscal year were 6,939
million yen, an increase of 4,453 million yen compared with the previous fiscal year. This was
primarily due to increased expenditure for the repayment of loans, and also that there was a
decrease in net cash from loans payable.
As a result of the above factors, the balance of net cash at the end of the current fiscal year was
- 7 -

55,844 million yen, a decrease of 205 million yen from the previous fiscal year-end.
(3) Basic policy regarding profit sharing and the dividends for the current and next
accounting period
The azbil Group places great importance on the distribution of profits to its shareholders. The
management would like to maintain stable dividends while striving to increase its dividends
payout, taking into account comprehensively its consolidated performance, levels of ROE
(Return On Equity), DOE (Dividends On Equity), as well as retained earnings for strengthening
its business base and developing future businesses.
In consideration of the policies outlined above, it is planned to issue an annual dividend for
FY2013 of 63 yen per share, as previously announced. For FY2014, an annual dividend of 63
yen per share is projected in order to maintain stable shareholders’ return.
As regards the use to which retained earnings will be put, while effectively investing them
in strengthening the business base and business expansion – for example, reinforcing
products and services for business growth and implementing structural reform of global
production and development – as well as in enhancing management, we will also invest in
contingency plans to ensure business continuity following natural disasters, etc., thus aiming
to realize even greater shareholder value.
- 8 -

2. Activities (Present situation) of the azbil Group
The azbil Group consists of our company, 69 subsidiaries and 7 affiliates, and is pursuing
“human-centered automation” that aims to realize safety, comfort and fulfillment and contribute to
global environmental preservation. The Group operates in three core business segments:
Building Automation (BA) business in the building market, Advanced Automation (AA) business
in the industrial market, and Life Automation (LA) business in markets closely related to everyday
life such as lifelines and healthcare. The BA business develops and manufactures a
comprehensive lineup, from building management and security systems to application software,
controllers, valves and sensors, and also provides instrumentation design, sales, engineering,
maintenance, energy-saving solutions, and operation and management of facilities. The Group
also draws on its original environmental control technologies to create comfortable and
productive office and factory spaces and to develop business that contributes to environmental
load reduction. The AA business is focused on solving issues in the materials industry such as oil,
chemical, steel, and pulp and paper, as well as in the processing and assembly industries
including automobiles, electrical and electronic, semiconductors and food, through the provision
of products, solutions, instrumentation, engineering and maintenance to support the optimum
operation of equipment and facilities throughout their lifecycle. The Group develops advanced
measurement and control technologies, aims to create production spaces that are safe and
enhance human capabilities, and conducts business to create new value through collaboration
with customers. The LA business applies measurement, control and metering technologies
cultivated over many years in the building and industrial markets, as well as heartfelt, attentive
service, to lifelines such as gas and water, residential central air-conditioning systems, nursing
care and healthcare support, the pharmaceutical and medical fields and life science research.
The Group conducts business to support active lifestyles.
- 9 -

【Overseas】
As for the above mentioned business contents, our company and other companies are positioned as shown in the following business chart.
Sales Engineering, Sales <Advanced Automation Business/Others > Azbil Trading Co., Ltd.*1,*4 (Sales of control, measurement, testing, safety, environmental equipment, design, Instrumentation; sales, engineering management services)
Azbil TA Co.,Ltd. *1, *5 and 1 unconsolidated subsidiary, *2 (Manufacture and sale of pneumatic equipment and related equipment)
Tem-Tech Lab. *3 (Production, sales and entrusted R&D of various sensors)
<Building Automation Business> Yamatake Environmental Control Technology (Beijing) Co., Ltd. *1 (Instrumentation; sales of control and measurement equipment)
Beijing YTYH Intelli-Technology Co., Ltd. *1 (Instrumentation; sales of control and measurement equipment)
CECEP Building Energy Management Co., Ltd. *3 (sales of control and measurement equipment and provision of energy management
services)
Azbil BioVigilant, Inc. *1 (R&D, manufacture and sales of microbial detection instrument)
<Advanced Automation Business > Azbil Saudi Limited *2 (Production and sales of control valves)
Shanghai Azbil Automation Co., Ltd *1 (Instrumentation; software development; production and sales of control measurement equipment)
Yamatake Automation Products (Shanghai) Co., Ltd. *1 (Sales of control equipment)
Azbil North America, Inc.*1 (Sales of control and measurement equipment)
Azbil VorTek, LLC *1 (R&D,manufacturing,sales of flow instrument)
Azbil Europe NV *1 (Sales of control equipment)
Azbil Brazil Limited *1 (Instrumentation; sales of control and measurement equipment)
Production, Sales <Life Automation Business> Azbil Care & Support Co., Ltd. *1 (Sales of emergency alert response service,nursing care support service and group home operation for the elderly)
Azbil Kimmon Co., Ltd. and 8 consolidated subsidiaries *1 ( R&D, manufacture and sales of gas/water meters and related equipment)
<Building Automation Business / Advanced Automation Business> Azbil Control Solutions (Shanghai) Co., Ltd. *1 Azbil Vietnam Co., Ltd.*1 Azbil Philippines Corporation *1 Azbil Korea Co., Ltd. *1 Azbil Taiwan Co., Ltd. *1 Azbil (Thailand) Co., Ltd. *1 Azbil Malaysia Sdn. Bhd. *1 Azbil Singapore Pte. Ltd. *1 PT. Azbil Berca Indonesia *1 Azbil India Private Limited *1 (Above subsidiaries: Instrumentation; sales of control and measurement equipment) One other *2
<Life Automation Business> Azbil Telstar, S.L. *1,*6 and 23 consolidated subsidiaries, *1 and 3 affiliate companies that are accounted for by the equity method(R&D, manufacturing, sales, installation, maintenance of manufacturing equipment and environmental equipment for pharmaceutical plant, laboratory, hospital )
【Japan】
Production
Azbil Taishin Co., Ltd. *1 (R&D and manufacture of electronic and
precision equipment)
Azbil Kyoto Co., Ltd. *1 (Manufacture of electronic and precision equipment)
【Japan】
Others Azbil Yamatake Friendly Co., Ltd. *2 (Cleaning; safety management; collection and delivery; assembly of control and measurement components)
Azbil SecurityFriday Co.,Ltd. *2 (R&D and sales of software)
【Overseas】
Production Azbil Production (Thailand) Co., Ltd. *2 (Manufacture of electronic and precision equipment)
Azbil Control Instruments (Dalian) Co., Ltd. *1 (Manufacture of electronic and precision equipment) Azbil Hong Kong Limited *1 (Manufacture of control and measurement equipment) Azbil Information Technology Center (Dalian) Co., Ltd. *2 (Software development) Azbil Kimmon Technology Corporation *1 One other *2 Two others *3
Others Azbil North America Research and Development, Inc. *2 (R&D and entrusted services of technological research)
【Japan】
【Overseas】
Customers in Japan, overseas
R&D・Manufacturing・Sales・Installation・Maintenance
Azbil Corporation
- 10 -

*1 Consolidated subsidiary
*2 Unconsolidated companies that are not accounted for by the equity method.
*3 Affiliate companies that are not accounted for by the equity method
*4 On April 1, 2013, Azbil RoyalControls Co., Ltd. merged with Azbil Trading Co., Ltd. and changed its name
to Azbil Trading Co., Ltd.
*5 On April 1, 2013, TACO Co., Ltd, changed its name to Azbil TA Co., Ltd.
*6 On June 17, 2013, Telstar, S.A. changed its name to Azbil Telstar, S.L.
- 11 -

3. Management Policy
(1) Basic policy for corporate management
The philosophy of the azbil Group is to realize safety, comfort and fulfillment in people’s lives and
to contribute to global environmental preservation through “human-centered automation.” The
azbil Group seeks to thrive and grow as a unique corporate consortium through implementing
this philosophy. Drawing on considerable technologies and resources – principally for
measurement and control – that have been built up over many years, and using them to create
high-quality products and services that offer customers safety, peace of mind and high added
value, the azbil Group delivers unique solutions for the issues faced by its customers.
Guided by the Group philosophy of “human-centered automation,” we adopt a medium- to
long-term perspective to managing integrated Group operations in our three business segments:
Building Automation (BA), Advanced Automation (AA), and Life Automation (LA). In striving to
enhance and maximize enterprise value, we not only satisfy the expectations of all our
stakeholders – shareholders, customers, employees and local communities – but we can also
play a leading role in realizing a sustainable society.
(2) Management metrics
The azbil Group places great importance on its shareholders, and therefore a basic objective is
to enhance consolidated ROE in order to increase shareholder value. By enhancing profitability
and capital efficiency, we aim to achieve a consolidated ROE of at least 10% in the medium to
long term.
A new 4-year medium-term plan was drawn up in FY2013, aiming to achieve this goal by the
year ending March 31, 2017 (FY2016). In order to respond effectively to changes in the business
environment and realize sustainable yet accelerated growth, we will make use of the synergies of
the whole Group to invigorate and achieve global growth for our businesses founded on
technologies, products and services. In this way, we aim to achieve operating income of 22,000
million yen and sales of 280,000 million yen, and to increase overseas sales to over 20% of the
total.
(3) Medium- to long-term management strategies
While focusing on automation, we have avoided an overconcentration on single markets, and
instead we have created a diverse business portfolio; this is made up of the three businesses
(BA, AA, LA), each of which is aligned to a different market structure. And we have been striving
to expand our business domain by winning new customers and generating synergies within the
Group. Nevertheless, in these business fields there are some markets that are mature, making it
hard to achieve sustainable growth by offering existing products and services, but then there are
other markets that are growing at a rapid pace. Henceforth, we will continue to firmly establish
- 12 -

the foundation for attaining the Group’s mission and ensuring our future as an enterprise. At the
same time, in order to realize further growth, we will strive to enhance our capabilities for
providing solutions in the form of “products and collaboration with customers at their site,” from
the perspective of business creation. And as a long-term partner for both the customer and the
community worldwide, we will demonstrate that we can offer unique value that is only available
from the azbil Group.
The year ended March 31, 2014 (FY2013) was the first year in the new medium-term plan. In
addition to generating new business opportunities that are finely tuned to energy-saving and
environment-related trends, to bolster the management foundation so that it will be less
susceptible to changes in the business environment, this plan targets the following three growth
areas: energy management solutions, next-generation solutions for production and working/living
spaces, and safety solutions. As well as being vital for our customers’ own operations, these are
areas in which we can offer unique value that is only available from the azbil Group. By
implementing measures to realize this plan and by strengthening the business structure, we have
increased sales and profits. From the year ending March 31, 2015 (FY2014), the second year of
the plan, we will focus increasingly on these three growth areas. In this way, as a world-class,
comprehensive automation manufacturer, we will aim to achieve sustainable development – both
for our enterprise and for society – and we will realize CSR management that respects mankind
and actively contributes to society, the environment and the economy.
(4) Issues to be tackled
To secure medium- to long-term business growth, the azbil Group is keen to meet the
expectations of its shareholders and other stakeholders by striving to continually enhance
enterprise value. For this reason, we have set long-term targets for the azbil Group, and we have
been working steadily towards achieving those targets. Through the pursuit of “human-centered
automation,” we have been emphasizing the three initiatives: (1) aiming to become a long-term
partner for both the customer and community through offering solutions based on the
technologies and products of our three business fields (BA business, AA business, LA business);
(2) implementing global initiatives aimed at expansion into new regions and a qualitative change
of focus; and in realizing those initiatives, (3) transforming the azbil Group into a learning
corporate organization. We have also been implementing business structural reforms that can
lead to business expansion. In future, emphasizing the priorities listed below, and distributing
management resources boldly and effectively, we will endeavor to achieve sustainable growth by
accelerating these reform activities and seeing that they are continued over the long term.
1. Our core BA and AA businesses are serving mature industries; however, by recombining
business from the viewpoint of the three key elements – customers, value and
- 13 -

products/technologies – in different ways, future growth is possible. With each segment
pursuing the concept of “human-centered automation,” we will go beyond the conventional
business boundaries by developing comprehensive strengths – everything from development
and production to sales, installation, maintenance and service. These are uniquely azbil in
nature and unavailable from other companies. In this way, we will strive to develop new
business models and new business fields which azbil has not yet addressed. For example, the
name ENEOPT has now been adopted to cover all of those products and services related to
energy management solutions offered by the azbil Group, thus making it clear that the Group
companies are working together to actively develop energy management solutions for buildings,
plants and factories. In addition to offering planned services that are tailored to the lifecycle of
the facilities in a customer’s business and/or manufacturing plant, we provide operational
support services, access control for a facility, and even perimeter controls to prevent physical
trespass. Unauthorized access can also come in the form of a cyber-attack, and for this and
other contingencies, such as natural disasters and accidents, we offer a variety of
business-continuity solutions based on many years of accumulated know-how and
achievements. We are actively developing these high value-added services, unique to the azbil
Group, harnessing group-wide coordination that transcends the conventional BA/AA business
framework.
2. Our LA business offers heartfelt, hands-on service with warmth and compassion – as well as
measurement and control technologies developed over many years. It operates in the fields
which have a different business cycle to that of the BA and AA businesses. Its activities cover
the supply of gas and water meters, residential central air-conditioning systems, and nursing
care and healthcare support, the pharmaceutical and medical fields, life science research and
other segments. In many ways, the LA business helps people to lead active, fulfilling lives.
Examples include the strengthening of Kikubari™ products in the field of residential central
air-conditioning systems; the provision by Azbil Care & Support of nursing care and emergency
alert/response services in assisted living facilities for the elderly; and the launch of scheduled
visits and on-demand services. Also, we have begun development of the Life Science
Engineering business targeting pharmaceutical markets worldwide, an initiative in which Azbil
Telstar is playing a key role.
3. In overseas markets that have potential for future growth, as one example of strengthening the
business base, we are focusing on training global human resources that are needed for future
business development; this initiative will be implemented worldwide. Specifically, we will pursue
business expansion in fast-growing emerging economies, including the Chinese and other
Asian markets in which the azbil Group is already engaged. We will also qualitatively enhance
business operations, ensuring they are attuned to the specific characteristics of the local
- 14 -

business environment. In the case of Azbil Saudi Limited, the construction of the valve
manufacturing plant currently underway is one initiative aimed at further global expansion: as
well as providing customers with meticulous maintenance and repair services for
facilities/equipment already in use in the region, this is intended to facilitate future sales
activities targeting new customers.
4. As regards environmental protection and reducing CO2 emissions, the azbil Group is striving to
reduce environmental load resulting from its own corporate activities. At the same time, making
maximum use of our measurement and control technologies, we will contribute to solving
environmental and energy issues faced by our customers and society as a whole. We are thus
working to expand our business in fields where stricter regulations mean that we can reliably
predict future growth in demand domestically and internationally. Examples of this include the
installation by Azbil (Thailand) Co., Ltd. of a BEMS Note 1 in a large-scale mixed-use building,
marking the start of its ESCO business Note 2; organizing energy-saving seminars in Japan and
abroad; taking part in environment-related trade shows and conferences; and making available
our own domestic carbon credits to offset the CO2 emissions resulting from the Shonan
International Marathon, an event cosponsored by the azbil Group.
Note1 : BEMS (Building and Energy Management System)
A system for minimizing energy consumption for entire buildings – offices, factories and
DHC facilities – through automation and visualization of energy management (monitoring
and control).
Note2 : ESCO (Energy Service COmpany) business
A business in which the provider is responsible not only for a comprehensive
energy-saving service but also for guaranteeing energy savings in the customer’s factory
or office building.
5. In order to enhance our product development competences, while restructuring the group-wide
R&D organization and building up resources, we are reinforcing and upgrading our
development system worldwide, prioritizing the development of products that are perfectly
matched to customer needs, and working to reduce time-to-market. Looking to satisfy the
demands of customers operating in markets worldwide, and in order to develop future
technologies from a global perspective on technical innovation and market reform, we have
established a local R&D subsidiary in North America: Azbil North America Research &
Development, Inc. Moreover, in the area of production, we are making further improvements to
realize a more flexible, optimum production system that can cope with global market needs,
- 15 -

changes in the business environment and other business risks. Azbil Production (Thailand) Co.,
Ltd., a local manufacturing subsidiary in Thailand that began operating in the summer of 2013,
demonstrates how we are restructuring our production system in Japan and abroad to meet this
objective. Another example can be seen in Dalian, China, where we have started production of
gas flowmeters and electromagnetic flowmeters for the Chinese market.
6. The promotion of CSR management has been set out as a goal in the medium-term plan, and
the entire Group – including overseas subsidiaries as well as domestic companies – is actively
engaged in matters that prioritize our contribution to society: compliance (corporate ethics and
legal compliance); risk management (quality, PL, disaster prevention, BCP and information
security); management that emphasizes people; contributing to the environment; and Group
administration. In the current fiscal year, we have made a special effort to raise the standard of
internal controls, including a system designed to ensure reliable financial reporting in the
subsidiaries that have recently joined the Group. Moreover, we have further expanded our own
social action program; this includes co-sponsoring international eco-friendly marathons and
expanding the azbil Honey Bee Club program to encourage voluntary participation in social
contribution activities by azbil Group employees. At the same time, in order to contribute to the
global environment and society through our core businesses, we are actively promoting
business activities that will help realize a reduction in CO2 emissions using azbil Group
technologies.
- 16 -

4. Consolidated financial statements
(1) Consolidated balance sheets
(Millions of yen)
As of March 31, 2013
As of March 31, 2014
Assets Current assets
Cash and deposits 48,411 52,402Notes and accounts receivable - trade 88,874 88,227Securities 13,251 14,937Merchandise and finished goods 4,186 4,236Work in process 5,263 5,958Raw materials 7,053 7,998Deferred tax assets 5,530 5,403Other 9,505 10,706Allowance for doubtful accounts 362) 494)
Total current assets 181,714 189,377
Non-current assets Property, plant and equipment
Buildings and structures 39,350 40,831Accumulated depreciation 26,216) 27,879)
Buildings and structures, net 13,133 12,951
Machinery, equipment and vehicles 18,578 19,712Accumulated depreciation 16,188) 17,187)
Machinery, equipment and vehicles, net 2,389 2,525
Tools, furniture and fixtures 21,141 20,226Accumulated depreciation 18,997) 18,123)
Tools, furniture and fixtures, net 2,144 2,102
Land 6,699 6,623Leased assets 397 293
Accumulated depreciation 275) 164)
Leased assets, net 121 129
Construction in progress 187 167
Total property, plant and equipment 24,677 24,501
Intangible assets Right of using facilities 144 144Software 740 787Goodwill 9,662 8,083Other 2,078 3,934
Total intangible assets 12,625 12,950
- 17 -
(Millions of yen)
As of March 31, 2013
As of March 31, 2014
Investments and other assets Investment securities 15,304 16,841Long-term loans receivable 288 125Claims provable in bankruptcy, claims provable in rehabilitation and other
68 84
Deferred tax assets 1,801 2,101Other 7,377 7,841Allowance for doubtful accounts 438) 375)
Total investments and other assets 24,401 26,618
Total non-current assets 61,704 64,070
Total assets 243,418 253,448
Liabilities Current liabilities
Notes and accounts payable - trade 40,548 41,456Short-term loans payable 13,308 15,380Current portion of bonds 80 50Income taxes payable 5,625 6,247Advances received 3,094 2,842Provision for bonuses 7,838 8,600Provision for directors' bonuses 96 109Provision for product warranties 583 567Provision for loss on order received 443 370Other 11,209 11,732
Total current liabilities 82,828 87,356
Non-current liabilities Bonds payable 90 40Long-term loans payable 4,441 2,215Deferred tax liabilities 736 815Deferred tax liabilities for land revaluation 210 210Provision for retirement benefits 12,719 -
Net defined benefit liability - 16,636Provision for directors' retirement benefits 105 111Other 1,089 1,083
Total non-current liabilities 19,393 21,112
Total liabilities 102,221 108,469
- 18 -

(Millions of yen)
As of March 31, 2013
As of March 31, 2014
Net assets Shareholders' equity
Capital stock 10,522 10,522Capital surplus 17,197 17,197Retained earnings 111,141 114,275Treasury shares 2,644) 2,646)
Total shareholders' equity 136,217 139,349
Accumulated other comprehensive income Valuation difference on available-for-sale securities 3,776 4,978Deferred gains or losses on hedges 0 0Foreign currency translation adjustment 952) 824Remeasurements of defined benefit plans - 1,836)
Total accumulated other comprehensive income 2,824 3,966
Subscription rights to shares 2 2Minority interests 2,152 1,660
Total net assets 141,197 144,978
Total liabilities and net assets 243,418 253,448
- 19 -

(2) Consolidated statements of income and Consolidated statements of comprehensive income
(Consolidated statements of income )
(Millions of yen)
Fiscal year 2012 (April 1, 2012 to
March 31, 2013)
Fiscal year 2013 (April 1, 2013 to
March 31, 2014)
Net sales 227,584 248,416Cost of sales 149,712 161,866
Gross profit 77,871 86,549
Selling, general and administrative expenses 64,461 72,645
Operating income 13,410 13,903
Non-operating income Interest income 128 170Dividend income 285 299Foreign exchange gains 954 517Real estate rent 54 51Subsidy income 100 85Reversal of allowance for doubtful accounts - 4Other 200 184
Total non-operating income 1,723 1,314
Non-operating expenses Interest expenses 108 393Commitment fee 24 21Rent expenses on real estates 78 62Office transfer expenses 40 34Share of loss of entities accounted for using equity method - 6Provision of allowance for doubtful accounts 255 -
Other 58 99
Total non-operating expenses 565 617
Ordinary income 14,569 14,599
Extraordinary income Gain on sales of non-current assets 636 9Compensation income - 506Gain on sales of investment securities 0 43
Total extraordinary income 636 559
Extraordinary losses Loss on sales and retirement of non-current assets 49 63Impairment loss 94 35Restructuring loss - 358Lump-sum withdrawal from employees' pension funds 800 -
Environmental expenses 159 -
Loss on valuation of investment securities 10 133Loss on sales of investment securities 0 19
Total extraordinary losses 1,113 609
Income before income taxes and minority interests 14,092 14,549
Income taxes - current 5,616 6,663Income taxes - deferred 58) 237
Total income taxes 5,557 6,900
Income before minority interests 8,534 7,648
Minority interests in income (loss) 225 21)
Net income 8,308 7,669
- 20 -
(Consolidated statements of comprehensive income)
(Millions of yen)
Fiscal year 2012 (April 1, 2012 to
March 31, 2013)
Fiscal year 2013 (April 1, 2013 to
March 31, 2014)
Income before minority interests 8,534 7,648Other comprehensive income
Valuation difference on available-for-sale securities 1,324 1,202Deferred gains or losses on hedges 1 0Foreign currency translation adjustment 680 2,041
Total other comprehensive income 2,006 3,244
Comprehensive income 10,540 10,892
Comprehensive income attributable to Comprehensive income attributable to owners of parent
10,184 10,648
Comprehensive income attributable to minority interests
356 243
- 21 -
(3) Consolidated statements of changes in net assets
Fiscal year 2012 (April 1, 2012 to March 31, 2013)
(Millions of yen)
Shareholders' equity
Capital stock Capital surplus Retained earnings Treasury shares Total shareholders' equity
Balance at beginning of current period 10,522 17,197 107,538 (2,643) 132,615
Changes of items during period
Dividends of surplus (4,652) (4,652)
Net income 8,308 8,308
Change of scope of consolidation (53) (53)
Purchase of treasury shares (1) (1)
Disposal of treasury shares (0) 0 0
Transfer to capital surplus from retained earnings 0 (0) -
Net changes of items other than shareholders' equity
Total changes of items during period - - 3,603 (1) 3,601
Balance at end of current period 10,522 17,197 111,141 (2,644) 136,217
Accumulated other comprehensive income Subscription rights to shares
Minority interests
Total net assets
Valuation difference on available-for-sale securities
Deferred gains or losses on hedges
Foreign currency translation adjustment
Remeasurements of defined benefit plans
Total accumulated other comprehensive income
Balance at beginning of current period 2,451 (0) (1,501) - 948 2 1,509 135,076
Changes of items during period
Dividends of surplus (4,652)
Net income 8,308
Change of scope of consolidation (53)
Purchase of treasury shares (1)
Disposal of treasury shares 0
Transfer to capital surplus from retained earnings -
Net changes of items other than shareholders' equity
1,324 1 549 - 1,875 0 643 2,518
Total changes of items during period 1,324 1 549 - 1,875 0 643 6,120
Balance at end of current period 3,776 0 (952) - 2,824 2 2,152 141,197
- 22 -

Fiscal year 2013 (April 1, 2013 to March 31, 2014) (Millions of yen)
Shareholders' equity
Capital stock Capital surplus Retained earnings Treasury shares Total shareholders' equity
Balance at beginning of current period 10,522 17,197 111,141 (2,644) 136,217
Changes of items during period
Dividends of surplus (4,652) (4,652)
Net income 7,669 7,669
Change of scope of consolidation 117 117
Purchase of treasury shares (2) (2)
Disposal of treasury shares (0) 0 0
Transfer to capital surplus from retained earnings 0 (0) -
Net changes of items other than shareholders' equity
Total changes of items during period - - 3,133 (2) 3,131
Balance at end of current period 10,522 17,197 114,275 (2,646) 139,349
Accumulated other comprehensive income Subscription rights to shares
Minority interests
Total net assets
Valuation difference on available-for-sale securities
Deferred gains or losses on hedges
Foreign currency translation adjustment
Remeasurements of defined benefit plans
Total accumulated other comprehensive income
Balance at beginning of current period 3,776 0 (952) - 2,824 2 2,152 141,197
Changes of items during period
Dividends of surplus (4,652)
Net income 7,669
Change of scope of consolidation 117
Purchase of treasury shares (2)
Disposal of treasury shares 0
Transfer to capital surplus from retained earnings -
Net changes of items other than shareholders' equity
1,202 0 1,776 (1,836) 1,142 - (492) 649
Total changes of items during period 1,202 0 1,776 (1,836) 1,142 - (492) 3,781
Balance at end of current period 4,978 0 824 (1,836) 3,966 2 1,660 144,978
- 23 -

(4) Consolidated statements of cash flows
(Millions of yen)
Fiscal year 2012 (April 1, 2012 to
March 31, 2013)
Fiscal year 2013 (April 1, 2013 to
March 31, 2014)
Cash flows from operating activities Income before income taxes and minority interests 14,092 14,549Depreciation and amortization 3,620 3,722Amortization of goodwill 1,359 1,871Increase (decrease) in allowance for doubtful accounts (98) 188Increase (decrease) in provision for retirement benefits 53) -
Increase(decrease)in net defined benefit liability - 1,312Increase (decrease) in provision for bonuses 324) 732Increase (decrease) in provision for directors' bonuses (26) 13Interest and dividend income 414) (470)Interest expenses 108 393Foreign exchange losses (gains) 763) 596)Loss (gain) on sales and retirement of property, plant and equipment
403) 53
Loss (gain) on sales and valuation of investment securities
9 109
Impairment loss 94 35Loss on business restructuring - 358Lump-sum withdrawal from employees' pension funds 800 -
Environmental expenses 159 -
Compensation income - (506)Decrease (increase) in notes and accounts receivable - trade
2,596 2,630
Decrease (increase) in inventories 1,981 (846)Increase (decrease) in notes and accounts payable - trade
1,039) 340)
Decrease (increase) in other assets 851) 1,090)Increase (decrease) in other liabilities 157) 765)
Subtotal 20,690 21,355
Interest and dividend income received 415 468Interest expenses paid 101) 390)Payments for Lump-sum withdrawal from employees' pension funds
800) -
Payments for loss on disaster 48) -
Proceeds from compensation 268 506Payments for business restructuring - 158)Income taxes paid 5,413) 5,946)
Net cash provided by (used in) operating activities 15,010 15,835
- 24 -

(Millions of yen)
Fiscal year 2012 (April 1, 2012 to
March 31, 2013)
Fiscal year 2013 (April 1, 2013 to
March 31, 2014)
Cash flows from investing activities Payments into time deposits 3,570) (2,856)Proceeds from withdrawal of time deposits 3,722 4,198Purchase of securities (3,000) 16,700)Proceeds from sales of securities 31 9,845Purchase of trust beneficiary right 13,402) (13,301)Proceeds from sales of trust beneficiary right 13,889 12,998Purchase of property, plant and equipment 2,512) 2,650)Proceeds from sales of property, plant and equipment 589 253Purchase of intangible assets 782) 2,091)Proceeds from sales of intangible assets 329 18Purchase of investment securities 34) (26)Proceeds from sales of investment securities 3 249Purchase of shares of subsidiaries resulting in change in scope of consolidation
7,574) -
Payments for investments in capital of subsidiaries and associates
205) -
Purchase of shares of subsidiaries and associates 456) 40)Other, net 256 566)
Net cash provided by (used in) investing activities (12,716) (10,669)
Cash flows from financing activities Increase in short-term loans payable 5,747 4,307Decrease in short-term loans payable (1,851) (3,518)Proceeds from long-term loans payable 140 87Repayments of long-term loans payable 1,582) (2,421)Redemption of bonds (45) (80)Cash dividends paid 4,649) 4,651)Repayments of lease obligations 83) (64)Cash dividends paid to minority shareholders 160) 596)Purchase of treasury shares 1) 2)Proceeds from sales of treasury shares 0 0
Net cash provided by (used in) financing activities 2,486) 6,939)
Effect of exchange rate change on cash and cash equivalents
837 1,532
Net increase (decrease) in cash and cash equivalents 644 (241)
Cash and cash equivalents at beginning of period 55,355 56,050Increase in cash and cash equivalents from newly consolidated subsidiary
49 36
Cash and cash equivalents at end of period 56,050 55,844
- 25 -

(5) Notes to the consolidated financial statements:
(Notes regarding assumptions of continuing operations)
Non applicable
(Changes in accounting standards)
(Application of Accounting Standard for Retirement Benefits)
“The Accounting Standard for Retirement Benefits” (ASBJ statement No.26, May 17, 2012, hereafter
referred to as “the Retirement Benefits Accounting Standard”) and “the Application Guidance on the
Accounting Standard for Retirement Benefits” (ASBJ Guidance No.25, May 17, 2012, hereafter
referred to as “the Retirement Benefits Application Guidance”) were adopted at the end of the current
fiscal year (with the exception of the provisions found in the body of paragraph 35 of the Retirement
Benefits Accounting Standard and in the body of paragraph 67 of the Retirement Benefits Application
Guidance). As a result of this change, net defined benefit liability are calculated by deducting pension
assets from the retirement benefit obligation ; the unrecognized actuarial loss and unrecognized prior
service cost are recorded under these net defined benefit liability.
Regarding the application of the Retirement Benefits Accounting Standard, in accordance with the
method for handling the transition stipulated in paragraph 37 of the Retirement Benefits Accounting
Standard, at the end of the current fiscal year the difference resulting from the said accounting
changes has been subtracted from the remeasurements of defined benefit plans within accumulated
other comprehensive income.
As a result, net defined benefit liability of 2,601 million yen have been recorded for the current fiscal
year, while accumulated other comprehensive income has fallen by 1,836 million yen. At the same
time net assets per share have decreased by 24.87 yen.
- 26 -
(Segment information)
1. The summary of the reportable segments
The reportable segments of the azbil Group – identifiable operating segments of the Group’s business
structure for which financial information is made separately available – are subject to periodic review by
the Board of Directors in order to make decisions on the distribution of management resources and to
assess performance.
The azbil Group identifies its operating segments using such criteria as business organization,
product lines, service content, and markets. This approach results in three separate reportable
segments: the Building Automation business, the Advanced Automation business, and the Life
Automation business.
The Building Automation business supplies commercial buildings and production facilities with
automatic HVAC control and security systems, including products, engineering and related services.
The Advanced Automation business supplies automation control systems, switches and sensors,
engineering and maintenance services to industrial plants and factories. The Life Automation business
supplies lifeline meters and manufacture and sale of manufacturing equipment and environmental
equipment for pharmaceutical plants, laboratories, and hospitals as well as products and services
related to nursing care/health support and emergency alert response services – all of which are
intimately connected with the daily lives of the general public.
2. Information on sales, profit(loss), assets, liabilities and the other items every segment
Fiscal year 2012 (April 1, 2012 to March 31, 2013) (Millions of yen)
Reportable segment
Other *1 Total
Adjust- ment
*2
Consoli-dated
*3 Building Automation
Advanced Automation
Life Automation Subtotal
Sales
Customers 107,137 86,534 33,850 227,522 62 227,584 - 227,584
Inter-segment 288 1,142 143 1,574 11 1,586 (1,586) -
Total 107,426 87,676 33,994 229,097 73 229,171 (1,586) 227,584
Segment Profit(loss) 10,152 3,646 (399) 13,399 9 13,409 1 13,410
Segment Assets 62,894 65,359 39,808 168,062 10 168,073 75,345 243,418
Other items
Depreciation and Amortization
1,027 1,845 746 3,619 0 3,620 - 3,620
Increase in Property, plant and equipment, and Intangible assets
899 1,587 631 3,119 0 3,120 - 3,120
Note *1.“Other” includes insurance agent business. *2. Details on adjustments are as follows.
(1) The adjustment of "segment profit(loss) 1 million yen" is elimination of inter-segment transactions.
- 27 -

(2) The main contents of the adjustment of "segment assets 75,345 million yen" are cash and deposits, investment securities and so on which are not distributed to every reportable segment.
*3. The segment profit is adjusted to operating income stated in the consolidated financial statements.
Fiscal year 2013 (April 1, 2013 to March 31, 2014) (Millions of yen)
Reportable segment
Other *1 Total
Adjust- ment *2
Consoli-dated *3 Building
Automation Advanced
AutomationLife
AutomationSubtotal
Sales
Customers 109,284 89,637 49,434 248,356 60 248,416 - 248,416
Inter-segment 282 1,188 163 1,634 6 1,640 (1,640) -
Total 109,566 90,826 49,597 249,990 66 250,057 (1,640) 248,416
Segment Profit(loss) 10,593 3,966 (671) 13,887 17 13,904 (1) 13,903
Segment Assets 62,299 66,716 40,558 169,574 15 169,589 83,858 253,448
Other items
Depreciation and Amortization
989 1,642 1,090 3,722 0 3,722 - 3,722
Increase in Property, plant and equipment, and Intangible assets
1,819 2,666 815 5,302 0 5,302 - 5,302
Note *1.“Other” includes insurance agent business. *2. Details on adjustments are as follows.
(1) The adjustment of "segment profit(loss) (1) million yen" is elimination of inter-segment transactions. (2) The main contents of the adjustment of "segment assets 83,858 million yen" are cash and deposits, investment securities and so on which are not distributed to every reportable segment.
*3. The segment profit is adjusted to operating income stated in the consolidated financial statements.
- 28 -

[Related Information]
Fiscal year 2012 (April 1, 2012 to March 31, 2013)
1. Information by product and service
The information disclosed is identical to the segment information. It is therefore omitted.
2. Information by region
(1) Sales (Millions of yen)
Japan Asia China North America Europe Others Total
204,628 11,115 8,639 1,589 895 715 227,584
(Note) Sales, based on the location of customers, are classified by country or region.
(2) Property, plant and equipment
The value of domestic property, plant and equipment exceed 90% of the value of the property, plant
and equipment on the consolidated balance sheets, so this information is omitted.
3. Information by principal client
No clients accounted for more than 10% of net sales on the consolidated statements of income, so this
information is omitted.
Fiscal year 2013 (April 1, 2013 to March 31, 2014)
1. Information by product and service
The information disclosed is identical to the segment information. It is therefore omitted.
2. Information by region
(1) Sales (Millions of yen)
Japan Asia China North America Europe Others Total
202,281 16,066 11,292 3,444 11,572 3,758 248,416
(Note) Sales, based on the location of customers, are classified by country or region.
(2) Property, plant and equipment
The value of domestic property, plant and equipment exceed 90% of the value of the property, plant
and equipment on the consolidated balance sheets, so this information is omitted.
3. Information by principal client
No clients accounted for more than 10% of net sales on the consolidated statements of income, so this
information is omitted.
- 29 -

[Information on impairment loss in noncurrent assets by reportable segment]
Fiscal year 2012 (April 1, 2012 to March 31, 2013) (Millions of yen)
Reportable segment
Other Corporate/ Elimination Total
Building Automation
Advanced Automation
Life Automation
Subtotal
Impairment loss - - 94 94 - - 94
Fiscal year 2013 (April 1, 2013 to March 31, 2014) (Millions of yen)
Reportable segment
Other Corporate/ Elimination Total
Building Automation
Advanced Automation
Life Automation Subtotal
Impairment loss - - 35 35 - - 35
[Information on amortization of goodwill and unamortized balance by reportable segment]
Fiscal year 2012 (April 1, 2012 to March 31, 2013) (Millions of yen)
Reportable segment
Other Corporate/ Elimination
Total Building
Automation Advanced Automation
Life Automation Subtotal
Amortization of goodwill 79 16 1,264 1,359 - - 1,359
Balance at endof period
712 1,371 7,578 9,662 - - 9,662
Fiscal year 2013 (April 1, 2013 to March 31, 2014) (Millions of yen)
Reportable segment
Other Corporate/ Elimination
Total Building
Automation Advanced Automation
Life Automation Subtotal
Amortization of goodwill 158 314 1,399 1,871 - - 1,871
Balance at endof period
554 1303 6,225 8,083 - - 8,083
[Information on profits resulting from negative goodwill by reportable segment]
Fiscal year 2012 (April 1, 2012 to March 31, 2013)
Non applicable
Fiscal year 2013 (April 1, 2013 to March 31, 2014)
Non applicable
- 30 -

(Per share information)
Fiscal year 2012 (April 1,2012 to March 31, 2013)
Fiscal year 2013 (April 1,2013 to March 31,2014)
Net assets per share(Yen) 1,882.66
Net income per share(Yen) 112.50
Net assets per share(Yen) 1,940.56
Net income per share(Yen) 103.85
Note 1. Net income per share after adjusting for latent shares is not presented. Although latent shares exist, they
have not been stated in the absence of any dilution effects.
2. The basis for calculating net income per share is as follows.
Item Fiscal year 2012 (April 1,2012 to March 31, 2013)
Fiscal year 2013 (April 1,2013 to March 31,2014)
Net income (Millions of yen) 8,308 7,669
Amount not attributable to common stock holders(Millions of yen) - -
Net income relevant to common stock (Millions of yen) 8,308 7,669
Average number of shares (Thousands of shares) 73,854 73,853
3. The basis for calculating net assets per share is as follows.
Item As of March 31,2013 As of March 31,2014
Total of net assets (Millions of yen) 141,197 144,978
Amount deducted from the total of net assets(Millions of yen)
2,155 1,662
(of which subscription rights to shares (Millions of yen)) (2) (2)
(of which minority interests (Millions of yen)) (2,152) (1,660)
Net assets at the end of the consolidated fiscalyear relevant to common stock (Millions of yen)
139,041 143,316
Number of shares of common stock used to determinetotal net assets per share (Thousands of shares) 73,853 73,852
(Events after the reporting period)
Non applicable
- 31 -
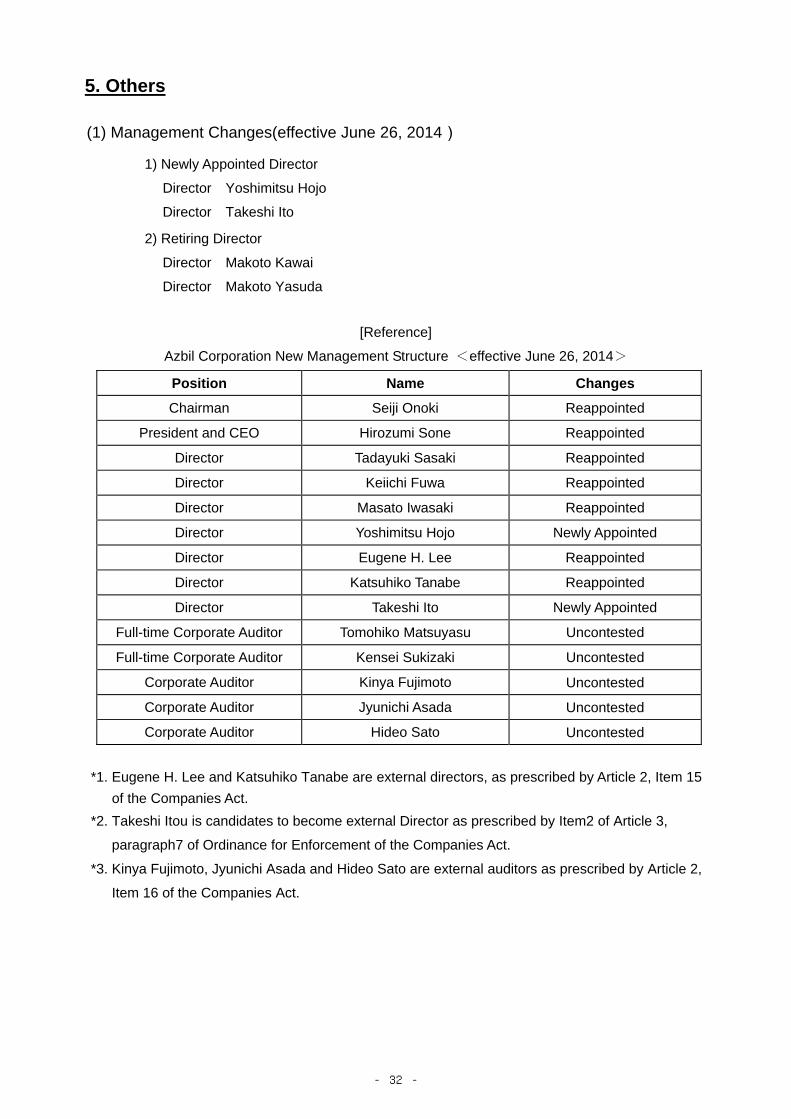
5. Others
(1) Management Changes(effective June 26, 2014)
1) Newly Appointed Director
Director Yoshimitsu Hojo
Director Takeshi Ito
2) Retiring Director
Director Makoto Kawai
Director Makoto Yasuda
[Reference]
Azbil Corporation New Management Structure <effective June 26, 2014>
Position Name Changes
Chairman Seiji Onoki Reappointed
President and CEO Hirozumi Sone Reappointed
Director Tadayuki Sasaki Reappointed
Director Keiichi Fuwa Reappointed
Director Masato Iwasaki Reappointed
Director Yoshimitsu Hojo Newly Appointed
Director Eugene H. Lee Reappointed
Director Katsuhiko Tanabe Reappointed
Director Takeshi Ito Newly Appointed
Full-time Corporate Auditor Tomohiko Matsuyasu Uncontested
Full-time Corporate Auditor Kensei Sukizaki Uncontested
Corporate Auditor Kinya Fujimoto Uncontested
Corporate Auditor Jyunichi Asada Uncontested
Corporate Auditor Hideo Sato Uncontested
*1. Eugene H. Lee and Katsuhiko Tanabe are external directors, as prescribed by Article 2, Item 15
of the Companies Act.
*2. Takeshi Itou is candidates to become external Director as prescribed by Item2 of Article 3,
paragraph7 of Ordinance for Enforcement of the Companies Act.
*3. Kinya Fujimoto, Jyunichi Asada and Hideo Sato are external auditors as prescribed by Article 2,
Item 16 of the Companies Act.
- 32 -

(2) Other information Orders received condition
(Millions of yen)
Reportable
segment
Fiscal year 2012
(April 1,2012 to
March 31,2013)
Fiscal year 2013
(April 1,2013 to
March 31,2014)
Change
Orders
received Backlog
Orders
received Backlog
Orders
Received Backlog
Building
Automation 105,726 39,610 108,432 38,476 2,705 (1,134)
Advanced
Automation 86,663 20,980 93,105 23,259 6,441 2,278
Life
Automation 40,118 7,873 52,628 10,904 12,510 3,031
Total of reportable
segment 232,508 68,464 254,165 72,640 21,657 4,175
Other 72 0 66 0 (5) (0)
Elimination (1,437) (188) (1,797) (345) (359) (156)
Consolidated 231,143 68,276 252,435 72,295 21,291 4,018
- 33 -


![Announces Q3 Results (Standalone & Consolidated), Limited Review Report (Standalone & Consolidated) & Results Press Release for the Quarter ended December 31, 2015 [Result]](https://img.pdfslide.net/doc/110x75/577c98931a28ab163a8b6d49/announces-q3-results-standalone-consolidated-limited-review-report-standalone.jpg)


![FY2015 Full-Year Consolidated Financial Results [Japan GAAP] (April 1, 2015 through March 31, 2016) · FY2015 Full-Year Consolidated Financial Results [Japan GAAP] (April 1, 2015](https://img.pdfslide.net/doc/110x75/5fcc42730482603d5603dd4a/fy2015-full-year-consolidated-financial-results-japan-gaap-april-1-2015-through.jpg)


![Audited Consolidated financial results & Auditors Report (Consolidated) for the period ended December 31, 2015 [Result]](https://img.pdfslide.net/doc/110x75/577c7d731a28abe0549ed6a5/audited-consolidated-financial-results-auditors-report-consolidated-for.jpg)

![Announces Q3 Results (Consolidated) & Limited Review Report (Consolidated) & Results Press Release for the Quarter ended December 31, 2015 [Result]](https://img.pdfslide.net/doc/110x75/577ca4e81a28abea748b5084/announces-q3-results-consolidated-limited-review-report-consolidated.jpg)


![Financial Results & Limited Review Report for Sept 30, 2015 (Consolidated) [Result]](https://img.pdfslide.net/doc/110x75/577ca73e1a28abea748c4dc0/financial-results-limited-review-report-for-sept-30-2015-consolidated.jpg)
![Revised Financial Results for June 30, 2015 (Consolidated) [Result]](https://img.pdfslide.net/doc/110x75/577cb1c71a28aba7118bdd63/revised-financial-results-for-june-30-2015-consolidated-result.jpg)

![Financial Results & Auditors Report for March 31, 2015 (Consolidated) (Audited) [Result]](https://img.pdfslide.net/doc/110x75/577cb40d1a28aba7118c4766/financial-results-auditors-report-for-march-31-2015-consolidated-audited.jpg)