Embed Size (px)
Citation preview
Pioneering the mining industry by shaping tomorrow’s exploration process
New Discovery Program Industry Consultation and Knowledge
Transfer Workshop
Mikael Arthursson, CTO, Minalyze Pty Ltd

Geolytical Core ScanningFull length analysis of drill cores
Photography
Structural logging
Chemical analysis
Specific gravity
Topography
RQD
Minalyzer CS
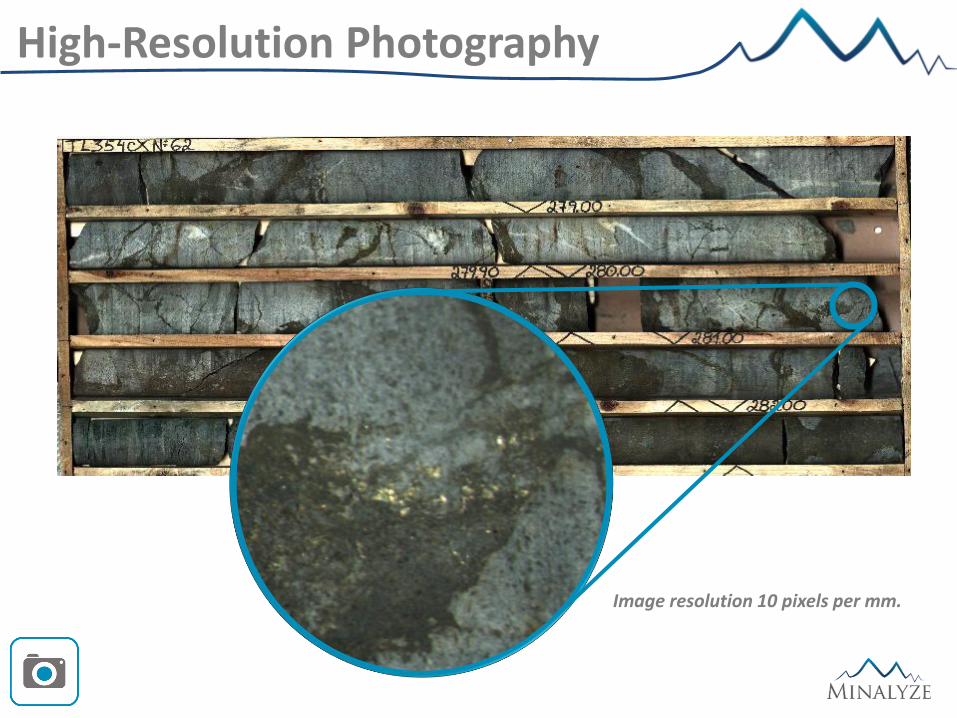
High-Resolution Photography
Image resolution 10 pixels per mm.

Topography Scan
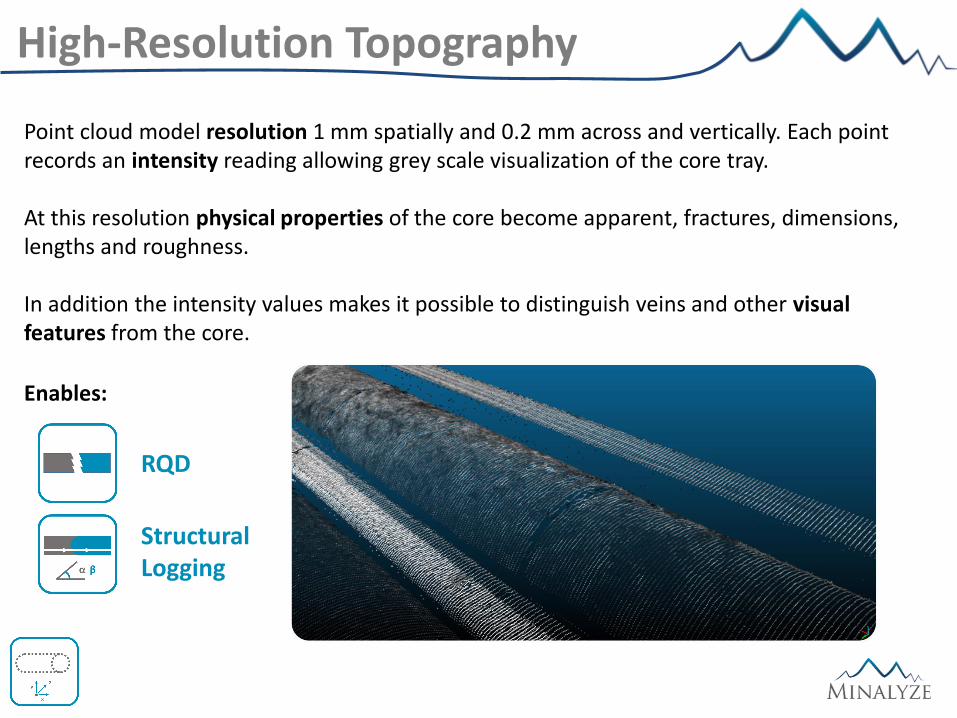
Point cloud model resolution 1 mm spatially and 0.2 mm across and vertically. Each point records an intensity reading allowing grey scale visualization of the core tray.
At this resolution physical properties of the core become apparent, fractures, dimensions, lengths and roughness.
In addition the intensity values makes it possible to distinguish veins and other visual features from the core.
RQD
Structural Logging
High-Resolution Topography
Enables:
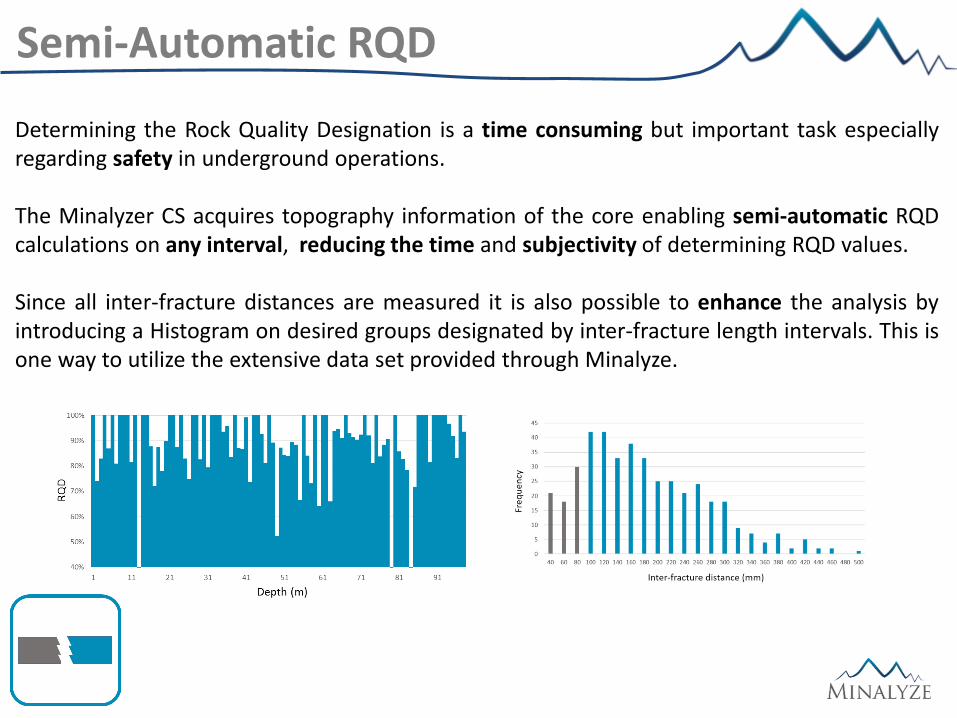
Determining the Rock Quality Designation is a time consuming but important task especiallyregarding safety in underground operations.
The Minalyzer CS acquires topography information of the core enabling semi-automatic RQDcalculations on any interval, reducing the time and subjectivity of determining RQD values.
Since all inter-fracture distances are measured it is also possible to enhance the analysis byintroducing a Histogram on desired groups designated by inter-fracture length intervals. This isone way to utilize the extensive data set provided through Minalyze.
Semi-Automatic RQD

The Minalyzer CS aquires XRF spectral data by a continuous movement along the complete length of the core.
Geochemical XRF Assays
• Provides overview and continuity
• Removes bias in sampling
• Allows for geochemical logging with objective data
The XRF footprint is 20mm x 1 mm. Analysis is less subjective, very repeatable and highly representative.

The elemental range spans in general from Al to U, allowing whole rock analyses.
Allows you to find correlations between elements that previously were not included in youranalytical suite for the full length of core.
Detection limits can be optimized through parameters such as anode type, scanning speedand interval length.
Detectable
Multi-Elemental
Not Detectable / No Natural Occurrence
Scanning samples is completely non-destructive and minimal sample preparation is required.
The sample surface should be visually clean from dust, mud and other contaminants.
Keeping your samples intact enables for subsequent mechanical testing and saves time on time consuming tasks of sample preparation such as splitting, cutting, crushing and grindingsamples.
Non-Destructive

The Minalyzer CS is equipped with a calibration station that hosts features to cover instrument QA/QC in an automated routine.
- a sensor for checking the X-ray beam intensity, shape and position. - standard samples to calibrate the X-ray detector and check for drift. Slots for up to ten
pressed pellets which could be either standard reference materials or deposit specific material that allows for calibration of the chemical data.
Calibration station integrated in Minalyzer CS for routine drift check and calibration.
Standards Slots Beam Quality and Alignment
Instrument Calibration & QA/QC
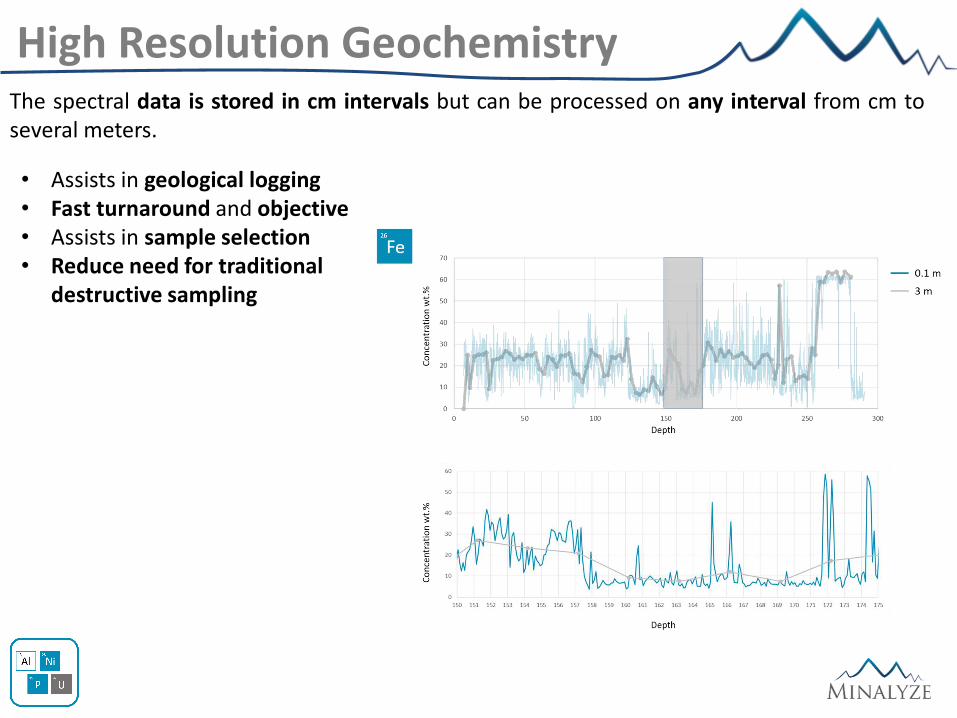
The spectral data is stored in cm intervals but can be processed on any interval from cm toseveral meters.
High Resolution Geochemistry
• Assists in geological logging• Fast turnaround and objective• Assists in sample selection• Reduce need for traditional
destructive sampling
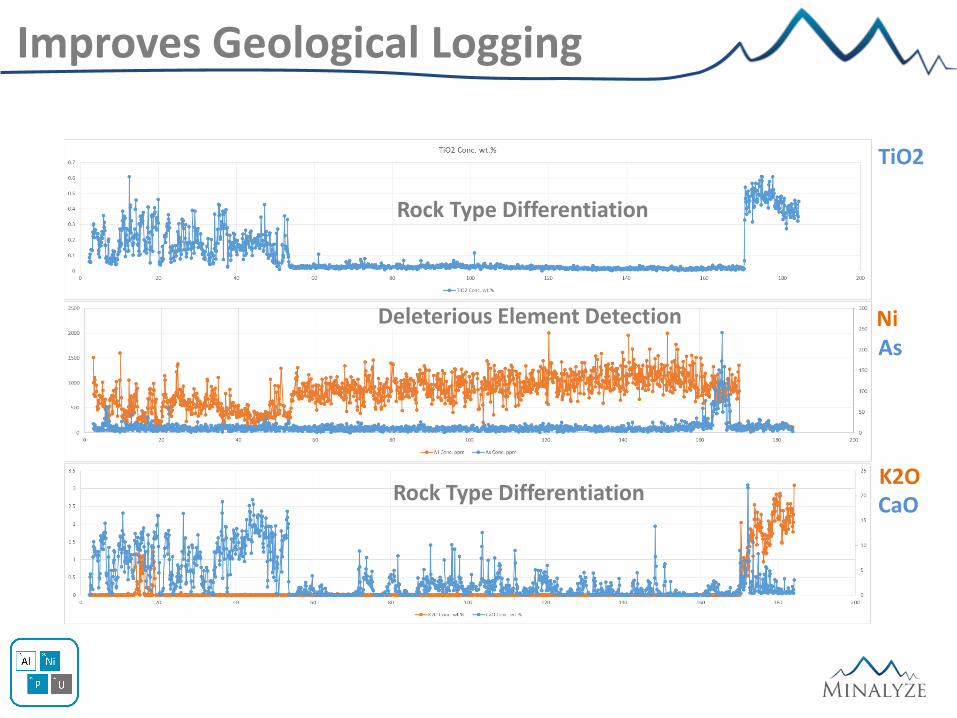
TiO2
NiAs
CaOK2O
Rock Type Differentiation
Deleterious Element Detection
Rock Type Differentiation
Improves Geological Logging

The geochemical XRF data provides the logger with objective and quantifiable information about the core, such as chemical data which can improve the consistency & quality of the log.
Geochemical Core Logging

• Geology can be complicated. • Lithologies can be altered. • Identifying the original rock units can be challenging. • Correctly recording geology is critical for a geological model and resource estimation. • Drill holes are often logged by the least experienced. • Geochemical data generated by the Minalyzer CS can be used to distinguish rocks.
Geochemical Core Logging
0
10
20
30
40
50
60
70
330 340 350 360 370 380 390 400 410 420 430
Fe(%)
Downcoredepth(m)
Fe(IGO)
Fe(MLZ)
0
10000
20000
30000
40000
50000
60000
70000
330 340 350 360 370 380 390 400 410 420 430
Ni(ppm)
Downcoredepth(m)
Ni(IGO)
Ni(MLZ)
0
5
10
15
20
25
30
35
40
45
50
330 340 350 360 370 380 390 400 410 420 430
S(%
)
Downcoredepth(m)
S(IGO)
S(MLZ)
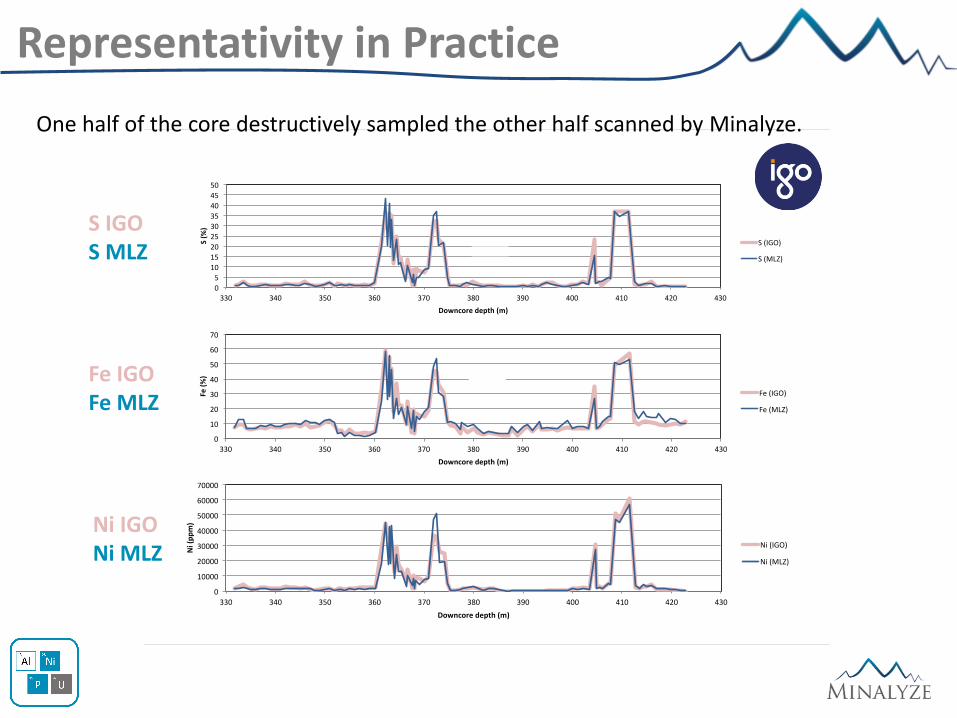
Representativity in Practice
S IGOS MLZ
Fe IGOFe MLZ
Ni IGONi MLZ
One half of the core destructively sampled the other half scanned by Minalyze.

Representativity in Practice

• High-resolution analyses (10 cm) of zirconium in drill core
• Results compatible withLeapfrog Geo and other 3D modelling software
• Variations in zirconiumcontent dependent on distinct rock types in a metavolcanic stratigraphy.
Compatible Data Set
Minalyze is in a partnership with Leapfrog and other companies in the data value chain.
Structural Logging
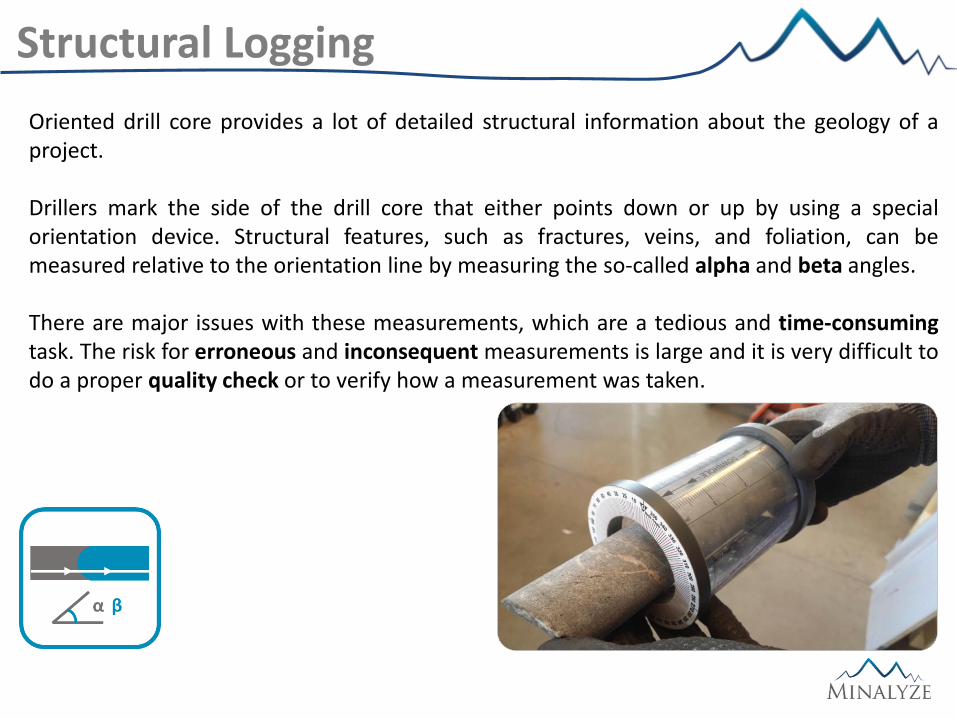
Oriented drill core provides a lot of detailed structural information about the geology of aproject.
Drillers mark the side of the drill core that either points down or up by using a specialorientation device. Structural features, such as fractures, veins, and foliation, can bemeasured relative to the orientation line by measuring the so-called alpha and beta angles.
There are major issues with these measurements, which are a tedious and time-consumingtask. The risk for erroneous and inconsequent measurements is large and it is very difficult todo a proper quality check or to verify how a measurement was taken.

3D Model of Oriented Core
3D Topography model of the core tray is acquired during the Pre-Scanning step in theMinalyzer CS. If the core have been oriented and marked prior to the Pre-Scan with theorientation line facing upwards this data set enables digital structural logging.

Alpha and beta angles of planar structural features can be measured in the tray withoutmanual handling, quickly and accurately directly from this digital version of the drill core usingsoftware developed by Minalyze. The method is in general faster and less labour-intensivethan conventional methods, while also significantly reducing the risk of incorrectmeasurements. The method works for all sizes of drill core and even cut cores, such as halfcore, can be measured.
The structural feature is logged by clicking two points on the orientation line and three points on the feature to be logged.
3D Model of Oriented Core

Alpha and beta angles of planar structural features can now be measured quickly andaccurately, saving time on time-consuming manual measurements, while also significantlyreducing the risk of incorrect measurements. Measurements are stored digitally in directrelation to the drill core, eliminating the risks of erroneous recording of measurements.Adjustments can be made to the measurements if necessary, long after the cores have beensampled and sent to the archive without needing to physically retrieve the core trays. Seniorgeologists can easily perform a quality check of the measurements.
Works for All Angles

Digital Measurement in Practice
Time and cost savingsExample
Core length: 500 meters
Core features: 600
Traditional: average 2.5 minutes/feature
Minalogger: average 0.5 minutes/feature Saved 20 hours manual work
Angles:Alpha_= 59.55Beta = 34.98

Measure SG to convert volume to weight.
Traditionally done by:
• Hydrostatic weighing in air and water.
• Gamma-ray densitometry for core and downhole tools.
• Gas Pycnometry on pulps.
Specific Gravity
36.2 g 14.2 g
2.55 g/cm3=
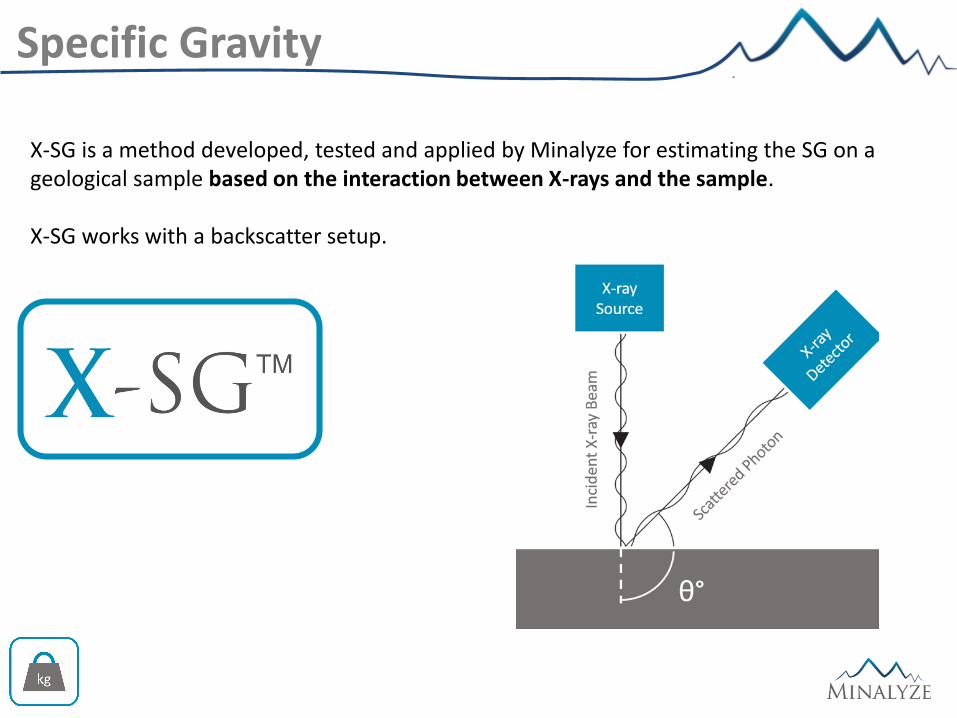
X-SG is a method developed, tested and applied by Minalyze for estimating the SG on a geological sample based on the interaction between X-rays and the sample.
X-SG works with a backscatter setup.
Specific Gravity

Apart from the characteristic X-rays there are incident X-rays that are scattered by thesample, known as Rayleigh and Compton scattering. The intensity of the scattered X-raysdepends on the physical properties of the sample, including the density.
SG is estimated on the same intervals as the chemistry as it is derived from the same data just looking at a different part of the spectra.
This effect is used in healthcare applications to measure bone density.
Rayleigh & Compton Peaks
Rayleigh and Compton peaks have a direct correlation to the density of the material.
Compton (Rh) Peaks
Rayleigh (Rh) Peaks

Trials show the relation between the hydrostatic specific gravity and Minalyzer CS specific gravity is close to a 1 : 1 ratio.
The relative differences between the hydrostatic specific gravity and the estimated specificgravity by Minalyzer CS are generally less than ±10 %.
Reliable Results
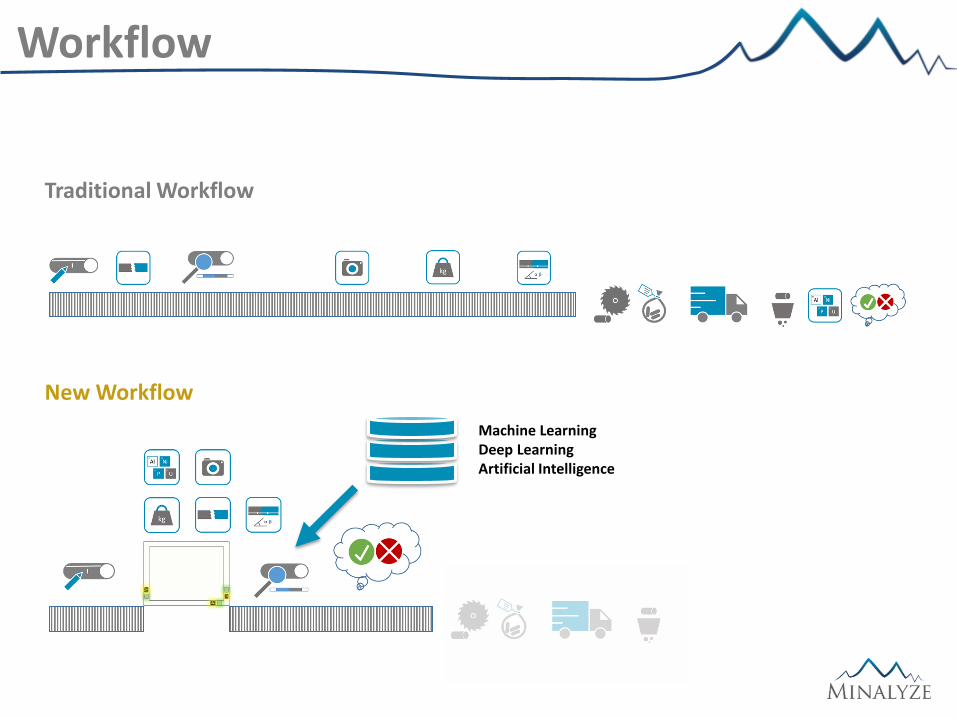
Workflow
Traditional Workflow
New Workflow
Machine LearningDeep Learning Artificial Intelligence

RC Chip Tray Scanning
Possibility to scan around 1000 samples per shift depending on desired analysis time and quality.Also enables scanning of pulps.

Minalyzer CS is Mobile
Decreasing waiting timePreparation and transport of samples not needed

Minalyzer CS is Mobile

Application – Remote Exploration

Application – Core Shed

Application - Mine Site

Application - Mine Site
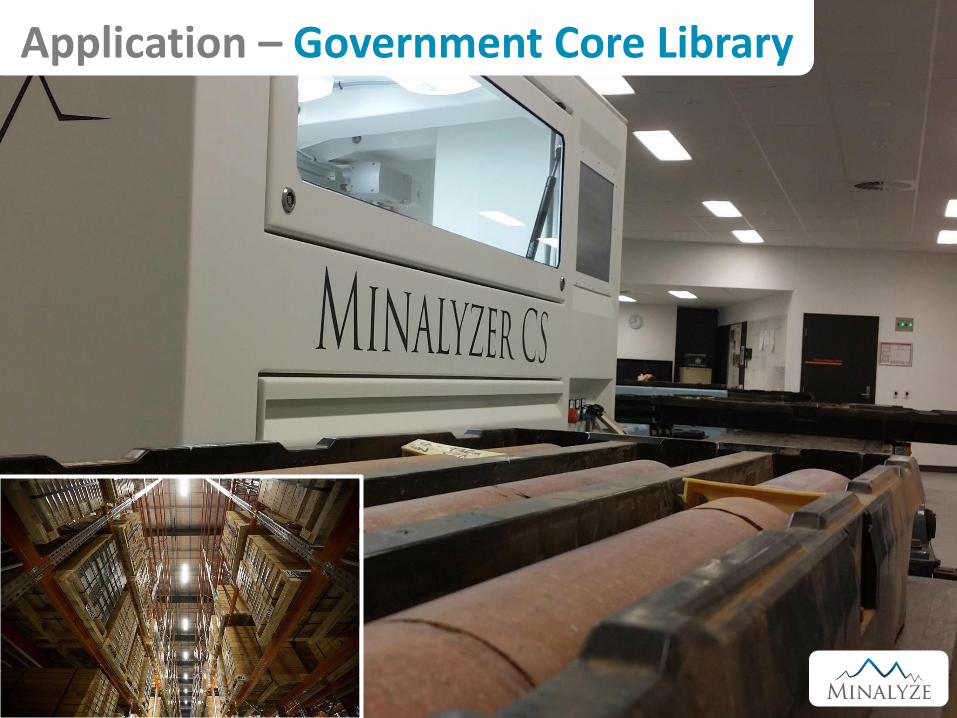
Application – Government Core Library

Application – Research and Academia

Minalogger – Cloud Software
World unique cloud based web software for 3D visualization of all generated datsets in a PC, Mac, Phone or Tablet on the go. Can also load other externally generated depth related data.
Workshop Tasks
MSDP 02• Is there information in this drill hole
that could drive economic mineral exploration?
• What elements would potentially be of economic value?
• At what depth is metals of potential economic value introduced?
Workshop Tasks
CDP 008• This hole passes through a sedimentary
sequence of mud and siltstones before entering a basalt. Which elements are helpful when identifying these changes in lithology?
• At what depth is the basalt introduced?• What happens around depth 600m?
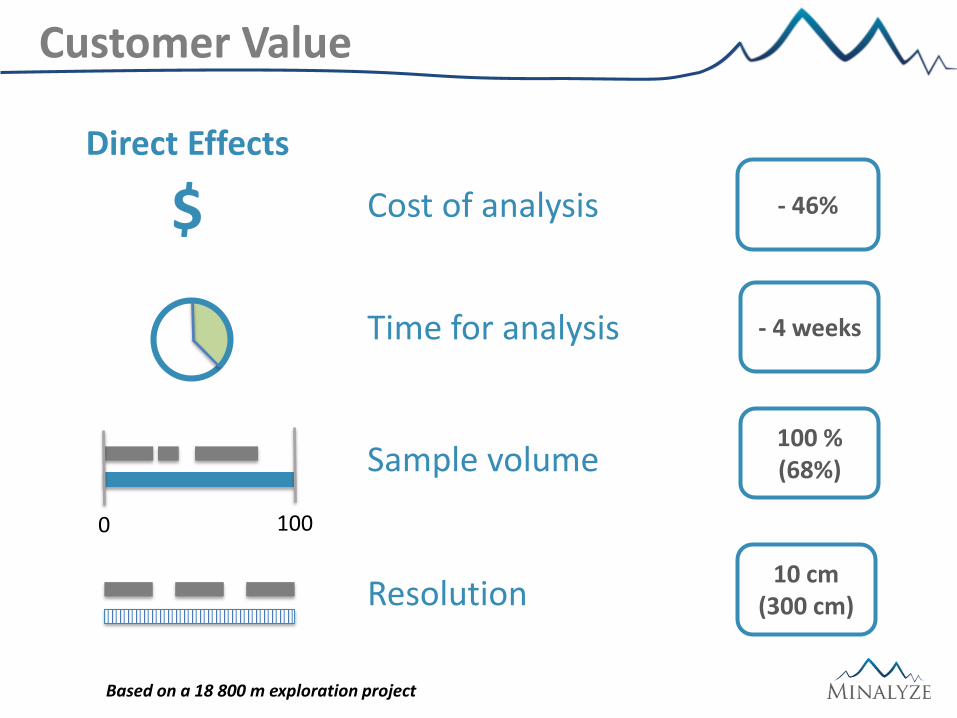
Based on a 18 800 m exploration project
0 100
Cost of analysis - 46%
Time for analysis - 4 weeks
Sample volume100 % (68%)
Resolution10 cm
(300 cm)
$Direct Effects
Customer Value
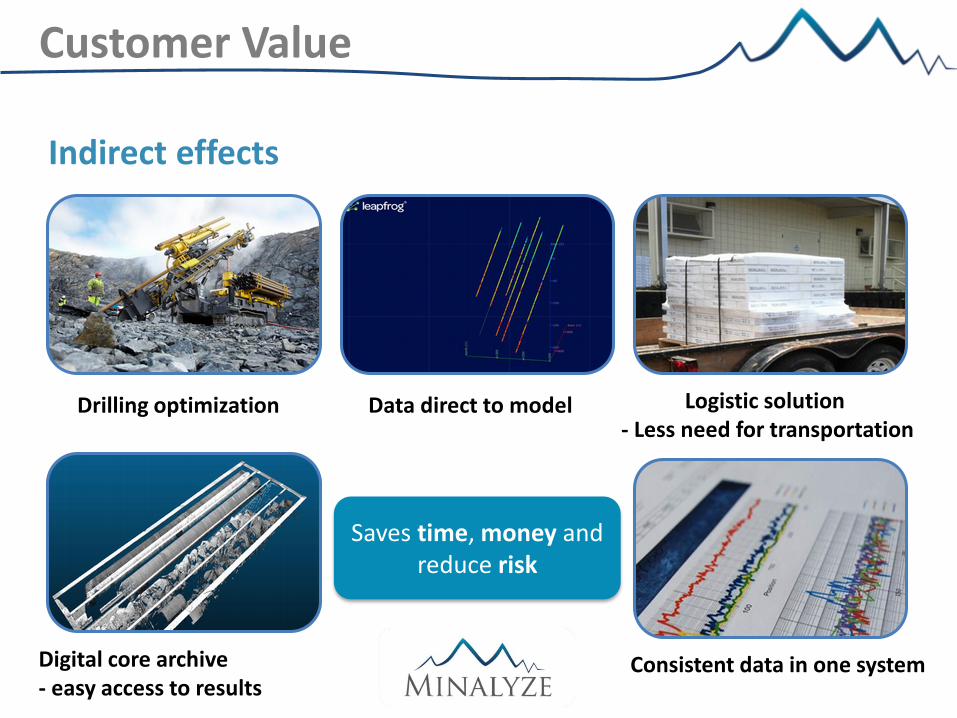
Drilling optimization Data direct to model Logistic solution - Less need for transportation
Digital core archive- easy access to results
Consistent data in one system
Indirect effects
Saves time, money and reduce risk
Customer Value

•Faster discoveries - Detailed information delivered quickly will shorten and refine the exploration process and time to operating mine.
•More discoveries per dollar invested - Critical information delivered in real-time to optimize decision making.
•CAPEX efficient - A service-based business model for Minalyzer allows you to direct investment to operations optimization.
Enhance Revenue

•Efficient utilization of personnel - Semi-automation of time consuming and repetitive work allows more time for qualitative assignments.
•Decreased risk for investments - More information earlier, provides improved decision basis.
•Resource optimization - Benefit from short lead times and optimize the exploration process or mine operations.
Reduce Cost

•Analysis while the rig is still on site – means drill program, logistics and data management can be improved, leading to better budget utilization.
•Remote access - retrieve results from the scan regardless of location. Experienced geological team at HQ can collaborate with the field geologist.
•Complete information - The continuous scan reveals more than what is visible to the eye providing a confident basis for efficient logging.
Increase Efficiency

Challenger Geological Services
Example Clients and Partners
This list provide an idea on the width of application and is not exhaustive, more clients and partners are available for reference upon request.