Embed Size (px)
Citation preview

Global Implementation Programme for the SEEA; UNHQ, New York, June 19th 2013
1
New ecosystem and biodiversity information from existing environmental data
By Tonnie Tekelenburg

100%
0%
50%
MSA
3. Current state of affairs
Functio
n chang
e &
degrad
ation
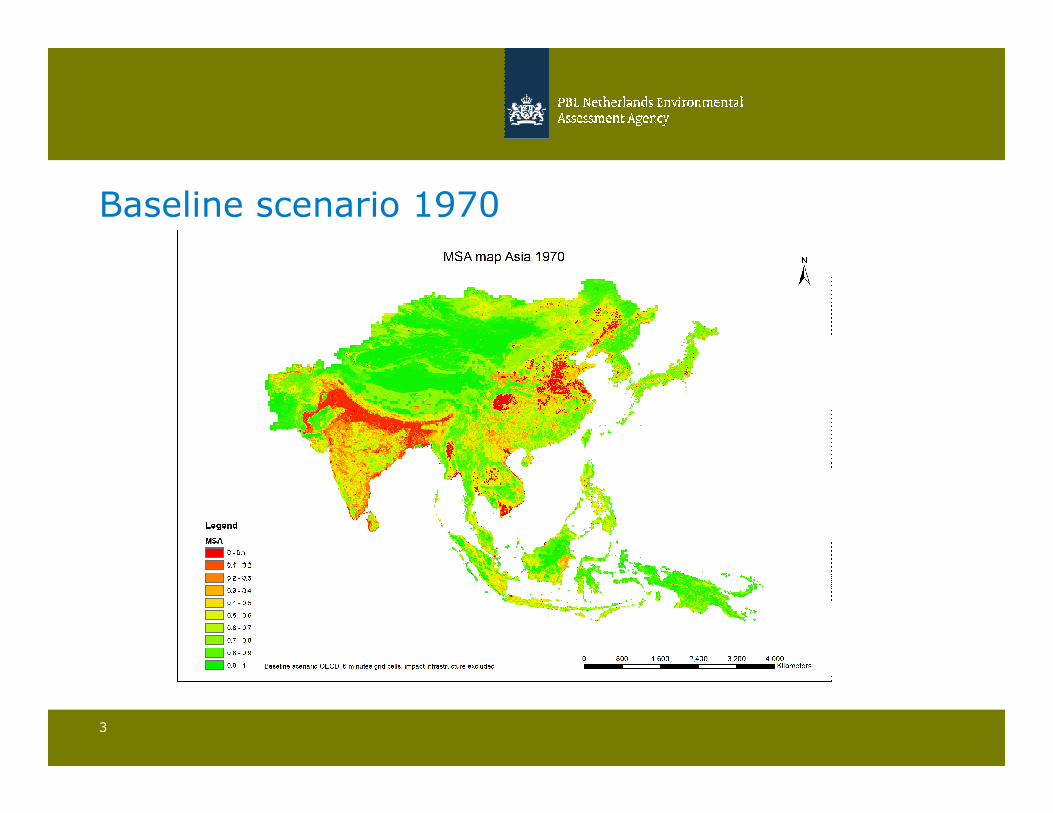
Baseline scenario 1970
3

Baseline scenario 2000
4

Baseline scenario 2030
5

6
NCI:Global: 77 -> 72 -> 65% South-East Asia 70 -> 60 -> 40%
Increasing rate of biodiversity loss in 30 years periods
2030
1970
2000
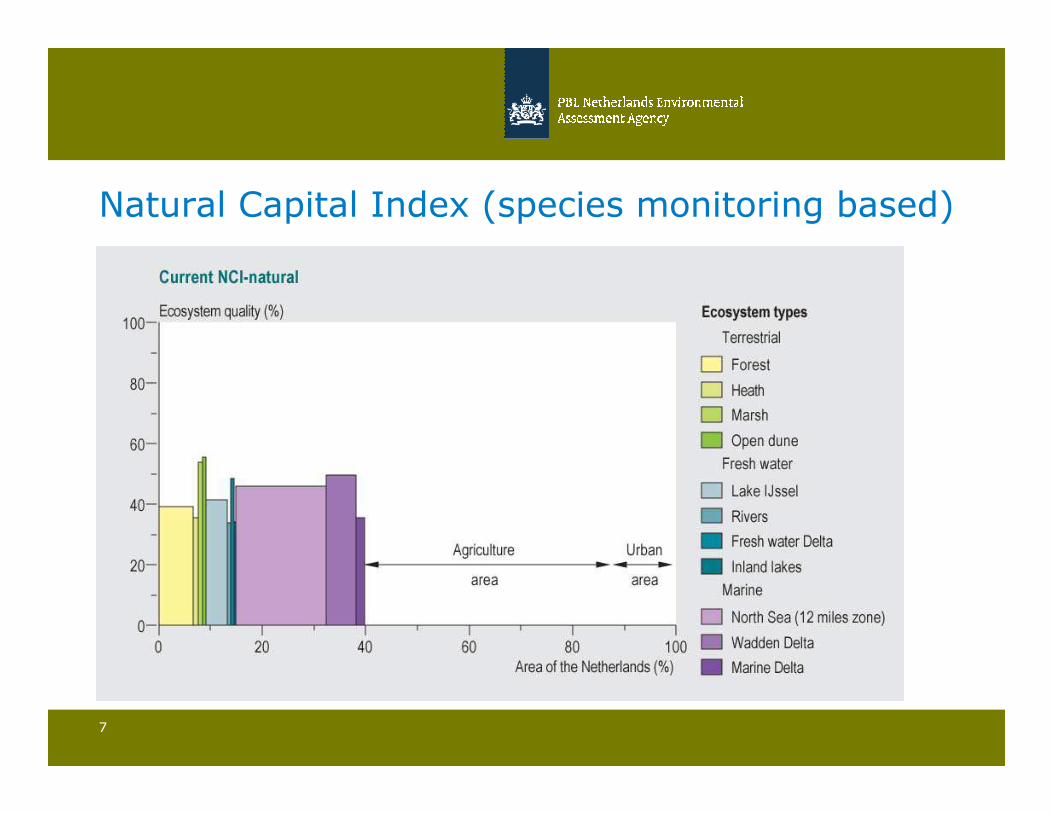
Natural Capital Index (species monitoring based)
7
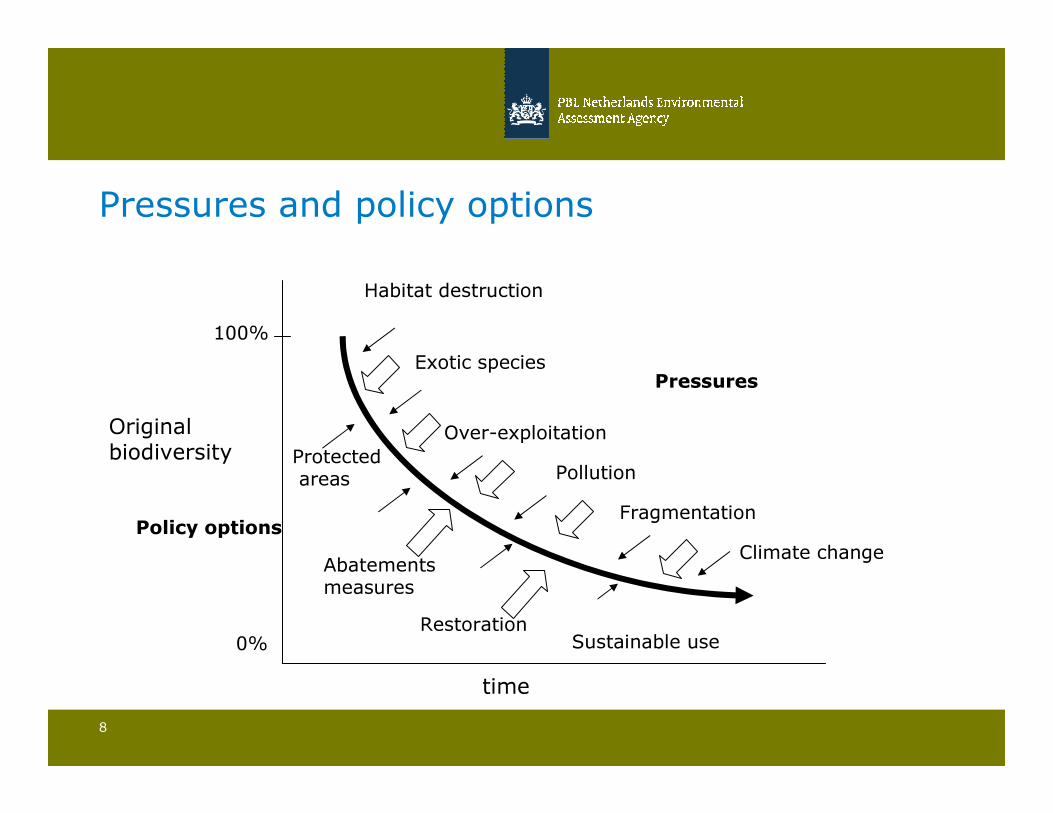
Pressures and policy options
8
Pressures
Policy options
time
Originalbiodiversity
Habitat destruction
Exotic species
Over-exploitation
Pollution
Fragmentation
Climate change
Sustainable useRestoration
Abatementsmeasures
Protectedareas
100%
0%

How to calculate the biodiversity status?Example GIS part calculation current biodiversity Zambia
9

Potential ecosystems
PBL and SCBD workshop: regional scenario analysis. Nairobi
28 January - 1 February 201310
Siglas Ecosistema Km2 % Nac
bha Bosque húmedo amazónico 74919,87 30,12
bhai Bosque húmedo amazónico inundable 11913,33 4,79
bhc Bosque húmedo de la costa 47405,15 19,06
bhmoc Bosque húmedo montano occidental 21201,09 8,52
bhmor Bosque húmedo montano oriental 31827,93 12,79
bsmor Bosque seco montano oriental 368,97 0,15
bsoc Bosque seco occidental 33863,97 13,61
h Humedal 448,03 0,18
m Manglar 2819,91 1,13
n Nieve 212,05 0,09
ph Páramo húmedo 13680,72 5,50
ps Páramo seco 1804,4 0,73
vhi Vegetación húmeda interandina 5943,22 2,39
vsi Vegetación seca interandina 2369,56 0,95

Remnants of natural ecosystems
11
56
29
16

Distribution of nature, mosaics and intervention areas
12
56
29
16

Average naturalness/intactness of ecosystems (MSA)
13
0
10
20
30
40
50
60
70
80
90
100
bha bhai bhc bhmoc bhmor bsmor bsoc h m n ph ps vhi vsi NAC

Comparison between ecosystems
14
77,057,35
2,83
5,1
7,14
15,96
High versus low integrity/intactness
bha = 87,23
vsi = 28,20

MSA and loss form pressures per administrative region
15
Remaing MSA and pressures by region in 2000
0%
10%
20%
30%
40%
50%
60%
70%
80%
90%
100%
Red_riv er North_east North_w est North_centre South_centre Central_highl South_east Mekong_delta
MS
A
MSA remaining land use depostion climate infrastructure fragmentation

Share of ecosystem in and outside the national protected area system
16
0%
20%
40%
60%
80%
100%
bha bhai bhc bhmoc bhmor bsmor bsoc h m n ph ps vhi vsi NAC
Dentro SNAP Fuera SNAP

Average ecosystem quality/ecosystem integrity (MSA) of protected areas
17
Área protegida Biovalor
Refugio de Vida Silvestre Islas Corazón y Fragatas 0,05
Ecosistema de Manglar del Esturio del Río Muisne 0,28
Refugio de Vida Silvestre Isla Sta.Clara 0,40
Reserva de Producción Faunística Chimborazo 0,76
Reserva Ecológica Mache Chindul 0,76
Reserva Ecológica Los ILinizas 0,77
Reserva Ecológica Manglares Churute 0,84
Parque Nacional Cotopaxi 0,87
Reserva Ecológica Manglares Cayapas Mataje 0,87
Parque Nacional Machalilla 0,90
Parque Nacional Sangay 0,91
Reserva Ecológica Cayambe Coca 0,93
Parque Nacional LLanganates 0,97
Reserva de Vida Silvestre Pasochoa 0,98
Reserva de Producción Faunística Cuyabeno 0,98
Reserva Ecológica Cotacachi Cayapas 0,99
Parque Nacional Yasuní 0,99
Parque Nacional Cajas 0,99
Reserva Ecológica Cofán Bermejo 1,00
Parque Nacional Podocarpus 1,00
18

19

PBL proposal to SEEA
� National (remote sensing based) landuse, ecosystem and MSA biodiversity accounting baseline 2010-2015 (in line with CBD)
� Support planning and implementation of Experimental Ecosystem accounting
– Meeting in Norway in september: international project formulation
– Expert meeting on data, tools and procedures
� One country case study with national Statistic office and Biodiversity focal point (2013)
� One country accounting (Costa Rica?) to be discussed in Waves program
� Compare for The Netherlands species based and pressure based national MSA ecosystem accounting
20

Who is PBL?
Governmental institute:
� Netherlands Environmental Assessment Agency (PBL)
� Support policy for ministries:
– Nature protection,
– Environment,
– Economy and innovation and
– Foreign Affairs
� 3 geographical levels: national, regional and global
� Interface between policy makers and research
� We work close together with CBS (Statistics office)
21

What is our work?
� Understanding biodiversity loss & its implications� Developing indicators� Developing models� Relating biodiversity to human well-being� Capacity building� Scientific publication
� Assessment reports: – UNEP’s Global Environment Outlook – CBD’s Global Biodiversity Outlook– EU Outstanding Environment Issues– OECD Environmental Outlook and Strategy– Rethinking– 25 countries trained
22
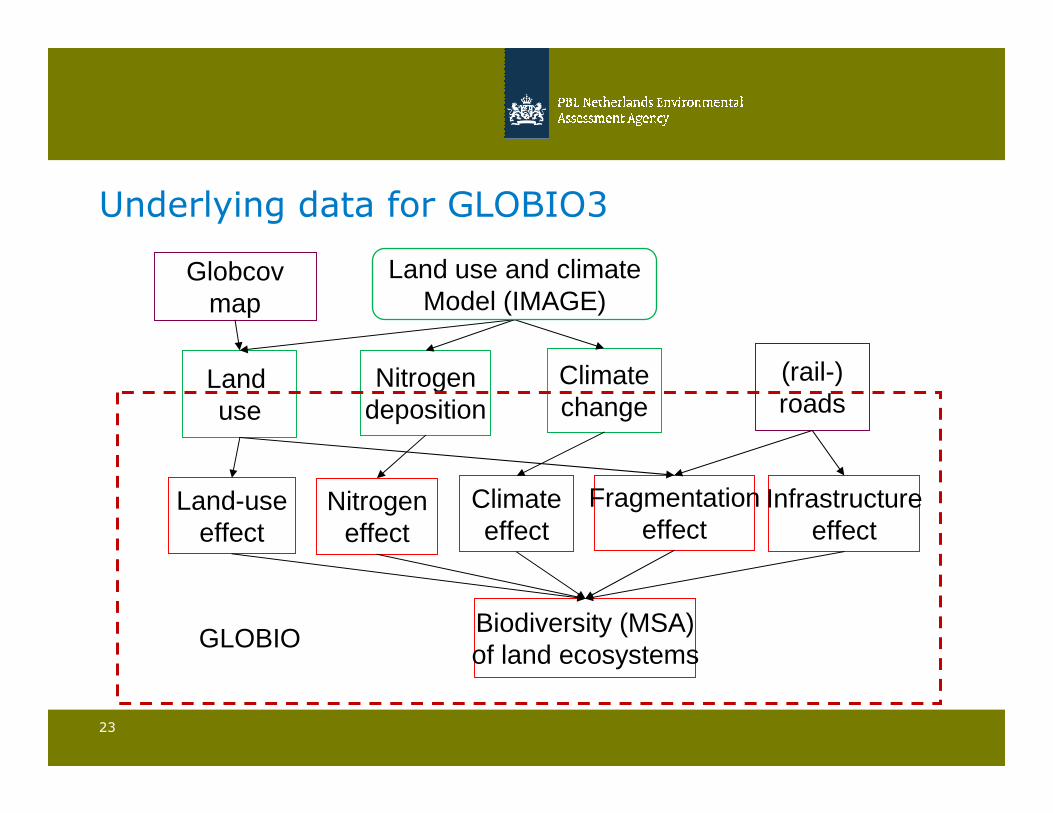
Underlying data for GLOBIO3
23
Globcovmap
Land use
Nitrogendeposition
Climatechange
(rail-)roads
Land-useeffect
Nitrogeneffect
Climateeffect
Fragmentationeffect
Infrastructureeffect
Biodiversity (MSA)of land ecosystems
GLOBIO
Land use and climateModel (IMAGE)

Future assessment in Cambodia
24
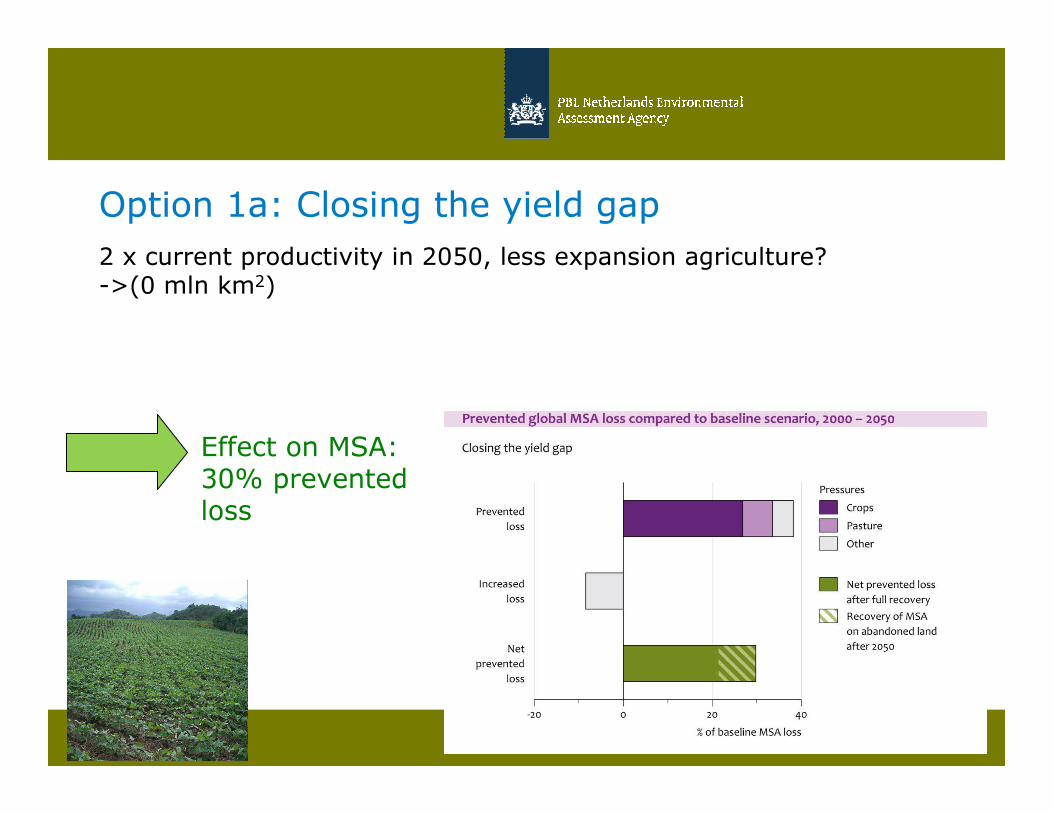
Option 1a: Closing the yield gap
2 x current productivity in 2050, less expansion agriculture? ->(0 mln km2)
PBL and SCBD workshop: regional scenario analysis. Incheon
City, South Korea 20 -24 May 201325
Effect on MSA:30% prevented loss

26
Degraded Degrading
Cstorage & climate Water retention & floods
Agri area & food Forestry area & fiber
Biodiversity Environm dependency
• Km3 soil water prist, LU, degra,
to 2050
• Change in waterstress days
• Figure: Nr days/km2 flooded
• Map all year / seasonal rivers
• Mln km2 arable / grazing good condition & degraded & abandoned
& reserve, tot 2050 Stapel diagram
• Lost food production former & current
agri land in Kcal & kg proteins
tov potential, tot 2050
• Mln km2 forestry good condition & degraded & lost & reserve, tot 2050 Stapeldiagram
• Lost timber & fiber production former & current forestry land
in m3 & tons per Y tov potential,
tot 2050
• Remaining MSA & loss due to
agri, forestry, climate, infra/urban,
Ndep, degradation from former LU &
indirect from degradation from
current LU
• Map % prim sector/GDP
• Lost GDP due to degradation Map
• Figure: x-as 100- 0% env incomey-as Nr people
• Nr of high env dependent peoplein degrading areas tot 205
PBL workplan on Ecosystem services