Embed Size (px)
Citation preview
Musical Illusions
Diana Deutsch Department of Psychology
University of California, San Diego La Jolla, CA 92093
In Squire, L. (Ed.) New Encyclopedia of Neuroscience, (Oxford, Elsevier, in press)
2
Author information:
Name and affiliation to appear in published work:
Diana Deutsch, Professor of Psychology, University of California, San Diego
Full address:
Professor Diana Deutsch Department of Psychology University of California, San Diego 9500 Gilman Dr. #0109 La Jolla, CA 92093-0109, USA
3
keywords and phrases for indexing:
glissando illusion
handendness
illusion
individual differences
language
modularity
music
musical illusions
octave illusion
perception
plasticity
scale illusion
speech
tritone paradox
4
Synopsis Musical illusions are explored, and their implications for brain function are discussed. There are striking
variations across listeners in perception of these illusions. For certain illusions, perceptual differences
correlate with handedness, indicating that they reflect variations in innate brain organization. For
another illusion, perceptual differences correlate with the language or dialect to which the listener was
exposed, particularly early in life, so pointing to an influence of early exposure to speech sounds on
how music is perceived. Implications of the illusions for modularity of function are discussed.
5
Musical Illusions D Deutsch, University of California, San Diego, La Jolla, CA, USA
Introduction Over the last decade, there have been significant advances in understanding the brain mechanisms
underlying music perception. Functional imaging studies of normal individuals have provided
considerable information concerning the anatomical structures involved. Studies of patients with musical
deficits resulting from brain lesions have supplied much complementary information, as have studies of
individuals with congenital amusia. Investigations of musical illusions – misperceptions of music by
normal individuals – provide further insights into the brain circuitry underlying music perception. This
entry reviews those musical illusions which have clear implications for the neuroscience of music. In
exploring these illusions, we focus in particular on three issues:
(1) Innate differences in music perception. Can we assume that music perception the function of innate
brain circuitry that is common to most individuals, or are there widespread and substantial differences in
music perception that reflect innate differences in brain organization? Some of the illusions to be
described point to widespread individual differences in the perception of music that correlate with
handedness; these indicate that there are substantial variations in the innate brain circuitry underlying
music perception.
(2) Neural plasticity in the development of music perception. Recent imaging studies have indicated that
musical practice produces alterations in brain organization, and that this happens particularly at an early
age, when the effects of experience on brain function are particularly strong. In addition, a musical
illusion to be described here has been shown to be heavily influenced by the speech patterns to which
the individual has been exposed, particularly in childhood. The characteristics of this illusion indicate
that the brain circuitry underlying music perception can be influenced by extramusical input, particularly
at an early age. More specifically, it points to a strong influence of exposure to speech patterns in
childhood on how music is later perceived.
6
(3) Modularity in musical processing. Findings from neurophysiological and neuropsychological
studies have indicated that there are distinct what and where pathways in the auditory system. In
accordance with these findings, certain musical illusions indicate that there are separate decision
mechanisms underlying what pitches we hear and underlying where the tones appear to be coming from,
and that the combined outputs of these decision mechanisms can lead to illusory conjunctions. More
specifically, we can think of a musical tone as a bundle of attribute values – having a pitch, a location, a
loudness, a timbre, and so on, with the different attributes being subserved by distinct neural pathways.
When more that one tone is presented at a time, the different outputs of these pathways must be
correctly conjoined in order to produce veridical percepts. Some of the illusions described here can be
explained as due to incorrect conjunctions of attribute values.
Stereo illusions
Powerful musical illusions can be produced when two streams of tones arise in parallel from different
regions of space. There are striking differences between listeners in the way these illusions are
perceived. These differences have been found to correlate with the handedness of the listener, and so can
be taken to reflect innate differences in brain organization.
The octave illusion.
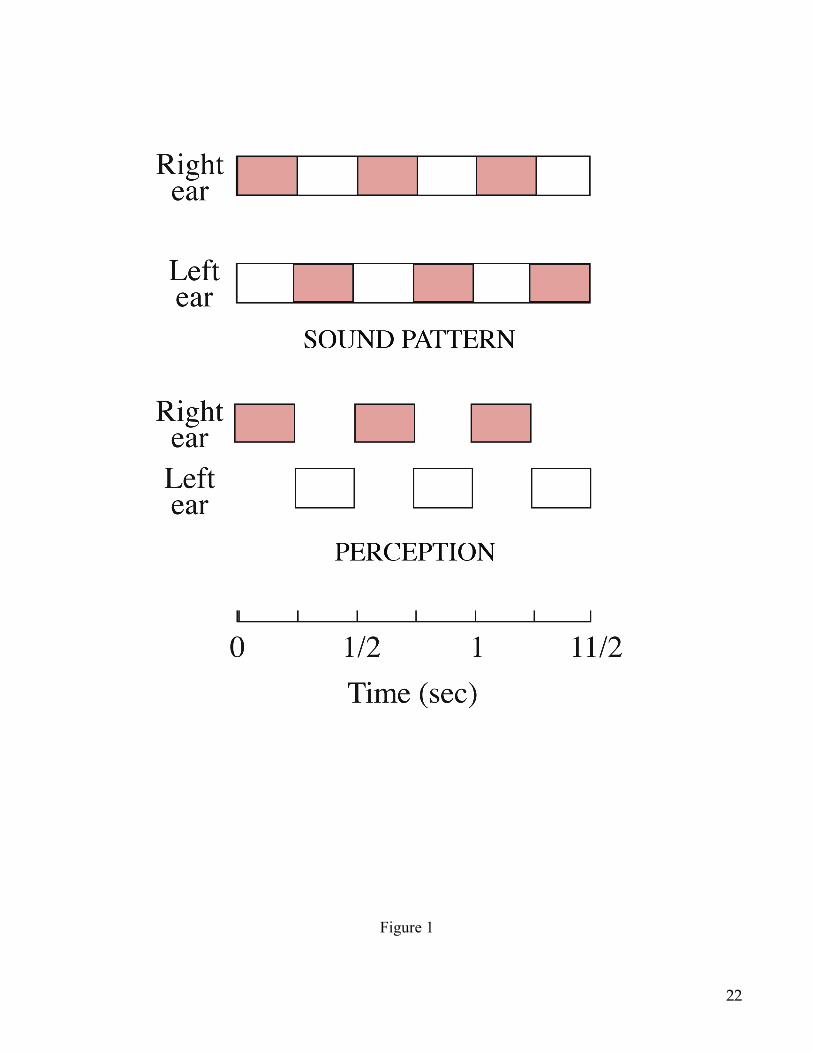
The octave illusion is produced by the pattern shown in the upper portion of Figure 1. Two tones which
are spaced an octave apart (at 400 Hz and 800 Hz) are repeatedly presented in alternation. The tones are
250 ms sine waves at equal amplitude, and they follow each other without pause. The identical sequence
is presented via headphones to both ears simultaneously; however when the right ear receives the high
tone the left ear receives the low tone; and vice versa.
<Figure 1 near here>
7
Surprisingly, this simple pattern is almost never perceived correctly, and instead gives rise to a variety of
illusions. The type of illusion varies substantially across listeners, and the one most commonly obtained
is shown in the lower portion of Figure 1. A single tone appears to be switching from each to ear while
at the same time its pitch appears to be switching between high and low. In other words, the sequence as
heard at the right ear consists of ‘high tone - silence – high tone – silence’ while the sequence as heard at
the left ear consists of ‘silence – low tone – silence – low tone’.
The illusion becomes even more surprising when the listener’s earphones are placed in reverse position.
Now most people experience exactly the same thing – the tone that had appeared in the right ear still
appears in the right ear, and the tone that had appeared in the left ear still appears in the left ear. This
gives rise to the peculiar impression that the earphone that had been producing the high tone is now
producing the low tone, and that the earphone that had been producing the low tone is now producing
the high tone.
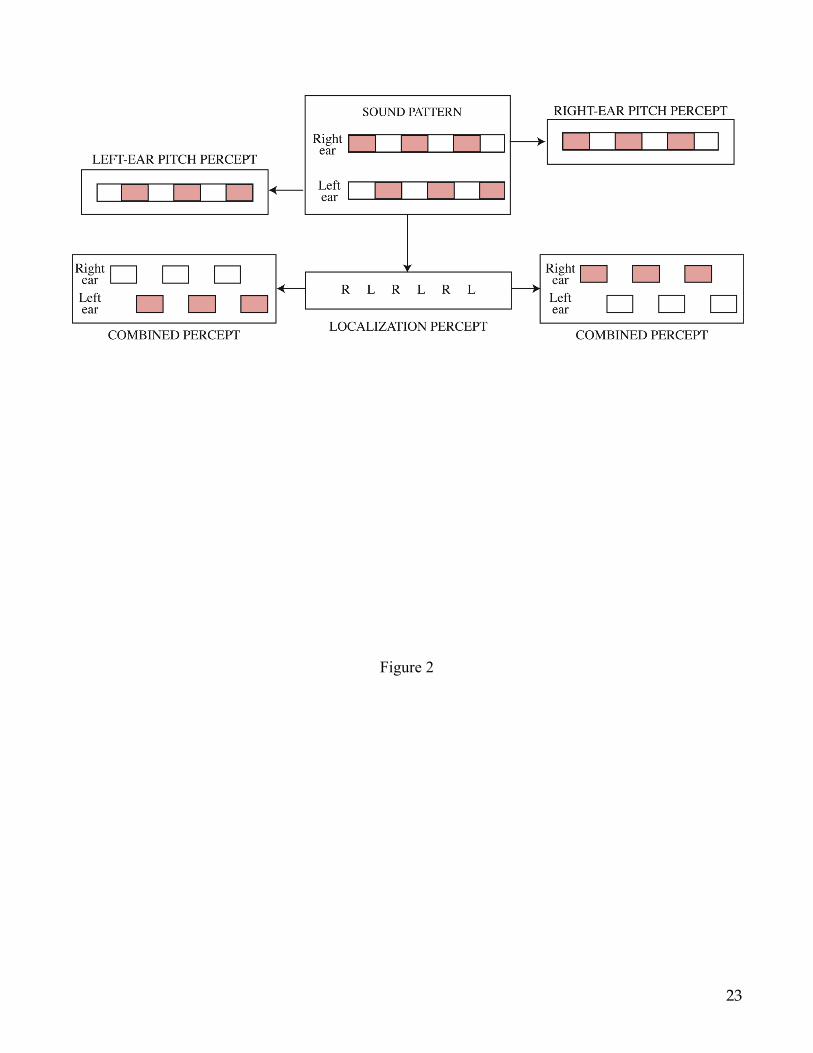
There is clearly no simple explanation for this illusory percept. However, if we assume that there are
two separate decision mechanisms, one determining what pitch we hear, and the other determining
where the sound is coming from, we are in a position to advance an explanation. The model is shown in
Figure 2. To provide the perceived sequence of pitches, the frequencies arriving at the dominant ear (i.e.,
the right ear in most righthanders) are followed, while those arriving at the nondominant ear are
suppressed from conscious perception. However, to provide the perceived locations, each tone is
localized at the ear that
receives the higher frequency signal, regardless of whether a pitch corresponding to the higher or the
lower frequency is perceived.
<Figure 2 near here>
More specifically, we can take a listener who perceives the pitches corresponding to the frequencies
delivered to the right ear. When the high tone is delivered to the right ear and the low tone to the left,
this listener hears a high tone, since it is delivered to the right ear, and localizes the tone in the right ear,
since this ear is receiving the higher frequency signal. However, when a low tone is delivered to the
right ear and a high tone to the left, this listener now hears a low tone, since it is delivered to the right
8
ear, but hears the tone in the left ear instead, since this ear is receiving the higher frequency signal. So
the full sequence is heard as a high tone to the right alternating with a low tone to the left. It can be seen
from Figure 2 that reversing the position of the headphones would not alter this basic percept. However,
given a listener who perceives the pitches corresponding to the frequencies arriving at the left ear
instead, holding the localization rule constant, the same sequence is heard as a high tone to the left
alternating with a low tone to the right.
Evidence for the above model has been obtained in a number of studies. The octave illusion therefore
provides a strong indication, at the perceptual level, that the neural pathways underlying what pitch we
hear, and those underlying where the sound is located are at some stage distinct and separate, and
operate in accordance with different rules. The combined outputs of these two mechanisms can then
result in a striking illusory conjunctions.
<Table 1 near here>
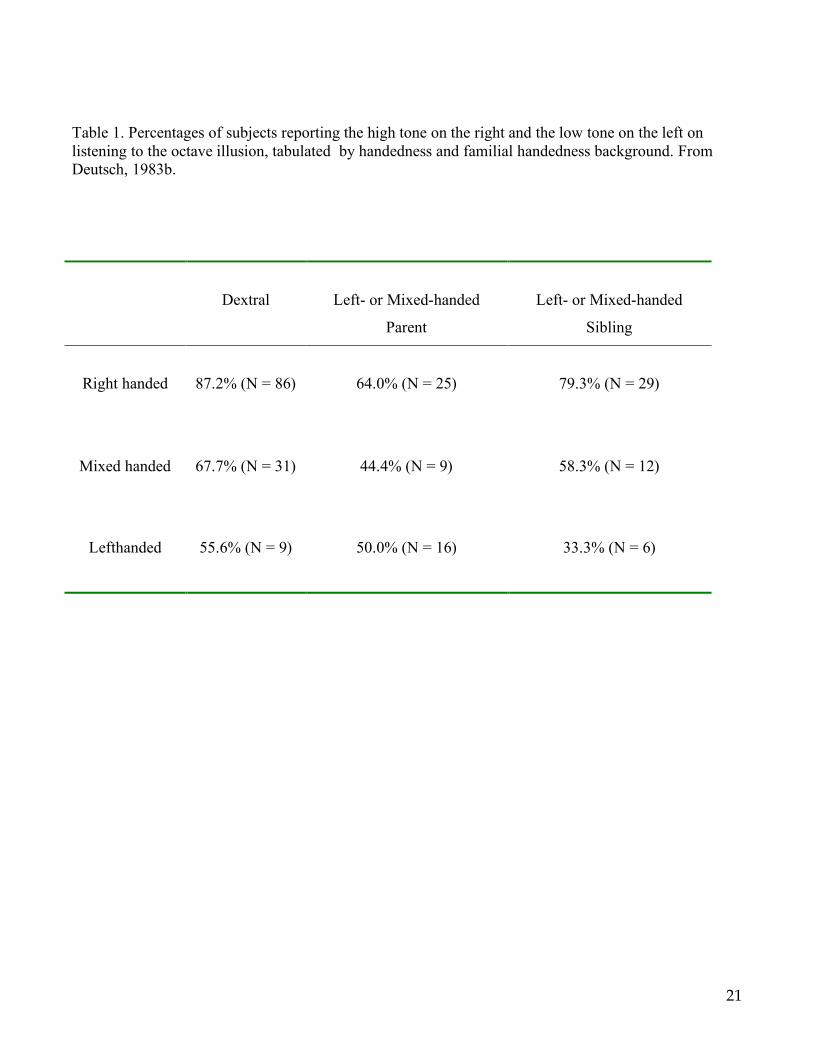
As another aspect of the octave illusion, it has been found, on a statistical basis, that righthanders and
lefthanders show different patterns of localization for the high and low tones at the two ears:
Righthanders tend strongly to hear the high tone on the right and the low tone on the left; however
lefthanders as a group do not show the same tendency. This handedness difference is in accordance with
the literature showing that while most righthanders have clear left hemisphere dominance, patterns of
cerebral dominance among lefthanders vary considerably. In one study subjects were categorized as
strongly righthanded, mixed handed, or lefthanded, and these groups were subdivided into those who
had only righthanded parents and siblings, and those who had a lefthanded parent or sibling. As shown
in Table 1, this categorization produced an orderly pattern of results: Subjects who were strongly
righthanded and with no lefthanders in their family were most likely to hear the high tone on the right
and the low tone on the left, while lefthanders with lefthanders in their family were least likely to do so.
These findings are as expected from neuropsychological studies relating hemispheric dominance of
function to patterns of handedness and familial handedness background, since those individuals with
lefthanders in their family are less likely to be strongly left hemisphere dominant than those with only
righthanders in their family. As a further handedness correlate, lefthanders as a group tend more than
righthanders to obtain complex percepts on listening to the octave illusion. This is in accordance with
9
studies showing that lefthanders, on a statistical basis, tend to have weaker patterns of cerebral
dominance than do righthanders.
The scale illusion.
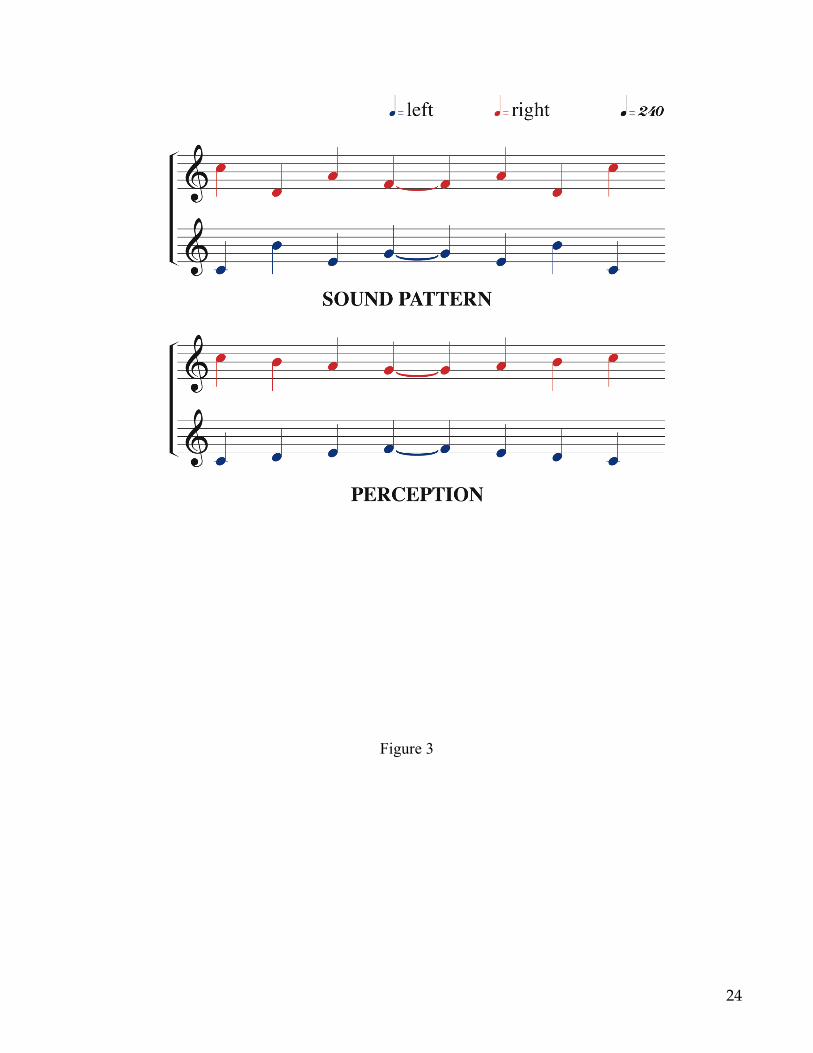
We next enquire what happens when a pattern is presented that consists of more than two tones. The
scale illusion provides an example. As shown in the upper portion of Figure 3, the sequence that
produces this illusion consists of a major scale, with successive tones alternating from ear to ear. The
scale is presented simultaneously in both ascending and descending form, such that when a tone from
the ascending scale is in the right ear, a tone from the descending scale is in the left ear; and vice versa.
In consequence, the right ear receives one disjunct pattern of pitches, while the left ear receives a
different, and overlapping, disjunct pattern of pitches. The tones are 250 ms sine waves at equal
amplitude, and the sequence is repeatedly presented without pause.
<Figure 3 near here>
This scale pattern also produces a number of illusions, which vary strikingly across listeners. The
illusion most commonly obtained by righthanders is shown in the lower portion of Figure 3. A melody
that corresponds to the higher tones appears to be coming from the right earphone, and melody
corresponding to the lower tones appears to be coming from the left earphone. When the earphone
positions are reversed, the higher tones continue to be heard as in the right ear and the lower tones as in
the left ear. This produces the strange impression that the procedure of reversing earphone positions has
caused the higher tones to migrate from one earphone to the other, and the lower tones to migrate in the
opposite direction. As with the octave illusion, righthanders and lefthanders differ statistically in the
way they perceive the scale illusion: Righthanders tend to hear the higher tones on the right and the
lower tones on the left; however lefthanders as a group do not show the same tendency. This indicates
that there is a perceptual tendency to perceive higher tones as coming from the dominant side of space
and lower tones as from the nondominant side.
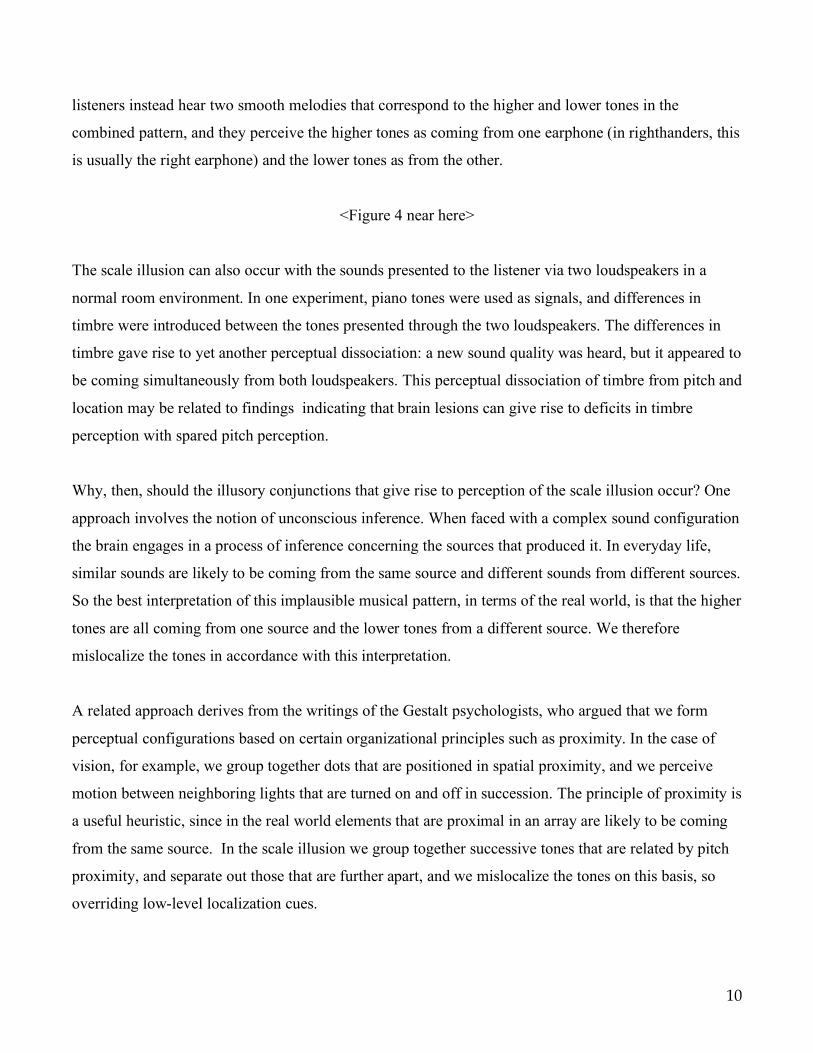
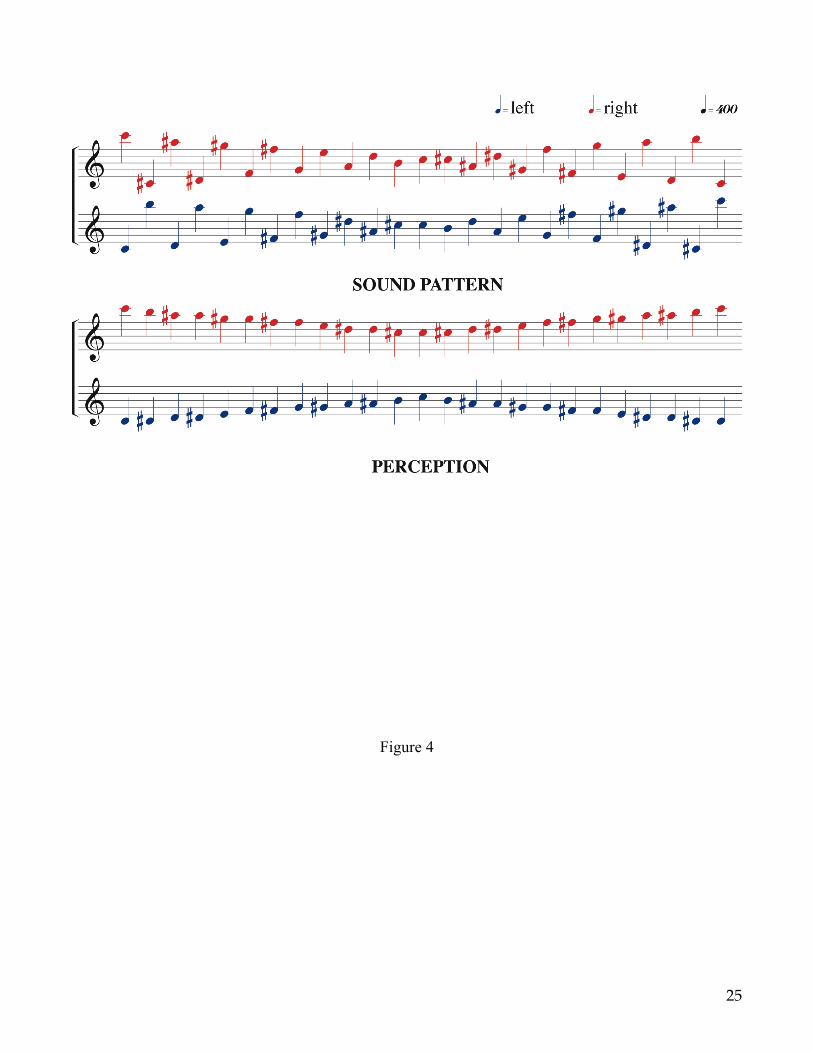
Variants of the scale illusion are easily produced. Figure 4 depicts a version involving a two-octave
chromatic scale. In reality, the sounds coming from each earphone leap around in pitch; however
10
listeners instead hear two smooth melodies that correspond to the higher and lower tones in the
combined pattern, and they perceive the higher tones as coming from one earphone (in righthanders, this
is usually the right earphone) and the lower tones as from the other.
<Figure 4 near here>
The scale illusion can also occur with the sounds presented to the listener via two loudspeakers in a
normal room environment. In one experiment, piano tones were used as signals, and differences in
timbre were introduced between the tones presented through the two loudspeakers. The differences in
timbre gave rise to yet another perceptual dissociation: a new sound quality was heard, but it appeared to
be coming simultaneously from both loudspeakers. This perceptual dissociation of timbre from pitch and
location may be related to findings indicating that brain lesions can give rise to deficits in timbre
perception with spared pitch perception.
Why, then, should the illusory conjunctions that give rise to perception of the scale illusion occur? One
approach involves the notion of unconscious inference. When faced with a complex sound configuration
the brain engages in a process of inference concerning the sources that produced it. In everyday life,
similar sounds are likely to be coming from the same source and different sounds from different sources.
So the best interpretation of this implausible musical pattern, in terms of the real world, is that the higher
tones are all coming from one source and the lower tones from a different source. We therefore
mislocalize the tones in accordance with this interpretation.
A related approach derives from the writings of the Gestalt psychologists, who argued that we form
perceptual configurations based on certain organizational principles such as proximity. In the case of
vision, for example, we group together dots that are positioned in spatial proximity, and we perceive
motion between neighboring lights that are turned on and off in succession. The principle of proximity is
a useful heuristic, since in the real world elements that are proximal in an array are likely to be coming
from the same source. In the scale illusion we group together successive tones that are related by pitch
proximity, and separate out those that are further apart, and we mislocalize the tones on this basis, so
overriding low-level localization cues.
11
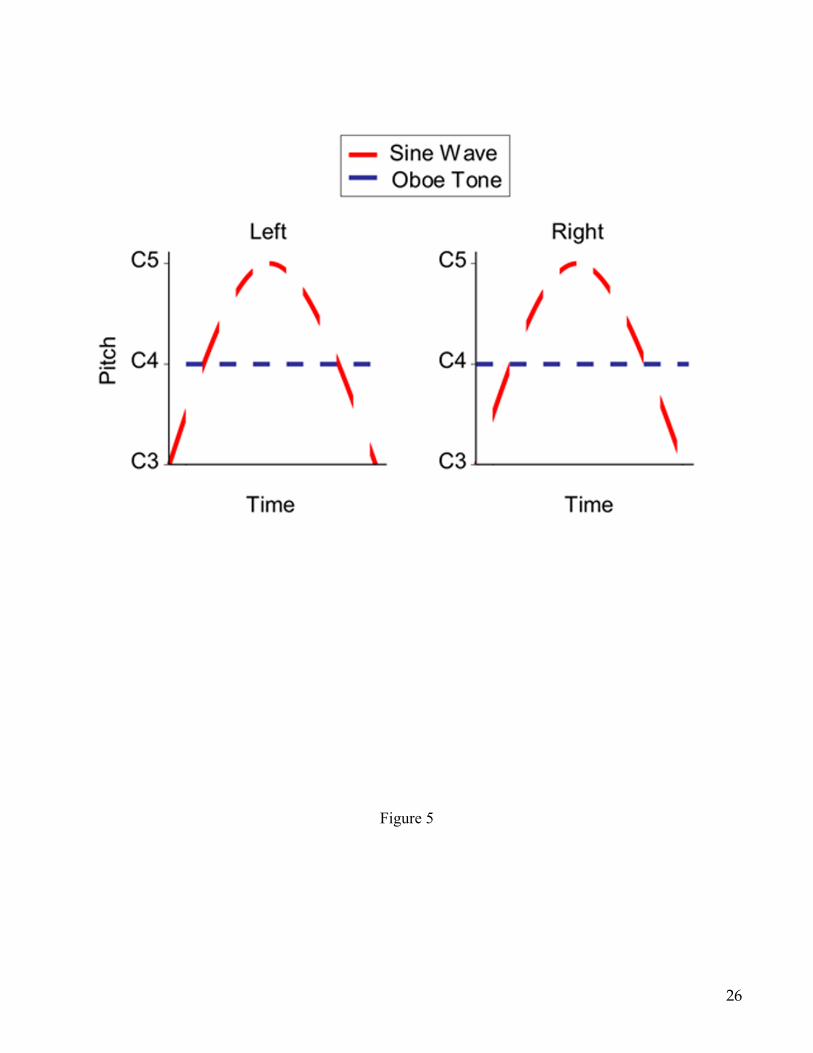
The glissando illusion
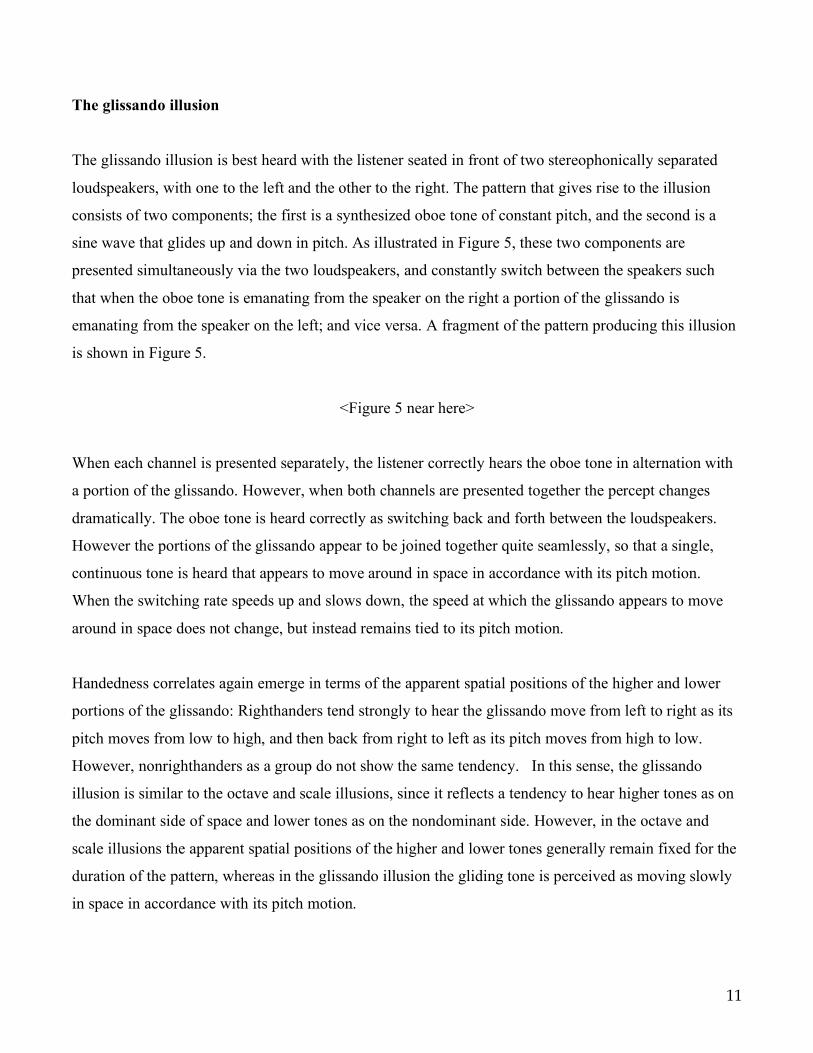
The glissando illusion is best heard with the listener seated in front of two stereophonically separated
loudspeakers, with one to the left and the other to the right. The pattern that gives rise to the illusion
consists of two components; the first is a synthesized oboe tone of constant pitch, and the second is a
sine wave that glides up and down in pitch. As illustrated in Figure 5, these two components are
presented simultaneously via the two loudspeakers, and constantly switch between the speakers such
that when the oboe tone is emanating from the speaker on the right a portion of the glissando is
emanating from the speaker on the left; and vice versa. A fragment of the pattern producing this illusion
is shown in Figure 5.
<Figure 5 near here>
When each channel is presented separately, the listener correctly hears the oboe tone in alternation with
a portion of the glissando. However, when both channels are presented together the percept changes
dramatically. The oboe tone is heard correctly as switching back and forth between the loudspeakers.
However the portions of the glissando appear to be joined together quite seamlessly, so that a single,
continuous tone is heard that appears to move around in space in accordance with its pitch motion.
When the switching rate speeds up and slows down, the speed at which the glissando appears to move
around in space does not change, but instead remains tied to its pitch motion.
Handedness correlates again emerge in terms of the apparent spatial positions of the higher and lower
portions of the glissando: Righthanders tend strongly to hear the glissando move from left to right as its
pitch moves from low to high, and then back from right to left as its pitch moves from high to low.
However, nonrighthanders as a group do not show the same tendency. In this sense, the glissando
illusion is similar to the octave and scale illusions, since it reflects a tendency to hear higher tones as on
the dominant side of space and lower tones as on the nondominant side. However, in the octave and
scale illusions the apparent spatial positions of the higher and lower tones generally remain fixed for the
duration of the pattern, whereas in the glissando illusion the gliding tone is perceived as moving slowly
in space in accordance with its pitch motion.
12
In considering why the glissando illusion occurs we can refer to the same principles as were discussed
with respect to the scale illusion. In this case we link together portions of the glissando that are proximal
in pitch, and that follow smooth trajectories. In the real world this perceptual strategy is likely to lead to
the best conclusion in interpreting our auditory environment, since it is very unlikely that a sound which
is changing smoothly in pitch is switching abruptly between two widely different locations.
Illusions based on octave ambiguity
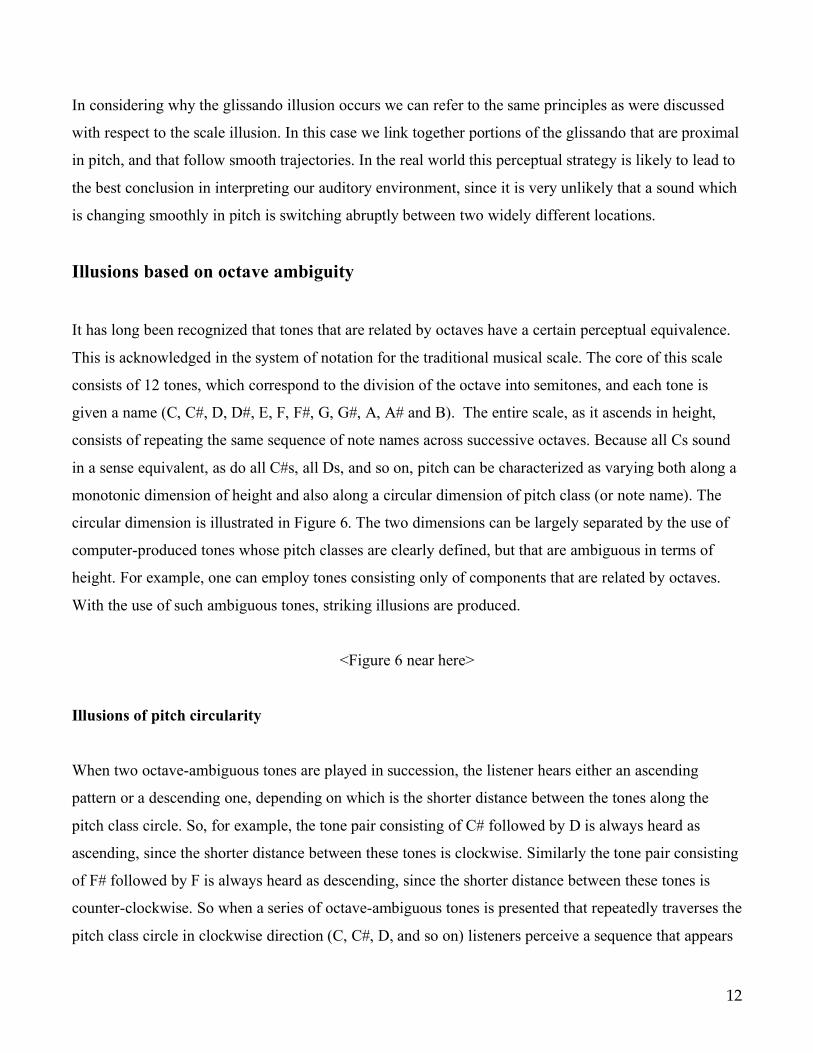
It has long been recognized that tones that are related by octaves have a certain perceptual equivalence.
This is acknowledged in the system of notation for the traditional musical scale. The core of this scale
consists of 12 tones, which correspond to the division of the octave into semitones, and each tone is
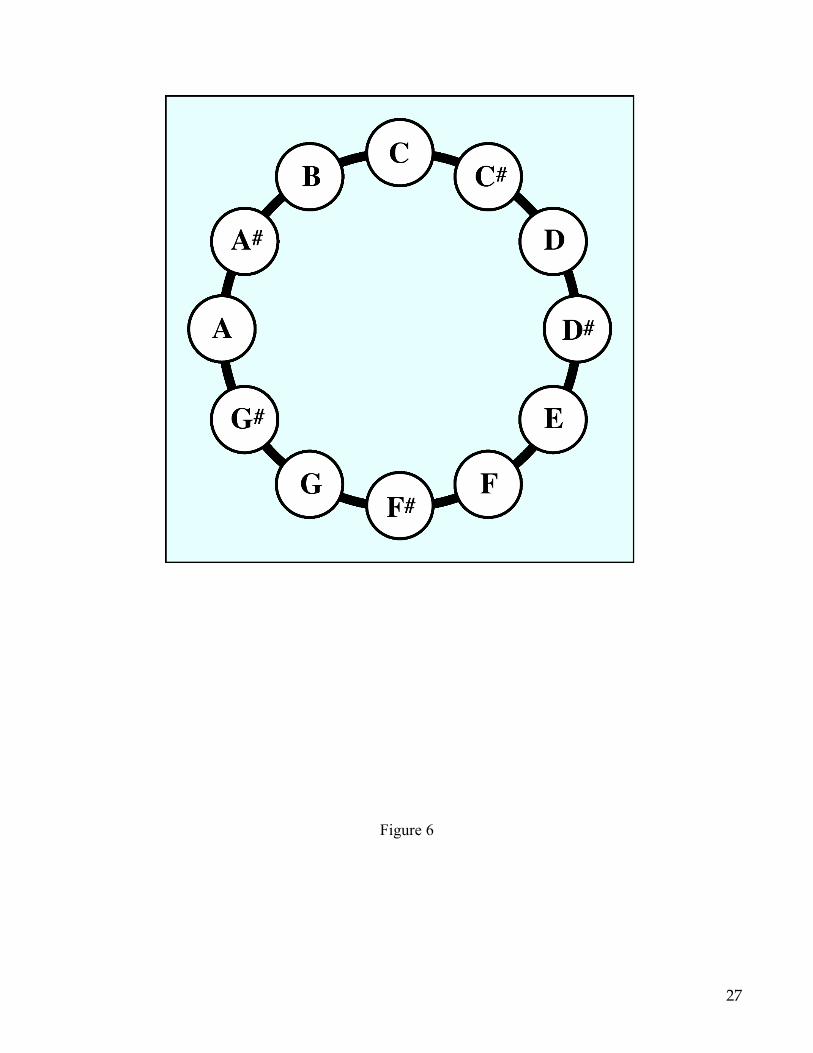
given a name (C, C#, D, D#, E, F, F#, G, G#, A, A# and B). The entire scale, as it ascends in height,
consists of repeating the same sequence of note names across successive octaves. Because all Cs sound
in a sense equivalent, as do all C#s, all Ds, and so on, pitch can be characterized as varying both along a
monotonic dimension of height and also along a circular dimension of pitch class (or note name). The
circular dimension is illustrated in Figure 6. The two dimensions can be largely separated by the use of
computer-produced tones whose pitch classes are clearly defined, but that are ambiguous in terms of
height. For example, one can employ tones consisting only of components that are related by octaves.
With the use of such ambiguous tones, striking illusions are produced.
<Figure 6 near here>
Illusions of pitch circularity
When two octave-ambiguous tones are played in succession, the listener hears either an ascending
pattern or a descending one, depending on which is the shorter distance between the tones along the
pitch class circle. So, for example, the tone pair consisting of C# followed by D is always heard as
ascending, since the shorter distance between these tones is clockwise. Similarly the tone pair consisting
of F# followed by F is always heard as descending, since the shorter distance between these tones is
counter-clockwise. So when a series of octave-ambiguous tones is presented that repeatedly traverses the
pitch class circle in clockwise direction (C, C#, D, and so on) listeners perceive a sequence that appears
13
to ascend endlessly in pitch. When, instead, the tones repeatedly traverse the pitch class circle in
counterclockwise direction (C, B, A#, and so on) listeners hear a sequence that appears to descend
endlessly. So just as with the scale illusion, this circularity illusion provides an example of the
perceptual tendency to link together elements of an array of tones on the basis of pitch proximity.
The tritone paradox
We can then ask what happens when listeners are presented with pairs of octave-ambiguous tones that
are related in such a way that proximity cannot be used as a cue in judging their relative heights. For
example, what happens when listeners are presented with two tones in succession that stand in opposite
positions along the pitch class circle, so that the same distance between them along the circle is traversed
in either direction? Such tones form an interval of six semitones, known as a tritone. When such tone
pairs are presented, striking perceptual differences between listeners emerge. For example, when D is
presented followed by G#, some listeners clearly hear an ascending pattern, while other listeners clearly
hear a descending one. Yet when instead A is presented followed by D#, the first group of listeners now
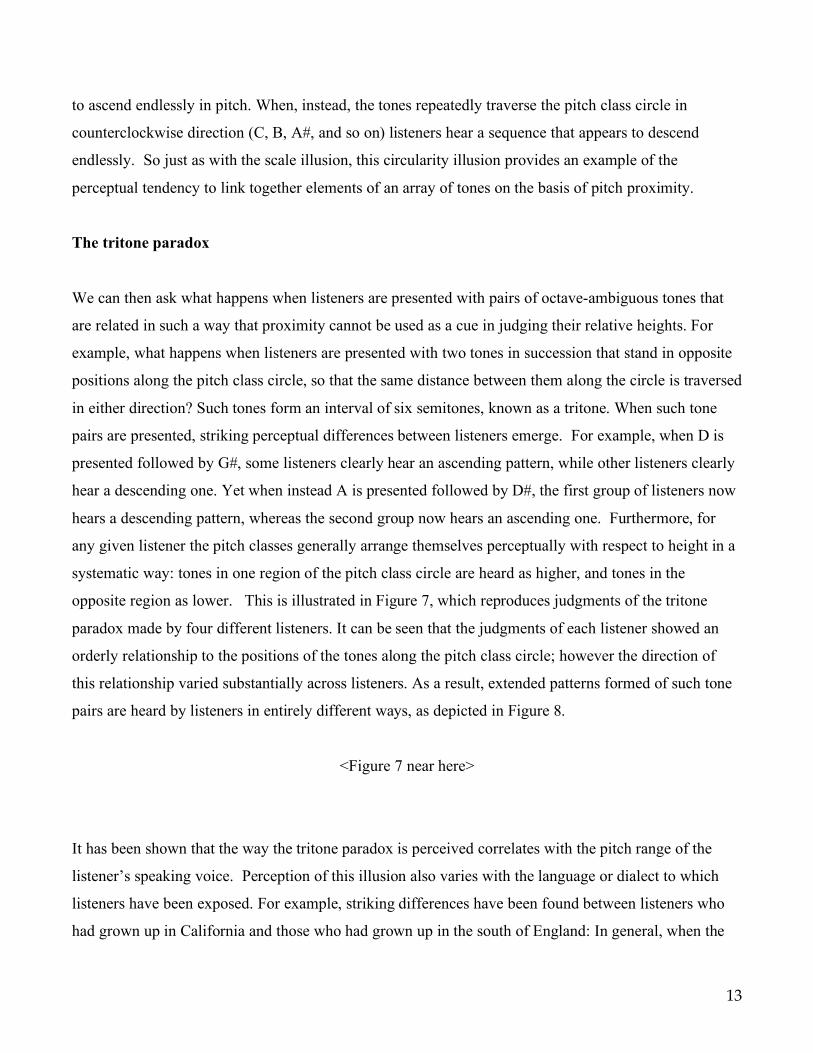
hears a descending pattern, whereas the second group now hears an ascending one. Furthermore, for
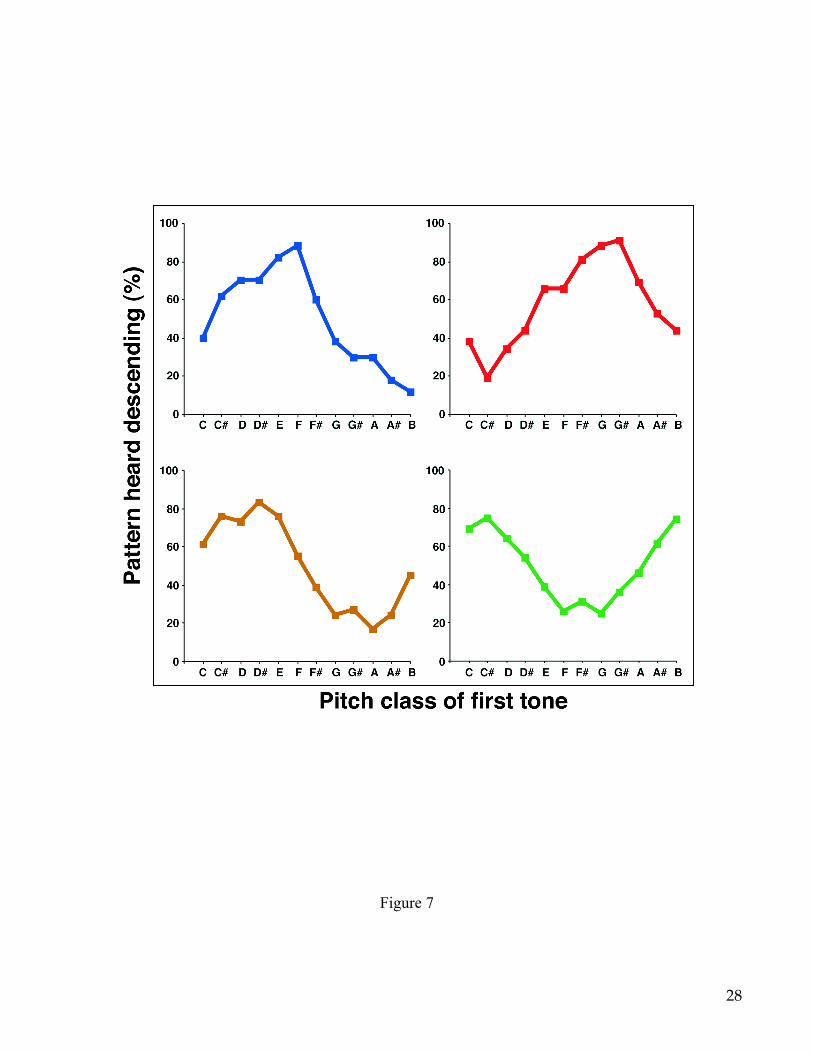
any given listener the pitch classes generally arrange themselves perceptually with respect to height in a
systematic way: tones in one region of the pitch class circle are heard as higher, and tones in the
opposite region as lower. This is illustrated in Figure 7, which reproduces judgments of the tritone
paradox made by four different listeners. It can be seen that the judgments of each listener showed an
orderly relationship to the positions of the tones along the pitch class circle; however the direction of
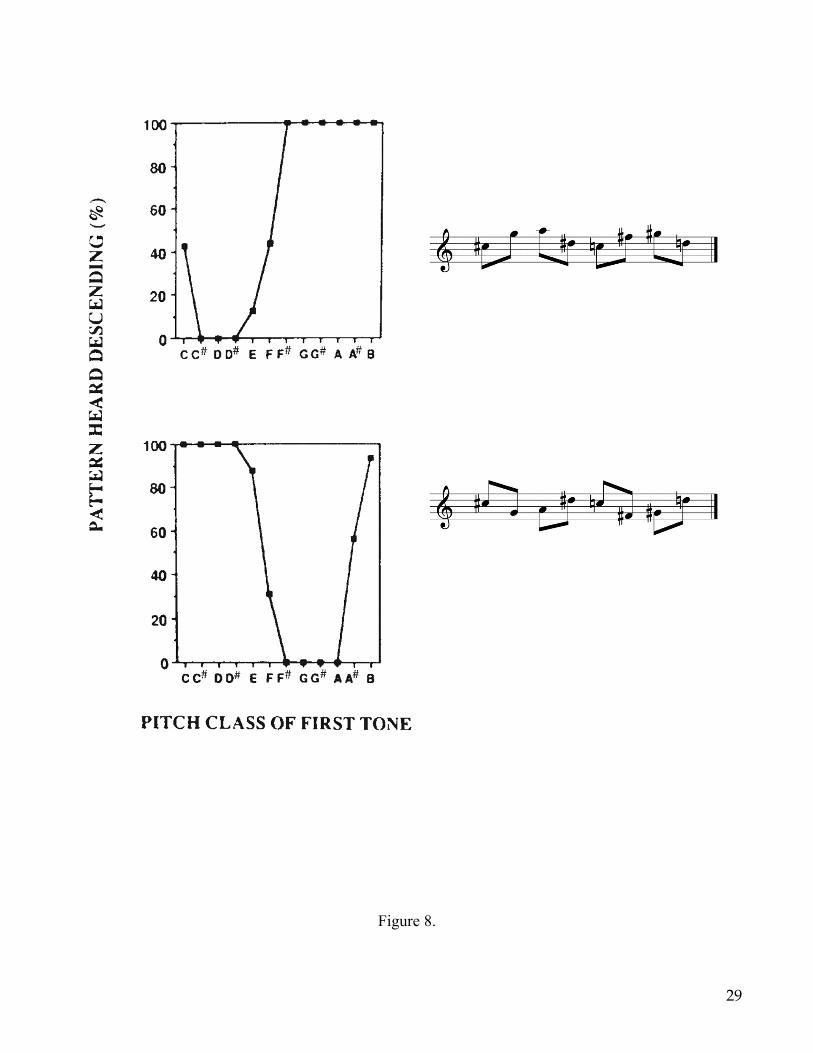
this relationship varied substantially across listeners. As a result, extended patterns formed of such tone
pairs are heard by listeners in entirely different ways, as depicted in Figure 8.
<Figure 7 near here>
It has been shown that the way the tritone paradox is perceived correlates with the pitch range of the
listener’s speaking voice. Perception of this illusion also varies with the language or dialect to which
listeners have been exposed. For example, striking differences have been found between listeners who
had grown up in California and those who had grown up in the south of England: In general, when the
14
Californian group tended to hear a pattern as ascending the English group tended to hear it as
descending, and vice versa. It appears,
therefore, that perception of the tritone paradox is based on an acquired pitch template that is used
primarily for speech communication.
<Figure 8 near here>
Further work has provided evidence that the pitch representation that influences perception of the tritone
paradox is formed early in life. On study explored perception of the tritone paradox in mothers and their
children. The subjects were all Californian; however, their mothers had grown up in many different
geographical regions, including England, the European continent, and various parts of the United States.
As expected, the mothers perceived this pattern in ways that differed considerably; however although
the subjects were all Californian, their percepts were very similar to those of their mothers. In a further
study, perception of this illusion was explored in subjects who were born in Vietnam, as well as in a
group of English-speaking Californians. The Vietnamese group were divided into two subgroups: those
who had arrived in the US. as adults and spoke fluent Vietnamese but little English, and those who had
arrived as infants or young children and now spoke perfect English though most were not fluent in
Vietnamese. Perception of the tritone paradox by the two Vietnamese groups was very similar, and
clearly differed from its perception by English-speaking Californians. The study therefore indicates that
exposure to speech sounds during an early critical period can have a substantial influence on perception
of music in adulthood.
Conclusion
The perceptual phenomena described in this entry demonstrate that the auditory system is very prone to
illusion. This is not surprising, considering the paucity of information that is supplied by the peripheral
auditory system. There are roughly 16,000 peripheral receptors in each ear, compared with roughly 125
million receptors in each eye. In addition, the amount of brain tissue devoted to hearing is far less than is
devoted to vision. As a further consideration, sound signals are mixed together and are subject to
numerous distortions as they travel from their sources to our ears, so that the brain is faced with the very
15
difficult task of reconstructing the original signals from the mixture of sounds that arrive at the ears. The
musical illusions described here provide valuable information concerning the strategies adopted by the
nervous system in interpreting our auditory environment, and they reflect the operation of both innate
mechanisms and neural plasticity in the process.
16
Further Reading
Deutsch, D. (1974). An auditory illusion. Nature, 251, 307-309.
Deutsch, D. (1975a). Two-channel listening to musical scales. Journal of the Acoustical Society of
America, 57, 1156-1160.
Deutsch, D. (1975b). Musical Illusions. Scientific American , 233, 92-104.
Deutsch, D. (1983a). Auditory illusions, handedness, and the spatial environment. Journal of the Audio
Engineering Society, 31, 607-618.
Deutsch, D. (1983b). The octave illusion in relation to handedness and familial handedness background.
Neuropsychologia, 21, 289-293
Deutsch, D. (1991). The tritone paradox: An influence of language on music perception. Music
Perception, 8, 335-347.
Deutsch, D. (1992a). Some new sound paradoxes and their implications. In Auditory Processing of
Complex Sounds. Philosophical Transactions of the Royal Society, Series B, 336, 391-397.
Deutsch, D. (1992b). Paradoxes of musical pitch. Scientific American, 267, 88-95.
Deutsch, D. (1999a). Grouping mechanisms in music. In Deutsch, D. (ed.) The psychology of music, 2nd
ed, pp 299-348. San Diego: Academic Press.
Deutsch, D. (1999b). Processing of pitch combinations. In D. Deutsch (ed.) The psychology of music,
2nd ed, pp 349-412. San Diego, Academic Press.
Deutsch, D., Henthorn, T., & Dolson, M. (2004). Speech patterns heard early in life influence later
perception of the tritone paradox. Music Perception, 21, 357-372.
17
Peretz, I. and Zatorre, R. (2003). The cognitive neuroscience of music. Oxford: Oxford University Press.
Rauschecker, J. P., & Tian, B. (2000). Mechanisms and streams or processing “what” and “where” in
the auditory cortex. Proceedings of the National Academy of Sciences, 97, 1180-1186.
Shepard, R. N. (1964). Circularity in judgments of relative pitch. Journal of the Acoustical Society of
America, 36, 2346-2353.

18
Website citations
Deutsch’s Musical Illusions
http://psy.ucsd.edu/~ddeutsch/psychology/deutsch_research1.html
19
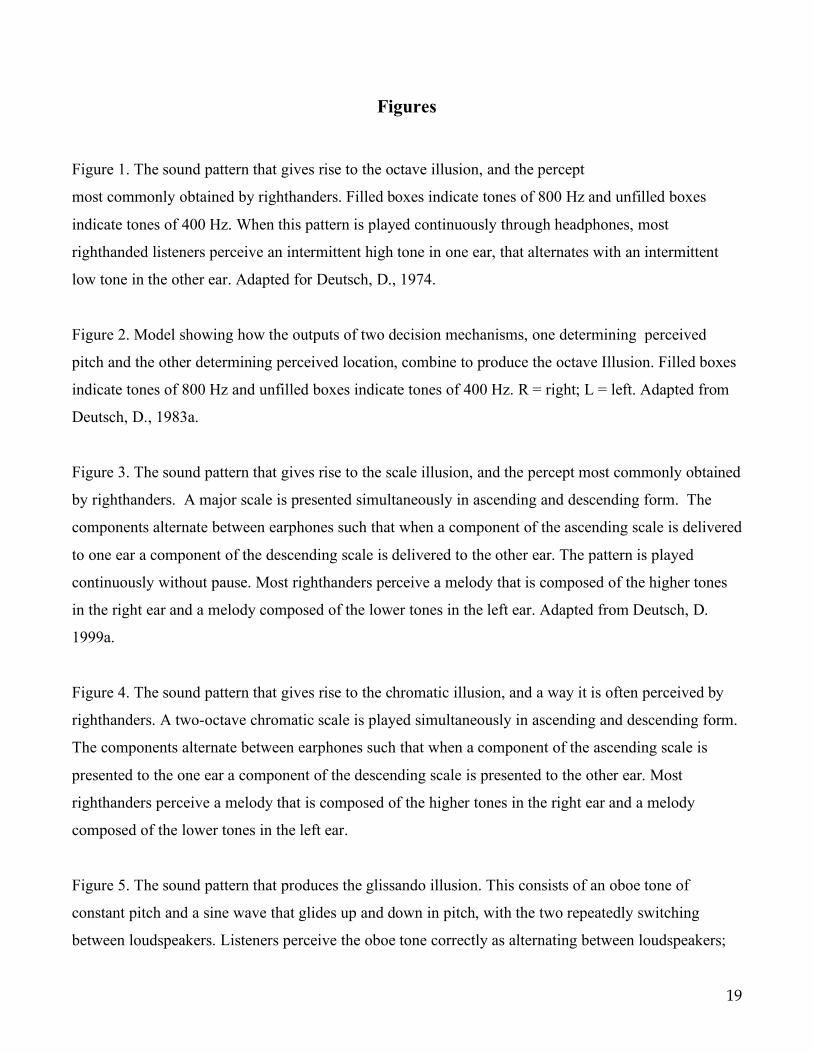
Figures
Figure 1. The sound pattern that gives rise to the octave illusion, and the percept
most commonly obtained by righthanders. Filled boxes indicate tones of 800 Hz and unfilled boxes
indicate tones of 400 Hz. When this pattern is played continuously through headphones, most
righthanded listeners perceive an intermittent high tone in one ear, that alternates with an intermittent
low tone in the other ear. Adapted for Deutsch, D., 1974.
Figure 2. Model showing how the outputs of two decision mechanisms, one determining perceived
pitch and the other determining perceived location, combine to produce the octave Illusion. Filled boxes
indicate tones of 800 Hz and unfilled boxes indicate tones of 400 Hz. R = right; L = left. Adapted from
Deutsch, D., 1983a.
Figure 3. The sound pattern that gives rise to the scale illusion, and the percept most commonly obtained
by righthanders. A major scale is presented simultaneously in ascending and descending form. The
components alternate between earphones such that when a component of the ascending scale is delivered
to one ear a component of the descending scale is delivered to the other ear. The pattern is played
continuously without pause. Most righthanders perceive a melody that is composed of the higher tones
in the right ear and a melody composed of the lower tones in the left ear. Adapted from Deutsch, D.
1999a.
Figure 4. The sound pattern that gives rise to the chromatic illusion, and a way it is often perceived by
righthanders. A two-octave chromatic scale is played simultaneously in ascending and descending form.
The components alternate between earphones such that when a component of the ascending scale is
presented to the one ear a component of the descending scale is presented to the other ear. Most
righthanders perceive a melody that is composed of the higher tones in the right ear and a melody
composed of the lower tones in the left ear.
Figure 5. The sound pattern that produces the glissando illusion. This consists of an oboe tone of
constant pitch and a sine wave that glides up and down in pitch, with the two repeatedly switching
between loudspeakers. Listeners perceive the oboe tone correctly as alternating between loudspeakers;
20
however the glissando appears to be joined together quite seamlessly, and to be moving around in space
in accordance with its pitch motion.
Figure 6. The pitch class circle. The notes of the Western musical scale are formed by dividing the
octave into twelve semitone steps, and each note is given a name: C, C#, D; and so on. The entire scale
is formed by repeating this sequence of note names across octaves.
Figure 7. Judgments of the tritone paradox made by four different listeners. Each graph shows the
percentages of judgments that a tone pair formed a descending pattern, plotted as a function of the pitch
class of the first tone of the pair. The judgments of all subjects showed orderly relationships to the
positions of the tones along the pitch class circle; however the direction of this relationship varied
substantially across subjects. Data supplied by the author.
Figure 8. Perception of the tritone paradox by two listeners who experienced the illusion in a
pronounced way. Each graph shows the percentages of judgments that a tone pair formed a descending
pattern, plotted as a function of the pitch class of the first tone of the pair. The notations show how the
identical series of tone pairs was perceived by these two subjects in entirely different ways. From
Deutsch, 1999b.
21
Table 1. Percentages of subjects reporting the high tone on the right and the low tone on the left on listening to the octave illusion, tabulated by handedness and familial handedness background. From Deutsch, 1983b.
Dextral
Left- or Mixed-handed
Parent
Left- or Mixed-handed
Sibling
Right handed
87.2% (N = 86)
64.0% (N = 25)
79.3% (N = 29)
Mixed handed
67.7% (N = 31)
44.4% (N = 9)
58.3% (N = 12)
Lefthanded
55.6% (N = 9)
50.0% (N = 16)
33.3% (N = 6)
22
Figure 1
23
Figure 2
24
Figure 3
25
Figure 4
26
Figure 5
27
Figure 6
28
Figure 7
29
Figure 8.