Embed Size (px)
Citation preview
E n e r g y R e s e a r c h a n d D e v e l o p m e n t D i v i s i o n
F I N A L P R O J E C T R E P O R T
NEW ENGINE TECHNOLOGY FOR CALIFORNIA’S COMBINED HEAT AND POWER MARKET
MARCH 2013
CEC-500-2013-119
Prepared for: California Energy Commission
Prepared by: Tecogen, Inc.
PREPARED BY: Primary Author(s): Jean Roy Tecogen, Inc.. 45 First Avenue Waltham, MA 02451 781-466-6431 www.tecogen.com Contract Number: PIR-08-022 Prepared for: California Energy Commission Rizaldo Aldas, Ph.D. Contract Manager Linda Spiegel Office Manager Energy Generation Research Office Laurie ten Hope Deputy Director ENERGY RESEARCH AND DEVELOPMENT DIVISION Robert P. Oglesby Executive Director
DISCLAIMER
This report was prepared as the result of work sponsored by the California Energy Commission. It does not necessarily represent the views of the Energy Commission, its employees or the State of California. The Energy Commission, the State of California, its employees, contractors and subcontractors make no warrant, express or implied, and assume no legal liability for the information in this report; nor does any party represent that the uses of this information will not infringe upon privately owned rights. This report has not been approved or disapproved by the California Energy Commission nor has the California Energy Commission passed upon the accuracy or adequacy of the information in this report.

ACKNOWLEDGEMENTS
Tecogen gratefully acknowledges the following participants:
• The Public Interest Energy Research (PIER) Program of the California Energy Commission, Grant Agreement #PIR-08-022, Rizaldo Aldas, Commission Project Manager, for financial support, as well as project guidance and oversight
• AVL California Technology Center, Bruce Falls, Phillip Schnell, and Brian Moran for engine selection, development, and dynamometer testing
• Richard Geiss for support in collaboration with AVL in the engine development phase
• SAE International for publishing our technical paper in their journal, along with inviting us to present at the 2012 International Powertrains, Fuels, and Lubricants Meeting in Malmo, Sweden.
• DE Solutions, Keith Davidson, President, for business development support, technical guidance, technology transfer, and commercial readiness activities.
i
PREFACE
The California Energy Commission’s Energy Research and Development Division supports public interest energy research and development that will help improve the quality of life in California by bringing environmentally safe, affordable, and reliable energy services and products to the marketplace.
The Energy Research and Development Division conducts public interest research, development, and demonstration (RD&D) projects to benefit California.
The Energy Research and Development Division strives to conduct the most promising public interest energy research by partnering with RD&D entities, including individuals, businesses, utilities, and public or private research institutions.
Energy Research and Development Division funding efforts are focused on the following RD&D program areas:
• Buildings End-Use Energy Efficiency
• Energy Innovations Small Grants
• Energy-Related Environmental Research
• Energy Systems Integration
• Environmentally Preferred Advanced Generation
• Industrial/Agricultural/Water End-Use Energy Efficiency
• Renewable Energy Technologies
• Transportation
New Engine Technology for California’s Combined Heat and Power Market is the final report for grant number PIR-08-022, conducted by Tecogen, Inc., with the assistance of primary subcontractor AVL California Technology Center. The information from this project contributes to Energy Research and Development Division’s Environmentally Preferred Advanced Generation Program.
For more information about the Energy Research and Development Division, please visit the Energy Commission’s website at www.energy.ca.gov/research/ or contact the Energy Commission at 916-327-1551.
ii
ABSTRACT
The goal of this project was to develop an automotive-based engine for small combined heat and power applications with advanced performance features and emissions compliant with the California Air Resources Board 2007 Emissions Guideline. Researchers selected the Ford 2.5L engine. It was equipped to operate with the Atkinson thermodynamic cycle and included a 12.3:1 compression ratio, variable valve timing, an aluminum block and head, and four valves per cylinder. The Atkinson cycle is an internal combustion engine process where the expansion ratio exceeds the compression ratio, resulting in improved efficiency at the expense of power.
Researchers adapted the engine to a natural gas fueling system and developed a custom engine control module. They tested the engine in a state-of-the-art dynamometer test cell fully equipped with precision emission measurement equipment for verifying California Air Resources Board compliance. The horsepower and efficiency goals of the program were achieved with an efficiency improvement of 17 percent relative to the industrial version of a similar engine operating on a standard Otto cycle. The California Air Resources Board 2007 emission goal was attained by incorporating a proprietary dual stage catalyst system.
The engine was endurance tested for 4070 hours. It successfully demonstrated overall mechanical durability but the exhaust valve wear was unacceptable for combined heat and power applications. Tecogen planned a follow-on program with AVL California Technology Center to develop a post-assembly line solution to this issue. AVL planned to adapt the control system to the latest Ford Atkinson model.
Tecogen planned to unveil this advanced engine on the heat pump water heater product line in 2014, which will boost its coefficient of performance by 10 percent, providing significant energy savings and carbon reduction. Tecogen planned to develop a 35 kilowatt combined heat and power product around this engine platform for release in 2015.
Keywords: Atkinson cycle, natural gas engine, small CHP engine, VVT, CARB 2007, Tecogen, AVL, Ford, engine heat pump
iii

TABLE OF CONTENTS
Acknowledgements ................................................................................................................................... i
PREFACE ....................................................................................................................................................ii
ABSTRACT .............................................................................................................................................. iii
TABLE OF CONTENTS .......................................................................................................................... iv
LIST OF FIGURES ................................................................................................................................... vi
LIST OF TABLES .................................................................................................................................. viii
EXECUTIVE SUMMARY ........................................................................................................................ 1
Introduction ........................................................................................................................................ 1
Project Purpose ................................................................................................................................... 1
Project Results ..................................................................................................................................... 2
Project Benefits ................................................................................................................................... 4
CHAPTER 1: Introduction ....................................................................................................................... 5
1.1 Background and Overview ....................................................................................................... 5
1.2 Project Objectives ....................................................................................................................... 5
1.3 Report Organization .................................................................................................................. 6
CHAPTER 2: Project Approach .............................................................................................................. 7
CHAPTER 3: Engine Selection ............................................................................................................... 8
3.1 Atkinson Cycle Analysis ........................................................................................................... 8
3.2 More Advanced Features ........................................................................................................ 16
3.3 Engine Selection Process ......................................................................................................... 16
3.3.1 Targets and Ratings ......................................................................................................... 19
3.3.2 Value Calculation ............................................................................................................. 22
3.4 Engine Selection (Task 2) Outcome ....................................................................................... 22
CHAPTER 4: Adaptation to Natural Gas Fueling ............................................................................. 25
4.1 Natural Gas Fuel System Selection ........................................................................................ 25
4.2 Engine Natural Gas Fuel Adaptation .................................................................................... 27
4.3 Testing Configuration.............................................................................................................. 30
4.3.1 Natural Gas Fuel Supply System ................................................................................... 30
4.3.2 Load Absorber and Engine Stand .................................................................................. 32
iv

4.3.3 Instrumentation ................................................................................................................ 34
4.4 Engine Operation and Test Results ....................................................................................... 37
4.4.1 Gasoline Calibration Results (Baseline Confirmation) ............................................... 37
4.4.2 Natural Gas Fuel Characteristics (vs. Gasoline) .......................................................... 38
4.4.3 Natural Gas Calibration Results .................................................................................... 39
CHAPTER 5: Adaptation to Atkinson Cycle Operation .................................................................. 43
5.1 Background ............................................................................................................................... 43
5.2 Spark and Valve Timing Optimization ................................................................................. 47
5.3 Engine Efficiency ...................................................................................................................... 47
5.4 Test Results – Engine Power and Efficiency ........................................................................ 47
5.5 Emission Control System ........................................................................................................ 51
5.6 Engine Development Conclusions......................................................................................... 54
CHAPTER 6: Adaptation to CHP Application .................................................................................. 56
6.1 Driveline .................................................................................................................................... 56
6.2 Heat Recovery System ............................................................................................................. 58
6.3 Exhaust Heat Exchanger ......................................................................................................... 60
6.4 Water-Cooled Exhaust Manifold ........................................................................................... 60
Figure 32 Dry Exhaust Manifold ...................................................................................................... 61
6.5 Extended Oil Change System ................................................................................................. 62
6.6 Exhaust System ......................................................................................................................... 63
6.7 Natural Gas External Piping System ..................................................................................... 63
6.8 Control Harness ....................................................................................................................... 64
CHAPTER 7: Laboratory Validation of System Durability ............................................................ 66
7.1 Test Plan .................................................................................................................................... 66
7.1.1 Performance ...................................................................................................................... 66
7.1.2 Mechanical Durability ..................................................................................................... 67
7.2 Test Cell Description ................................................................................................................ 68
7.3 Test Method .............................................................................................................................. 70
7.4 Instrumentation ........................................................................................................................ 71
7.5 Test Results ............................................................................................................................... 73
v

7.5.1 Valve wear ......................................................................................................................... 73
7.5.2 Lubrication Oil Analysis ................................................................................................. 77
7.5.3 Oil Consumption .............................................................................................................. 79
7.5.4 Performance ...................................................................................................................... 79
7.5.5 Emissions ........................................................................................................................... 86
7.5.6 Vibration ............................................................................................................................ 87
CHAPTER 8: Technology Transfer ...................................................................................................... 88
CHAPTER 9: Commercial Readiness Plan ......................................................................................... 89
9.1 Technical Readiness Assessment ........................................................................................... 89
9.2 Market Readiness Assessment ............................................................................................... 94
9.2.1 Regulatory and Institutional Factors ............................................................................. 94
9.2.2 Business and Commercial Relationships ...................................................................... 95
9.2.3 Technical Market Potential ............................................................................................. 96
9.2.4 Economic Market Potential ............................................................................................. 96
9.2.5 Engine Cost ....................................................................................................................... 97
9.2.6 Targeted Customers ......................................................................................................... 97
9.2.7 Competition ...................................................................................................................... 97
9.3 Public Benefits Assessment ..................................................................................................... 99
CHAPTER 10: Conclusions and Recommendations ...................................................................... 101
GLOSSARY ............................................................................................................................................ 103
LIST OF FIGURES
Figure 1 Atkinson Cycle vs. Otto Cycle ................................................................................................. 9
Figure 2 Otto Cycle vs. Atkinson Cycle – Mechanical Ratios ........................................................... 11
Figure 3 Atkinson Cycle vs. Otto Cycle Efficiency Improvement ................................................... 14
Figure 4 Torque Trade-off of Atkinson Cycle vs. Otto Cycle .......................................................... 15
Figure 5 Power and Torque Requirements......................................................................................... 17
Figure 6 - Assembly of Fuel Control Valve, Mixer, and Coupler ...................................................... 27
Figure 7 - NG Fuel Control Valve and Mixer Adaptation on Engine ............................................... 27
Figure 8 - Camshaft Timing Wheel ........................................................................................................ 29
Figure 9 - Crankshaft Timing Wheel ..................................................................................................... 29
vi
Figure 10 - Blow-off Valve ...................................................................................................................... 30
Figure 11 - NG Fuel Supply .................................................................................................................... 31
Figure 12 - Flow Meter and Second Stage Regulator .......................................................................... 31
Figure 13 - System Fuel and Ignition Components ............................................................................. 31
Figure 14 - Test Rig (1) ............................................................................................................................. 33
Figure 15 - Test Rig (2) ............................................................................................................................. 34
Figure 16 Customized Display Interface for Ford 2.5L Engine Testing .......................................... 35
Figure 17 Instrumentation Block Diagram .......................................................................................... 36
Figure 18 - Baseline Performance on Natural Gas ............................................................................... 40
Figure 19 - Baseline Emission Levels ..................................................................................................... 42
Figure 20 - VVT Camshaft Phaser (conceptual) ................................................................................... 44
Figure 21 - Ford 2.5L VVT Timing Diagram ........................................................................................ 45
Figure 22 - Heat Pump Output and Engine Power vs. Saturated Suction Temperature ............... 46
Figure 23 - WOT Power vs RPM and IVC ............................................................................................ 48
Figure 24 - WOT Efficiency (@ LHV) vs. RPM and IVC ..................................................................... 48
Figure 25 WOT Engine Efficiency vs. Horsepower ............................................................................ 49
Figure 26 - Part Throttle Efficiency vs. Engine Power @ 1750 RPM ................................................. 50
Figure 27 - Emission Test Results .......................................................................................................... 53
Figure 28 Engine Driven Heat Pump Cycle ........................................................................................ 57
Figure 29 Driveline Structural Frame ................................................................................................... 58
Figure 30 Engine Heat Recovery P&ID ................................................................................................ 59
Figure 31 Exhaust HX/Catalyst ............................................................................................................ 60
Figure 32 Dry Exhaust Manifold ........................................................................................................... 61
Figure 33 Water-cooled Manifold Design ............................................................................................ 61
Figure 34 Extended Oil Change System .............................................................................................. 62
Figure 35 Second Stage Catalyst/Silencer Design .............................................................................. 63
Figure 36 Fuel System Photos ............................................................................................................... 64
Figure 37 Control Harness Conceptual Diagram ............................................................................... 65
Figure 38 Ilios Horsepower Operating Range .................................................................................... 67
Figure 39 Engine Endurance Test Cell ................................................................................................. 69
vii

Figure 40 Engine Driveline ..................................................................................................................... 70
Figure 41 Engine System Boundary Diagram ..................................................................................... 72
Figure 42 Typical Engine with Overhead Cam Design and Bucket/Shim Arrangement ............. 74
Figure 43 Typical Valve Bucket with Shim .......................................................................................... 74
Figure 44 Valve Wear Comparison – Atkinson Cycle Engine vs. Otto Cycle Engine .................. 76
Figure 45 Lubricant Analysis Report .................................................................................................... 78
Figure 46 Torquemeter Installed on Engine Output Shaft ................................................................ 79
Figure 47 Torquemeter Calibration ...................................................................................................... 80
Figure 48 Horsepower Measurements at 2000 rpm ........................................................................... 81
Figure 49 Horsepower Measurements at 1800 rpm ........................................................................... 82
Figure 50 Efficiency Measurement at 2000 rpm .................................................................................. 83
Figure 51 Efficiency Measurements at 1800 rpm ............................................................................... 83
Figure 52 Normalized Horsepower Output vs. Operating Hours ................................................... 84
Figure 53 Normalized Efficiency vs. Run Hours ................................................................................ 85
Figure 54 Variable Cam Timing Test Results ...................................................................................... 86
LIST OF TABLES
Table ES-1 Ford 2.5 Liter Engine Specifications .................................................................................... 2
Table 1 Thermodynamic Cycle Descriptions ........................................................................................ 8
Table 2 Targets with Corresponding Ratings ..................................................................................... 18
Table 3 #1 and #2 Ranked Engines ...................................................................................................... 24
Table 4. - Baseline Test Results with Gasoline Fuel ............................................................................ 37
Table 5 Horsepower – Gasoline vs. Natural Gas ............................................................................... 39
Table 6 Efficiency – Gasoline vs. Natural Gas ..................................................................................... 41
Table 7 - Emission Targets ...................................................................................................................... 42
Table 8 Compliance Limits for Criteria Pollutants (CARB 2007 and SCAQMD) .......................... 52
Table 9 - Emission Results with Final Calibrations ............................................................................. 54
Table 10 Performance Rating Tests ....................................................................................................... 55
Table 11 Test Cell Instrumentation and Measurements ..................................................................... 71
viii

Table 12 Intake Valve Clearance Measurements ................................................................................ 75
Table 13 Exhaust Valve Clearance Measurements ............................................................................. 75
Table 14 Metallurgical Analysis Comparison of Exhaust Valve Seat ............................................. 77
Table 15 Wear Metal Sources ................................................................................................................. 77
Table 16 Oil Consumption Improvement ............................................................................................ 79
Table 17 Torquemeter Calibration Points ............................................................................................ 80
Table 18 Technical Readiness Milestone Chart ................................................................................... 90
Table 19 California Technical Potential ................................................................................................ 96
Table 20 California Economic Potential ............................................................................................... 97
Table 21 Competitive Products ............................................................................................................. 99
Table 22 Benefits Assessment ............................................................................................................... 100
ix

EXECUTIVE SUMMARY
Introduction Combined heat and power (CHP) is a well-established and proven solution for reducing carbon emissions. It is an option that is not only accessible to large-scale infrastructure and public utilities, but offers small businesses and local municipal institutions the ability to reduce their carbon footprint while cutting their energy costs by 40 percent. These benefits can be achieved with a moderate investment in capital equipment and ongoing maintenance.
CHP accounts for approximately 10 percent of the world’s electricity generation and has the potential to grow to 24 percent of global generation by 2030 given proper policy and market incentives.1 The projected penetration of new CHP by 2029 in California in the small size range of 50 kilowatt (kW) to 500 kW is 476 megawatt (MW) in the base case or 684 MW if incentives such as carbon credits and power export credits are considered. The active CHP sites in this size range are less than 5 percent of the total or approximately 400 MW, and the market for small CHP is projected to double over the next 15 years.2
The penetration of small CHP in California has stalled in the last decade, especially for those systems powered by reciprocating engines. Several factors contributed to this phenomenon, including natural gas pricing, interconnection policy, and the push towards more stringent air emission regulations and rigorous compliance enforcement. In addition, the engines commonly used in smaller CHP applications are typically derived from outdated automotive designs. These legacy engines typically have lackluster efficiencies and have difficulty meeting more recent emission regulations for CHP systems. Significant technological advances have been made in the automotive engine sector such as greater efficiencies, improved oil control, sophisticated-cycle combustion, and better fuel control strategies. Adapting these engines to stationary CHP systems will help to provide momentum for reenergizing the small CHP market.
Tecogen’s established product line had a singular engine platform, a GM 7.4-liter engine which is a converted gasoline engine that originated in the 1960s. This engine was optimized for industrial CHP application through many years of research and development (R&D). The design has been upgraded and refined numerous times. In 2009 Tecogen had a breakthrough in emission technology with the development of an ultra-low emission system that was able to achieve CARB 2007 emission levels. This R&D was funded by PIER and Southern California Gas Company under California Energy Commission PIER project PNG-06-002. A smaller size engine was essential to allowing Tecogen to offer products at below 50 kW for the electrical generation and heat pump markets in order to broaden market reach.
Project Purpose The primary goal of the program was to introduce a modern automotive-based small engine to the CHP market with exceptional efficiency for significant energy cost savings and a reduced
1 “Cogeneration and District Energy: Sustainable energy technologies for today…and tomorrow,” International Energy Agency, 2009.
2 “Combined Heat and Power Market Assessment,” ICF International 2010, California Energy Commission Contract CEC-500-2009-094-F.
1
carbon footprint. It was also essential that this engine meet the most stringent emission targets established in California via the CARB 2007 regulation. The objective of this project was to identify an advanced engine in the automotive market that also had an available supply chain for lower volume industrial use and adapt it to the stationary application. This involved conversion to natural gas fueling, controls development, and the integration of an emission control system that could meet the requirements of CARB 2007. Another critical element of the program was to ensure that engine durability was suitable for the rigorous duty cycle of CHP applications.
A compelling advance in automotive engine efficiency has been the implementation of an Atkinson cycle3 as the thermodynamic performance model of the engine. The Atkinson cycle is employed in hybrid vehicles such as the Ford Escape and Toyota Prius. This cycle improves efficiency with a trade-off in the power output, which in hybrid vehicles is compensated for with the electric drive. This technology presented a viable approach for small CHP applications given projections of a 10 percent improvement in efficiency.
Project Results Tecogen’s expertise was in the design of CHP products, so a strong capability in engine development and testing was needed in order to successfully implement the program. Tecogen partnered with AVL California Technology Center (AVL), a California-based entity (CBE) that was internationally recognized for the development of powertrain systems with internal combustion engines, as well as instrumentation and test systems. AVL offered valuable insight and proficiency in the engine selection, controls development, and dynamometer testing, with a test cell that was equipped with state-of-the-art instrumentation and a continuous emissions monitoring system (CEMS) for exhaust emission measurements.
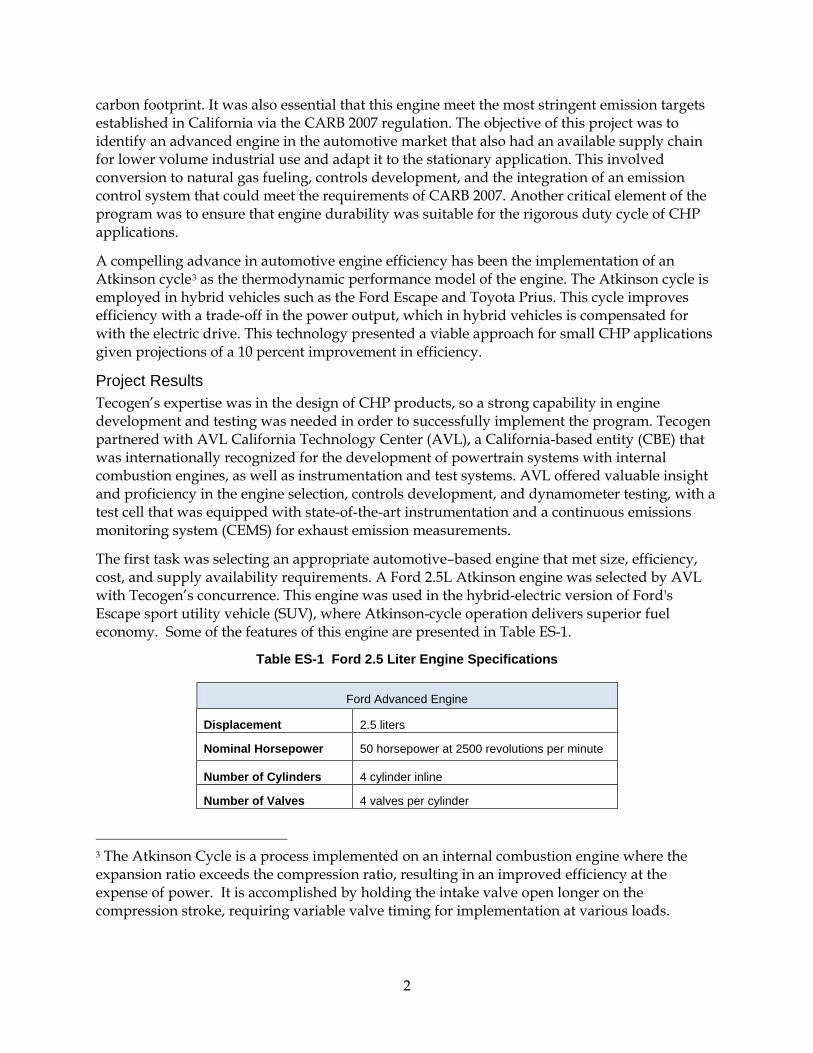
The first task was selecting an appropriate automotive–based engine that met size, efficiency, cost, and supply availability requirements. A Ford 2.5L Atkinson engine was selected by AVL with Tecogen’s concurrence. This engine was used in the hybrid-electric version of Ford's Escape sport utility vehicle (SUV), where Atkinson-cycle operation delivers superior fuel economy. Some of the features of this engine are presented in Table ES-1.
Table ES-1 Ford 2.5 Liter Engine Specifications
Ford Advanced Engine
Displacement 2.5 liters
Nominal Horsepower 50 horsepower at 2500 revolutions per minute
Number of Cylinders 4 cylinder inline
Number of Valves 4 valves per cylinder
3 The Atkinson Cycle is a process implemented on an internal combustion engine where the expansion ratio exceeds the compression ratio, resulting in an improved efficiency at the expense of power. It is accomplished by holding the intake valve open longer on the compression stroke, requiring variable valve timing for implementation at various loads.
2

Construction Aluminum block and head
Features Variable Valve Timing (VVT) Atkinson Cycle
The automotive gasoline fueling system was removed and the engine was up-fitted with a natural gas fumigation type system, including an ECM (engine control module) for air/fuel ratio (AFR) control. A fumigation system delivers metered gas to a mixer mounted on top of the intake manifold, unlike multi-point fuel injection that adds liquid fuel directly into the cylinder. Fuel is introduced and mixed with air present in the engine air supply stream. This air-fuel mixture subsequently enters and travels through the intake manifold and is distributed to the individual cylinders. A fumigation-type system presents additional challenges in controlling AFR because manifold volume and air exchange rates can cause cylinder-to-cylinder and/or cycle-to-cycle variations.
Successful conversion to natural gas fueling was accomplished. Both the horsepower and efficiency goals of the program were met. However, robust emission compliance to CARB 2007 was difficult so researchers decided to implement the new Tecogen ultra low emission technology on the engine for the final characterization testing.
Steady state performance measurements were conducted by implementing the Atkinson cycle using variable valve timing (VVT). An efficiency improvement over a standard Otto cycle engine was achieved as a result of the engine’s high expansion ratio. However, the VVT did not demonstrate a benefit. It was concluded that the losses associated with delaying the closing of the intake valve negated the advanced cycle benefits, even though they were necessary to prevent knock with gasoline fuel. The ultra-low emission technology achieved robust CARB compliance by reducing carbon monoxide (CO) levels to near zero and increasing the AFR control window margin by nearly four times.
Tecogen assessed the various interface connection points to the engine and adapted the subsystems required for stationary CHP applications. This included a belt/pulley driveline, exhaust components, a water-cooled manifold, a coolant system, and an extended oil change system.
The prototype development engine was shipped to Tecogen’s Waltham facility and installed in the endurance test cell after AVL completed work at its California facility. Many of the accessories and subsystems were up-fitted as well. A total of 4070 of run hours were accumulated and the core engine performed very successfully. The bottom end showed no sign of degradation but the engine head, specifically the exhaust valve seats, demonstrated unacceptable wear that would require a post-production enhancement for commercial readiness. Horsepower and efficiency measurements indicated no decline in performance providing exhaust valve clearance was maintained to acceptable levels.
An important factor in the engine selection was supply chain availability. Researchers discovered that some of the major automakers (i.e., Toyota, Honda) were not interested in supporting a low-volume industrial engine market. The logistics of intervening in a mass-produced assembly process presented challenges. However, Ford was enthusiastic about the CHP market, based on conditions of minimum order quantities and no customized configurations. This meant that Tecogen would need to adapt any future innovations and upgrades that Ford implemented to the vehicle engine platform.
3

Ford notified Tecogen in the spring of 2012 that they were ending the production of the 2.5L Atkinson engine and transitioning to a 2.0L version. The 2.0L engine had the same advanced features and efficiency, as well as similar mechanical construction including the valve train. CHP products can readily compensate the smaller displacement because of the variable speed feature.
The path to commercialization required Tecogen to renew their collaboration with AVL to address these unresolved issues. AVL will perform a teardown of the endurance test engine (2.5L) as well as the new 2.0L to determine a post-production line upgrade to the head in order to extend its life. They will also establish the process for rework via a secondary engine rebuilder or through the Tecogen factory.
AVL will also adapt the existing engine/emission control system that was developed in this program to the new 2.0L Atkinson, as well as integrate commercial-ready features that the current firmware is now lacking. This includes on-board diagnostics and adaptive learning features for the emission control system, which are necessary for maintaining long-term compliance. Tecogen will fund this follow-on program in order to complete the commercialization process for the Atkinson engine. The program is budgeted for approximately $100,000. This engine is critical to the business plan as its superior efficiency is unmatched in the small CHP market.
Tecogen can now enter the small CHP marketplace with an advanced technology engine platform that boosts efficiencies relative to its standard product line and with clean air emissions comparable to a fuel cell. They plan to commercially introduce this engine in 2014 on the Ilios heat pump water heater and to develop a 35-kW CHP unit for release in 2015.
Project Benefits Expected public benefits realized by 2030 as a result of this project include a yearly energy savings of $93 million, a natural gas savings of 9300 million cubic feet (MMcf), and carbon savings of ½ million tonnes based on the projected market expansion resulting from the advanced small CHP engine. These savings assume an estimated market penetration of 2380 water heating and CHP units in California and 9690 total units worldwide.
4
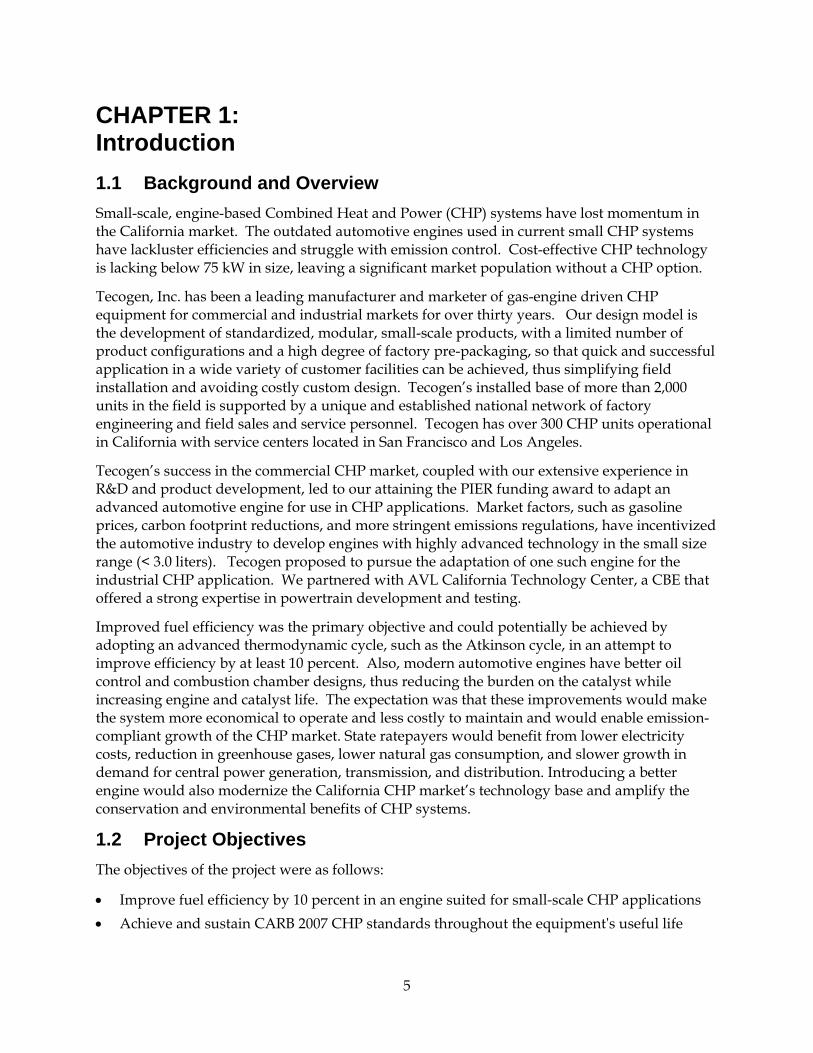
CHAPTER 1: Introduction 1.1 Background and Overview Small-scale, engine-based Combined Heat and Power (CHP) systems have lost momentum in the California market. The outdated automotive engines used in current small CHP systems have lackluster efficiencies and struggle with emission control. Cost-effective CHP technology is lacking below 75 kW in size, leaving a significant market population without a CHP option.
Tecogen, Inc. has been a leading manufacturer and marketer of gas-engine driven CHP equipment for commercial and industrial markets for over thirty years. Our design model is the development of standardized, modular, small-scale products, with a limited number of product configurations and a high degree of factory pre-packaging, so that quick and successful application in a wide variety of customer facilities can be achieved, thus simplifying field installation and avoiding costly custom design. Tecogen’s installed base of more than 2,000 units in the field is supported by a unique and established national network of factory engineering and field sales and service personnel. Tecogen has over 300 CHP units operational in California with service centers located in San Francisco and Los Angeles.
Tecogen’s success in the commercial CHP market, coupled with our extensive experience in R&D and product development, led to our attaining the PIER funding award to adapt an advanced automotive engine for use in CHP applications. Market factors, such as gasoline prices, carbon footprint reductions, and more stringent emissions regulations, have incentivized the automotive industry to develop engines with highly advanced technology in the small size range (< 3.0 liters). Tecogen proposed to pursue the adaptation of one such engine for the industrial CHP application. We partnered with AVL California Technology Center, a CBE that offered a strong expertise in powertrain development and testing.
Improved fuel efficiency was the primary objective and could potentially be achieved by adopting an advanced thermodynamic cycle, such as the Atkinson cycle, in an attempt to improve efficiency by at least 10 percent. Also, modern automotive engines have better oil control and combustion chamber designs, thus reducing the burden on the catalyst while increasing engine and catalyst life. The expectation was that these improvements would make the system more economical to operate and less costly to maintain and would enable emission-compliant growth of the CHP market. State ratepayers would benefit from lower electricity costs, reduction in greenhouse gases, lower natural gas consumption, and slower growth in demand for central power generation, transmission, and distribution. Introducing a better engine would also modernize the California CHP market’s technology base and amplify the conservation and environmental benefits of CHP systems.
1.2 Project Objectives The objectives of the project were as follows:
• Improve fuel efficiency by 10 percent in an engine suited for small-scale CHP applications • Achieve and sustain CARB 2007 CHP standards throughout the equipment's useful life
5
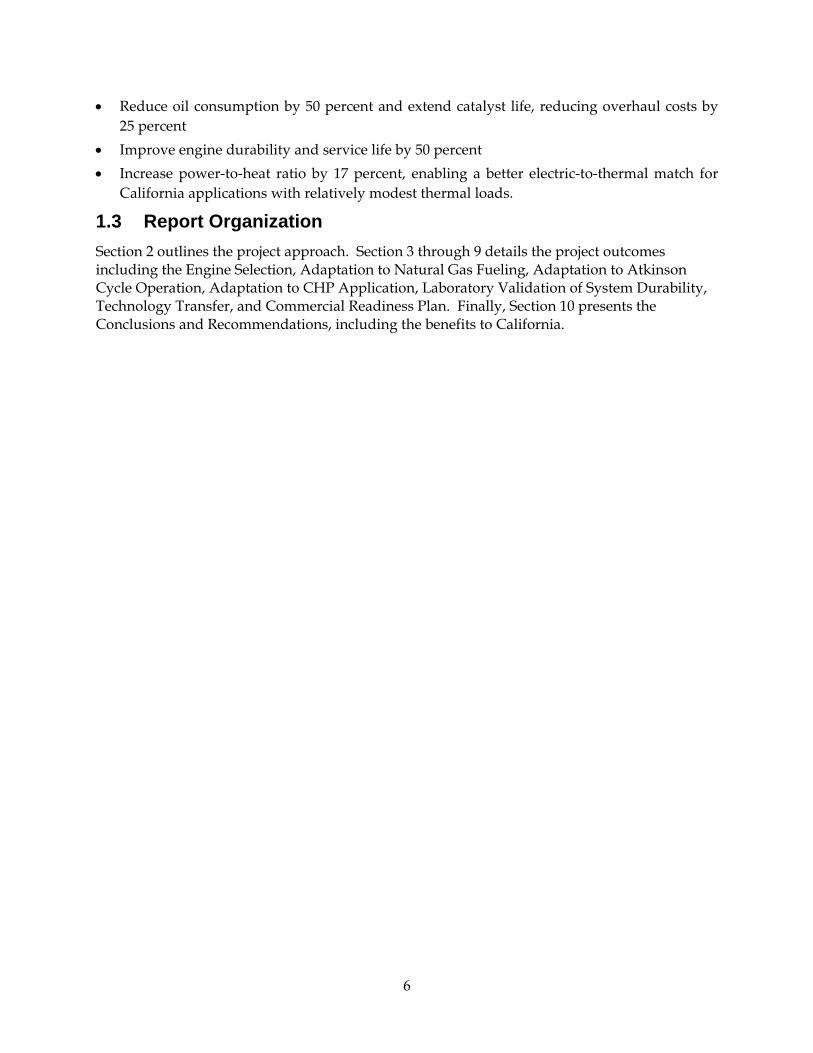
• Reduce oil consumption by 50 percent and extend catalyst life, reducing overhaul costs by 25 percent
• Improve engine durability and service life by 50 percent • Increase power-to-heat ratio by 17 percent, enabling a better electric-to-thermal match for
California applications with relatively modest thermal loads.
1.3 Report Organization Section 2 outlines the project approach. Section 3 through 9 details the project outcomes including the Engine Selection, Adaptation to Natural Gas Fueling, Adaptation to Atkinson Cycle Operation, Adaptation to CHP Application, Laboratory Validation of System Durability, Technology Transfer, and Commercial Readiness Plan. Finally, Section 10 presents the Conclusions and Recommendations, including the benefits to California.
6

CHAPTER 2: Project Approach Tecogen’s goal is to increase penetration of California’s CHP market by introducing modern automotive engine technology. The technical development work to achieve this goal consisted of the following:
• Select Engine – this work, conducted primarily by AVL, involved a search for an advanced automotive engine that met the requirements of improved efficiency, low cost, and accessible supply chain
• Adapt Engine to Natural Gas Fueling – this work, conducted primarily by AVL, required replacing the engine’s gasoline fuel system with a natural gas metering system and engine controls for proper spark timing, fueling, and air/fuel ratio control.
• Adapt Engine to Atkinson Cycle Operation – this work, conducted primarily by AVL, involved further dynamometer testing to implement the Atkinson cycle using variable cam timing, as well as achieving compliance to CARB 2007.
• Adapt Engine For CHP Application – this work, conducted by Tecogen, required assessing the various interface connection points to the engine and adapting the subsystems required for stationary CHP applications including the driveline coupling, natural gas piping, heat recovery system, extended oil change system and control wiring harnesses.
• Laboratory Validation of System Durability – this work, conducted by Tecogen, involved administering an endurance test on the engine to ensure adequate mechanical durability and performance over an extended operating cycle (completed 4070 hours).
• Technology Transfer Activities– this work involved presentations and tradeshows for market outreach and education, as well as a published SAE paper primarily on the emission system, but highlighting AVL’s dynamometer emission testing.
• Commercial Readiness Plan – this work involved the development of a plan that addressed Technical Readiness, Market Readiness and a Public Benefits assessment.
7

CHAPTER 3: Engine Selection The program commenced with AVL conducting a search of available engines from automakers worldwide, as well as after-market engine package developers. This search focused on identifying an engine of the appropriate size, which could be readily converted to a low-pressure Natural Gas (NG) fueling system, as well as an Atkinson cycle operating strategy. The supply chain feasibility was also considered.
First, based upon Tecogen’s prospective small CHP product lines, the duty cycle for torque and power requirements were established. Then using predictive modeling, the gasoline-equivalent performance parameters were determined. The modeling took into account degradation in performance due to NG fueling and emission compliance, plus efficiency and power/torque tradeoffs associated with Atkinson cycle operation.
A matrix was devised that listed all of the currently available automotive-type gasoline engines, with a breakdown of the various selection criteria. These parameters included not just performance and mechanical specifications, but the various associated costs such as engine procurement, modifications, operation (fuel cost), maintenance, and cost of any supplemental hardware. A critical measure was also the supply chain availability as this can be an obstacle for a small company such as Tecogen, with relatively low volume requirements, in dealing with a large automaker.
A weighting system was formulated to rate each of the engines, and the top candidates were pursued more extensively. Based upon the combination of a favorable rating, arrived at by the numerical analysis, as well as the commercial securing of the supply chain, a final engine selection was made; the Ford 2.5 L Duratec Atkinson.
3.1 Atkinson Cycle Analysis Internal combustion engines are modeled thermodynamically as an air standard cycle. The simplest approach is to assume ideal behavior which provides a very good approximation of efficiency, and illustrates a suitable relative comparison between the standard Otto cycle and the Atkinson cycle.
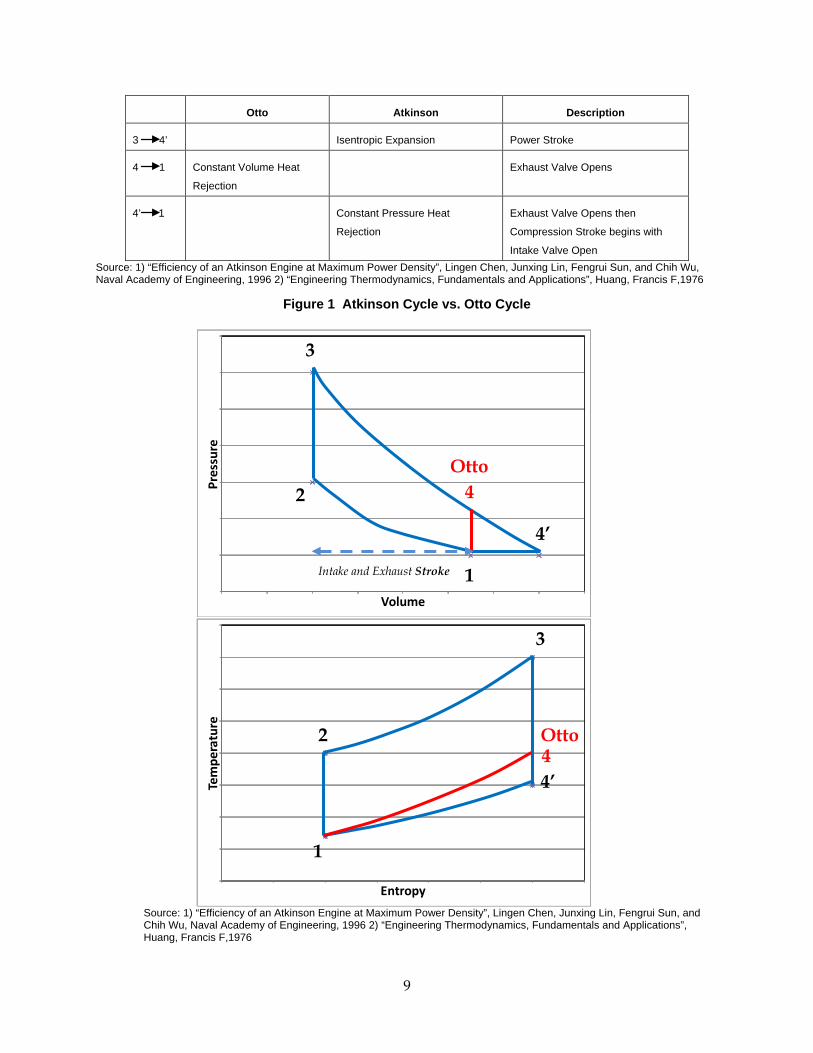
Figure 1 presents both the Pressure-Volume (P-V) diagram and corresponding Temperature-Entropy (T-S) diagram for both cycles. Table 1 below describes each process of the cycle.
Table 1 Thermodynamic Cycle Descriptions
Otto Atkinson Description
1 2 Isentropic Compression Isentropic Compression Compression Stroke
2 3 Constant Volume Heat
Transfer
Constant Volume Heat Transfer Combustion
3 4 Isentropic Expansion Power Stroke
8
Otto Atkinson Description
3 4’ Isentropic Expansion Power Stroke
4 1 Constant Volume Heat
Rejection
Exhaust Valve Opens
4’ 1 Constant Pressure Heat
Rejection
Exhaust Valve Opens then
Compression Stroke begins with
Intake Valve Open Source: 1) “Efficiency of an Atkinson Engine at Maximum Power Density”, Lingen Chen, Junxing Lin, Fengrui Sun, and Chih Wu, Naval Academy of Engineering, 1996 2) “Engineering Thermodynamics, Fundamentals and Applications”, Huang, Francis F,1976
Figure 1 Atkinson Cycle vs. Otto Cycle
Source: 1) “Efficiency of an Atkinson Engine at Maximum Power Density”, Lingen Chen, Junxing Lin, Fengrui Sun, and Chih Wu, Naval Academy of Engineering, 1996 2) “Engineering Thermodynamics, Fundamentals and Applications”, Huang, Francis F,1976
Pres
sure
Volume
Tem
pera
ture
Entropy
2
3
4’
4
Otto
Otto 4 4’
3
2
1
1
Intake and Exhaust Stroke
9

Referring to the Otto cycle diagrams, points 1 and 2 represent the beginning and end of the compression stroke, during which the air-fuel mixture is compressed from atmospheric pressure by the rising piston. When the piston reaches its top position at point 2, a spark plug is fired to initiate combustion. Point 3 defines the completion of the combustion process. In this ideal cycle, the entire combustion process occurs instantaneously (at constant volume).
Isentropic expansion then takes place during the power stroke between points 3 and 4. At point 4, the exhaust valve is opened and constant volume heat rejection (exhaust blowdown to atmospheric pressure) occurs between points 4 and 1, instantaneously. The subsequent exhaust intake strokes (both occurring at constant atmospheric pressure) are shown as a dashed line on the cycle diagram as they do not contribute to the thermodynamic cycle.
The variation in the Atkinson cycle is that the intake valve is held open when the compression stroke begins, bringing the mixture to atmospheric pressure (4’ to 1). This results in an expansion stroke (3 to 4’) that is greater than the compression stroke (1 to 2).
In the ideal Otto cycle, the compression ratio is equal to the expansion ratio:
Otto Cycle: These ratios are determined from the physical dimensions of the engine, so are referred to as “mechanical” ratios. The mechanical compression ratio (or expansion ratio) is the total trapped cylinder volume (measured with the piston at the lower extreme of its travel) divided by combustion chamber volume (measured with the piston at the upper extreme of its travel). It is also important to note that the “effective” compression ratio may not be the same as the mechanical compression ratio due to the camshaft profile/phasing, induction tuning (air intake), etc. If the “effective” compression ratio is too high for a given fuel, engine knock and/or pre-ignition can occur. Therefore, this “effective” compression ratio is based upon the fuel’s octane rating.
As presented in the thermodynamic analysis, the fundamental difference with the Atkinson cycle is that the intake valve is held open during the initial portion of the compression stroke, resulting in an expansion ratio that is greater than the compression ratio. This is depicted in Figure 2.
10

Figure 2 Otto Cycle vs. Atkinson Cycle – Mechanical Ratios
Source: “ Ford Gives 2009 Escape and Mariner Hybrids a Mid-Term Boost; Electric Drive Now up to 40 mph”, http://www.greencarcongress.com/2008/06/ford-gives-2009.html
The Atkinson cycle compression ratio and expansion ratio are defined as follows:
Atkinson Cycle:
Efficiency is essentially a function of expansion ratio, that is, a higher expansion ratio yields higher efficiency. Consequently, for a given engine size, the efficiency resulting from the implementation of the Atkinson cycle will exceed that of an Otto cycle.
The derivation of the efficiency is as follows:
OTTO CYCLE:
Constant Volume Heat Addition:
Constant Volume Heat Rejection:
11

Work:
Efficiency:
Upon further derivation using the ideal gas law, the Otto cycle efficiency in terms of the compression ratio is as follows:
(Equation 1)
where,
The derivation of efficiency for the Atkinson cycle is as follows:
ATKINSON CYCLE:
Constant Volume Heat Addition:
Constant Pressure Heat Rejection:
Efficiency:
(Equation 2)
12
where,
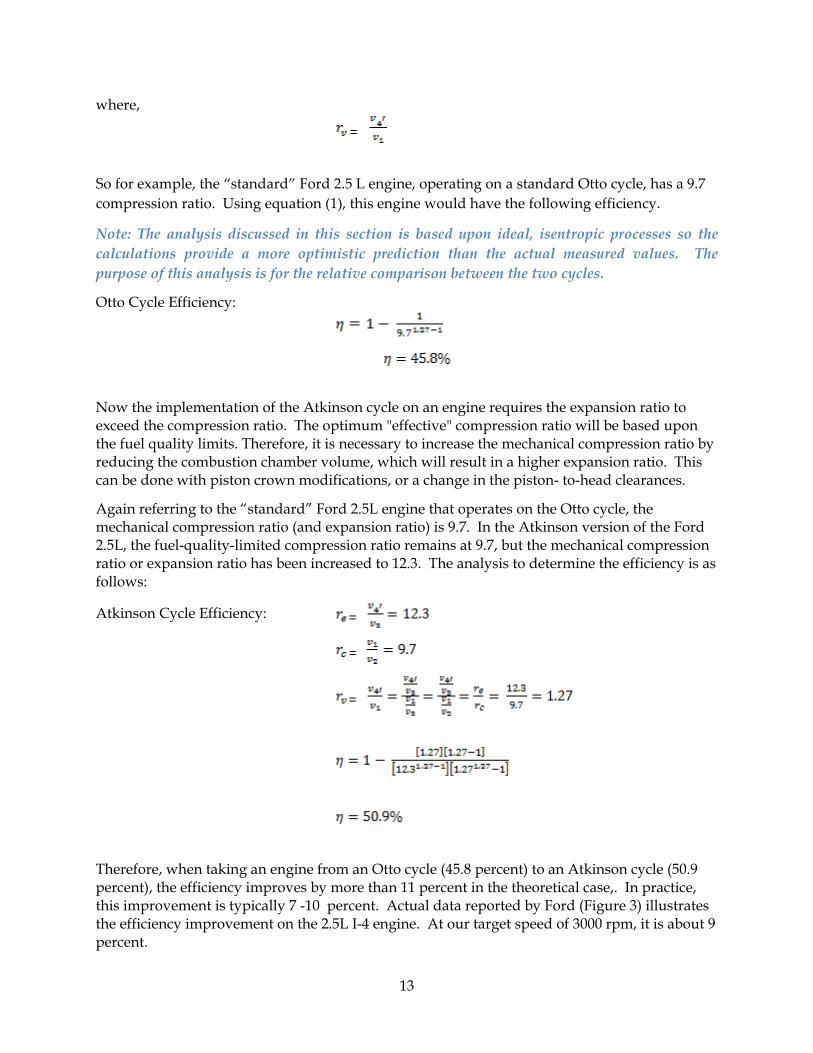
So for example, the “standard” Ford 2.5 L engine, operating on a standard Otto cycle, has a 9.7 compression ratio. Using equation (1), this engine would have the following efficiency.
Note: The analysis discussed in this section is based upon ideal, isentropic processes so the calculations provide a more optimistic prediction than the actual measured values. The purpose of this analysis is for the relative comparison between the two cycles.
Otto Cycle Efficiency:
Now the implementation of the Atkinson cycle on an engine requires the expansion ratio to exceed the compression ratio. The optimum "effective" compression ratio will be based upon the fuel quality limits. Therefore, it is necessary to increase the mechanical compression ratio by reducing the combustion chamber volume, which will result in a higher expansion ratio. This can be done with piston crown modifications, or a change in the piston- to-head clearances.
Again referring to the “standard” Ford 2.5L engine that operates on the Otto cycle, the mechanical compression ratio (and expansion ratio) is 9.7. In the Atkinson version of the Ford 2.5L, the fuel-quality-limited compression ratio remains at 9.7, but the mechanical compression ratio or expansion ratio has been increased to 12.3. The analysis to determine the efficiency is as follows:
Atkinson Cycle Efficiency:
Therefore, when taking an engine from an Otto cycle (45.8 percent) to an Atkinson cycle (50.9 percent), the efficiency improves by more than 11 percent in the theoretical case,. In practice, this improvement is typically 7 -10 percent. Actual data reported by Ford (Figure 3) illustrates the efficiency improvement on the 2.5L I-4 engine. At our target speed of 3000 rpm, it is about 9 percent.
13

The improved efficiency from the Atkinson cycle also provides other consequential benefits of importance. Exhaust temperatures are lower, resulting in reduced NOx emissions and improved service life of not just engine components, but the after treatment components (catalysts, sensors, etc.) as well.
Figure 3 Atkinson Cycle vs. Otto Cycle Efficiency Improvement
Source: “ Ford Gives 2009 Escape and Mariner Hybrids a Mid-Term Boost; Electric Drive Now up to 40 mph”, http://www.greencarcongress.com/2008/06/ford-gives-2009.html
While efficiency is improved by utilizing the Atkinson strategy, power is reduced. Holding the intake valve open during the initial portion of the compression stroke causes some air-fuel mixture to be pumped back out of the cylinder as the piston rises, reducing the net quantity of retained air-fuel charge, and effectively decreasing engine displacement and power.
A simple calculation demonstrates the magnitude of this issue in the Atkinson version:
If the combustion chamber volume is “x” and the cylinder displacement is 2.5 liters, then solving for “x”:
14

Setting the effective compression ratio to 9.7 (the value employed by the Otto cycle version of the engine, limited by fuel quality constraints) permits calculation of an equivalent Atkinson displacement, and also defines the required intake valve closing point.
Therefore, the Atkinson 2.5 L engine size is essentially reduced to 1.92 liters in order to maintain the proper difference between expansion ratio and compression while not exceeding the fuel-quality-limited compression ratio. When the piston reaches the swept volume corresponding to 1.92 liters, this defines the point in the compression stroke at which the intake valve must be closed to give an “effective” compression ratio of 9.7:1. Using engine geometry (bore, stroke, and connecting rod length), a simple calculation will yield the required camshaft timing point in degrees of crankshaft rotation.
This reduction in swept volume of approximately 25 percent translates into an equivalent loss of power in the engine as depicted by Figure 4. This graphic, again provided by Ford, shows the reduction in torque throughout the speed range, when implementing an Atkinson cycle. At 3000 rpm, this torque reduction is approximately 18 percent.
Therefore, since an important objective of this program is to implement an Atkinson cycle operating strategy, the engine search considered those engines that were already configured for Atkinson operation, with higher interest. However, the conversion of a standard Otto cycle engine to Atkinson was also considered as a viable approach. This would require physical changes that could be as limited to modifying the timing strategies on a VVT engine, or could be more invasive as a camshaft replacement or modified pistons depending upon the relative size of the engine to the power requirements of this application.
Figure 4 Torque Trade-off of Atkinson Cycle vs. Otto Cycle
Source: “ Ford Gives 2009 Escape and Mariner Hybrids a Mid-Term Boost; Electric Drive Now up to 40 mph”, http://www.greencarcongress.com/2008/06/ford-gives-2009.html
15

3.2 More Advanced Features Other important goals for this engine platform are reduced oil consumption rates, CARB compliant emissions, and improved service life. New advanced engine designs have implemented features which address these issues. For example, modern automotive engines typically have four valves per cylinder. This improves intake and exhaust gas flow, enhancing combustion efficiency. Modern engines also have state-of-the-art oil control features, such as bore roundness, surface finish, valve stem seals, etc. Better oil management will reduce oil consumption rate, thereby not only improving serviceability, but potentially improving emissions by reducing hydrocarbons in the exhaust stream. Also, less oil consumption extends catalyst life.
In the following section, the process of investigating, analyzing, and rating various engines based upon the technical criteria just outlined here, as well as commercial and cost considerations, is presented. This analysis provided the foundation for the final engine selection
3.3 Engine Selection Process The engine selection process required researching a number of engines and creating a matrix table that listed various categories of interest. Weighted numerical scores were applied to each of these categories. These scores were added together to determine a total “Value”. The engines were then ranked in descending order from the highest “Value” to the lowest “Value”. The following section will explain the methodology in devising the matrix and the analysis of the results.
The first step in the engine selection process was to establish the duty cycle torque and power requirements for Tecogen’s small CHP product line. This is presented in Figure 5 with the power and/or torque vs. rpm. It is expected that the engine will operate at a nominal speed of 2500 – 3000 rpm, although there is flexibility in this range. Given that, the horsepower rating should be approximately 50 HP with natural gas fueling.
16

Figure 5 Power and Torque Requirements
Source: Tecogen, Inc, 2009, Analysis of CHP duty cycle requirements
Aside from the power rating, there were several other criteria that were investigated. Table 2 lists all the parameters that were researched, categorized, and rated. Each numbered row represents a specification or a feature. The first column is the item number followed by an item description. The column titled “Target” lists the desired goal for that feature. The last column, titled “Scale”, gives a weighting of the relative importance of the feature on a scale of “1” to “5”. So, for example, Line #8, titled “Gaseous Fuel Validated”, has a Target or desired goal of “yes”. However, on a scale of 1 to 5, its rating is “3” meaning that if the engine has never been operated on natural gas; it is not a significant demerit. By contrast, Line #29 titled “Required Modifications for Atkinson Cycle Usage” has a target on “None” with a scale of “five”. This means that Atkinson Cycle compatibility, in other words not requiring invasive mechanical modifications to operate on the Atkinson cycle, is weighted more heavily than having previous operation on natural gas.
There were a total of 37 parameters that were categorized and rated. The targets for each of these categories are presented in the following section.
0
10
20
30
40
50
60
70
80
90
1000 1200 1400 1600 1800 2000 2200 2400 2600 2800 3000
Pow
er (H
P) o
r Tor
que
(ft-lb
)
RPM
Torque Envelope
Power Envelope
17

Table 2 Targets with Corresponding Ratings Feature Target Rating
Bas
e En
gine
Dat
a
1 Model n/a n/a 2 Vendor Domestic 3 3 Asm Plant USA 4 4 Engine Type I-4 5 5 Number of Valves 4 per cylinder 4 6 Block Material Al or Fe 3 7 Head Material Aluminum 3 8 Gaseous Fuel Validated Yes 3 9 Horsepower > 50 4 10 Torque > 140 4 11 BSFC (g/kWh) < 250 @
3000 5
12 BSFC (g/kWh) - value at 2000rpm < 290 Score Line # 11 13 Displacement (cc) < 3000 2 14 Bore and Stroke n/a Info only 15 Compression Ratio > 12:1 4 16 Fuel System MPFI 2 17 VVT Yes 4 18 Oil Consumption < 4L/500h 3 19 Mass n/a 0 20 Appx Dims:HxLxW () n/a 0 21 Controller Available Yes 4 22 Service Parts Availability Yes 5 23 Estimated Procurement Costs ($/unit) < $4,000 4
Nat
ural
Gas
M
odifi
catio
ns
24 Required Modifications for Natural Gas Usage
None score line#8
25 Modification Costs ($/unit) $0 score line #24
26 Labor Costs Required ($/unit) $0 score line #24
27 Performance Reduction (Natural Gas) None score line #9&10
28 Operation Cost Estimate ($/unit/15000hr) None info only
Atk
inso
n M
odifi
catio
ns 29 Required Modifications for Atkinson Cycle
Usage None 5
30 HW Modification Costs ($/unit) $0 score line #29
31 Labor Costs Required ($/unit) $0 score line #29
32 Performance Reduction (Atkinson) None score line #9&10
33 Fuel Efficiency Increase (Atkinson) None score line #11
34 Operation Costs Estimate ($/unit/15000hr) None info only
Life
35 Head Service Life (hr) > 7,000 4 36 Engine Life (hr) > 15,000 4
37 Secured Supply Chain to Commercialization of TECOGEN product
existing relationship
4
Source: PIER PIR-08-022, Task 2 Engine Selection Summary Report, April 2010
18

3.3.1 Targets and Ratings An explanation of each of the targets is presented below.
BASE ENGINE DATA
1. Model – Target and rating not applicable.
2. Vendor – The target for this category is a domestic supplier, as this would simplify the commercial relationship. This category has a score of 3, assigning it moderate importance.
3. Asm Plant – Again, the United States is the preferred target from a commercial perspective, not just from the benefit of the supply chain logistics (shipping costs, lead times), but also from the marketing advantage of having the primary component of Tecogen products be manufactured in the United States. This category gets a relatively high score of 4 because of these commercial implications.
4. Engine Type - The preferred engine type is an inline four cylinder rather than a “V” style. The inline engine will have a single exhaust line. This reduces the challenges of the emission control system by eliminating the balancing the air/fuel ratio to each bank, packaging two catalysts, or designing a “wye” exhaust. It also simplifies service access by having all spark plugs and wires on one side of the engine. This feature has a high score of 5.
5. Number of Valves - Four valves per cylinder, that is two intake valves and two exhaust valves, is preferred over having just one of each per cylinder (two valves per cylinder. Having two valves increases the contact surface of the gas, improving flow and extending life, especially on the hot exhaust valves. Fitting in two smaller valves, as opposed to one, improves the geometry of the head by placing the spark plug at the center of the combustion, ideal for flame propagation. The weight of the valves, pushrods, etc. is also reduced.
6. Block Material – Although aluminum is preferred over iron with the heads (see #7), it is not as critical with the block.
7. Head Material – Aluminum is the preferred material over iron because it is lightweight, and with excellent strength. It also is corrosion resistant with very good thermal conductivity properties. These heat transfer properties are especially important in cylinder heads to bring down the exhaust temperatures, which is beneficial for emissions.
8. Gaseous Fuel Validated – Many industrial engines have already undergone conversion to natural gas, while the newer automotive engines have not. This is given a score of 3 since there is less technical risk, but it is not given a 5 because this would favor older technologies.
9. Horsepower – Based on the requirements presented in Figure 5, the Tecogen CHP product line requires an engine that has a power rating that exceeds 50 HP with gasoline. This is given a score of 4.
19

10. Torque – Based upon the requirements presented in Figure 5, the torque requirement is to exceed 140 Nm. Torque is also given a score of 4.
11. BSFC – BSFC is Brake Specific Fuel Consumption which is a measure of efficiency. It is the fuel consumption divided by the power. This is given the highest score of 5.
12. BSFC (Value at 3000 rpm) – This speed of 3000 rpm is the nominal rating of the CHP products so the efficiency comparison between engines, at this speed, has the most significance. This is also given the highest score of 5.
13. Displacement – The engine displacement is the total swept volume of pistons within the cylinder in one revolution. The power output of the engine is proportional to the displacement. It does not include the combustion chamber. The target is < 3000 cc (3.0L) since this is the size range of interest. The score is only 2 since a range of sizes could be considered.
14. Bore And Stroke – The bore is the diameter of the cylinder, the stroke is the distance of travel of the piston. These are listed for informational purposes only and are not scored.
15. Compression Ratio – The mechanical compression ratio is the “swept volume” of the piston divided by the total volume of the piston, the difference being the combustion chamber volume. The target is 12:1 since a high compression ratio is needed for an effective Atkinson cycle implementation. It is scored as a 4 since as discussed earlier, physical modifications can be made to the engine to increase the compression ratio (camshaft, pistons, etc.).
16. Fuel System – The target is MPFI, Multi Point Fuel Injection, where fuel is injected into each cylinder just upstream of the intake valve, rather than a carburetion system, where the fuel is injected at a central point on the intake manifold and then the manifold distributes the fuel mixture to the cylinders. MPFI provides a more uniform mixture to each of the cylinders. Although fuel injection cannot be utilized with a low pressure natural gas system, the presence of MPFI is an indicator of increased fuel control, improved parts mechanical tolerancing, and a higher control within the engine assembly process. This feature is scored at 2.
17. VVT – VVT, or Variable Valve Timing, is a feature of the engine that allows the intake and/or exhaust valve timing to be altered at various conditions of engine operation in order to optimize fuel efficiency. This can be done mechanically and/or electronically. For example, a camshaft can be rotated ahead a few degrees to shift the valve timing during low load operation. Alternatively, some engines may have two different sets of cam lobes. VVT is given a score of 4 since it will more easily facilitate the implementation of the Atkinson cycle.
18. Oil Consumption – This primary concern with oil consumption is emissions, not only because of catalyst contamination due to blowby, but also because of the concern that the combustion of the oil within the cylinder may be contributing to higher levels of pollutants in the exhaust. Oil consumption is also undesirable from a service cost perspective. The target is less than 4L per 500 hours of operation and this has a score of 3.
20

19. Mass – This is listed for informational purposes only. Target and score are not applicable.
20. Dimensions - This is listed for informational purposes only. Target and score are not applicable.
21. Controller Available – All automotive engines have a control module, typically referred to as an ECM (Engine Control Module), which utilizes a microprocessor to control the air/fuel ratio, ignition timing, VVT, and monitors various input and output sensors and the safety system. It would be ideal to obtain the ECM for the engine, however in most cases, the software is proprietary. Many of the industrial engines have an aftermarket controller customized for the application. This ECM is given a score of 4.
22. Service Part Availability - Parts availability is critical in CHP applications due to the extended run hours. This is given a score of 5.
23. Procurement Costs – The target is set at less than $4000. This is given a score of 4.
NATURAL GAS MODIFICATIONS
These categories were not scored, nor included in the rating calculation, because they are covered in earlier categories.
ATKINSON MODIFICATIONS
1. The target for this category is for the engine to already have the Atkinson cycle implemented on it, requiring no mechanical modifications. An Otto cycle engine would require modifications in the pistons, camshaft, or valve timing, in order to boost the mechanical compression ratio (see Section 2.1). Because of the cost and risks associated with these mechanical modifications, this category is scored as 5.
2. – 34. These categories were not scored, nor included in the rating calculation because they are covered in earlier categories.
ENGINE LIFE
1. Head Service Life – The target for the cylinder head life is > 7000 hours. This is consistent with the TecoDrive 7400, the current CHP product line’s engine platform. This is given a score of 4.
2. Engine Life - The target for the engine life is > 15,000 hours. This is consistent with the TecoDrive 7400 engine, the current CHP product line’s engine platform. This is given a score of 4.
COMMERCIALIZATION
Supply Chain to Commercialization – The target for this category was a supplier that Tecogen already had an existing relationship, because they would have an understanding of the CHP market, engine duty cycle, sales volume, and level of support required. Likewise, Tecogen would have an understanding of lead times, corporate
21
structure and contacts, and level of technical support to expect. This is given a score of 4.
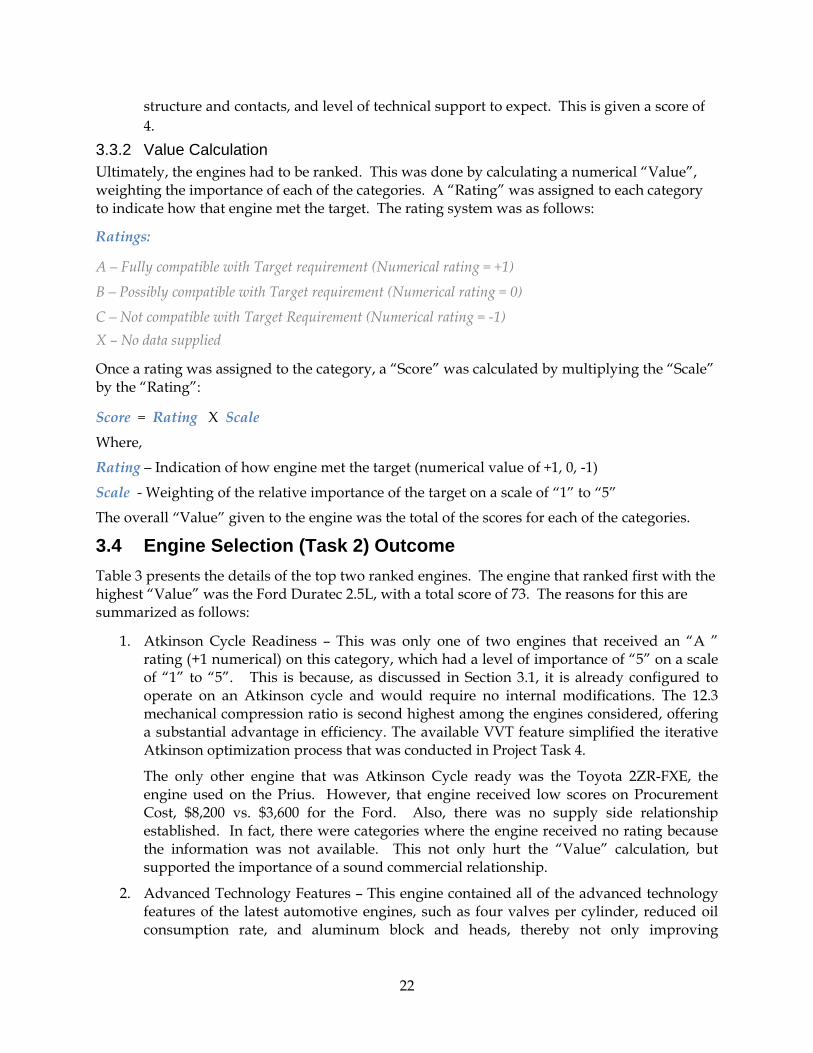
3.3.2 Value Calculation Ultimately, the engines had to be ranked. This was done by calculating a numerical “Value”, weighting the importance of each of the categories. A “Rating” was assigned to each category to indicate how that engine met the target. The rating system was as follows:
Ratings:
A – Fully compatible with Target requirement (Numerical rating = +1)
B – Possibly compatible with Target requirement (Numerical rating = 0)
C – Not compatible with Target Requirement (Numerical rating = -1) X – No data supplied
Once a rating was assigned to the category, a “Score” was calculated by multiplying the “Scale” by the “Rating”:
Score = Rating X Scale
Where,
Rating – Indication of how engine met the target (numerical value of +1, 0, -1)
Scale - Weighting of the relative importance of the target on a scale of “1” to “5”
The overall “Value” given to the engine was the total of the scores for each of the categories.
3.4 Engine Selection (Task 2) Outcome Table 3 presents the details of the top two ranked engines. The engine that ranked first with the highest “Value” was the Ford Duratec 2.5L, with a total score of 73. The reasons for this are summarized as follows:
1. Atkinson Cycle Readiness – This was only one of two engines that received an “A ” rating (+1 numerical) on this category, which had a level of importance of “5” on a scale of “1” to “5”. This is because, as discussed in Section 3.1, it is already configured to operate on an Atkinson cycle and would require no internal modifications. The 12.3 mechanical compression ratio is second highest among the engines considered, offering a substantial advantage in efficiency. The available VVT feature simplified the iterative Atkinson optimization process that was conducted in Project Task 4.
The only other engine that was Atkinson Cycle ready was the Toyota 2ZR-FXE, the engine used on the Prius. However, that engine received low scores on Procurement Cost, $8,200 vs. $3,600 for the Ford. Also, there was no supply side relationship established. In fact, there were categories where the engine received no rating because the information was not available. This not only hurt the “Value” calculation, but supported the importance of a sound commercial relationship.
2. Advanced Technology Features – This engine contained all of the advanced technology features of the latest automotive engines, such as four valves per cylinder, reduced oil consumption rate, and aluminum block and heads, thereby not only improving
22
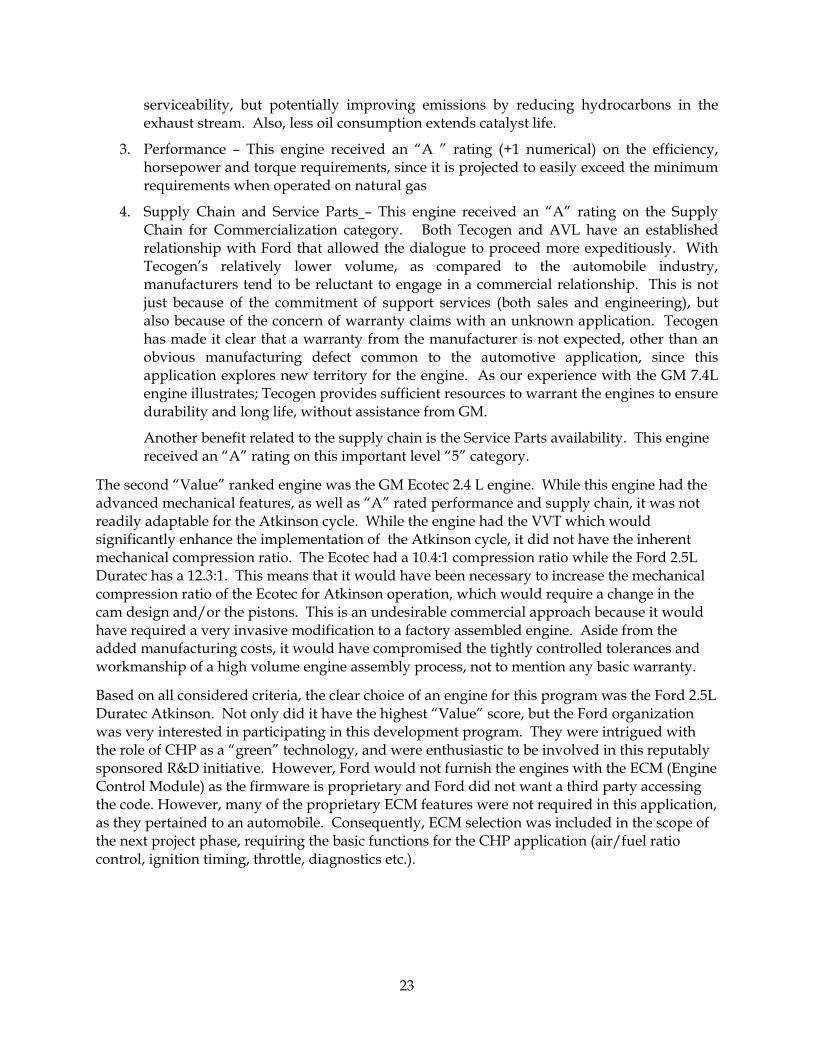
serviceability, but potentially improving emissions by reducing hydrocarbons in the exhaust stream. Also, less oil consumption extends catalyst life.
3. Performance – This engine received an “A ” rating (+1 numerical) on the efficiency, horsepower and torque requirements, since it is projected to easily exceed the minimum requirements when operated on natural gas
4. Supply Chain and Service Parts – This engine received an “A” rating on the Supply Chain for Commercialization category. Both Tecogen and AVL have an established relationship with Ford that allowed the dialogue to proceed more expeditiously. With Tecogen’s relatively lower volume, as compared to the automobile industry, manufacturers tend to be reluctant to engage in a commercial relationship. This is not just because of the commitment of support services (both sales and engineering), but also because of the concern of warranty claims with an unknown application. Tecogen has made it clear that a warranty from the manufacturer is not expected, other than an obvious manufacturing defect common to the automotive application, since this application explores new territory for the engine. As our experience with the GM 7.4L engine illustrates; Tecogen provides sufficient resources to warrant the engines to ensure durability and long life, without assistance from GM.
Another benefit related to the supply chain is the Service Parts availability. This engine received an “A” rating on this important level “5” category.
The second “Value” ranked engine was the GM Ecotec 2.4 L engine. While this engine had the advanced mechanical features, as well as “A” rated performance and supply chain, it was not readily adaptable for the Atkinson cycle. While the engine had the VVT which would significantly enhance the implementation of the Atkinson cycle, it did not have the inherent mechanical compression ratio. The Ecotec had a 10.4:1 compression ratio while the Ford 2.5L Duratec has a 12.3:1. This means that it would have been necessary to increase the mechanical compression ratio of the Ecotec for Atkinson operation, which would require a change in the cam design and/or the pistons. This is an undesirable commercial approach because it would have required a very invasive modification to a factory assembled engine. Aside from the added manufacturing costs, it would have compromised the tightly controlled tolerances and workmanship of a high volume engine assembly process, not to mention any basic warranty.
Based on all considered criteria, the clear choice of an engine for this program was the Ford 2.5L Duratec Atkinson. Not only did it have the highest “Value” score, but the Ford organization was very interested in participating in this development program. They were intrigued with the role of CHP as a “green” technology, and were enthusiastic to be involved in this reputably sponsored R&D initiative. However, Ford would not furnish the engines with the ECM (Engine Control Module) as the firmware is proprietary and Ford did not want a third party accessing the code. However, many of the proprietary ECM features were not required in this application, as they pertained to an automobile. Consequently, ECM selection was included in the scope of the next project phase, requiring the basic functions for the CHP application (air/fuel ratio control, ignition timing, throttle, diagnostics etc.).
23
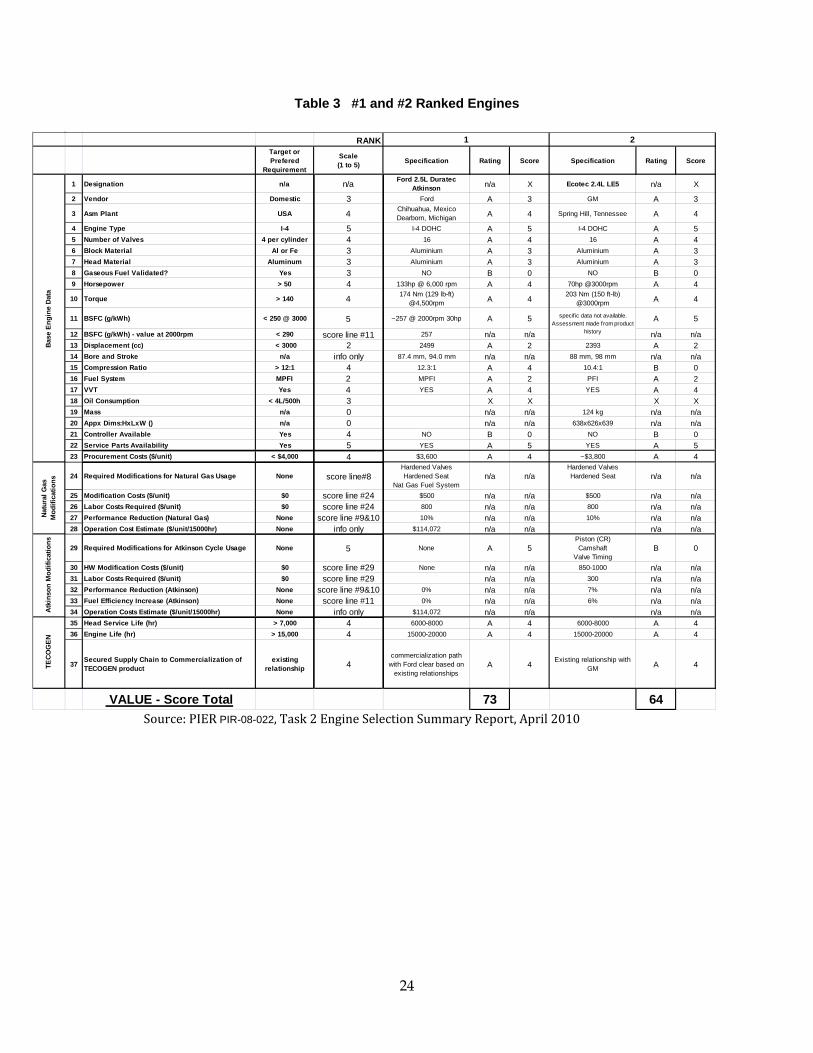
Table 3 #1 and #2 Ranked Engines
Source: PIER PIR-08-022, Task 2 Engine Selection Summary Report, April 2010
RANKTarget or Prefered
Requirement
Scale(1 to 5) Specification Rating Score Specification Rating Score
1 Designation n/a n/a Ford 2.5L Duratec Atkinson n/a X Ecotec 2.4L LE5 n/a X
2 Vendor Domestic 3 Ford A 3 GM A 3
3 Asm Plant USA 4 Chihuahua, MexicoDearborn, Michigan A 4 Spring Hill, Tennessee A 4
4 Engine Type I-4 5 I-4 DOHC A 5 I-4 DOHC A 55 Number of Valves 4 per cylinder 4 16 A 4 16 A 46 Block Material Al or Fe 3 Aluminium A 3 Aluminium A 37 Head Material Aluminum 3 Aluminium A 3 Aluminium A 38 Gaseous Fuel Validated? Yes 3 NO B 0 NO B 09 Horsepower > 50 4 133hp @ 6,000 rpm A 4 70hp @3000rpm A 4
10 Torque > 140 4 174 Nm (129 lb-ft) @4,500rpm A 4
203 Nm (150 ft-lb) @3000rpm A 4
11 BSFC (g/kWh) < 250 @ 3000 5 ~257 @ 2000rpm 30hp A 5 A 5
12 BSFC (g/kWh) - value at 2000rpm < 290 score line #11 257 n/a n/a n/a n/a13 Displacement (cc) < 3000 2 2499 A 2 2393 A 214 Bore and Stroke n/a info only 87.4 mm, 94.0 mm n/a n/a 88 mm, 98 mm n/a n/a15 Compression Ratio > 12:1 4 12.3:1 A 4 10.4:1 B 016 Fuel System MPFI 2 MPFI A 2 PFI A 217 VVT Yes 4 YES A 4 YES A 418 Oil Consumption < 4L/500h 3 X X X X19 Mass n/a 0 n/a n/a 124 kg n/a n/a20 Appx Dims:HxLxW () n/a 0 n/a n/a 638x626x639 n/a n/a21 Controller Available Yes 4 NO B 0 NO B 022 Service Parts Availability Yes 5 YES A 5 YES A 523 Procurement Costs ($/unit) < $4,000 4 $3,600 A 4 ~$3,800 A 4
24 Required Modifications for Natural Gas Usage None score line#8Hardened ValvesHardened Seat
Nat Gas Fuel Systemn/a n/a
Hardened ValvesHardened Seat n/a n/a
25 Modification Costs ($/unit) $0 score line #24 $500 n/a n/a $500 n/a n/a26 Labor Costs Required ($/unit) $0 score line #24 800 n/a n/a 800 n/a n/a27 Performance Reduction (Natural Gas) None score line #9&10 10% n/a n/a 10% n/a n/a28 Operation Cost Estimate ($/unit/15000hr) None info only $114,072 n/a n/a n/a n/a
29 Required Modifications for Atkinson Cycle Usage None 5 None A 5Piston (CR)Camshaft
Valve TimingB 0
30 HW Modification Costs ($/unit) $0 score line #29 None n/a n/a 850-1000 n/a n/a31 Labor Costs Required ($/unit) $0 score line #29 n/a n/a 300 n/a n/a32 Performance Reduction (Atkinson) None score line #9&10 0% n/a n/a 7% n/a n/a33 Fuel Efficiency Increase (Atkinson) None score line #11 0% n/a n/a 6% n/a n/a34 Operation Costs Estimate ($/unit/15000hr) None info only $114,072 n/a n/a n/a n/a35 Head Service Life (hr) > 7,000 4 6000-8000 A 4 6000-8000 A 436 Engine Life (hr) > 15,000 4 15000-20000 A 4 15000-20000 A 4
37 Secured Supply Chain to Commercialization of TECOGEN product
existing relationship 4
commercialization path with Ford clear based on
existing relationshipsA 4
Existing relationship with GM A 4
VALUE - Score Total 73 64
Base
Eng
ine
Data
Atki
nson
Mod
ifica
tions
Natu
ral G
as
Mod
ifica
tions
TECO
GEN
specif ic data not available. Assessment made from product
history
21
24
CHAPTER 4: Adaptation to Natural Gas Fueling The objective of Task 3 was to select a natural gas (NG) fuel system to replace the gasoline components, and perform baseline performance dynamometer testing at AVL’s California Technology Center in order to characterize power output, efficiency, and emissions. Initially, the engine was operated on gasoline fuel using Ford's MPI fuel system components, but with control provided by the fumigation system ECM. This step involved development of ECM control algorithms and calibrations demonstrating capability to achieve performance and emissions comparable to Ford's published levels.
The next step entailed disabling the gasoline fuel supply and activating the NG system. For these tests, NG from compressed gas cylinders was employed. Fuel pressure was reduced for low pressure operation (i.e. 3 in-H2O). ECM algorithms and calibrations were optimized for NG operation, and engine performance and emissions were recorded.
4.1 Natural Gas Fuel System Selection Maintenance of a desired AFR is the primary function of the NG fuel control system, which consists of sensors, the ECM, and actuators (air and fuel management devices). The sensors detect deviations from the desired AFR. The ECM receives sensor inputs, then calculates and commands actuator position changes that should correct the error.
AFR error detection occurs at the oxygen sensor, typically located in the engine exhaust manifold outlet. Achievement of optimal AFR requires minimizing the time between sensing an error, implementing a correction, and determining whether that correction has successfully corrected the error. The time required for this is the sum of "process time" and "transport lag".
The ECM processes corrective actions instantaneously. However, there is a finite time required for electro-pneumatic and electro-hydraulic air and fuel management devices (actuators) to reposition themselves as commanded by the ECM. This is "process time".
A significant response "wait time" follows as the correction works its way through the system, before it can be detected and confirmed by the oxygen sensor. That delay is a function of airflow path volume between the points of error correction (fuel flow controller) and error detection (oxygen sensor). This is "transport lag", and it typically exceeds "process time".
When adapting small engines such as Ford's 2.5L for operation on NG fuel, either multiple fuel injectors or a single fuel control valve can be used to meter the quantity of delivered fuel. If multiple fuel injectors are employed, the system is essentially identical to a gasoline MPI configuration, with individual injectors delivering fuel to individual cylinders. If a single fuel control valve is employed, the fuel system configuration is more similar to that of a "carbureted" gasoline engine, where the carburetor meters total engine fuel into a manifold that then distributes the fuel uniformly to all cylinders.
The MPI approach offers excellent AFR control capability. Because fuel is metered and delivered on a cylinder-by-cylinder basis, any detected variation from optimal AFR can be immediately compensated by increasing or decreasing the quantity of fuel delivered to the next cylinder in the engine firing sequence. The injector location just upstream of the intake valve
25

assures that the ensuing cylinder combustion event will have been supplied with the corrected fuel quantity. Transport lag in this configuration is minimal.
To utilize commercially available injectors and to minimize the undesirable effects of fuel compressibility, NG MPI systems require fuel supplied at "high" pressure (~40 psi). This limits MPI usage to applications with access to a high pressure fuel source. MPI is primarily used in mobile applications that employ very high pressure (3600 psi) fuel storage. Examples include Honda's Civic NGV and Cummins' Westport NG engines.
A single fuel control valve is commonly used in situations employing pipeline gaseous fuels supplied at low pressure (inches-H2O) and is referred to as a "fumigation" configuration. Tecogen's CHP applications utilize on-site low pressure natural gas as a fuel source. Because some units are located indoors, on-site gas compression and high pressure storage is not an option. For these reasons, a fumigation system must be employed.
The fumigation system consists of a fuel control (butterfly) valve that meters NG flow in proportion to engine airflow (measured or calculated) with the intent of achieving optimal AFR. The metered NG fuel then enters a mixer within which it is homogeneously combined with the engine airstream. The air/fuel mixture next enters the throttle body, which controls the quantity of air/fuel mixture to match engine power demand. The mixture then enters the engine intake manifold where it is distributed to each cylinder.
Response time of the fumigation configuration is significantly longer than with MPI, for several reasons. One is the relatively slow speed at which the fumigation system can implement fuel flow changes, due to the low operational pressures. Errors due to NG compressibility effects at these low pressures are also concerning.
The primary reason however is a larger separation between AFR correction and detection points resulting from additional volume present in the engine airflow path between these points. The degree of increased transport lag is a function of component designs (mixer, throttle inlet tube, throttle body, and intake manifold), but can easily exceed five (5) times the MPI level. During this extended transport lag period, the AFR error continues to occur. Depending upon catalyst oxygen storage capacity, this may result in emissions "breakthrough", a common control issue.
After review of commercial equipment available from several fumigation system suppliers, AVL selected Woodward as the preferred source for this project. That selection was influenced by their Mototron ECM that offers an "open" architecture suitable for development purposes, and the availability of Woodward's engineering support. Woodward is a current Tecogen supplier that offers a broad range of gaseous fuel control equipment, has established a good track record as a Tecogen commercial partner, and was the logical first choice supplier.
A fumigation system available from eControls was also deemed suitable for this application, but their ECM was less adaptable for independent development purposes. Based on relatively modest anticipated production volume projections, eControls would not commit to provide the engineering support required to implement anticipated development activities. A system from Impco was also briefly reviewed as part of the selection process.
26
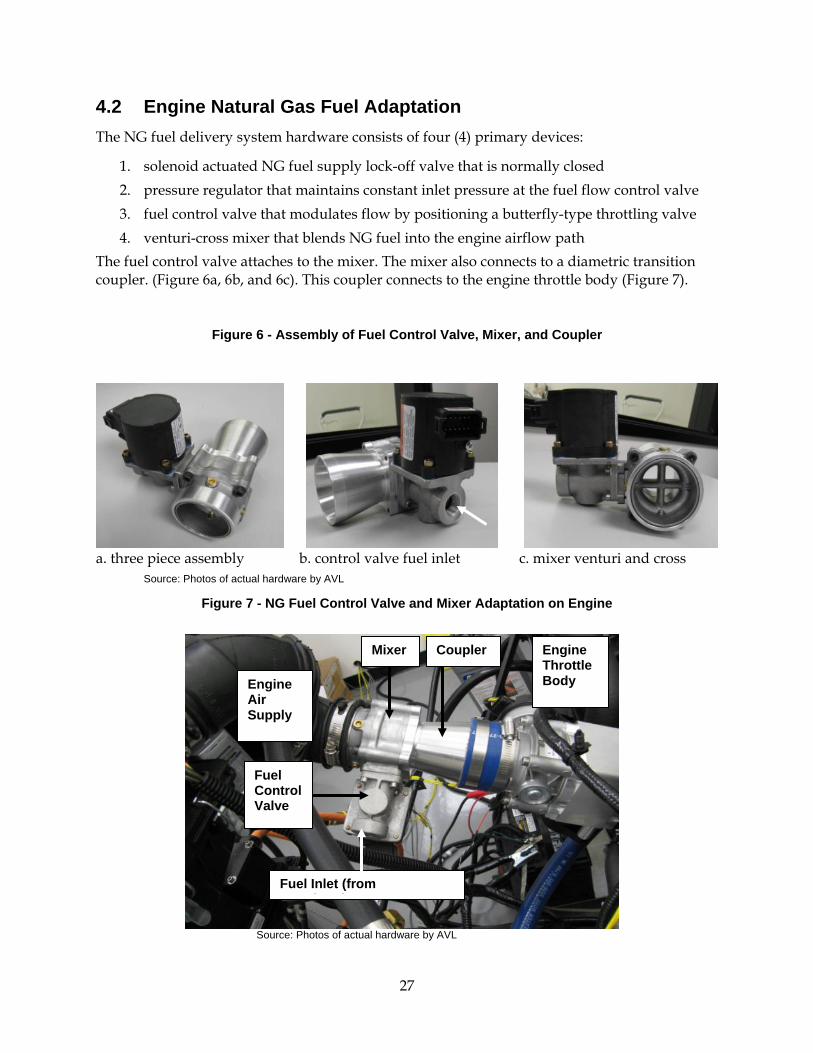
4.2 Engine Natural Gas Fuel Adaptation The NG fuel delivery system hardware consists of four (4) primary devices:
1. solenoid actuated NG fuel supply lock-off valve that is normally closed 2. pressure regulator that maintains constant inlet pressure at the fuel flow control valve 3. fuel control valve that modulates flow by positioning a butterfly-type throttling valve 4. venturi-cross mixer that blends NG fuel into the engine airflow path
The fuel control valve attaches to the mixer. The mixer also connects to a diametric transition coupler. (Figure 6a, 6b, and 6c). This coupler connects to the engine throttle body (Figure 7).
Figure 6 - Assembly of Fuel Control Valve, Mixer, and Coupler
a. three piece assembly b. control valve fuel inlet c. mixer venturi and cross
Source: Photos of actual hardware by AVL
Figure 7 - NG Fuel Control Valve and Mixer Adaptation on Engine
Source: Photos of actual hardware by AVL
Engine Throttle Body
Fuel Control Valve
Mixer Coupler
Fuel Inlet (from R l )
Engine Air Supply
27
When the ECM is powered up, a lock-off valve is opened, allowing fuel to enter the pressure regulator. The regulator maintains fuel pressure to a constant preset level using a zero governor balanced-valve spring-loaded diaphragm configuration. The pressure-regulated fuel is routed to the fuel control valve inlet and into a 16 mm bore inside the device. The ECM modulates fuel flow by positioning a butterfly valve located within this bore. Metered fuel then exits the control valve and enters an annular chamber within the mixer. This chamber communicates through a series of small holes into a 40 mm venturi with an 8 mm "cross". Here the fuel combines with engine intake air also flowing through the venturi section of the mixer. All devices were sized to accommodate the maximum anticipated fuel flow required to develop full engine power. Engine Mechanical Adaptation
Three engines were received from Ford as "long block" assemblies consisting of :
1. Cylinder block with installed crankshaft, bearings, pistons and connecting rods 2. Cylinder head with valves, valve springs, camshafts, gasoline fuel rail and injectors 3. Camshaft drive system with sprockets, timing chain, and VVT actuator 4. Front cover assembly with integral oil pump 5. Oil pan, valve cover, etc.
Additional mechanical components required for engine operation were also procured:
1. Ford throttle body with electronic throttle actuator 2. Ford intake manifold 3. Bellhousing, flex plate with ring gear, and electric starter motor 4. Ford air cleaner assembly with integral mass airflow meter (MAF) 5. Ford vehicle exhaust manifold with integral "close-coupled" 3-way catalyst (3WC) 6. Ford vehicle exhaust pipe with integral "underfloor" 3WC 7. Exhaust muffler and tailpipe 8. Engine mounts, alternator and belt tensioner, etc.
One engine was fitted with the additional components and installed on a test fixture at AVL for development testing. A second engine was retained at AVL as a backup. The third engine was delivered to Tecogen to be used for CHP packaging studies.
Another issue involved ignition coils - Mototron's ECM was unable to drive the Ford coils. It was initially proposed to substitute Delphi coils, but it was ultimately decided to install a pair of auxiliary ignition modules to boost output from the Mototron ECM to a level at which the stock Ford coils could be retained.
The Mototron ECM incorporates a method of identifying camshaft and crankshaft positioning that is similar to Ford's method, but different. Both use a strategy of "missing tooth" recognition to track relative position of the camshaft and crankshaft versus engine TDC. To be compatible with the Mototron ECM, it was necessary to alter the missing tooth patterns on the Ford cam and crank timing wheels. Three teeth were removed from the cam wheel (refer to Figure 8) to make it compatible with Woodward's 4-1 recognition pattern. One tooth was removed from the crank wheel (refer to Figure 9) to obtain the 36-2 pattern used by Woodward. (Photos are prior
28

to modification). It was also necessary to re-index the crank wheel to accommodate the Mototron timing strategy.
Figure 8 - Camshaft Timing Wheel
Source: Photos of actual hardware by AVL
Figure 9 - Crankshaft Timing Wheel
Source: Photos of actual hardware by AVL
For vehicle applications of this engine, Ford uses an in-house ECM that employs proprietary gasoline-optimized control algorithms and calibrations. This ECM is not compatible with NG fueling, and Ford does not grant permission to access or modify these control features. As discussed earlier, this required use of a substitute Woodward Mototron ECM. It was also necessary to fabricate a unique wiring harness incorporating all required circuits and connectors.
29

Because the Ford engine is equipped with a thermoplastic intake manifold, it was deemed necessary to provide a "pop-off" valve to afford protection against potential damage in the case of a "popback" or backfire in the manifold (which is filled with combustible air/fuel mixture during NG engine operation). An adapter was fabricated to accommodate an available pressure relief valve (GM P/N 13562017) used on production GM Northstar engines, and the unit was inserted downstream of the engine throttle body (Figures 10a and 10b).
Figure 10 - Blow-off Valve
a. Blow-off Valve and Mounting Adaptor b. Installed Position (gasoline configuration)
Source: Photos of actual hardware by AVL
4.3 Testing Configuration 4.3.1 Natural Gas Fuel Supply System The AVL test facility is not serviced by a NG utility. NG engine development tests were conducted using 2000 psi bottled NG that was obtained in a six-pack configuration (Figure 11a). Fuel cylinders in the six-pack were connected to an outlet manifold via individual manual shutoff valves, permitting either multi or single cylinder usage. Six-pack outlet pressure was controlled to 100 psi by the six-pack pressure regulator (Figure 11b). To enable remote fuel shutoff, an electric lock-off valve was installed in this line, followed by a fuel filter and 125 psi relief valve (Figure 11c).
30

Figure 11 - NG Fuel Supply
a. - NG "Six-Pack" b. - Six-Pack 100 psi Regulator c. - Lock-off, Filter, and Relief Source: Photos of actual hardware by AVL
A Coriolis-type flow meter was installed in the filtered 100 psi line to provide measurement of NG mass flow during testing. A second stage of pressure regulation was required to simulate NG source conditions available at Tecogen CHP end-user locations accessing utility-supplied (pipeline) NG. The second-stage regulator supplies NG to the test rig at a pressure of 10 in.-H20. Figures 12a and 12b show the flow meter and second stage regulator installation.
Figure 12 - Flow Meter and Second Stage Regulator
Figure 12a - Fuel Flow Meter Figure 12b - Second Stage Regulator
Source: Photos of actual hardware by AVL
The set-up allowed filtered, regulated NG source fuel to be delivered to the test rig at a pressure simulating typical real-world CHP installation conditions. The engine test rig accomodated the Woodward-supplied fuel lock-off valve and final stage regulator, as well as the two auxilliary ignition modules (Figure 13). From here, fuel entered the engine-mounted control valve and mixer.
Figure 13 - System Fuel and Ignition Components
Lock-off
Filter Relief
Flow Meter
Meter Readout
31

Source: Photos of actual hardware by AVL
4.3.2 Load Absorber and Engine Stand A stand to support the engine and load absorber was designed and fabricated. Exhaust catalysts were mounted in vehicle position (Figure 14). The stand also accommodated the engine cooling system, air cleaner, and other system components (Figure 15).
A UQM Technologies PowerPhase 125 load absorber was used for development testing. The machine operated in either torque-control or speed-control mode and was capable of motoring the engine or applying load.
In torque-control mode, a positive or negative torque could be specified, along with a speed limit. For cranking/starting, a 100 Nm positive torque was specified at an engine speed of 900 RPM.
The speed-control mode was utilized for power absorption testing. Torque limits of +100 Nm (motoring) and -250 Nm (absorbing/generating) were used for this program.
Power testing at discrete speed-load points was accomplished by first selecting an engine speed. Load was then adjusted by moving the engine's electronic throttle via Mototune (the Mototron ECM user interface) or via the system CAN bus. The motor-generator applied appropriate torque to maintain the specified engine speed. When engine torque was being absorbed, electric power was generated and backfed to the building's electric grid connection. When the engine was motored (for starting or to measure engine friction), power was pulled from the grid.
Source Fuel
Supply Line
Lock-off Valve Pressure Regulator
Engine Fuel
Supply Line
Auxiliary Ignition Modules
32

Figure 14 - Test Rig (1)
Source: Photos of actual hardware by AVL
Load Absorber
Catalyst
Air Cleaner
Exhaust Manifold
Oxygen Sensor
Secondary Oxygen Sensor
33
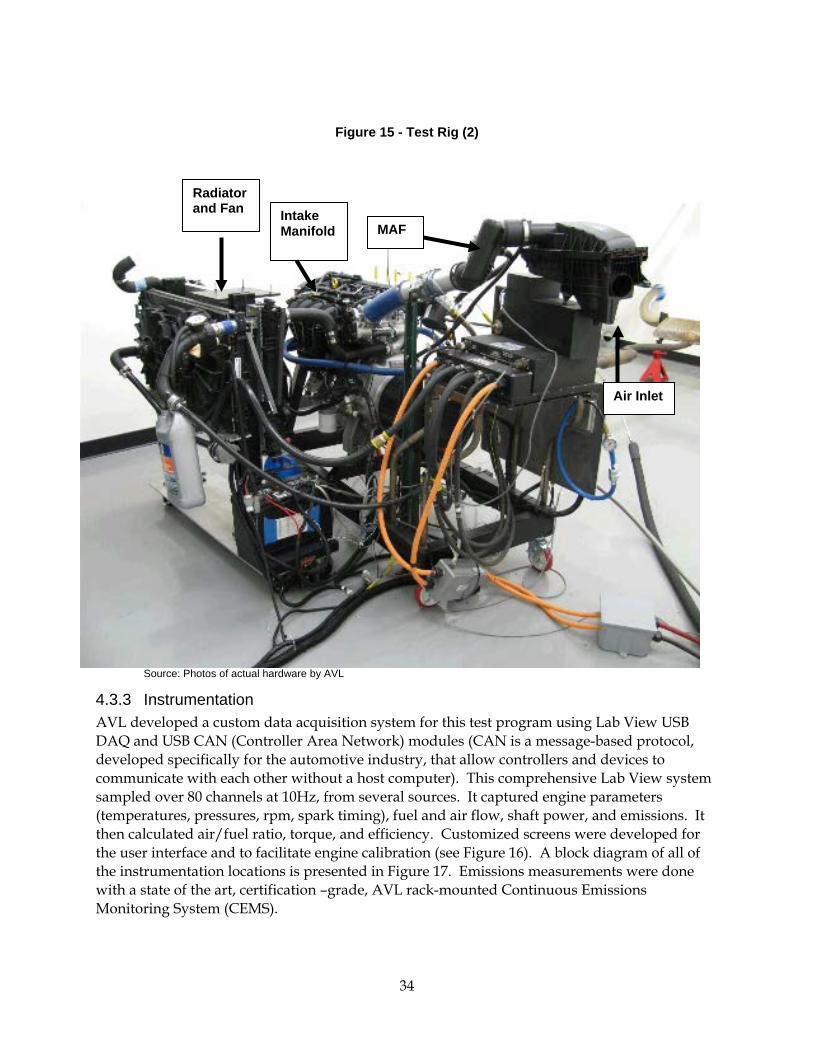
Figure 15 - Test Rig (2)
Source: Photos of actual hardware by AVL
4.3.3 Instrumentation AVL developed a custom data acquisition system for this test program using Lab View USB DAQ and USB CAN (Controller Area Network) modules (CAN is a message-based protocol, developed specifically for the automotive industry, that allow controllers and devices to communicate with each other without a host computer). This comprehensive Lab View system sampled over 80 channels at 10Hz, from several sources. It captured engine parameters (temperatures, pressures, rpm, spark timing), fuel and air flow, shaft power, and emissions. It then calculated air/fuel ratio, torque, and efficiency. Customized screens were developed for the user interface and to facilitate engine calibration (see Figure 16). A block diagram of all of the instrumentation locations is presented in Figure 17. Emissions measurements were done with a state of the art, certification –grade, AVL rack-mounted Continuous Emissions Monitoring System (CEMS).
Air Inlet
MAF
Radiatorand Fan Intake
Manifold
34
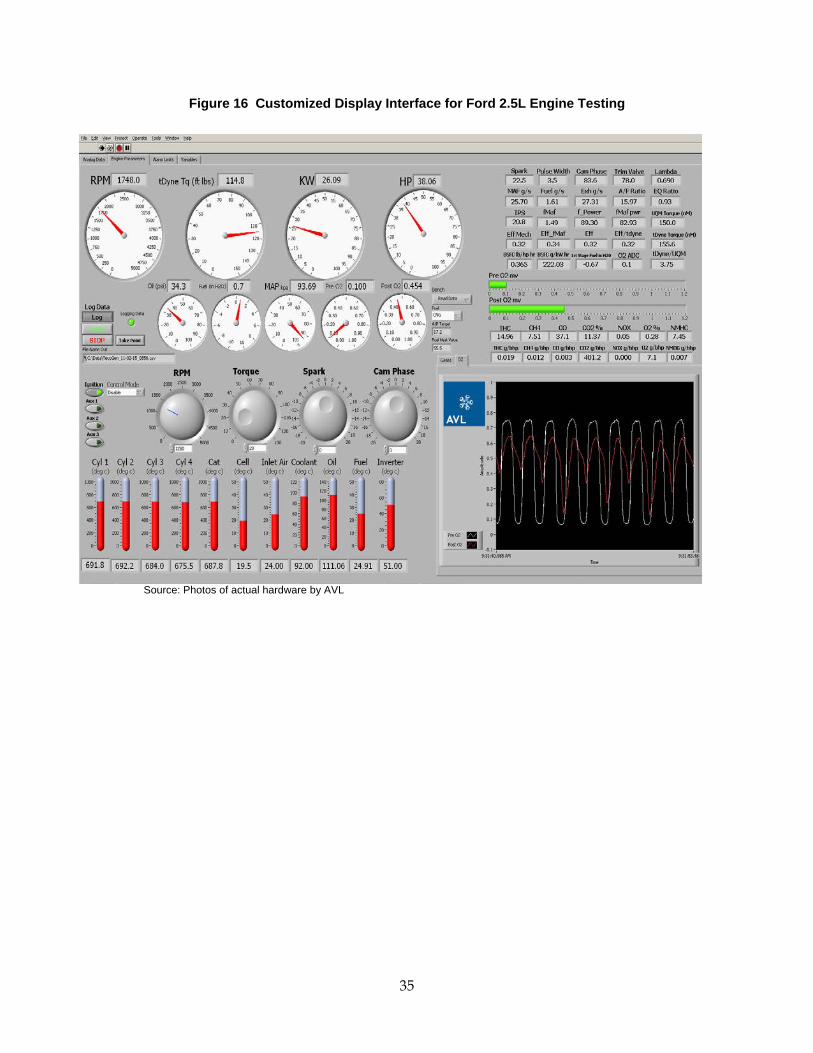
Figure 16 Customized Display Interface for Ford 2.5L Engine Testing
Source: Photos of actual hardware by AVL
35

Figure 17 Instrumentation Block Diagram
Source: Photos of actual hardware by AVL
36
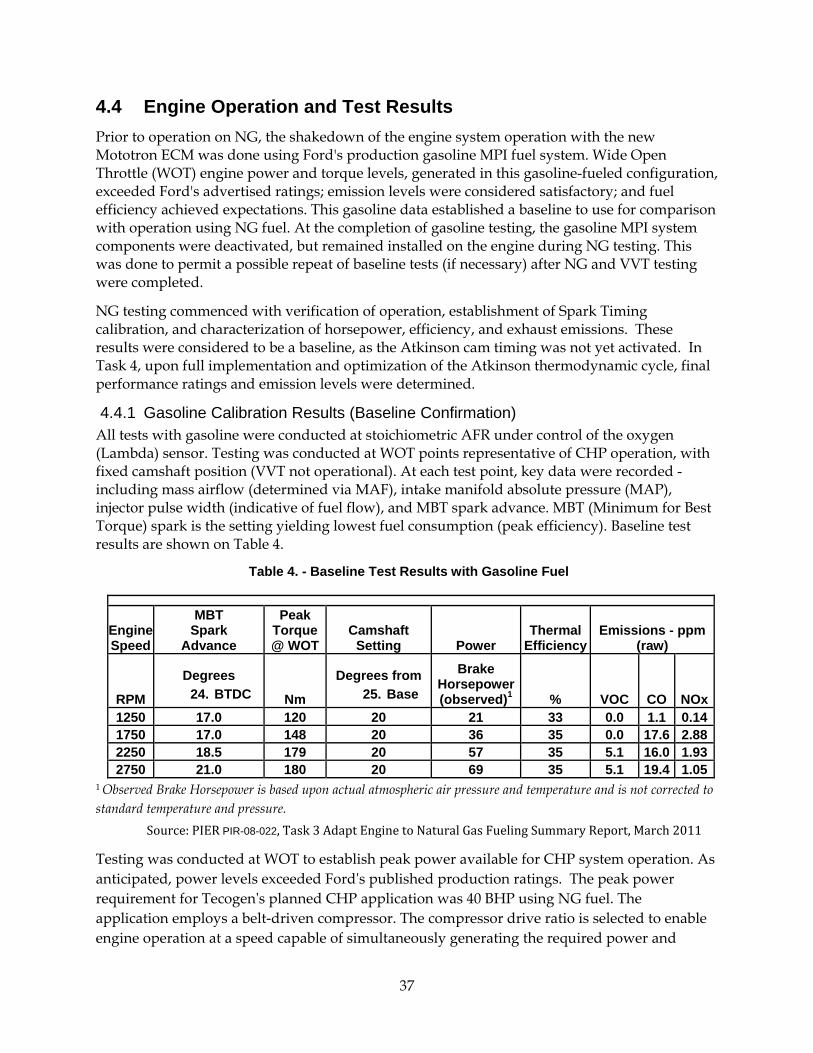
4.4 Engine Operation and Test Results Prior to operation on NG, the shakedown of the engine system operation with the new Mototron ECM was done using Ford's production gasoline MPI fuel system. Wide Open Throttle (WOT) engine power and torque levels, generated in this gasoline-fueled configuration, exceeded Ford's advertised ratings; emission levels were considered satisfactory; and fuel efficiency achieved expectations. This gasoline data established a baseline to use for comparison with operation using NG fuel. At the completion of gasoline testing, the gasoline MPI system components were deactivated, but remained installed on the engine during NG testing. This was done to permit a possible repeat of baseline tests (if necessary) after NG and VVT testing were completed.
NG testing commenced with verification of operation, establishment of Spark Timing calibration, and characterization of horsepower, efficiency, and exhaust emissions. These results were considered to be a baseline, as the Atkinson cam timing was not yet activated. In Task 4, upon full implementation and optimization of the Atkinson thermodynamic cycle, final performance ratings and emission levels were determined.
4.4.1 Gasoline Calibration Results (Baseline Confirmation) All tests with gasoline were conducted at stoichiometric AFR under control of the oxygen (Lambda) sensor. Testing was conducted at WOT points representative of CHP operation, with fixed camshaft position (VVT not operational). At each test point, key data were recorded - including mass airflow (determined via MAF), intake manifold absolute pressure (MAP), injector pulse width (indicative of fuel flow), and MBT spark advance. MBT (Minimum for Best Torque) spark is the setting yielding lowest fuel consumption (peak efficiency). Baseline test results are shown on Table 4.
Table 4. - Baseline Test Results with Gasoline Fuel
Engine Speed
MBT Spark
Advance
Peak Torque @ WOT
Camshaft Setting Power
Thermal Efficiency
Emissions - ppm (raw)
RPM
Degrees 24. BTDC Nm
Degrees from 25. Base
Brake Horsepower (observed)1 % VOC CO NOx
1250 17.0 120 20 21 33 0.0 1.1 0.14 1750 17.0 148 20 36 35 0.0 17.6 2.88 2250 18.5 179 20 57 35 5.1 16.0 1.93 2750 21.0 180 20 69 35 5.1 19.4 1.05
1 Observed Brake Horsepower is based upon actual atmospheric air pressure and temperature and is not corrected to standard temperature and pressure.
Source: PIER PIR-08-022, Task 3 Adapt Engine to Natural Gas Fueling Summary Report, March 2011
Testing was conducted at WOT to establish peak power available for CHP system operation. As anticipated, power levels exceeded Ford's published production ratings. The peak power requirement for Tecogen's planned CHP application was 40 BHP using NG fuel. The application employs a belt-driven compressor. The compressor drive ratio is selected to enable engine operation at a speed capable of simultaneously generating the required power and
37
highest fuel efficiency. Anticipating a power reduction of about 10 percent with NG fuel, and allowing margin for VVT effects, 2250 RPM was selected as the preliminary target engine speed.
Gasoline testing was conducted utilizing Ford's MAF to directly measure mass airflow. It was decided that the final CHP application would delete the MAF device and instead employ a speed-density approach for determining mass airflow resulting in an initial cost saving, reduced maintenance requirements, and improved system reliability. The speed-density approach was incorporated for the NG testing.
4.4.2 Natural Gas Fuel Characteristics (vs. Gasoline) The chemical composition of NG (primarily CH4) has the lowest ratio of C to H of any HC fuel. NG combustion results in a 28 percent reduction in CO2 (per ARB data) compared to gasoline, and reduced levels of other pollutants (CO, VOC, NOx, SOx, and particulates).
NG has an octane rating of about 120 (vs. 89 for regular unleaded gasoline). This would permit operation in an engine with a compression ratio of about 13.5:1 (vs. about 9.5:1 for gasoline) and in turn would theoretically improve thermal efficiency by about 11 percent. (Most NG engines are derived from gasoline engines and do not capture this advantage. Ford's 2.5L Atkinson engine, with a mechanical CR of 12.3, is theoretically capable of an 8 percent efficiency improvement.)
Gasoline has a stoichiometric AFR of 14.7 (by mass). Each kg of air will consume 1/14.7 = .068 kg of fuel. That fuel contains 42.7 MJ/kg x .068 kg = 2.9 MJ of energy.
Methane has a stoichiometric AFR of 14.7 (by mass). Each kg of air will consume 1/17.2 = .058 kg of fuel. That fuel contains 50 MJ/kg x .058 kg = 2.9 MJ of energy.
Therefore, on a mass basis, stoichiometric mixtures of gasoline and NG will contain equal amounts of energy and be capable of producing equal amounts of power.
On a volumetric basis, liquid gasoline occupies negligible volume (less than .01 percent) in the air-fuel charge - each liter of charge will consist of essentially 100 percent air.
However, gaseous methane (NG) has a stoichiometric AFR of 9.7 (by volume). For each liter of air-fuel charge, 1/(9.7+1) = .093 liter (or 9.3 percent) will be fuel, and the remainder (90.7 percent) will be air.
Therefore on a volumetric basis, the NG charge will contain 9.3 percent less energy than the gasoline charge, and the engine operating on NG will (theoretically) produce 9.3 percent less power.
Actual power loss with NG can exceed this theoretical value. The chilling effect of gasoline vaporization can reduce engine air-fuel charge temperature. The resultant small increase in charge density effectively increases power output. This effect does not occur with NG fuel.
Depending upon the specific application and duty cycle, reduced engine power may enable operation at conditions that reduce part throttle pumping losses.
Other characteristics of NG fuel influence engine operating costs. For example, unlike gasoline, NG does not contaminate or dilute the engine's lubricating oil, permitting extended oil change
38

intervals and subsequently reduced operating costs. Spark plug replacement intervals may also be extended.
NG is currently less expensive than gasoline on an equivalent energy basis, further reducing operating costs compared to gasoline.
4.4.3 Natural Gas Calibration Results The NG calibration program entailed establishing a baseline of three primary parameters: horsepower, efficiency, and emissions. The optimization of these parameters is deferred to the Task 4 report since final calibration must be done simultaneously with Atkinson cycle optimization. However, in the following sections, the baseline results will be presented.
HORSEPOWER
Baseline testing was conducted to confirm that the power produced on NG fuel would be sufficient to satisfy program objectives. To simplify testing and also to permit direct comparison to gasoline data, cam timing was fixed at the "20 degree" setting, which is the center of the VVT adjustability range (VVT was deactivated). In theory, this essentially penalizes the NG results by preventing capture of any benefit resulting from the higher octane rating available with NG fuel.
These baseline results are presented in Table 5, which compares the horsepower measured on gasoline (from Table 4) versus NG. This data was taken using brief duration torque readings, as this is a practical test method when tuning for MBT spark (Minimum spark advance for Best Torque).
Table 5 Horsepower – Gasoline vs. Natural Gas
Source: PIER PIR-08-022, Task 3 Adapt Engine to Natural Gas Fueling Summary Report, March 2011
At the target speed of 2250 rpm, the data shows a reduction in power with NG at 6.6 percent, somewhat less than the theoretical 9.6 percent.
However, at 1250 RPM, NG power exceeds gasoline power by a significant margin (29.6 percent). This would indicate that operation on gasoline at this engine speed and with this fixed camshaft setting is most likely "knock limited", which means that spark advance must be retarded from the optimum setting to avoid the occurrence of detonation ("knock"). In an engine fully "optimized" for operation on gasoline, VVT would be employed to adjust camshaft
RPM GasolineNatural
GasNG Power Reduction
1250 21 27.2 -29.6%1750 41.2 40.6 1.6%2250 56.5 52.8 6.6%2750 69.7 65.3 6.4%
Note: 1. Cam timing is at the base setting of 20° (50%)
Horsepower
2. Data represents brief duration torque readings, for the purpose of optimizing spark advance, and should not be used for performance
39

timing at this 1250 RPM point to effectively reduce CR and eliminate "knock" while maintaining the ability to operate with MBT spark.
This 1250 RPM power comparison illustrates how, under certain conditions, the higher octane of NG can result in a real power benefit. However, it is likely that with both camshaft timing and spark timing set to their respective optimums, gasoline power would exceed NG power by an amount similar to that seen at the higher test speeds.
Longer duration steady state data points using a standard engine protocol were done in Task 4 to confirm performance ratings. The program goal was to achieve 40 HP at 2,800 rpm. Based on this baseline data, this engine can produce 40 HP at 1750 rpm and WOT (wide open throttle), so it is sufficiently sized for a range of CHP applications (40 – 60 HP). Figure 18 presents a full sweep of horsepower and efficiency vs. ROM over a range of throttle settings (MAP -Manifold Absolute Pressure values).
Figure 18 - Baseline Performance on Natural Gas
Source: PIER PIR-08-022, Task 3 Adapt Engine to Natural Gas Fueling Summary Report, March 2011
0
10
20
30
40
50
60
70
80
90
100
110
120
130
140
150
160
0.1
0.11
0.12
0.13
0.14
0.15
0.16
0.17
0.18
0.19
0.2
0.21
0.22
0.23
0.24
0.25
0.26
0.27
0.28
0.29
0.3
0.31
0.32
0.33
0.34
0.35
0.36
0.37
0.38
1000 1200 1400 1600 1800 2000 2200 2400 2600 2800 3000 3200
HP
Effi
cien
cy [H
HV
55
MJ/
Kg]
Speed
29.53
26.58
23.62
20.67
17.72
29.53
26.58
23.62
20.67
17.72
MAP [in hg]
Horsepower
Efficiency
40

EFFICIENCY
As discussed in Section 4.4.2, since NG has a higher octane rating than gasoline, it can operate at higher compression ratios than gasoline, and thus more efficiently. However, in our baseline comparison of gasoline to NG, we used the base cam timing in both cases, and thus the same compression ratio. Therefore, we did not expect a significant efficiency difference between the two fuels and data in Table 6 shows this to be the case.
Table 6 Efficiency – Gasoline vs. Natural Gas
Source: PIER PIR-08-022, Task 3 Adapt Engine to Natural Gas Fueling Summary Report, March 2011
For further characterization of efficiency, sweeps were done at various speeds and horsepower levels as shown in Figure 18. As previously noted, the method used to obtain this data was brief duration torque readings, as this is a practical test method when tuning for MBT spark (Minimum spark advance for Best Torque). This data indicated that this engine appears to easily meet the program performance goals for power and efficiency. The efficiency goal for the program was 31.1 percent HHV (Higher Heating Value or 35.1 percent LHV (Lower Heating Value). Figure 15 shows that the efficiency measurements were also better than expected at 35 percent (HHV) or 39 percent (LHV) in the HP range for our CHP application. However, some steady state data points, using a standard engine protocol, still needed to be taken in order to confirm the performance ratings.
EMISSIONS
Compliance with CARB 2007 stationary engine emission standards was a key project objective. These standards, and the derived Program Emission Targets, are shown on Table 7. Line 1 presents the pollutant limits per the CARB regulation for fossil fuel fired DG units. In Line 2, the CARB standard is converted to the allowable pollutant concentration, including a heat recovery credit for a CHP system with an overall efficiency of 60 percent, which is the minimum efficiency threshold required for a credit. These pollutant concentrations are expressed at 0 percent O2, which is analogous to the raw emissions measured with an exhaust gas analyzer. Line 3 corrects these values to pollutant concentration expressed at 15 percent O2, which is the industry standard for reporting emission concentrations.
RPM GasolineNatural
GasEfficiency
Comparison1250 0.35 0.32 7.4%1750 0.35 0.35 0.0%2250 0.35 0.35 0.0%2750 0.35 0.34 2.9%
Note: 1. Cam timing is at the base setting of 20° (50%)
Efficiency
2. Data represents brief duration torque readings, for the purpose of optimizing spark advance, and should not be used for performance
41

Assessment of Best Available Technology (BAT) resulted in the selection of an emission control system employing a 3WC in conjunction with a stoichiometric AFR control strategy. In this application, the testing indicated that the best emission control system efficiency (compromised for simultaneous control of NOx, CO, and VOC) was achieved with AFR controlled slightly (less than 1 percent) rich of the 17.2:1 stoichiometric AFR for NG. A feedback control system incorporating exhaust oxygen sensors, located upstream and downstream of the 3WC, was calibrated to maintain AFR in a tight band around this optimum level.
Table 7 - Emission Targets
Source: 1) California Code of Regulation, Section 94200-94214, Article 3, Subchapter 8, Chapter 1, Division 3 of Title 17, 2) PIER PIR-08-022, Task 3 Adapt Engine to Natural Gas Fueling Summary Report, March 2011
Tests were performed to determine the optimal settings for the P-I-D control parameters, with an objective of achieving peak 3WC conversion efficiencies. The initial emissions measurements of NOx easily met the CARB 2007 limits, but the CO emissions struggled to consistently stay below the CARB level. A typical interval of data is presented in Figure 19 which shows approximately six minutes of data recorded on the exhaust gas analyzer. The NOx consistently is near zero, while the CO experiences significant variations in this short period of time.
Although the average level of CO was acceptable, we needed to achieve more robust compliance with our final optimization testing in Task 4. Given that, we planned to equip the engine with our two stage catalyst design, developed on the PIER funded program (PNG-06-002), in order to try to obtain consistent compliant CO levels throughout the operating range. Also, we expected that the addition of this system would provide a safety margin as components age (i.e. catalyst, O2 sensors and engine).
Figure 19 - Baseline Emission Levels
NOx CO VOC1 CARB DG Emission Standard [lb/MW-hr] 0.07 0.10 0.022 ppmvd @ 0% O2 (60% Effic Credit)1 11.9 55.7 9.73 ppmvd @ 15% O2 (60% Effic Credit)1 3.3 15.7 2.7
Note: Calculation for pollutant concentration based on a Distributed Generation unit meeting a 60% system efficiency specification, the threshold required for heat recovery credit.
42
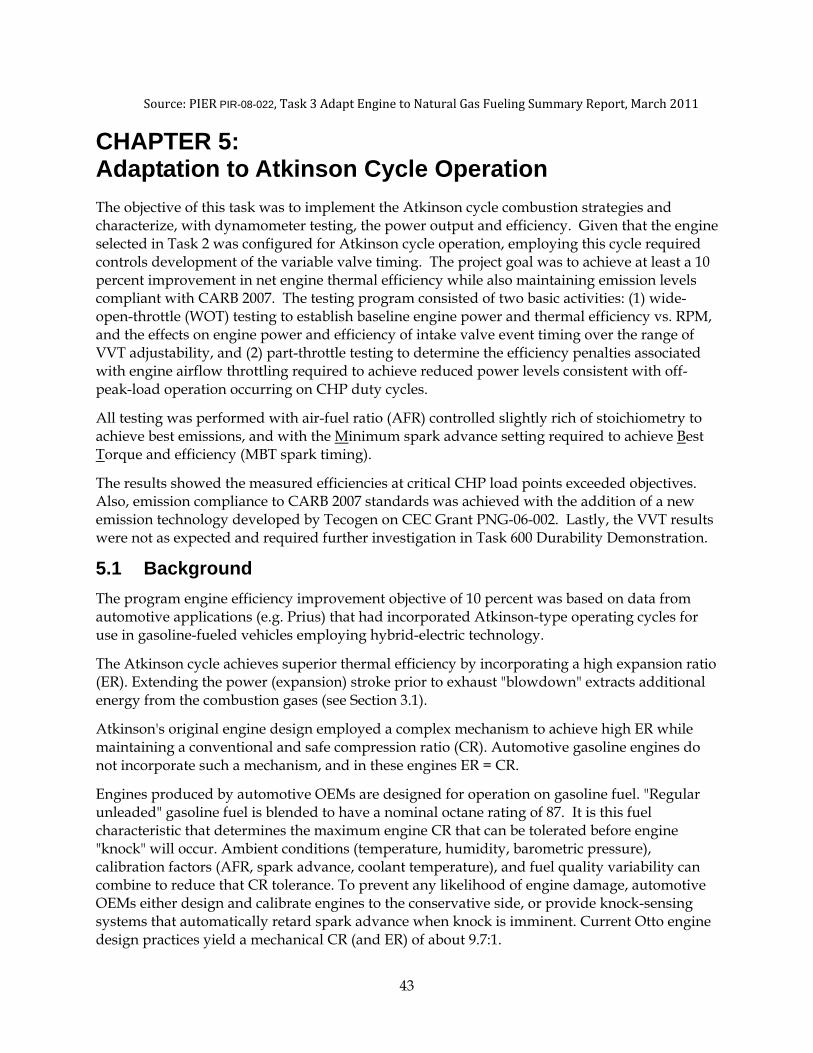
Source: PIER PIR-08-022, Task 3 Adapt Engine to Natural Gas Fueling Summary Report, March 2011
CHAPTER 5: Adaptation to Atkinson Cycle Operation The objective of this task was to implement the Atkinson cycle combustion strategies and characterize, with dynamometer testing, the power output and efficiency. Given that the engine selected in Task 2 was configured for Atkinson cycle operation, employing this cycle required controls development of the variable valve timing. The project goal was to achieve at least a 10 percent improvement in net engine thermal efficiency while also maintaining emission levels compliant with CARB 2007. The testing program consisted of two basic activities: (1) wide-open-throttle (WOT) testing to establish baseline engine power and thermal efficiency vs. RPM, and the effects on engine power and efficiency of intake valve event timing over the range of VVT adjustability, and (2) part-throttle testing to determine the efficiency penalties associated with engine airflow throttling required to achieve reduced power levels consistent with off-peak-load operation occurring on CHP duty cycles.
All testing was performed with air-fuel ratio (AFR) controlled slightly rich of stoichiometry to achieve best emissions, and with the Minimum spark advance setting required to achieve Best Torque and efficiency (MBT spark timing).
The results showed the measured efficiencies at critical CHP load points exceeded objectives. Also, emission compliance to CARB 2007 standards was achieved with the addition of a new emission technology developed by Tecogen on CEC Grant PNG-06-002. Lastly, the VVT results were not as expected and required further investigation in Task 600 Durability Demonstration.
5.1 Background The program engine efficiency improvement objective of 10 percent was based on data from automotive applications (e.g. Prius) that had incorporated Atkinson-type operating cycles for use in gasoline-fueled vehicles employing hybrid-electric technology.
The Atkinson cycle achieves superior thermal efficiency by incorporating a high expansion ratio (ER). Extending the power (expansion) stroke prior to exhaust "blowdown" extracts additional energy from the combustion gases (see Section 3.1).
Atkinson's original engine design employed a complex mechanism to achieve high ER while maintaining a conventional and safe compression ratio (CR). Automotive gasoline engines do not incorporate such a mechanism, and in these engines ER = CR.
Engines produced by automotive OEMs are designed for operation on gasoline fuel. "Regular unleaded" gasoline fuel is blended to have a nominal octane rating of 87. It is this fuel characteristic that determines the maximum engine CR that can be tolerated before engine "knock" will occur. Ambient conditions (temperature, humidity, barometric pressure), calibration factors (AFR, spark advance, coolant temperature), and fuel quality variability can combine to reduce that CR tolerance. To prevent any likelihood of engine damage, automotive OEMs either design and calibrate engines to the conservative side, or provide knock-sensing systems that automatically retard spark advance when knock is imminent. Current Otto engine design practices yield a mechanical CR (and ER) of about 9.7:1.
43
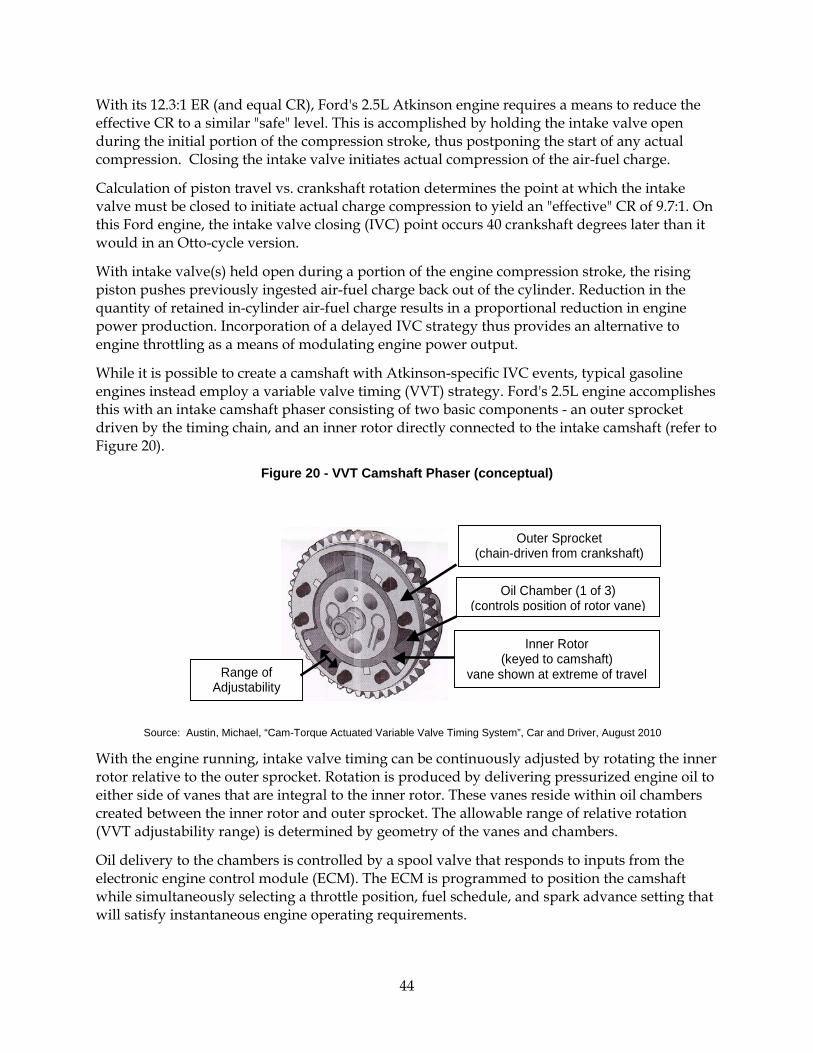
With its 12.3:1 ER (and equal CR), Ford's 2.5L Atkinson engine requires a means to reduce the effective CR to a similar "safe" level. This is accomplished by holding the intake valve open during the initial portion of the compression stroke, thus postponing the start of any actual compression. Closing the intake valve initiates actual compression of the air-fuel charge.
Calculation of piston travel vs. crankshaft rotation determines the point at which the intake valve must be closed to initiate actual charge compression to yield an "effective" CR of 9.7:1. On this Ford engine, the intake valve closing (IVC) point occurs 40 crankshaft degrees later than it would in an Otto-cycle version.
With intake valve(s) held open during a portion of the engine compression stroke, the rising piston pushes previously ingested air-fuel charge back out of the cylinder. Reduction in the quantity of retained in-cylinder air-fuel charge results in a proportional reduction in engine power production. Incorporation of a delayed IVC strategy thus provides an alternative to engine throttling as a means of modulating engine power output.
While it is possible to create a camshaft with Atkinson-specific IVC events, typical gasoline engines instead employ a variable valve timing (VVT) strategy. Ford's 2.5L engine accomplishes this with an intake camshaft phaser consisting of two basic components - an outer sprocket driven by the timing chain, and an inner rotor directly connected to the intake camshaft (refer to Figure 20).
Figure 20 - VVT Camshaft Phaser (conceptual)
Outer Sprocket (chain-driven from crankshaft)
Inner Rotor (keyed to camshaft)
vane shown at extreme of travel
Oil Chamber (1 of 3) (controls position of rotor vane)
Range of Adjustability
Source: Austin, Michael, “Cam-Torque Actuated Variable Valve Timing System”, Car and Driver, August 2010
With the engine running, intake valve timing can be continuously adjusted by rotating the inner rotor relative to the outer sprocket. Rotation is produced by delivering pressurized engine oil to either side of vanes that are integral to the inner rotor. These vanes reside within oil chambers created between the inner rotor and outer sprocket. The allowable range of relative rotation (VVT adjustability range) is determined by geometry of the vanes and chambers.
Oil delivery to the chambers is controlled by a spool valve that responds to inputs from the electronic engine control module (ECM). The ECM is programmed to position the camshaft while simultaneously selecting a throttle position, fuel schedule, and spark advance setting that will satisfy instantaneous engine operating requirements.
44

In addition to reducing CR, late IVC also effectively shrinks engine displacement, enabling reduced power output. Ford's 2.5L Atkinson engine provides an IVC adjustability range of about 40 crankshaft degrees. Figure 21 presents a timing diagram illustrating the two extreme limits of the cam timing. The highest level of late IVC occurs at 0 percent of cam rotation. In this case, the intake valve does not close until 77 ABDC, thus reducing the CR to 4.78:1 and effectively reducing the engine displacement by about 50 percent. At 100 percent of the cam timing adjustment (C100), the intake valve closes at 37 ABDC, providing the highest compression ratio of 10.1:1, and thus the highest power levels.
Figure 21 - Ford 2.5L VVT Timing Diagram
Source: PIER PIR-08-022, Task 4 Adapt Engine to Atkinson Cycle Summary Report, August 2011
It is important to note that this engine cannot operate with the standard Otto cycle, where the intake valve closes at BDC, because this would result in a CR equal to the ER of 12.3:1, causing detonation on gasoline fuel. Natural Gas (NG) fuel has an octane rating of about 130 (vs. 87 for gasoline), so an engine designed specifically for operation on NG could therefore tolerate a high CR, up to about 14:1. (Honda's Civic NGV uses a CR of 12.5:1 which may represent a more practical maximum). Both the high CR Honda and Ford's Atkinson engine could operate on NG fuel using conventional Otto-cycle valve timing (i.e. with no requirement for delayed IVC).
And yet, Honda's Civic NGV does have an intake valve VVT system (trademark name i-VTEC). However, the Honda strategy involves multiple camshaft profiles that actually reduces intake valve lift and duration, or completely shuts off one of the two intake valves at low rpm. By using the valves to modulate fuel flow, the typical throttling loss is avoided at low load, resulting in improved volumetric efficiency. By contrast, the Ford VVT system is attempting to improve efficiency on a gasoline engine by reducing CR while maintaining a high ER (simulated Atkinson cycle). However, there is work losses associated with this method and the test data will show that this approach is not necessarily beneficial on a natural gas engine.
In Tecogen's NG-fueled CHP applications, the principal role for VVT was expected to be modulation of engine power to reduce the requirement for engine throttling, thereby enabling increased efficiency during some off-peak-load operating conditions. This is particularly
45
important in heat pump applications, which have two primary modes of off peak operation. The first occurs when customer demand for heat is less than what the system is capable of delivering. In this situation, compressor power demand drops. To match that lower power demand, engine RPM is reduced. (The belt driven compressor is now also operating at reduced RPM). The engine RPM tracks down the engine WOT power curve as required until a minimum RPM is reached, as this is the most efficient method of unloading an engine. At or below this RPM threshold, throttling or delayed IVC is required to further reduce engine power.
The second mode of off peak operation occurs when ambient (outdoor) temperature drops and the system is no longer capable of producing its peak (rated) level of heating; i.e. heat demand can no longer be satisfied by the system. In this situation, it is necessary to continue operating the compressor (and engine) at maximum rated speed to deliver as much heat as is possible. But because less heat is actually being delivered, engine power demand is reduced.
Figure 22 illustrates the behavior of a typical refrigeration compressor. Engine power requirement drops by about 30 percent from its peak level as ambient temperature approaches freezing. This engine power reduction can be accomplished either via pure throttling, or by using a combination of throttling and VVT. The objective is to use whichever method delivers best efficiency.
Figure 22 - Heat Pump Output and Engine Power vs. Saturated Suction Temperature
Source: PIER PIR-08-022, Task 4 Adapt Engine to Atkinson Cycle Summary Report, August 2011
46
5.2 Spark and Valve Timing Optimization All efficiency tests were conducted with AFR set slightly rich of stoichiometry (based on best tailpipe emissions) and with a wide open throttle (WOT). Tests were conducted at a series of discrete engine RPMs, while IVC at each RPM was varied over the range of VVT adjustability.
With these test conditions defined, determination of peak efficiency requires only identification of optimal spark timing - defined as MBT timing - denoting "Minimum for Best Torque." MBT spark timing is unique for each tested condition, and produces maximum torque and minimum fuel consumption (i.e. maximum engine efficiency) for that condition. MBT spark is determined by operating the engine at a constant RPM and throttle opening (in this case WOT) while incrementally increasing spark advance until a torque peak is achieved.
5.3 Engine Efficiency Once all settings were optimized at each test point, data was collected to determine engine efficiency. Efficiency is calculated by comparing engine power output to fuel energy input, with the resultant ratio (%) defined as thermal efficiency or "shaft efficiency." These efficiency numbers were reproducible within +/- 0.5 percent, so efficiency results are stated in whole percent values.
Engine Output is measured in kW-hr and converted to Joules (1 kW-hr = 3.6 MJ)
Fuel Energy Input is calculated as the product of Fuel Flow and Fuel Specific Heating Value:
Fuel Flow is measured in g/sec and converted to kg/hr (1 g/s = 3.6 kg/hr) Lower Specific Fuel Heating Value (LHV) = 50 MJ/kg (test fuel is 99.9 percent methane)
Efficiency = (kW-hr x 3.6)MJ / (g/s x 3.6 x LHV)MJ = kW-hr / (g/s x 50) Efficiency and power will vary with fuel composition. Fuels with higher heating value will produce more power (increasing the numerator in the efficiency equation). But at the same time fuel energy input (the denominator in the fuel equation) also increases. The differences tend to offset one another and thus result in relatively small variations in efficiency.
5.4 Test Results – Engine Power and Efficiency Figure 23 presents WOT engine power vs. RPM and IVC timing. Figure 24 is a similar plot showing WOT engine efficiency vs. RPM and IVC timing. As expected, higher power levels were achieved at the least delayed IVC timing position of 37 ABDC, the setting that yields the highest engine compression ratio of 10.2:1. However, the efficiency results were not as expected. There appears to be no efficiency gain with the delayed IVC, other than at very low speed. The data also indicated that efficiency improved slightly at engine speeds above 1750 RPM, reaching a peak between 2250 and 2500 RPM
Figure 25 is an alternative presentation of this data as Efficiency vs. HP. At the rating point of 40 HP, the 37 ABDC point provides the optimum efficiency of 37.2 percent LHV (33.8 percent HHV). In fact, it is not until below 30 HP that there is any benefit to modulating the delayed IVC from this 100 percent (37ABDC) setting.
47
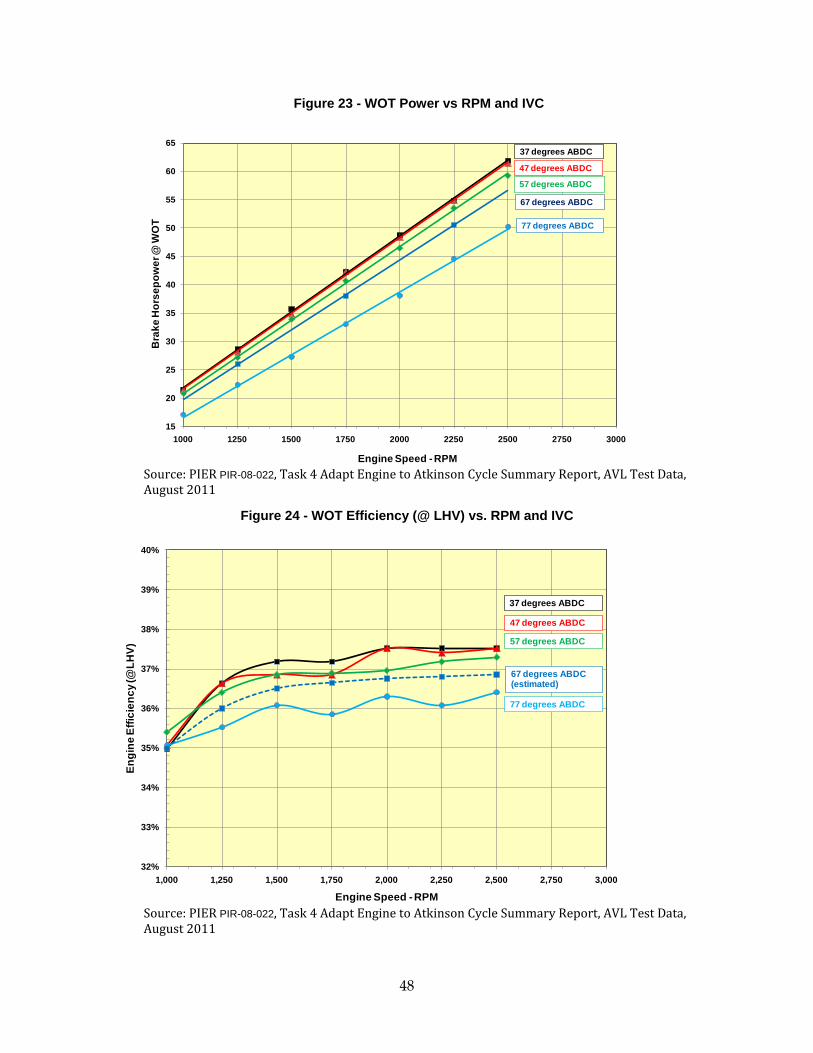
Figure 23 - WOT Power vs RPM and IVC
Source: PIER PIR-08-022, Task 4 Adapt Engine to Atkinson Cycle Summary Report, AVL Test Data, August 2011
Figure 24 - WOT Efficiency (@ LHV) vs. RPM and IVC
Source: PIER PIR-08-022, Task 4 Adapt Engine to Atkinson Cycle Summary Report, AVL Test Data, August 2011
15
20
25
30
35
40
45
50
55
60
65
1000 1250 1500 1750 2000 2250 2500 2750 3000
Bra
ke H
orse
pow
er @
WO
T
Engine Speed - RPM
77 degrees ABDC
57 degrees ABDC
47 degrees ABDC
37 degrees ABDC
67 degrees ABDC
32%
33%
34%
35%
36%
37%
38%
39%
40%
1,000 1,250 1,500 1,750 2,000 2,250 2,500 2,750 3,000
Engi
ne E
ffici
ency
(@LH
V)
Engine Speed - RPM
77 degrees ABDC
57 degrees ABDC
47 degrees ABDC
37 degrees ABDC3
67 degrees ABDC(estimated)
48
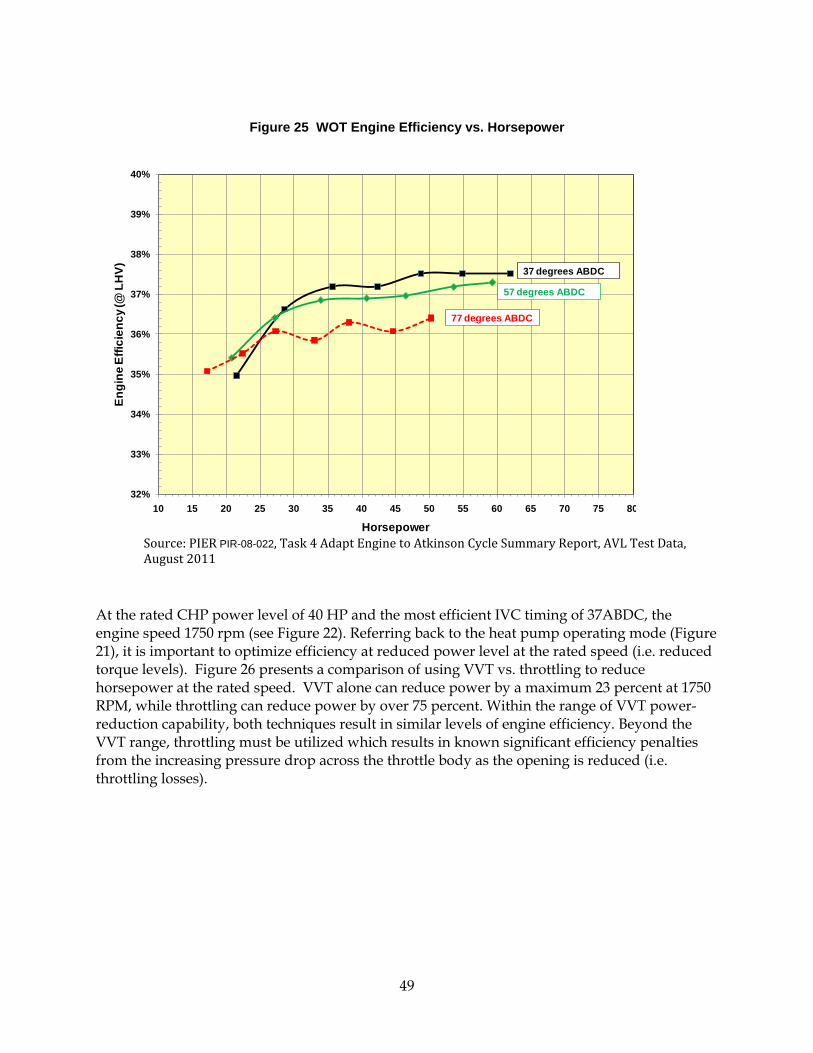
Figure 25 WOT Engine Efficiency vs. Horsepower
Source: PIER PIR-08-022, Task 4 Adapt Engine to Atkinson Cycle Summary Report, AVL Test Data, August 2011
At the rated CHP power level of 40 HP and the most efficient IVC timing of 37ABDC, the engine speed 1750 rpm (see Figure 22). Referring back to the heat pump operating mode (Figure 21), it is important to optimize efficiency at reduced power level at the rated speed (i.e. reduced torque levels). Figure 26 presents a comparison of using VVT vs. throttling to reduce horsepower at the rated speed. VVT alone can reduce power by a maximum 23 percent at 1750 RPM, while throttling can reduce power by over 75 percent. Within the range of VVT power-reduction capability, both techniques result in similar levels of engine efficiency. Beyond the VVT range, throttling must be utilized which results in known significant efficiency penalties from the increasing pressure drop across the throttle body as the opening is reduced (i.e. throttling losses).
32%
33%
34%
35%
36%
37%
38%
39%
40%
10 15 20 25 30 35 40 45 50 55 60 65 70 75 80
Engi
ne E
ffici
ency
(@ L
HV)
Horsepower
77 degrees ABDC
57 degrees ABDC
37 degrees ABDC3
49

Figure 26 - Part Throttle Efficiency vs. Engine Power @ 1750 RPM
Source: PIER PIR-08-022, Task 4 Adapt Engine to Atkinson Cycle Summary Report, AVL Test Data, August 2011
Again, the unexpected result is that the IVC does not provide an efficiency benefit when using it to reduce power, even at a fixed speed. An explanation for this anomaly is that this engine is not a true Atkinson engine, but rather an Otto engine using a simulated Atkinson cycle. The difference is that a true Atkinson engine uses a complex design to mechanically achieve ER > CR. The intake and compression strokes are actually shorter than the subsequent expansion and exhaust strokes, whereas this Ford 2.5L hybrid engine uses valve timing to simulate this condition. It actually fills the entire cylinder with air-fuel charge on the intake stroke, then pumps some of this charge back out during the initial part of the compression stroke (while the intake valve remains open). This "filling and partial emptying" step requires work to be performed. The actual Atkinson engine does not have to do that work, and therefore will have net higher efficiency. So the ideal Atkinson efficiency formula overstates what we can actually achieve with our simulated Atkinson approach.
Overall, this simulated Atkinson engine does provide a significant efficiency benefit, when compared to a standard Otto cycle engine. This is a result of the higher ER. Referring to the theoretical equation for efficiency of an Otto cycle (see Section 3.1 for derivation):
Standard Otto Cycle:
50

Where, and )
At CR =ER=9.7
Alternatively, the theoretical efficiency of the Atkinson cycle is as follows:
Atkinson Cycle:
Where, and
Theoretically, an Atkinson cycle should improve efficiency over that of an Otto cycle by 11 percent.
The simulated Atkinson cycle with VVT was adopted to capture the efficiency effect of high ER while maintaining an ability to operate on gasoline fuel by allowing the CR to not exceed 9.7, the knock limit. However, NG fuel can tolerate a higher CR without experiencing detonation so an Otto engine design with CR = ER =12.7 would provide the efficiency benefit without any need for late IVC, at least from an efficiency standpoint. Theoretically, operating an Otto Cycle at a higher compression ratio also yields a significant improvement in efficiency:
Standard Otto Cycle
Where,
This efficiency improvement is 7.3 percent.
Therefore, this Ford hybrid engine proved to meet the efficiency goals of the program by virtue of the high ER. Although late IVC is required on a gasoline engine to obtain a high ER, it does not appear to provide any efficiency benefit with NG operation, other than at very low load conditions.
5.5 Emission Control System The typical emission control system used on CHP equipment produced by Tecogen, prior to recent implementation of more stringent emission standards, consisted of a three-way catalyst (3WC). 3WCs are currently used successfully in most modern automotive applications, including Honda’s Civic NGV. A 3WC simultaneously controls CO, NOx, and VOC emissions when the engine is operated at an air-fuel ratio (AFR) tightly controlled close to the stoichiometric AFR, which is 17.2:1 with natural gas fuel.
51
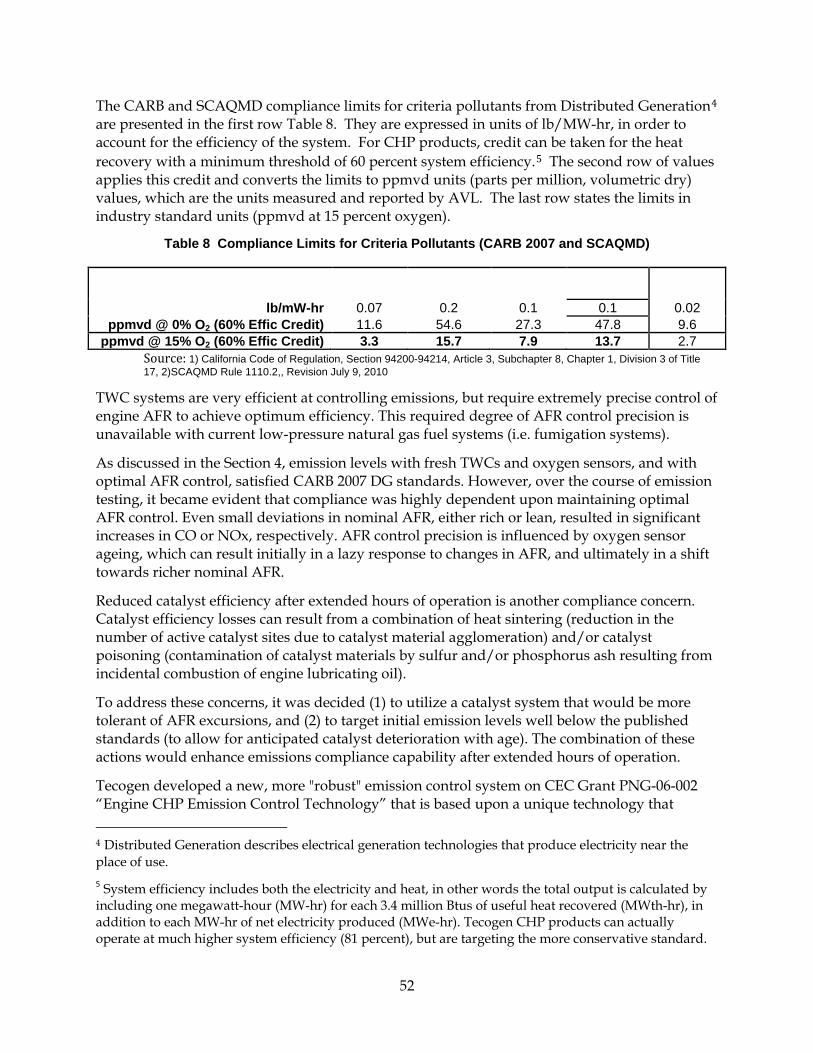
The CARB and SCAQMD compliance limits for criteria pollutants from Distributed Generation4 are presented in the first row Table 8. They are expressed in units of lb/MW-hr, in order to account for the efficiency of the system. For CHP products, credit can be taken for the heat recovery with a minimum threshold of 60 percent system efficiency.5 The second row of values applies this credit and converts the limits to ppmvd units (parts per million, volumetric dry) values, which are the units measured and reported by AVL. The last row states the limits in industry standard units (ppmvd at 15 percent oxygen).
Table 8 Compliance Limits for Criteria Pollutants (CARB 2007 and SCAQMD)
NOx
CO (SCAQMD)
CO (CARB)
VOC (SCAQMD)
VOC (CARB)
lb/mW-hr 0.07 0.2 0.1 0.1 0.02 ppmvd @ 0% O2 (60% Effic Credit) 11.6 54.6 27.3 47.8 9.6
ppmvd @ 15% O2 (60% Effic Credit) 3.3 15.7 7.9 13.7 2.7 Source: 1) California Code of Regulation, Section 94200-94214, Article 3, Subchapter 8, Chapter 1, Division 3 of Title 17, 2)SCAQMD Rule 1110.2,, Revision July 9, 2010
TWC systems are very efficient at controlling emissions, but require extremely precise control of engine AFR to achieve optimum efficiency. This required degree of AFR control precision is unavailable with current low-pressure natural gas fuel systems (i.e. fumigation systems).
As discussed in the Section 4, emission levels with fresh TWCs and oxygen sensors, and with optimal AFR control, satisfied CARB 2007 DG standards. However, over the course of emission testing, it became evident that compliance was highly dependent upon maintaining optimal AFR control. Even small deviations in nominal AFR, either rich or lean, resulted in significant increases in CO or NOx, respectively. AFR control precision is influenced by oxygen sensor ageing, which can result initially in a lazy response to changes in AFR, and ultimately in a shift towards richer nominal AFR.
Reduced catalyst efficiency after extended hours of operation is another compliance concern. Catalyst efficiency losses can result from a combination of heat sintering (reduction in the number of active catalyst sites due to catalyst material agglomeration) and/or catalyst poisoning (contamination of catalyst materials by sulfur and/or phosphorus ash resulting from incidental combustion of engine lubricating oil).
To address these concerns, it was decided (1) to utilize a catalyst system that would be more tolerant of AFR excursions, and (2) to target initial emission levels well below the published standards (to allow for anticipated catalyst deterioration with age). The combination of these actions would enhance emissions compliance capability after extended hours of operation.
Tecogen developed a new, more "robust" emission control system on CEC Grant PNG-06-002 “Engine CHP Emission Control Technology” that is based upon a unique technology that
4 Distributed Generation describes electrical generation technologies that produce electricity near the place of use. 5 System efficiency includes both the electricity and heat, in other words the total output is calculated by including one megawatt-hour (MW-hr) for each 3.4 million Btus of useful heat recovered (MWth-hr), in addition to each MW-hr of net electricity produced (MWe-hr). Tecogen CHP products can actually operate at much higher system efficiency (81 percent), but are targeting the more conservative standard.
52
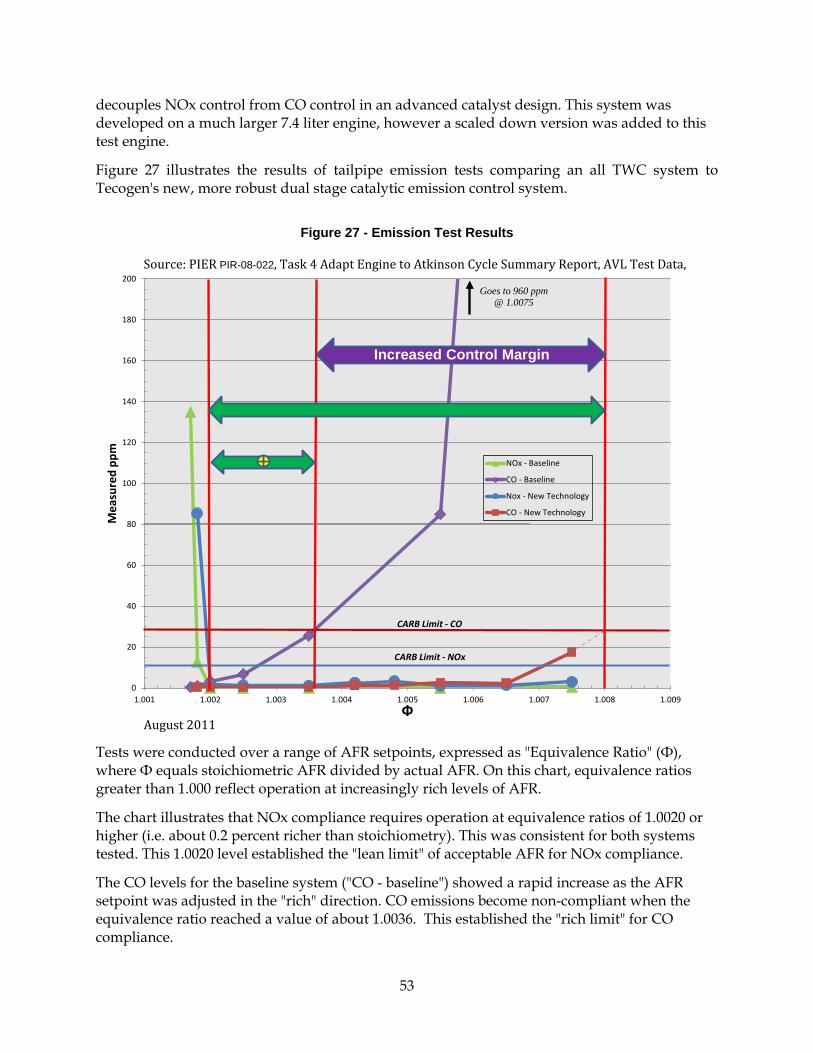
decouples NOx control from CO control in an advanced catalyst design. This system was developed on a much larger 7.4 liter engine, however a scaled down version was added to this test engine.
Figure 27 illustrates the results of tailpipe emission tests comparing an all TWC system to Tecogen's new, more robust dual stage catalytic emission control system.
Figure 27 - Emission Test Results
Source: PIER PIR-08-022, Task 4 Adapt Engine to Atkinson Cycle Summary Report, AVL Test Data,
August 2011
Tests were conducted over a range of AFR setpoints, expressed as "Equivalence Ratio" (Ф), where Ф equals stoichiometric AFR divided by actual AFR. On this chart, equivalence ratios greater than 1.000 reflect operation at increasingly rich levels of AFR.
The chart illustrates that NOx compliance requires operation at equivalence ratios of 1.0020 or higher (i.e. about 0.2 percent richer than stoichiometry). This was consistent for both systems tested. This 1.0020 level established the "lean limit" of acceptable AFR for NOx compliance.
The CO levels for the baseline system ("CO - baseline") showed a rapid increase as the AFR setpoint was adjusted in the "rich" direction. CO emissions become non-compliant when the equivalence ratio reached a value of about 1.0036. This established the "rich limit" for CO compliance.
0
20
40
60
80
100
120
140
160
180
200
1.001 1.002 1.003 1.004 1.005 1.006 1.007 1.008 1.009
Mea
sure
d pp
m
Ф
NOx - Baseline
CO - Baseline
Nox - New Technology
CO - New Technology
CARB Limit - CO
CARB Limit - NOx
Goes to 960 ppm @ 1.0075
Increased Control Margin
53
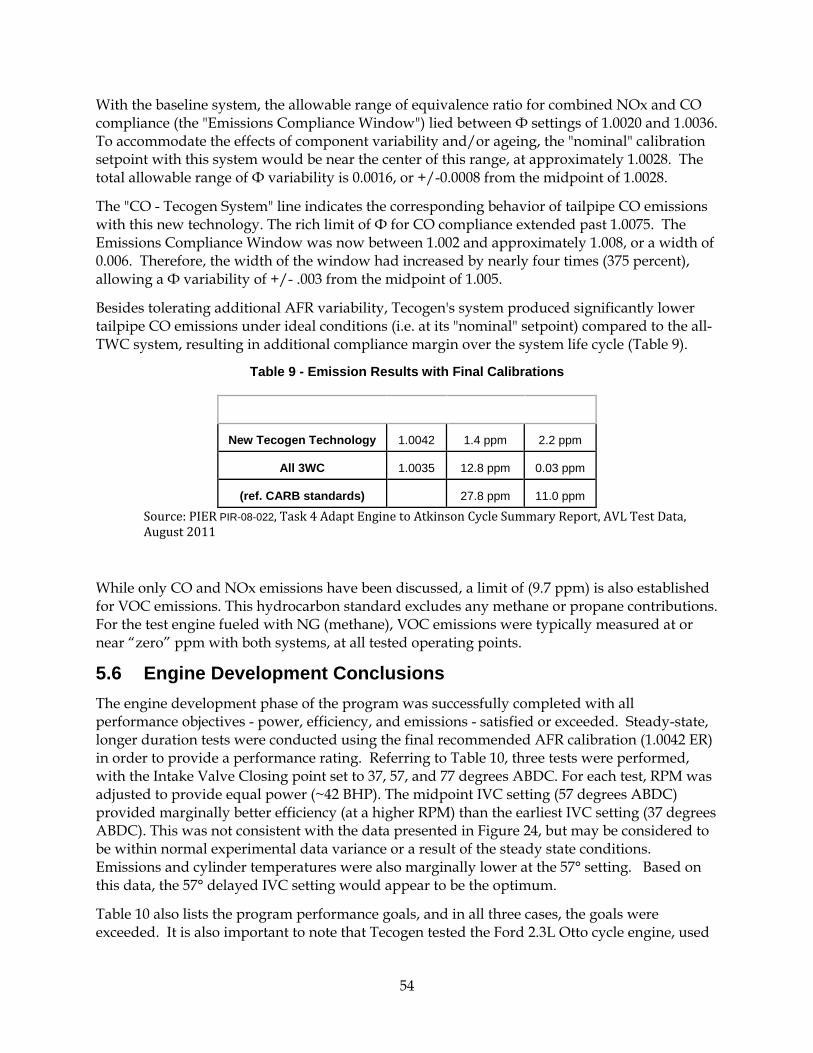
With the baseline system, the allowable range of equivalence ratio for combined NOx and CO compliance (the "Emissions Compliance Window") lied between Ф settings of 1.0020 and 1.0036. To accommodate the effects of component variability and/or ageing, the "nominal" calibration setpoint with this system would be near the center of this range, at approximately 1.0028. The total allowable range of Ф variability is 0.0016, or +/-0.0008 from the midpoint of 1.0028.
The "CO - Tecogen System" line indicates the corresponding behavior of tailpipe CO emissions with this new technology. The rich limit of Ф for CO compliance extended past 1.0075. The Emissions Compliance Window was now between 1.002 and approximately 1.008, or a width of 0.006. Therefore, the width of the window had increased by nearly four times (375 percent), allowing a Ф variability of +/- .003 from the midpoint of 1.005.
Besides tolerating additional AFR variability, Tecogen's system produced significantly lower tailpipe CO emissions under ideal conditions (i.e. at its "nominal" setpoint) compared to the all-TWC system, resulting in additional compliance margin over the system life cycle (Table 9).
Table 9 - Emission Results with Final Calibrations
Emission Control System ER CO NOx
New Tecogen Technology 1.0042 1.4 ppm 2.2 ppm
All 3WC 1.0035 12.8 ppm 0.03 ppm
(ref. CARB standards) 27.8 ppm 11.0 ppm
Source: PIER PIR-08-022, Task 4 Adapt Engine to Atkinson Cycle Summary Report, AVL Test Data, August 2011
While only CO and NOx emissions have been discussed, a limit of (9.7 ppm) is also established for VOC emissions. This hydrocarbon standard excludes any methane or propane contributions. For the test engine fueled with NG (methane), VOC emissions were typically measured at or near “zero” ppm with both systems, at all tested operating points.
5.6 Engine Development Conclusions The engine development phase of the program was successfully completed with all performance objectives - power, efficiency, and emissions - satisfied or exceeded. Steady-state, longer duration tests were conducted using the final recommended AFR calibration (1.0042 ER) in order to provide a performance rating. Referring to Table 10, three tests were performed, with the Intake Valve Closing point set to 37, 57, and 77 degrees ABDC. For each test, RPM was adjusted to provide equal power (~42 BHP). The midpoint IVC setting (57 degrees ABDC) provided marginally better efficiency (at a higher RPM) than the earliest IVC setting (37 degrees ABDC). This was not consistent with the data presented in Figure 24, but may be considered to be within normal experimental data variance or a result of the steady state conditions. Emissions and cylinder temperatures were also marginally lower at the 57° setting. Based on this data, the 57° delayed IVC setting would appear to be the optimum.
Table 10 also lists the program performance goals, and in all three cases, the goals were exceeded. It is also important to note that Tecogen tested the Ford 2.3L Otto cycle engine, used
54

on the heat pump water heater product, on our factory dynamometer and measured an efficiency of 31.1 percent LHV (27.6 percent HHV) at the rated horsepower (40 HP). Consequently, the Atkinson engine will provide an 18 percent increase in efficiency over the standard industrial engine, resulting in a COP increase for the product of 10 percent
Table 10 Performance Rating Tests
Program Goal
Delayed Intake Valve Timing Setting
37° 57° 77°
Speed 2800 1752 1821 2201
Power 40 41.7 42.1 42.0
Torque
125 121 100
Eff (LHV) 35.1% 36.5% 36.9% 36.0%
NOx [ppm @ 15% O2] 3.3 0.639 0.607 0.535
CO [ppm @ 15% O2] 7.9 0.399 0.239 0.198
NMHC [ppm @ 15% O2] 2.7 0.336 0.170 1.282
Avg Cyl Exh Temp [°F]
1272 1262 1294
Data Point Duration (Minutes)
16.3 15.6 16.5
Notes 1. The Program Goal emission targets are the CARB 2007 CHP limits with the minimum heat recovery credit (60% overall efficiency).
Source: PIER PIR-08-022, Task 4 Adapt Engine to Atkinson Cycle Summary Report, AVL Test Data, August 2011
55
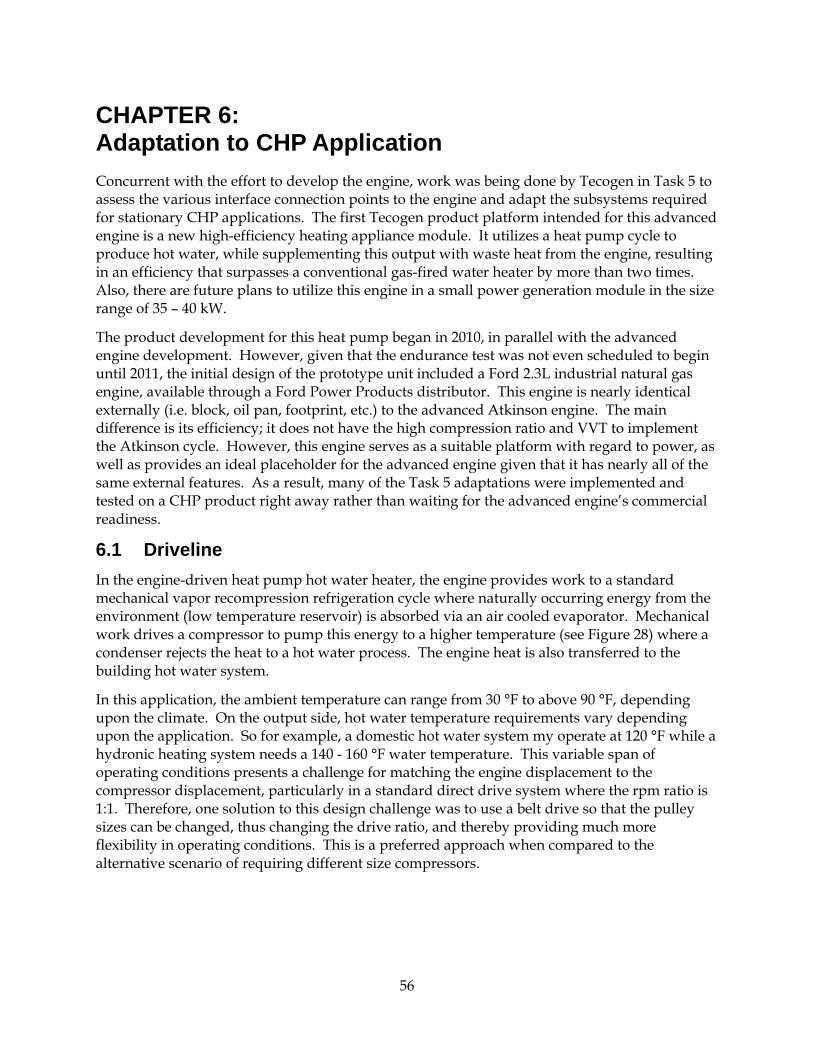
CHAPTER 6: Adaptation to CHP Application Concurrent with the effort to develop the engine, work was being done by Tecogen in Task 5 to assess the various interface connection points to the engine and adapt the subsystems required for stationary CHP applications. The first Tecogen product platform intended for this advanced engine is a new high-efficiency heating appliance module. It utilizes a heat pump cycle to produce hot water, while supplementing this output with waste heat from the engine, resulting in an efficiency that surpasses a conventional gas-fired water heater by more than two times. Also, there are future plans to utilize this engine in a small power generation module in the size range of 35 – 40 kW.
The product development for this heat pump began in 2010, in parallel with the advanced engine development. However, given that the endurance test was not even scheduled to begin until 2011, the initial design of the prototype unit included a Ford 2.3L industrial natural gas engine, available through a Ford Power Products distributor. This engine is nearly identical externally (i.e. block, oil pan, footprint, etc.) to the advanced Atkinson engine. The main difference is its efficiency; it does not have the high compression ratio and VVT to implement the Atkinson cycle. However, this engine serves as a suitable platform with regard to power, as well as provides an ideal placeholder for the advanced engine given that it has nearly all of the same external features. As a result, many of the Task 5 adaptations were implemented and tested on a CHP product right away rather than waiting for the advanced engine’s commercial readiness.
6.1 Driveline In the engine-driven heat pump hot water heater, the engine provides work to a standard mechanical vapor recompression refrigeration cycle where naturally occurring energy from the environment (low temperature reservoir) is absorbed via an air cooled evaporator. Mechanical work drives a compressor to pump this energy to a higher temperature (see Figure 28) where a condenser rejects the heat to a hot water process. The engine heat is also transferred to the building hot water system.
In this application, the ambient temperature can range from 30 °F to above 90 °F, depending upon the climate. On the output side, hot water temperature requirements vary depending upon the application. So for example, a domestic hot water system my operate at 120 °F while a hydronic heating system needs a 140 - 160 °F water temperature. This variable span of operating conditions presents a challenge for matching the engine displacement to the compressor displacement, particularly in a standard direct drive system where the rpm ratio is 1:1. Therefore, one solution to this design challenge was to use a belt drive so that the pulley sizes can be changed, thus changing the drive ratio, and thereby providing much more flexibility in operating conditions. This is a preferred approach when compared to the alternative scenario of requiring different size compressors.
56
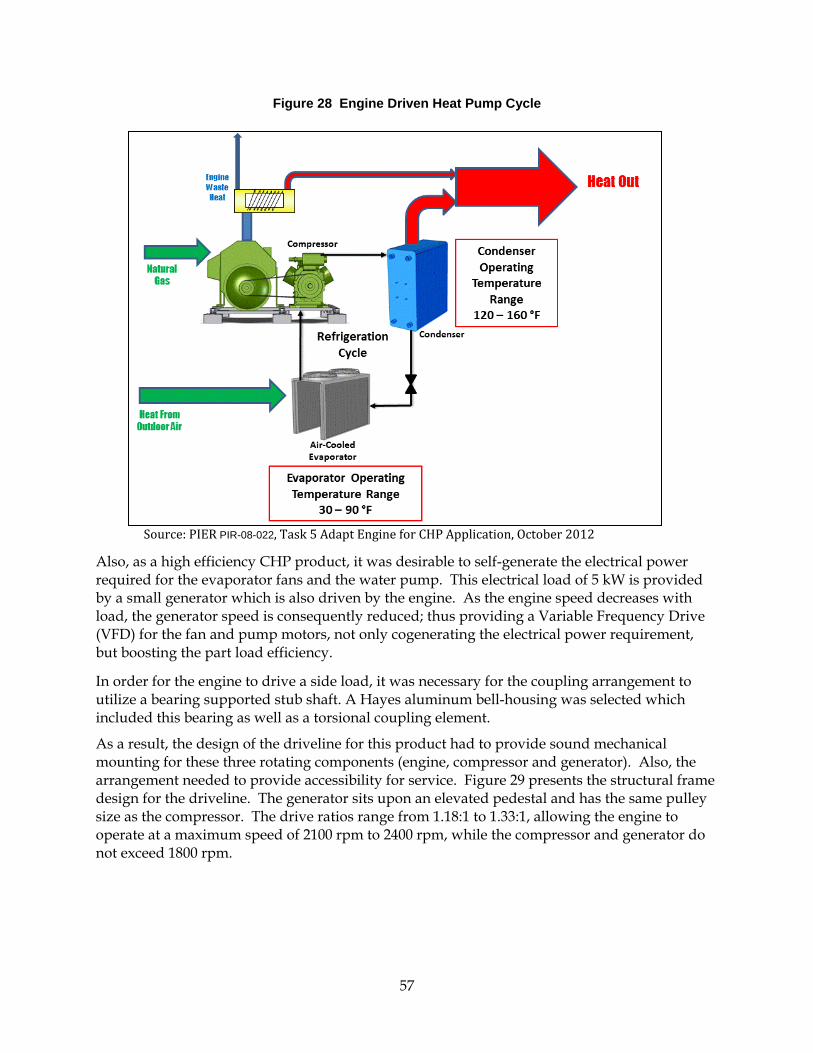
Figure 28 Engine Driven Heat Pump Cycle
Source: PIER PIR-08-022, Task 5 Adapt Engine for CHP Application, October 2012
Also, as a high efficiency CHP product, it was desirable to self-generate the electrical power required for the evaporator fans and the water pump. This electrical load of 5 kW is provided by a small generator which is also driven by the engine. As the engine speed decreases with load, the generator speed is consequently reduced; thus providing a Variable Frequency Drive (VFD) for the fan and pump motors, not only cogenerating the electrical power requirement, but boosting the part load efficiency.
In order for the engine to drive a side load, it was necessary for the coupling arrangement to utilize a bearing supported stub shaft. A Hayes aluminum bell-housing was selected which included this bearing as well as a torsional coupling element.
As a result, the design of the driveline for this product had to provide sound mechanical mounting for these three rotating components (engine, compressor and generator). Also, the arrangement needed to provide accessibility for service. Figure 29 presents the structural frame design for the driveline. The generator sits upon an elevated pedestal and has the same pulley size as the compressor. The drive ratios range from 1.18:1 to 1.33:1, allowing the engine to operate at a maximum speed of 2100 rpm to 2400 rpm, while the compressor and generator do not exceed 1800 rpm.
57

Figure 29 Driveline Structural Frame
Source: PIER PIR-08-022, Task 5 Adapt Engine for CHP Application, October 2012
In the product design, this driveline sub-frame will sit atop the structural base separated by vibration isolators. The engine will be positioned on the end for easy access for oil filter change, as well as other maintenance and replacement, and a front door will provide access to the belt, drive coupling, and compressor shaft seal.
6.2 Heat Recovery System A CHP system requires a method of recovering the waste heat from the engine and exhaust system. All Tecogen products utilize a hydronic system that interfaces with a building’s hot water piping loop. The on-board heat recovery system usually includes a circulating pump, a thermostatic valve, heat exchanger(s), and instrumentation.
Tecogen’s mainstay engine for cogeneration and chiller products is the GM 454 V8 engine that has had the benefit of customization and upgrades through many years of product development. One of its features is the ability to withstand up to 60 psi of pressure on the water side with special head gaskets. With this advanced automotive Ford engine, any special supply chain accommodation was not plausible at the time of design, so the standard 15 psi automotive coolant system pressure was considered the limit. Given that, it was necessary to isolate the engine coolant system from the building hydronic system, which typically is a closed loop systems that operates at much higher pressures.
Engine
Generator
Compressor
Hayes Bell Housing
with Bearing
58

Figure 30 presents a Process and Instrumentation Diagram (P&ID) of the heat recovery system that includes a secondary engine coolant loop connected to the primary CHP hot water system. The engine coolant fluid is a glycol based solution (recommended by Ford). The engine is equipped with an internal engine-driven pump to circulate the coolant, and an internal thermostatic valve to maintain a minimum engine temperature of 192 °F by internally bypassing the heated water when necessary.
The engine coolant loop rejects its heat to the primary heat pump hot water system where it is combined with the heat recovered from the engine exhaust, as well as the heat recovered from the refrigeration process (i.e. condenser). A description of the CHP primary hot water system is provided below:
(1) - (2) Water (or glycol mix) enters the heat recovery system at (1). The water first flows through a condenser (brazed-plate type) where it picks up the heat rejected from refrigeration system.
(2) - (3) Water then flows through the unit’s onboard water pump. This pump’s nominal flow rate is 50 gpm with allowing for an external pressure drop of 10 psi.
(3) - (4) Water absorbs heat from the engine exhaust heat exchanger. This heat exchanger is not rated for the full flow on the pump so a portion of flow is bypassed around it. There is a fixed orifice in this line so flow adjustment is not necessary.
(4) - (5) The process water then flows through an engine heat exchanger where additional heat is transferred from the coolant system. The process hot water is now at its highest temperature where it then exits the unit to the building piping system.
Figure 30 Engine Heat Recovery P&ID
Source: PIER PIR-08-022, Task 5 Adapt Engine for CHP Application, October 2012
Condenser
Customer Heat Exchanger
Exhaust Heat Exchanger/ Catalyst
ExpTank
Main Loop Pump
Exhaust out to atmosphere
Refrigerant in Refrigerant out
Engine Block
Engine Pump
Thermostat
Engine LoopConnect to building loop
Building
T3Engine Heat Exchanger
Over-flowTank
P3
T2
T1
Circulating Pump
T0
(oil)
O2 1Three Way
Catalyst
O2 2
LegendWater Piping
Stop Valve
Check Valve
Temperature Sensor
Pressure Sensor
Pressure Relief Valve
Oxygen Sensor
Exhaust Heat Exchanger
TC0
TC1
Exhaust
1
2
3
4
5
59

6.3 Exhaust Heat Exchanger The exhaust heat exchanger/catalyst design is similar to Tecogen’s larger CHP products where the catalyst is packaged inside the water coil to better manage the extreme temperatures of the catalyst housing, as well as to facilitate conduction heat transfer to the coil. In order to scale down the existing design, an analysis of the catalyst sizing was first determined based upon the engine’s exhaust flow and required emissions. Then a heat transfer analysis established the tubing diameter, number of coils, and tubing length. Also, unlike Tecogen’s other CHP product that utilize a Vee style engine, thus requiring two water coils (i.e. one for each exhaust side), this Ford inline engine needs only a single coil. Figure 31 presents a drawing of the final design.
Figure 31 Exhaust HX/Catalyst
Source: PIER PIR-08-022, Task 5 Adapt Engine for CHP Application, October 2012
6.4 Water-Cooled Exhaust Manifold For engine-driven CHP applications, it is most advantageous to have a water-cooled exhaust manifold as opposed to the “dry” type typically found on automotive engines. There are two reasons for this. First, a water-cooled manifold will recover additional heat that would otherwise get rejected to ambient in the dry manifold configuration. But of equal importance is the durability and management of heat within a packaged enclosure. The duty of a CHP application is much more rigorous than a vehicle. Dry exhaust manifolds are typically cast steel since vehicle loads are only intermittently high, and the air movement from the moving vehicle provides sufficient cooling effect. However, because of the continuous, full-power duty of CHP applications, the exhaust manifold is subject to extremely high temperatures (> 1400 °F). Moreover, in a package design, the manifold must be insulated for safety and not overheat the space, so there is no convective cooling of the surface. This subjects the cast metal to temperatures beyond the normal design conditions which can lead to cracking and premature failure. Figure 32 presents a photo of the dry exhaust manifold available from Ford for the 2.5L engine. As shown, it is a complex casting so it is difficult to insulate and manage the heat.
Water Out Water In
Exhaust Out
Water Inlet
Inlet O2 Sensor
Exhaust In
Water Outlet
60

Figure 32 Dry Exhaust Manifold
Source: PIER PIR-08-022, Task 5 Adapt Engine for CHP Application, October 2012
Therefore, a desirable adaptation for CHP applications is a water-cooled manifold. Figure 33 presents a proposed model of a cast aluminum piece designed to mate to the 2.5 L head. At the time of this report, we have not been able to secure a vendor to make a prototype. Although we are working through a Ford engine distributor, it has been difficult to move this forward because there is no synergy with other applications. The Tecogen 7.4L CHP engine not only had origins in the automotive industry, but is very popular in the marine industry where there is a large demand for water-cooled exhaust manifolds. That is not the case with this Ford engine. While we will continue to pursue a supply chain for this component to improve heat recovery efficiency and avoid a potential durability issue, the dry exhaust manifold is commercially viable. On the prototype heat pump unit equipped with the Ford 2.3L (Otto cycle) engine, the dry manifold has completed over 6000 hours of operation.
Figure 33 Water-cooled Manifold Design
Source: PIER PIR-08-022, Task 5 Adapt Engine for CHP Application, October 2012
61
6.5 Extended Oil Change System The duty cycle of a CHP unit, described as continuous run hours heavily loaded, requires that the engine have a sufficient oil reservoir to extend the oil change intervals beyond what is typical in a vehicle. For example, vehicle oil changes are usually recommended at 5000 miles. To compare this to a CHP unit, assuming an average speed of 40 mph, the oil would be changed after 125 continuous hours of operation. This is less than 6 days of operation for a CHP unit. As a result, an oil reservoir significantly larger than the engine oil pan is required.
The oil pan on the Ford 2.5 L Atkinson engine is made of aluminum and it has an integrated mounting configuration to the block such that major engine disassembly is required to remove it. As a result, it is undesirable to modify the pan to add an external pump with a recirculation system, as is done in Tecogen’s other CHP products. Rather, the extended oil change system design utilizes the existing oil pan penetrations with no modifications to the stock pan.
Figure 34 presents a schematic of the extended oil change system design. The concept is to have an oil external oil make-up reservoir to the oil pan. As oil is pumped out of the pan with the engine’s own internal oil pump, it refills through the bottom connection to the reservoir. The oil is recirculated back to the reservoir via a pressurized oil port from the engine. Since the reservoir is vented to the oil pan, they are both at the same level.
This scheme was tested on the heat pump CHP unit, equipped with a standard Ford 2.3L industrial gas engine (non-Atkinson), which as mentioned previously, is externally equivalent to the advanced engine. It was found that the rate of oil leaving the engine was too high such that the oil make-up could not maintain the level in the oil pan, as the oil viscosity did not allow instant oil make-up. A fixed orifice was installed in the pressurized line feeding the reservoir to limit this flow. However, the final result showed that a solenoid valve, cycled only for a short duration each hour, was the most effective method to limit the oil flow.
Figure 34 Extended Oil Change System
Source: PIER PIR-08-022, Task 5 Adapt Engine for CHP Application, October 2012
62

6.6 Exhaust System The exhaust system of a CHP engine must include an exhaust heat recovery heat exchanger, a catalytic converter, and an exhaust silencer. The design for the exhaust heat exchanger was presented in Section 6.3 in the discussion on the heat recovery system. Following Tecogen’s standard method, the catalytic converter is packaged within the heat recovery coil for a compact design, as well as for effective management of the ambient heat rejection of the catalyst.
The exhaust silencer is typically a standard catalog item for most CHP applications. However in Task 4, Tecogen demonstrated new emission control technology (developed on CEC Grant PNG-06-002) which included a second stage catalyst. This emission system (tradename Ultra) has shown robust CARB 2007 compliance on Tecogen’s CHP products and has been incorporated in all product designs. Because of the space limitations with small size CHP, compact packaging is critical, so a combined second stage catalyst/silencer design was pursued.
Catalyst/silencers combination units can be offered as catalog items as well. However, since there were very specific requirements for the Ultra second stage catalyst, the catalyst manufacturer DCL was approached to provide a custom design suitable for compact CHP packaging. Figure 35 shows the conceptual layout, where the exhaust first enters the catalyst, and then flows through the baffled section for noise reduction. Two catalysts sizes were tested, and with the larger size, CARB 2007 compliant emission results were achieved.
Figure 35 Second Stage Catalyst/Silencer Design
Source: PIER PIR-08-022, Task 5 Adapt Engine for CHP Application, October 2012
6.7 Natural Gas External Piping System In Task 3, AVL selected a natural gas fueling system that included a mixer, pressure regulator, and ECM (Engine Control Module) for precision air/fuel ratio control, throttle control, and safe
Silencer Section
Exhaust Out
Catalyst
Exhaust In
63
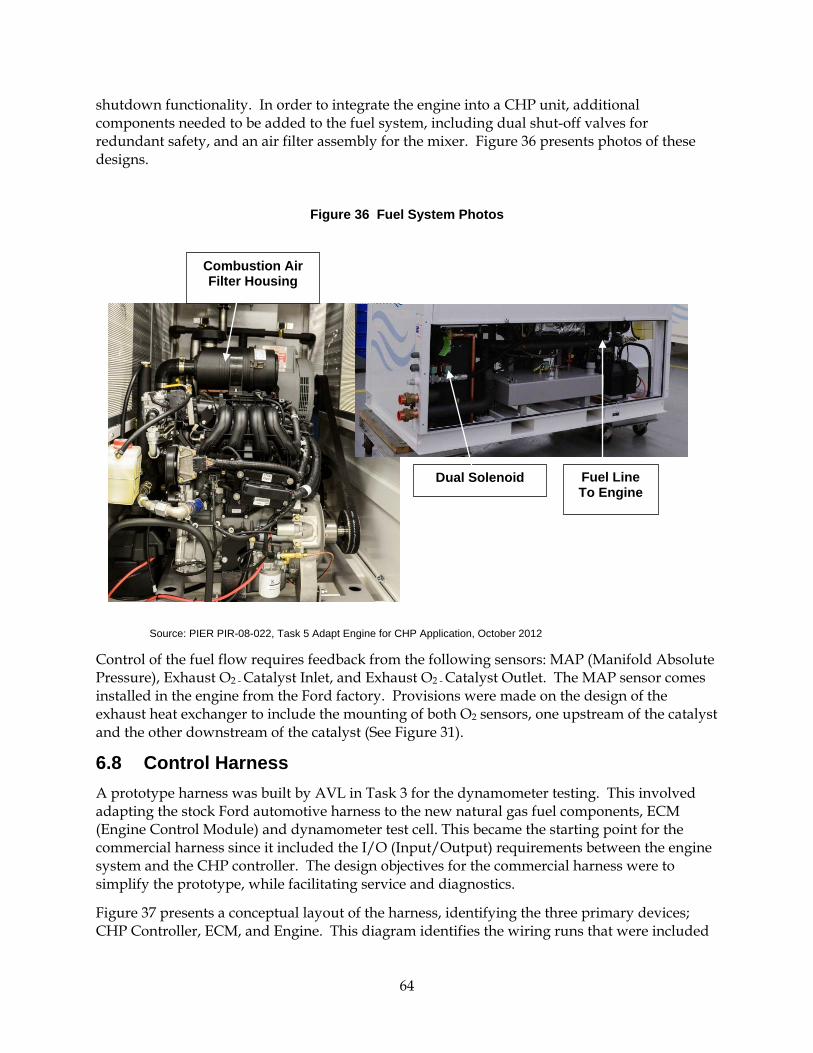
shutdown functionality. In order to integrate the engine into a CHP unit, additional components needed to be added to the fuel system, including dual shut-off valves for redundant safety, and an air filter assembly for the mixer. Figure 36 presents photos of these designs.
Figure 36 Fuel System Photos
Source: PIER PIR-08-022, Task 5 Adapt Engine for CHP Application, October 2012
Control of the fuel flow requires feedback from the following sensors: MAP (Manifold Absolute Pressure), Exhaust O2 - Catalyst Inlet, and Exhaust O2 - Catalyst Outlet. The MAP sensor comes installed in the engine from the Ford factory. Provisions were made on the design of the exhaust heat exchanger to include the mounting of both O2 sensors, one upstream of the catalyst and the other downstream of the catalyst (See Figure 31).
6.8 Control Harness A prototype harness was built by AVL in Task 3 for the dynamometer testing. This involved adapting the stock Ford automotive harness to the new natural gas fuel components, ECM (Engine Control Module) and dynamometer test cell. This became the starting point for the commercial harness since it included the I/O (Input/Output) requirements between the engine system and the CHP controller. The design objectives for the commercial harness were to simplify the prototype, while facilitating service and diagnostics.
Figure 37 presents a conceptual layout of the harness, identifying the three primary devices; CHP Controller, ECM, and Engine. This diagram identifies the wiring runs that were included
Dual Solenoid hutoff
Fuel Line To Engine
Combustion Air Filter Housing
64
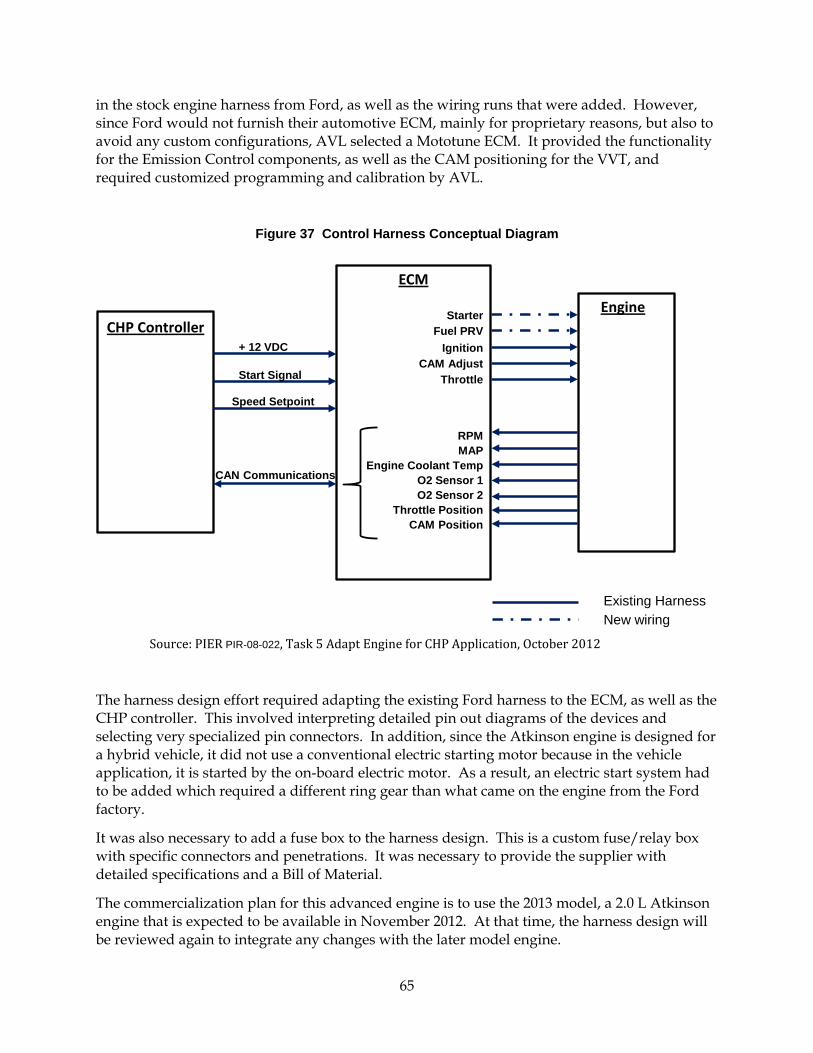
in the stock engine harness from Ford, as well as the wiring runs that were added. However, since Ford would not furnish their automotive ECM, mainly for proprietary reasons, but also to avoid any custom configurations, AVL selected a Mototune ECM. It provided the functionality for the Emission Control components, as well as the CAM positioning for the VVT, and required customized programming and calibration by AVL.
Figure 37 Control Harness Conceptual Diagram
Source: PIER PIR-08-022, Task 5 Adapt Engine for CHP Application, October 2012
The harness design effort required adapting the existing Ford harness to the ECM, as well as the CHP controller. This involved interpreting detailed pin out diagrams of the devices and selecting very specialized pin connectors. In addition, since the Atkinson engine is designed for a hybrid vehicle, it did not use a conventional electric starting motor because in the vehicle application, it is started by the on-board electric motor. As a result, an electric start system had to be added which required a different ring gear than what came on the engine from the Ford factory.
It was also necessary to add a fuse box to the harness design. This is a custom fuse/relay box with specific connectors and penetrations. It was necessary to provide the supplier with detailed specifications and a Bill of Material.
The commercialization plan for this advanced engine is to use the 2013 model, a 2.0 L Atkinson engine that is expected to be available in November 2012. At that time, the harness design will be reviewed again to integrate any changes with the later model engine.
Start Signal
+ 12 VDC
CAN Communications
CHP Controller
ECM
EngineStarter Fuel PRV
IgnitionCAM Adjust
Throttle
O2 Sensor 1O2 Sensor 2
Engine Coolant Temp
CAM PositionThrottle Position
RPMMAP
Speed Setpoint
New wiringExisting Harness
65
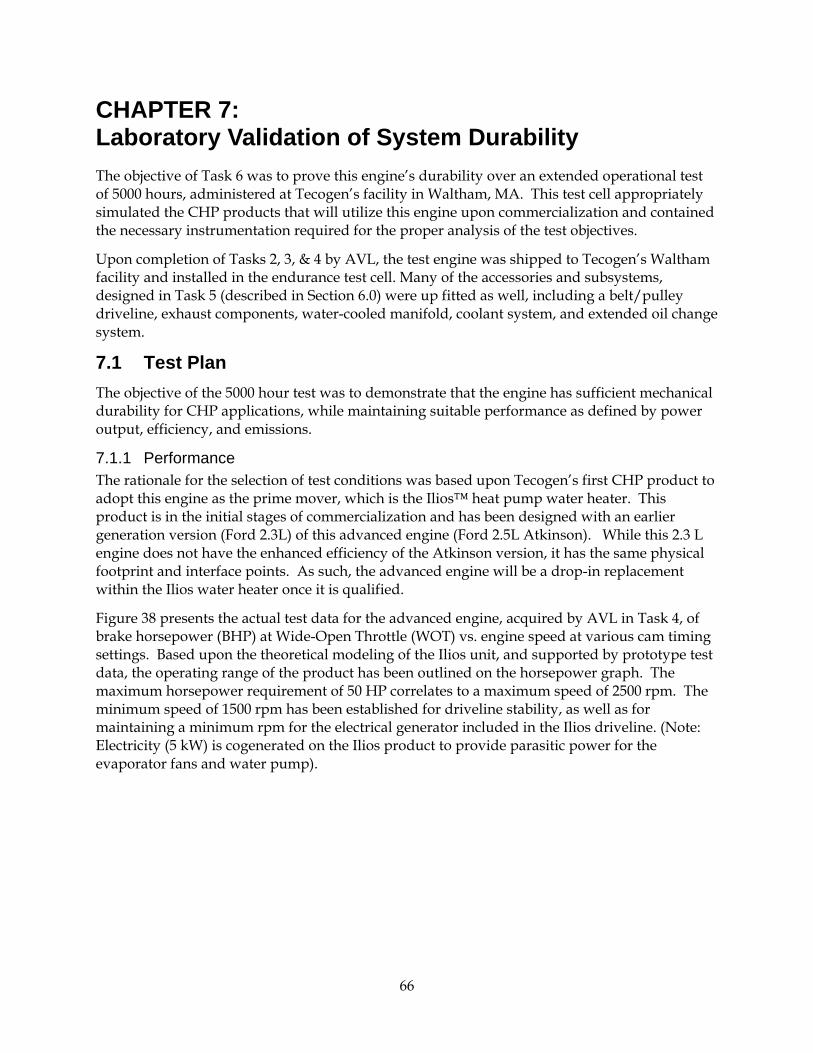
CHAPTER 7: Laboratory Validation of System Durability The objective of Task 6 was to prove this engine’s durability over an extended operational test of 5000 hours, administered at Tecogen’s facility in Waltham, MA. This test cell appropriately simulated the CHP products that will utilize this engine upon commercialization and contained the necessary instrumentation required for the proper analysis of the test objectives.
Upon completion of Tasks 2, 3, & 4 by AVL, the test engine was shipped to Tecogen’s Waltham facility and installed in the endurance test cell. Many of the accessories and subsystems, designed in Task 5 (described in Section 6.0) were up fitted as well, including a belt/pulley driveline, exhaust components, water-cooled manifold, coolant system, and extended oil change system.
7.1 Test Plan The objective of the 5000 hour test was to demonstrate that the engine has sufficient mechanical durability for CHP applications, while maintaining suitable performance as defined by power output, efficiency, and emissions.
7.1.1 Performance The rationale for the selection of test conditions was based upon Tecogen’s first CHP product to adopt this engine as the prime mover, which is the Ilios™ heat pump water heater. This product is in the initial stages of commercialization and has been designed with an earlier generation version (Ford 2.3L) of this advanced engine (Ford 2.5L Atkinson). While this 2.3 L engine does not have the enhanced efficiency of the Atkinson version, it has the same physical footprint and interface points. As such, the advanced engine will be a drop-in replacement within the Ilios water heater once it is qualified.
Figure 38 presents the actual test data for the advanced engine, acquired by AVL in Task 4, of brake horsepower (BHP) at Wide-Open Throttle (WOT) vs. engine speed at various cam timing settings. Based upon the theoretical modeling of the Ilios unit, and supported by prototype test data, the operating range of the product has been outlined on the horsepower graph. The maximum horsepower requirement of 50 HP correlates to a maximum speed of 2500 rpm. The minimum speed of 1500 rpm has been established for driveline stability, as well as for maintaining a minimum rpm for the electrical generator included in the Ilios driveline. (Note: Electricity (5 kW) is cogenerated on the Ilios product to provide parasitic power for the evaporator fans and water pump).
66

Figure 38 Ilios Horsepower Operating Range
Source: PIER PIR-08-022, Task 6 Endurance Test Report, February 2013
Tecogen also has future plans to incorporate this engine into a smaller CHP product of approximately 30 - 35 kW. This product will have a similar operating range as the Ilios heat pump product, with the exception that the rating may be based upon limiting the horsepower output to less than 50 HP since there could be a strategic advantage in doing this for air permitting purposes.
This endurance test plan included measurements of horsepower and efficiency early on, and then at periodic intervals throughout the duration of the program to monitor any change in these performance parameters. The test matrix included a selection of speeds and cam timing settings.
Partial throttle efficiency is also a parameter of importance for CHP applications. Figure 26 (Section 5.4) presented data taken in Task 4 which showed no significant benefit in varying the cam timing for reduced load, versus closing the throttle. The endurance test program plan also included variable cam timing tests to confirm this finding.
Emissions measurements of NOx and CO, were also included in the test plan with the objective of maintaining CARB compliance.
7.1.2 Mechanical Durability The driveline design is critical to long life, not just of the engine, but of the driven components. Excessive vibration can occur in power transmission systems, induced by both rotation and
67

lateral movement. A reciprocating engine transmits pulsating torque, and in the case of this specific CHP driveline, there is also a reciprocating compressor with a non-smooth torque profile. Vibration analysis and measurements will be done in the early stages of the testing to establish a baseline frequency spectrum profile throughout the operating speed range. Areas of concern will be corrected with either a design modification (i.e. structure, coupling system) or a possible avoidance of a speed, or speed range. The vibration measurements will then be repeated near the end of the test program.
A primary area of concern with natural gas fueling is valve life, mainly because of the higher temperatures, but also because of reduced lubrication due to the absence of a gum component6. It is unclear whether the hardness and/or wear resistance of the standard exhaust valve seats from the Ford factory were going to be durable enough for a CHP natural gas application. A material analysis, by a metallurgical testing company, was done on the valve seat from the stock head to determine a baseline hardness and chemical composition. For comparison purposes, the exhaust valve seat used on the TecoDrive 454 natural gas engine, which has been shown to have an average life of approximately 8000 hours, underwent a similar analysis. The results show that the hardness of the TecoDrive’s engine valve seat (≈ 500 Vickers) was higher than the Ford engine valve seat (≈ 300 Vickers), but it is unclear as to whether the Ford hardness is sufficient. Baseline measurements of valve clearance were done initially, with periodic checks throughout the test program to determine wear.
Engine oil consumption and oil analysis was also monitored throughout the test program.
7.2 Test Cell Description The engine was installed in a test cell that simulates the Ilios™ heat pump water heater (see Figure 39). This product uses a standard mechanical vapor compression refrigeration cycle to generate heat, with the added efficiency from the energy reclaimed from the engine waste heat (i.e. block and exhaust). The engine drives a refrigeration compressor with a belt/sheave configuration. In addition, the engine also powers a small electrical 5 kW generator. This generator provides AC power to the CHP unit’s fans and onboard pump. Figure 40 presents a photo of the driveline.
Control of the test cell was administered by a master control system. The master system primarily controlled the refrigeration circuit functions, such as compressor loading and expansion valve control. It also interfaced with the engine’s Mototune ECM for starting and stopping, as well as safety and diagnostic monitoring. The speed setpoint was manually set via a computer interface with the Mototune ECM controller.
6 Development of Valve Seat Material for CNG Fueled Engines, Katsuaki Sato, Honda R&D Co., Teruo Takahashi, Nippon Piston Ring Co., Ltd.
68

Figure 39 Engine Endurance Test Cell
Source: PIER PIR-08-022, Task 6 Endurance Test Report, February 2013
69
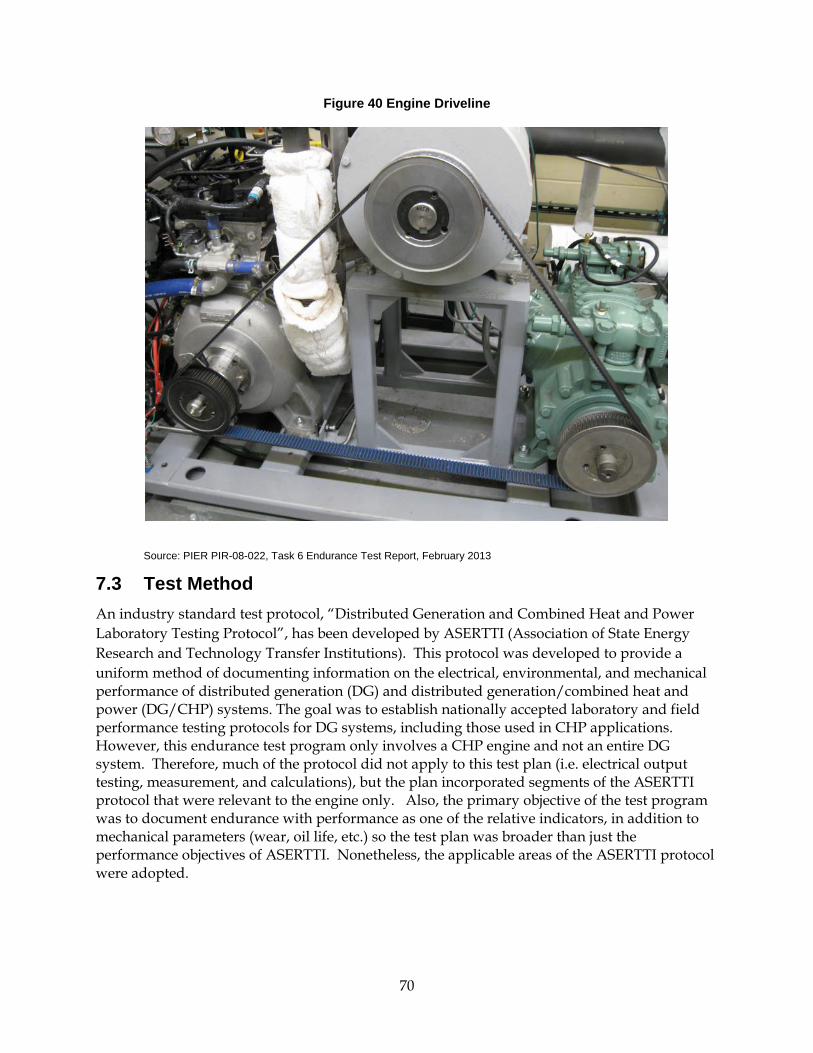
Figure 40 Engine Driveline
Source: PIER PIR-08-022, Task 6 Endurance Test Report, February 2013
7.3 Test Method An industry standard test protocol, “Distributed Generation and Combined Heat and Power Laboratory Testing Protocol”, has been developed by ASERTTI (Association of State Energy Research and Technology Transfer Institutions). This protocol was developed to provide a uniform method of documenting information on the electrical, environmental, and mechanical performance of distributed generation (DG) and distributed generation/combined heat and power (DG/CHP) systems. The goal was to establish nationally accepted laboratory and field performance testing protocols for DG systems, including those used in CHP applications. However, this endurance test program only involves a CHP engine and not an entire DG system. Therefore, much of the protocol did not apply to this test plan (i.e. electrical output testing, measurement, and calculations), but the plan incorporated segments of the ASERTTI protocol that were relevant to the engine only. Also, the primary objective of the test program was to document endurance with performance as one of the relative indicators, in addition to mechanical parameters (wear, oil life, etc.) so the test plan was broader than just the performance objectives of ASERTTI. Nonetheless, the applicable areas of the ASERTTI protocol were adopted.
70

7.4 Instrumentation In order to properly characterize the engine, the gas input, shaft power output, heat recovered from the engine block, and exhaust emissions were measured. The waste heat out of the exhaust was calculated using the measured fuel input, air/fuel ratio, and the exhaust temperature. The instrumentation required to achieve this is presented in Table 11. For each measurement, the Maximum Uncertainty (Table 3.1 of ASERTTI) and Maximum Permissible Deviation in Test Condition (Table 4.1 of ASERTTI) are also presented.
Figure 41 presents a boundary diagram of system indicating the locations of the instruments listed in Table 11.
Table 11 Test Cell Instrumentation and Measurements
Parameter Units Maximum
Uncertainty (Table 3.1)
Maximum Permissible
Deviation in Test Condition
(Table 4.1)
Instrument
Designation
Intake Air Temperature ºC [°F] ±1.1ºC [±2ºF] ±2.2ºC [±4ºF] T1 Barometric Pressure “ of Hg ±2.0% ±0.5% P1 Exhaust Backpressure “ of H2O ±3.0% ±5.0% P2 Exhaust Temperature ºC [°F] ±2.8ºC [±5ºF] ±10 °F T2 Average Volumetric Exhaust Flow scfm ±3.0% ±2.0%
Fuel Supply Pressure psia ±1.5% P3 Fuel Flow Rate scfm ±1.0% ±2.0% F1 Fuel Higher Heating Value Btu/lb ±1.0% ±1.0% Fuel Lower Heating Value Btu/lb ±1.0% ±1.0% High-Temperature Coolant Flow Rate gpm ±1.5%
±5.0% F2
High-Temperature Coolant Inlet Temperature ºC [°F] ±0.5˚C [± 1.0ºF]
±5ºF T3
High-Temperature Coolant Outlet Temperature
ºC [°F] ±0.5˚C [± 1.0ºF] ±5ºF T4
Torque Ft-lbs N/A N/A TM Speed rpm N/A N/A MP Exhaust Gas Emissions ppm N/A N/A
Parameter
Units
Maximum Uncertainty
Specific Heat of fluid Btu/lb °F ±1.0% Liquid Density lb/gal ±1.0% Acoustic Measurements dB ±3 dB
Source: Association of State Energy Research and Technology Transfer Institutions “Distributed Generation and Combined Heat and Power Laboratory Testing Protocol”, Version 1.0, 2008
71
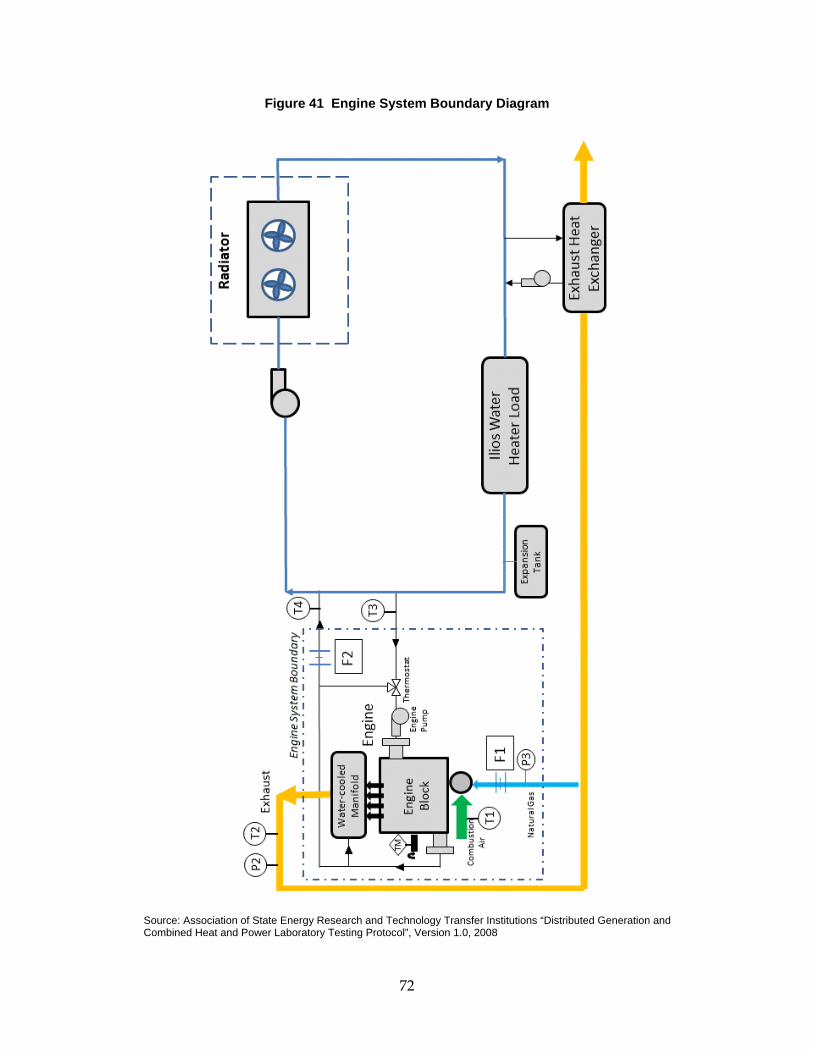
Figure 41 Engine System Boundary Diagram
Source: Association of State Energy Research and Technology Transfer Institutions “Distributed Generation and Combined Heat and Power Laboratory Testing Protocol”, Version 1.0, 2008
72

7.5 Test Results The endurance test accomplished the goal of determining whether the engine had adequate durability to be viable for CHP application. After 4070 of run hours accumulated, the core engine performed very successfully. The bottom end showed no sign of degradation but the engine head, specifically the exhaust valve seats, demonstrated unacceptable wear that will require a post-production enhancement for commercial readiness.
The stated goal for the endurance test was 5000 hours. However, with concurrence from the Commission, Tecogen decided to end the test at 4070 hours in order to preserve the mechanical integrity of the engine for a teardown process, a critical step for prospective commercialization.
The following section will provide test results on valve wear, lubrication oil analysis, oil consumption, performance measurements, and vibration.
7.5.1 Valve wear The Ford 2.5L engine is equipped with dual overhead cams for direct actuation of the valves via the cam. The cam lobe contacts the valve via a valve bucket, which is has an integral hardened metal shim in its center where the valve stem makes contact. Figure 42 shows a typical arrangement of this type and Figure 43 is a photo of the bucket itself. The shim heights vary from valve to valve, due to the various stack-up of tolerances, and are installed at the factory to set the proper clearance between the cam lobe and the bucket.
Valve recession can occur if the valve seat begins to wear. If the valve starts to recede into the seat, the valve clearance is reduced. A valve clearance of zero will cause interference between the cam lobe and the bucket and a likely mechanical failure. Therefore, in order to restore the clearance, the shim height must be decreased. This requires replacing the bucket (with integral shim) to one with a shim of shorter height.
Valve clearance measurements can be made by removing the valve cover and sliding a feeler gage between the cam lobe and bucket (see Figure 42). However, valve bucket replacement is a very invasive procedure requiring removal of the cam, and precision calculations for each valve to determine the proper bucket height, which makes it an impractical service procedure in the field.
Valve clearances were measured at various intervals throughout the test program for both the intake valves and the exhaust valve. The intake valve results are presented in Table 12. As shown, with the exception of valve #1, the intake valve clearances stayed within the factory specification. Also, although the clearance on Valve #1 was below the specification, it appeared the wear mechanism had leveled off such that the clearance had stabilized.
However, the exhaust valve clearances were more of a concern. Referring to Table 13, all of the valve clearances had fallen out of the specification range at 1767 hours and at 2500 hours, the #1 valve clearance was near zero. At that time, we proceeded with changing the valve buckets. As indicated in the table, each valve clearance was able to be brought back to within spec by fitting it with the proper shim height in the valve bucket. Nonetheless, in less than 400 hours (@ 2838.7 hours), the valve clearances were again out of specification range.
73
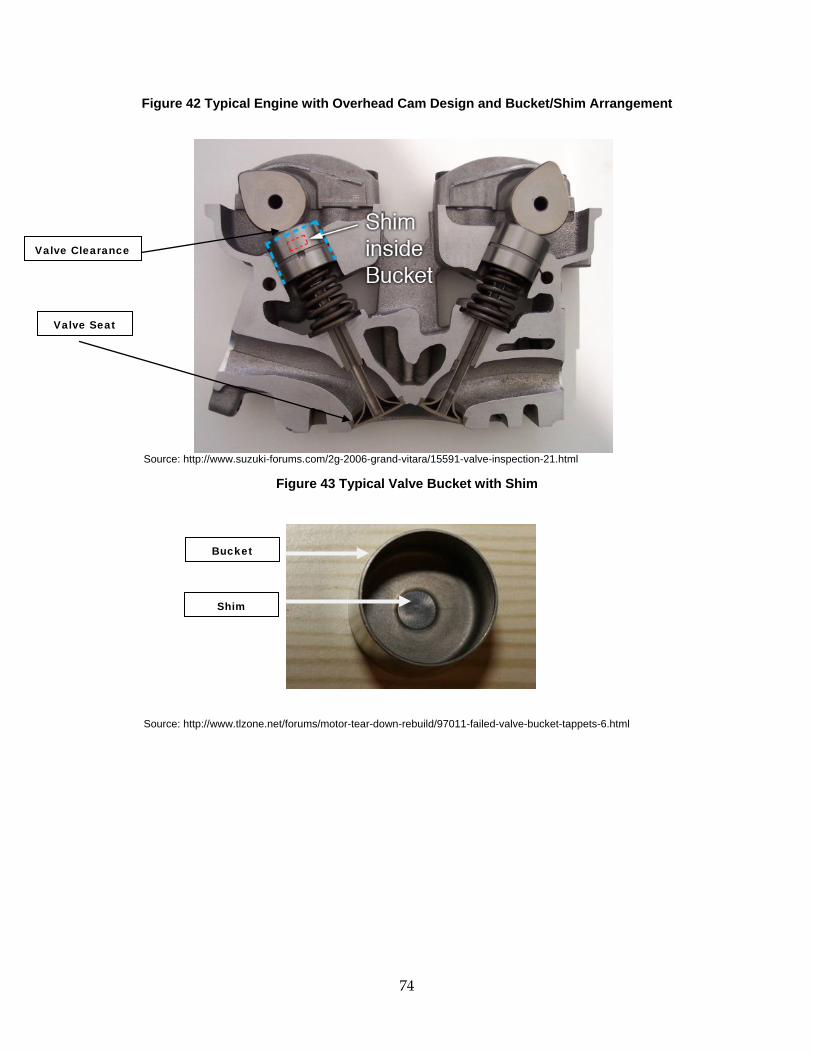
Figure 42 Typical Engine with Overhead Cam Design and Bucket/Shim Arrangement
Source: http://www.suzuki-forums.com/2g-2006-grand-vitara/15591-valve-inspection-21.html
Figure 43 Typical Valve Bucket with Shim
Source: http://www.tlzone.net/forums/motor-tear-down-rebuild/97011-failed-valve-bucket-tappets-6.html
Valve Clearance
Valve Seat
Shim
Bucket
74

Table 12 Intake Valve Clearance Measurements
1 2 3 4 5 6 7 8
50 0.009 0.009 0.010 0.010 0.010 0.010 0.009 0.0091767 0.007 0.009 0.011 0.010 0.010 0.010 0.009 0.008
2398.5 0.007 0.009 0.011 0.011 0.011 0.011 0.011 0.0082838.7 0.006 0.008 0.011 0.011 0.012 0.012 0.008 0.0083432 0.006 0.009 0.011 0.012 0.012 0.012 0.009 0.0084070 0.006 0.008 0.011 0.011 0.012 0.012 0.009 0.008
Acceptable Valve Clearance (0.008" - 0.011")
Run Hours
Indicates out of spec
Measured Valve Clearance (inches)
Source: PIER PIR-08-022, Task 6 Endurance Test Report, February 2013
Table 13 Exhaust Valve Clearance Measurements
1 2 3 4 5 6 7 8
50 0.010 0.010 0.011 0.011 0.010 0.010 0.010 0.0111767 0.003 0.007 0.005 0.006 0.009 0.008 0.006 0.007
2398.5 0.002 0.006 0.003 0.005 0.009 0.007 0.005 0.0052500* 0.014 0.013 0.012 0.013 0.012 0.011 0.013 0.0102838.7 0.009 0.012 0.008 0.011 0.011 0.009 0.012 0.0093432 0.005 0.011 0.006 0.010 0.010 0.009 0.012 0.0084070 0.003 0.009 0.004 0.009 0.009 0.007 0.010 0.006
MeasuredValve Clearance (inches)Acceptable Valve Clearance (0.010" - 0.013")
Run Hours
Indicates out of spec* Valves adjusted
Source: PIER PIR-08-022, Task 6 Endurance Test Report, February 2013
Given that the bucket change is not practical for field service, an important task for Commercial Readiness is to determine a feasible design modification that can be done to extend the life of the exhaust valves. This could include a more hardened valve seat, a modified shim/bucket arrangement where the shim is removable from the top (i.e. without disassembling the cam), or a modified cam. Tecogen has commenced a follow-on program with AVL which will include a teardown of this engine to identify the wear surfaces (i.e. valve seat, valve) and then determine a post -production line solution.
As mentioned previously, Tecogen is currently utilizing a Ford 2.3L engine on the gas engine heat pump CHP product. This engine operates with a standard Otto cycle at a 9.7 compression
75

ratio, unlike the 2.5L Atkinson which has a 12.3 compression ratio. We have been monitoring the valve clearance on the prototype unit equipped with the 2.3 L. Figure 44 compares exhaust valve wear of the two engines. The data shows that the wear rate is accelerated on the 2.5L Atkinson engine.
It was unclear as to whether the seat material for both engine heads was the same since Ford does not disclose that information. So we sent a sample head from each model engine to have a metallurgical analysis done to determine the element composition and hardness. A comparison of the results is presented in Table 14. While there were some differences in the chemical composition (i.e. C, Mo, V, Al), the Rockwell hardness test results were identical. Therefore, it appears that the two engines are equipped with similar valve seats and given that the duty cycles were similar, the less favorable wear rate of the 2.5 L may be attributable to the higher compression ratio. Further controlled study would be needed to confirm this.
Figure 44 Valve Wear Comparison – Atkinson Cycle Engine vs. Otto Cycle Engine
Source: PIER PIR-08-022, Task 6 Endurance Test Report, February 2013
0.000
0.100
0.200
0.300
0.400
0.500
0.600
0.700
0.800
E1 E2 E3 E4 E5 E6 E7 E8
Rece
ssio
n Ra
te [m
ils/1
00 h
ours
]
Exhaust Valve
2.5L Atkinson - From Factory
2.5L Atkinson - After Valve Adjustment
2.3 L Otto - From Factory
76
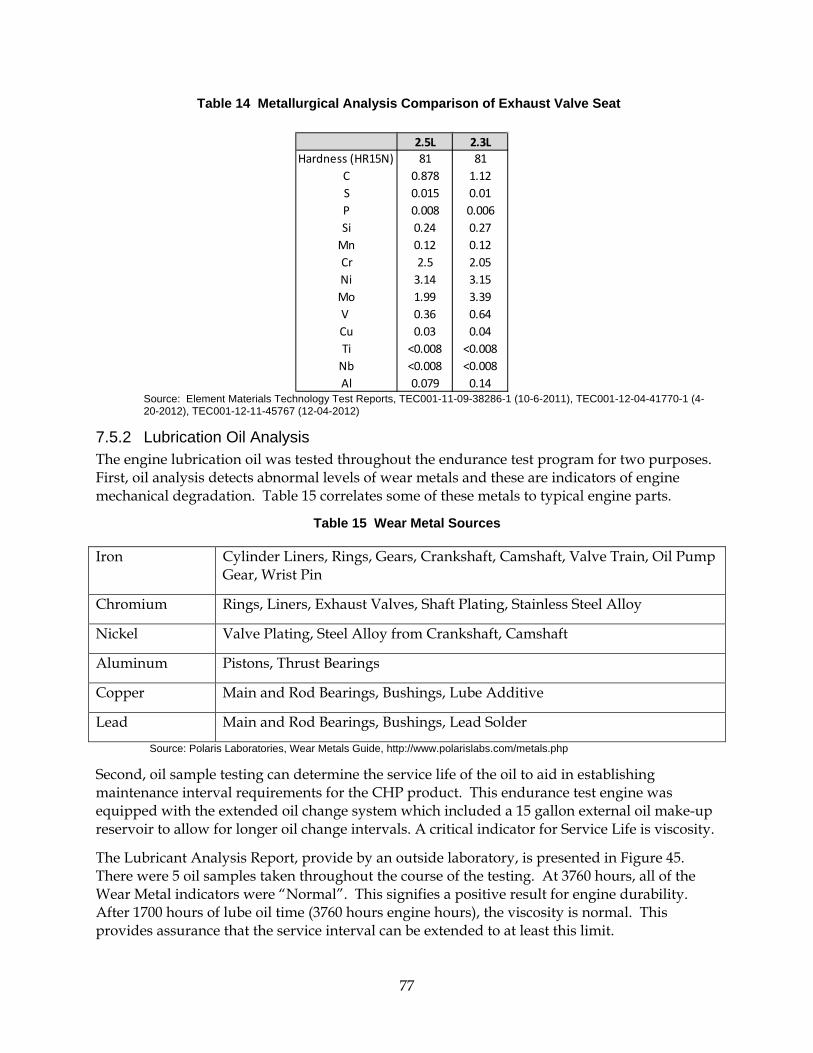
Table 14 Metallurgical Analysis Comparison of Exhaust Valve Seat
Source: Element Materials Technology Test Reports, TEC001-11-09-38286-1 (10-6-2011), TEC001-12-04-41770-1 (4-20-2012), TEC001-12-11-45767 (12-04-2012)
7.5.2 Lubrication Oil Analysis The engine lubrication oil was tested throughout the endurance test program for two purposes. First, oil analysis detects abnormal levels of wear metals and these are indicators of engine mechanical degradation. Table 15 correlates some of these metals to typical engine parts.
Table 15 Wear Metal Sources
Iron Cylinder Liners, Rings, Gears, Crankshaft, Camshaft, Valve Train, Oil Pump Gear, Wrist Pin
Chromium Rings, Liners, Exhaust Valves, Shaft Plating, Stainless Steel Alloy
Nickel Valve Plating, Steel Alloy from Crankshaft, Camshaft
Aluminum Pistons, Thrust Bearings
Copper Main and Rod Bearings, Bushings, Lube Additive
Lead Main and Rod Bearings, Bushings, Lead Solder
Source: Polaris Laboratories, Wear Metals Guide, http://www.polarislabs.com/metals.php
Second, oil sample testing can determine the service life of the oil to aid in establishing maintenance interval requirements for the CHP product. This endurance test engine was equipped with the extended oil change system which included a 15 gallon external oil make-up reservoir to allow for longer oil change intervals. A critical indicator for Service Life is viscosity.
The Lubricant Analysis Report, provide by an outside laboratory, is presented in Figure 45. There were 5 oil samples taken throughout the course of the testing. At 3760 hours, all of the Wear Metal indicators were “Normal”. This signifies a positive result for engine durability. After 1700 hours of lube oil time (3760 hours engine hours), the viscosity is normal. This provides assurance that the service interval can be extended to at least this limit.
2.5L 2.3LHardness (HR15N) 81 81
C 0.878 1.12S 0.015 0.01P 0.008 0.006Si 0.24 0.27
Mn 0.12 0.12Cr 2.5 2.05Ni 3.14 3.15Mo 1.99 3.39V 0.36 0.64Cu 0.03 0.04Ti <0.008 <0.008
Nb <0.008 <0.008Al 0.079 0.14
77

Figure 45 Lubricant Analysis Report
Source: Polaris Laboratories, Indianapolis, IN, January 23, 2013
78
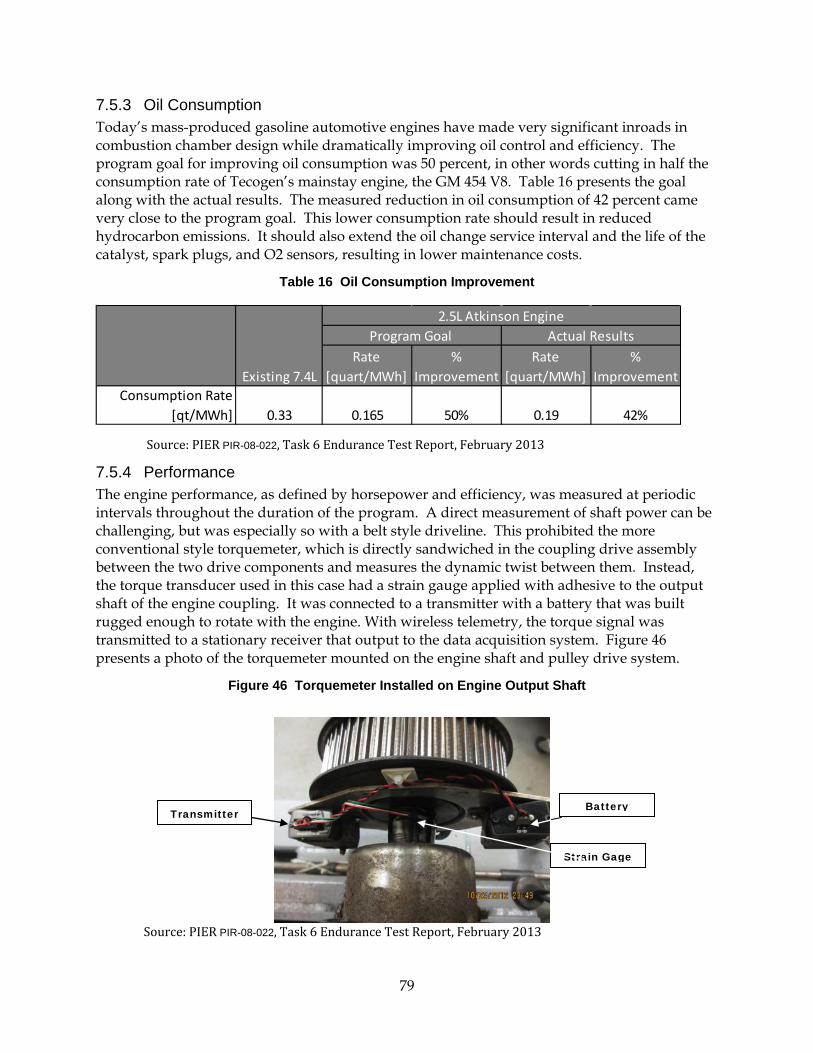
7.5.3 Oil Consumption Today’s mass-produced gasoline automotive engines have made very significant inroads in combustion chamber design while dramatically improving oil control and efficiency. The program goal for improving oil consumption was 50 percent, in other words cutting in half the consumption rate of Tecogen’s mainstay engine, the GM 454 V8. Table 16 presents the goal along with the actual results. The measured reduction in oil consumption of 42 percent came very close to the program goal. This lower consumption rate should result in reduced hydrocarbon emissions. It should also extend the oil change service interval and the life of the catalyst, spark plugs, and O2 sensors, resulting in lower maintenance costs.
Table 16 Oil Consumption Improvement
Rate [quart/MWh]
% Improvement
Rate [quart/MWh]
% Improvement
Consumption Rate [qt/MWh] 0.33 0.165 50% 0.19 42%
Program Goal Actual Results2.5L Atkinson Engine
Existing 7.4L
Source: PIER PIR-08-022, Task 6 Endurance Test Report, February 2013
7.5.4 Performance The engine performance, as defined by horsepower and efficiency, was measured at periodic intervals throughout the duration of the program. A direct measurement of shaft power can be challenging, but was especially so with a belt style driveline. This prohibited the more conventional style torquemeter, which is directly sandwiched in the coupling drive assembly between the two drive components and measures the dynamic twist between them. Instead, the torque transducer used in this case had a strain gauge applied with adhesive to the output shaft of the engine coupling. It was connected to a transmitter with a battery that was built rugged enough to rotate with the engine. With wireless telemetry, the torque signal was transmitted to a stationary receiver that output to the data acquisition system. Figure 46 presents a photo of the torquemeter mounted on the engine shaft and pulley drive system.
Figure 46 Torquemeter Installed on Engine Output Shaft
Source: PIER PIR-08-022, Task 6 Endurance Test Report, February 2013
Transmitter
Battery
Strain Gage
79

While the electronic signal was straightforward to calibrate, we felt it was necessary to verify the mechanical torque measurement from the shaft. Using lever/weight arrangement (see Figure 47) we checked the static torque at two significant values. The weights used were ANSI/ASTM 6 reference weights and the lever was 24” long. Referring to Table 17, the static torque was checked at 104 ft-lbs and 44 ft-lbs, corresponding to approximately 40 HP and 17 HP in the heat pump application.
Table 17 Torquemeter Calibration Points
Reference Weight
Torque [Ft-lbs]*
HP [@2000 rpm]
20 44.15 16.8
50 104.15 39.7
*Includes weight of lever and hanger support
Source: PIER PIR-08-022, Task 6 Endurance Test Report, February 2013
Figure 47 Torquemeter Calibration
Source: PIER PIR-08-022, Task 6 Endurance Test Report, February 2013
80
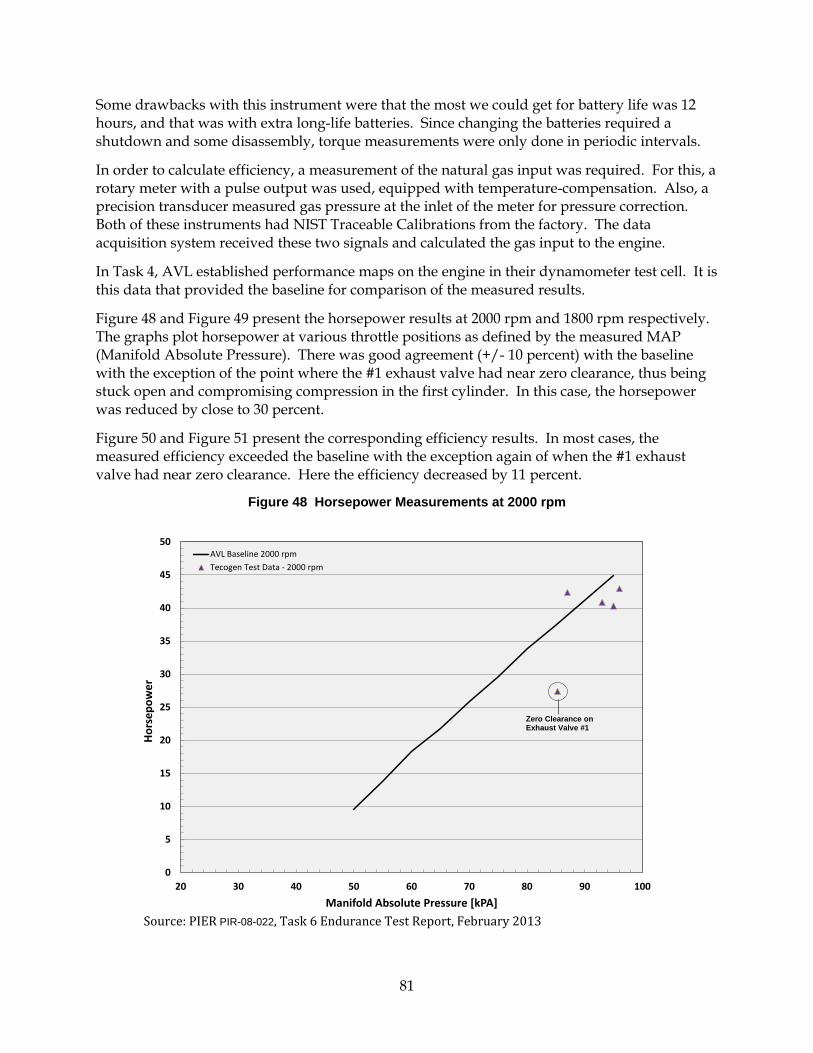
Some drawbacks with this instrument were that the most we could get for battery life was 12 hours, and that was with extra long-life batteries. Since changing the batteries required a shutdown and some disassembly, torque measurements were only done in periodic intervals.
In order to calculate efficiency, a measurement of the natural gas input was required. For this, a rotary meter with a pulse output was used, equipped with temperature-compensation. Also, a precision transducer measured gas pressure at the inlet of the meter for pressure correction. Both of these instruments had NIST Traceable Calibrations from the factory. The data acquisition system received these two signals and calculated the gas input to the engine.
In Task 4, AVL established performance maps on the engine in their dynamometer test cell. It is this data that provided the baseline for comparison of the measured results.
Figure 48 and Figure 49 present the horsepower results at 2000 rpm and 1800 rpm respectively. The graphs plot horsepower at various throttle positions as defined by the measured MAP (Manifold Absolute Pressure). There was good agreement (+/- 10 percent) with the baseline with the exception of the point where the #1 exhaust valve had near zero clearance, thus being stuck open and compromising compression in the first cylinder. In this case, the horsepower was reduced by close to 30 percent.
Figure 50 and Figure 51 present the corresponding efficiency results. In most cases, the measured efficiency exceeded the baseline with the exception again of when the #1 exhaust valve had near zero clearance. Here the efficiency decreased by 11 percent.
Figure 48 Horsepower Measurements at 2000 rpm
Source: PIER PIR-08-022, Task 6 Endurance Test Report, February 2013
0
5
10
15
20
25
30
35
40
45
50
20 30 40 50 60 70 80 90 100
Hor
sepo
wer
Manifold Absolute Pressure [kPA]
AVL Baseline 2000 rpmTecogen Test Data - 2000 rpm
Zero Clearance on Exhaust Valve #1
81

Figure 49 Horsepower Measurements at 1800 rpm
Source: PIER PIR-08-022, Task 6 Endurance Test Report, February 2013
0
5
10
15
20
25
30
35
40
45
50
20 30 40 50 60 70 80 90 100
Hor
sepo
wer
Manifold Absolute Pressure [kPA]
AVL Baseline 1800 rpm
Tecogen Test Data - 1800 rpm
82

Figure 50 Efficiency Measurement at 2000 rpm
Source: PIER PIR-08-022, Task 6 Endurance Test Report, February 2013
Figure 51 Efficiency Measurements at 1800 rpm
Source: PIER PIR-08-022, Task 6 Endurance Test Report, February 2013
83

Figure 52 presents the horsepower output as a function of operating hours where the horsepower is normalized to the baseline (HP/HPbase). Again as noted earlier, the only time there was a significant drop-off was when the exhaust valve clearance on exhaust valve #1 essentially went to zero, causing the valve to hang open. There was a significant decline in horsepower by close to 30 percent. However, it is significant that after the valve adjustment was made with the replacement of the valve bucket/shims, the horsepower output was restored to normal. It was this performance data that demonstrated that overall engine durability, both lower end and head, showed no sign of decline and that by ensuring that zero valve clearance is avoided, engine performance could be maintained. This data provide assurance of commercial viability.
Figure 52 Normalized Horsepower Output vs. Operating Hours
Source: PIER PIR-08-022, Task 6 Endurance Test Report, February 2013
Figure 53 presents efficiency as a function of operating hours, again normalizing the efficiency to the baseline (Eff/Effbase). As with horsepower, there is no indication of a decline in efficiency with accumulating operating hours.
0
0.2
0.4
0.6
0.8
1
1.2
1.4
1.6
1.8
2
0 500 1000 1500 2000 2500 3000 3500 4000
HP/
HP b
asel
ine
Run Hours
Zero Clearance on Exhaust Valve #1
Performance Restored After
Valve Adjustment
84

Figure 53 Normalized Efficiency vs. Run Hours
Source: PIER PIR-08-022, Task 6 Endurance Test Report, February 2013
VARIABLE CAM PERFORMANCE VERIFICATION
In Task 4, AVL’s dynamometer data showed that the variable cam timing, while necessary to implement the Atkinson cycle and operate at a higher compression ratio on a gasoline engine, did not exhibit any significant benefit in the natural gas application. As verification to these results, tests at various cam positions were implemented in the endurance test plan. Figure 54 presents this test data compared to the data taken at AVL on their dynamometer. The first point was at 100 percent cam timing (i.e. least delayed intake valve closing – closest to Otto cycle) and the second point was at 67 percent cam timing, closer to the Atkinson cycle. The data seems consistent with AVL’s data, that is, changing the timing in the direction of simulating an Atkinson cycle does not improve efficiency.
0
0.2
0.4
0.6
0.8
1
1.2
1.4
1.6
1.8
2
0 500 1000 1500 2000 2500 3000 3500 4000
Eff/
Eff b
asel
ine
Run Hours
Performance Restored After
Valve Adjustment
Zero Clearance on Exhaust Valve #1
85
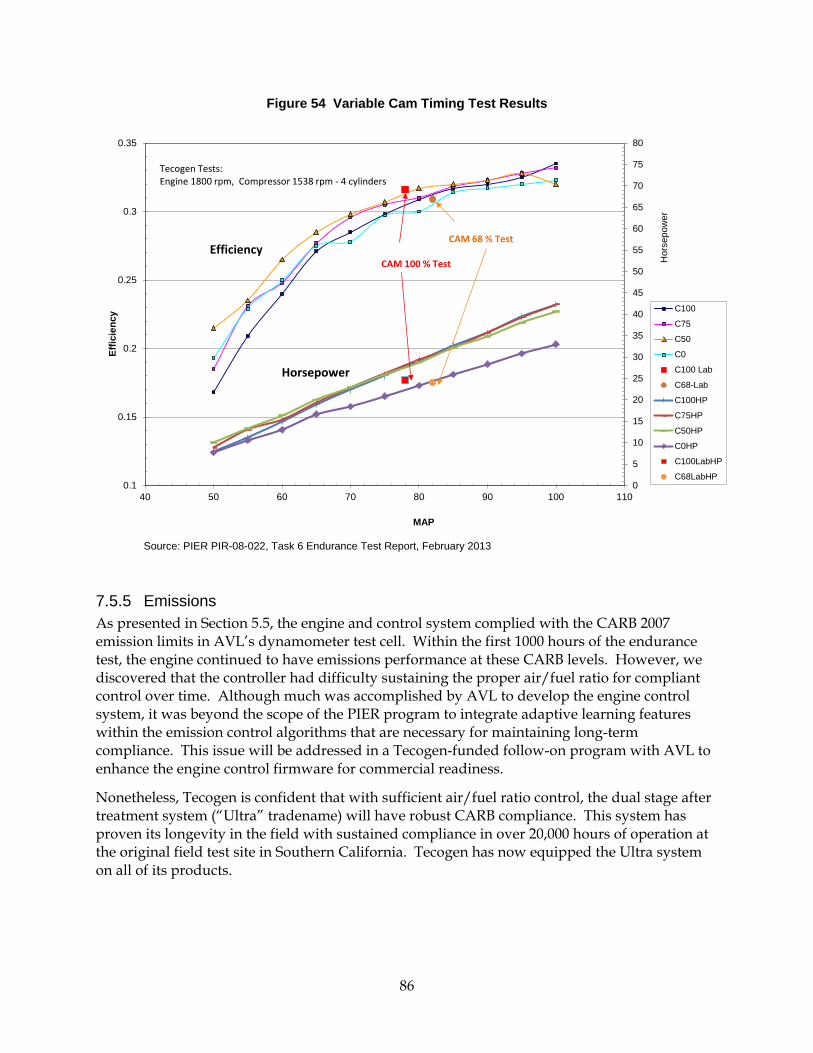
Figure 54 Variable Cam Timing Test Results
Source: PIER PIR-08-022, Task 6 Endurance Test Report, February 2013
7.5.5 Emissions As presented in Section 5.5, the engine and control system complied with the CARB 2007 emission limits in AVL’s dynamometer test cell. Within the first 1000 hours of the endurance test, the engine continued to have emissions performance at these CARB levels. However, we discovered that the controller had difficulty sustaining the proper air/fuel ratio for compliant control over time. Although much was accomplished by AVL to develop the engine control system, it was beyond the scope of the PIER program to integrate adaptive learning features within the emission control algorithms that are necessary for maintaining long-term compliance. This issue will be addressed in a Tecogen-funded follow-on program with AVL to enhance the engine control firmware for commercial readiness.
Nonetheless, Tecogen is confident that with sufficient air/fuel ratio control, the dual stage after treatment system (“Ultra” tradename) will have robust CARB compliance. This system has proven its longevity in the field with sustained compliance in over 20,000 hours of operation at the original field test site in Southern California. Tecogen has now equipped the Ultra system on all of its products.
0
5
10
15
20
25
30
35
40
45
50
55
60
65
70
75
80
0.1
0.15
0.2
0.25
0.3
0.35
40 50 60 70 80 90 100 110
Hor
sepo
wer
Effic
ienc
y
MAP
C100
C75
C50
C0
C100 Lab
C68-Lab
C100HP
C75HP
C50HP
C0HP
C100LabHP
C68LabHP
Tecogen Tests:Engine 1800 rpm, Compressor 1538 rpm - 4 cylinders
CAM 100 % Test
CAM 68 % TestEfficiency
Horsepower
86

7.5.6 Vibration During the course of the endurance testing, the driveline exhibited excessive vibration, especially below 1500 rpm. In fact, some cracking was exhibited in the driveline support structure, specifically the generator pedestal.
Working with a consultant specializing in structural and torsional vibration, we took a series of vibration measurements on the driveline. We also performed an impact test, where a hammer is used to excite the natural frequencies in the structure. It was concluded that the source of vibration was not torsional, but forced vibration from the full torque of the engine being transmitted through the generator on the elevated pedestal (see Figure 40 for belt arrangement). It was determined that by decoupling the engine from the small generator, the excessive movement of the pedestal would be alleviated. This would require a two belt system (i.e. engine/compressor, compressor/generator).
In order to prove this concept expeditiously, we removed the generator from the driveline and just drove the compressor off the engine (i.e. shorter belt). The vibration levels were significantly reduced. The driveline pulley and belt arrangements have since been redesigned for the Ilios product so there are two separate belts. This scheme will be tested in March 2013 on the product, and vibration measurements will be made for comparison to the baseline for design validation.
87
CHAPTER 8: Technology Transfer Tecogen has participated in a number of presentations that highlight the development of the advanced Atkinson engine, and continue to do so. Listed below are several of these presentations:
1. Presentation to SCG regarding the Ilios Heat Pump – September 2011 2. Presentation to Southern California Engine Operators – October 2011 3. Presentation to SCAQMD – October 2011 4. Presentation to Energy Solutions Center – November 2011 5. Presentation to PowerGen – December 2011 6. Presentation to Energy Solutions Center – June 2012
Tecogen also exhibited at the ASHRAE Show in January 2012 and displayed the advanced engine on the high efficiency heat pump water heater (Ilios).
A prominent accomplishment for Tecogen was publishing a technical paper in an SAE Journal. This paper, titled “Exhaust Temperature Control Enhances Dual Stage Catalyst System Performance on Engines Fueled with Low-Pressure Natural Gas”, presented the emission technology developed on CEC Grant PNG-06-002, as well as the validation testing done on the advanced engine in this program (Task 4). SAE International is a worldwide organization of scientists, engineers, and practitioners whose mission is to advance the knowledge of vehicle systems in a neutral forum for the benefit of society. Moreover, their papers undergo a rigorous peer review and acceptance process. We presented this paper at the SAE 2012 International Powertrains, Fuels and Lubricants Meeting in Malmo, Sweden on September 20, 2012. The published paper is available at http://papers.sae.org/2012-01-1730.
88

CHAPTER 9: Commercial Readiness Plan The Commercialization Readiness Plan identifies the pathway for integrating the advanced engine into the Tecogen CHP product line. It also identifies the expected market penetration of the products, as well as identify the benefits to California ratepayers and the potential return on investment.
The Commercial Readiness Plan contains three sections: 1) Technical Readiness Assessment, 2) Market Readiness Assessment and 3) Public Benefits Assessment. Each of these will be presented in the following sections.
9.1 Technical Readiness Assessment The Technical Readiness Assessment presents the actions, time, and funding required to integrate this engine into Tecogen’s products. In the near term, this engine will be readily adapted to the heat pump product within this next year. In the longer term, Tecogen plans to develop a small-sized Premium Power (InVerde) electrical generation package in the size range of 30 – 40 kW. It is expected that this product can be launched in 2015. While we had hoped for an earlier commercial introduction of a small Premium Power unit, the product launch of the Ultra emission system across our entire product line, as well as the uncertainty of a source for a small permanent magnet generator (see Item #15 in the following section), has reallocated resources and shifted this timeline out by a couple of years.
A milestone chart outlining the roadmap to commercialization is presented in Table 18. Each step within the plan is described as follows:
89
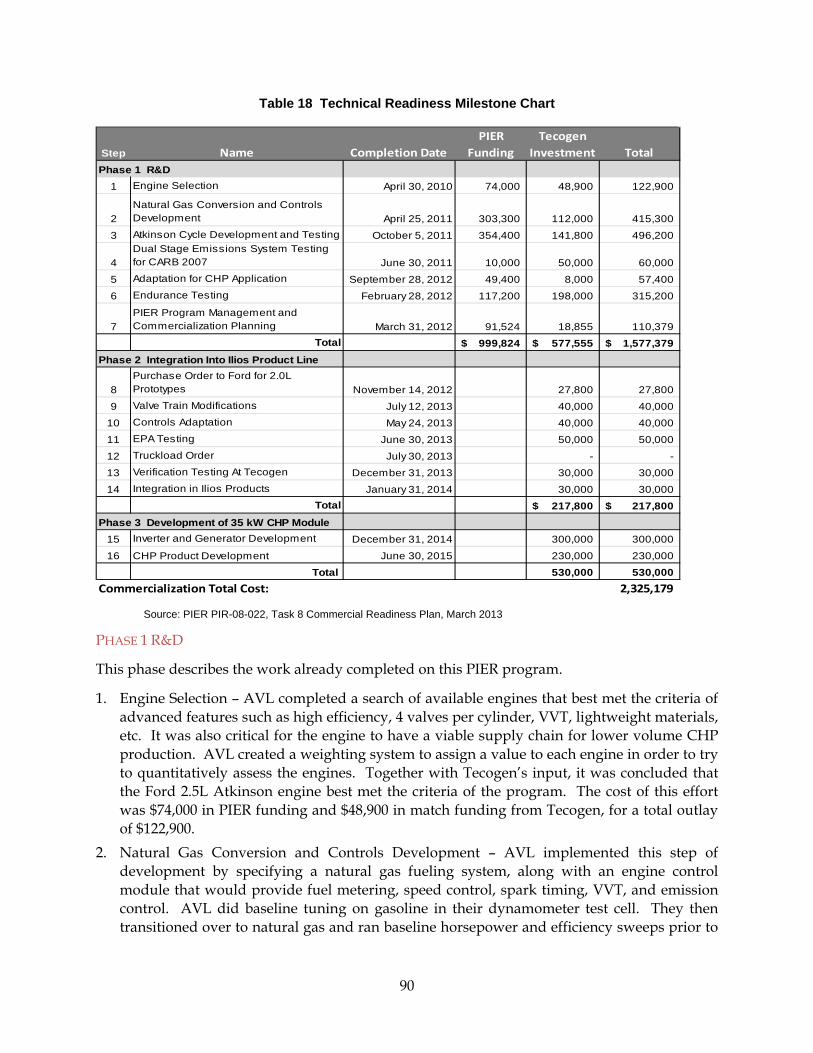
Table 18 Technical Readiness Milestone Chart
Step Name Completion DatePIER
FundingTecogen
Investment TotalPhase 1 R&D
1 Engine Selection April 30, 2010 74,000 48,900 122,900
2Natural Gas Conversion and Controls Development April 25, 2011 303,300 112,000 415,300
3 Atkinson Cycle Development and Testing October 5, 2011 354,400 141,800 496,200
4Dual Stage Emissions System Testing for CARB 2007 June 30, 2011 10,000 50,000 60,000
5 Adaptation for CHP Application September 28, 2012 49,400 8,000 57,400
6 Endurance Testing February 28, 2012 117,200 198,000 315,200
7PIER Program Management and Commercialization Planning March 31, 2012 91,524 18,855 110,379
Total 999,824$ 577,555$ 1,577,379$ Phase 2 Integration Into Ilios Product Line
8Purchase Order to Ford for 2.0L Prototypes November 14, 2012 27,800 27,800
9 Valve Train Modifications July 12, 2013 40,000 40,000
10 Controls Adaptation May 24, 2013 40,000 40,000
11 EPA Testing June 30, 2013 50,000 50,000
12 Truckload Order July 30, 2013 - -
13 Verification Testing At Tecogen December 31, 2013 30,000 30,000
14 Integration in Ilios Products January 31, 2014 30,000 30,000 Total 217,800$ 217,800$
Phase 3 Development of 35 kW CHP Module15 Inverter and Generator Development December 31, 2014 300,000 300,000
16 CHP Product Development June 30, 2015 230,000 230,000
Total 530,000 530,000 2,325,179 Commercialization Total Cost:
Source: PIER PIR-08-022, Task 8 Commercial Readiness Plan, March 2013
PHASE 1 R&D
This phase describes the work already completed on this PIER program.
1. Engine Selection – AVL completed a search of available engines that best met the criteria of advanced features such as high efficiency, 4 valves per cylinder, VVT, lightweight materials, etc. It was also critical for the engine to have a viable supply chain for lower volume CHP production. AVL created a weighting system to assign a value to each engine in order to try to quantitatively assess the engines. Together with Tecogen’s input, it was concluded that the Ford 2.5L Atkinson engine best met the criteria of the program. The cost of this effort was $74,000 in PIER funding and $48,900 in match funding from Tecogen, for a total outlay of $122,900.
2. Natural Gas Conversion and Controls Development – AVL implemented this step of development by specifying a natural gas fueling system, along with an engine control module that would provide fuel metering, speed control, spark timing, VVT, and emission control. AVL did baseline tuning on gasoline in their dynamometer test cell. They then transitioned over to natural gas and ran baseline horsepower and efficiency sweeps prior to
90
Atkinson cycle implementation. The cost of this effort was $303,000 in PIER funding and $112,000 in match funding from Tecogen, for a total outlay of $415,300.
3. Atkinson Cycle Development and Testing – AVL continued dynamometer testing, now implementing the Atkinson Cycle with the delayed intake valve timing (VVT). They ran sweeps at various speed, power levels, and cam settings. The operating efficiency of VVT vs. throttling was also compared. The results showed that the high compression ratio of the Atkinson engine provided a significant boost in efficiency levels throughout the operating range, but the VVT feature did not appear to minimize efficiency losses at part load. The cost of this effort was $354,400 in PIER funding and $141,800 in match funding from Tecogen, for a total outlay of $496,200.
4. Dual Stage Emission Testing For CARB 2007 Compliance – Although the emissions measured on the advanced engine far exceeded engine BACT levels, CO emissions could not be consistently maintained below CARB levels. In order to robustly meet CARB levels, Tecogen decided to adapt the new dual stage technology to the advanced engine and have AVL test it in their dynamometer test cell. This also provided the dual benefit of a third party validation of the dual stage system using state-of-the-art CEMS instrumentation. The results were very successful, the new second stage system design increased the compliance range for the control of the AF ratio by nearly four times and reduced the level of CO emissions at the control setpoint from 13ppm to near 0 ppm. The cost of this effort was $10,000 in PIER funding and $50,000 in match funding from Tecogen, for a total outlay of $60,000.
5. Adaptation for CHP Application – Tecogen adapted the engine for the various subsystems required for CHP applications. This included the driveline assembly, heat recovery system, extended oil service lubrication system, exhaust system, and control harness. The cost of this effort was $49,400 in PIER funding and $8,000 in match funding from Tecogen, for a total outlay of $57,400.
6. Endurance Testing – After AVL completed the dynamometer testing, Tecogen installed the engine in our test cell that was constructed to simulate the heat pump CHP product. The engine was endurance tested for 4070 hours. Mechanical durability and performance were monitored. The results were favorable with the exception of the valve train. It was determined that as configured from the Ford production line, the exhaust valves did not meet the durability standard required for the CHP application. Consequently, a follow-on program is planned with AVL to determine a post-production upgrade to the cylinder head. The cost of this effort was $117,200 in PIER funding and $198,000 in match funding from Tecogen, for a total outlay of $315,200.
7. PIER Program Management and Commercialization Planning - A requirement of PIER funding is Monthly Progress Reports, Task Reports, Critical Program Reviews and a Final Report and presentation. In addition, as the program wound down, a Commercialization Plan was required with the main objective to establish a supply chain arrangement with Ford. It was during those negotiations that we made the decision to move forward with the 2012 model 2.0L Atkinson engine, rather than purchase a truckload (112 engines) of 2.5L engines that would subsequently be discontinued. In taking this approach, we arranged for a follow-on program with AVL to adapt the engine control system to the 2.0L. Also, this successive program is structured to include the determination of a solution for the valve
91

train issue. The cost of this effort was $91,524 in PIER funding and $18,855 in match funding from Tecogen, for a total outlay of $110,379.
Phase 1 R&D is complete and was accomplished with a total investment of $999,824 by PIER and $577,555 by Tecogen, for a total of $1,577,379. PHASE 2 INTEGRATION INTO ILIOS PRODUCT LINE
8. Purchase Order to Ford for 2.0L Prototypes – In August 2012, Tecogen submitted an order to Ford, via the Ford Power Products industrial engine distributor EDI, for eight (8) prototypes engines. Ford required a minimum order quantity of 8 since this is a full pallet. Also, Tecogen was not allowed to submit a commercial order until we obtained EPA emission certification on the 2.0L prototype. The emission limits for EPA certification are significantly more lenient than the CARB certification, so passing the certification testing should not be a problem. However, there is a significant investment of resources for completion and submission of the documentation, as well as third-party laboratory testing. These engines were delivered to Tecogen in November 2012. The cost for these engines was $3314.76 per engine (x 8) plus $1250 for prototype paperwork submission by the distributor, for a total of $27,768.
9. Valve Train Modifications - The outcome of the engine durability test (Task 6) identified that the exhaust valve wear on the Ford Atkinson engine was excessive for reasonable CHP service intervals. Consequently, Tecogen will contract with AVL to perform a teardown inspection of the 2.5L cylinder head from the endurance test engine, as well as assess the 2.0L cylinder head, and formulate a plan for post-production modifications to extend exhaust valve life and service intervals. AVL will recommend vendors for the parts and/or labor, as well as purchase initial development components. They will then implement the modifications on a prototype engine that will be later tested for durability at Tecogen. This work is scheduled to begin in March 2013, and be completed in July 2013, at an estimated cost of $40,000.
10. Controls Adaptation - The transition to the 2.0 L Atkinson engine from the 2.5L requires adapting the engine control system, which was developed in Tasks 3 & 4 of the PIER program, to the newer and smaller engine. This will include utilizing a later version of the controller, implementing the 2.0L engine’s crank trigger configuration, and dynamometer testing to verify engine mapping and emissions. AVL will also incorporate a more commercial-ready diagnostics package as well as adaptive learning features for the emission control system that are necessary for maintaining long-term compliance. This work is scheduled to begin in March 2013 and be completed in May 2013 at an estimated cost of $40,000.
11. EPA Testing – Once AVL completes the controls adaptation and retrofits a prototype 2.0L engine head with the exhaust valve modifications, the engine will be sent to a third-party test facility for EPA certification. This also involves a fairly extensive documentation effort with a qualified EPA certification liaison. The relevant EPA certification is to the standard for Non-emergency SI Natural Gas Engines 25 < HP < 100. The emissions levels for this regulation are much more lenient (226 NOx, 635 CO, ppm @ 15 percent O2) than the CARB limits that we were achieving with the two stage system, as well as with even just a conventional single stage three-way catalyst. Therefore, certification should be relatively
92

straightforward. This work is scheduled to take place in June 2013 at an estimated cost of $50,000.
12. Truckload Order – Once the EPA Certification testing is complete, Ford will accept a commercial order from Tecogen for a truckload of engines. This is a quantity of 112 engines, priced at $3312.76, for a total investment of $382,229. This amount was not included in the Milestone Chart as it will become inventory and the costs will be recovered with product sales. Tecogen expects to place this purchase order by the end of July 2013.
13. Verification Testing at Tecogen – The 2.0L prototype with the new control system modifications, as well the exhaust valve upgrades, will be installed in the endurance test cell at Tecogen. It will first be tested to verify starting, emissions, alarm diagnostics, etc. which may require onsite support from AVL. Then it will be operated 24/7 to accumulate hours for proof of durability. After 2500 hours, we should have sufficient valve clearance measurements for a meaningful comparison to the 2.5L baseline. This work is scheduled to take place from July – December 2013 at an estimated cost of $30,000.
14. Integration into Ilios Product Line - Significant work was accomplished on the PIER program (Task 5) to integrate the engine into the Ilios high efficiency heat pump water heater product line. Mechanically, the engine will drop right in place of the current Ford industrial engine (2.3L Otto cycle engine). The remaining effort is to integrate the engine control with the Ilios control system. This will include reconfiguring the CAN communications interface, start sequence, speed control and diagnostics, as well as adapting the engine wiring harness to the existing system. Also, manufacturing drawings and documentation will require updating. Marketing literature and tools, including the product brochures, economic analysis software, and website will also require revision. Lastly, the customer Operator and Maintenance manual will need to be updated. This work is scheduled to take place in from July 2013 – January 2014 at an estimated cost of $30,000.
Phase 2 R&D will begin in March 2013 and is expected to be completed by January 31, 2014. It will require a total investment by Tecogen of $217,800. PHASE 3 DEVELOPMENT OF A 35 KW CHP MODULE
15. Inverter and Generator Development – Tecogen will need to scale down the existing design of the 100 kW power module which includes the inverter, generator, and controls. Our recent acquisition of the Danotek permanent magnet generator product line will facilitate our developing a scaled-down version of the existing 100 kW generator. Included in the overall product development effort are design drawings, prototype construction and testing, as well as an extensive certification process to UL 1741, the interconnection standard for distributed energy resources. This effort is scheduled for completion by December 2014 and will require a budget of $300,000.
16. CHP Product Development - In addition to the power module, the balance of systems required for the CHP product; that is the engine and its subsystems, heat recovery hydronic system, and overall control integration, will need to be designed and packaged. Certification to UL 2200 Stationary Engine Generator Assemblies is also necessary. This work is expected to be completed by June 2015 requiring a budget of $230,000.
93
At the completion of Phase 3 in 2015, Tecogen will introduce a 35 kW CHP module utilizing this advanced engine platform. The total budget for this effort is estimated at $530,000.
In conclusion, $1.6 million has already been invested in the development of the small CHP advanced engine; $1 million from the California Energy Commission’s PIER program and the balance from Tecogen. Within a year’s time, and an additional Tecogen investment of $0.2 million, the engine will be commercially integrated into the Ilios ultra high efficiency water heater. Tecogen then plans to invest an additional $0.5 million to feature this engine on a 35 kW Premium Power CHP module by 2015.
9.2 Market Readiness Assessment The advanced natural gas engine coupled with our ultra-low emission system considerably elevates the value of small engine technology in a variety of end user applications. Furthermore, these enhancements are scalable in size to span 10 kW up to 100 kW to fit residential, commercial and light industrial facilities. Target applications include water heating and combined heat and power (CHP). A space conditioning unit is also a potential product.
9.2.1 Regulatory and Institutional Factors Water heating – configuring the high performance engine to drive a heat pump water heater with integrated heat recovery can yield COPs twice the efficiency of water heaters in California’s milder climate. Regulatory and Institutional factors include:
• Classified as CHP by the Federal Government, it is eligible for a 10 percent Investment Tax Credit (ITC) and accelerated depreciation (Modified Accelerated Cost Recovery System – MACRS)
• Eligible for gas efficiency incentive from investor owned gas utilities equal to $1 per annual therm savings over conventional water heater
• However, these savings are not adequate to justify the price premium for this device given the bargain basement price for natural gas
• Propane cost is much higher than natural gas affording reasonable economics although there are no applicable State incentives
• Exhaust after-treatment required for systems > 50 hp. Although current air districts exempt engines < 50 hp from permitting, it is expected to be only temporary once a high volume product enters the market.
• Natural gas prices will include cost of CO2 offsets beginning in 2015 resulting in improved economics
CHP – Using the advanced natural gas engine to generate electricity to displace electricity purchases from the utility, while utilizing recovered heat, can yield overall efficiencies of 75 percent or more.
• Federal ITC and MACRS applies – 10 percent for natural gas and 30 percent for bio-fuels • SGIP incentives of $500/kW, but cost of M&V performance, measurement requirements
threaten to negate any benefit • Current and projected economical gas prices benefit CHP economics
94
• CHP systems are subject to departing load charges, standby charges and demand charges, all of which detract from the economic merit
• The Rule 21 certification process has been modified and is now only renewable technologies
• The Rule 21 interconnection rules are being modified again which will likely add time and delays to the process
Space Conditioning – Using the engine to drive a heat pump for space conditioning with heat recovery capability enables high efficiencies in the heating mode but can be problematic in the cooling mode unless the heat can be used for DHW or an absorption chiller.
• Federal ITC and MACRS applies if overall efficiency exceeds 60 percent • Gas efficiency incentive for space heating portion of the load • Gas cooling is considered “fuel switching” and currently no State/utility incentives
apply • Same air permit considerations as for heat pump configuration. • Natural gas prices will include cost of CO2 offsets beginning in 2015 resulting in
improved economics in heating mode and a penalty in the cooling mode unless recovered heat displaces natural gas usage elsewhere.
9.2.2 Business and Commercial Relationships Tecogen products incorporating the advanced engine are similar enough to the existing products line that with the exception of the engine, existing supply chain suppliers and fabricators will be used for heat exchangers, inverters, compressors, enclosures and catalysts. Tecogen has an agreement with Ford to supply engines with the high efficiency features. Tecogen will upgrade the valve seats in order to achieve our durability and life targets. Final assembly will be performed at Tecogen’s facility in Waltham, Massachusetts.
Maintenance of these new products will be provided by Tecogen’s Service Technicians located throughout California and in other US locations.
California marketing and sales support for the new products will be provided by corporate staff and our West Coast Regional Office in Portland, Oregon. Tecogen has multiple relationships to promote its products through conference/meeting presentations and exhibits:
• The Energy Solution Center is a natural gas industry organization that assists suppliers of new gas consuming products with market introduction and growth.
• The American Society of Heating and Refrigeration Engineers (ASHRAE)
• Utility sponsored workshops on CHP and HVAC technology
Furthermore, Tecogen spreads the word about its products and success stories through press releases and articles in industry magazines and periodicals.
Tecogen’s sales network includes manufacturer representatives, engineering firms, developers, and Energy Service Companies (ESCOs). A sister company of Tecogen, American DG Energy (ADGE), owns and operates Tecogen products in New England and sells electricity, hot water
95

and cooling solutions to the host customers. A subsidiary of ADGE, EuroSite Power, has begun offering energy services in Europe. Tecogen has also begun offering products in Mexico, Japan, and Australia.
9.2.3 Technical Market Potential The technical market potential in California was estimated from the 2011 California CHP Market Assessment and SoCalGas’ boiler inventory database. The California water heater market was extrapolated from the SoCalGas database. As there was overlap between the technical potential for the CHP market and the heat pump water heater market, the CHP potential hot water load was subtracted from the water heater potential. The technical potential estimates are summarized in Table 19.
Table 19 California Technical Potential
Source: 1) ICF International Combined Heat and Power Market Assessment, April 2010 2) SoCal Gas Boiler Inventory Data 2004
9.2.4 Economic Market Potential The economic market potential was estimated from the technical potential based on the following considerations:
• Heat pump water heating – An estimated 30 percent of the water heater inventory has a load factor sufficient to support a reasonable economic rate of return. Natural gas prices do not vary appreciably throughout the US so the same 30 percent screen was applied to the US technical potential.
• CHP – The technical potential already considered applications that had sufficient thermal load profiles. Complexity of installation and electricity price will be the two primary factors that shape the economic potential. The economic subset of the technical potential was estimated at 40 percent for California and 20 percent for the US as a whole.
The economic market potential is summarized in Table 20:
Technical Potential California USHeat Pump - Water Heating 27,800 192,000CHP 8,300 55,000Total 36,100 247,000
# of 2.0 L Engines
96

Table 20 California Economic Potential
Source: 1) ICF International Combined Heat and Power Market Assessment, April 2010 2) SoCal Gas Boiler Inventory Data 2004
9.2.5 Engine Cost Tecogen currently has an agreement with Ford Motor Company to purchase the engines in small quantities (200 engines) for $3,315 per engine. Tecogen’s current cost estimate to modify the engines for continuous duty natural gas applications is $800 per engine for a total cost of $4,115. With higher quantity purchases (1,000) from Ford, we don’t anticipate a cheaper price as these quantities are still considered small by Ford. We do expect to lower Tecogen’s per unit cost to $500 lowering the overall engine cost to $3815.
9.2.6 Targeted Customers Customer segments appropriate for Tecogen’s advanced engine products similar to the markets we currently serve. These customer classes include:
• Nursing homes • Small hospitals • Schools • Community colleges • Hotels • Health Clubs • Multifamily Buildings • Retirement residences • Community centers • Jails • Light industrial
9.2.7 Competition There are many alternatives to the advanced engine for producing hot water, heating and cooling, and electric power. As is the case with most end user applications, there is not a single technology solution. Energy solutions incorporating prime movers are usually pricey and must pay for their cost premium through energy cost savings and other value-added features. There are no other advanced natural gas engines in this size range used for stationary energy applications. Representative competitive products along with their advantages and disadvantages relative to the advanced engine are illustrated in Table 21.
Technical Potential California USHeat Pump - Water Heating 27,800 192,000CHP 8,300 55,000Total 36,100 247,000
# of 2.0 L Engines
97

98

Table 21 Competitive Products
Technology Advantages Disadvantages
Hot Water
Natural Gas Fired Boiler/Water Heater
Low Capital Cost; Inexpensive fuel; 80-85% efficient
Efficiency limited to mid-80 %
Propane Fired Boiler/Water Heater
Low capital cost; 80-85% efficient; attractive alternative to natural gas
At efficiency limit; Premium priced fuel
Condensing Water Heater
Capital cost premium; 95-98% efficient Efficiency limited to 98%; Condensate & corrosion management
Electric Resistance Cheap initial cost Unless electricity is cheap, expensive to operate
Electric Heat Pump Efficient and cost effective with inexpensive electricity prices and moderate climate
Not effective in cold climates or where electricity is expensive; Temperature limitations
Heating & Cooling
Gas Heat & Elec. AC Most common solution in colder climates
Expensive summer peak electricity charges; limits on gas efficiency
Electric Heat & AC Low capital cost option often opted for when natural gas not available
Costly to operate in heating and cooling seasons
Electric Heat Pump Most cost effective in milder climates Not effective in colder climates; High electric rates keep cooling costs pricey
Combined Heat & Power
Microturbine Modest O&M costs; high availability; low emissions
High capital cost; modest overall efficiency;
Fuel Cell Ultra-low emissions; high electric efficiency; Attractive incentives
Very high capital and O&M costs; Low overall efficiencies
Source: PIER PIR-08-022, Task 8 Commercial Readiness Plan, March 2013
9.3 Public Benefits Assessment Small-scale electric and direct-drive CHP, such as the systems currently sold by Tecogen, can address the enormous market of multi-family residential, small commercial and institutional/light industrial applications that are currently under-served in California. Because California is unique in its stringent emission requirements, the market for small-scale CHP systems has deteriorated relative to the markets in other regions. Tecogen has succeeded in bringing CHP benefits to small business ratepayers and this new advanced engine product will expand the market and increase benefits to adopters and to ratepayers as a whole.
99

California ratepayers will benefit from the technology developments in four ways: 1) the technology will reach a smaller size customer class that now lacks a cost-effective CHP option; 2) all ratepayers would benefit from the associated reduction in GHG emissions and natural gas consumption; 3) with the future CHP systems, customers will enjoy lower electricity costs, since the power will be produced more efficiently; 4) the use of natural gas-fueled CHP would reduce growth in demand for central power generation, transmission, and distribution, mitigating rising electricity costs.
Table 22 estimates the sales volume and benefits to California that can result from this PIER funded technology. The predictive approach for sales volume was to assume that Tecogen could capture 20 percent of California market and that the California market totals would comprise approximately 30 percent of the total US market. The two planned CHP products (heat pump water heater and cogeneration) and heat pump space conditioner) will result in lower natural gas usage as well as lower carbon emissions due to more efficient energy utilization. In addition to these benefits, we estimate the impact in other U.S. regions to be triple the size of the California market. Lastly, we expect that other manufacturers will follow Tecogen’s lead and introduce competitive products that could easily double Tecogen’s volume.
Table 22 also provides our projection for the royalty payment stream resulting from commercial product sales incorporating the new engine.
Table 22 Benefits Assessment
2014 2015 2016 2017 2018 2019 2020 2030Heat Pump Water HeaterUnits installed/yr - CA 10 20 30 50 70 100 100 130Units installed/yr - Elsewhere 20 40 60 100 150 200 250 400Total units installed/yr 30 60 90 150 220 300 350 530Cumulative units installed 30 90 180 330 550 850 1200 6400Energy Cost Savings/yr (x $1000) $284 $853 $1,706 $3,128 $5,214 $8,058 $11,376 $60,671Natural gas savings, MMcf 38 113 225 413 688 1,063 1,500 8,000CO2 Mitigation, tonnes 1,990 5,969 11,939 21,888 36,480 56,378 79,592 424,490CHPUnits installed/yr - CA 10 20 30 40 50 50 50Units installed/yr - Elsewhere 20 40 80 100 150 200 200Total units installed/yr 30 60 110 140 200 250 250Cumulative units installed 30 90 200 340 540 790 3290Energy Cost Savings/yr (x $1000) $291 $874 $1,941 $3,300 $5,242 $7,669 $31,936Natural gas savings, MMcf 12 36 79 134 213 312 1,300CO2 Mitigation, tonnes 629 1,887 4,193 7,128 11,321 16,563 68,976Cumulative TotalsCalifornia Units 10 40 90 170 280 430 580 2,380Total Units 30 120 270 530 890 1,390 1,990 9,690Energy Cost Savings/yr (x $1000) $284 $1,144 $2,580 $5,070 $8,514 $13,300 $19,044 $92,608Natural gas savings, MMcf 38 124 261 492 822 1,276 1,812 9,300CO2 Mitigation, tonnes 1,990 6,598 13,826 26,081 43,608 67,699 96,154 493,465CEC Annual Royalty Payments $2,289 $6,867 $11,445 $19,838 $27,468 $38,150 $45,780 $59,514
Year
Source: PIER PIR-08-022, Task 8 Commercial Readiness Plan, March 2013
100
CHAPTER 10: Conclusions and Recommendations A summary of the program accomplishments are as follows: 1. The automotive-based engine selected for the program was the Ford 2.5L Atkinson. It met
the critical performance criteria of high efficiency as a result of the advanced thermodynamic cycle. It also had other important innovative features, typical of the latest automotive engines, such as four valves per cylinder, a reduced oil consumption rate, and aluminum block and heads. Furthermore, unlike some of the other automakers (i.e. Toyota, Honda) Ford provided a viable supply chain for a small volume OEM. In fact, the Ford organization was enthusiastic about entering into the CHP industry, as well as becoming involved with a reputably sponsored R&D initiative.
2. The engine development phase of the program was successfully completed by AVL California Technology Center. First, they selected a natural gas fueling system and engine controller. They then developed the control software and calibrations for fuel metering, spark timing, speed, emission control, VVT, and safeties.
3. All performance objectives - power, efficiency, and emissions – were satisfied or exceeded. The key enabling factor in achieving increased efficiency was the Ford Atkinson engine’s high (12.3:1) expansion ratio (compression ratio). This factor alone theoretically enabled a 17 percent efficiency advantage compared to a typical Otto-cycle engine with 9.7:1 compression ratio.
4. VVT did not prove to provide an additional efficiency benefit. First, since natural gas has a higher octane value than gasoline, no unique valve timing strategy was required to operate at the higher compression ratio. Second, the anticipated advantage of VVT at part load was also not realized. This is most likely due to Ford’s method of implementing the Atkinson cycle, where an entire cylinder is actually filled with air-fuel charge on the intake stroke, and then some of this charge is pumped back out during the initial part of the compression stroke (while the intake valve remains open). This "filling and partial emptying" step requires work to be performed, resulting in losses that negate the avoidance of throttling losses.
5. The fumigation style fuel system did not provide sufficient control precision to achieve adequate emission compliance margin when using a conventional all-3WC system. A robust after-treatment system was needed, and the dual-stage catalyst system concept, which had been developed earlier by Tecogen, provided the necessary improvement. CARB 2007 emission levels were achieved, with the level of CO emissions at the control setpoint reduced from 13ppm to near 0 ppm. Also with this new technology, the compliance range for control of the air/fuel ratio increased by nearly four times which can potentially compensate for varying load profiles, component variation, aging oxygen sensors, and catalytic converter degradation.
6. The engine’s mechanical and interface systems were adapted for CHP duty. This included the driveline, heat recovery system, extended oil change system, exhaust system, fuel system, and control wiring. All of these features have already been incorporated into
101

Tecogen’s newest product line, a high efficiency gas engine heat pump hot water heater. At this time, this product is utilizing a standard Ford industrial engine (non-Atkinson) as a placeholder until the advanced Atkinson version is ready for commercial use. This has facilitated manufacturing and testing of most of these adaptations.
7. The endurance test accomplished the goal of determining if the engine had adequate durability for viable CHP application. After 4070 of run hours accumulated, the core engine performed very successfully. The bottom end showed no sign of degradation but the engine head, specifically the exhaust valve seats, demonstrated unacceptable wear that will require a post-production enhancement for commercial readiness.
8. The engine completed 4070 operating hours in the endurance test. The testing was concluded prior to the 5000 hour goal because it had already been determined that exhaust valve wear was unacceptable, and a post-production enhancement would be required for commercial readiness. Also, terminating the testing provided a cautious approach given the tenuous valve clearance. We wanted to prevent a catastrophic failure that could destroy the valve wear evidence critical for the future determination of a remedy.
9. The durability results indicated no issues with the bottom end of the engine as indicated by favorable oil analysis and no changes in oil consumption, horsepower, and efficiency.
10. Tecogen published an SAE paper in 2012 that combined efforts on CEC Grant PNG-06-002 and this program. It is titled “Exhaust Temperature Control Enhances Dual Stage Catalyst System Performance on Engines Fueled with Low-Pressure Natural Gas”. The published paper is available at http://papers.sae.org/2012-01-1730.
The commercialization plan moving forward is as follows: 1. Tecogen will proceed with commercialization utilizing Ford’s newer Atkinson model, a 2.0L
engine (2.5L discontinued). Consequently, Tecogen will re-engage with AVL to adapt the engine control system to the newer engine, as well as make enhancements for improved diagnostics and adaptive learning features for emission control. AVL will also teardown the cylinder head for analysis and a recommendation for a post assembly line exhaust valve clearance modification.
2. Tecogen expects to introduce the 2.0 L Atkinson engine in the high efficiency heat pump water heater in early 2014. This engine’s efficiency improvement of 17 percent over the standard Ford industrial engine now used on this product will boost the overall COP by 10 percent.
3. Tecogen also plans to develop a 35 kW CHP product with this engine platform, to be introduced in mid-2015.
4. The projected market penetration for Tecogen products centered around this small engine platform are 2380 water heating and CHP units in California and 9690 total units worldwide.
102
GLOSSARY
ABDC
AFR
BDC
After Bottom Dead Center
Air-to-Fuel Ratio
Bottom Dead Center
CAN Controller Area Network
CARB California Air Resources Board
CARB 2007 CARB emission guidelines for Distributed Generation
CBE California-Based Entity
CEC California Energy Commission
CEMS Continuous Emission Monitoring System
CHP Combined Heat and Power
CO Carbon Monoxide
CR
ECM
Compression Ratio
Engine Control Module
EPA US Environmental Protection Agency
ER Equivalence Ratio (Stoichiometric AFR)/(Actual AFR), symbolized by the
Greek symbol,phi (φ)
HHV
LHV
Higher Heating Value
Lower Heating Value
IVC Intake Valve Closing
kW kilowatt
Lambda (Actual AFR)/(Stoichiometric AFR), symbolized by the Greek symbol, Lambda (λ)
MAP Manifold Absolute Pressure
103

MBT
MACRS
Minimum for Best Torque
Modified Accelerated Cost Recovery System
NG Natural Gas
NOx Nitrogen Oxide (NO) and Nitrogen Dioxide (NO2)
OEM Original Equipment Manufacturer
PIER California Energy Commission’s Public Interest Energy Research (PIER) Program
ppmvd Parts per million, volumetric dry
SCAQMD South Coast Air Quality Management District
TWC Three-Way Catalyst
VOC Volatile Organic Compounds
WOT Wide Open Throttle
104