Embed Size (px)
Citation preview
New events discovered in the Apollo lunar
seismic data
R. C. Bulow, C. L. Johnson,1 and P. M. ShearerCecil H. and Ida M. Green Institute of Geophysics and Planetary Physics, Scripps Institution of Oceanography,University of California, San Diego, La Jolla, California, USA
Received 8 February 2005; revised 11 July 2005; accepted 15 July 2005; published 27 October 2005.
[1] We use modern seismological data processing tools to revisit the Apollo lunar seismicdata set with the goal of extending and further characterizing the existing catalog ofdeep moonquakes. Our studies focus on the long-period data and include filtering anddespiking noisy data, event classification, cluster identification, and robust methods foramplitude estimation. We perform cross-correlation analyses for known groups of deepevents, confirming earlier visual classifications. By combining the cross-correlationapproach with a robust median despiking algorithm, we produce improved differentialtimes and amplitudes, enabling us to construct cleaner stacks. Each event group,represented by a single waveform stack of its constituent members, is cross correlated withthe continuous time series. We focus on the A1 cluster because it has more catalogedevents than any other cluster and is generally well characterized. Using this approach, weidentify additional events that can be associated with previously defined deep clusters. Forthe deep event group A1 we have found 123 new events, which show phase behaviorsimilar to the 323 previously cataloged events. Our new event search allows us to createoptimized event stacks with improved signal to noise from which revised travel time picks(and thus location estimates) can be made. Application of our methods to other deepclusters should form a more complete event catalog and improve our understanding of thespatial and temporal distribution of deep lunar events.
Citation: Bulow, R. C., C. L. Johnson, and P. M. Shearer (2005), New events discovered in the Apollo lunar seismic data,
J. Geophys. Res., 110, E10003, doi:10.1029/2005JE002414.
1. Introduction
[2] The Apollo Passive Seismic Experiment (PSE) con-sisted of four seismometers placed on the lunar surfacebetween 1969 and 1972 as part of the Apollo Lunar SurfaceExperiment Package. The seismometers were deployed byastronauts on the Apollo 11, 12, 14, 15, and 16 missions.Each station included three long-period instruments (onevertical and two horizontal components, sample rate6.625 Hz) and one short-period instrument (vertical com-ponent, sample rate 53.00 Hz). Continuous data fromstations 12, 14, 15, and 16 (the Apollo 11 instrument failedafter one lunar day) were telemetered to Earth and recordeduntil 1977.[3] Analysts visually inspected the records in order to
identify seismic events. Early studies classified events intofour main types: artificial impacts (such as the boosterrockets ejected from the command module), natural impacts(meteoroids), shallow moonquakes occurring at depths of50–220 km [Khan et al., 2000; Lognonne et al., 2003], anddeep moonquakes (natural events with focal depths between
700 and 1000 km). Events were classified using a variety ofcriteria, including waveform matching, risetime, spectralcharacteristics, shear wave identification, and time ofoccurrence [Lammlein et al., 1974]. Over 12,000 eventshave been identified, more than half of which (6549) aredeep moonquakes [Nakamura et al., 2004]. Most studiesperformed on the lunar seismic data have concentratedon these previously identified events, which contain datastarting 10 min before the detected signal onset and lastinguntil that signal attenuates below the noise level, often anhour or more later.[4] Early analyses of the lunar event data included the
generation of seismic velocity models with different typesof events used to infer information about different regions inthe lunar interior. For example, because artificial impactscreate seismic events of known location and origin time atrelatively small distances from the stations (median distance172 km), energy recorded from these impacts providesinformation on crustal structure: thickness and seismicvelocities to approximately 100 km depth [e.g., Toksoz etal., 1972, 1974]. In contrast, accurately locating meteroidimpacts and moonquakes is challenging because of thesmall number of stations, the poor signal-to-noise ratio ofmany of the records, the often emergent P wave arrivals,and the strong P wave coda that hampers identification of Swave arrivals. Nonetheless, subsets of these events have
JOURNAL OF GEOPHYSICAL RESEARCH, VOL. 110, E10003, doi:10.1029/2005JE002414, 2005
1Also at Department of Earth and Ocean Sciences, University of BritishColumbia, Vancouver, British Columbia, Canada.
Copyright 2005 by the American Geophysical Union.0148-0227/05/2005JE002414$09.00
E10003 1 of 22

been used to estimate lunar seismic velocity profiles downto about 1000 km, the depth of the deepest moonquakes[Nakamura et al., 1976; Dainty et al., 1976; Goins et al.,1981; Nakamura et al., 1982; Nakamura, 1983; Khan et al.,2000; Lognonne et al., 2003]. Seismic velocity structure atdepths greater than 1000 km is not known because of thelack of deeper events and definitively identified far sideevents.[5] Deep moonquakes are the most numerous type of
event recorded by the PSE. These events appear to originatefrom specific source regions, each of which producesrepeatable waveforms [Lammlein, 1977]. Early classifica-tions were made by visual inspection and matching ofwaveforms. Seismograms printed on translucent paper werecompared by placing one atop another on an illuminatedtable. The most current event catalog still lists eventsselected from the continuous data in this manner. A com-bination of waveform cross correlation and single-linkcluster analysis performed on this catalog [Nakamura,2003] has identified clusters of associated deep events frommore than 300 distinct source regions. However, as the
cataloged events were originally detected by eye, it ispossible that many low signal-to-noise events may havebeen overlooked. Modern computing capabilities providemotivation to analyze the continuous data. Waveform cor-relations can be performed systematically, enabling thequantification of similarities among deep moonquakes andthe objective detection of such events in the continuous timeseries.[6] Two characteristics of deep moonquakes are especially
notable: seismograms from each deep event source regionare highly repeatable, and correlate in time with lunar tides[Lammlein et al., 1974]. The waveform repeatability allowsus to use stacking and cross-correlation methods to searchfor previously undetected events in the continuous data.Newly identified events can be added to the existing catalog[Nakamura et al., 2004]. The application of cross-correla-tion techniques to all events in our expanded catalogenables robust identification of events associated with aspecific deep cluster, including our new events, and previ-ously unclassified or incorrectly classified events. This canyield event stacks with increased signal to noise and better
Figure 1. Topographic map [Zuber et al., 1994] of the nearside of the moon showing station locationsand the epicenter of the A1 deep event group.
E10003 BULOW ET AL.: NEW LUNAR SEISMIC EVENTS
2 of 22
E10003
seismic phase identification, from which we can pick traveltimes and estimate cluster hypocenters.[7] Previous studies have suggested that the periodicity
of deep moonquake occurrence times results from thebuildup and release of tidal stresses [Lammlein et al.,1974; Lammlein, 1977; Toksoz et al., 1977]. This furthermotivates our interest in obtaining a more complete catalogof deep moonquakes, as improved temporal information for
each event cluster will allow for more accurate analyses oftidal periodicities.[8] In this paper, we demonstrate how the existing lunar
deep event database can be improved through the analysisof the A1 cluster (Figure 1). We focus on A1 as it is thecluster with the most cataloged events (323 as identified byNakamura et al. [2004]) and has been the subject of manyprevious studies [e.g., Lammlein et al., 1974; Lammlein,
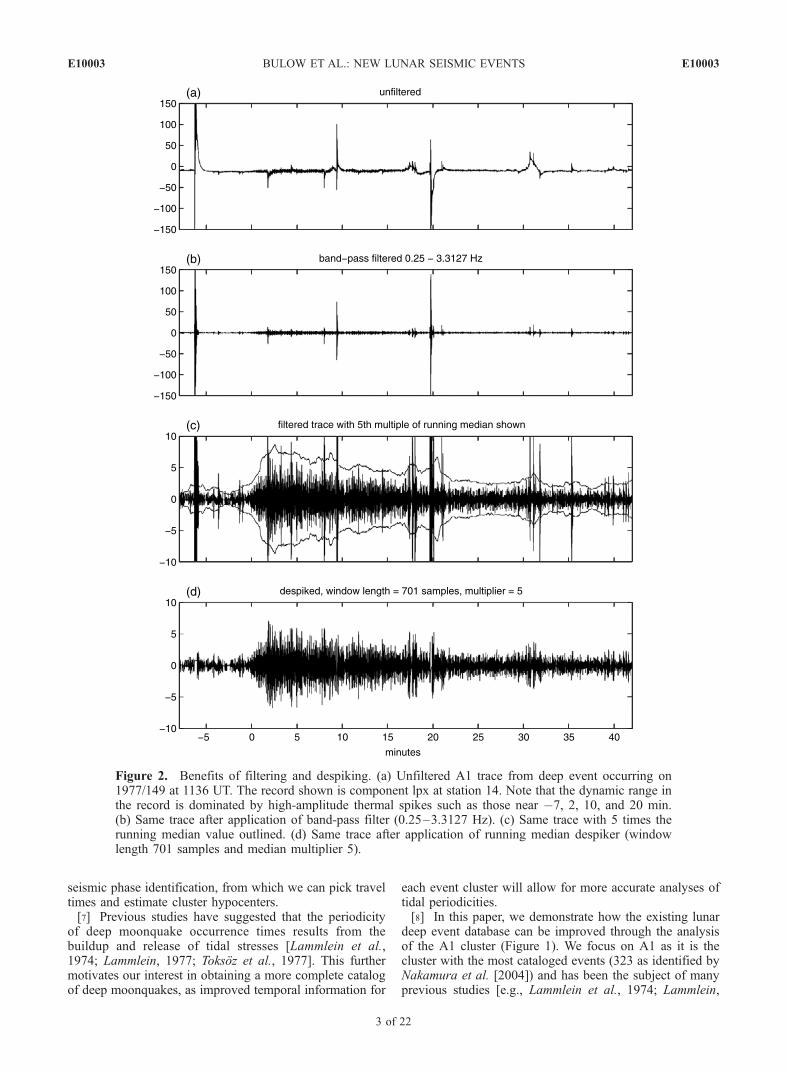
Figure 2. Benefits of filtering and despiking. (a) Unfiltered A1 trace from deep event occurring on1977/149 at 1136 UT. The record shown is component lpx at station 14. Note that the dynamic range inthe record is dominated by high-amplitude thermal spikes such as those near �7, 2, 10, and 20 min.(b) Same trace after application of band-pass filter (0.25–3.3127 Hz). (c) Same trace with 5 times therunning median value outlined. (d) Same trace after application of running median despiker (windowlength 701 samples and median multiplier 5).
E10003 BULOW ET AL.: NEW LUNAR SEISMIC EVENTS
3 of 22
E10003
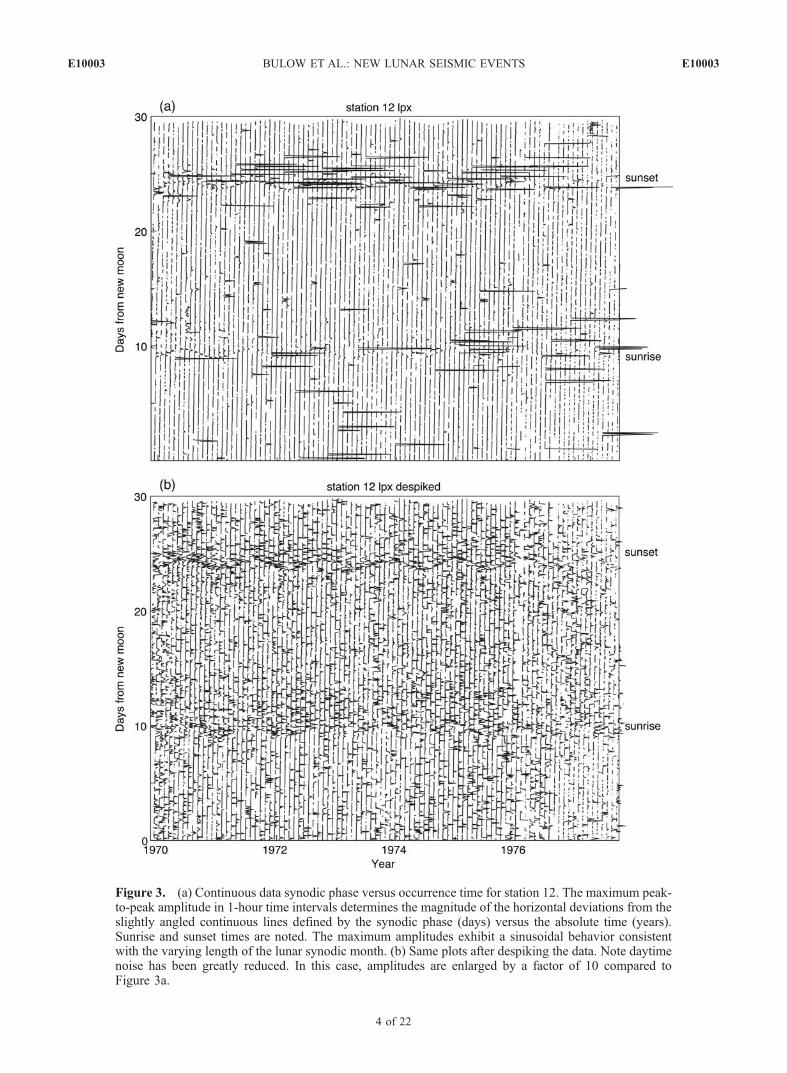
Figure 3. (a) Continuous data synodic phase versus occurrence time for station 12. The maximum peak-to-peak amplitude in 1-hour time intervals determines the magnitude of the horizontal deviations from theslightly angled continuous lines defined by the synodic phase (days) versus the absolute time (years).Sunrise and sunset times are noted. The maximum amplitudes exhibit a sinusoidal behavior consistentwith the varying length of the lunar synodic month. (b) Same plots after despiking the data. Note daytimenoise has been greatly reduced. In this case, amplitudes are enlarged by a factor of 10 compared toFigure 3a.
E10003 BULOW ET AL.: NEW LUNAR SEISMIC EVENTS
4 of 22
E10003
1977; Nakamura, 1978; Toksoz et al., 1977]. However, ourapproach is general and can be extended to other deepclusters. We document the techniques and data processingsteps required in some detail since our analysis begins withthe lunar seismic data in its original format. Although muchof this information is available in previous papers andtechnical reports, our analyses have been greatly helpedby additional information provided through personal com-munication with investigators who originally worked withthe PSE data. We hope that the synthesis provided here willprove useful to those wishing to use this challenging dataset in the future.[9] We first describe initial processing steps applied to
both the event and continuous time series to removepotentially erroneous records, filter, and despike the seismo-grams (section 2). We conduct a qualitative assessment ofthe seismograms for previously cataloged events: a visualinspection of records to provide familiarity with the data setand to obtain an estimate of the percentages of data that areof a specified quality.[10] Our new event search has so far focused on the
A1 cluster. We begin with the preparation of a target
trace for cross correlation: a representative A1 eventstack used to identify all potential A1 events from thecontinuous data (section 3). We perform cross correlationsbetween the stack and the continuous data, noting thetimes of peaks in the correlation function for comparison tocataloged event times. Correlation peak occurrence timesnot coinciding with cataloged event times [Nakamura et al.,2004] may represent new events. New event records aredistinguished from noise by requiring the absolute valueof the cross-correlation function to be greater than athreshold value (section 4). We validate these new events(section 5) by stacking them to enhance their signal levelsand by comparing their occurrence times to tidal perio-dicities recognized previously for the A1 cluster [Lammleinet al., 1974; Toksoz et al., 1977; Lammlein, 1977]. Themethods used to discover new events can also beapplied to identify all events associated uniquely withA1 and to optimize event stacks. These stacks produceimproved signal-to-noise records for measuring P and Sarrival times. Our methodology should be applicable toother deep event clusters, where the discovery of addi-tional events will assist in location and tidal periodicity
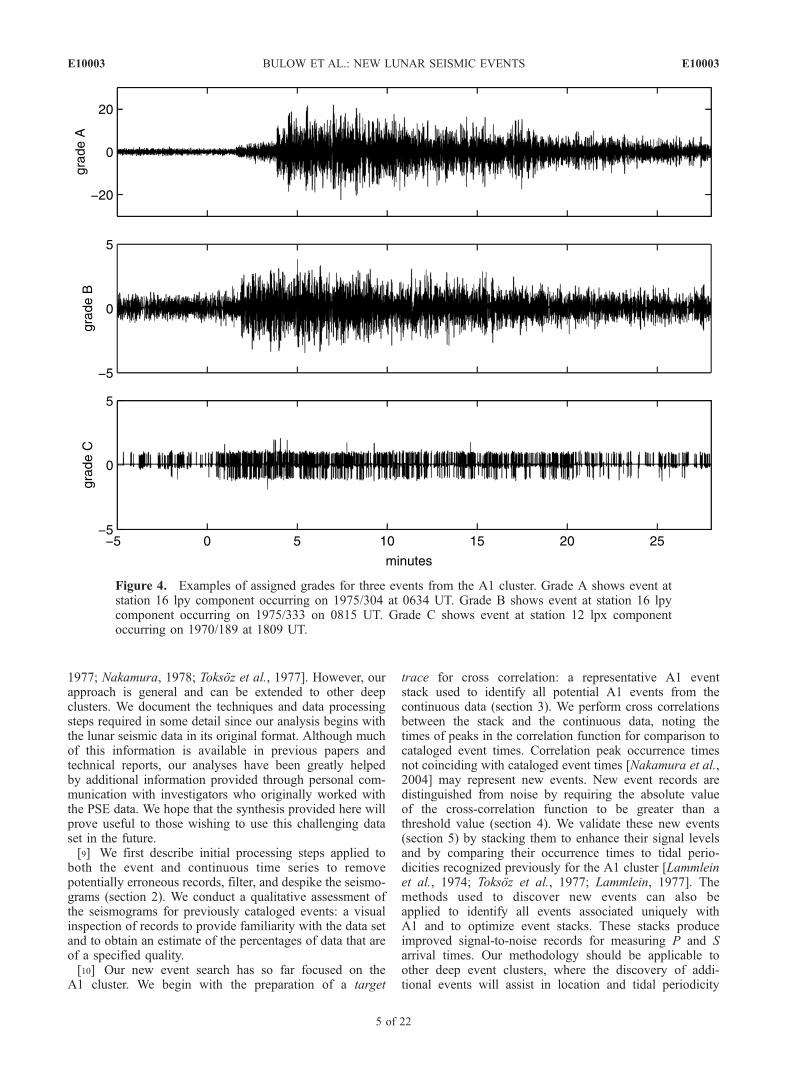
Figure 4. Examples of assigned grades for three events from the A1 cluster. Grade A shows event atstation 16 lpy component occurring on 1975/304 at 0634 UT. Grade B shows event at station 16 lpycomponent occurring on 1975/333 on 0815 UT. Grade C shows event at station 12 lpx componentoccurring on 1970/189 at 1809 UT.
E10003 BULOW ET AL.: NEW LUNAR SEISMIC EVENTS
5 of 22
E10003
studies, particularly for the smaller, less well-identifiedclusters.
2. Data Preparation
[11] The lunar seismic data are currently available fromthe IRIS Data Management Center (www.iris.edu) either
via exabyte tape request or by ftp. Both event data andcontinuous data are available. The event tapes containevents reported in the catalog of Nakamura et al. [2004].The continuous data tapes are available as two separategroups: the PSE (Passive Seismic Experiment) tapesarchiving the seismic data up until 1976 Julian day 60,and the Normal Bit-Rate Work tapes which archive the
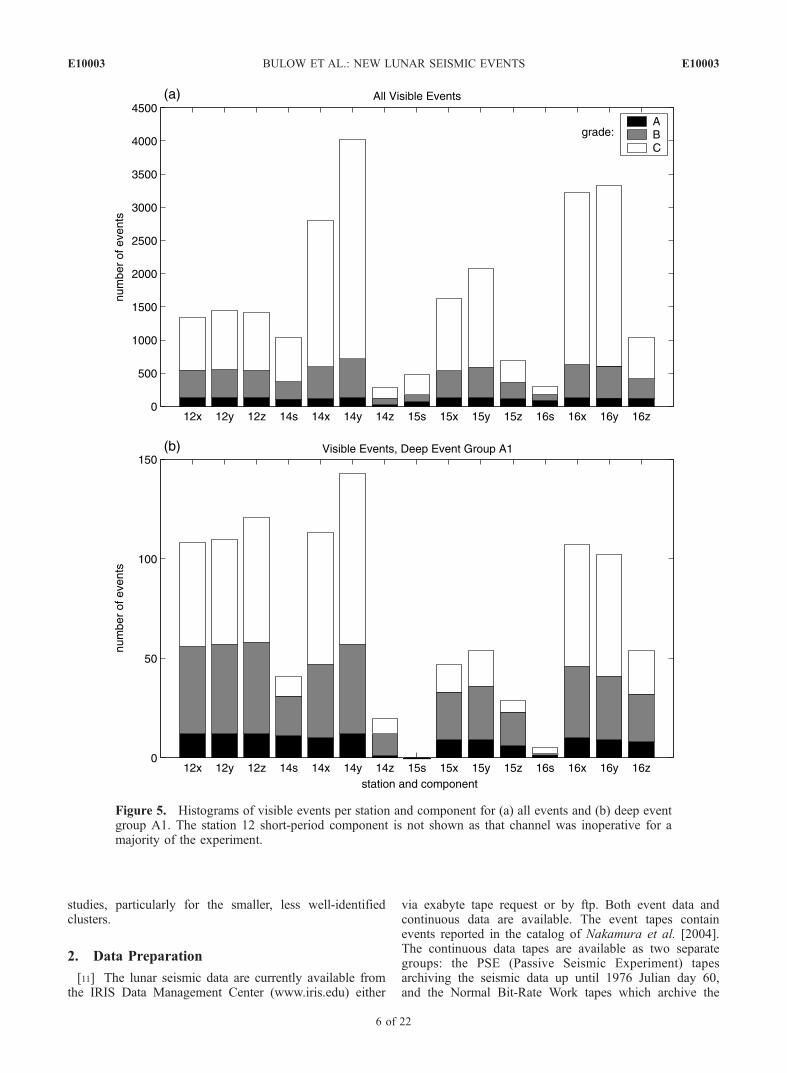
Figure 5. Histograms of visible events per station and component for (a) all events and (b) deep eventgroup A1. The station 12 short-period component is not shown as that channel was inoperative for amajority of the experiment.
E10003 BULOW ET AL.: NEW LUNAR SEISMIC EVENTS
6 of 22
E10003
data from that time until the end of the experiment onJulian day 273, 1977. These two types of continuouslunar seismic data have minor differences in format; bothare available from IRIS.
[12] Each tape consists of a series of records. Read errorsfrom the original magnetic tapes occasionally resulted inthe fragmentation of a record. Other problems were intro-duced by instrument sensitivity to temperature fluctuations
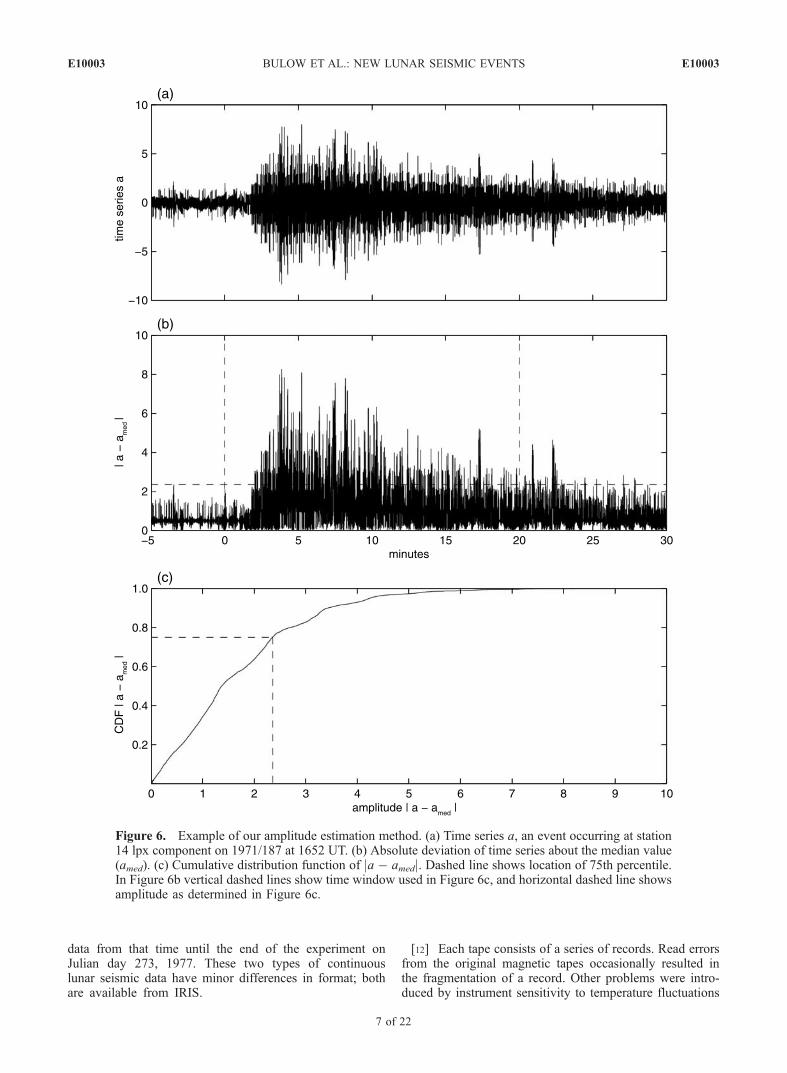
Figure 6. Example of our amplitude estimation method. (a) Time series a, an event occurring at station14 lpx component on 1971/187 at 1652 UT. (b) Absolute deviation of time series about the median value(amed). (c) Cumulative distribution function of ja � amedj. Dashed line shows location of 75th percentile.In Figure 6b vertical dashed lines show time window used in Figure 6c, and horizontal dashed line showsamplitude as determined in Figure 6c.
E10003 BULOW ET AL.: NEW LUNAR SEISMIC EVENTS
7 of 22
E10003
between lunar day and night, telemetry errors, and thelimited dynamic range of the instruments (10 bit sampling).In general, the quality of lunar seismograms is low com-pared to typical terrestrial seismograms. In addition, strongscattering and low attenuation result in emergent arrivalsand extended codas for both P and S waves.[13] Each long-period instrument could be operated in
one of two modes: ‘‘peak’’ or ‘‘flat’’ (broader band)response [Lammlein et al., 1974]. Operating the instrumentsin flat mode sometimes made them unstable, so for the most
part the stations were operated in peak mode. This lattermode had a higher gain, which was fortunate owing to thelow dynamic range of the instruments and the small mag-nitude of natural seismic signals. Additionally, the resonantperiod of the instruments in peak mode is 2.2 s, coincidentwith the frequency range of deep moonquakes. Nonetheless,from Julian day 180, 1975 (1975/180), to day 86, 1977(1977/086), stations 12, 15, and 16 were operated in ‘‘flat’’mode, in which the instrument response was extended tolower frequencies. (Station 12 was also operated in the flat
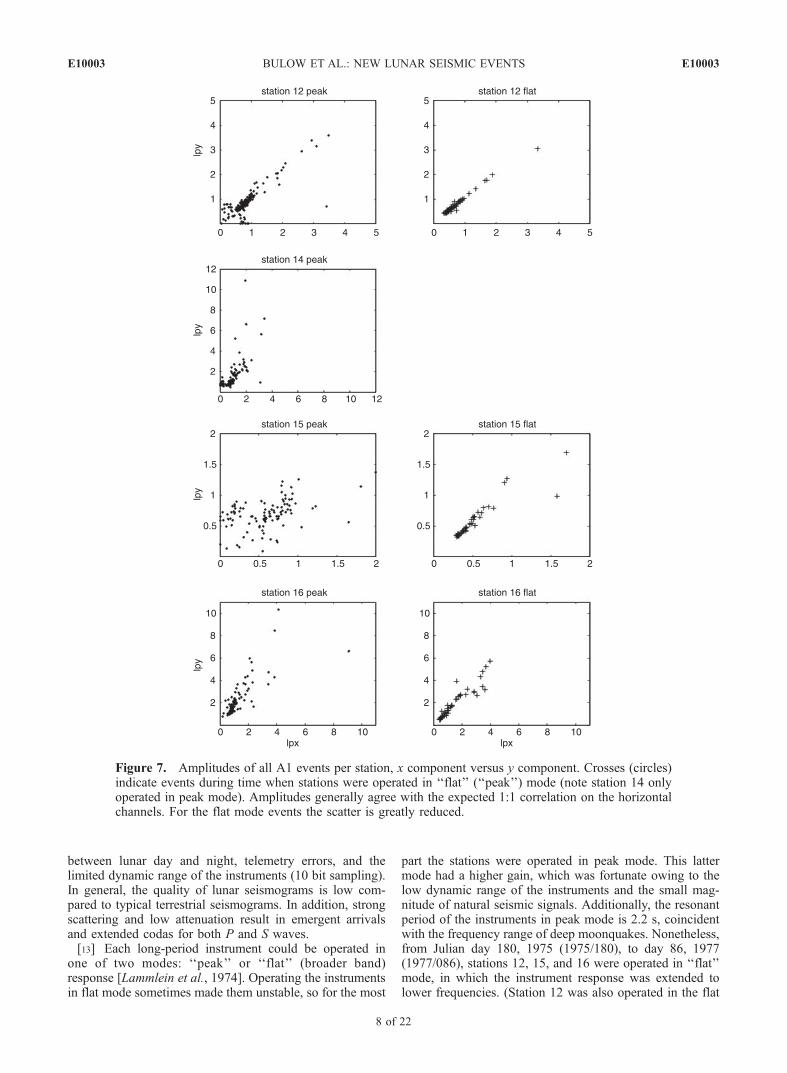
Figure 7. Amplitudes of all A1 events per station, x component versus y component. Crosses (circles)indicate events during time when stations were operated in ‘‘flat’’ (‘‘peak’’) mode (note station 14 onlyoperated in peak mode). Amplitudes generally agree with the expected 1:1 correlation on the horizontalchannels. For the flat mode events the scatter is greatly reduced.
E10003 BULOW ET AL.: NEW LUNAR SEISMIC EVENTS
8 of 22
E10003
mode from 1974/289 to 1975/99.) In this mode, the long-period seismometers have a level response from 1 to 15 s[Lammlein et al., 1974].[14] The analog seismometer output was digitized and
telemetered directly to Earth. Various digitization irregular-ities were common as the digitization of seismic traces wasstill in its infancy when the lunar data were gathered. Errorchecks and filtering performed on the event and continuousdata are described below. Our processing began with theconversion of files from their original format to a format
used in analyses of terrestrial seismic data and adapted forthe lunar data. During this conversion procedure we con-ducted the following checks:[15] 1. The software time flag check indicates that one of
the receiving stations had difficulty reading the standardtime signal, and a computer-generated time was substituted.Such times may be off by as much as several seconds fromthe standard time.[16] 2. The sync pattern check compares a bit string in the
data to the Barker code and its complement. Barker codes
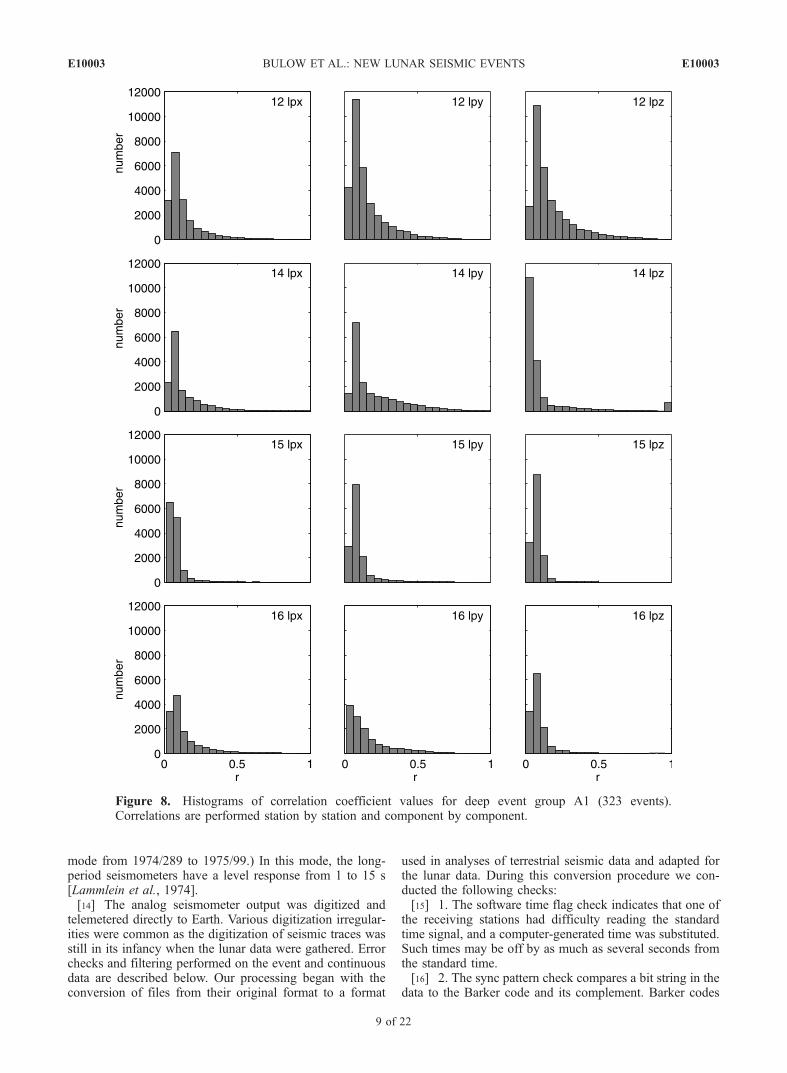
Figure 8. Histograms of correlation coefficient values for deep event group A1 (323 events).Correlations are performed station by station and component by component.
E10003 BULOW ET AL.: NEW LUNAR SEISMIC EVENTS
9 of 22
E10003
are commonly used for frame synchronization in digitalcommunication systems. If the bit string in the data does notmatch the code, the data are out of sync.[17] 3. The timing mismatch check is computed as (tc �
tp) � Dt where tc and tp are the times of the current andprevious records, respectively, and Dt is the predicted timedifference assuming evenly sampled data. We consideredrecords more than 0.5 s off from the previous recordunusable.[18] In this study, we discard records containing any of
the above errors since the precise time correction requiredfor reliable timing information is unknown. To removelong-period fluctuations and secular trends from the data,we band-pass filter the traces from 0.25 Hz to the Nyquistfrequency (3.3127 Hz). However, some large-amplitudeanomalies characterized by sharp onsets and exponentialamplitude decay pass through the filter and emerge asspikes (Figures 2a and 2b). These spikes are observed onall stations and are most intense near lunar sunrise andsunset; they are likely caused by the thermal expansion andcontraction of the insulating shroud protecting each instru-ment [Lammlein et al., 1974].
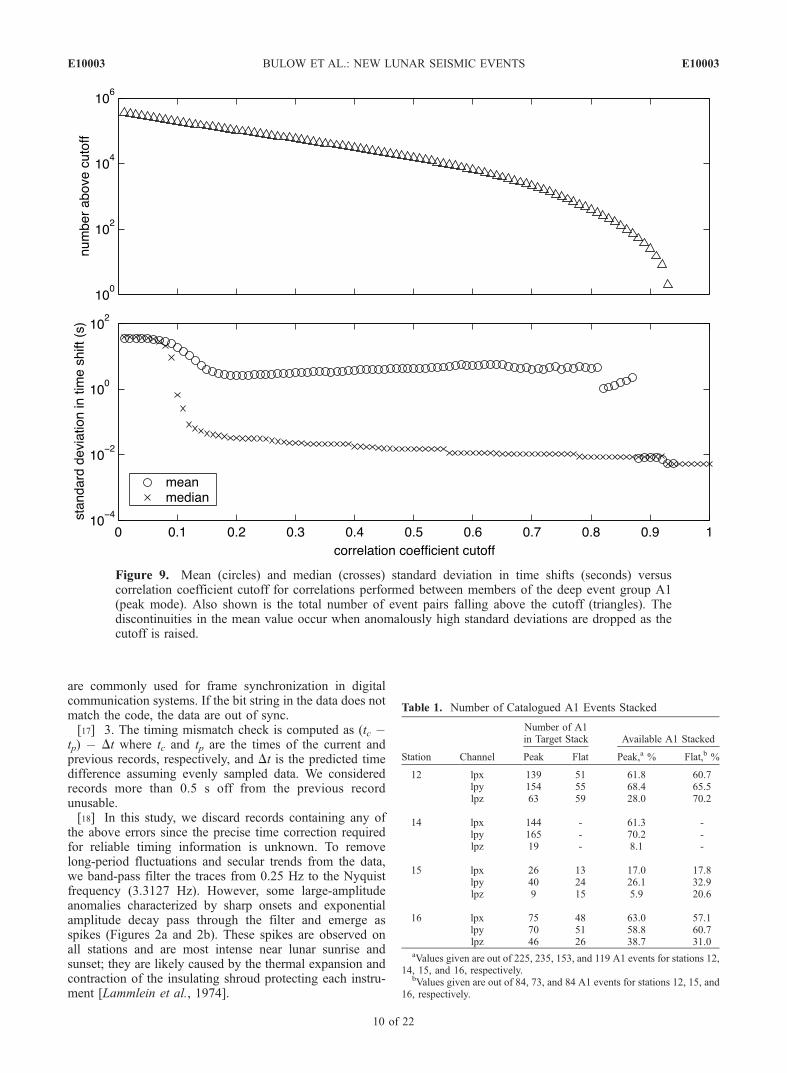
Figure 9. Mean (circles) and median (crosses) standard deviation in time shifts (seconds) versuscorrelation coefficient cutoff for correlations performed between members of the deep event group A1(peak mode). Also shown is the total number of event pairs falling above the cutoff (triangles). Thediscontinuities in the mean value occur when anomalously high standard deviations are dropped as thecutoff is raised.
Table 1. Number of Catalogued A1 Events Stacked
Station Channel
Number of A1in Target Stack Available A1 Stacked
Peak Flat Peak,a % Flat,b %
12 lpx 139 51 61.8 60.7lpy 154 55 68.4 65.5lpz 63 59 28.0 70.2
14 lpx 144 - 61.3 -lpy 165 - 70.2 -lpz 19 - 8.1 -
15 lpx 26 13 17.0 17.8lpy 40 24 26.1 32.9lpz 9 15 5.9 20.6
16 lpx 75 48 63.0 57.1lpy 70 51 58.8 60.7lpz 46 26 38.7 31.0
aValues given are out of 225, 235, 153, and 119 A1 events for stations 12,14, 15, and 16, respectively.
bValues given are out of 84, 73, and 84 A1 events for stations 12, 15, and16, respectively.
E10003 BULOW ET AL.: NEW LUNAR SEISMIC EVENTS
10 of 22
E10003
[19] The association of noise spikes with lunar sunrise andsunset is illustrated in Figure 3, in which we show themaximum peak-to-peak amplitudes in 1-hour time windowsas a function of time since the last new moon (the phaserelative to the 29.53-day period of the synodic month, or thetime between two consecutive new moons) for continuousdata from station 12. The noisiest parts of the records occurnear the times of lunar sunrise and sunset, and in general therecords are noisier during the daytime. Figure 3 also illus-trates gaps in the data as recovered from the tape archives;these gaps amount to only about 1% of the total time period.[20] We remove noise spikes and thermal anomalies from
our filtered records using a robust median despiking algo-rithm [Evans, 1982] to avoid bias in event amplitudeestimation and other calculations. We compute the medianvalue of the time series in a running window of length msamples. Points within the window that lie above a user-specified multiple of the median are removed and replacedwith a linear interpolation of the data across the spikes. Atrace that has been despiked using a window length of 701samples (approximately 2 min) and a median multiplier of 5is shown in Figures 2c and 2d. Experimentation showed thatthese parameter values result in a relatively conservative
despiking method that removes the largest anomalies asso-ciated with the spikes with minimal clipping of actual data.Despiking also improves phase/time plots, emphasizing thecorrelation between noise spikes and lunar sunrise andsunset (Figure 3b).
3. Analysis of Previously Identified DeepMoonquakes
[21] To familiarize ourselves with the lunar data, weanalyze previously detected deep moonquakes for whichevent seismograms are available. We visually inspect thisentire data set to evaluate event quality and distribution.Next, we assess A1, the largest of the deep clusters,examining event amplitudes and correlations among wave-forms. The results are used to establish selection criteria forA1 events that can be stacked to create target traces. Thesetraces are then used to find previously undetected events inthe continuous time series.
3.1. Qualitative Event Characteristics: All Events
[22] We apply a manual ‘‘grading’’ technique in which allcataloged events [Nakamura et al., 2004] are inspected
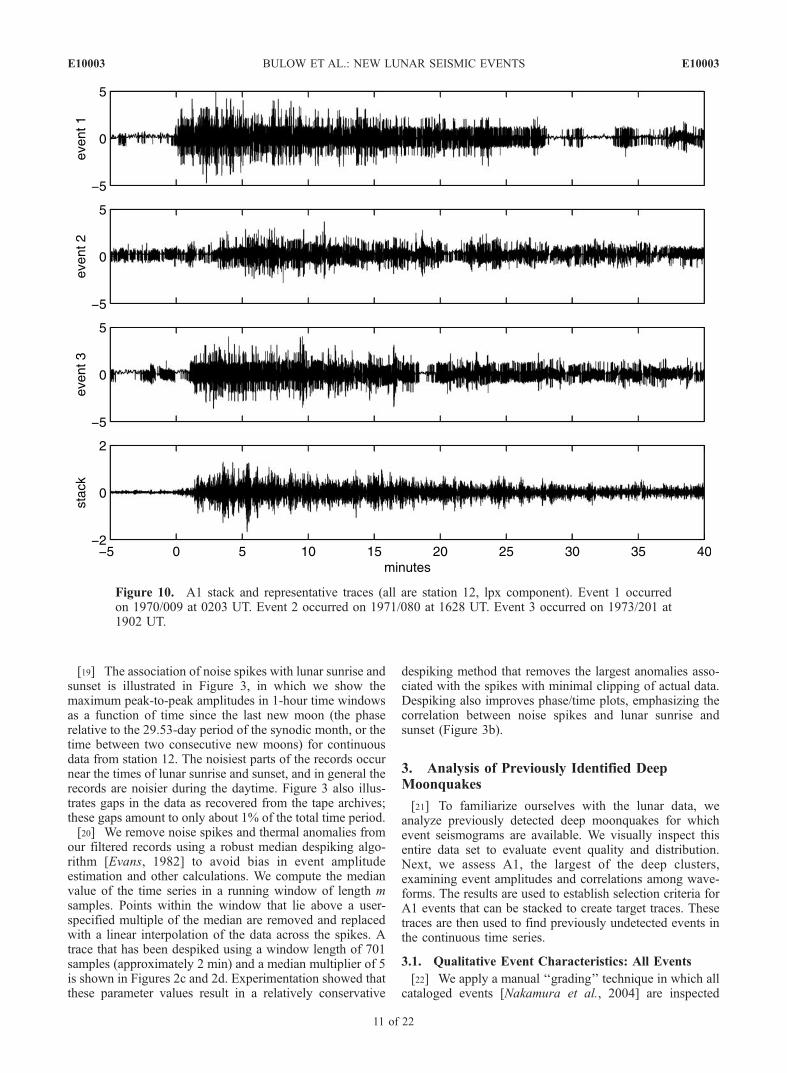
Figure 10. A1 stack and representative traces (all are station 12, lpx component). Event 1 occurredon 1970/009 at 0203 UT. Event 2 occurred on 1971/080 at 1628 UT. Event 3 occurred on 1973/201 at1902 UT.
E10003 BULOW ET AL.: NEW LUNAR SEISMIC EVENTS
11 of 22
E10003
visually and assigned a grade of A, B, or C based on thequality of their traces. In the grading process we considerseveral factors, including signal to noise, initial impulsecoherence, the shape of the envelope function, and theappearance of the event on one or more of the long-periodchannels. This grading allows for easy selection of subsetsof high-, medium-, or low-quality traces for later analyses(Figure 4).[23] A trace receiving the grade ‘‘A’’ generally has high
signal to noise and an impulsive onset, and seismic phasesmay be visible. A grade ‘‘B’’ trace has somewhat lowersignal to noise and a more gradual emergence, but a distinctenvelope is still evident. A grade ‘‘C’’ trace has inferiorsignal to noise and the entire event trace is often dominatedby amplitudes of a single digital unit, with the event seen as
a region in the trace with a greater frequency of 1-bitfluctuations between high and low. While events may(optimistically) be detected from such traces, any estimationof event amplitude or timing is problematic. The percen-tages of events receiving grades A, B, and C are 2%, 8%,and 57% respectively, with 33% remaining ungraded (i.e.,of poorer quality than grade ‘‘C’’), representing 263, 1019,7127, and 4149 of the 12,558 events in the Nakamura et al.[2004] catalog.[24] We consider a previously cataloged event ‘‘visible’’
if it received a grade during this process. Events notreceiving a grade were not readily distinguishable frombackground noise (and in fact were originally detected onlyafter processing with an unconventional filter). Significantvariability in the total number of ‘‘visible’’ events is seen
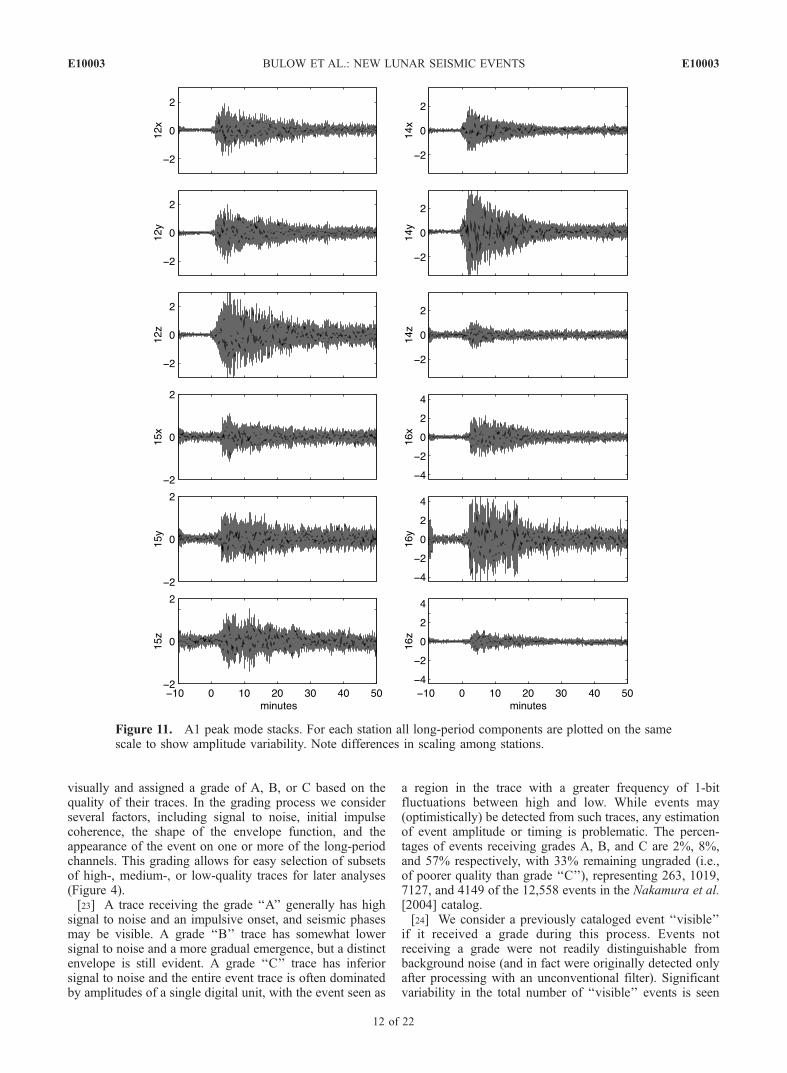
Figure 11. A1 peak mode stacks. For each station all long-period components are plotted on the samescale to show amplitude variability. Note differences in scaling among stations.
E10003 BULOW ET AL.: NEW LUNAR SEISMIC EVENTS
12 of 22
E10003
among different stations and for a given station among thex, y, and z channels. Histograms of event visibility by stationand channel are shown in Figure 5a for all events andFigure 5b for the deep event group A1 alone.[25] Similar patterns in the relative number of visible
events are seen for all events and for the A1 group.However, the A1 cluster has higher relative visibility onstation 12 compared to stations 14 and 16 (Figure 5b) thanthat of all events (Figure 5a). This is likely due to theproximity of the A1 source to station 12 (Figure 1). Twoadditional station characteristics are apparent in Figure 5.First note that the long-period z component of station 14was inoperative for most of the deployment and did notrecord many seismograms. Second, the A1 events (and deepmoonquakes in general) tend not to appear in the short-period seismograms. (Note that there is no data for the
station 12 short-period instrument, which failed shortly afterdeployment.) Because of this, we restrict our analyses ofdeep events to the long-period data.
3.2. Quantitative Event Characteristics:Deep Cluster A1
[26] The deep event cluster A1 has the most catalogedevents and is the focus of further quantitative studies, includ-ing amplitude estimation and waveform cross correlation.3.2.1. Event Amplitude Estimation[27] We investigated several methods for estimating event
amplitudes in order to identify a consistent amplitudemeasure despite the poor signal-to-noise ratio exhibited bya majority of the traces. These included relative amplitudescalculated through cross correlation and several differentestimates of absolute amplitude.
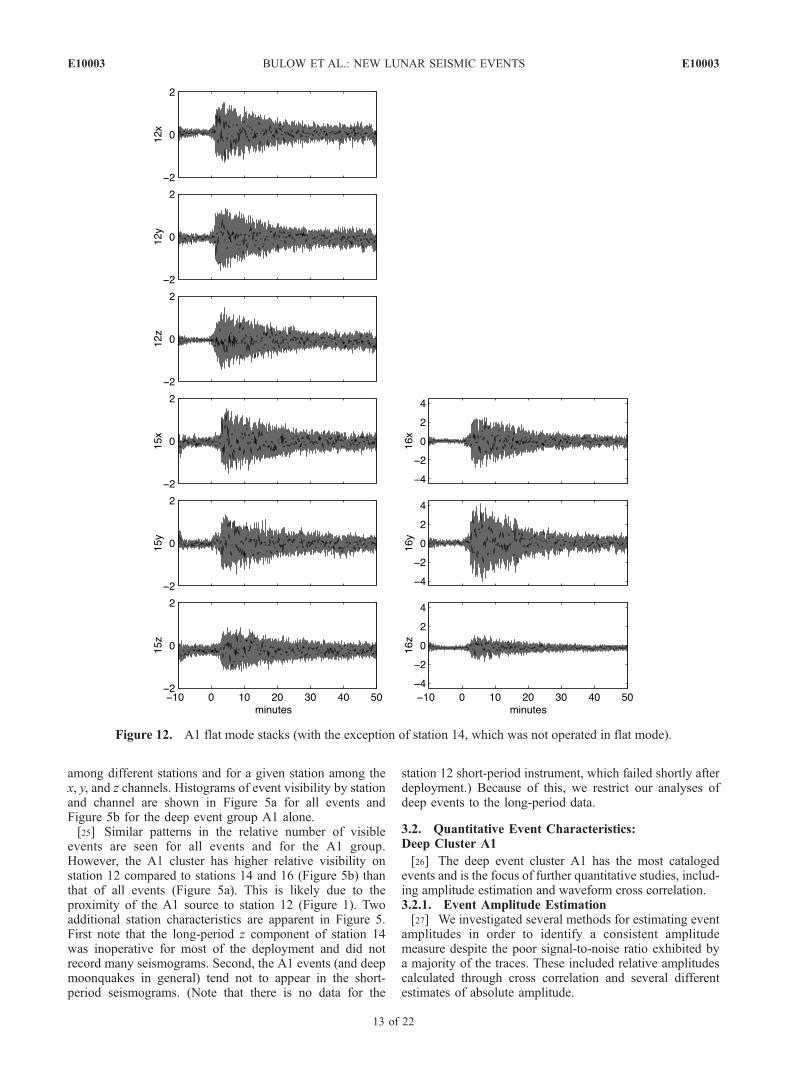
Figure 12. A1 flat mode stacks (with the exception of station 14, which was not operated in flat mode).
E10003 BULOW ET AL.: NEW LUNAR SEISMIC EVENTS
13 of 22
E10003
[28] Among these estimation methods, the most consis-tent amplitudes were obtained using the 75th percentileof the absolute deviation of the data from the median(Figure 6). We consider amplitudes consistent if they exhibitsimilar values on the horizontal channels, corresponding toa 1:1 relationship on x component versus y componentamplitude plots. Amplitude consistency between the long-period horizontal channels is shown for deep event cluster
A1 in Figure 7. We have found that amplitude character-istics vary depending on the mode in which the instrumentswere operated. As a result, the flat and peaked modes areshown separately for stations 12, 15, and 16 (station 14 wasnot operated in the flat mode). Events recorded during theflat mode exhibit a clear 1:1 relationship between x and yamplitudes. In contrast, x and y component amplitudeestimates for events recorded during the peak mode are less
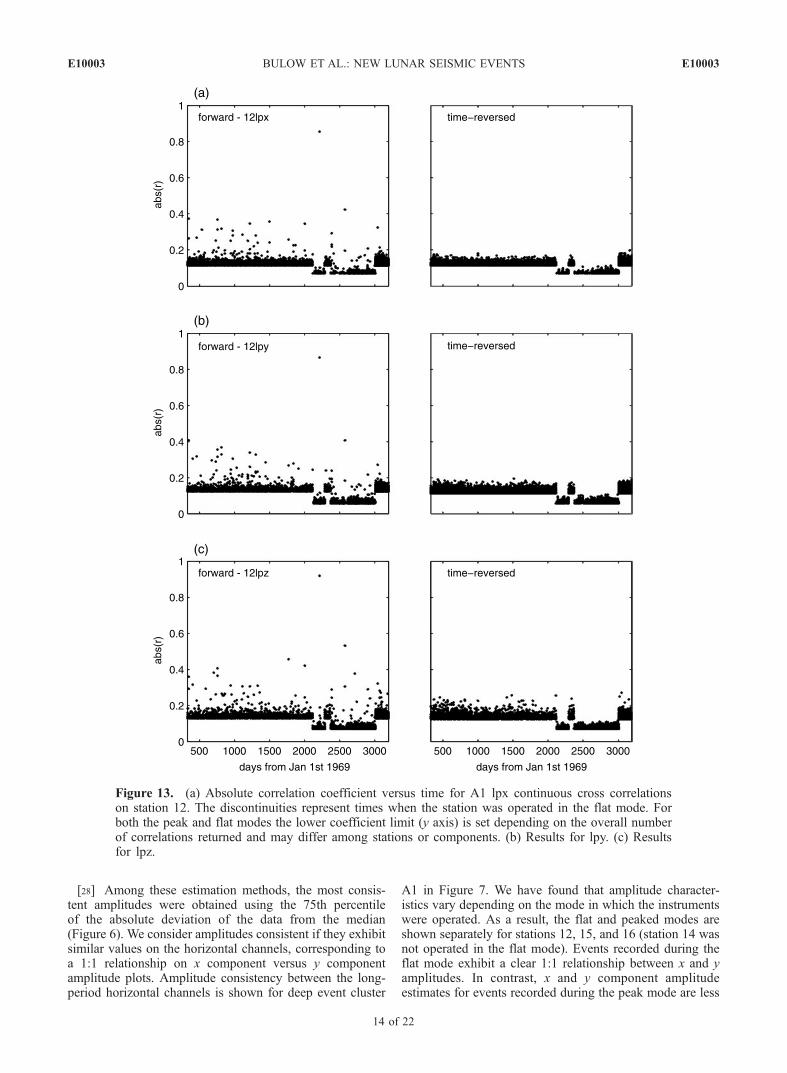
Figure 13. (a) Absolute correlation coefficient versus time for A1 lpx continuous cross correlationson station 12. The discontinuities represent times when the station was operated in the flat mode. Forboth the peak and flat modes the lower coefficient limit (y axis) is set depending on the overall numberof correlations returned and may differ among stations or components. (b) Results for lpy. (c) Resultsfor lpz.
E10003 BULOW ET AL.: NEW LUNAR SEISMIC EVENTS
14 of 22
E10003
consistent. This is probably due to the fact that flat modeevents tend to have better signal to noise than peak modeevents. This is manifest in our grade results, which showthat 23% of graded flat mode events received an A grade,while only 6% of peak mode event did so. Consequently, infurther analyses we treat flat mode and peak mode record-ings separately. Overall, stations 12 and 16 show the mostconsistent amplitudes on the horizontal channels.3.2.2. Robust Identification of A1 Events[29] Owing to variations in deep event classification
methods and the low signal-to-noise ratio of many records,waveforms from one deep event source may be similar tothose from other sources. To more accurately identify deepevent group members, every event from a previouslyclassified group is cross correlated with every other eventin that group. This quantifies the level of associationamong members of a deep event group, identifying thebest matched events. Before cross correlation, the data arefiltered and despiked. A 20-min window is used in eachcalculation; the beginning of the window is aligned withthe catalog event start time. The time shifts and relativeamplitudes of the traces are recorded for the peak positiveand negative correlations of two given traces. The largestabsolute value of the correlation coefficient determines theevent polarity. For each event pair, correlations for thethree long-period channels at each station are performedseparately.[30] Histograms of correlation coefficient values for cal-
culations performed among all A1 deep events are shown inFigure 8. Note the malfunction of the lpz component atstation 14, reflected in the overall low correlation of itstraces. The few high correlations (0.9 to 1.0) for 14 lpz areartifacts generated by correlations between two ‘‘flat line’’
traces on that channel. Another station characteristic is thelow number of events with absolute values of correlationcoefficient higher than 0.2 on any of the channels onstation 15. This could possibly be a result of the overalllow amplitude of events recorded on that station (Figure 7).Whether this reflects instrument or site characteristics isunknown, although it has been suggested that station 15 issituated in such a manner that waveforms from the A1source vary with tidally induced changes in slip behavior(Y. Nakamura, personal communication, 2005). The overallnumber of correlations decreases from station 12 to 16 sincestations deployed earlier recorded more events. Applicationof the despiking algorithm to the data before performing thecross correlations produces overall larger correlation coef-ficient values and improved estimates of differential timesand amplitudes.[31] ‘‘Good’’ correlations are identified by examining the
agreement in time shifts (the time offset required to align apair of traces for maximum cross correlation) for each eventpair as a function of cross-correlation coefficient (Figure 9).Above an absolute correlation coefficient of �0.2, themedian standard deviation in time shifts is less than 0.1 s,which is smaller than the data sampling interval and reflectsaccurate timing. Below this value, the variability in timeshifts increases dramatically.3.2.3. Stacking A1 Events[32] We generate deep event group stacks from event
pairs meeting an absolute correlation coefficient cutoff of0.2 or higher. The traces were despiked and appropriatelytime shifted, and negative polarity events were flippedbefore stacking. We make separate stacks for both the flatand peaked station modes, and normalize the stacks by thenumber of contributing traces. Our cross-correlation selec-
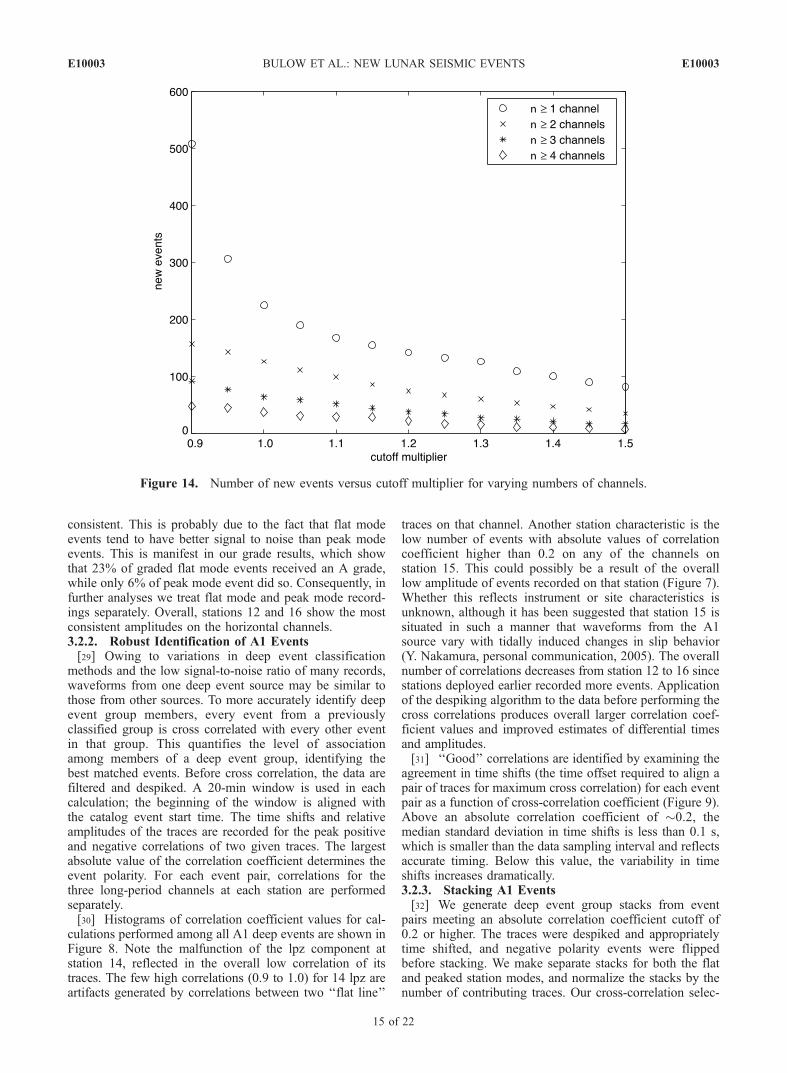
Figure 14. Number of new events versus cutoff multiplier for varying numbers of channels.
E10003 BULOW ET AL.: NEW LUNAR SEISMIC EVENTS
15 of 22
E10003
tion criterion results in the retention of between 17% and71% of the cataloged A1 events for the horizontal channelstacks and up to 39% of the cataloged events for verticalchannel stacks (Table 1). Despiking before stacking allowsfor greatly improved signal to noise, as shown in Figure 10.Stacks for deep event group A1 on all long-period compo-nents are shown in Figure 11 for the peak mode and
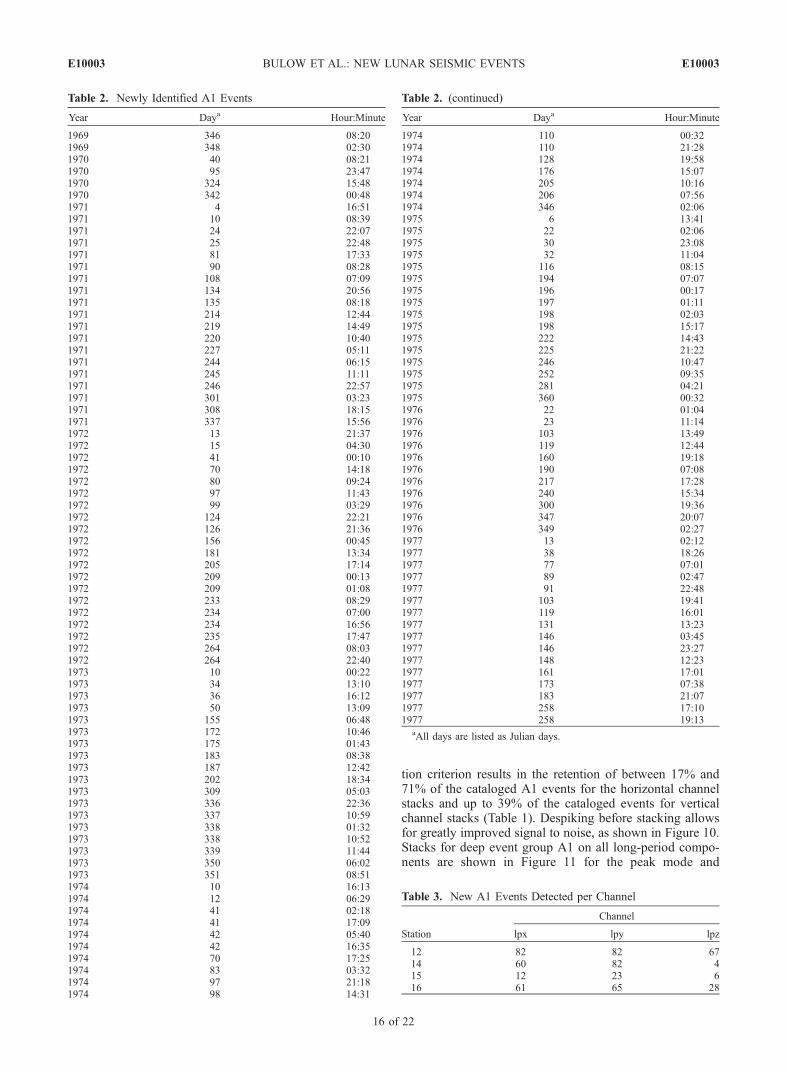
Table 2. Newly Identified A1 Events
Year Daya Hour:Minute
1969 346 08:201969 348 02:301970 40 08:211970 95 23:471970 324 15:481970 342 00:481971 4 16:511971 10 08:391971 24 22:071971 25 22:481971 81 17:331971 90 08:281971 108 07:091971 134 20:561971 135 08:181971 214 12:441971 219 14:491971 220 10:401971 227 05:111971 244 06:151971 245 11:111971 246 22:571971 301 03:231971 308 18:151971 337 15:561972 13 21:371972 15 04:301972 41 00:101972 70 14:181972 80 09:241972 97 11:431972 99 03:291972 124 22:211972 126 21:361972 156 00:451972 181 13:341972 205 17:141972 209 00:131972 209 01:081972 233 08:291972 234 07:001972 234 16:561972 235 17:471972 264 08:031972 264 22:401973 10 00:221973 34 13:101973 36 16:121973 50 13:091973 155 06:481973 172 10:461973 175 01:431973 183 08:381973 187 12:421973 202 18:341973 309 05:031973 336 22:361973 337 10:591973 338 01:321973 338 10:521973 339 11:441973 350 06:021973 351 08:511974 10 16:131974 12 06:291974 41 02:181974 41 17:091974 42 05:401974 42 16:351974 70 17:251974 83 03:321974 97 21:181974 98 14:31
Table 3. New A1 Events Detected per Channel
Station
Channel
lpx lpy lpz
12 82 82 6714 60 82 415 12 23 616 61 65 28
Table 2. (continued)
Year Daya Hour:Minute
1974 110 00:321974 110 21:281974 128 19:581974 176 15:071974 205 10:161974 206 07:561974 346 02:061975 6 13:411975 22 02:061975 30 23:081975 32 11:041975 116 08:151975 194 07:071975 196 00:171975 197 01:111975 198 02:031975 198 15:171975 222 14:431975 225 21:221975 246 10:471975 252 09:351975 281 04:211975 360 00:321976 22 01:041976 23 11:141976 103 13:491976 119 12:441976 160 19:181976 190 07:081976 217 17:281976 240 15:341976 300 19:361976 347 20:071976 349 02:271977 13 02:121977 38 18:261977 77 07:011977 89 02:471977 91 22:481977 103 19:411977 119 16:011977 131 13:231977 146 03:451977 146 23:271977 148 12:231977 161 17:011977 173 07:381977 183 21:071977 258 17:101977 258 19:13
aAll days are listed as Julian days.
E10003 BULOW ET AL.: NEW LUNAR SEISMIC EVENTS
16 of 22
E10003
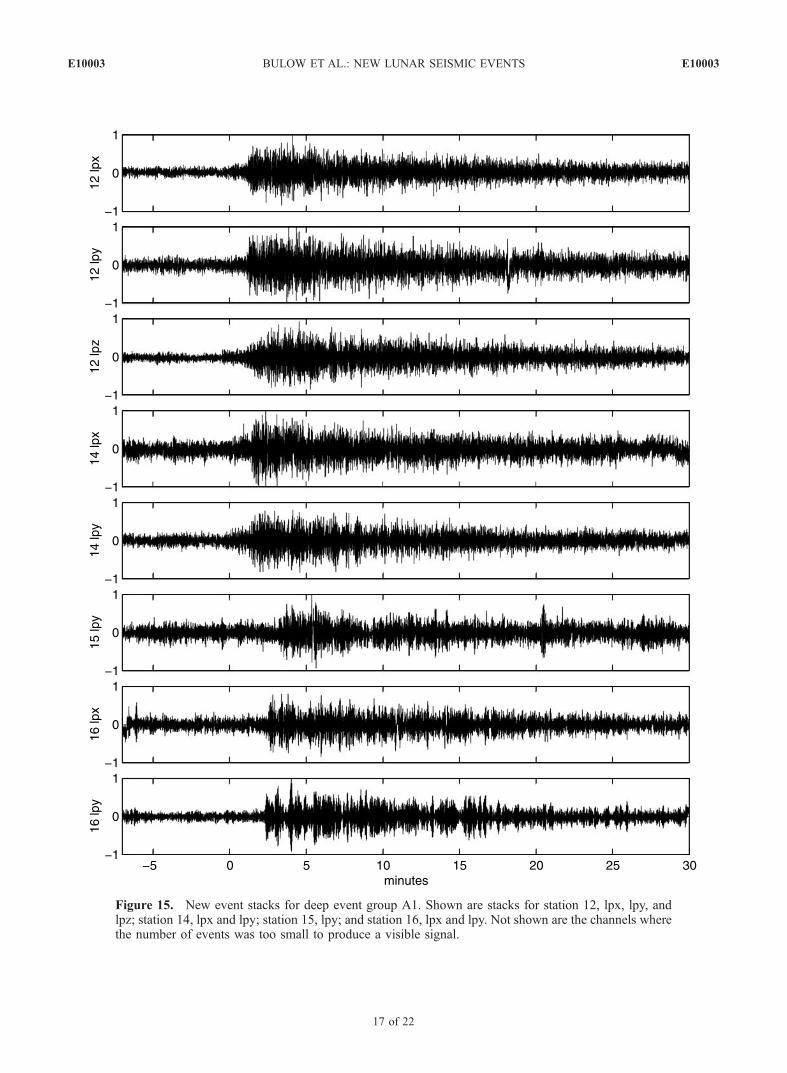
Figure 15. New event stacks for deep event group A1. Shown are stacks for station 12, lpx, lpy, andlpz; station 14, lpx and lpy; station 15, lpy; and station 16, lpx and lpy. Not shown are the channels wherethe number of events was too small to produce a visible signal.
E10003 BULOW ET AL.: NEW LUNAR SEISMIC EVENTS
17 of 22
E10003
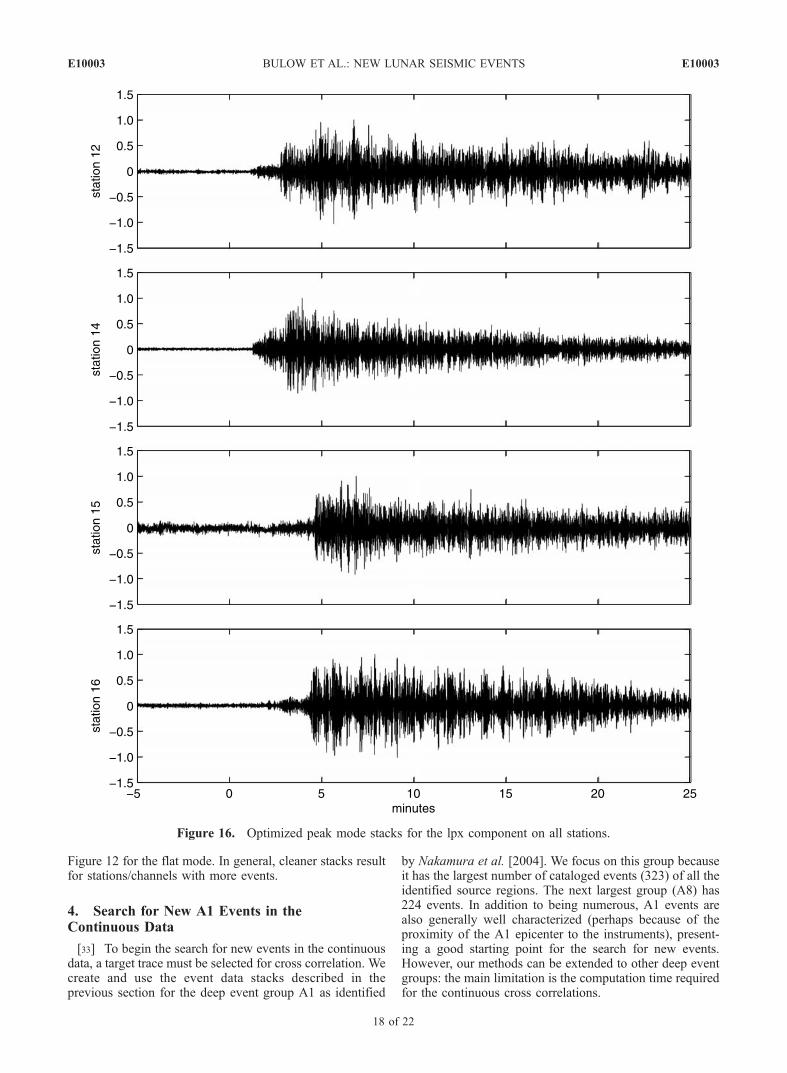
Figure 12 for the flat mode. In general, cleaner stacks resultfor stations/channels with more events.
4. Search for New A1 Events in theContinuous Data
[33] To begin the search for new events in the continuousdata, a target trace must be selected for cross correlation. Wecreate and use the event data stacks described in theprevious section for the deep event group A1 as identified
by Nakamura et al. [2004]. We focus on this group becauseit has the largest number of cataloged events (323) of all theidentified source regions. The next largest group (A8) has224 events. In addition to being numerous, A1 events arealso generally well characterized (perhaps because of theproximity of the A1 epicenter to the instruments), present-ing a good starting point for the search for new events.However, our methods can be extended to other deep eventgroups: the main limitation is the computation time requiredfor the continuous cross correlations.
Figure 16. Optimized peak mode stacks for the lpx component on all stations.
E10003 BULOW ET AL.: NEW LUNAR SEISMIC EVENTS
18 of 22
E10003
[34] We compute cross correlations of the A1 stacks withthe continuous data on a station by station, component bycomponent basis using a 30-min window of the target stack.(Peak and flat mode times are treated separately.) While therelatively long window length creates an overall reductionin correlation coefficient values, it also reduces the numberof false returns. Results for the long-period components ofstation 12 are shown in Figures 13a–13c. The left columnshows the time of occurrence of each peak in the cross-correlation function. For clarity, points representing previ-ously cataloged events are not shown; the remaining pointsrepresent possible new events.[35] Because the signal-to-noise ratio for events is often
close to unity, absolute values of the cross-correlationcoefficient (r) are typically low (see Figure 13), and it isimportant to establish criteria for distinguishing a potentialnew event from noise. We minimize incorrect detection ofevents in two ways. First, we observed that true cross-correlation peaks between the target trace and the continu-ous data often are accompanied by adjacent peaks withabsolute values almost as high as that of the true peak, butlocated at time shifts approximated by the dominant periodof the seismogram. We suppress these by not acceptingpeaks within �1.2 min of a peak with a higher absolutevalue in r (to account for polarity flips). Second, weestimate the maximum cross-correlation coefficients char-acteristic of noise in the data by performing cross correla-tions in which we time reverse the target trace. This gives atarget trace with the same amplitude and frequency contentas the real trace but with physically meaningless phasebehavior. Cross-correlation peaks resulting from time-reversed targets provide a measure of correlated noise inthe data set. Results from the time-reversed correlationsperformed on the long-period channels of station 12 areshown in Figures 13a–13c (right column).[36] To ensure that our correlation method is successfully
detecting new A1 events, we first check that a significantpercentage of known A1 events (the points removed from theleft-column plots of Figures 13a–13c) are identified. Be-cause a subset of these events comprise the target stack, theytend to correlate highly. For the lpx, lpy, and lpz componentson station 12, we successfully identify 80%, 90%, and 77%ofcataloged A1 events during the continuous cross correlations,in good agreement with the percentage of events used ingenerating the target stacks for these channels (Table 1).
[37] To calculate the number of remaining points repre-senting new events, we select a cross-correlation cutoff thatdiscriminates between noise and events. In Figures 13a–13c(left), points falling above this cutoff represent new eventsand points falling below represent noise. This cutoff is setusing a multiple of the absolute maximum correlationcoefficient returned by the time-reversed correlations. Wealso can choose whether we require a new ‘‘event’’ to appearon more than one channel or station. Figure 14 shows thenumber of new events returned as a function of the cutoffmultiplier for four different channel/station constraints.[38] Using a cutoff multiplier of one (i.e., a threshold
cross-correlation coefficient equal to the maximum valuereturned by the time-reversed correlations) and a channel/station constraint of two, we identify 123 new A1 events(Table 2). This is a conservative estimate; by relaxing thecutoffs we could obtain additional events at the cost oflikely including some false correlations. We note that ourrequirements are more stringent than those originallyemployed in the identification of lunar events: events listedin the existing lunar catalog need only appear on a singlechannel on a single station. The numbers of new eventsobserved on each station and channel are specified inTable 3. In the continuous data, most of the individualnew event waveforms cannot be visually distinguished frombackground noise. However stacking improves the signal-to-noise ratio and the new events are visible. In Figure 15we stack each component separately using the events listedin Table 3. Channels where the number of events was toosmall to produce a visible signal are not shown.
5. Discussion: Analyses of Complete A1 Cluster
[39] Our discovery of 123 new A1 events (a 38%increase) enables several avenues of further investigation.Here we report initial analyses that revise and extendprevious work. Combined with the previously catalogedA1 events, we have formed a complete list of all A1events available in the Apollo lunar seismic data. Thisallows us to produce improved waveform stacks for theA1 cluster using a weighted iterative stacking method.From these optimized stacks, we make seismic phasepicks for comparison with picks from previous studies,and generate revised location estimates using specificvelocity models. With the new catalog, we will also bebetter able to investigate the temporal distribution of A1events and its implications for tidal periodicities presentin A1 occurrence times.
5.1. Generation of Optimized Stacks
[40] Because A1 events in the original catalog are ofvariable quality, stacking these events using a simplearithmetic average of traces may not produce as clean astack as a method that gives more weight to highlycorrelating traces or those having a better signal-to-noiseratio. We employ a weighted iterative stacking method toensure events are selected and stacked to create a represen-tative trace with high signal to noise and the clearest seismicphase arrivals. Using a single high-quality A1 event as thetarget trace, we perform cross correlations with all events inthe new, complete catalog. This allows us to identify not
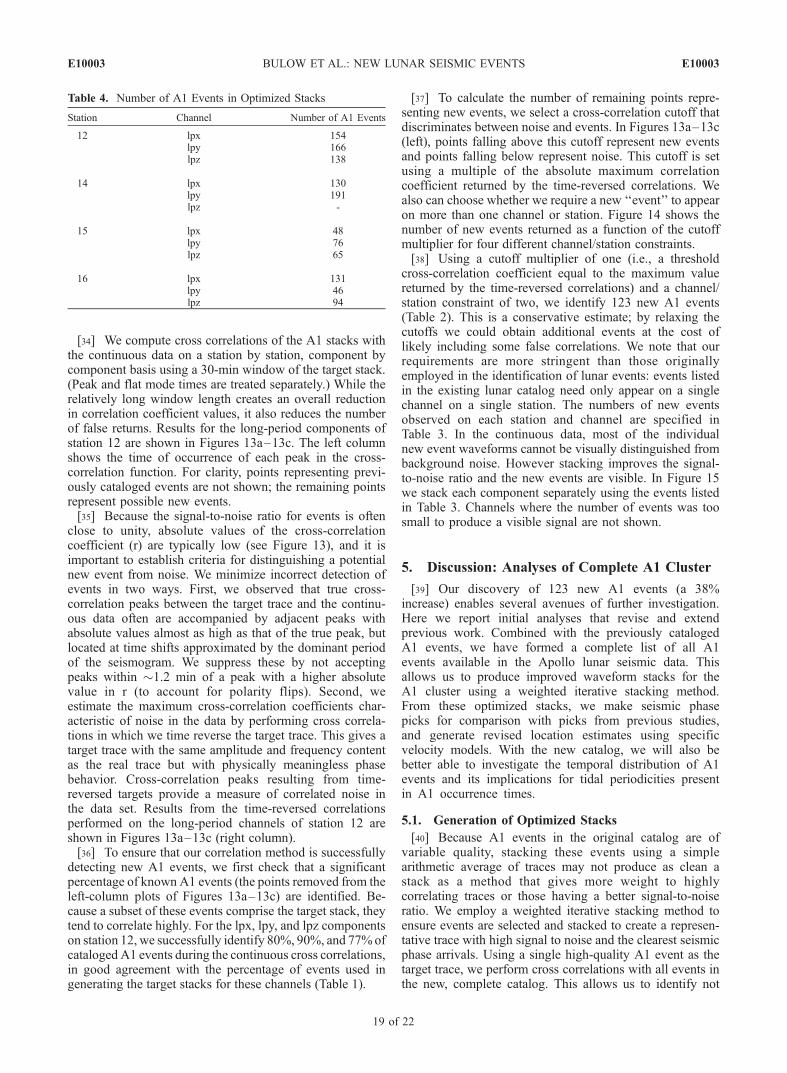
Table 4. Number of A1 Events in Optimized Stacks
Station Channel Number of A1 Events
12 lpx 154lpy 166lpz 138
14 lpx 130lpy 191lpz -
15 lpx 48lpy 76lpz 65
16 lpx 131lpy 46lpz 94
E10003 BULOW ET AL.: NEW LUNAR SEISMIC EVENTS
19 of 22
E10003
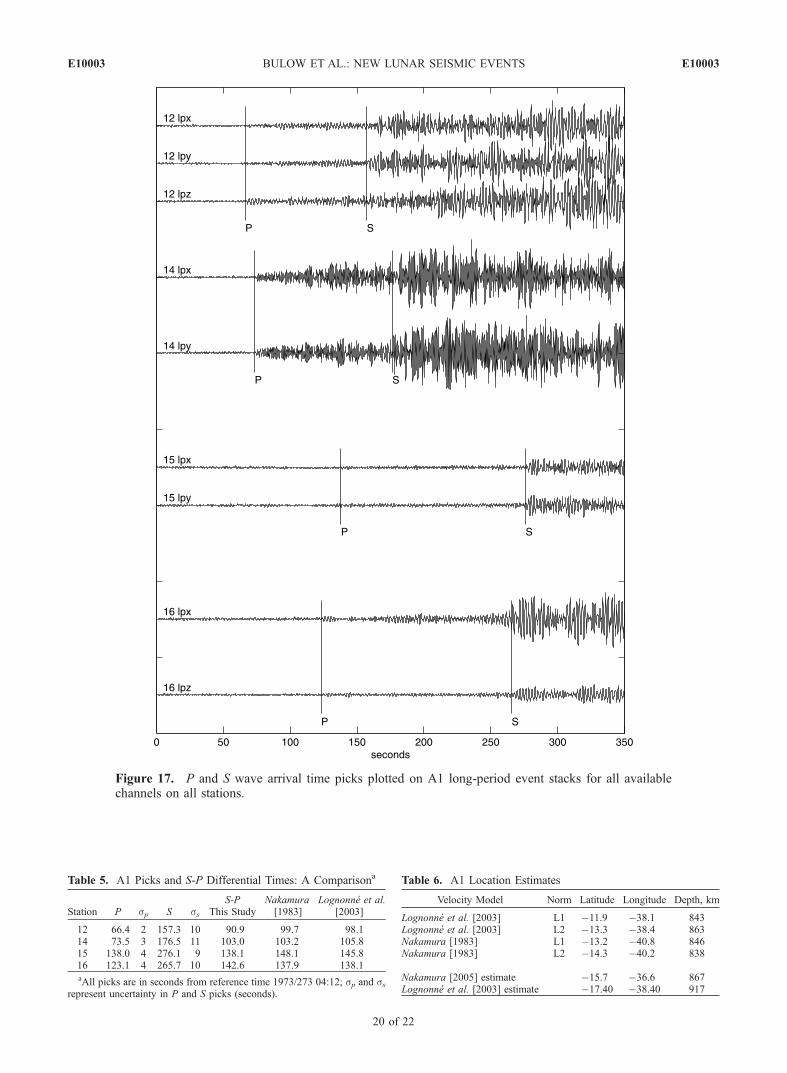
Figure 17. P and S wave arrival time picks plotted on A1 long-period event stacks for all availablechannels on all stations.
Table 5. A1 Picks and S-P Differential Times: A Comparisona
Station P sp S ssS-P
This StudyNakamura[1983]
Lognonne et al.[2003]
12 66.4 2 157.3 10 90.9 99.7 98.114 73.5 3 176.5 11 103.0 103.2 105.815 138.0 4 276.1 9 138.1 148.1 145.816 123.1 4 265.7 10 142.6 137.9 138.1aAll picks are in seconds from reference time 1973/273 04:12; sp and ss
represent uncertainty in P and S picks (seconds).
Table 6. A1 Location Estimates
Velocity Model Norm Latitude Longitude Depth, km
Lognonne et al. [2003] L1 �11.9 �38.1 843Lognonne et al. [2003] L2 �13.3 �38.4 863Nakamura [1983] L1 �13.2 �40.8 846Nakamura [1983] L2 �14.3 �40.2 838
Nakamura [2005] estimate �15.7 �36.6 867Lognonne et al. [2003] estimate �17.40 �38.40 917
E10003 BULOW ET AL.: NEW LUNAR SEISMIC EVENTS
20 of 22
E10003
only known A1 events, but also A1 events that were eitherlisted in the catalog as ‘unclassified’ or incorrectly classifiedas members of other deep clusters.[41] Events correlating with the target at r � 0.2 are
considered for stacking. Before the stack is formed, eachindividual trace is weighted by the squared correlationcoefficient, r2. We also attempted weighting by r, higherpowers of r, and the signal-to-noise ratio, but weightingwith r2 produced a stack with the most easily discernableseismic phase arrivals. The cross-correlation procedure isthen repeated, this time using the weighted stack as thetarget. To optimize the stack, the process is repeated untilthe number of events added to the stack stabilizes. We findgood convergence after four iterations. Optimized peakmode stacks for the lpx component on all stations areshown in Figure 16 and the number of events in each stackis summarized in Table 4.
5.2. Travel Time Picks
[42] P and S wave arrival picks made from our optimizedA1 stacks are shown in Figure 17. Our S – P differentialtimes show good agreement with comparison times fromNakamura [1983] and Lognonne et al. [2003] as summa-rized in Table 5. This is to be expected, as A1 is the largestand most-studied deep cluster. Future application of ourmethod to less well-characterized clusters will be of partic-ular interest, especially to those groups whose location hasnot previously been well-constrained.
5.3. Location Estimates
[43] We use the travel time picks reported in Table 5along with two representative seismic velocity models
[Nakamura, 1983; Lognonne et al., 2003], to reestimatethe A1 cluster location. Clearly, cluster location trades offwith velocity structure and a more complete study wouldinclude joint forward modeling of a set of cluster locationsand deep lunar velocity structure. Using an initial guess forthe hypocenter location, we ray trace through a specifiedvelocity model using a grid search algorithm to find the bestfit cluster location in a least squares (L2-norm) or robust(L1-norm) sense.[44] The L1 (L2) best fit latitude, longitude, and depth for
the Nakamura [1983] and the Lognonne et al. [2003]velocity models are given in Table 6, along with a recentA1 location estimate by Nakamura [2005], and the estimategiven in Lognonne et al. [2003]. Generally good agreementamong location estimates is seen, as would be expected forthe relatively well-characterized A1 cluster. Differences inlocations reflect a combination of (1) uncertainties in traveltime estimates, (2) trade-offs with velocity structure, and(3) possible spatial extent of the cluster. The largestdiscrepancy between our preliminary location estimatesand those previously published is in the cluster depth;however, our A1 depths reported here are consistent withthe recent estimate of 867 ± 29 km of Nakamura [2005].
5.4. Temporal Distribution
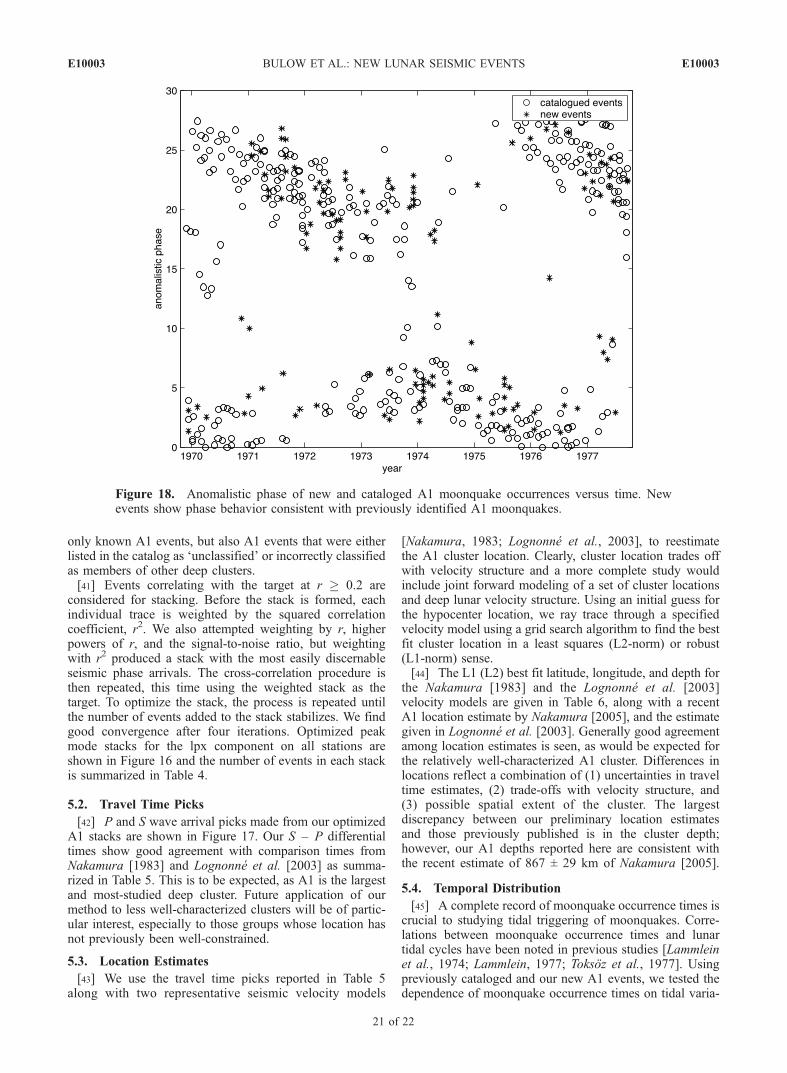
[45] A complete record of moonquake occurrence times iscrucial to studying tidal triggering of moonquakes. Corre-lations between moonquake occurrence times and lunartidal cycles have been noted in previous studies [Lammleinet al., 1974; Lammlein, 1977; Toksoz et al., 1977]. Usingpreviously cataloged and our new A1 events, we tested thedependence of moonquake occurrence times on tidal varia-
Figure 18. Anomalistic phase of new and cataloged A1 moonquake occurrences versus time. Newevents show phase behavior consistent with previously identified A1 moonquakes.
E10003 BULOW ET AL.: NEW LUNAR SEISMIC EVENTS
21 of 22
E10003
tions by calculating the anomalistic phase of each event.The anomalistic month represents the time it takes the Moonto travel from one perigee to the next (�27.55 days). Theanomalistic phase of our complete set of A1 moonquakesrelative to a reference date is shown in Figure 18. Theperiodicity of A1 moonquakes is apparent, with eventsoccurring near perigee in 1970 and gradually shifting tobefore perigee in 1974. New events show phase behaviorconsistent with previously identified A1 moonquakes, asexpected. Figure 18 also illustrates how our event searchfills in the temporal distribution of events.[46] As noted by Lammlein [1977], A1 moonquakes are
controlled not only by the anomalistic phase (most closelylinked with tides), but also by the orientation of the moon’sorbit with respect to the ecliptic, which is described by thenodical month (27.21 days). These two periods determinethe location and orientation of the moon relative to Earth,and their sum yields a period with a ‘‘beating’’ that causes aphase shift every 6 years. On the anomalistic phase versustime plot in Figure 18, the shift in 1974 is due to this 6-yearvariation, with occurrence times gradually switching frombefore perigee passage to after.[47] Robust analyses of A1 moonquake occurrence times
are possible using our revised catalog. In addition, theextension of our new event search and stack optimizationto all deep event clusters will create a more complete pictureof the temporal and spatial distribution of lunar seismicity.Such a data set would form the basis for examining thedriving mechanism of deep moonquakes.
6. Conclusions
[48] Analysis of the continuous event data has proven tobe fruitful. Although previous studies did a remarkable jobof identifying events by visual rather than automatic means,our comprehensive event search has shown the analysis ofthe continuous Apollo lunar seismic data to be worthwhile,as additional events are readily detectable using cross-correlation methods. Furthermore, modern computing capa-bilities have proven essential for obtaining reliable results,as lunar seismograms are of limited quality compared toterrestrial seismograms. The extensive data processingdescribed in section 2 is essential to our results.[49] Focusing on the A1 deep cluster has allowed us to
conduct our initial investigations on a group of events withpreviously documented characteristics [e.g., Lammlein,1977; Lammlein et al., 1974; Nakamura, 1978; Toksozet al., 1977]. Our discovery of 123 new A1 events promptedour development of stack optimization methods, as stackingwaveforms from a given deep event group provides themeans for identifying seismic phases that may be difficultto discern on individual seismograms. These improvedstacks have led to travel time picks and source locationestimates for A1 similar to those of previous studies. Forother deep event groups, which may not be as thoroughly
well characterized, our approach may prove instrumentalin improving our understanding of the spatial and temporalqualities of moonquake source regions.[50] The new A1 events show occurrence patterns con-
sistent with previously cataloged A1 events. The extensionof our search to all deep event groups will provide a morecomplete catalog needed for further analyses of tidal varia-tions in the deep moonquake occurrence times.
[51] Acknowledgments. The authors would like to thank MaryEdmunds at the IRIS DMC for help in getting the data and Yosio Nakamurafor his comments, suggestions, and tireless dedication to answering ques-tions about data formats and other issues. We thank Mark Jellinek forcomments on an early draft of this manuscript and acknowledge YosioNakamura and Amir Khan for thorough and helpful reviews. This researchwas supported by NASA Planetary Geology and Geophysics grant NAG5-11563.
ReferencesDainty, A. M., M. N. Toksoz, and S. Stein (1976), Seismic investigation ofthe lunar interior, Proc. Lunar Planet. Sci. Conf., 7th, 3057–3075.
Evans, J. R. (1982), Running median filters and a general despiker, Bull.Seismol. Soc. Am., 72, 331–338.
Goins, N. R., A. M. Dainty, and M. N. Toksoz (1981), Lunar seismology:The internal structure of the Moon, J. Geophys. Res., 86, 5061–5074.
Khan, A., K. Mosegaard, and K. L. Rasmussen (2000), A new seismicvelocity model for the moon from a Monte Carlo inversion of the Apollolunar seismic data, Geophys. Res. Lett., 27, 1591–1594.
Lammlein, D. R. (1977), Lunar seismicity and tectonics, Phys. Earth Pla-net. Inter., 14, 224–273.
Lammlein, D. R., G. V. Latham, J. Dorman, Y. Nakamura, and M. Ewing(1974), Lunar seismicity, structure, and tectonics, Rev. Geophys., 12, 1–21.
Lognonne, P., J. Gagnepain-Beyneix, and H. Chenet (2003), A new seismicmodel of the Moon: Implications for structure, thermal evolution andformation of the Moon, Earth Planet. Sci. Lett., 211, 27–44.
Nakamura, Y. (1978), A1 moonquakes: Source distribution and mechanism,Proc. Lunar Planet. Sci. Conf., 9th, 3589–3607.
Nakamura, Y. (1983), Seismic velocity structure of the lunar mantle,J. Geophys. Res., 88, 677–686.
Nakamura, Y. (2003), New identification of deep moonquakes in the Apollolunar seismic data, Phys. Earth Planet. Inter., 139, 197–205.
Nakamura, Y. (2005), Farside deep moonquakes and deep interior of theMoon, J. Geophys. Res., 110, E01001, doi:10.1029/2004JE002332.
Nakamura, Y., F. K. Duennebier, G. V. Latham, and H. J. Dorman (1976),Structure of the lunar mantle, J. Geophys. Res., 81, 4818–4824.
Nakamura, Y., G. V. Latham, H. J. Dorman, and J. E. Harris (2004), Passiveseismic experiment long-period event catalog, Tech. Rep. 118, rev. ed.,Univ. of Tex. Inst. for Geophys., Austin.
Nakamura, Y., G. V. Latham, and H. J. Dorman (1982), Apollo lunarseismic experiment—Final summary, Proc. Lunar Planet. Sci. Conf.,13th, Part 1, J. Geophys. Res., 87, suppl. A117–A123.
Toksoz, M. N., et al. (1972), Velocity structure and properties of the lunarcrust, Moon, 4, 490–504.
Toksoz, M. N., A. M. Dainty, S. C. Solomon, and K. R. Anderson (1974),Structure of the moon, Rev. Geophys., 12, 539–567.
Toksoz, M. N., N. R. Goins, and C. H. Cheng (1977), Moonquakes:Mechanisms and relations to tidal stresses, Science, 196, 979–981.
Zuber, M. T., D. E. Smith, F. G. Lemoine, and G. A. Neumann (1994), Theshape and internal structure of the Moon from the Clementine Mission,Science, 266, 1839–1843.
�����������������������R. C. Bulow, C. L. Johnson, and P. M. Shearer, Cecil H. and Ida M.
Green Institute of Geophysics and Planetary Physics, Scripps Institution ofOceanography, University of California, San Diego, 9500 Gilman Drive,Mail Code 0225, La Jolla, CA 92093-0225, USA. ([email protected])
E10003 BULOW ET AL.: NEW LUNAR SEISMIC EVENTS
22 of 22
E10003