Embed Size (px)
Citation preview

Language & Linguistics in Melanesia Vol. 30, 2012 ISSN: 0023-1959
64
Journal of the Linguistic Society of Papua New Guinea
ISSN: 0023-1959
Vol. 30, 2012

Language & Linguistics in Melanesia Vol. 30, 2012 ISSN: 0023-1959
65
New Guinea through the eyes of WALS
Bernard Comrie* and Michael Cysouw†
*Max Planck Institute for Evolutionary Anthropology
†Philipps-Universität Marburg
Correspondence address: Michael Cysouw
Forschungszentrum Deutscher Sprachatlas
Philipps-Universität Marburg
Hermann-Jacobsohn-Weg 3
D-35032 Marburg
1. Introduction1
It is commonplace in linguistics to describe the New Guinea area as the linguistically
most diverse area on the planet. And there is a clear sense in which this is true. No
area of comparable size or population is home to as many distinct languages, and this
presumably remains true, whatever plausible consistent definition of the language/
dialect divide one adopts. If one counts populations and numbers of languages for the
relevant countries and administrative areas for which separate statistics are given in
Gordon (2005), the results are as follows. First, taking a broad definition of the New
Guinea area to include all of Papua New Guinea, the Solomon Islands, East Timor,
and the Indonesian administrative areas of Papua, Maluku, and Nusa Tenggara, we
have a total population of 19,695,077 and about 1,380 first languages, giving an
average number of speakers per language of 14,272. If we exclude Maluku and Nusa
Tenggara, large parts of which do not form part of the New Guinea area, then we are
left with a population of 9,284,083 people speaking 1,178 languages, or an average of
7,796 speakers per language.2
Of course, there are other ways in which one could define the linguistic diversity
of an area; for instance, in terms of the number of distinct language families
represented within the area in question. In this sense, genealogical diversity will
depend, of course, on one‘s views on the validity of macro-families.3 For those who
believe that Papuan or Indo-Pacific is a valid genealogical grouping, the New Guinea
area contains basically only two families, Papuan (Indo-Pacific) and Austronesian
(excluding languages introduced as the result of European contact). If, instead, we
adopt the more conservative classification proposed by Matthew Dryer, with Papuan

Language & Linguistics in Melanesia Vol. 30, 2012 ISSN: 0023-1959
66
being only a cover term for some 46 distinct language families, then the New Guinea
would also be a highly diverse area in genealogical terms.4 One might compare this
situation with Vanuatu, where the average number of speakers per language is
actually even smaller than for the New Guinea area. Again following Gordon (2005),
Vanuatu has a population of 202,609, representing 109 distinct languages, i.e. on
average 1,859 speakers per language. But all of these languages belong to one
subdivision of the Oceanic subdivision of Austronesian, i.e. the range of genealogical
diversity is clearly many magnitudes lower than that found in the New Guinea area.
Yet another way in which one could attempt to assess the diversity of the New
Guinea area is in terms of the typological variation across the languages spoken in
this area. Until recently, it has been very difficult to carry out such a characterisation
in any systematic way, i.e. by looking systematically at a wide enough range of
features from different parts of the grammar in a wide enough range of languages
spoken in the area, so that opinions on typological variation across languages of the
New Guinea area, or sub-areas within this area, have usually been impressionistic, as
when a colleague remarked (perhaps not entirely seriously, but also perhaps not
entirely in jest) that the Highland languages are all the same—verb-final with switch-
reference.
The publication of the World Atlas of Language Structures (Haspelmath et al.
2005, hereafter WALS) has radically changed the feasibility of such studies for the
better. WALS is an attempt to map some 140 typological features—ranging from
phonetics to syntax and including the semantics of morphological categories—across
the languages of the world.5 The mapping, in the literal sense of the cartography, is
grounded in an extensive database that can also be used for other purposes, such as
testing correlations among typological features—and measuring degrees of
typological variation within particular sets of languages. The project was guided, in
part, by a proposed sample of 200 languages reasonably representative of the world's
genealogical diversity. In the body of this paper, we show how the WALS materials
can be used to give an answer at a high level of reliability to the question: How
diverse is the New Guinea area typologically, including in comparison with other
parts of the world?
Although the publication of WALS provides us with an immensely powerful new
tool to study cross-linguistic structural variation, some limitations of this new tool
should nonetheless be borne in mind. In section 2, some questions relating to choice

Language & Linguistics in Melanesia Vol. 30, 2012 ISSN: 0023-1959
67
of languages in the New Guinea area, including their relation to the features selected
for inclusion in WALS, will be discussed. But there are also issues relating purely to
the features. The features covered in WALS were selected on the basis of a number of
criteria, including the desire to cover a range of different kinds of features from
different areas of grammar, but also on the basis of practical considerations, such as
availability of reliable material from across the languages of the world and feasibility
of identifying a small number of feature values that could be mapped conveniently.
As it turns out, certain features that might be considered important for the New
Guinea area, such as presence versus absence of switch-reference – not to mention
subtypes of switch-reference – are not covered by WALS.
A second point to note with regard to the features is that not all of the features are
independent. In some cases, the dependence is logical, as when there are separate
maps for the order of subject and verb, of object and verb, and of subject, object, and
verb. Although it would, in principle, have been possible to exclude or minimise such
logical overlaps, we decided in this preliminary assessment to adhere more literally to
the database in its current form, leaving it to others to check whether taking different
decisions would materially affect the results. But, in addition to such logical
dependencies, there are also correlations between different features that have been
claimed in the literature, for instance, that the relative order of verb and object
correlates with that of adposition and noun phrase, or with that of noun and adjective.
Many of these correlations remain to be tested, and indeed it is only with a database
of the kind provided by WALS that they can be tested reliably against the languages
of the world.6 Especially given that many correlations remain to be tested, we have
not excluded features on the basis of (possible) correlations. Again, later work will
need to assess to what extent this decision is justified.
In Section 2 of this paper, we will first discuss some aspects of using WALS for
typological research. In particular, our choice of languages from the wealth of data in
WALS will be explained, and the possible influence of missing data will be
examined.
Section 3 consists of a short digression on the occurrence of typologically rare
features in New Guinea languages. As will be argued, the languages in and around
New Guinea are—from a worldwide perspective—relatively poor in rare
characteristics; in other words, they are relatively ‗normal‘ languages (given the
selection of features included in WALS).

Language & Linguistics in Melanesia Vol. 30, 2012 ISSN: 0023-1959
68
In section 4, we will use all the data in WALS to make an overall analysis of the
similarities between the languages in the New Guinea area. We found a remarkable
split between the Austronesian and West Papuan languages on the one side, against
the remaining ‗Papuan‘ languages on the other.
Section 5 investigates the interrelation between typological similarity, genealogical
relatedness and geographical proximity. These three factors are normally all
correlated, which makes it difficult to decide what kind of influence each of these
factors has. We will suggest that the observation of a strong mismatch between
typological similarity and geographical proximity has interesting repercussions for
historical hypotheses. Further, the observed split between Austronesian plus West
Papuan against the remaining ‗Papuan‘ languages is argued to be primarily a
typological distinction, and only secondarily caused by the geographical distribution
of the languages involved.
Finally, in Section 6, all typological characteristics listed in WALS are
investigated individually as to whether they are particularly prominent in the New
Guinea area, or in any subparts of this area. It will be shown here that the separation
of the Austronesian and West Papuan languages is basically due to their word-order
profile and their morphological structure. This split is apparently not an incidental
typological split of the New Guinea area, but the repercussion of a typological pattern
attested more widely among the world‘s languages.
2. Selecting Languages
The WALS is an extremely rich source of information, including data for about 140
linguistic characteristics and more than 2,500 languages. However, information on all
140 characteristics is only available for a few of those languages. Most of the
languages included in WALS are only coded for very few characteristics. This means
that for every investigation based on WALS data only a selection of the available data
can be used. The languages chosen for the present investigation are shown in Table 1.
Their approximate geographical location is indicated in Map 1.7
In total, this selection includes 48 languages from New Guinea and the
immediately surrounding areas. The primary consideration in choosing these
languages was the availability of information. We sorted all languages of the New
Guinea area in WALS by the number of available data points and chose a cut-off
point rather arbitrarily at a level that still showed a reasonable amount of available

Language & Linguistics in Melanesia Vol. 30, 2012 ISSN: 0023-1959
69
information. One subsidiary consideration to choose this cut-off point was that
enough Austronesian and West Papuan languages should be part of the sample, to be
able to investigate the internal variation within these groups.
Family Language
Austronesian Irarutu (irr), Kaliai-Kove (kkv), Kilivila (klv),
Kwaio (kwa), Loniu (lon), Taba (tab), Tawala (taw),
Tetun (ttn), Tigak (tgk), Tolai (tla)
Trans-New Guinea
(Lowlands)
Amele (ame), Asmat (asm), Suena (sue), Usan (usa),
Waskia (wsk)
Trans-New Guinea
(Highlands)
Ekari (eka), Hamtai (ham), Hua (hua), Kewa (kew) Kobon
(kob). Kombai (kmb), Lower Grand Valley Dani (dni),
Salt-Yui (syu), Selepet (slp), Tauya (tau), Una (una),
Wahgi (wah), Yagaria (ygr)
West Papuan Abun (abu), Hatam (hat), Maybrat (may), Sahu (sah),
Tidore (tid), West Makian (wma)
Sepik Alamblak (ala), Awtuw (awt), Kwoma (kwo)
Border Imonda (imo)
Dagan Daga (dag)
East Bougainville Nasioi (nas)
Kiwaian Kiwai (kiw)
Sepik-Ramu Yimas (yim)
Marind Marind (mrd)
Sentani Sentani (snt)
Sko Dumo (dum)
East Papuan Lavukaleve (lav)
Torricelli Arapesh (arp)
Yele Yelî Dnye (yel)
Table 1. Selection of languages (the three-letter language-identification code from
WALS is added in brackets).
Map 1. Approximate geographical location of the languages in our sample. The
abbreviations used are the three-letter language identification codes as used in WALS.

Language & Linguistics in Melanesia Vol. 30, 2012 ISSN: 0023-1959
70
On average, there are 66.5 characteristics available per language for this set of 48
languages. This is a useful amount of information for computational purposes, though
the available data are not very evenly distributed over the languages. The number of
available characteristics per language ranges from a maximum of 129 for Amele to a
minimum of only 36 for Selepet and Irarutu. To investigate whether this large
variation should be considered a problem, we looked at the relation between available
information and language similarity. For every pair of languages in our sample of 48
languages, we computed two parameters. First, the number of WALS-characteristics
that is available for both languages was counted. Second, the similarity for every pair
of languages was established (the measure of similarity used will be discussed in
more detail in section 4). Fortunately, there is no correlation between these two
parameters (Mantel Test p > .4). This means that the similarity between two
languages is not obviously correlated to the amount of information that is available
for the measurement of similarity.
The chosen selection of 48 languages allows us to investigate various groups of
languages in New Guinea and the surrounding areas. For the purpose of this paper, we
considered the following groups of languages. First, the whole group of 48 languages,
comprising both Austronesian and non-Austronesian languages, can be compared to
the worldwide variation, to see whether the larger New Guinea area can be considered
a linguistic area. Further, there are three more or less accepted genealogical groups of
languages that can be investigated: Austronesian, West Papuan and Trans-New
Guinea. The Sepik family is left out of this investigation, because there are only three
languages available in the present sample, which we considered an insufficient base
for reliable conclusions. We also considered the languages spoken in the Highlands of
New Guinea as a possible areal group. The Highlands languages mainly are a
subgroup of the Trans-New Guinea languages, though also including the Border
language Imonda.8
3. Something Special?
Although the number of languages and the genealogical diversity in New Guinea and
its surroundings are particularly high, such diversity does not necessarily imply that
the languages themselves are in any sense unusual from a worldwide perspective. To
investigate whether the large diversity also implies that the languages of New Guinea
are typologically unusual, we asked, to what extent the languages sampled have rare

Language & Linguistics in Melanesia Vol. 30, 2012 ISSN: 0023-1959
71
characteristics, where rarity is defined as being of low frequency in the WALS data.
A rarity-index is proposed in Cysouw (2011) to give an indication of the overall rarity
of the characteristics of a language. This index includes the relative frequency of each
characteristic, the number of possible characteristics, and controls for the number of
characteristics on which data are available. The index is normalised in such a way that
the values range evenly between 0 and 100, and the median should be around 50 for
all data considered. Computing the Rarity Index for all languages in WALS gives the
expected distribution as shown in the leftmost boxplot in Figure 1.
Only considering our set of 48 languages from New Guinea and the surrounding
areas gives a radically different picture. As shown in the rightmost boxplot in Figure
1, about three-quarters of the rarity indices are now below 50, and the median lies
below 20. This distribution is significantly different from the overall distribution (t-
test p < .001). This indicates that the languages of our New Guinea area sample show
relatively fewer unusual characteristics (i.e. they are relatively more ‗normal‘),
compared to the world‘s languages as a whole. However, note that the whiskers of the
rightmost boxplot in Figure 1 extend all the way up to 100. This means that the range
of Rarity Index values in our New Guinea sample extends through the whole range of
possible values. So, although the New Guinea area languages tend to have just very
few rare characteristics in general, there are some languages that have many of them.
In particular, Kombai is among the top 10 of languages of all WALS languages,
according to the rarity indices.9
Figure 1. Rarity Index compared between the whole world and the New Guinea area.

Language & Linguistics in Melanesia Vol. 30, 2012 ISSN: 0023-1959
72
4. Overall typological comparison
As a next step, we will now turn to the comparison of the overall typological profile
of the New Guinea languages. Instead of selecting specific typological characteristics
that are known, or expected, to be telling for the linguistic structure of New Guinea
languages, we simply take all typological characteristics, as available in WALS, to
investigate typological similarity. In this way, we avoid the problem of self-fulfilling
typological prophecies; viz. finding clusters of typologically similar languages on the
basis of a selection of characteristics that were expected to show these clusters to
begin with. To compare languages using the complete WALS data, we took relative
Hamming distance as a measure for language comparison. The relative Hamming
distance between two languages is the number of differences between these two
languages relative to the total number of characteristics coded for both languages.10
For example, the languages Abun and Alamblak appear together in 41 maps in WALS
(Abun alone is found in 50 maps and Alamblak alone in 114 maps). Out of these 41
shared maps, there are 31 maps in which Abun and Alamblak are of a different type.
The distance between Abun and Alamblak is then taken to be 31/41 (= 75.6 %).11
This distance is computed for each pair of languages under investigation. This results
in a large table of relative differences (a ‗distance matrix‘), much like a table of
distances between towns as often found in road maps. Such a distance matrix is then
used to investigate quantitatively the structure of typological similarity between the
languages under investigation.
The first question we addressed was whether or not the 48 languages in our sample
form a consistent group when compared to a random sample of other languages from
the world. For this purpose we selected a random worldwide test set by the following
procedure. First, we took the best-coded 150 languages from WALS, taking
maximally one language per genus (where a genus is a group of languages with
roughly the internal genealogical diversity of the Romance languages). Then we
randomly selected 47 languages out of this set of 150.12
For the total set of 95
languages (i.e. the 48 New Guinea area languages plus the 47 randomly selected
languages), we computed all pairwise distances, using the relative Hamming distance
as explained above. The structure of the resulting distance matrix is illustrated by
using a NeighbourNet (Bryant & Moulton 2004), shown in Figure 2. A NeighbourNet
is an example of a so-called ‗split decomposition tree‘, which is an attempt to make a
hierarchical clustering (i.e. a tree-like object) of the languages, but it does not force a

Language & Linguistics in Melanesia Vol. 30, 2012 ISSN: 0023-1959
73
decision for one particular tree structure. Instead, when it is unclear from the data
whether to consider a language as belonging to one group or the other, both
possibilities are drawn using parallel lines (called ‗reticulations‘), with the length of
the lines being inversely proportional to the amount of information arguing for that
particular grouping (cf. Bryant et al. 2005 for a more extensive explanation of this
approach).
It will not come as a surprise that the random selection of the world‘s languages
does not clearly separate into hierarchically organised groups. A first inspection of the
resulting network in Figure 2, in fact, shows that the structure of the typological
distances is not tree-like at all. In the middle there is a rather complex network of
roughly equally likely alternative possibilities of subgrouping. To the outside, there
appear to be some groups, though in general these are not very strongly supported by
the data. This lack of grouping can visually be discerned from the fact that most
branches separate individually from the central network. An example of a relatively
good group, indicated by a longish pair of parallel lines, is the pairing of Russian and
French in the centre bottom of Figure 2 (both are, of course, Indo-European
languages). Notwithstanding the general impression of lack of structure, some of the
(weak) groups, as indicated by the nearness of the languages in the network, seem to
make linguistic sense (e.g. the nearness of the Austronesian languages Maori, Tagalog
and Malagasy at the bottom left or the nearness of the Australian languages
Gooniyandi, Kayardild and Ngiyambaa at the bottom centre).
Further, there seems to be a slight separation of the whole network into two
groups, separating a group ranging from Zulu to Guarani on the left from a group,
ranging from Marind to Gooniyandi, to the right. We will return to an explanation for
this separation in Section 6.

Language & Linguistics in Melanesia Vol. 30, 2012 ISSN: 0023-1959
74
Figure 2. NeighbourNet of the languages from the New Guinea area (in boldface)
together with a selection of 47 semi-randomly selected other languages from all over
the world.
Related to our current investigation of New Guinea area languages, it is
noteworthy that the languages in our present sample do not represent a single
subgroup within the worldwide linguistic variation. Our 48 languages are found
distributed throughout the network in Figure 2 (the names of the New Guinea area
languages sampled are shown in boldface in the figure). There is a relatively coherent
group of New Guinea languages to the left (ranging from Maybrat to Kilivila in the
figure) consisting of all Austronesian languages combined with all West Papuan
languages. The only missing language in this group is Tawala, which is an
Austronesian language, but it appears amidst mainland Papuan languages to the top
right of Figure 2. Still, there is apparently a typological similarity between
Austronesian and West Papuan (this similarity will be further discussed in Section 6).
Further, there is a less pronounced cluster of New Guinea languages to the top
right (ranging from Marind to Dani in the figure), which does not obviously show any
coherence as far as any accepted genealogical grouping or areal distribution is
concerned. Other New Guinea languages are found all over the network. The basic

Language & Linguistics in Melanesia Vol. 30, 2012 ISSN: 0023-1959
75
distribution of Austronesian plus West Papuan against the rest can clearly be
discerned in Figure 3, which shows the same network as shown in Figure 2, though
restricted to the languages from our New Guinea sample.
In Figure 4, a NeighbourNet is shown of only the Austronesian and West Papuan
languages (we have also included Tawala in this figure). There are some rather
pronounced typological groups discernible in Figure 4 (e.g. Kilivila + Kaliai Kove +
Tawala, or Sahu + Irarutu + Tidore). However, it is not possible to distinguish
between the two main groups, viz. Austronesian and West Papuan. Typologically
speaking, these two groups appear to be too similar to be distinguishable.
Finally, in Figure 5 a NeighbourNet of the remaining languages of our New
Guinea sample is shown. There is no tree-like structure at all visible in the graph,
indicating—as might have been expected—that the typological similarity between the
‗Papuan‘ languages cannot properly be modelled by the tree metaphor as used in
historical approaches.
Figure 3. NeighbourNet of the languages from the New Guinea area.

Language & Linguistics in Melanesia Vol. 30, 2012 ISSN: 0023-1959
76
Figure 4. NeighbourNet of the Austronesian and West Papuan languages.
Figure 5. NeighbourNet of the remaining ‗Papuan‘ languages (i.e. non-Austronesian
and non-West Papuan).
Language & Linguistics in Melanesia Vol. 30, 2012 ISSN: 0023-1959
77
5. Typology and Geography
On the basis of typological data as collected in WALS, we are thus able to make some
rough genealogical distinctions: Austronesian and West Papuan, on the one hand,
against Trans-New Guinea, Sepik, and the other non-Austronesian languages, on the
other. This indicates that typological patterns might be useful to recover genealogical
relationships (cf. Dunn et al. 2005). However, one of the problems of proposing a
direct link between typology and genealogy is the possible intermediate parameter of
geographical distance. In this section, we will present some observations about the
relationship between typology, genealogy and geography for the languages of New
Guinea.13
In general, there is a clear tendency for genealogically related languages to be also
typologically similar, which indicates that typological similarity might be inherited
from a common ancestor. However, there is also a general tendency for
geographically close languages to be typological similar, possibly influenced through
borrowing and other processes of language convergence. So, as there is also a strong
tendency for genealogically related languages to be geographically close, the
typological similarity of related languages might also be due to convergence because
of geographical proximity.
The impact of both geographical proximity and typological similarity on
genealogical relatedness for our New Guinea languages is shown in Figures 6 and 7.
For these figures, we took the matrix of pairwise typological distances for all pairs of
languages in our sample (cf. Section 4) and divided these distances into two groups.
One group consists of those distances between pairs of related languages, and one
group consists of those distances between pairs of unrelated languages.
In Figure 6, it is shown that the typological distance between related languages is
in general smaller than the typological distance between unrelated languages.
Likewise, in Figure 7, it is shown that the geographical distance between related
languages is smaller than the geographical distances between unrelated languages.
Both distinctions are highly significant (t-test p < 10-15
).

Language & Linguistics in Melanesia Vol. 30, 2012 ISSN: 0023-1959
78
Figure 6. Typological distances compared between pairs of genealogically related
languages and pairs of unrelated languages in our New Guinea sample.
Figure 7. Geographical distances compared between pairs of genealogically related
languages and pairs of unrelated languages in our New Guinea sample.
The direct comparison between geographical distance and typological distance is
shown in Figure 8. In this scatterplot, every dot stands for a possible pairing of two
languages from our New Guinea sample. With 48 languages in total, there are
(48*47)/2 = 1128 pairs. For every pair of languages, the geographical and the
typological distances are established separately. These two distance values determine
one dot in the figure. Visually, there is a slight correlation discernable, which turns

Language & Linguistics in Melanesia Vol. 30, 2012 ISSN: 0023-1959
79
out to be statistically weak but significant (Pearson r = .21, Mantel test p < .001). This
means that—in general—the typological difference between two languages is larger,
the farther the languages are geographically separated.
Figure 8. Scatterplot of the correlation between geographical distance and typological
distance for all possible pairs of languages from our New Guinea sample.
Although there is a general tendency for geography and typology to be
correlated, this correlation is not necessarily equally strong for all languages involved.
To investigate which languages show the strongest mismatch, we removed each of the
48 languages from our sample one at a time and then computed the Pearson‘s
correlation coefficient for the remaining geographical and typological distances. If the
coefficient rises when a particular language is removed, this indicates that this
language contributes little to the initial correlation between geographical distance and
typological distance. The languages resulting in a rising coefficient after removal are
shown in Table 2, ordered by the strength of the correlation after removing. It turns
out that the languages with the strongest mismatch between geography and typology
are all Austronesian languages (though not all Austronesian languages end up at the
top of the list). When all Austronesian languages are removed from our sample, the
correlation between geography and typology becomes much stronger, compared to the
correlation for all languages (without Austronesian: Pearson r = .40, Mantel test
p < .00001).

Language & Linguistics in Melanesia Vol. 30, 2012 ISSN: 0023-1959
80
This effect can be explained by the fact that the Austronesian languages are the
result of a relatively recent episode of language dispersal. The non-Austronesian
languages from New Guinea have been geographically stable for a relatively much
longer period, which made it possible for these languages to exchange more
typological features locally, and thus enhance the geography-typology correlation. In
contrast, the Austronesian languages have had less time to assimilate linguistically to
their ‗new‘ neighbours. This result indicates that it might be worthwhile to investigate
recent language dispersals by looking for mismatches between typological and
geographical similarity.
Language Removed Pearson r
Loniu 0.253 Kwaio 0.248 Kaliai-Kove 0.227 Tigak 0.226 Tolai 0.226 Kilivila 0.225 West Makian 0.219 Arapesh 0.219 Yimas 0.216 Lavukaleve 0.214 Tetun 0.212 Irarutu 0.209
Table 2. Correlations between geographical distance and typological distance when
one single language is removed, ordered by the strength of the correlation. The
Austronesian languages are shown in boldface.
In Section 4, we found that there is a typological separation of the Austronesian
and the West Papuan languages from the other languages in our sample (cf. Figure 3).
In the light of the present discussion of the relation between geography and typology,
this separation becomes somewhat suspicious, because both the Austronesian and the
West Papuan languages are also geographically outliers to our sample. In fact, both
geography and typology correlate highly with the separation of Austronesian plus
West Papuan from the other languages in our sample. So, the question remains
whether the typological separation—as shown in Figure 3—really is a typological
separation, or simply an effect of the geographical location of these languages.
To investigate the relative effect of typological distance and geographical distance
on the separation of the languages in two groups, one ideally would like to perform a

Language & Linguistics in Melanesia Vol. 30, 2012 ISSN: 0023-1959
81
regression-like analysis, including both typology and geography as factors. However,
to our knowledge, there is currently no worked out regression-like analysis available
for distance matrices (cf. Cysouw, forthcoming, for an in-depth discussion). To get,
nonetheless, an impression of the relative importance of the two factors, we
performed a little trick. We first turned the distinction between the group
‗Austronesian plus West Papuan‘ and the group consisting of the remaining languages
into a distance measure. To achieve this, we set the distance between two languages
from the same group to ‗one‘ and a distance between two languages from different
groups to ‗two‘. This admittedly rather coarse distance-measure is then used to
perform a regression to the corresponding geographical and typological distances.14
Both factors turn out to be highly significant in the regression, though the t-value of
the typological distances (t = 22.4) is more than twice as large as the t-value for
geographical distances (t = 10.9). This suggests (though not more than that) that the
distinction in the two groups as found in Figure 3 is to a large extent the result of the
typological profile, and only to a lesser extent the result of the geographical distance.
6. Noteworthy Characteristics
Besides investigating the combined structure of all typological structures in WALS,
we also wanted to find out whether there are any special characteristics that are
specifically found in New Guinea or in smaller groups from this area. For this part of
our study, we delimited various groups of languages to investigate in more detail.
Among these groups, there are genuine or hypothesised genealogical groups
(Austronesian, West Papuan, Trans-New Guinea), areal groups (our complete New
Guinea sample, non-Austronesian, New Guinea Highlands) and the typological
separation that turned up earlier in this paper (Austronesian plus West Papuan, cf.
Figure 3).
For all these groups, we investigated each typological characteristic listed in
WALS. Specifically, for each value from each map in WALS, we computed the
Fisher‘s Exact probability opposing a specific area against the rest of the world. An
example of such a computation is shown in Figure 9. In this example, the first value
(small consonant inventory) from the first WALS map (size of the consonant
inventory, Maddieson 2005a) is investigated for the whole New Guinea area, in
contrast to the rest of the world. In the WALS map on consonant inventories, there are
in total 562 languages listed, of which only a minority has a small consonant

Language & Linguistics in Melanesia Vol. 30, 2012 ISSN: 0023-1959
82
inventory (viz. 91 = 16 %). From the 48 languages in our New Guinea sample, only
19 occur in this specific map, but among these 19 the large majority has a small
consonant inventory (viz. 16 = 84 %). This implies a large difference between the
New Guinea area and the whole world; namely, in and around New Guinea, there is a
much larger proportion of languages with small consonant inventories than expected
from the totality of the world‘s languages (Fisher‘s Exact p < 10-10
).
New Guinea Others Total
Consonant Inventory Small 16 75 91
Others 3 468 471
Total 19 543 562
Figure 9. Example interaction.
Such Fisher‘s Exact probabilities are computed for all values of all maps in
WALS, separately for all of the following groups of languages in contrast to the rest
of the world‘s languages:
a) The whole New Guinea sample (including Austronesian)
b) Austronesian
c) non-Austronesian (‗Papuan‘)
d) West Papuan
e) Trans-New Guinea
f) New Guinea Highlands
g) Austronesian plus West Papuan
h) All except Austronesian and West Papuan
In total, there are 643 different values throughout all maps in WALS, each of which
was investigated for all 8 groups; this means that we had to wade through the results
of a total of 5,144 Fisher‘s Exact tests. From all these probabilities, we only selected
those that were smaller than 0.01 as being interesting enough for further investigation.
We then performed one further selection to deal with the many existing overlaps
between these groups. The problem is that, for example, a typological characteristic
that is typical of the Trans-New Guinea languages will sometimes also turn out to be
typical for the whole group of non-Austronesian (‗Papuan‘) languages. For all such
cases in which the groups show overlap, we selected the group that shows the
strongest interaction (as instantiated by the lowest Fisher‘s Exact probability). For
example, a particular characteristic might be typical (i.e. p < .001) for three different

Language & Linguistics in Melanesia Vol. 30, 2012 ISSN: 0023-1959
83
groups: the whole set of 48 languages, Austronesian, and Austronesian plus West
Papuan. However, when the probability is lowest for Austronesian, the characteristic
is said to be typical of Austronesian only.
The first selection of typical characteristics is shown in Table 3. In this table, all
those characteristics are shown that are typical for our whole sample of 48 languages.
The most typical characteristic of all these languages, independent of areal or
genealogical grouping, is the fact that the languages have a small consonant system
(cf. Figure 9). Each of the other features listed in this and the following tables are
likewise highly interesting, though we choose only to discuss a selected set of features
in some detail because of limitations of space.
Typical Austronesian characteristics—or, more precisely, typical characteristics of
the Austronesian languages in and around New Guinea—are summarised in Table 4.
It is immediately obvious that there are far fewer typical characteristics for these
languages, compared to the whole New Guinea area (though there is possibly a slight
effect here, caused by the small number of languages available for this test, as there
are only 10 Austronesian languages in our sample). The most noteworthy
characteristic of the Austronesian languages is the usage of a separate word for the
marking of plurality (cf. Dryer 2005a). The moderate preference for prefixing will be
discussed in more detail below.
WALS Map (‗Feature‘) Characteristic (‗Value‘)
1 Consonant Inventories 1 Small
103 Third Person Zero of Verbal Person Marking 2 Overt third person S forms
120 Zero Copula for Predicate Nominals 2 Zero copula is possible
91 Order of Degree Word and Adjective 2 Degree word follows adjective
7 Glottalised Consonants 1 No glottalised consonants
62 Action Nominal Constructions 8 No action nominals
110 Periphrastic Causative Constructions 1 Sequential type but no purposive type
112 Negative Morphemes 2 Negative auxiliary verb
21 Exponence of Selected Inflectional Formatives 5 No case
76 Situational and Epistemic Modal Marking 3 No markers for both situational and
epistemic modality
Table 3. Typical characteristics of the New Guinea area (inclusive Austronesian).
WALS Map (‗Feature‘) Characteristic (‗Value‘)
33 Coding of Nominal Plurality 7 Plural word
26 Prefixing vs. Suffixing in Inflectional Morphology 5 Moderate preference for prefixing
101 Expression of Pronominal Subjects 4 Subject pronouns in different syntactic
position from full noun phrase subjects
Table 4. Typical characteristics of Austronesian languages.

Language & Linguistics in Melanesia Vol. 30, 2012 ISSN: 0023-1959
84
In Table 5, various groups of ‗Papuan‘ languages are summarised. For West
Papuan, only one characteristic is listed, and even this one is probably better
considered an epiphenomenon of the separation of values in WALS. It appears to be
typical for West Papuan languages to be predominantly prefixing. However, as noted
in Table 4, it is also typical for Austronesian languages to be moderately prefixing. If
the definition of these values in WALS would have been different, it would have
come out as a typical characteristic of Austronesian and West Papuan to prefer
prefixing (cf. Dryer 2005b). This also makes sense from a wider typological
perspective, as discussed below in the context of the discussion of the typical
characteristics of the combination of Austronesian and West Papuan.
The typical characteristics of the Highland languages are particularly interesting.
First, the absence of voicing contrasts in both plosive and fricatives (Maddieson
2005b) is clearly an instantiation of the widespread characteristic of small consonant
inventories in New Guinea. However, when looking at the WALS map, it turns out
that the absence of voicing contrasts is a typical ‗circumpacific‘ characteristic (cf.
Nichols 1997). It is highly tempting to speculate about a connection between the New
Guinea Highlands and a circumpacific typological distribution as a leftover of ancient
migration. Further, the extended body-part counting system is already known to be a
typical ‗Highland‘ characteristic (cf. Comrie 2005).
For Trans-New Guinea, we find another widely quoted ‗typically Papuan‘
characteristic: various degrees of remoteness in the marking of past tense (Dahl &
Velupillai 2005). Also note the occurrence of accusative alignment in verbal person
marking as a typical Trans-New Guinea characteristic. Of course, accusative
alignment is common worldwide (occurring worldwide in 212 languages out of a
sample of 380 languages in WALS, cf. Siewierska 2005). However, it is especially
common among Trans-New Guinea languages, reaching almost 100 % (just as, for
example, among Indo-European). The opposite situation occurs with the lexical stress
system that shows up as a specific characteristic of Trans-New Guinea languages.
Lexical stress is by no means a typical phenomenon among Trans-New Guinea
languages. It is only listed in WALS for about 35 % of the Trans-New Guinea
languages. However, this fraction is still much higher than the worldwide occurrence
of lexical stress, which is listed only for about 8 % of the world‘s languages in WALS
(cf. Goedemans & Van der Hulst 2005).
Language & Linguistics in Melanesia Vol. 30, 2012 ISSN: 0023-1959
85
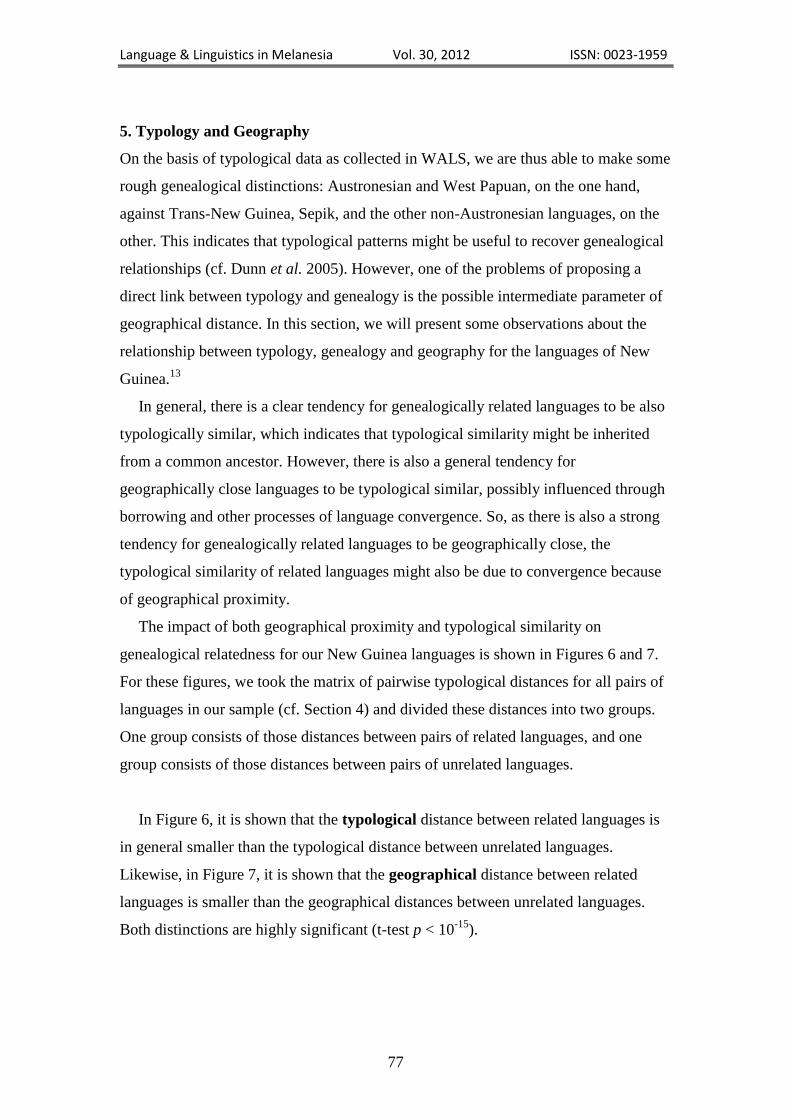
For all non-Austronesian (‗Papuan‘) languages, the absence of a passive is the
most typical characteristic. Looking at the map in WALS, it looks more like this is a
typical characteristic of the whole New Guinea area, but because of the passive in the
Austronesian language Taba, the statistics just barely favoured listing this
characteristic as typical non-Austronesian (cf. Siewierska 2005b). This should be
considered a close call. For the order genitive-noun the odds are clearer. This is, of
course, in no way a special characteristic from a worldwide perspective, but it clearly
separates Austronesian from non-Austronesian (cf. Dryer 2005c). Specifically, the
West Papuan languages are also genitive-noun, although they otherwise pattern with
Austronesian in questions of word order (see below).
WALS Map (‗Feature‘) Characteristic (‗Value‘)
Typically West Papuan
26 Prefixing vs. Suffixing in Inflectional Morphology 6 Predominantly prefixing
Typically Highlands
4 Voicing in Plosives and Fricatives 1 No voicing contrast
131 Numeral Bases 5 Extended body-part
64 Nominal and Verbal Conjunction 2 Different
Typically Trans New Guinea
37 Definite Articles 4 No definite article but indefinite article
104 Order of Person Markers on the Verb 3 P precedes A
66 The Past Tense 2 2-3 degrees of remoteness
84 Order of Object, Oblique, and Verb 3 Oblique-object-verb
100 Alignment of Verbal Person Marking 2 Accusative alignment
16 Weight Factors in Weight-Sensitive Stress Systems 6 Lexical: lexical stress, diacritic weight
Typically non-Austronesian (‘Papuan’)
107 Passive Constructions 2 There is no passive construction
86 Order of Genitive and Noun 1 Genitive-noun
93 Position of Interrogative in Content Questions 2 Not obligatorily initial
46 Indefinite Pronouns 2 Generic-noun-based indefinites
33 Coding of Nominal Plurality 9 No plural
106 Reciprocal Constructions 1 No non-iconic reciprocal constructions
34 Occurrence of Nominal Plurality 1 No nominal plural
89 Order of Numeral and Noun 2 Numeral follows noun
54 Distributive Numerals 1 No distributive numerals
40 Inclusive/Exclusive Distinction in Verbal Inflection 3 No inclusive/exclusive opposition
Table 5. Typical characteristics of ‗Papuan‘ languages.

Language & Linguistics in Melanesia Vol. 30, 2012 ISSN: 0023-1959
86
Finally, we now turn to the characterisation of the apparent split between
Austronesian plus West Papuan against the other languages in our sample. From the
previous discussion in Sections 4 and 5, there appears to be a typological distinction
between these two groups (cf. Figure 3). In Table 6, a survey is presented of those
characteristics from WALS that are typical for this distinction. From this table, it is
immediately obvious what causes this typological division. The Austronesian and
West Papuan languages are of the word-order type verb–object (VO) with
prepositions. In contrast, the other languages have object–verb (OV) and
postpositions. In WALS, there are various maps about different word-order
characteristics, which are all to some degree correlated with each other. Because of
this ‗bias‘ towards maps on word order in WALS, the effect of a difference in word-
order type—as found in our New Guinea sample—is probably to some extent
artificially enhanced.
WALS Map (‗Feature‘) Characteristic (‗Value‘)
Typically Austronesian and West Papuan
69 Position of Tense-Aspect Affixes 5 No tense-aspect inflection
70 The Morphological Imperative 5 No second person imperatives
51 Position of Case Affixes 9 Neither case affixes nor clitics
84 Order of Object, Oblique, and Verb 1 Verb-object-oblique (VOX)
81 Order of Subject, Object and Verb 2 Subject-verb-object (SVO)
85 Order of Adposition and Noun Phrase 2 Prepositions
88 Order of Demonstrative and Noun 2 Demonstrative word follows noun
124 ‗Want‘ Complement Subjects 2 Expressed overtly
83 Order of Object and Verb 2 Object follows verb (VO)
116 Polar Questions 6 Interrogative intonation only
Typically non-Austronesian/non-West Papuan
81 Order of Subject, Object and Verb 1 Subject-object-verb (SOV)
83 Order of Object and Verb 1 Object precedes verb (OV)
85 Order of Adposition and Noun Phrase 1 Postpositions
74 Situational Possibility 1 Expressed with affixes on verbs
118 Predicative Adjectives 2 Nonverbal encoding
67 The Future Tense 1 Inflectional marking
53 Ordinal Numerals 1 Zero: Ordinal numerals do not exist
29 Syncretism in Verbal Person/Number Marking 2 Subject marking is syncretic
69 Position of Tense-Aspect Affixes 2 Tense-aspect suffixes
55 Numeral Classifiers 1 Numeral classifiers are absent
90 Order of Relative Clause and Noun 2 Relative clause precedes noun (RelN)
8 Lateral Consonants 1 No laterals
Table 6. Typical characteristics distinguishing Austronesian plus West-Papuan from
the other non-Austronesian languages.
Language & Linguistics in Melanesia Vol. 30, 2012 ISSN: 0023-1959
87
However, in Table 6, there is a second kind of characteristic attested that
distinguishes the two groups. The Austronesian and West Papuan languages appear to
be characterised by relatively little inflectional marking (highly significant are no
tense-aspect inflection, no morphological imperative, and no case affixes), while the
remaining ‗Papuan‘ languages typically have morphological marking (highly
significant are morphological marking for situational possibility, and for tense and
aspect marking). Further, note that the Austronesian and West Papuan languages both
have a preference for prefixes (as noted previously in the discussion of individual
characteristics of these groups), while the other languages have a preference for
suffixes (e.g. tense-aspect suffixes). The typological distinction between Austronesian
plus West Papuan and the remaining ‗Papuan‘ languages is thus not only the result of
a different word-order type, but also an effect of a different morphological type of
languages in these groups.15
As noted in Section 4 (cf. Figure 2), there is also a worldwide separation of
languages into two groups along the lines of the distinction of Austronesian plus West
Papuan versus the remaining ‗Papuan‘ languages. And indeed, this worldwide
distinction also follows the OV/VO pattern observed (with the exception of Wichita,
which is listed as OV in WALS, but is found on the VO side). As noted already by
Greenberg (1963), the OV/VO distinction is strongly linked to the usage of
postpositions vs. prepositions (and other word order phenomena). However, several of
the other characteristics that show up in Table 5 also hold for the worldwide data. For
example, there is a strong worldwide (one-sided) asymmetrical dependency (Fisher‘s
Exact p < 10-15
) between OV/VO and a preference for suffixes/prefixes, respectively,
in the WALS data (cf. Bybee et al. 1990 for a discussion of this typological
observation). Second, there is an almost equally strong worldwide (two-sided)
asymmetrical dependency between OV/VO and inflectional / non-inflectional tense-
aspect marking (Fisher‘s Exact p < 10-11
). Likewise, there is a slightly less strong,
though still significant, worldwide symmetrical dependency between OV/VO and
inflectional/non-inflectional future marking (Fisher‘s Exact p = .007).16
In general, there appear to be strong typological connections between OV, much
inflectional marking, and a preference for suffixing, on the one side, against the
combination VO, less inflectional marking, and a preference for prefixing (with the
proviso that prefixing is less common than suffixing overall), on the other side. As
most of the word order parameters are related to the OV/VO distinction, and the

Language & Linguistics in Melanesia Vol. 30, 2012 ISSN: 0023-1959
88
presence vs. absence of inflectional marking permeates the characteristics in WALS,
these correlations have a broad impact, resulting in a rough typological bipartite
distinction of the languages according to WALS. Consequently, this distinction is also
found in our New Guinea sample. The distinction between Austronesian plus West
Papuan against the remaining ‗Papuan‘ languages is thus not so much a special
feature of the New Guinea area in need of an idiosyncratic or historic explanation, but
a specific instance of a worldwide typological pattern in need of a general cognitive
explanation; to provide such an explanation, however, would go beyond the scope of
this article.
7. Conclusions
Large databases with linguistic information about many of the world‘s languages are
a new tool for exploratory cross-linguistic research. In this article, we have used one
such database, the World Atlas of Language Structures (WALS, Haspelmath et al.
2005), to investigate the languages of New Guinea and the surrounding areas. There
are still many unknowns concerning the methodological aspects of such research, and
we see this article as a contribution to the development of this approach.
Investigating all features from WALS for a sample of languages from the New
Guinea area, we did not find evidence that these languages make up a single group
from a worldwide perspective. Trying to group languages according to their linguistic
similarity, the New Guinean languages did not end up as one group, but were found
dispersed among the world‘s languages (cf. Figure 2). As for the internal structure of
the linguistic similarities among the New Guinean languages in our sample, we found
a basic two-way distinction between Austronesian and West Papuan, on the one side,
and the remaining ‗Papuan‘ languages on the other side (cf. Figure 3). This division
turned out to be the result of a more general typological division among the world‘s
languages between languages with a verb-object word-order profile, which are at the
same time low on affixal morphology and have a preference for prefixing, in contrast
to languages with an object-verb word order profile with more morphology and a
preference for suffixation.
As for specific ‗New Guinean‘ characteristics, we found that, overall, there are
fewer unusual characteristics in the New Guinea area than expected from the
worldwide distribution. The languages from New Guinea appear to be relatively
‗normal‘ languages (at least as far as the characteristics covered in WALS are

Language & Linguistics in Melanesia Vol. 30, 2012 ISSN: 0023-1959
89
concerned). Of course there are still some linguistically unusual phenomena to be
found in New Guinea. The most outstanding feature for all languages in our New
Guinean sample is the presence of a small consonant inventory. For various
subsamples of our sample, we found different special characteristics, like no voicing
contrasts for plosives and fricatives, as well as extended body-part numerals for the
languages spoken in the New Guinea Highlands, or degrees of remoteness marked in
the past tense, as specifically found in Trans-New Guinean languages.
Language & Linguistics in Melanesia Vol. 30, 2012 ISSN: 0023-1959
90
References
Altmann, Gabriel; Köhler, Reinhard; and Piotrowski, R. (eds.). 2005. Quantitative
Linguistics: An International Handbook. Berlin: de Gruyter.
Bryant, David; and Moulton, Vincent. 2004. ―Neighbor-Net: An agglomerative
method for the construction of phylogenetic networks.‖ Molecular Biology and
Evolution 21: 255-265.
Bryant, David; Filimon, Flavia; and Gray, Russell D. 2005. ―Untangling our past:
Languages, trees, splits and networks.‖ In: Mace et al. (eds.) 2005: 67-84.
Bybee, Joan; Pagliuca, William; and Perkins, Revere D. 1990. ―On the asymmetries
in the affixation of grammatical material.‖ In: Croft (ed.) 1990: 1-42.
Comrie, Bernard. 2005. ―Numeral bases.‖ In: Haspelmath et al. (eds.) 2005: 530-535.
Croft, William. (ed.). 1990. Studies in Typology and Diachrony. Amsterdam:
Benjamins.
Cysouw, Michael. 2002. ―Against implicational universals.‖ Linguistic Typology 7:
89-10.
Cysouw, Michael. 2005. ―Quantitative method in typology.‖ In: Altmann et al. (eds.)
2005: 554-578.
Cysouw, Michael. 2011. ―Quantitative explorations of the world-wide distribution of
rare characteristics, or: the exceptionality of northwestern European languages.‖
In: Horst Simon & Heike Wiese (eds.). 2011: 411-431.
Cysouw, Michael. forthcoming. ―Disentangling geography from genealogy.‖ In:
Benedikt Szmrecsanyi (ed.).
Dahl, Östen; and Velupillai, Viveka. 2005. ―The past tense.‖ In: Haspelmath et al.
(eds.) 2005: 270-273.
Dryer, Matthew S. 2005a. ―Coding of nominal plurality.‖ In: Haspelmath et al. (eds.)
2005: 138-141.
Dryer, Matthew S. 2005b. ―Prefixing versus suffixing in inflectional morphology.‖ In:
Haspelmath et al. (eds.) 2005: 110-113.
Dryer, Matthew S. 2005c. ―Order of genitive and noun.‖ In: Haspelmath et al. (eds.)
2005: 350-353.
Dunn, M.; Terrill, A.; Reesink, G.; Foley, R. A.; and Levinson, S. C. (2005).
―Structural Phylogenetics and the Reconstruction of Ancient Language
History.‖ Science 309: 2072-2075.
Goebl, Hans. 1984. Dialektometrische Studien. Tübingen: Niemeyer.
Goedemans Rob; and Van der Hulst, Harry. 2005. ―Weight factores in weight-
sensitive stress systems.‖ In: Haspelmath et al. (eds.) 2005: 70-73.
Gordon, Raymond G., Jr. 2005. Ethnologue: Languages of the world. 15th ed. Dallas:
SIL International.
Greenberg, Joseph H. (ed.). 1963. Universals of Language. Cambridge, Mass.: MIT
Press.
Greenberg, Joseph H. 1963. ―Some universals of grammar with particular reference to
the order of meaningful elements.‖ In: Greenberg (ed.) 1963: 73-113.
Haspelmath, Martin; Dryer, Matthew; Gil, David; and Comrie, Bernard (eds.). 2005.
The World Atlas of Language Structures. Oxford: oxford University Press.
Mace, Ruth; Holden, Clare J.; and Shennan, Stephan. (eds.). 2005. The Evolution of
Cultural Diversity: A Phylogenetic Approach. London: UCL.
Maddieson, Ian. 2005a. ―Consontant inventories.‖ In: Haspelmath et al. (eds.) 2005:
10-13.
Language & Linguistics in Melanesia Vol. 30, 2012 ISSN: 0023-1959
91
Maddieson, Ian. 2005b. ―Voicing in plosives and fricatives.‖ In: Haspelmath et al.
(eds.) 2005: 22-25.
Maslova, Elena. 2002. ―A case for implicational universals.‖ Linguistic Typology 7:
101-108.
Nichols, Johanna. 1997. ―Modeling ancient population structures and movement in
linguistics.‖ Annual Review of Anthropology 26: 359-384.
Siewierska, Anna. 2005a. ―Alignment of verbal person marking.‖ In: Haspelmath et
al. (eds.) 2005: 402-405.
Siewierska, Anna. 2005b. ―Passive constructions.‖ In: Haspelmath et al. (eds.) 2005:
434-437.
Simon, Horst & Heike Wiese (eds.) 2011. Expecting the Unexpected. Berlin: De
Gruyter Mouton.
Szmrecsanyi, Benedikt (ed.).Space in language and linguistics: geographical,
interactional, and cognitive perspectives. Berlin: Walter de Gruyter.
Language & Linguistics in Melanesia Vol. 30, 2012 ISSN: 0023-1959
92
Notes
1 This paper was originally written in the fall of 2006 in response to the first call for
papers for the relaunch of the current journal. We are grateful that the relaunch of this
journal finally materialised, and we would like to wish LLM good fortune and high-
quality submissions. We decided against rewriting this paper, although both the
WALS data itself has been updated and the proposed statistic analysis of such data
have been discussed extensively in the intermediate years. Finally, we thank Hans-
Jörg Bibiko and Mihai Albu for assistance with the selection of the languages and
conversion of the data. 2 The population figures were reached by adding together the population figures for
each country or administrative area in Gordon (2005). Some error is inevitably
introduced from the fact that the figures relate to censuses taken in different years.
The number of languages is the total of the numbers of living first languages for each
country or administrative area in Gordon (2005). These numbers are very slightly too
high because some languages are spoken in more than one country or administrative
area and therefore get counted twice. 3 We use the term ―genealogical‖ rather than ―genetic‖ to avoid confusion with
biological genetics. Nothing crucial hinges on this terminological choice. 4 Matthew Dryer‘s summary of the Papuan genetic classification is available online at
http://linguistics.buffalo.edu/people/faculty/dryer/dryer/papuan (consulted on 17
September 2006). 5 In the terminology as used in WALS, a feature is a particular dimension of linguistic
variation (e.g. the order of object and verb) and a feature-value (or ‗value‘ for short) is
a particular instantiation of this dimension (e.g. object-verb order). 6 For the record, the correlation between verb–object and adposition–noun phrase is
validated, with 81.7% of the languages in the relevant sample having either verb–
object and preposition–noun phrase or object–verb and noun phrase–postposition
orders, only 4.6% having object–verb and preposition–noun phrase or verb–object
and noun phrase–postposition orders; that between verb–object and noun–adjective is
not significant, with 51.7% having either verb–object and Noun–adjective or object–
verb and adjective–Noun orders, but as many as 33.1% having verb–object and
adjective–noun or object–verb and noun–adjective orders. 7 The location of the circles in Map 1 only approximates the geographical location of
the speaker communities, for reasons of presentation. 8 The arguments for considering a language part of the New Guinea Highlands is
rather ad hoc. It is not even obvious that this group would make linguistic sense,
though we wanted at least to include some areal group in our investigation to show
the possibility of investigating such groups. We originally defined an altitude of 1,500
meters as the arbitrary cut-off point between the Lowlands and the Highlands (a
boundary suggested, when pushed, by William A. Foley, p.c.). However, although the
Selepet airstrip is located at 1,340 meters, many of the Selepet live higher (Ger
Reesink, p.c.), so we included this language as a marginal Highland language. Tauya
is spoken only at an altitude of about 200 meters above sea-level, but Lorna
MacDonald (p.c.) informs us that most contact of the Tauya is directed towards the
Highlands, and also their stories and diet seem to indicate a strong Highland
influence. We will here consider Tauya to be a Highland language. Further thanks for
discussing the delimitation of a concept ‗Highland‘ are due to Les Bruce, Andrew

Language & Linguistics in Melanesia Vol. 30, 2012 ISSN: 0023-1959
93
Pawley and Malcolm Ross. None of the colleagues mentioned in this note bears any
responsibility for our decision on this issue. 9 For the present sample, we also considered the basic two-fold division that was
found in the NeighbourNet analysis as shown in Figure 3. There seems to be a slight
difference between the Austronesian-West Papuan group and the rest, as the
Austronesian-West Papuan languages are even more ‗normal‘ than the other
languages in our sample. However, the difference between these two groups is not
really significant (t-test p = .06) 10
Our relative Hamming distance is basically the same as the ‗relativer Identitätswert‘
(RIW) as discussed by Goebl (1984). The only difference is that our measure is
formulated as a measure of distance, where the RIW is formulated as a measure of
similarity (which means that our measure is the same as 1-RIW). 11
This is one of the simplest methods to determine a distance on the basis of the
WALS data. There are many ways in which this measure could be improved upon.
For example, with gradient parameters, like the number of consonants (Maddieson
2005a), not all differences are equally different: a small consonant inventory is more
similar to an average inventory than to a large inventory. Further, there are many
maps in WALS that could be separated into independent parameters. However, for
reasons of methodological clarity and ease of analysis, we decided not to add any
information to WALS just for the purpose of this paper, but simply use the data
exactly as they are specified in WALS. 12
The reason to take the best coded 150 was that after these 150 there was a strong
drop in the amount of available data per language. The reason to select randomly the
rather odd number of exactly 47 languages is due to a late recognised error. We
originally selected the best 48 (the same as the number of languages in our sample),
but only later did we notice that one language of our New Guinea area sample
accidentally was also present in the random sample. We decided to remove this
language without redoing the calculations needed for Figure 2. 13
The notion of geography that will be used in this section is rather impoverished.
The landscape of New Guinea and the surrounding areas is full of natural barriers that
make travel and contact often much more likely in one direction that in another, a
phenomenon that we ideally would like to model in some way. However, in this first
attempt to investigate geographical patterns quantitatively, we will only use
geographical distance in the sense of a direct line from one speech community to the
other. 14
Statistically, this approach is highly suspect. The problem is that a set of pairwise
distances is not a set of independent measurements. If the pairs (A,B) and (B,C) are
close, then normally also the distance between A and C is small. However, we use
this approach here awaiting statistical improvements from colleagues more proficient
in such matters. 15
In Figure 3, there were two languages that did not fit into the distinction
Austronesian plus West Papuan against the rest. First, the Austronesian language
Tawala ended up on the side together with the other ‗Papuan‘ languages. As it turns
out, Tawala has an atypical word-order type for an Austronesian language (OV,
genitive-noun), though it is—as expected—weakly prefixing. Second, the non-
Austronesian language Arapesh is found inbetween the two groups, with a tendency
towards Austronesian and West Papuan. And indeed, Arapesh is listed in WALS with
Language & Linguistics in Melanesia Vol. 30, 2012 ISSN: 0023-1959
94
typical word-order characteristics of Austronesian and West Papuan (VO with
prepositions) and having a weak preference for prefixing. 16
The terms ‗one-sided asymmetrical dependency‘ and ‗two-sided asymmetrical
dependency‘ are proposed in Cysouw (2005) to capture distributions that would
traditionally be interpreted in typology as a statistical implicational universal, like
OV -> suffixes, or the equivalent prefixes -> VO. These new notions were originally
proposed under the name ‗weak‘ and ‗strong‘ directional implication, respectively, in
Maslova‘s (2002) reply to Cysouw (2002). However, as there is nothing weak or
strong in either kind of correlation, Cysouw (2005) proposed the names used here.
The name ‗symmetrical dependency‘ is proposed as a statistically sound replacement
for what is traditionally called a statistical equivalence.