Embed Size (px)
Citation preview
New Hampshire Community Mental Health Agreement Quarterly Data Report
April to June 2017
New Hampshire Department of Health and Human Services
Office of Quality Assurance and Improvement
September 1, 2017
The Department of Health and Human Services’ Mission is to join communities and families in providing opportunities for citizens to achieve health and independence
April – June 2017
NH DHHS - OQAI - CMHA Quarterly Report, 9/1/17 1
Community Mental Health Agreement Quarterly Report
New Hampshire Department of Health and Human Services Publication Date: 9/1/2017 Reporting Period: 4/1/2017 – 6/30/2017
Notes for Quarter
Improved data capture from NH Hospital and Designated Receiving Facility stays has resulted in more accurate reporting for some measures. Where this is the case, the January to March quarter has been revised.
April – June 2017
NH DHHS - OQAI - CMHA Quarterly Report, 9/1/17 2
Community Mental Health Agreement Quarterly Report
New Hampshire Department of Health and Human Services Publication Date: 9/1/2017 Reporting Period: 4/1/2017 – 6/30/2017
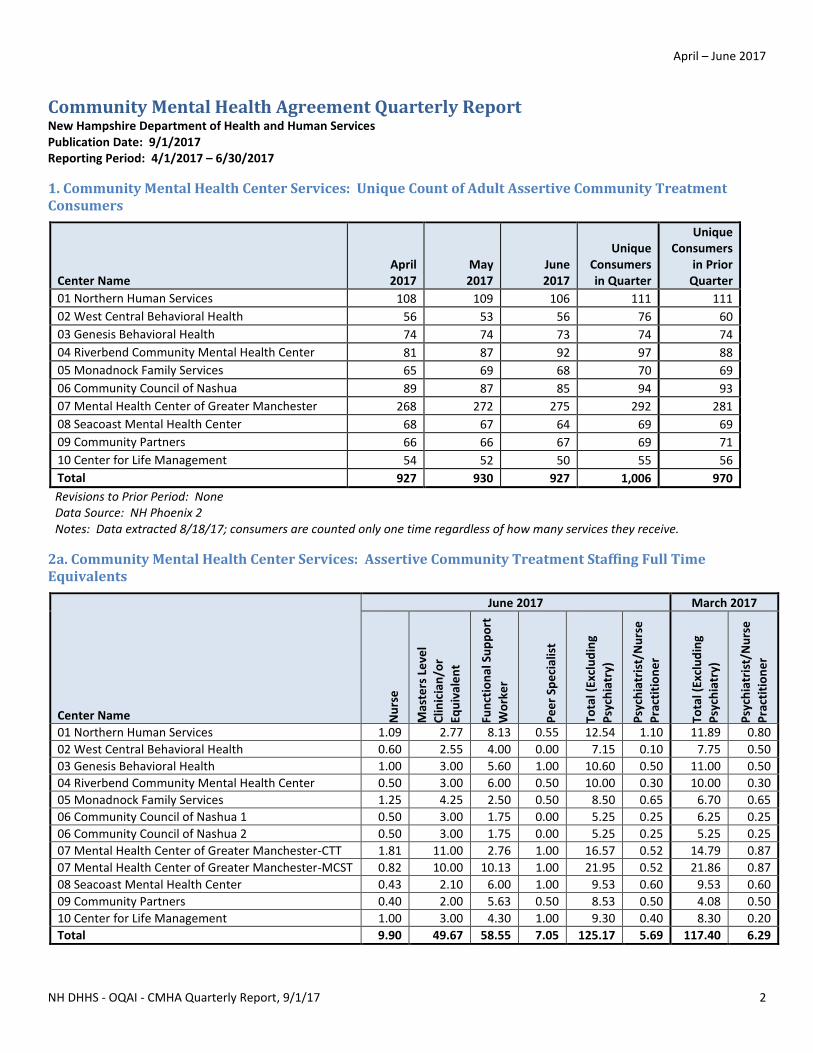
1. Community Mental Health Center Services: Unique Count of Adult Assertive Community Treatment Consumers
Center Name April
2017 May
2017 June
2017
Unique Consumers in Quarter
Unique Consumers
in Prior Quarter
01 Northern Human Services 108 109 106 111 111
02 West Central Behavioral Health 56 53 56 76 60
03 Genesis Behavioral Health 74 74 73 74 74
04 Riverbend Community Mental Health Center 81 87 92 97 88
05 Monadnock Family Services 65 69 68 70 69
06 Community Council of Nashua 89 87 85 94 93
07 Mental Health Center of Greater Manchester 268 272 275 292 281
08 Seacoast Mental Health Center 68 67 64 69 69
09 Community Partners 66 66 67 69 71
10 Center for Life Management 54 52 50 55 56
Total 927 930 927 1,006 970
Revisions to Prior Period: None Data Source: NH Phoenix 2 Notes: Data extracted 8/18/17; consumers are counted only one time regardless of how many services they receive.
2a. Community Mental Health Center Services: Assertive Community Treatment Staffing Full Time Equivalents
Center Name
June 2017 March 2017
Nu
rse
Mas
ters
Le
vel
Clin
icia
n/o
r
Equ
ival
en
t
Fun
ctio
nal
Su
pp
ort
Wo
rke
r
Pe
er
Spe
cial
ist
Tota
l (Ex
clu
din
g
Psy
chia
try)
Psy
chia
tris
t/N
urs
e
Pra
ctit
ion
er
Tota
l (Ex
clu
din
g
Psy
chia
try)
Psy
chia
tris
t/N
urs
e
Pra
ctit
ion
er
01 Northern Human Services 1.09 2.77 8.13 0.55 12.54 1.10 11.89 0.80
02 West Central Behavioral Health 0.60 2.55 4.00 0.00 7.15 0.10 7.75 0.50
03 Genesis Behavioral Health 1.00 3.00 5.60 1.00 10.60 0.50 11.00 0.50
04 Riverbend Community Mental Health Center 0.50 3.00 6.00 0.50 10.00 0.30 10.00 0.30
05 Monadnock Family Services 1.25 4.25 2.50 0.50 8.50 0.65 6.70 0.65
06 Community Council of Nashua 1 0.50 3.00 1.75 0.00 5.25 0.25 6.25 0.25
06 Community Council of Nashua 2 0.50 3.00 1.75 0.00 5.25 0.25 5.25 0.25
07 Mental Health Center of Greater Manchester-CTT 1.81 11.00 2.76 1.00 16.57 0.52 14.79 0.87
07 Mental Health Center of Greater Manchester-MCST 0.82 10.00 10.13 1.00 21.95 0.52 21.86 0.87
08 Seacoast Mental Health Center 0.43 2.10 6.00 1.00 9.53 0.60 9.53 0.60
09 Community Partners 0.40 2.00 5.63 0.50 8.53 0.50 4.08 0.50
10 Center for Life Management 1.00 3.00 4.30 1.00 9.30 0.40 8.30 0.20
Total 9.90 49.67 58.55 7.05 125.17 5.69 117.40 6.29
April – June 2017
NH DHHS - OQAI - CMHA Quarterly Report, 9/1/17 3
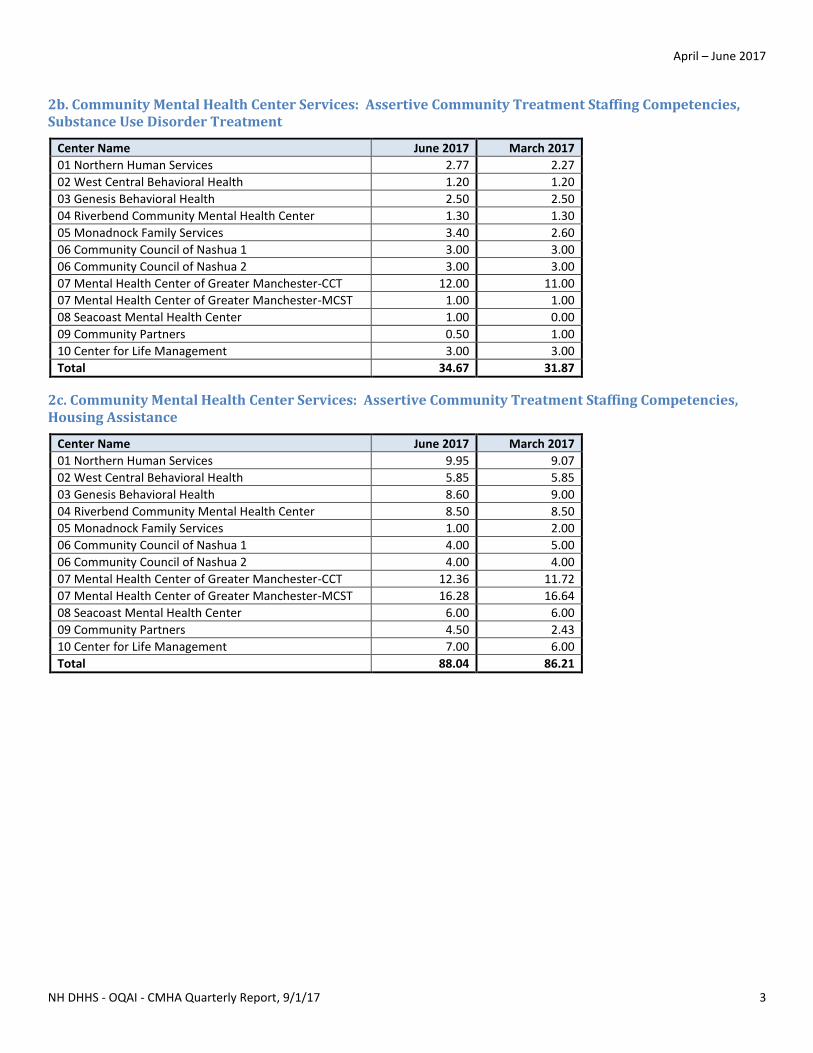
2b. Community Mental Health Center Services: Assertive Community Treatment Staffing Competencies, Substance Use Disorder Treatment
Center Name June 2017 March 2017
01 Northern Human Services 2.77 2.27
02 West Central Behavioral Health 1.20 1.20
03 Genesis Behavioral Health 2.50 2.50
04 Riverbend Community Mental Health Center 1.30 1.30
05 Monadnock Family Services 3.40 2.60
06 Community Council of Nashua 1 3.00 3.00
06 Community Council of Nashua 2 3.00 3.00
07 Mental Health Center of Greater Manchester-CCT 12.00 11.00
07 Mental Health Center of Greater Manchester-MCST 1.00 1.00
08 Seacoast Mental Health Center 1.00 0.00
09 Community Partners 0.50 1.00
10 Center for Life Management 3.00 3.00
Total 34.67 31.87
2c. Community Mental Health Center Services: Assertive Community Treatment Staffing Competencies, Housing Assistance
Center Name June 2017 March 2017
01 Northern Human Services 9.95 9.07
02 West Central Behavioral Health 5.85 5.85
03 Genesis Behavioral Health 8.60 9.00
04 Riverbend Community Mental Health Center 8.50 8.50
05 Monadnock Family Services 1.00 2.00
06 Community Council of Nashua 1 4.00 5.00
06 Community Council of Nashua 2 4.00 4.00
07 Mental Health Center of Greater Manchester-CCT 12.36 11.72
07 Mental Health Center of Greater Manchester-MCST 16.28 16.64
08 Seacoast Mental Health Center 6.00 6.00
09 Community Partners 4.50 2.43
10 Center for Life Management 7.00 6.00
Total 88.04 86.21
April – June 2017
NH DHHS - OQAI - CMHA Quarterly Report, 9/1/17 4
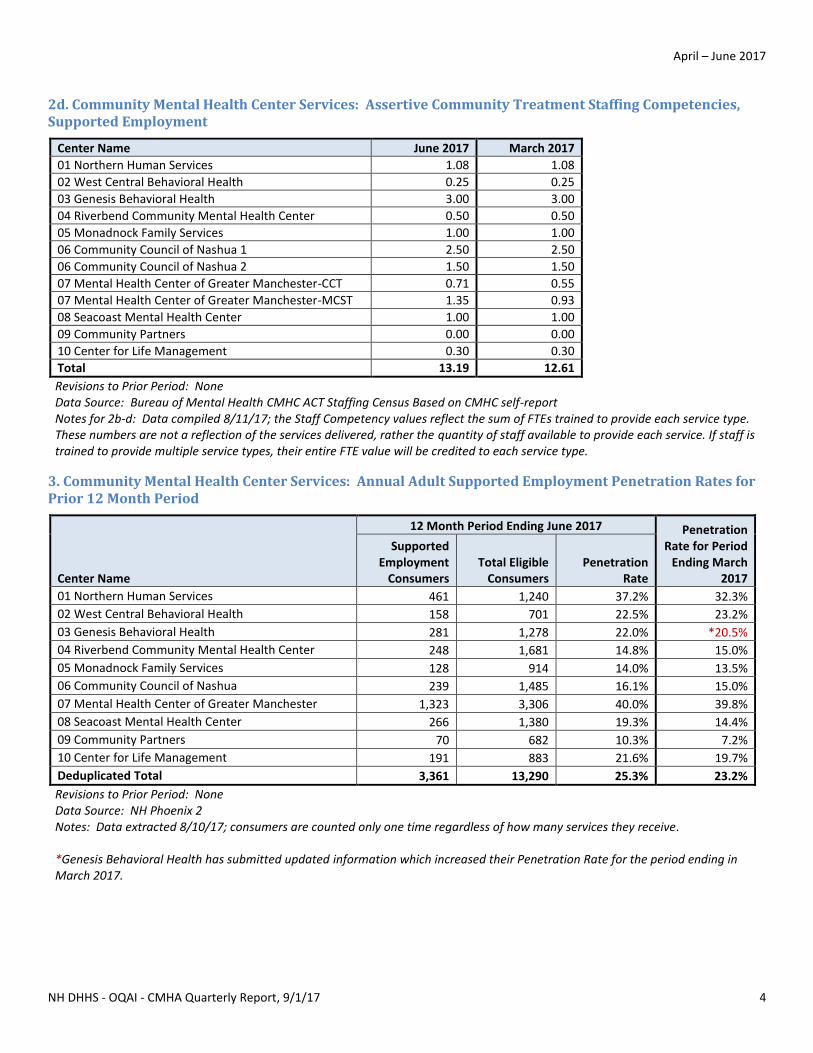
2d. Community Mental Health Center Services: Assertive Community Treatment Staffing Competencies, Supported Employment
Center Name June 2017 March 2017
01 Northern Human Services 1.08 1.08
02 West Central Behavioral Health 0.25 0.25
03 Genesis Behavioral Health 3.00 3.00
04 Riverbend Community Mental Health Center 0.50 0.50
05 Monadnock Family Services 1.00 1.00
06 Community Council of Nashua 1 2.50 2.50
06 Community Council of Nashua 2 1.50 1.50
07 Mental Health Center of Greater Manchester-CCT 0.71 0.55
07 Mental Health Center of Greater Manchester-MCST 1.35 0.93
08 Seacoast Mental Health Center 1.00 1.00
09 Community Partners 0.00 0.00
10 Center for Life Management 0.30 0.30
Total 13.19 12.61
Revisions to Prior Period: None Data Source: Bureau of Mental Health CMHC ACT Staffing Census Based on CMHC self-report Notes for 2b-d: Data compiled 8/11/17; the Staff Competency values reflect the sum of FTEs trained to provide each service type. These numbers are not a reflection of the services delivered, rather the quantity of staff available to provide each service. If staff is trained to provide multiple service types, their entire FTE value will be credited to each service type.
3. Community Mental Health Center Services: Annual Adult Supported Employment Penetration Rates for Prior 12 Month Period
Center Name
12 Month Period Ending June 2017 Penetration Rate for Period
Ending March 2017
Supported Employment
Consumers Total Eligible
Consumers Penetration
Rate
01 Northern Human Services 461 1,240 37.2% 32.3%
02 West Central Behavioral Health 158 701 22.5% 23.2%
03 Genesis Behavioral Health 281 1,278 22.0% *20.5%
04 Riverbend Community Mental Health Center 248 1,681 14.8% 15.0%
05 Monadnock Family Services 128 914 14.0% 13.5%
06 Community Council of Nashua 239 1,485 16.1% 15.0%
07 Mental Health Center of Greater Manchester 1,323 3,306 40.0% 39.8%
08 Seacoast Mental Health Center 266 1,380 19.3% 14.4%
09 Community Partners 70 682 10.3% 7.2%
10 Center for Life Management 191 883 21.6% 19.7%
Deduplicated Total 3,361 13,290 25.3% 23.2%
Revisions to Prior Period: None Data Source: NH Phoenix 2 Notes: Data extracted 8/10/17; consumers are counted only one time regardless of how many services they receive. *Genesis Behavioral Health has submitted updated information which increased their Penetration Rate for the period ending in March 2017.
April – June 2017
NH DHHS - OQAI - CMHA Quarterly Report, 9/1/17 5
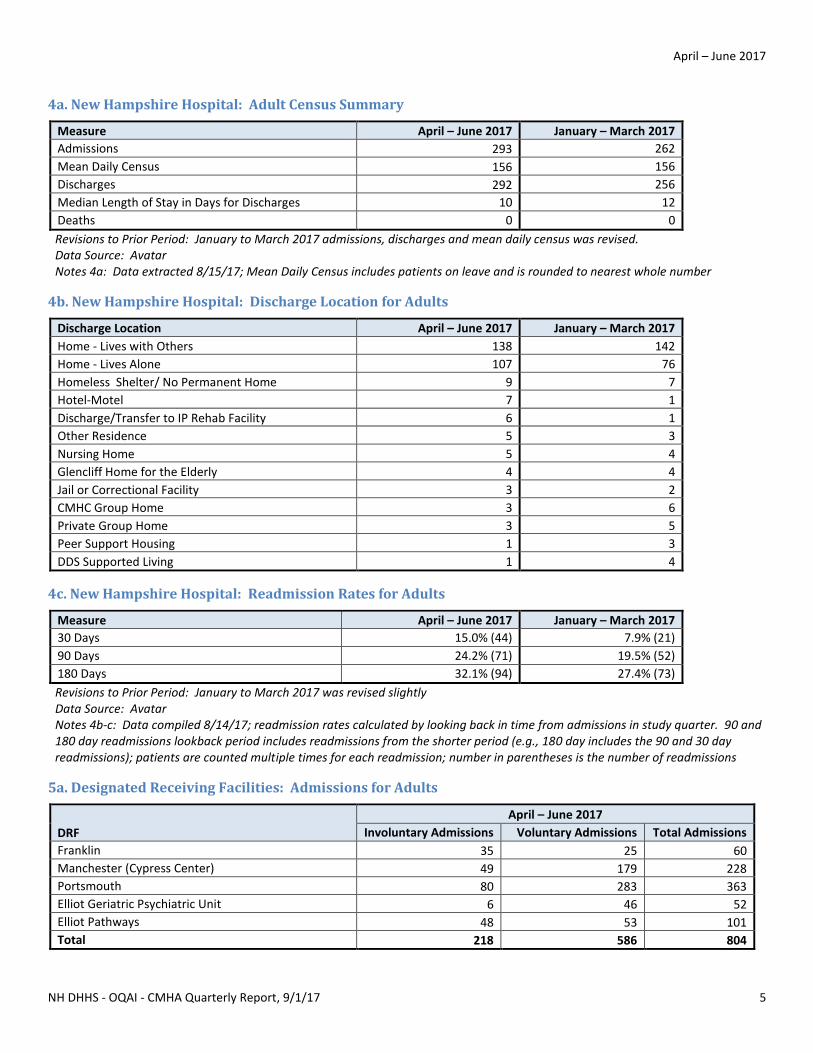
4a. New Hampshire Hospital: Adult Census Summary
Measure April – June 2017 January – March 2017
Admissions 293 262
Mean Daily Census 156 156
Discharges 292 256
Median Length of Stay in Days for Discharges 10 12
Deaths 0 0
Revisions to Prior Period: January to March 2017 admissions, discharges and mean daily census was revised. Data Source: Avatar Notes 4a: Data extracted 8/15/17; Mean Daily Census includes patients on leave and is rounded to nearest whole number
4b. New Hampshire Hospital: Discharge Location for Adults
Discharge Location April – June 2017 January – March 2017
Home - Lives with Others 138 142
Home - Lives Alone 107 76
Homeless Shelter/ No Permanent Home 9 7
Hotel-Motel 7 1
Discharge/Transfer to IP Rehab Facility 6 1
Other Residence 5 3
Nursing Home 5 4
Glencliff Home for the Elderly 4 4
Jail or Correctional Facility 3 2
CMHC Group Home 3 6
Private Group Home 3 5
Peer Support Housing 1 3
DDS Supported Living 1 4
4c. New Hampshire Hospital: Readmission Rates for Adults
Measure April – June 2017 January – March 2017
30 Days 15.0% (44) 7.9% (21)
90 Days 24.2% (71) 19.5% (52)
180 Days 32.1% (94) 27.4% (73)
Revisions to Prior Period: January to March 2017 was revised slightly Data Source: Avatar Notes 4b-c: Data compiled 8/14/17; readmission rates calculated by looking back in time from admissions in study quarter. 90 and 180 day readmissions lookback period includes readmissions from the shorter period (e.g., 180 day includes the 90 and 30 day readmissions); patients are counted multiple times for each readmission; number in parentheses is the number of readmissions
5a. Designated Receiving Facilities: Admissions for Adults
DRF
April – June 2017
Involuntary Admissions Voluntary Admissions Total Admissions
Franklin 35 25 60
Manchester (Cypress Center) 49 179 228
Portsmouth 80 283 363
Elliot Geriatric Psychiatric Unit 6 46 52
Elliot Pathways 48 53 101
Total 218 586 804
April – June 2017
NH DHHS - OQAI - CMHA Quarterly Report, 9/1/17 6
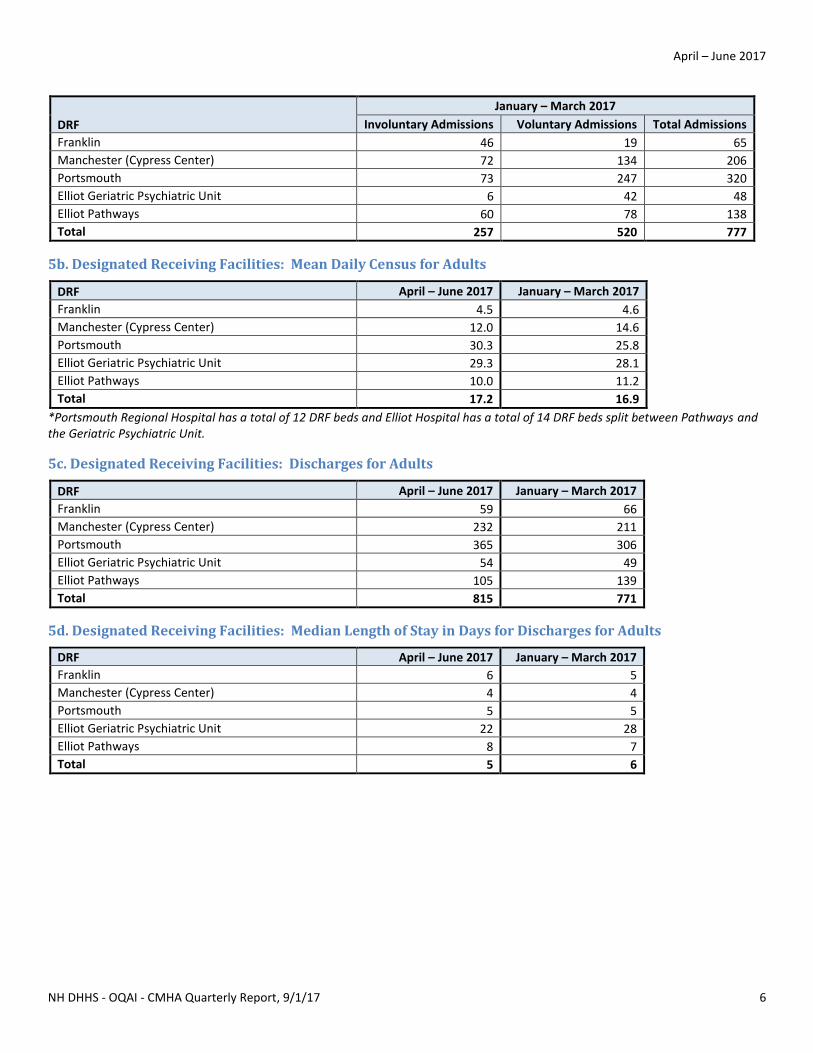
DRF
January – March 2017
Involuntary Admissions Voluntary Admissions Total Admissions
Franklin 46 19 65
Manchester (Cypress Center) 72 134 206
Portsmouth 73 247 320
Elliot Geriatric Psychiatric Unit 6 42 48
Elliot Pathways 60 78 138
Total 257 520 777
5b. Designated Receiving Facilities: Mean Daily Census for Adults
DRF April – June 2017 January – March 2017
Franklin 4.5 4.6
Manchester (Cypress Center) 12.0 14.6
Portsmouth 30.3 25.8
Elliot Geriatric Psychiatric Unit 29.3 28.1
Elliot Pathways 10.0 11.2
Total 17.2 16.9
*Portsmouth Regional Hospital has a total of 12 DRF beds and Elliot Hospital has a total of 14 DRF beds split between Pathways and the Geriatric Psychiatric Unit.
5c. Designated Receiving Facilities: Discharges for Adults
DRF April – June 2017 January – March 2017
Franklin 59 66
Manchester (Cypress Center) 232 211
Portsmouth 365 306
Elliot Geriatric Psychiatric Unit 54 49
Elliot Pathways 105 139
Total 815 771
5d. Designated Receiving Facilities: Median Length of Stay in Days for Discharges for Adults
DRF April – June 2017 January – March 2017
Franklin 6 5
Manchester (Cypress Center) 4 4
Portsmouth 5 5
Elliot Geriatric Psychiatric Unit 22 28
Elliot Pathways 8 7
Total 5 6
April – June 2017
NH DHHS - OQAI - CMHA Quarterly Report, 9/1/17 7
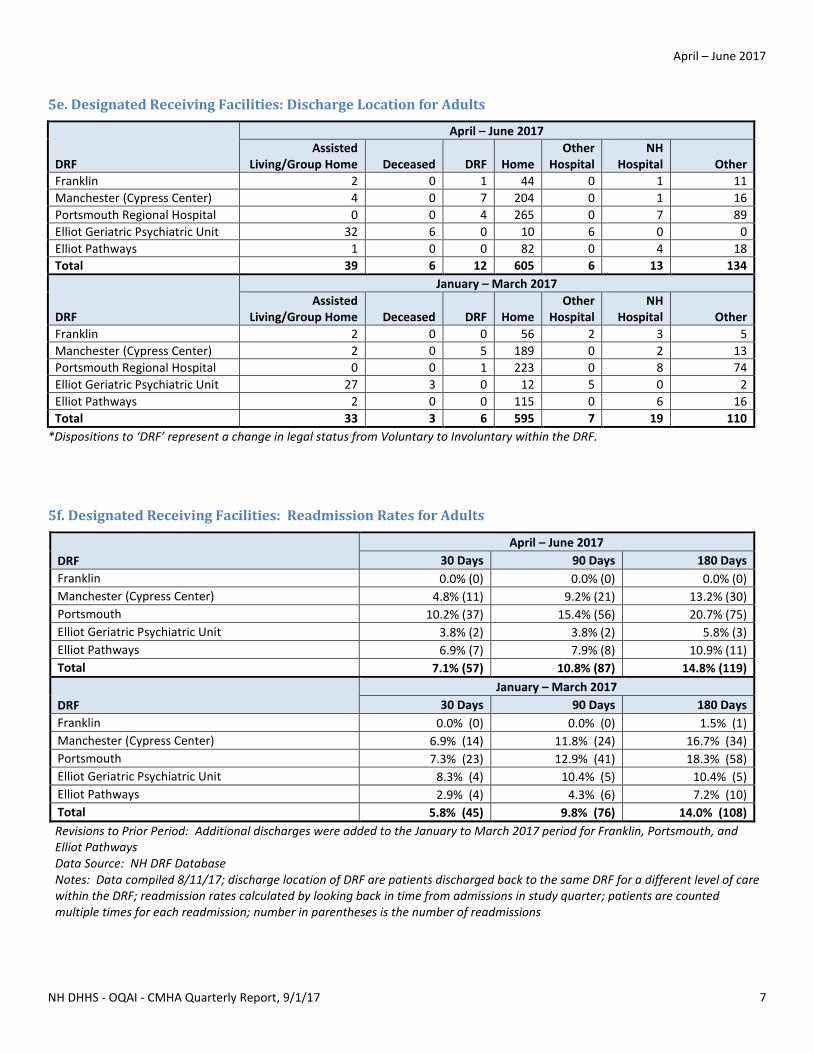
5e. Designated Receiving Facilities: Discharge Location for Adults
DRF
April – June 2017
Assisted Living/Group Home Deceased DRF Home
Other Hospital
NH Hospital Other
Franklin 2 0 1 44 0 1 11
Manchester (Cypress Center) 4 0 7 204 0 1 16
Portsmouth Regional Hospital 0 0 4 265 0 7 89
Elliot Geriatric Psychiatric Unit 32 6 0 10 6 0 0
Elliot Pathways 1 0 0 82 0 4 18
Total 39 6 12 605 6 13 134
DRF
January – March 2017
Assisted Living/Group Home Deceased DRF Home
Other Hospital
NH Hospital Other
Franklin 2 0 0 56 2 3 5
Manchester (Cypress Center) 2 0 5 189 0 2 13
Portsmouth Regional Hospital 0 0 1 223 0 8 74
Elliot Geriatric Psychiatric Unit 27 3 0 12 5 0 2
Elliot Pathways 2 0 0 115 0 6 16
Total 33 3 6 595 7 19 110
*Dispositions to ‘DRF’ represent a change in legal status from Voluntary to Involuntary within the DRF.
5f. Designated Receiving Facilities: Readmission Rates for Adults
DRF
April – June 2017
30 Days 90 Days 180 Days
Franklin 0.0% (0) 0.0% (0) 0.0% (0)
Manchester (Cypress Center) 4.8% (11) 9.2% (21) 13.2% (30)
Portsmouth 10.2% (37) 15.4% (56) 20.7% (75)
Elliot Geriatric Psychiatric Unit 3.8% (2) 3.8% (2) 5.8% (3)
Elliot Pathways 6.9% (7) 7.9% (8) 10.9% (11)
Total 7.1% (57) 10.8% (87) 14.8% (119)
DRF
January – March 2017
30 Days 90 Days 180 Days
Franklin 0.0% (0) 0.0% (0) 1.5% (1)
Manchester (Cypress Center) 6.9% (14) 11.8% (24) 16.7% (34)
Portsmouth 7.3% (23) 12.9% (41) 18.3% (58)
Elliot Geriatric Psychiatric Unit 8.3% (4) 10.4% (5) 10.4% (5)
Elliot Pathways 2.9% (4) 4.3% (6) 7.2% (10)
Total 5.8% (45) 9.8% (76) 14.0% (108)
Revisions to Prior Period: Additional discharges were added to the January to March 2017 period for Franklin, Portsmouth, and Elliot Pathways Data Source: NH DRF Database Notes: Data compiled 8/11/17; discharge location of DRF are patients discharged back to the same DRF for a different level of care within the DRF; readmission rates calculated by looking back in time from admissions in study quarter; patients are counted multiple times for each readmission; number in parentheses is the number of readmissions
April – June 2017
NH DHHS - OQAI - CMHA Quarterly Report, 9/1/17 8
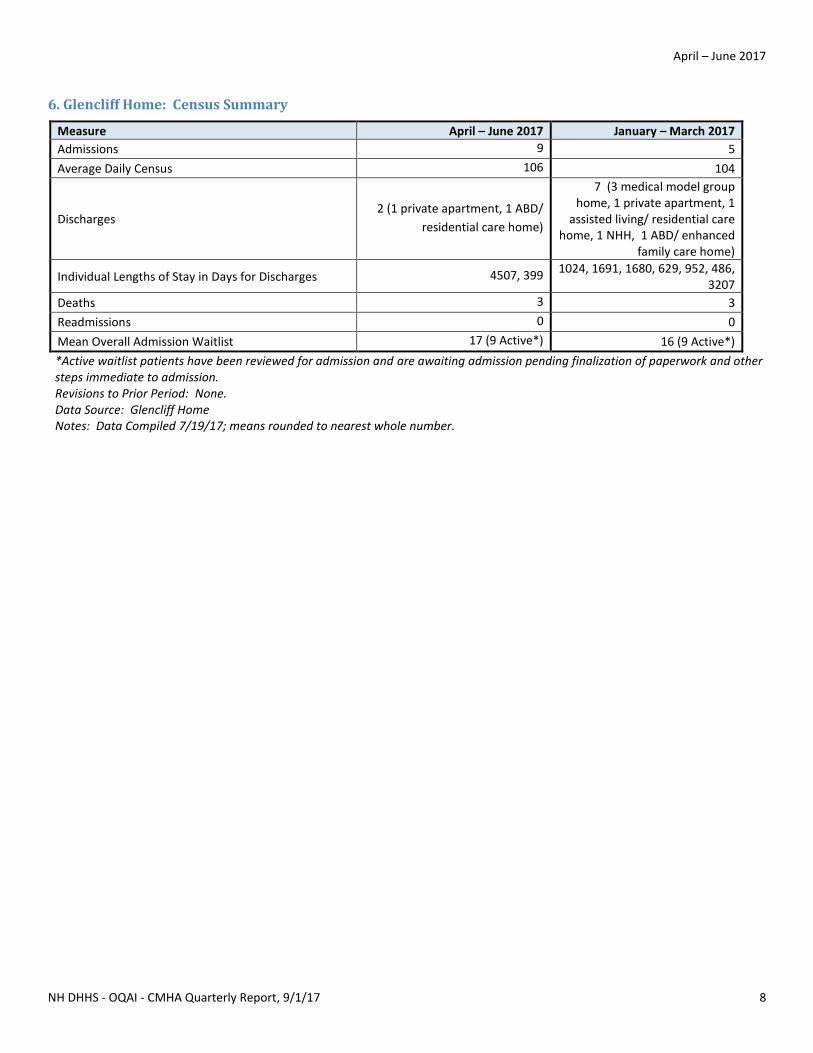
6. Glencliff Home: Census Summary
Measure April – June 2017 January – March 2017
Admissions 9 5
Average Daily Census 106 104
Discharges 2 (1 private apartment, 1 ABD/
residential care home)
7 (3 medical model group home, 1 private apartment, 1
assisted living/ residential care home, 1 NHH, 1 ABD/ enhanced
family care home)
Individual Lengths of Stay in Days for Discharges 4507, 399 1024, 1691, 1680, 629, 952, 486, 3207
Deaths 3 3
Readmissions 0 0
Mean Overall Admission Waitlist 17 (9 Active*) 16 (9 Active*)
*Active waitlist patients have been reviewed for admission and are awaiting admission pending finalization of paperwork and other steps immediate to admission. Revisions to Prior Period: None. Data Source: Glencliff Home Notes: Data Compiled 7/19/17; means rounded to nearest whole number.
April – June 2017
NH DHHS - OQAI - CMHA Quarterly Report, 9/1/17 9
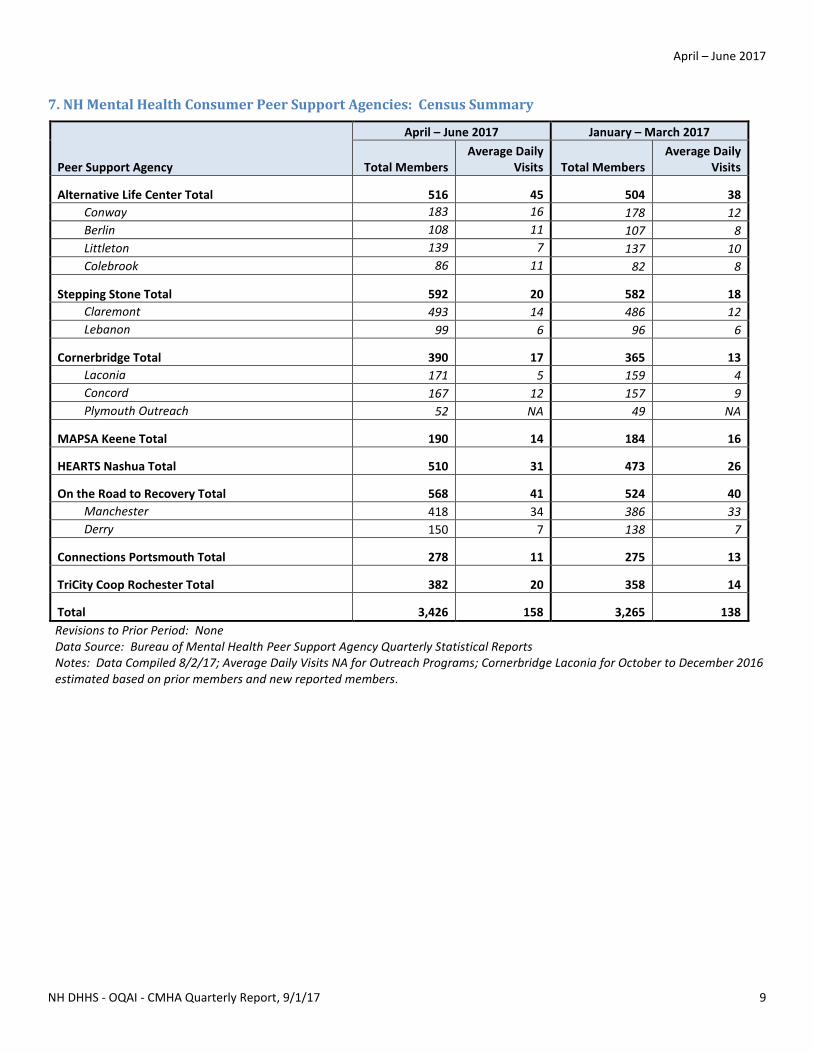
7. NH Mental Health Consumer Peer Support Agencies: Census Summary
Peer Support Agency
April – June 2017 January – March 2017
Total Members Average Daily
Visits Total Members Average Daily
Visits
Alternative Life Center Total 516 45 504 38
Conway 183 16 178 12
Berlin 108 11 107 8
Littleton 139 7 137 10
Colebrook 86 11 82 8
Stepping Stone Total 592 20 582 18
Claremont 493 14 486 12
Lebanon 99 6 96 6
Cornerbridge Total 390 17 365 13
Laconia 171 5 159 4
Concord 167 12 157 9
Plymouth Outreach 52 NA 49 NA
MAPSA Keene Total 190 14 184 16
HEARTS Nashua Total 510 31 473 26
On the Road to Recovery Total 568 41 524 40
Manchester 418 34 386 33
Derry 150 7 138 7
Connections Portsmouth Total 278 11 275 13
TriCity Coop Rochester Total 382 20 358 14
Total 3,426 158 3,265 138
Revisions to Prior Period: None Data Source: Bureau of Mental Health Peer Support Agency Quarterly Statistical Reports Notes: Data Compiled 8/2/17; Average Daily Visits NA for Outreach Programs; Cornerbridge Laconia for October to December 2016 estimated based on prior members and new reported members.
April – June 2017
NH DHHS - OQAI - CMHA Quarterly Report, 9/1/17 10
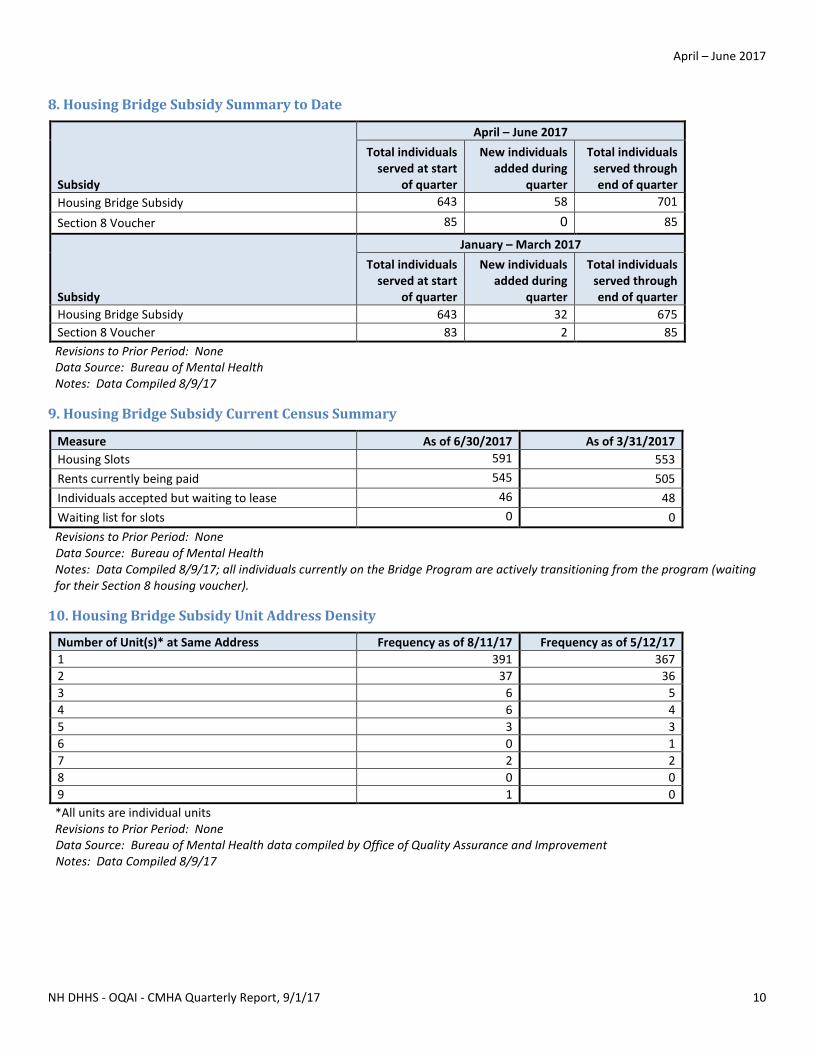
8. Housing Bridge Subsidy Summary to Date
Subsidy
April – June 2017
Total individuals served at start
of quarter
New individuals added during
quarter
Total individuals served through end of quarter
Housing Bridge Subsidy 643 58 701
Section 8 Voucher 85 0 85
Subsidy
January – March 2017
Total individuals served at start
of quarter
New individuals added during
quarter
Total individuals served through end of quarter
Housing Bridge Subsidy 643 32 675 Section 8 Voucher 83 2 85
Revisions to Prior Period: None Data Source: Bureau of Mental Health Notes: Data Compiled 8/9/17
9. Housing Bridge Subsidy Current Census Summary
Measure As of 6/30/2017 As of 3/31/2017
Housing Slots 591 553
Rents currently being paid 545 505
Individuals accepted but waiting to lease 46 48
Waiting list for slots 0 0
Revisions to Prior Period: None Data Source: Bureau of Mental Health Notes: Data Compiled 8/9/17; all individuals currently on the Bridge Program are actively transitioning from the program (waiting for their Section 8 housing voucher).
10. Housing Bridge Subsidy Unit Address Density
Number of Unit(s)* at Same Address Frequency as of 8/11/17 Frequency as of 5/12/17
1 391 367 2 37 36 3 6 5 4 6 4 5 3 3 6 0 1
7 2 2
8 0 0 9 1 0 *All units are individual units Revisions to Prior Period: None Data Source: Bureau of Mental Health data compiled by Office of Quality Assurance and Improvement Notes: Data Compiled 8/9/17
April – June 2017
NH DHHS - OQAI - CMHA Quarterly Report, 9/1/17 11
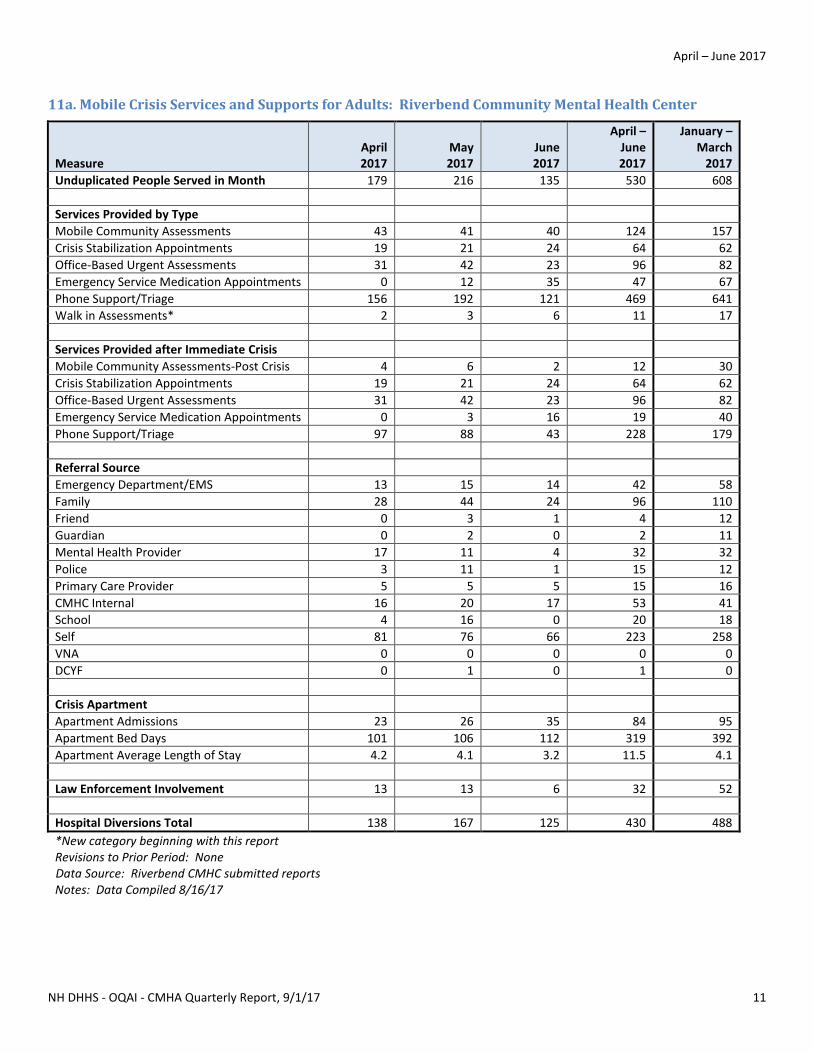
11a. Mobile Crisis Services and Supports for Adults: Riverbend Community Mental Health Center
Measure April
2017 May
2017 June 2017
April – June 2017
January – March
2017
Unduplicated People Served in Month 179 216 135 530 608
Services Provided by Type
Mobile Community Assessments 43 41 40 124 157
Crisis Stabilization Appointments 19 21 24 64 62
Office-Based Urgent Assessments 31 42 23 96 82
Emergency Service Medication Appointments 0 12 35 47 67
Phone Support/Triage 156 192 121 469 641
Walk in Assessments* 2 3 6 11 17
Services Provided after Immediate Crisis
Mobile Community Assessments-Post Crisis 4 6 2 12 30
Crisis Stabilization Appointments 19 21 24 64 62
Office-Based Urgent Assessments 31 42 23 96 82
Emergency Service Medication Appointments 0 3 16 19 40
Phone Support/Triage 97 88 43 228 179
Referral Source
Emergency Department/EMS 13 15 14 42 58
Family 28 44 24 96 110
Friend 0 3 1 4 12
Guardian 0 2 0 2 11
Mental Health Provider 17 11 4 32 32
Police 3 11 1 15 12
Primary Care Provider 5 5 5 15 16
CMHC Internal 16 20 17 53 41
School 4 16 0 20 18
Self 81 76 66 223 258
VNA 0 0 0 0 0
DCYF 0 1 0 1 0
Crisis Apartment
Apartment Admissions 23 26 35 84 95
Apartment Bed Days 101 106 112 319 392
Apartment Average Length of Stay 4.2 4.1 3.2 11.5 4.1
Law Enforcement Involvement 13 13 6 32 52
Hospital Diversions Total 138 167 125 430 488
*New category beginning with this report Revisions to Prior Period: None Data Source: Riverbend CMHC submitted reports Notes: Data Compiled 8/16/17
April – June 2017
NH DHHS - OQAI - CMHA Quarterly Report, 9/1/17 12
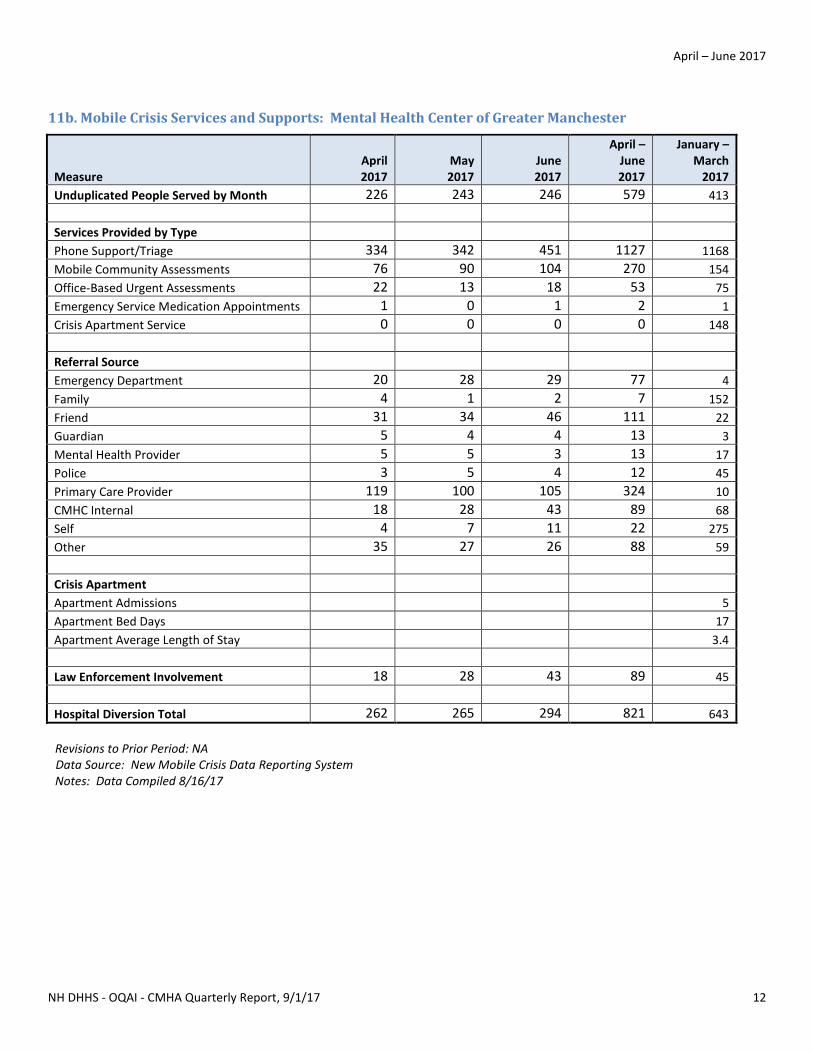
11b. Mobile Crisis Services and Supports: Mental Health Center of Greater Manchester
Measure April
2017 May
2017 June 2017
April – June 2017
January – March
2017
Unduplicated People Served by Month 226 243 246 579 413
Services Provided by Type
Phone Support/Triage 334 342 451 1127 1168
Mobile Community Assessments 76 90 104 270 154
Office-Based Urgent Assessments 22 13 18 53 75
Emergency Service Medication Appointments 1 0 1 2 1
Crisis Apartment Service 0 0 0 0 148
Referral Source
Emergency Department 20 28 29 77 4
Family 4 1 2 7 152
Friend 31 34 46 111 22
Guardian 5 4 4 13 3
Mental Health Provider 5 5 3 13 17
Police 3 5 4 12 45
Primary Care Provider 119 100 105 324 10
CMHC Internal 18 28 43 89 68
Self 4 7 11 22 275
Other 35 27 26 88 59
Crisis Apartment
Apartment Admissions 5
Apartment Bed Days 17
Apartment Average Length of Stay 3.4
Law Enforcement Involvement 18 28 43 89 45
Hospital Diversion Total 262 265 294 821 643
Revisions to Prior Period: NA Data Source: New Mobile Crisis Data Reporting System Notes: Data Compiled 8/16/17