Embed Size (px)
Citation preview

State of New HampshireChristopher T. Sununu, Governor
New Hampshire Employment SecurityGeorge N. Copadis, Commissioner
Economic and Labor Market Information BureauBruce R. DeMay, Director
June 2018
New Hampshire Employment Projections by Industry and
Occupation
base year 2016 to projected year 2026

New Hampshire Long-term Employment Projections — 2016 to 2026
Economic and Labor Market Information Bureau June 2018 New Hampshire Employment Security i www.nhes.gov/elmi/products/proj
Acknowledgements
The following New Hampshire Employment Security staff was instrumental in producing this publication and information posted on the Bureau website:
Economic and Labor Market Information Bureau
Michael Argiropolis, Labor Market Analyst Annette Nielsen, Economist Deborah Dunn, Informational/Website Representative Reproduction Services Mark Robinson, Supervisor of Reproduction
This workforce product was funded by a grant awarded by the U.S. Department of Labor’s Employment and Training Administration. The product was created by the grantee and does not necessarily reflect the official position of the U.S. Department of Labor. The Department of Labor makes no guarantees, warranties, or assurances of any kind, express or implied, with respect to such information, including any information on linked sites and including, but not limited to, accuracy of the information or its completeness, timeliness, usefulness, adequacy, continued availability, or ownership. This product is copyrighted by the institution that created it. Internal use by an organization and/or personal use by an individual for non-commercial purposes are permissible. All other uses require the prior authorization of the copyright owner.
New Hampshire Long-term Employment Projections — 2016 to 2026
Economic and Labor Market Information Bureau June 2018 New Hampshire Employment Security ii www.nhes.gov/elmi/products/proj
Table of Contents
Projections Highlights ........................................................................................ 1
Projections Methodology: Annual Job Openings ................................................ 4
Occupational Outlook Indicators........................................................................ 6
Entry-Level Education, Work Experience, and Post-Hire Training ...................... 7
Occupational Projections ................................................................................... 8
Industry Projections ......................................................................................... 29
New Hampshire Long-term Employment Projections — 2016 to 2026
Economic and Labor Market Information Bureau June 2018 New Hampshire Employment Security iii www.nhes.gov/elmi/products/proj
New Hampshire Long-term Employment Projections — 2016 to 2026
Economic and Labor Market Information Bureau June 2018 New Hampshire Employment Security 1 www.nhes.gov/elmi/products/proj
Projections Highlights
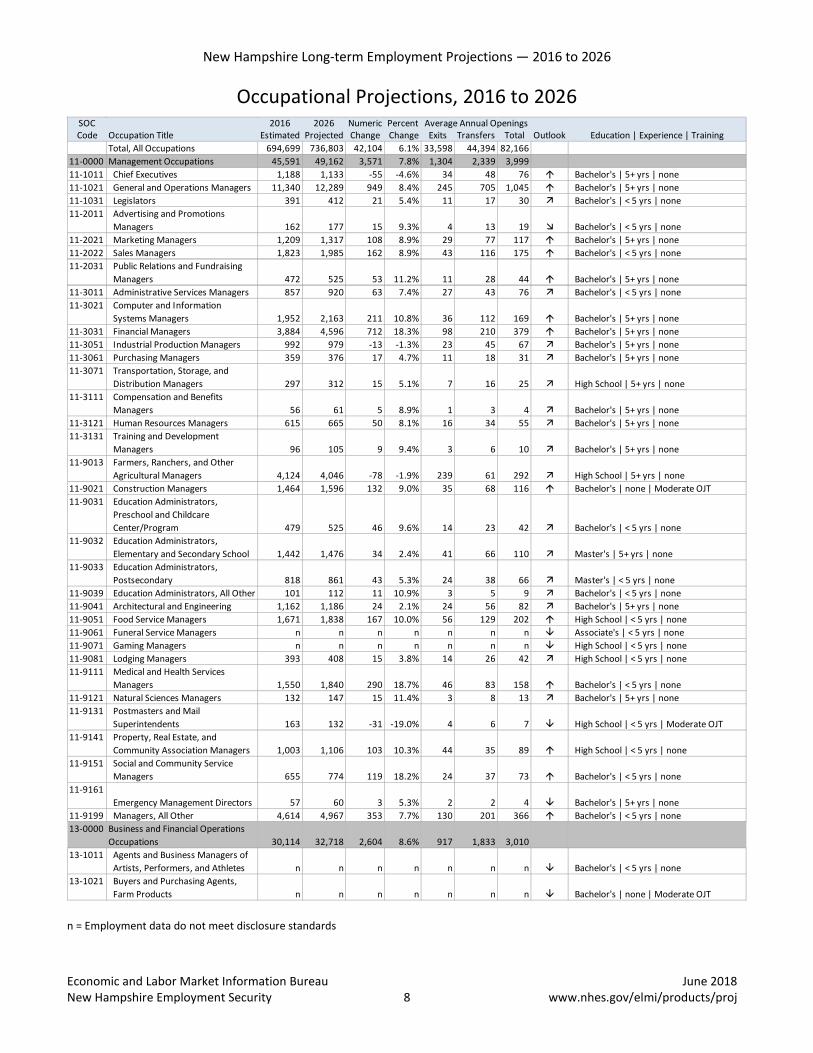
Over the ten-year period from 2016 to 2026, total employment in New Hampshire is expected to grow by 6.1 percent. Estimated employment is expected to increase from 694,699 to 736,803, a gain of 42,104 jobs. Annually, 82,166 job openings are projected, from a combination of new job growth, labor force exits, and occupational transfers.1
• Projected employment gains by industry sector will be the highest in the Healthcare and social assistance sector, an increase of 14,189 jobs by 2026. This sector is expected to contribute roughly one-third of total new jobs. The Accommodation and food services sector is projected to add 4,854 jobs, and the Professional, Scientific, and technical services sector is projected to add 4,634 jobs over the decade.
• The Healthcare and social assistance sector is expected to grow the fastest, with employment increasing by 15.7 percent by 2026; followed by the Professional, Scientific, and technical services sector, with an employment gain of 13.7 percent.
• Employment in all but one of the 22 major occupational groups is projected to increase, led by Healthcare practitioners and technical occupations, adding 5,700 jobs, and Food preparation and serving related occupations, adding 5,300 jobs between 2016 and 2026. The only group projected to decline is Production Occupations, with 2,500 fewer jobs.
• Personal care and service occupations are projected to be the fastest-growing major occupational group, with employment gains of 17.6 percent overall. Healthcare support occupations are also expected to grow rapidly, at 15.5 percent.
• The largest number of annual job openings is expected for Sales and related occupations and Office and administrative support occupations. About 12,500 annual job openings are expected for each of these major occupational groups.
• Occupations with the largest number of projected annual job openings are Cashiers (4,100 openings), Retail salespersons (3,900 openings), and Combined food preparation and serving workers (2,700 openings).
1 See page 4 for a detailed explanation of labor force exits and occupational transfers.

New Hampshire Long-term Employment Projections — 2016 to 2026
Economic and Labor Market Information Bureau June 2018 New Hampshire Employment Security 2 www.nhes.gov/elmi/products/proj
• Personal care aides help people with disabilities, the elderly, or convalescents with activities of daily living, either in their own home or in a care facility. About eight out of every ten of these workers are employed in the Healthcare and social assistance sector. Others are employed by Private households, or are Self-employed.
• Combined food preparation and serving workers perform both food preparation duties and serve customers. About two-thirds of these workers are employed in Food services and drinking places, but may also work in Food and beverage stores, Amusement, gambling, and recreation, Elementary and secondary schools, Food manufacturing, or Hospitals.
• A growing Healthcare and social assistance sector will fuel high demand for Registered nurses. While over half of Registered nurses are employed in Hospitals, they also are in demand by Ambulatory healthcare services, Nursing and residential care facilities, Educational services, Insurance carriers, and Government.
2,589
1,965
1,853
1,454
1,089
964
949
931
804
782
712
694
634
622
584
Personal Care Aides
Combined Food Prep and Serving Workers
Registered Nurses
Software Developers, Applications
Waiters and Waitresses
Nursing Assistants
General and Operations Managers
Retail Salespersons
Stock Clerks and Order Fillers
Cooks, Restaurant
Financial Managers
Janitors and Cleaners,
Sales Reps, Wholesale/Manufacturing, Ex.Tech/Scientific…
Medical Assistants
Landscaping and Groundskeeping Workers
Most New Jobs, 2016 to 2026
New Hampshire Long-term Employment Projections — 2016 to 2026
Economic and Labor Market Information Bureau June 2018 New Hampshire Employment Security 3 www.nhes.gov/elmi/products/proj
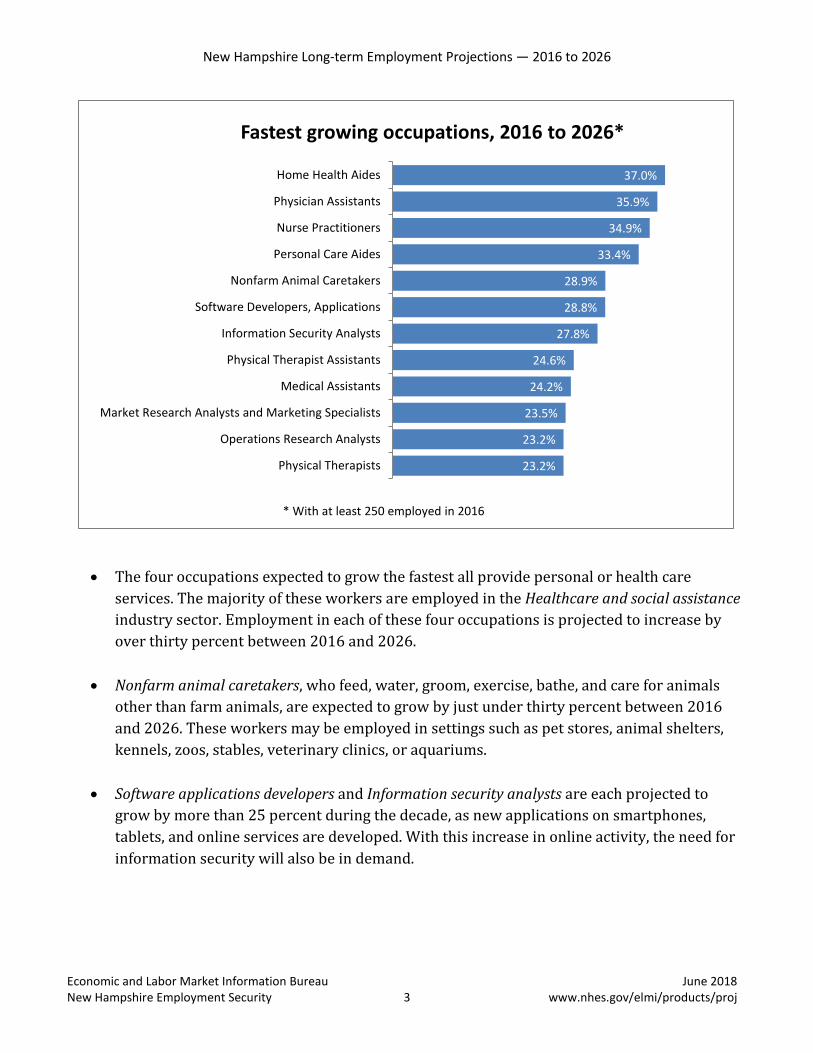
• The four occupations expected to grow the fastest all provide personal or health care
services. The majority of these workers are employed in the Healthcare and social assistance industry sector. Employment in each of these four occupations is projected to increase by over thirty percent between 2016 and 2026.
• Nonfarm animal caretakers, who feed, water, groom, exercise, bathe, and care for animals other than farm animals, are expected to grow by just under thirty percent between 2016 and 2026. These workers may be employed in settings such as pet stores, animal shelters, kennels, zoos, stables, veterinary clinics, or aquariums.
• Software applications developers and Information security analysts are each projected to grow by more than 25 percent during the decade, as new applications on smartphones, tablets, and online services are developed. With this increase in online activity, the need for information security will also be in demand.
37.0%
35.9%
34.9%
33.4%
28.9%
28.8%
27.8%
24.6%
24.2%
23.5%
23.2%
23.2%
Home Health Aides
Physician Assistants
Nurse Practitioners
Personal Care Aides
Nonfarm Animal Caretakers
Software Developers, Applications
Information Security Analysts
Physical Therapist Assistants
Medical Assistants
Market Research Analysts and Marketing Specialists
Operations Research Analysts
Physical Therapists
Fastest growing occupations, 2016 to 2026*
* With at least 250 employed in 2016
New Hampshire Long-term Employment Projections — 2016 to 2026
Economic and Labor Market Information Bureau June 2018 New Hampshire Employment Security 4 www.nhes.gov/elmi/products/proj
Projections Methodology: Annual Job Openings
After years of research, the U.S. Bureau of Labor Statistics has developed a new methodology for estimating annual job openings that better reflects the changing workforce in the twenty-first century. This new methodology changes the way job openings are estimated, recognizing that an individual may have several career changes throughout the course of their working life.
At first glance, users familiar with employment projections will notice that the latest values for projected openings are significantly higher than in past projections. The new methodology provides a better estimate of the labor market dynamics.
National separation rates, calculated by the U.S. Bureau of Labor Statistics, are used to estimate separations on a statewide basis, which are the number of workers in New Hampshire projected to leave an occupation to retire or some other reason, or to transfer to a different occupation. Separation rates are used to estimates the number of workers who permanently leave an occupation and need to be replaced by a new entrant into the occupation. This is not a measure of movement within an occupation, referred to as “turnover.” An example of turnover is a Cashier leaving one retail establishment to take a job at another. The Bureau of Labor Statistics defines permanent as exiting the labor force for four consecutive months or transferring to another occupational group within the Standard Occupational Classification (SOC) system.
Labor force exits are defined as workers that leave the workforce entirely to go to school, start a family, or retire, for example. Occupational transfers are defined as workers that leave one occupation to become employed in some other occupation in a different occupational group, due to promotion or simply a job change.
Total projected annual job openings are the combination of labor force exits, occupational transfers, and openings created from growth. As a worker departs a position, whether to exit the labor force or to change occupations, a job opening is created. Job openings are also created from new growth, which is simply the annualized difference between base year employment and projected employment. Growth occurs when there is demand for workers in an occupation, often due to increased demand for products and services produced by the industries that employ those workers. Growth for an occupation can be negative, such as when changes in technology result in fewer workers needed to achieve the same level of labor productivity.
There is no specific connection between occupational employment growth and the number of workers leaving an occupation.2 On the other hand, the number of job openings projected for a specific occupation is correlated with the number of individuals currently employed in the
2 Occupational Separations Methodology Frequently Asked Questions. U.S. Bureau of Labor Statistics.
www.bls.gov/emp/ep_separations_faqs.htm

New Hampshire Long-term Employment Projections — 2016 to 2026
Economic and Labor Market Information Bureau June 2018 New Hampshire Employment Security 5 www.nhes.gov/elmi/products/proj
occupation. Occupations with higher estimated employment usually have a large number of annual job openings, while occupations with fewer workers are expected to have a much lower number of annual job openings.
Some of the advantages of the new methodology are that it makes a distinction between the volume of workers who will be exiting the workforce as the baby boomer generation ages into retirement and workers who change careers and move from one occupation to another.
Projected job openings for an occupation should not be viewed as a precise estimate of the number of expected openings but more as a general guide to the magnitude of job openings in comparison to other occupations. In addition, long–term projections for prior periods should not be used as a comparison to determine how occupational demand has changed over time.
New Hampshire Long-term Employment Projections — 2016 to 2026
Economic and Labor Market Information Bureau June 2018 New Hampshire Employment Security 6 www.nhes.gov/elmi/products/proj
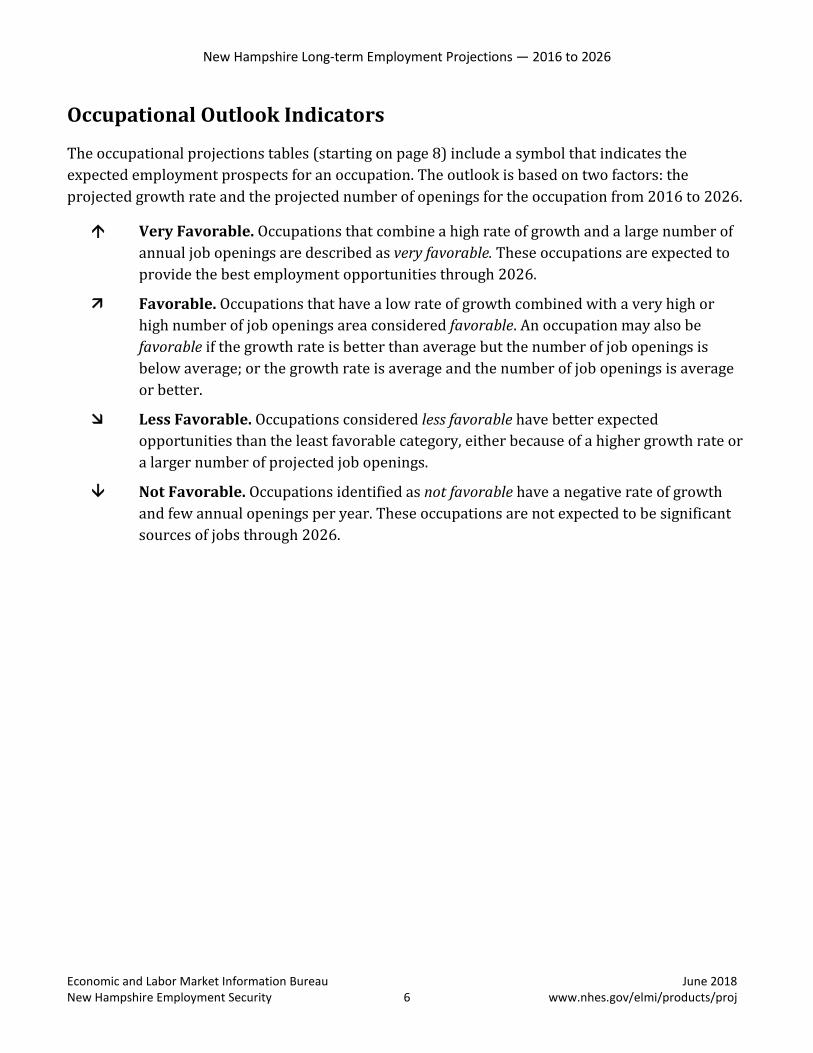
Occupational Outlook Indicators
The occupational projections tables (starting on page 8) include a symbol that indicates the expected employment prospects for an occupation. The outlook is based on two factors: the projected growth rate and the projected number of openings for the occupation from 2016 to 2026.
Very Favorable. Occupations that combine a high rate of growth and a large number of annual job openings are described as very favorable. These occupations are expected to provide the best employment opportunities through 2026.
Favorable. Occupations that have a low rate of growth combined with a very high or high number of job openings area considered favorable. An occupation may also be favorable if the growth rate is better than average but the number of job openings is below average; or the growth rate is average and the number of job openings is average or better.
Less Favorable. Occupations considered less favorable have better expected opportunities than the least favorable category, either because of a higher growth rate or a larger number of projected job openings.
Not Favorable. Occupations identified as not favorable have a negative rate of growth and few annual openings per year. These occupations are not expected to be significant sources of jobs through 2026.

New Hampshire Long-term Employment Projections — 2016 to 2026
Economic and Labor Market Information Bureau June 2018 New Hampshire Employment Security 7 www.nhes.gov/elmi/products/proj
Entry-Level Education, Work Experience, and Post-Hire Training
For each occupation, the typical education, related work experience, and post-hire training expected of entry-level workers have been identified. The first two categories show the educational attainment and work experience in a related occupation expected before an individual is employed. The last category refers to on-the-job training, apprenticeship, internship, or residency typically conducted after employment. Educational Attainment
These categories indicate the typical level of education most workers need for an entry-level position in the occupation:
• Doctoral (PhD) or professional degree (i.e., MD, DD, JD, DC) • Master’s degree (i.e., MA, MS, MEd) • Bachelor’s degree (i.e., BS, BA, BFA) • Associate’s degree (i.e., AS, AA) • Postsecondary non-degree award (program completion, i.e., CNA, cosmetologist) • Some college, no degree • High school diploma or equivalent (GED) • No formal educational credential
Work Experience
Some occupations require work experience in a related occupation as an entry-level qualification. Frequently, these occupations are managerial or supervisory positions, where the worker performs the same job tasks as the workers under their supervision, such as Retail supervisors, Marketing managers, or Construction managers. Non-supervisory workers may also have an experience requirement, such as Restaurant cooks or Industrial truck and tractor operators. The work experience categories are: less than five years, five years or more, or none. Post-Hire Training
This category identifies additional training or preparation typically needed to gain competency in the occupation once the worker is employed. This type of training is occupation-specific, not job-specific, meaning skills can be transferred to another job in the same occupation. The job training categories are:
• Internship or residency • Apprenticeship • Long-term on-the-job training (over 12 months) • Moderate-term on-the-job training (one to 12 months) • Short-term on-the-job training (one month or less of informal training) • None
New Hampshire Long-term Employment Projections — 2016 to 2026
Economic and Labor Market Information Bureau June 2018 New Hampshire Employment Security 8 www.nhes.gov/elmi/products/proj
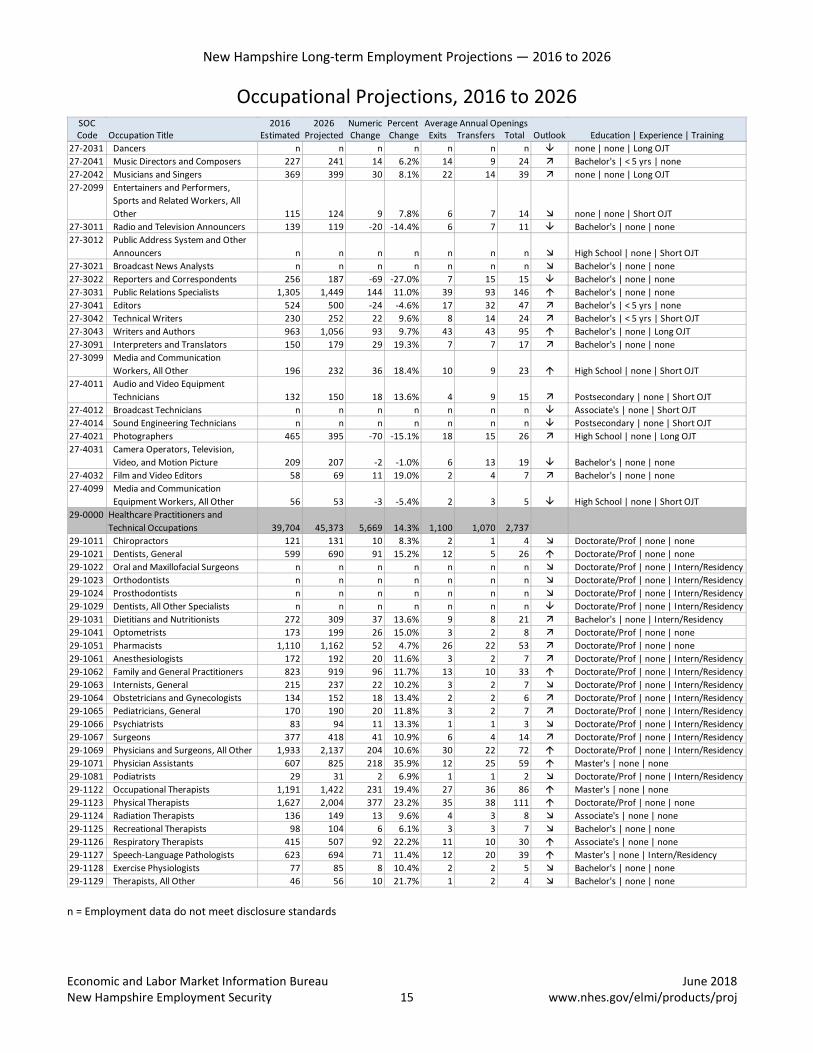
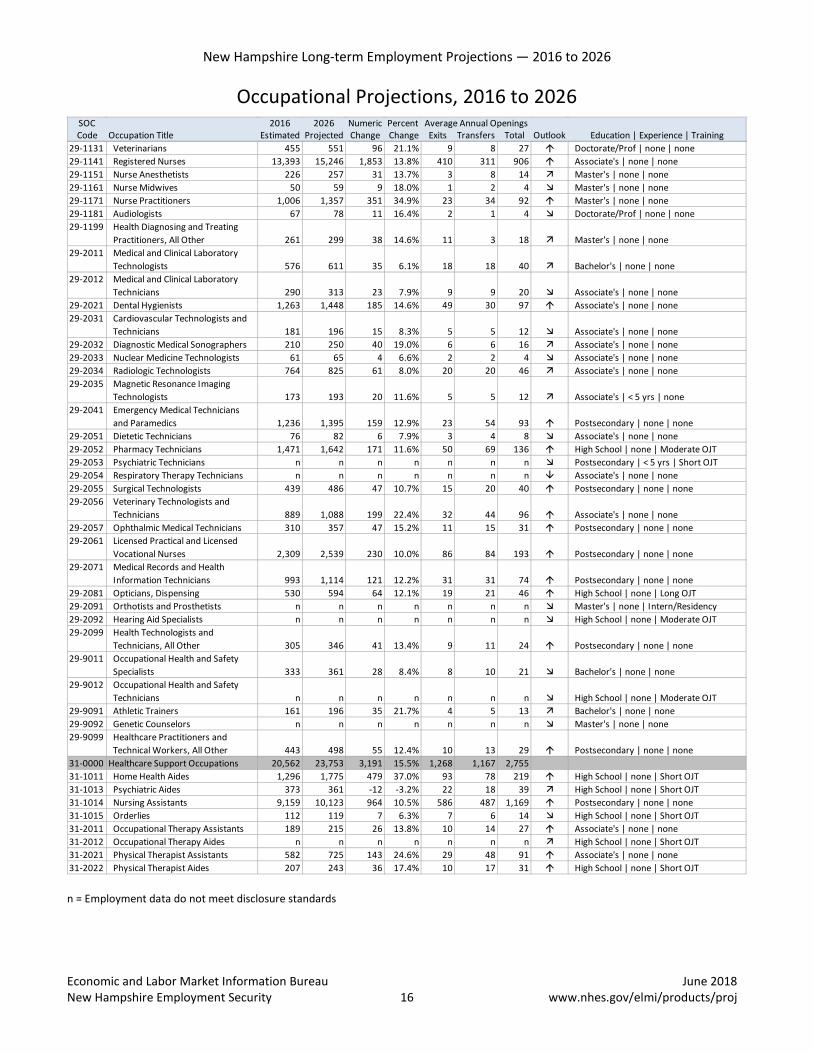
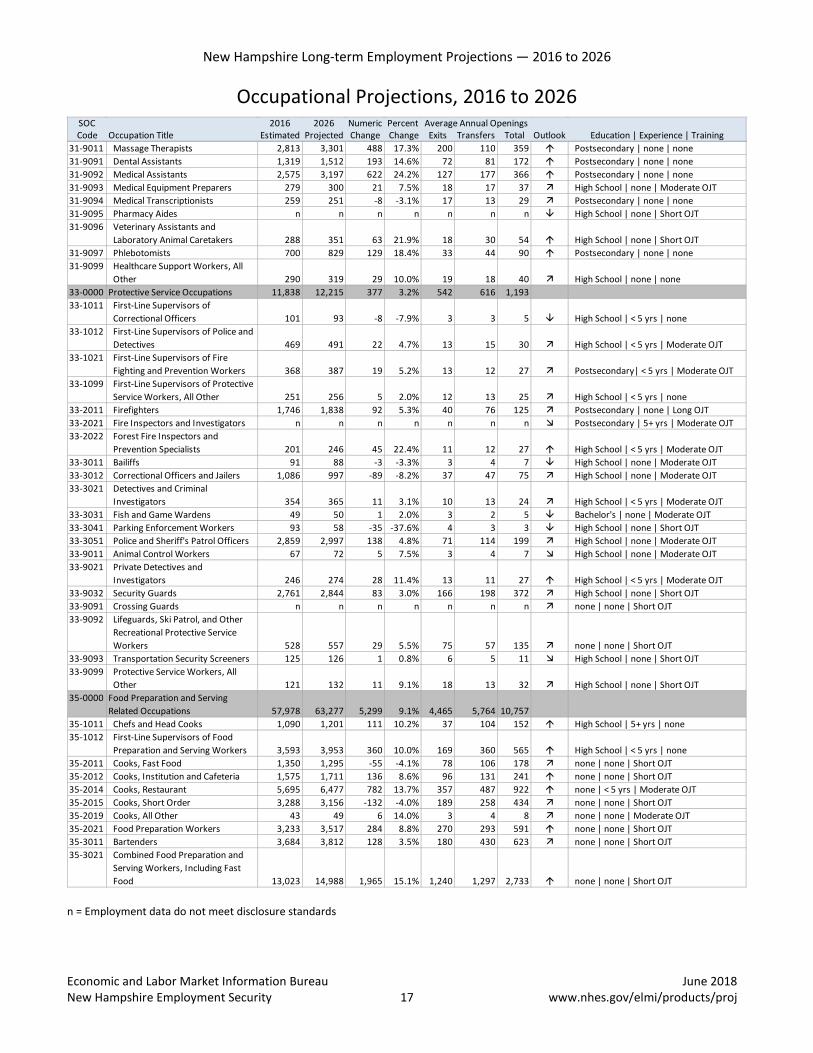
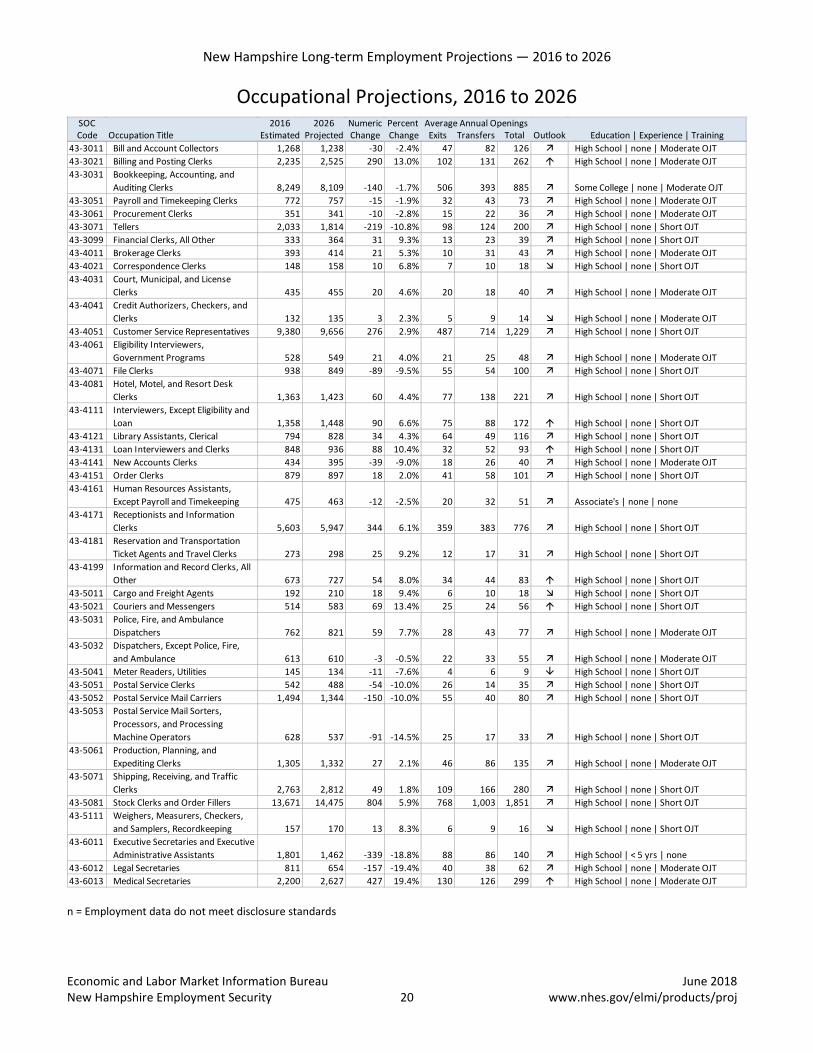
Occupational Projections, 2016 to 2026
n = Employment data do not meet disclosure standards
SOC 2016 2026 Numeric PercentCode Occupation Title Estimated Projected Change Change Exits Transfers Total Outlook Education | Experience | Training
Total, All Occupations 694,699 736,803 42,104 6.1% 33,598 44,394 82,16611-0000 Management Occupations 45,591 49,162 3,571 7.8% 1,304 2,339 3,99911-1011 Chief Executives 1,188 1,133 -55 -4.6% 34 48 76 Bachelor's | 5+ yrs | none11-1021 General and Operations Managers 11,340 12,289 949 8.4% 245 705 1,045 Bachelor's | 5+ yrs | none11-1031 Legislators 391 412 21 5.4% 11 17 30 Bachelor's | < 5 yrs | none11-2011 Advertising and Promotions
Managers 162 177 15 9.3% 4 13 19 Bachelor's | < 5 yrs | none11-2021 Marketing Managers 1,209 1,317 108 8.9% 29 77 117 Bachelor's | 5+ yrs | none11-2022 Sales Managers 1,823 1,985 162 8.9% 43 116 175 Bachelor's | < 5 yrs | none
Average Annual Openings
11-2031 Public Relations and Fundraising Managers 472 525 53 11.2% 11 28 44 Bachelor's | 5+ yrs | none
11-3011 Administrative Services Managers 857 920 63 7.4% 27 43 76 Bachelor's | < 5 yrs | none11-3021 Computer and Information
Systems Managers 1,952 2,163 211 10.8% 36 112 169 Bachelor's | 5+ yrs | none11-3031 Financial Managers 3,884 4,596 712 18.3% 98 210 379 Bachelor's | 5+ yrs | none11-3051 Industrial Production Managers 992 979 -13 -1.3% 23 45 67 Bachelor's | 5+ yrs | none11-3061 Purchasing Managers 359 376 17 4.7% 11 18 31 Bachelor's | 5+ yrs | none11-3071 Transportation, Storage, and
Distribution Managers 297 312 15 5.1% 7 16 25 High School | 5+ yrs | none11-3111 Compensation and Benefits
Managers 56 61 5 8.9% 1 3 4 Bachelor's | 5+ yrs | none11-3121 Human Resources Managers 615 665 50 8.1% 16 34 55 Bachelor's | 5+ yrs | none11-3131 Training and Development
Managers 96 105 9 9.4% 3 6 10 Bachelor's | 5+ yrs | none11-9013 Farmers, Ranchers, and Other
Agricultural Managers 4,124 4,046 -78 -1.9% 239 61 292 High School | 5+ yrs | none11-9021 Construction Managers 1,464 1,596 132 9.0% 35 68 116 Bachelor's | none | Moderate OJT11-9031 Education Administrators,
Preschool and Childcare Center/Program 479 525 46 9.6% 14 23 42 Bachelor's | < 5 yrs | none
11-9032 Education Administrators, Elementary and Secondary School 1,442 1,476 34 2.4% 41 66 110 Master's | 5+ yrs | none
11-9033 Education Administrators, Postsecondary 818 861 43 5.3% 24 38 66 Master's | < 5 yrs | none
11-9039 Education Administrators, All Other 101 112 11 10.9% 3 5 9 Bachelor's | < 5 yrs | none11-9041 Architectural and Engineering 1,162 1,186 24 2.1% 24 56 82 Bachelor's | 5+ yrs | none11-9051 Food Service Managers 1,671 1,838 167 10.0% 56 129 202 High School | < 5 yrs | none11-9061 Funeral Service Managers n n n n n n n Associate's | < 5 yrs | none11-9071 Gaming Managers n n n n n n n High School | < 5 yrs | none11-9081 Lodging Managers 393 408 15 3.8% 14 26 42 High School | < 5 yrs | none11-9111 Medical and Health Services
Managers 1,550 1,840 290 18.7% 46 83 158 Bachelor's | < 5 yrs | none11-9121 Natural Sciences Managers 132 147 15 11.4% 3 8 13 Bachelor's | 5+ yrs | none11-9131 Postmasters and Mail
Superintendents 163 132 -31 -19.0% 4 6 7 High School | < 5 yrs | Moderate OJT11-9141 Property, Real Estate, and
Community Association Managers 1,003 1,106 103 10.3% 44 35 89 High School | < 5 yrs | none11-9151 Social and Community Service
Managers 655 774 119 18.2% 24 37 73 Bachelor's | < 5 yrs | none11-9161
Emergency Management Directors 57 60 3 5.3% 2 2 4 Bachelor's | 5+ yrs | none11-9199 Managers, All Other 4,614 4,967 353 7.7% 130 201 366 Bachelor's | < 5 yrs | none13-0000 Business and Financial Operations
Occupations 30,114 32,718 2,604 8.6% 917 1,833 3,01013-1011 Agents and Business Managers of
Artists, Performers, and Athletes n n n n n n n Bachelor's | < 5 yrs | none13-1021 Buyers and Purchasing Agents,
Farm Products n n n n n n n Bachelor's | none | Moderate OJT

New Hampshire Long-term Employment Projections — 2016 to 2026
Economic and Labor Market Information Bureau June 2018 New Hampshire Employment Security 9 www.nhes.gov/elmi/products/proj
Occupational Projections, 2016 to 2026
n = Employment data do not meet disclosure standards
SOC 2016 2026 Numeric PercentCode Occupation Title Estimated Projected Change Change Exits Transfers Total Outlook Education | Experience | Training
Average Annual Openings
13-1022 Wholesale and Retail Buyers, Except Farm Products 536 541 5 0.9% 21 39 60 Bachelor's | none | Moderate OJT
13-1023 Purchasing Agents, Except Wholesale, Retail, and Farm Products 1,487 1,383 -104 -7.0% 43 79 112 Bachelor's | none | Moderate OJT
13-1031 Claims Adjusters, Examiners, and Investigators 1,619 1,588 -31 -1.9% 40 89 126 High School | none | Long OJT
13-1032 Insurance Appraisers, Auto Damage 58 60 2 3.4% 2 3 5 Postsecondary | none | Moderate OJT
13-1041 Compliance Officers 1,234 1,325 91 7.4% 36 64 109 Bachelor's | none | Moderate OJT13-1051 Cost Estimators 812 888 76 9.4% 27 55 90 Bachelor's | none | Moderate OJT13-1071 Human Resources Specialists 2,364 2,486 122 5.2% 70 159 241 Bachelor's | none | none13-1075 Labor Relations Specialists 229 212 -17 -7.4% 6 14 18 Bachelor's | < 5 yrs | none13-1081 Logisticians 464 499 35 7.5% 12 34 50 Bachelor's | none | none13-1111 Management Analysts 2,267 2,614 347 15.3% 78 126 239 Bachelor's | < 5 yrs | none13-1121 Meeting, Convention, and Event
Planners 454 487 33 7.3% 18 35 56 Bachelor's | none | none13-1131 Fundraisers 605 695 90 14.9% 20 43 72 Bachelor's | none | none13-1141 Compensation, Benefits, and Job
Analysis Specialists 250 262 12 4.8% 6 14 21 Bachelor's | < 5 yrs | none13-1151 Training and Development
Specialists 1,073 1,190 117 10.9% 35 73 120 Bachelor's | < 5 yrs | none13-1161 Market Research Analysts and
Marketing Specialists 1,991 2,458 467 23.5% 59 153 259 Bachelor's | none | none13-1199 Business Operations Specialists, All
Other 3,713 4,016 303 8.2% 121 223 374 Bachelor's | none | none13-2011 Accountants and Auditors 5,199 5,705 506 9.7% 161 314 526 Bachelor's | none | none13-2021 Appraisers and Assessors of Real
Estate 278 308 30 10.8% 10 8 21 Bachelor's | none | Long OJT13-2031 Budget Analysts 87 92 5 5.7% 2 4 6 Bachelor's | none | none13-2041 Credit Analysts 154 166 12 7.8% 4 9 14 Bachelor's | none | none13-2051 Financial Analysts n n n n n n n Bachelor's | none | none13-2052 Personal Financial Advisors 901 1,044 143 15.9% 24 48 86 Bachelor's | none | Long OJT13-2053 Insurance Underwriters 370 342 -28 -7.6% 9 19 25 Bachelor's | none | Moderate OJT13-2061 Financial Examiners 180 188 8 4.4% 5 8 14 Bachelor's | none | Long OJT13-2071 Credit Counselors 259 288 29 11.2% 7 15 25 Bachelor's | none | Moderate OJT13-2072 Loan Officers 1,108 1,217 109 9.8% 28 64 103 Bachelor's | none | Moderate OJT13-2081 Tax Examiners and Collectors, and
Revenue Agents 325 331 6 1.8% 10 13 24 Bachelor's | none | Moderate OJT13-2082 Tax Preparers 334 373 39 11.7% 19 18 41 High School | none | Moderate OJT13-2099 Financial Specialists, All Other 554 616 62 11.2% 18 30 54 Bachelor's | none | Moderate OJT15-0000 Computer and Mathematical
Occupations 18,999 21,466 2,467 13.0% 332 964 1,54115-1111 Computer and Information
Research Scientists 172 185 13 7.6% 2 9 12 Master's | none | none15-1121 Computer Systems Analysts 2,374 2,488 114 4.8% 44 108 163 Bachelor's | none | none15-1122 Information Security Analysts 367 469 102 27.8% 7 20 37 Bachelor's | < 5 yrs | none15-1131 Computer Programmers 1,559 1,475 -84 -5.4% 26 68 86 Bachelor's | none | none15-1132 Software Developers, Applications 5,045 6,499 1,454 28.8% 79 283 507 Bachelor's | none | none15-1133 Software Developers, Systems 1,443 1,498 55 3.8% 20 72 98 Bachelor's | none | none15-1134 Web Developers 703 808 105 14.9% 14 38 62 Associate's | none | none15-1141 Database Administrators 446 498 52 11.7% 10 20 35 Bachelor's | none | none15-1142 Network and Computer Systems
Administrators 1,952 2,009 57 2.9% 28 93 127 Bachelor's | none | none15-1143 Computer Network Architects 375 389 14 3.7% 5 19 25 Bachelor's | 5+ yrs | none15-1151 Computer User Support Specialists 2,516 2,768 252 10.0% 54 136 215 Some College | none | none15-1152 Computer Network Support
Specialists 422 453 31 7.3% 9 22 34 Associate's | none | none
New Hampshire Long-term Employment Projections — 2016 to 2026
Economic and Labor Market Information Bureau June 2018 New Hampshire Employment Security 10 www.nhes.gov/elmi/products/proj
Occupational Projections, 2016 to 2026
n = Employment data do not meet disclosure standards
SOC 2016 2026 Numeric PercentCode Occupation Title Estimated Projected Change Change Exits Transfers Total Outlook Education | Experience | Training
Average Annual Openings
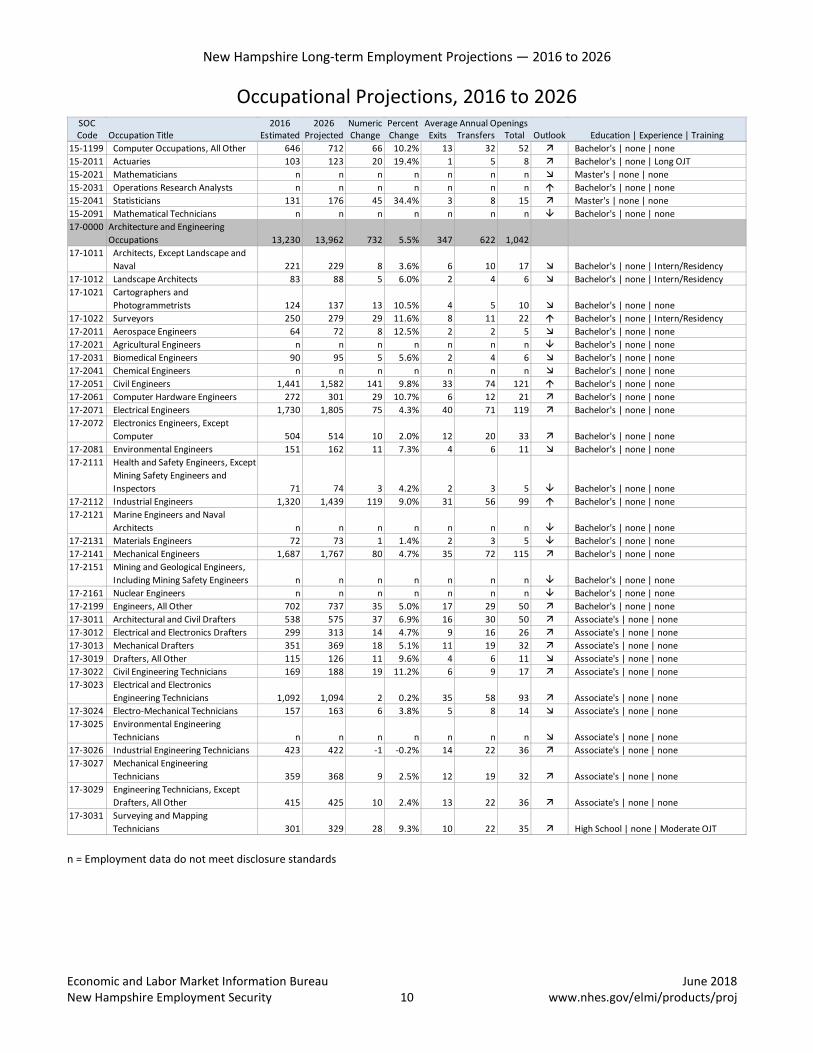
15-1199 Computer Occupations, All Other 646 712 66 10.2% 13 32 52 Bachelor's | none | none15-2011 Actuaries 103 123 20 19.4% 1 5 8 Bachelor's | none | Long OJT15-2021 Mathematicians n n n n n n n Master's | none | none15-2031 Operations Research Analysts n n n n n n n Bachelor's | none | none15-2041 Statisticians 131 176 45 34.4% 3 8 15 Master's | none | none15-2091 Mathematical Technicians n n n n n n n Bachelor's | none | none17-0000 Architecture and Engineering
Occupations 13,230 13,962 732 5.5% 347 622 1,04217-1011 Architects, Except Landscape and
Naval 221 229 8 3.6% 6 10 17 Bachelor's | none | Intern/Residency17-1012 Landscape Architects 83 88 5 6.0% 2 4 6 Bachelor's | none | Intern/Residency17-1021 Cartographers and
Photogrammetrists 124 137 13 10.5% 4 5 10 Bachelor's | none | none17-1022 Surveyors 250 279 29 11.6% 8 11 22 Bachelor's | none | Intern/Residency17-2011 Aerospace Engineers 64 72 8 12.5% 2 2 5 Bachelor's | none | none17-2021 Agricultural Engineers n n n n n n n Bachelor's | none | none17-2031 Biomedical Engineers 90 95 5 5.6% 2 4 6 Bachelor's | none | none17-2041 Chemical Engineers n n n n n n n Bachelor's | none | none17-2051 Civil Engineers 1,441 1,582 141 9.8% 33 74 121 Bachelor's | none | none17-2061 Computer Hardware Engineers 272 301 29 10.7% 6 12 21 Bachelor's | none | none17-2071 Electrical Engineers 1,730 1,805 75 4.3% 40 71 119 Bachelor's | none | none17-2072 Electronics Engineers, Except
Computer 504 514 10 2.0% 12 20 33 Bachelor's | none | none17-2081 Environmental Engineers 151 162 11 7.3% 4 6 11 Bachelor's | none | none17-2111 Health and Safety Engineers, Except
Mining Safety Engineers and Inspectors 71 74 3 4.2% 2 3 5 Bachelor's | none | none
17-2112 Industrial Engineers 1,320 1,439 119 9.0% 31 56 99 Bachelor's | none | none17-2121 Marine Engineers and Naval
Architects n n n n n n n Bachelor's | none | none17-2131 Materials Engineers 72 73 1 1.4% 2 3 5 Bachelor's | none | none17-2141 Mechanical Engineers 1,687 1,767 80 4.7% 35 72 115 Bachelor's | none | none17-2151 Mining and Geological Engineers,
Including Mining Safety Engineers n n n n n n n Bachelor's | none | none17-2161 Nuclear Engineers n n n n n n n Bachelor's | none | none17-2199 Engineers, All Other 702 737 35 5.0% 17 29 50 Bachelor's | none | none17-3011 Architectural and Civil Drafters 538 575 37 6.9% 16 30 50 Associate's | none | none17-3012 Electrical and Electronics Drafters 299 313 14 4.7% 9 16 26 Associate's | none | none17-3013 Mechanical Drafters 351 369 18 5.1% 11 19 32 Associate's | none | none17-3019 Drafters, All Other 115 126 11 9.6% 4 6 11 Associate's | none | none17-3022 Civil Engineering Technicians 169 188 19 11.2% 6 9 17 Associate's | none | none17-3023 Electrical and Electronics
Engineering Technicians 1,092 1,094 2 0.2% 35 58 93 Associate's | none | none17-3024 Electro-Mechanical Technicians 157 163 6 3.8% 5 8 14 Associate's | none | none17-3025 Environmental Engineering
Technicians n n n n n n n Associate's | none | none17-3026 Industrial Engineering Technicians 423 422 -1 -0.2% 14 22 36 Associate's | none | none17-3027 Mechanical Engineering
Technicians 359 368 9 2.5% 12 19 32 Associate's | none | none17-3029 Engineering Technicians, Except
Drafters, All Other 415 425 10 2.4% 13 22 36 Associate's | none | none17-3031 Surveying and Mapping
Technicians 301 329 28 9.3% 10 22 35 High School | none | Moderate OJT

New Hampshire Long-term Employment Projections — 2016 to 2026
Economic and Labor Market Information Bureau June 2018 New Hampshire Employment Security 11 www.nhes.gov/elmi/products/proj
Occupational Projections, 2016 to 2026
n = Employment data do not meet disclosure standards
SOC 2016 2026 Numeric PercentCode Occupation Title Estimated Projected Change Change Exits Transfers Total Outlook Education | Experience | Training
Average Annual Openings
19-0000 Life, Physical, and Social Science Occupations 4,363 4,737 374 8.6% 112 281 428
19-1011 Animal Scientists n n n n n n n Bachelor's | none | none19-1012 Food Scientists and Technologists n n n n n n n Bachelor's | none | none19-1013 Soil and Plant Scientists 29 32 3 10.3% 1 2 3 Bachelor's | none | none19-1021 Biochemists and Biophysicists 115 134 19 16.5% 2 8 12 Doctorate/Prof | none | none19-1022 Microbiologists 86 90 4 4.7% 2 6 8 Bachelor's | none | none19-1023 Zoologists and Wildlife Biologists 134 143 9 6.7% 3 9 13 Bachelor's | none | none19-1029 Biological Scientists, All Other 95 102 7 7.4% 2 6 9 Bachelor's | none | none19-1031 Conservation Scientists 53 57 4 7.5% 1 3 4 Bachelor's | none | none19-1032 Foresters 94 103 9 9.6% 2 6 9 Bachelor's | none | none19-1041 Epidemiologists n n n n n n n Master's | none | none19-1042 Medical Scientists, Except
Epidemiologists 375 411 36 9.6% 7 25 36 Doctorate/Prof | none | none19-1099 Life Scientists, All Other n n n n n n n Bachelor's | none | none19-2011 Astronomers n n n n n n n Doctorate/Prof | none | none19-2012 Physicists 76 81 5 6.6% 2 4 6 Doctorate/Prof | none | none19-2021 Atmospheric and Space Scientists 74 87 13 17.6% 2 4 7 Bachelor's | none | none19-2031 Chemists n n n n n n n Bachelor's | none | none19-2032 Materials Scientists 71 74 3 4.2% 2 4 6 Bachelor's | none | none19-2041 Environmental Scientists and
Specialists, Including Health 442 492 50 11.3% 10 32 47 Bachelor's | none | none19-2042 Geoscientists, Except Hydrologists
and Geographers 95 104 9 9.5% 2 7 10 Bachelor's | none | none19-2043 Hydrologists 63 68 5 7.9% 1 4 5 Bachelor's | none | none19-2099 Physical Scientists, All Other 80 81 1 1.3% 1 5 6 Bachelor's | none | none19-3011 Economists 73 72 -1 -1.4% 1 4 5 Master's | none | none19-3022 Survey Researchers n n n n n n n Master's | none | none19-3031 Clinical, Counseling, and School
Psychologists 488 546 58 11.9% 13 20 39 Doctorate/Prof | none | Intern/Residency19-3039 Psychologists, All Other n n n n n n n Master's | none | Intern/Residency19-3041 Sociologists n n n n n n n Master's | none | none19-3051 Urban and Regional Planners 182 201 19 10.4% 4 12 18 Master's | none | none19-3091 Anthropologists and Archeologists n n n n n n n Master's | none | none19-3092 Geographers n n n n n n n Bachelor's | none | none19-3093 Historians n n n n n n n Master's | none | none19-3094 Political Scientists n n n n n n n Master's | none | none19-3099 Social Scientists and Related
Workers, All Other 45 48 3 6.7% 1 3 4 Bachelor's | none | none19-4011 Agricultural and Food Science
Technicians n n n n n n n Associate's | none | Moderate OJT19-4021 Biological Technicians 563 623 60 10.7% 15 40 61 Bachelor's | none | none19-4031 Chemical Technicians 183 191 8 4.4% 6 11 18 Associate's | none | Moderate OJT19-4041 Geological and Petroleum
Technicians 27 28 1 3.7% 1 2 3 Associate's | none | Moderate OJT19-4051 Nuclear Technicians n n n n n n n Associate's | none | Moderate OJT19-4061 Social Science Research Assistants 29 28 -1 -3.4% 1 2 3 Bachelor's | none | none19-4091 Environmental Science and
Protection Technicians, Including Health 202 231 29 14.4% 9 16 28 Associate's | none | none
19-4092 Forensic Science Technicians 41 46 5 12.2% 2 3 5 Bachelor's | none | Moderate OJT19-4093 Forest and Conservation
Technicians 90 95 5 5.6% 4 7 11 Associate's | none | none19-4099 Life, Physical, and Social Science
Technicians, All Other 114 120 6 5.3% 5 9 15 Associate's | none | none
New Hampshire Long-term Employment Projections — 2016 to 2026
Economic and Labor Market Information Bureau June 2018 New Hampshire Employment Security 12 www.nhes.gov/elmi/products/proj
Occupational Projections, 2016 to 2026
n = Employment data do not meet disclosure standards
SOC 2016 2026 Numeric PercentCode Occupation Title Estimated Projected Change Change Exits Transfers Total Outlook Education | Experience | Training
Average Annual Openings
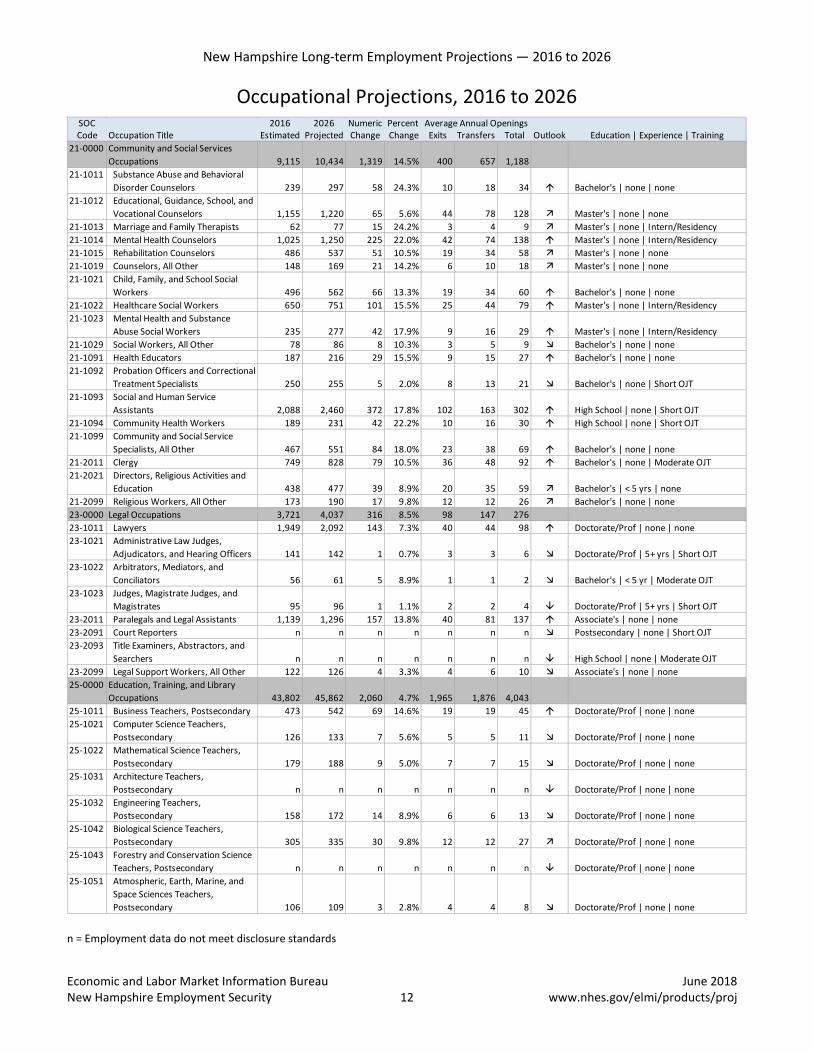
21-0000 Community and Social Services Occupations 9,115 10,434 1,319 14.5% 400 657 1,188
21-1011 Substance Abuse and Behavioral Disorder Counselors 239 297 58 24.3% 10 18 34 Bachelor's | none | none
21-1012 Educational, Guidance, School, and Vocational Counselors 1,155 1,220 65 5.6% 44 78 128 Master's | none | none
21-1013 Marriage and Family Therapists 62 77 15 24.2% 3 4 9 Master's | none | Intern/Residency21-1014 Mental Health Counselors 1,025 1,250 225 22.0% 42 74 138 Master's | none | Intern/Residency21-1015 Rehabilitation Counselors 486 537 51 10.5% 19 34 58 Master's | none | none21-1019 Counselors, All Other 148 169 21 14.2% 6 10 18 Master's | none | none21-1021 Child, Family, and School Social
Workers 496 562 66 13.3% 19 34 60 Bachelor's | none | none21-1022 Healthcare Social Workers 650 751 101 15.5% 25 44 79 Master's | none | Intern/Residency21-1023 Mental Health and Substance
Abuse Social Workers 235 277 42 17.9% 9 16 29 Master's | none | Intern/Residency21-1029 Social Workers, All Other 78 86 8 10.3% 3 5 9 Bachelor's | none | none21-1091 Health Educators 187 216 29 15.5% 9 15 27 Bachelor's | none | none21-1092 Probation Officers and Correctional
Treatment Specialists 250 255 5 2.0% 8 13 21 Bachelor's | none | Short OJT21-1093 Social and Human Service
Assistants 2,088 2,460 372 17.8% 102 163 302 High School | none | Short OJT21-1094 Community Health Workers 189 231 42 22.2% 10 16 30 High School | none | Short OJT21-1099 Community and Social Service
Specialists, All Other 467 551 84 18.0% 23 38 69 Bachelor's | none | none21-2011 Clergy 749 828 79 10.5% 36 48 92 Bachelor's | none | Moderate OJT21-2021 Directors, Religious Activities and
Education 438 477 39 8.9% 20 35 59 Bachelor's | < 5 yrs | none21-2099 Religious Workers, All Other 173 190 17 9.8% 12 12 26 Bachelor's | none | none23-0000 Legal Occupations 3,721 4,037 316 8.5% 98 147 27623-1011 Lawyers 1,949 2,092 143 7.3% 40 44 98 Doctorate/Prof | none | none23-1021 Administrative Law Judges,
Adjudicators, and Hearing Officers 141 142 1 0.7% 3 3 6 Doctorate/Prof | 5+ yrs | Short OJT23-1022 Arbitrators, Mediators, and
Conciliators 56 61 5 8.9% 1 1 2 Bachelor's | < 5 yr | Moderate OJT23-1023 Judges, Magistrate Judges, and
Magistrates 95 96 1 1.1% 2 2 4 Doctorate/Prof | 5+ yrs | Short OJT23-2011 Paralegals and Legal Assistants 1,139 1,296 157 13.8% 40 81 137 Associate's | none | none23-2091 Court Reporters n n n n n n n Postsecondary | none | Short OJT23-2093 Title Examiners, Abstractors, and
Searchers n n n n n n n High School | none | Moderate OJT23-2099 Legal Support Workers, All Other 122 126 4 3.3% 4 6 10 Associate's | none | none25-0000 Education, Training, and Library
Occupations 43,802 45,862 2,060 4.7% 1,965 1,876 4,04325-1011 Business Teachers, Postsecondary 473 542 69 14.6% 19 19 45 Doctorate/Prof | none | none25-1021 Computer Science Teachers,
Postsecondary 126 133 7 5.6% 5 5 11 Doctorate/Prof | none | none25-1022 Mathematical Science Teachers,
Postsecondary 179 188 9 5.0% 7 7 15 Doctorate/Prof | none | none25-1031 Architecture Teachers,
Postsecondary n n n n n n n Doctorate/Prof | none | none25-1032 Engineering Teachers,
Postsecondary 158 172 14 8.9% 6 6 13 Doctorate/Prof | none | none25-1042 Biological Science Teachers,
Postsecondary 305 335 30 9.8% 12 12 27 Doctorate/Prof | none | none25-1043 Forestry and Conservation Science
Teachers, Postsecondary n n n n n n n Doctorate/Prof | none | none25-1051 Atmospheric, Earth, Marine, and
Space Sciences Teachers, Postsecondary 106 109 3 2.8% 4 4 8 Doctorate/Prof | none | none

New Hampshire Long-term Employment Projections — 2016 to 2026
Economic and Labor Market Information Bureau June 2018 New Hampshire Employment Security 13 www.nhes.gov/elmi/products/proj
Occupational Projections, 2016 to 2026
n = Employment data do not meet disclosure standards
SOC 2016 2026 Numeric PercentCode Occupation Title Estimated Projected Change Change Exits Transfers Total Outlook Education | Experience | Training
Average Annual Openings
25-1052 Chemistry Teachers, Postsecondary 102 108 6 5.9% 4 4 9 Doctorate/Prof | none | none
25-1053 Environmental Science Teachers, Postsecondary 99 103 4 4.0% 4 4 8 Doctorate/Prof | none | none
25-1054 Physics Teachers, Postsecondary 95 99 4 4.2% 4 4 8 Doctorate/Prof | none | none25-1061 Anthropology and Archeology
Teachers, Postsecondary n n n n n n n Doctorate/Prof | none | none25-1062 Area, Ethnic, and Cultural Studies
Teachers, Postsecondary 83 87 4 4.8% 3 3 6 Doctorate/Prof | none | none25-1063 Economics Teachers,
Postsecondary 106 111 5 4.7% 4 4 8 Doctorate/Prof | none | none25-1064 Geography Teachers,
Postsecondary n n n n n n n Doctorate/Prof | none | none25-1065 Political Science Teachers,
Postsecondary 86 90 4 4.7% 3 3 6 Doctorate/Prof | none | none25-1066 Psychology Teachers,
Postsecondary 258 283 25 9.7% 10 10 22 Doctorate/Prof | none | none25-1067 Sociology Teachers, Postsecondary 91 94 3 3.3% 3 4 7 Doctorate/Prof | none | none25-1069 Social Sciences Teachers,
Postsecondary, All Other n n n n n n n Doctorate/Prof | none | none25-1071 Health Specialties Teachers,
Postsecondary 584 697 113 19.3% 24 24 59 Doctorate/Prof | < 5 yrs | none25-1072 Nursing Instructors and Teachers,
Postsecondary 232 280 48 20.7% 9 10 24 Doctorate/Prof | < 5 yrs | none25-1081 Education Teachers, Postsecondary 259 271 12 4.6% 10 10 21 Doctorate/Prof | < 5 yrs | none25-1082 Library Science Teachers,
Postsecondary n n n n n n n Doctorate/Prof | none | none25-1111 Criminal Justice and Law
Enforcement Teachers, Postsecondary 43 48 5 11.6% 2 2 4 Doctorate/Prof | none | none
25-1112 Law Teachers, Postsecondary n n n n n n n Doctorate/Prof | < 5 yrs | none25-1113 Social Work Teachers,
Postsecondary 58 61 3 5.2% 2 2 4 Doctorate/Prof | none | none25-1121 Art, Drama, and Music Teachers,
Postsecondary 632 667 35 5.5% 24 25 53 Master's | none | none25-1122 Communications Teachers,
Postsecondary 75 78 3 4.0% 3 3 6 Doctorate/Prof | none | none25-1123 English Language and Literature
Teachers, Postsecondary 384 405 21 5.5% 14 15 31 Doctorate/Prof | none | none25-1124 Foreign Language and Literature
Teachers, Postsecondary 164 173 9 5.5% 6 6 13 Doctorate/Prof | none | none25-1125 History Teachers, Postsecondary 119 125 6 5.0% 4 5 10 Doctorate/Prof | none | none25-1126 Philosophy and Religion Teachers,
Postsecondary 102 109 7 6.9% 4 4 9 Doctorate/Prof | none | none25-1193 Recreation and Fitness Studies
Teachers, Postsecondary 61 63 2 3.3% 2 2 4 Doctorate/Prof | none | none25-1194 Vocational Education Teachers,
Postsecondary 209 226 17 8.1% 8 8 18 Bachelor's | < 5 yrs | none25-1199 Postsecondary Teachers, All Other 412 431 19 4.6% 15 16 33 Doctorate/Prof | none | none25-2011 Preschool Teachers, Except Special
Education 3,057 3,322 265 8.7% 137 170 333 Associate's | none | none25-2012 Kindergarten Teachers, Except
Special Education 423 437 14 3.3% 18 23 42 Bachelor's | none | none25-2021 Elementary School Teachers,
Except Special Education 5,675 5,790 115 2.0% 189 212 413 Bachelor's | none | none25-2022 Middle School Teachers, Except
Special and Career/Technical 3,531 3,607 76 2.2% 118 132 258 Bachelor's | none | none25-2023 Career/Technical Education
Teachers, Middle School n n n n n n n Bachelor's | < 5 yrs | none
New Hampshire Long-term Employment Projections — 2016 to 2026
Economic and Labor Market Information Bureau June 2018 New Hampshire Employment Security 14 www.nhes.gov/elmi/products/proj
Occupational Projections, 2016 to 2026
n = Employment data do not meet disclosure standards
SOC 2016 2026 Numeric PercentCode Occupation Title Estimated Projected Change Change Exits Transfers Total Outlook Education | Experience | Training
Average Annual Openings
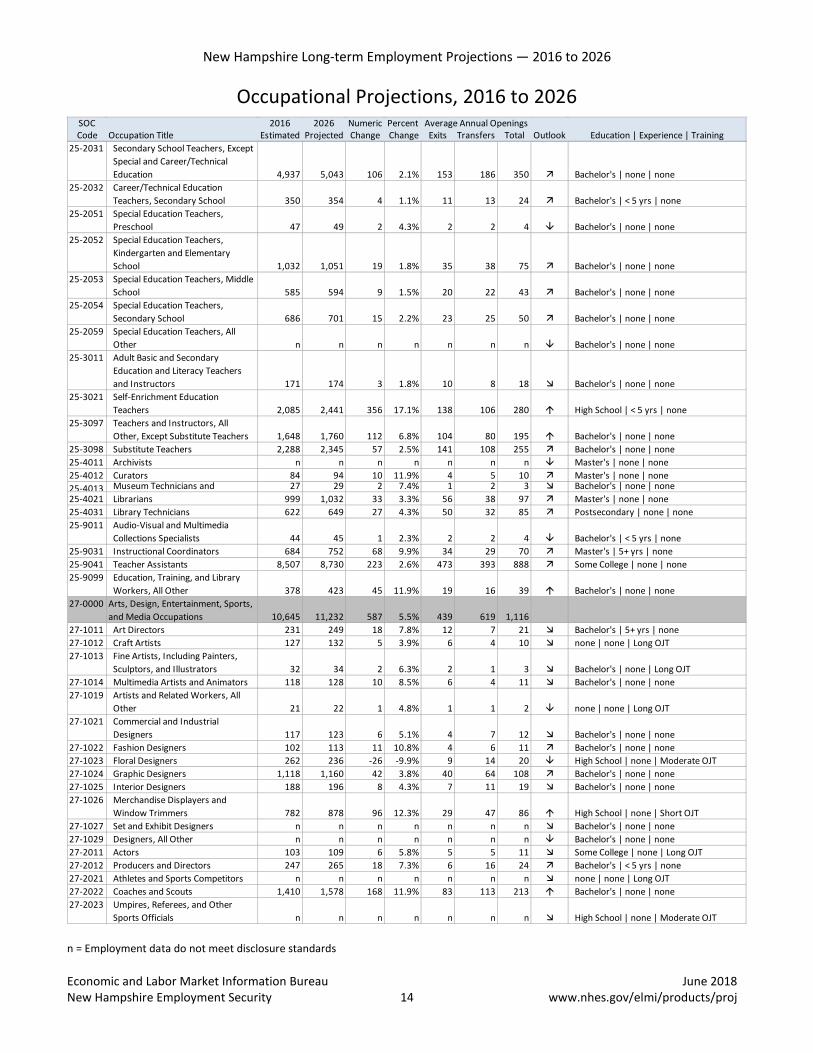
25-2031 Secondary School Teachers, Except Special and Career/Technical Education 4,937 5,043 106 2.1% 153 186 350 Bachelor's | none | none
25-2032 Career/Technical Education Teachers, Secondary School 350 354 4 1.1% 11 13 24 Bachelor's | < 5 yrs | none
25-2051 Special Education Teachers, Preschool 47 49 2 4.3% 2 2 4 Bachelor's | none | none
25-2052 Special Education Teachers, Kindergarten and Elementary School 1,032 1,051 19 1.8% 35 38 75 Bachelor's | none | none
25-2053 Special Education Teachers, Middle School 585 594 9 1.5% 20 22 43 Bachelor's | none | none
25-2054 Special Education Teachers, Secondary School 686 701 15 2.2% 23 25 50 Bachelor's | none | none
25-2059 Special Education Teachers, All Other n n n n n n n Bachelor's | none | none
25-3011 Adult Basic and Secondary Education and Literacy Teachers and Instructors 171 174 3 1.8% 10 8 18 Bachelor's | none | none
25-3021 Self-Enrichment Education Teachers 2,085 2,441 356 17.1% 138 106 280 High School | < 5 yrs | none
25-3097 Teachers and Instructors, All Other, Except Substitute Teachers 1,648 1,760 112 6.8% 104 80 195 Bachelor's | none | none
25-3098 Substitute Teachers 2,288 2,345 57 2.5% 141 108 255 Bachelor's | none | none25-4011 Archivists n n n n n n n Master's | none | none25-4012 Curators 84 94 10 11.9% 4 5 10 Master's | none | none25-4013 Museum Technicians and 27 29 2 7.4% 1 2 3 Bachelor's | none | none25-4021 Librarians 999 1,032 33 3.3% 56 38 97 Master's | none | none25-4031 Library Technicians 622 649 27 4.3% 50 32 85 Postsecondary | none | none25-9011 Audio-Visual and Multimedia
Collections Specialists 44 45 1 2.3% 2 2 4 Bachelor's | < 5 yrs | none25-9031 Instructional Coordinators 684 752 68 9.9% 34 29 70 Master's | 5+ yrs | none25-9041 Teacher Assistants 8,507 8,730 223 2.6% 473 393 888 Some College | none | none25-9099 Education, Training, and Library
Workers, All Other 378 423 45 11.9% 19 16 39 Bachelor's | none | none27-0000 Arts, Design, Entertainment, Sports,
and Media Occupations 10,645 11,232 587 5.5% 439 619 1,11627-1011 Art Directors 231 249 18 7.8% 12 7 21 Bachelor's | 5+ yrs | none27-1012 Craft Artists 127 132 5 3.9% 6 4 10 none | none | Long OJT27-1013 Fine Artists, Including Painters,
Sculptors, and Illustrators 32 34 2 6.3% 2 1 3 Bachelor's | none | Long OJT27-1014 Multimedia Artists and Animators 118 128 10 8.5% 6 4 11 Bachelor's | none | none27-1019 Artists and Related Workers, All
Other 21 22 1 4.8% 1 1 2 none | none | Long OJT27-1021 Commercial and Industrial
Designers 117 123 6 5.1% 4 7 12 Bachelor's | none | none27-1022 Fashion Designers 102 113 11 10.8% 4 6 11 Bachelor's | none | none27-1023 Floral Designers 262 236 -26 -9.9% 9 14 20 High School | none | Moderate OJT27-1024 Graphic Designers 1,118 1,160 42 3.8% 40 64 108 Bachelor's | none | none27-1025 Interior Designers 188 196 8 4.3% 7 11 19 Bachelor's | none | none27-1026 Merchandise Displayers and
Window Trimmers 782 878 96 12.3% 29 47 86 High School | none | Short OJT27-1027 Set and Exhibit Designers n n n n n n n Bachelor's | none | none27-1029 Designers, All Other n n n n n n n Bachelor's | none | none27-2011 Actors 103 109 6 5.8% 5 5 11 Some College | none | Long OJT27-2012 Producers and Directors 247 265 18 7.3% 6 16 24 Bachelor's | < 5 yrs | none27-2021 Athletes and Sports Competitors n n n n n n n none | none | Long OJT27-2022 Coaches and Scouts 1,410 1,578 168 11.9% 83 113 213 Bachelor's | none | none27-2023 Umpires, Referees, and Other
Sports Officials n n n n n n n High School | none | Moderate OJT
New Hampshire Long-term Employment Projections — 2016 to 2026
Economic and Labor Market Information Bureau June 2018 New Hampshire Employment Security 15 www.nhes.gov/elmi/products/proj
Occupational Projections, 2016 to 2026
n = Employment data do not meet disclosure standards
SOC 2016 2026 Numeric PercentCode Occupation Title Estimated Projected Change Change Exits Transfers Total Outlook Education | Experience | Training
Average Annual Openings
27-2031 Dancers n n n n n n n none | none | Long OJT27-2041 Music Directors and Composers 227 241 14 6.2% 14 9 24 Bachelor's | < 5 yrs | none27-2042 Musicians and Singers 369 399 30 8.1% 22 14 39 none | none | Long OJT27-2099 Entertainers and Performers,
Sports and Related Workers, All Other 115 124 9 7.8% 6 7 14 none | none | Short OJT
27-3011 Radio and Television Announcers 139 119 -20 -14.4% 6 7 11 Bachelor's | none | none27-3012 Public Address System and Other
Announcers n n n n n n n High School | none | Short OJT27-3021 Broadcast News Analysts n n n n n n n Bachelor's | none | none27-3022 Reporters and Correspondents 256 187 -69 -27.0% 7 15 15 Bachelor's | none | none27-3031 Public Relations Specialists 1,305 1,449 144 11.0% 39 93 146 Bachelor's | none | none27-3041 Editors 524 500 -24 -4.6% 17 32 47 Bachelor's | < 5 yrs | none27-3042 Technical Writers 230 252 22 9.6% 8 14 24 Bachelor's | < 5 yrs | Short OJT27-3043 Writers and Authors 963 1,056 93 9.7% 43 43 95 Bachelor's | none | Long OJT27-3091 Interpreters and Translators 150 179 29 19.3% 7 7 17 Bachelor's | none | none27-3099 Media and Communication
Workers, All Other 196 232 36 18.4% 10 9 23 High School | none | Short OJT27-4011 Audio and Video Equipment
Technicians 132 150 18 13.6% 4 9 15 Postsecondary | none | Short OJT27-4012 Broadcast Technicians n n n n n n n Associate's | none | Short OJT27-4014 Sound Engineering Technicians n n n n n n n Postsecondary | none | Short OJT27-4021 Photographers 465 395 -70 -15.1% 18 15 26 High School | none | Long OJT27-4031 Camera Operators, Television,
Video, and Motion Picture 209 207 -2 -1.0% 6 13 19 Bachelor's | none | none27-4032 Film and Video Editors 58 69 11 19.0% 2 4 7 Bachelor's | none | none27-4099 Media and Communication
Equipment Workers, All Other 56 53 -3 -5.4% 2 3 5 High School | none | Short OJT29-0000 Healthcare Practitioners and
Technical Occupations 39,704 45,373 5,669 14.3% 1,100 1,070 2,73729-1011 Chiropractors 121 131 10 8.3% 2 1 4 Doctorate/Prof | none | none29-1021 Dentists, General 599 690 91 15.2% 12 5 26 Doctorate/Prof | none | none29-1022 Oral and Maxillofacial Surgeons n n n n n n n Doctorate/Prof | none | Intern/Residency29-1023 Orthodontists n n n n n n n Doctorate/Prof | none | Intern/Residency29-1024 Prosthodontists n n n n n n n Doctorate/Prof | none | Intern/Residency29-1029 Dentists, All Other Specialists n n n n n n n Doctorate/Prof | none | Intern/Residency29-1031 Dietitians and Nutritionists 272 309 37 13.6% 9 8 21 Bachelor's | none | Intern/Residency29-1041 Optometrists 173 199 26 15.0% 3 2 8 Doctorate/Prof | none | none29-1051 Pharmacists 1,110 1,162 52 4.7% 26 22 53 Doctorate/Prof | none | none29-1061 Anesthesiologists 172 192 20 11.6% 3 2 7 Doctorate/Prof | none | Intern/Residency29-1062 Family and General Practitioners 823 919 96 11.7% 13 10 33 Doctorate/Prof | none | Intern/Residency29-1063 Internists, General 215 237 22 10.2% 3 2 7 Doctorate/Prof | none | Intern/Residency29-1064 Obstetricians and Gynecologists 134 152 18 13.4% 2 2 6 Doctorate/Prof | none | Intern/Residency29-1065 Pediatricians, General 170 190 20 11.8% 3 2 7 Doctorate/Prof | none | Intern/Residency29-1066 Psychiatrists 83 94 11 13.3% 1 1 3 Doctorate/Prof | none | Intern/Residency29-1067 Surgeons 377 418 41 10.9% 6 4 14 Doctorate/Prof | none | Intern/Residency29-1069 Physicians and Surgeons, All Other 1,933 2,137 204 10.6% 30 22 72 Doctorate/Prof | none | Intern/Residency29-1071 Physician Assistants 607 825 218 35.9% 12 25 59 Master's | none | none29-1081 Podiatrists 29 31 2 6.9% 1 1 2 Doctorate/Prof | none | Intern/Residency29-1122 Occupational Therapists 1,191 1,422 231 19.4% 27 36 86 Master's | none | none29-1123 Physical Therapists 1,627 2,004 377 23.2% 35 38 111 Doctorate/Prof | none | none29-1124 Radiation Therapists 136 149 13 9.6% 4 3 8 Associate's | none | none29-1125 Recreational Therapists 98 104 6 6.1% 3 3 7 Bachelor's | none | none29-1126 Respiratory Therapists 415 507 92 22.2% 11 10 30 Associate's | none | none29-1127 Speech-Language Pathologists 623 694 71 11.4% 12 20 39 Master's | none | Intern/Residency29-1128 Exercise Physiologists 77 85 8 10.4% 2 2 5 Bachelor's | none | none29-1129 Therapists, All Other 46 56 10 21.7% 1 2 4 Bachelor's | none | none
New Hampshire Long-term Employment Projections — 2016 to 2026
Economic and Labor Market Information Bureau June 2018 New Hampshire Employment Security 16 www.nhes.gov/elmi/products/proj
Occupational Projections, 2016 to 2026
n = Employment data do not meet disclosure standards
SOC 2016 2026 Numeric PercentCode Occupation Title Estimated Projected Change Change Exits Transfers Total Outlook Education | Experience | Training
Average Annual Openings
29-1131 Veterinarians 455 551 96 21.1% 9 8 27 Doctorate/Prof | none | none29-1141 Registered Nurses 13,393 15,246 1,853 13.8% 410 311 906 Associate's | none | none29-1151 Nurse Anesthetists 226 257 31 13.7% 3 8 14 Master's | none | none29-1161 Nurse Midwives 50 59 9 18.0% 1 2 4 Master's | none | none29-1171 Nurse Practitioners 1,006 1,357 351 34.9% 23 34 92 Master's | none | none29-1181 Audiologists 67 78 11 16.4% 2 1 4 Doctorate/Prof | none | none29-1199 Health Diagnosing and Treating
Practitioners, All Other 261 299 38 14.6% 11 3 18 Master's | none | none29-2011 Medical and Clinical Laboratory
Technologists 576 611 35 6.1% 18 18 40 Bachelor's | none | none29-2012 Medical and Clinical Laboratory
Technicians 290 313 23 7.9% 9 9 20 Associate's | none | none29-2021 Dental Hygienists 1,263 1,448 185 14.6% 49 30 97 Associate's | none | none29-2031 Cardiovascular Technologists and
Technicians 181 196 15 8.3% 5 5 12 Associate's | none | none29-2032 Diagnostic Medical Sonographers 210 250 40 19.0% 6 6 16 Associate's | none | none29-2033 Nuclear Medicine Technologists 61 65 4 6.6% 2 2 4 Associate's | none | none29-2034 Radiologic Technologists 764 825 61 8.0% 20 20 46 Associate's | none | none29-2035 Magnetic Resonance Imaging
Technologists 173 193 20 11.6% 5 5 12 Associate's | < 5 yrs | none29-2041 Emergency Medical Technicians
and Paramedics 1,236 1,395 159 12.9% 23 54 93 Postsecondary | none | none29-2051 Dietetic Technicians 76 82 6 7.9% 3 4 8 Associate's | none | none29-2052 Pharmacy Technicians 1,471 1,642 171 11.6% 50 69 136 High School | none | Moderate OJT29-2053 Psychiatric Technicians n n n n n n n Postsecondary | < 5 yrs | Short OJT29-2054 Respiratory Therapy Technicians n n n n n n n Associate's | none | none29-2055 Surgical Technologists 439 486 47 10.7% 15 20 40 Postsecondary | none | none29-2056 Veterinary Technologists and
Technicians 889 1,088 199 22.4% 32 44 96 Associate's | none | none29-2057 Ophthalmic Medical Technicians 310 357 47 15.2% 11 15 31 Postsecondary | none | none29-2061 Licensed Practical and Licensed
Vocational Nurses 2,309 2,539 230 10.0% 86 84 193 Postsecondary | none | none29-2071 Medical Records and Health
Information Technicians 993 1,114 121 12.2% 31 31 74 Postsecondary | none | none29-2081 Opticians, Dispensing 530 594 64 12.1% 19 21 46 High School | none | Long OJT29-2091 Orthotists and Prosthetists n n n n n n n Master's | none | Intern/Residency29-2092 Hearing Aid Specialists n n n n n n n High School | none | Moderate OJT29-2099 Health Technologists and
Technicians, All Other 305 346 41 13.4% 9 11 24 Postsecondary | none | none29-9011 Occupational Health and Safety
Specialists 333 361 28 8.4% 8 10 21 Bachelor's | none | none29-9012 Occupational Health and Safety
Technicians n n n n n n n High School | none | Moderate OJT29-9091 Athletic Trainers 161 196 35 21.7% 4 5 13 Bachelor's | none | none29-9092 Genetic Counselors n n n n n n n Master's | none | none29-9099 Healthcare Practitioners and
Technical Workers, All Other 443 498 55 12.4% 10 13 29 Postsecondary | none | none31-0000 Healthcare Support Occupations 20,562 23,753 3,191 15.5% 1,268 1,167 2,75531-1011 Home Health Aides 1,296 1,775 479 37.0% 93 78 219 High School | none | Short OJT31-1013 Psychiatric Aides 373 361 -12 -3.2% 22 18 39 High School | none | Short OJT31-1014 Nursing Assistants 9,159 10,123 964 10.5% 586 487 1,169 Postsecondary | none | none31-1015 Orderlies 112 119 7 6.3% 7 6 14 High School | none | Short OJT31-2011 Occupational Therapy Assistants 189 215 26 13.8% 10 14 27 Associate's | none | none31-2012 Occupational Therapy Aides n n n n n n n High School | none | Short OJT31-2021 Physical Therapist Assistants 582 725 143 24.6% 29 48 91 Associate's | none | none31-2022 Physical Therapist Aides 207 243 36 17.4% 10 17 31 High School | none | Short OJT
New Hampshire Long-term Employment Projections — 2016 to 2026
Economic and Labor Market Information Bureau June 2018 New Hampshire Employment Security 17 www.nhes.gov/elmi/products/proj
Occupational Projections, 2016 to 2026
n = Employment data do not meet disclosure standards
SOC 2016 2026 Numeric PercentCode Occupation Title Estimated Projected Change Change Exits Transfers Total Outlook Education | Experience | Training
Average Annual Openings
31-9011 Massage Therapists 2,813 3,301 488 17.3% 200 110 359 Postsecondary | none | none31-9091 Dental Assistants 1,319 1,512 193 14.6% 72 81 172 Postsecondary | none | none31-9092 Medical Assistants 2,575 3,197 622 24.2% 127 177 366 Postsecondary | none | none31-9093 Medical Equipment Preparers 279 300 21 7.5% 18 17 37 High School | none | Moderate OJT31-9094 Medical Transcriptionists 259 251 -8 -3.1% 17 13 29 Postsecondary | none | none31-9095 Pharmacy Aides n n n n n n n High School | none | Short OJT31-9096 Veterinary Assistants and
Laboratory Animal Caretakers 288 351 63 21.9% 18 30 54 High School | none | Short OJT31-9097 Phlebotomists 700 829 129 18.4% 33 44 90 Postsecondary | none | none31-9099 Healthcare Support Workers, All
Other 290 319 29 10.0% 19 18 40 High School | none | none33-0000 Protective Service Occupations 11,838 12,215 377 3.2% 542 616 1,19333-1011 First-Line Supervisors of
Correctional Officers 101 93 -8 -7.9% 3 3 5 High School | < 5 yrs | none33-1012 First-Line Supervisors of Police and
Detectives 469 491 22 4.7% 13 15 30 High School | < 5 yrs | Moderate OJT33-1021 First-Line Supervisors of Fire
Fighting and Prevention Workers 368 387 19 5.2% 13 12 27 Postsecondary| < 5 yrs | Moderate OJT33-1099 First-Line Supervisors of Protective
Service Workers, All Other 251 256 5 2.0% 12 13 25 High School | < 5 yrs | none33-2011 Firefighters 1,746 1,838 92 5.3% 40 76 125 Postsecondary | none | Long OJT33-2021 Fire Inspectors and Investigators n n n n n n n Postsecondary | 5+ yrs | Moderate OJT33-2022 Forest Fire Inspectors and
Prevention Specialists 201 246 45 22.4% 11 12 27 High School | < 5 yrs | Moderate OJT33-3011 Bailiffs 91 88 -3 -3.3% 3 4 7 High School | none | Moderate OJT33-3012 Correctional Officers and Jailers 1,086 997 -89 -8.2% 37 47 75 High School | none | Moderate OJT33-3021 Detectives and Criminal
Investigators 354 365 11 3.1% 10 13 24 High School | < 5 yrs | Moderate OJT33-3031 Fish and Game Wardens 49 50 1 2.0% 3 2 5 Bachelor's | none | Moderate OJT33-3041 Parking Enforcement Workers 93 58 -35 -37.6% 4 3 3 High School | none | Short OJT33-3051 Police and Sheriff's Patrol Officers 2,859 2,997 138 4.8% 71 114 199 High School | none | Moderate OJT33-9011 Animal Control Workers 67 72 5 7.5% 3 4 7 High School | none | Moderate OJT33-9021 Private Detectives and
Investigators 246 274 28 11.4% 13 11 27 High School | < 5 yrs | Moderate OJT33-9032 Security Guards 2,761 2,844 83 3.0% 166 198 372 High School | none | Short OJT33-9091 Crossing Guards n n n n n n n none | none | Short OJT33-9092 Lifeguards, Ski Patrol, and Other
Recreational Protective Service Workers 528 557 29 5.5% 75 57 135 none | none | Short OJT
33-9093 Transportation Security Screeners 125 126 1 0.8% 6 5 11 High School | none | Short OJT33-9099 Protective Service Workers, All
Other 121 132 11 9.1% 18 13 32 High School | none | Short OJT35-0000 Food Preparation and Serving
Related Occupations 57,978 63,277 5,299 9.1% 4,465 5,764 10,75735-1011 Chefs and Head Cooks 1,090 1,201 111 10.2% 37 104 152 High School | 5+ yrs | none35-1012 First-Line Supervisors of Food
Preparation and Serving Workers 3,593 3,953 360 10.0% 169 360 565 High School | < 5 yrs | none35-2011 Cooks, Fast Food 1,350 1,295 -55 -4.1% 78 106 178 none | none | Short OJT35-2012 Cooks, Institution and Cafeteria 1,575 1,711 136 8.6% 96 131 241 none | none | Short OJT35-2014 Cooks, Restaurant 5,695 6,477 782 13.7% 357 487 922 none | < 5 yrs | Moderate OJT35-2015 Cooks, Short Order 3,288 3,156 -132 -4.0% 189 258 434 none | none | Short OJT35-2019 Cooks, All Other 43 49 6 14.0% 3 4 8 none | none | Moderate OJT35-2021 Food Preparation Workers 3,233 3,517 284 8.8% 270 293 591 none | none | Short OJT35-3011 Bartenders 3,684 3,812 128 3.5% 180 430 623 none | none | Short OJT35-3021 Combined Food Preparation and
Serving Workers, Including Fast Food 13,023 14,988 1,965 15.1% 1,240 1,297 2,733 none | none | Short OJT

New Hampshire Long-term Employment Projections — 2016 to 2026
Economic and Labor Market Information Bureau June 2018 New Hampshire Employment Security 18 www.nhes.gov/elmi/products/proj
Occupational Projections, 2016 to 2026
n = Employment data do not meet disclosure standards
SOC 2016 2026 Numeric PercentCode Occupation Title Estimated Projected Change Change Exits Transfers Total Outlook Education | Experience | Training
Average Annual Openings
35-3022 Counter Attendants, Cafeteria, Food Concession, and Coffee Shop 1,890 1,952 62 3.3% 231 181 418 none | none | Short OJT
35-3031 Waiters and Waitresses 12,531 13,620 1,089 8.7% 968 1,483 2,560 none | none | Short OJT35-3041 Food Servers, Nonrestaurant 1,162 1,296 134 11.5% 93 86 192 none | none | Short OJT35-9011 Dining Room and Cafeteria
Attendants and Bartender Helpers 1,126 1,226 100 8.9% 105 93 208 none | none | Short OJT35-9021 Dishwashers 2,539 2,684 145 5.7% 193 208 415 none | none | Short OJT35-9031 Hosts and Hostesses, Restaurant,
Lounge, and Coffee Shop 2,062 2,234 172 8.3% 247 235 499 none | none | Short OJT35-9099 Food Preparation and Serving
Related Workers, All Other 94 106 12 12.8% 9 8 18 none | none | Short OJT37-0000 Building and Grounds Cleaning and
Maintenance Occupations 25,904 27,889 1,985 7.7% 1,606 1,717 3,52137-1011 First-Line Supervisors of
Housekeeping and Janitorial Workers 1,034 1,118 84 8.1% 54 65 127 High School | < 5 yrs | none
37-1012 First-Line Supervisors of Landscaping, Lawn Service, and Groundskeeping Workers 967 1,060 93 9.6% 33 61 103 High School | < 5 yrs | none
37-2011 Janitors and Cleaners, Except Maids and Housekeeping Cleaners 10,388 11,082 694 6.7% 699 675 1,443 none | none | Short OJT
37-2012 Maids and Housekeeping Cleaners 5,807 6,246 439 7.6% 446 337 827 none | none | Short OJT37-2019 Building Cleaning Workers, All
Other 47 54 7 14.9% 3 3 7 none | none | Short OJT37-2021 Pest Control Workers 251 259 8 3.2% 10 24 35 High School | none | Moderate OJT37-3011 Landscaping and Groundskeeping
Workers 6,586 7,170 584 8.9% 321 491 870 none | none | Short OJT37-3012 Pesticide Handlers, Sprayers, and
Applicators, Vegetation n n n n n n n High School | none | Moderate OJT37-3013 Tree Trimmers and Pruners 525 574 49 9.3% 26 39 70 High School | none | Short OJT37-3019 Grounds Maintenance Workers, All
Other n n n n n n n none | none | Short OJT39-0000 Personal Care and Service
Occupations 26,708 31,420 4,712 17.6% 2,168 2,031 4,66839-1011 Gaming Supervisors n n n n n n n High School | < 5 yrs | none39-1021 First-Line Supervisors of Personal
Service Workers 1,219 1,380 161 13.2% 62 58 136 High School | < 5 yrs | none39-2011 Animal Trainers 144 175 31 21.5% 8 10 21 High School | none | Moderate OJT39-2021 Nonfarm Animal Caretakers 1,092 1,407 315 28.8% 85 101 218 High School | none | Short OJT39-3011 Gaming Dealers n n n n n n n High School | none | Short OJT39-3012 Gaming and Sports Book Writers
and Runners n n n n n n n High School | none | Short OJT39-3021 Motion Picture Projectionists n n n n n n n none | none | Short OJT39-3031 Ushers, Lobby Attendants, and
Ticket Takers 391 422 31 7.9% 53 45 101 none | none | Short OJT39-3091 Amusement and Recreation
Attendants 1,470 1,600 130 8.8% 162 182 357 none | none | Short OJT39-3092 Costume Attendants n n n n n n n High School | none | Short OJT39-3093 Locker Room, Coatroom, and
Dressing Room Attendants n n n n n n n High School | none | Short OJT39-3099 Entertainment Attendants and
Related Workers, All Other n n n n n n n High School | none | Short OJT39-4021 Funeral Attendants 99 101 2 2.0% 9 6 15 High School | none | Short OJT39-4031 Morticians, Undertakers, and
Funeral Directors 126 131 5 4.0% 6 9 15 Associate's | none | Long OJT39-5011 Barbers 461 522 61 13.2% 22 22 50 Postsecondary | none | none39-5012 Hairdressers, Hairstylists, and
Cosmetologists 3,213 3,616 403 12.5% 228 170 438 Postsecondary | none | none

New Hampshire Long-term Employment Projections — 2016 to 2026
Economic and Labor Market Information Bureau June 2018 New Hampshire Employment Security 19 www.nhes.gov/elmi/products/proj
Occupational Projections, 2016 to 2026
n = Employment data do not meet disclosure standards
SOC 2016 2026 Numeric PercentCode Occupation Title Estimated Projected Change Change Exits Transfers Total Outlook Education | Experience | Training
Average Annual Openings
39-5092 Manicurists and Pedicurists 582 659 77 13.2% 37 32 77 Postsecondary | none | none39-5093 Shampooers n n n n n n n none | none | Short OJT39-5094 Skincare Specialists 480 543 63 13.1% 31 26 63 Postsecondary | none | none39-6011 Baggage Porters and Bellhops 70 74 4 5.7% 3 6 9 High School | none | Short OJT39-6012 Concierges n n n n n n n High School | none | Moderate OJT39-7011 Tour Guides and Escorts 209 236 27 12.9% 20 19 42 High School | none | Moderate OJT39-7012 Travel Guides n n n n n n n High School | none | Moderate OJT39-9011 Childcare Workers 4,361 4,672 311 7.1% 369 280 680 High School | none | Short OJT39-9021 Personal Care Aides 7,756 10,345 2,589 33.4% 722 544 1,525 High School | none | Short OJT39-9031 Fitness Trainers and Aerobics
Instructors 2,205 2,456 251 11.4% 152 233 410 High School | none | Short OJT39-9032 Recreation Workers 1,796 1,930 134 7.5% 122 186 321 High School | none | Short OJT39-9041 Residential Advisors 424 472 48 11.3% 30 44 79 High School | none | Short OJT39-9099 Personal Care and Service
Workers, All Other 275 315 40 14.5% 20 23 47 High School | none | Short OJT41-0000 Sales and Related Occupations 88,218 91,096 2,878 3.3% 5,291 6,937 12,51441-1011 First-Line Supervisors of Retail
Sales Workers 8,838 9,218 380 4.3% 333 608 979 High School | < 5 yrs | none41-1012 First-Line Supervisors of Non-Retail
Sales Workers 2,778 2,964 186 6.7% 96 160 275 High School | < 5 yrs | none41-2011 Cashiers 22,658 22,151 -507 -2.2% 2,104 2,053 4,106 none | none | Short OJT41-2021 Counter and Rental Clerks 1,928 2,060 132 6.8% 105 146 264 none | none | Short OJT41-2022 Parts Salespersons 1,557 1,638 81 5.2% 70 126 204 none | none | Moderate OJT41-2031 Retail Salespersons 26,172 27,103 931 3.6% 1,686 2,114 3,893 none | none | Short OJT41-3011 Advertising Sales Agents 599 532 -67 -11.2% 21 49 63 High School | none | Moderate OJT41-3021 Insurance Sales Agents 2,970 3,224 254 8.6% 126 167 318 High School | none | Moderate OJT41-3031 Securities, Commodities, and
Financial Services Sales Agents 2,381 2,520 139 5.8% 64 162 240 Bachelor's | none | Moderate OJT41-3041 Travel Agents 396 344 -52 -13.1% 20 22 37 High School | none | Moderate OJT41-3099 Sales Representatives, Services, All
Other 3,874 4,243 369 9.5% 128 350 515 High School | none | Moderate OJT41-4011 Sales Representatives, Wholesale
and Manufacturing, Technical and Scientific Products 3,388 3,650 262 7.7% 116 236 378 Bachelor's | none | Moderate OJT
41-4012 Sales Representatives, Wholesale and Manufacturing, Except Technical and Scientific Products 7,582 8,216 634 8.4% 261 529 853 High School | none | Moderate OJT
41-9011 Demonstrators and Product Promoters 80 90 10 12.5% 8 6 15 none | none | Short OJT
41-9012 Models n n n n n n n none | none | none41-9021 Real Estate Brokers 379 393 14 3.7% 20 15 36 High School | < 5 yrs | none41-9022 Real Estate Sales Agents 484 507 23 4.8% 25 19 46 High School | none | Moderate OJT41-9031 Sales Engineers 495 512 17 3.4% 12 39 53 Bachelor's | none | Moderate OJT41-9041 Telemarketers 654 634 -20 -3.1% 38 61 97 none | none | Short OJT41-9091 Door-to-Door Sales Workers, News
and Street Vendors, and Related Workers n n n n n n n none | none | Short OJT
41-9099 Sales and Related Workers, All Other 867 960 93 10.7% 48 70 127 High School | none | none
43-0000 Office and Administrative Support Occupations 109,581 109,989 408 0.4% 5,690 6,619 12,347
43-1011 First-Line Supervisors of Office and Administrative Support Workers 7,351 7,591 240 3.3% 290 431 745 High School | < 5 yrs | none
43-2011 Switchboard Operators, Including Answering Service 478 377 -101 -21.1% 27 28 45 High School | none | Short OJT
43-2021 Telephone Operators n n n n n n n High School | none | Short OJT43-2099 Communications Equipment
Operators, All Other n n n n n n n High School | none | Short OJT
New Hampshire Long-term Employment Projections — 2016 to 2026
Economic and Labor Market Information Bureau June 2018 New Hampshire Employment Security 20 www.nhes.gov/elmi/products/proj
Occupational Projections, 2016 to 2026
n = Employment data do not meet disclosure standards
SOC 2016 2026 Numeric PercentCode Occupation Title Estimated Projected Change Change Exits Transfers Total Outlook Education | Experience | Training
Average Annual Openings
43-3011 Bill and Account Collectors 1,268 1,238 -30 -2.4% 47 82 126 High School | none | Moderate OJT43-3021 Billing and Posting Clerks 2,235 2,525 290 13.0% 102 131 262 High School | none | Moderate OJT43-3031 Bookkeeping, Accounting, and
Auditing Clerks 8,249 8,109 -140 -1.7% 506 393 885 Some College | none | Moderate OJT43-3051 Payroll and Timekeeping Clerks 772 757 -15 -1.9% 32 43 73 High School | none | Moderate OJT43-3061 Procurement Clerks 351 341 -10 -2.8% 15 22 36 High School | none | Moderate OJT43-3071 Tellers 2,033 1,814 -219 -10.8% 98 124 200 High School | none | Short OJT43-3099 Financial Clerks, All Other 333 364 31 9.3% 13 23 39 High School | none | Short OJT43-4011 Brokerage Clerks 393 414 21 5.3% 10 31 43 High School | none | Moderate OJT43-4021 Correspondence Clerks 148 158 10 6.8% 7 10 18 High School | none | Short OJT43-4031 Court, Municipal, and License
Clerks 435 455 20 4.6% 20 18 40 High School | none | Moderate OJT43-4041 Credit Authorizers, Checkers, and
Clerks 132 135 3 2.3% 5 9 14 High School | none | Moderate OJT43-4051 Customer Service Representatives 9,380 9,656 276 2.9% 487 714 1,229 High School | none | Short OJT43-4061 Eligibility Interviewers,
Government Programs 528 549 21 4.0% 21 25 48 High School | none | Moderate OJT43-4071 File Clerks 938 849 -89 -9.5% 55 54 100 High School | none | Short OJT43-4081 Hotel, Motel, and Resort Desk
Clerks 1,363 1,423 60 4.4% 77 138 221 High School | none | Short OJT43-4111 Interviewers, Except Eligibility and
Loan 1,358 1,448 90 6.6% 75 88 172 High School | none | Short OJT43-4121 Library Assistants, Clerical 794 828 34 4.3% 64 49 116 High School | none | Short OJT43-4131 Loan Interviewers and Clerks 848 936 88 10.4% 32 52 93 High School | none | Short OJT43-4141 New Accounts Clerks 434 395 -39 -9.0% 18 26 40 High School | none | Moderate OJT43-4151 Order Clerks 879 897 18 2.0% 41 58 101 High School | none | Short OJT43-4161 Human Resources Assistants,
Except Payroll and Timekeeping 475 463 -12 -2.5% 20 32 51 Associate's | none | none43-4171 Receptionists and Information
Clerks 5,603 5,947 344 6.1% 359 383 776 High School | none | Short OJT43-4181 Reservation and Transportation
Ticket Agents and Travel Clerks 273 298 25 9.2% 12 17 31 High School | none | Short OJT43-4199 Information and Record Clerks, All
Other 673 727 54 8.0% 34 44 83 High School | none | Short OJT43-5011 Cargo and Freight Agents 192 210 18 9.4% 6 10 18 High School | none | Short OJT43-5021 Couriers and Messengers 514 583 69 13.4% 25 24 56 High School | none | Short OJT43-5031 Police, Fire, and Ambulance
Dispatchers 762 821 59 7.7% 28 43 77 High School | none | Moderate OJT43-5032 Dispatchers, Except Police, Fire,
and Ambulance 613 610 -3 -0.5% 22 33 55 High School | none | Moderate OJT43-5041 Meter Readers, Utilities 145 134 -11 -7.6% 4 6 9 High School | none | Short OJT43-5051 Postal Service Clerks 542 488 -54 -10.0% 26 14 35 High School | none | Short OJT43-5052 Postal Service Mail Carriers 1,494 1,344 -150 -10.0% 55 40 80 High School | none | Short OJT43-5053 Postal Service Mail Sorters,
Processors, and Processing Machine Operators 628 537 -91 -14.5% 25 17 33 High School | none | Short OJT
43-5061 Production, Planning, and Expediting Clerks 1,305 1,332 27 2.1% 46 86 135 High School | none | Moderate OJT
43-5071 Shipping, Receiving, and Traffic Clerks 2,763 2,812 49 1.8% 109 166 280 High School | none | Short OJT
43-5081 Stock Clerks and Order Fillers 13,671 14,475 804 5.9% 768 1,003 1,851 High School | none | Short OJT43-5111 Weighers, Measurers, Checkers,
and Samplers, Recordkeeping 157 170 13 8.3% 6 9 16 High School | none | Short OJT43-6011 Executive Secretaries and Executive
Administrative Assistants 1,801 1,462 -339 -18.8% 88 86 140 High School | < 5 yrs | none43-6012 Legal Secretaries 811 654 -157 -19.4% 40 38 62 High School | none | Moderate OJT43-6013 Medical Secretaries 2,200 2,627 427 19.4% 130 126 299 High School | none | Moderate OJT
New Hampshire Long-term Employment Projections — 2016 to 2026
Economic and Labor Market Information Bureau June 2018 New Hampshire Employment Security 21 www.nhes.gov/elmi/products/proj
Occupational Projections, 2016 to 2026
n = Employment data do not meet disclosure standards
SOC 2016 2026 Numeric PercentCode Occupation Title Estimated Projected Change Change Exits Transfers Total Outlook Education | Experience | Training
Average Annual Openings
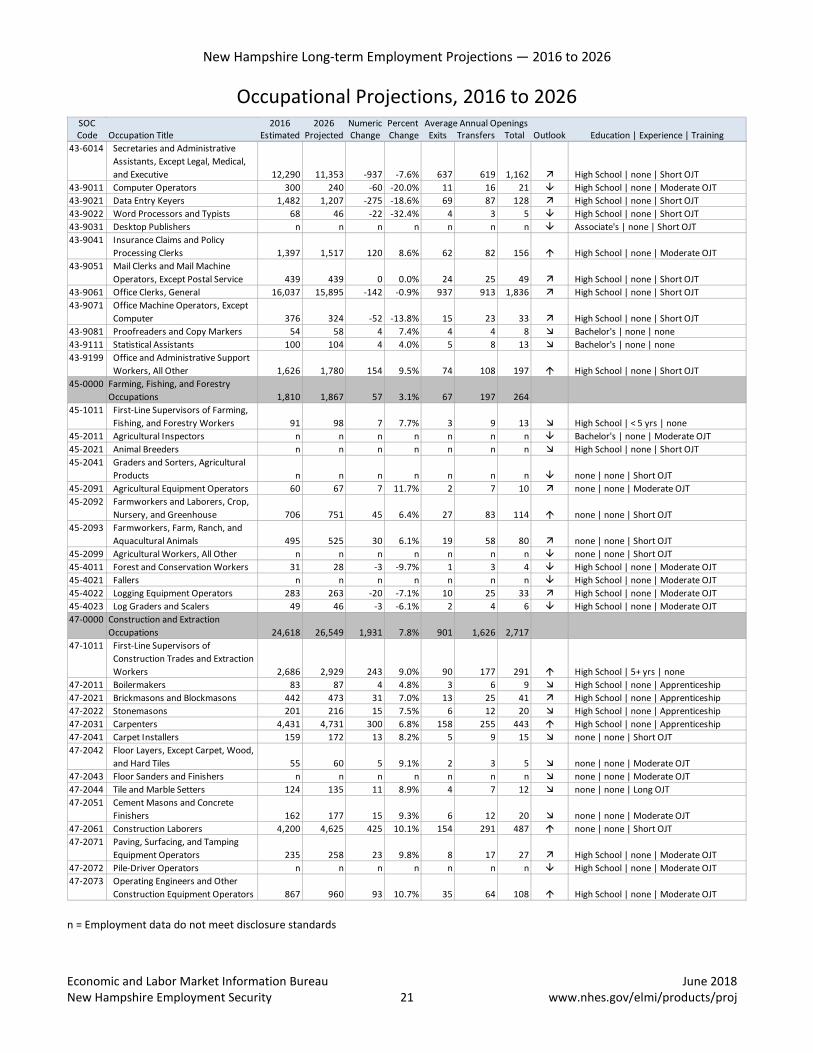
43-6014 Secretaries and Administrative Assistants, Except Legal, Medical, and Executive 12,290 11,353 -937 -7.6% 637 619 1,162 High School | none | Short OJT
43-9011 Computer Operators 300 240 -60 -20.0% 11 16 21 High School | none | Moderate OJT43-9021 Data Entry Keyers 1,482 1,207 -275 -18.6% 69 87 128 High School | none | Short OJT43-9022 Word Processors and Typists 68 46 -22 -32.4% 4 3 5 High School | none | Short OJT43-9031 Desktop Publishers n n n n n n n Associate's | none | Short OJT43-9041 Insurance Claims and Policy
Processing Clerks 1,397 1,517 120 8.6% 62 82 156 High School | none | Moderate OJT43-9051 Mail Clerks and Mail Machine
Operators, Except Postal Service 439 439 0 0.0% 24 25 49 High School | none | Short OJT43-9061 Office Clerks, General 16,037 15,895 -142 -0.9% 937 913 1,836 High School | none | Short OJT43-9071 Office Machine Operators, Except
Computer 376 324 -52 -13.8% 15 23 33 High School | none | Short OJT43-9081 Proofreaders and Copy Markers 54 58 4 7.4% 4 4 8 Bachelor's | none | none43-9111 Statistical Assistants 100 104 4 4.0% 5 8 13 Bachelor's | none | none43-9199 Office and Administrative Support
Workers, All Other 1,626 1,780 154 9.5% 74 108 197 High School | none | Short OJT45-0000 Farming, Fishing, and Forestry
Occupations 1,810 1,867 57 3.1% 67 197 26445-1011 First-Line Supervisors of Farming,
Fishing, and Forestry Workers 91 98 7 7.7% 3 9 13 High School | < 5 yrs | none45-2011 Agricultural Inspectors n n n n n n n Bachelor's | none | Moderate OJT45-2021 Animal Breeders n n n n n n n High School | none | Short OJT45-2041 Graders and Sorters, Agricultural
Products n n n n n n n none | none | Short OJT45-2091 Agricultural Equipment Operators 60 67 7 11.7% 2 7 10 none | none | Moderate OJT45-2092 Farmworkers and Laborers, Crop,
Nursery, and Greenhouse 706 751 45 6.4% 27 83 114 none | none | Short OJT45-2093 Farmworkers, Farm, Ranch, and
Aquacultural Animals 495 525 30 6.1% 19 58 80 none | none | Short OJT45-2099 Agricultural Workers, All Other n n n n n n n none | none | Short OJT45-4011 Forest and Conservation Workers 31 28 -3 -9.7% 1 3 4 High School | none | Moderate OJT45-4021 Fallers n n n n n n n High School | none | Moderate OJT45-4022 Logging Equipment Operators 283 263 -20 -7.1% 10 25 33 High School | none | Moderate OJT45-4023 Log Graders and Scalers 49 46 -3 -6.1% 2 4 6 High School | none | Moderate OJT47-0000 Construction and Extraction
Occupations 24,618 26,549 1,931 7.8% 901 1,626 2,71747-1011 First-Line Supervisors of
Construction Trades and Extraction Workers 2,686 2,929 243 9.0% 90 177 291 High School | 5+ yrs | none
47-2011 Boilermakers 83 87 4 4.8% 3 6 9 High School | none | Apprenticeship47-2021 Brickmasons and Blockmasons 442 473 31 7.0% 13 25 41 High School | none | Apprenticeship47-2022 Stonemasons 201 216 15 7.5% 6 12 20 High School | none | Apprenticeship47-2031 Carpenters 4,431 4,731 300 6.8% 158 255 443 High School | none | Apprenticeship47-2041 Carpet Installers 159 172 13 8.2% 5 9 15 none | none | Short OJT47-2042 Floor Layers, Except Carpet, Wood,
and Hard Tiles 55 60 5 9.1% 2 3 5 none | none | Moderate OJT47-2043 Floor Sanders and Finishers n n n n n n n none | none | Moderate OJT47-2044 Tile and Marble Setters 124 135 11 8.9% 4 7 12 none | none | Long OJT47-2051 Cement Masons and Concrete
Finishers 162 177 15 9.3% 6 12 20 none | none | Moderate OJT47-2061 Construction Laborers 4,200 4,625 425 10.1% 154 291 487 none | none | Short OJT47-2071 Paving, Surfacing, and Tamping
Equipment Operators 235 258 23 9.8% 8 17 27 High School | none | Moderate OJT47-2072 Pile-Driver Operators n n n n n n n High School | none | Moderate OJT47-2073 Operating Engineers and Other
Construction Equipment Operators 867 960 93 10.7% 35 64 108 High School | none | Moderate OJT
New Hampshire Long-term Employment Projections — 2016 to 2026
Economic and Labor Market Information Bureau June 2018 New Hampshire Employment Security 22 www.nhes.gov/elmi/products/proj
Occupational Projections, 2016 to 2026
n = Employment data do not meet disclosure standards
SOC 2016 2026 Numeric PercentCode Occupation Title Estimated Projected Change Change Exits Transfers Total Outlook Education | Experience | Training
Average Annual Openings
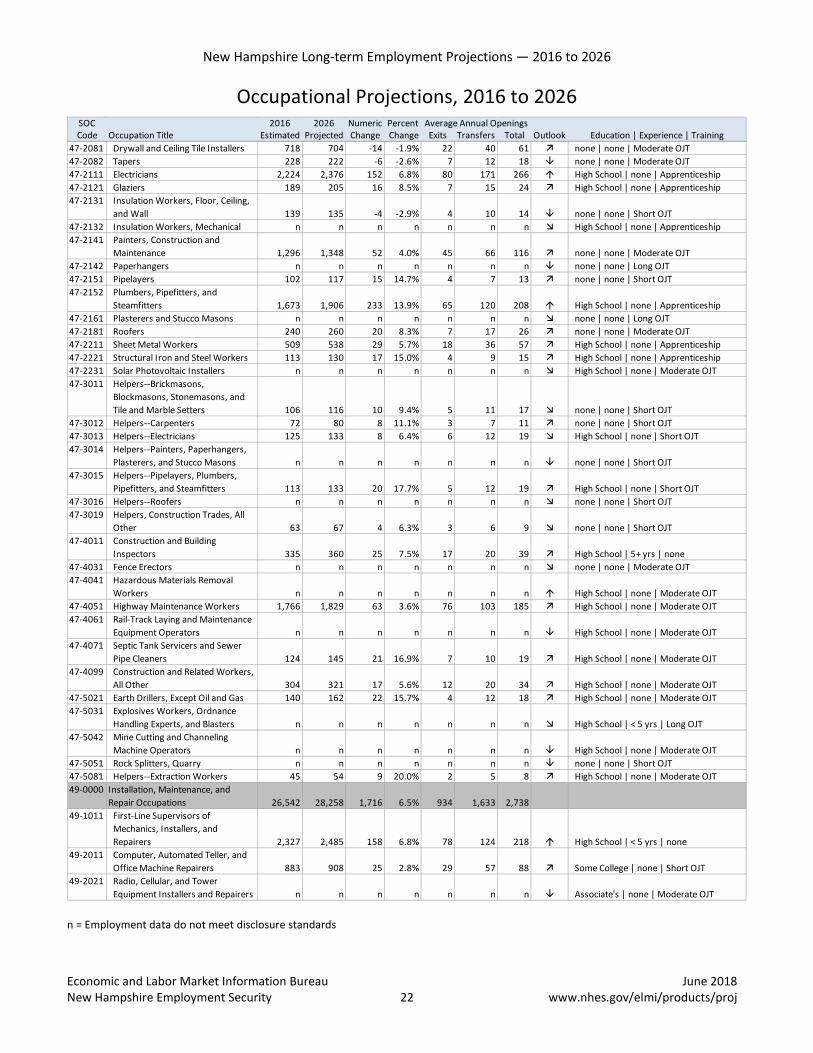
47-2081 Drywall and Ceiling Tile Installers 718 704 -14 -1.9% 22 40 61 none | none | Moderate OJT47-2082 Tapers 228 222 -6 -2.6% 7 12 18 none | none | Moderate OJT47-2111 Electricians 2,224 2,376 152 6.8% 80 171 266 High School | none | Apprenticeship47-2121 Glaziers 189 205 16 8.5% 7 15 24 High School | none | Apprenticeship47-2131 Insulation Workers, Floor, Ceiling,
and Wall 139 135 -4 -2.9% 4 10 14 none | none | Short OJT47-2132 Insulation Workers, Mechanical n n n n n n n High School | none | Apprenticeship47-2141 Painters, Construction and
Maintenance 1,296 1,348 52 4.0% 45 66 116 none | none | Moderate OJT47-2142 Paperhangers n n n n n n n none | none | Long OJT47-2151 Pipelayers 102 117 15 14.7% 4 7 13 none | none | Short OJT47-2152 Plumbers, Pipefitters, and
Steamfitters 1,673 1,906 233 13.9% 65 120 208 High School | none | Apprenticeship47-2161 Plasterers and Stucco Masons n n n n n n n none | none | Long OJT47-2181 Roofers 240 260 20 8.3% 7 17 26 none | none | Moderate OJT47-2211 Sheet Metal Workers 509 538 29 5.7% 18 36 57 High School | none | Apprenticeship47-2221 Structural Iron and Steel Workers 113 130 17 15.0% 4 9 15 High School | none | Apprenticeship47-2231 Solar Photovoltaic Installers n n n n n n n High School | none | Moderate OJT47-3011 Helpers--Brickmasons,
Blockmasons, Stonemasons, and Tile and Marble Setters 106 116 10 9.4% 5 11 17 none | none | Short OJT
47-3012 Helpers--Carpenters 72 80 8 11.1% 3 7 11 none | none | Short OJT47-3013 Helpers--Electricians 125 133 8 6.4% 6 12 19 High School | none | Short OJT47-3014 Helpers--Painters, Paperhangers,
Plasterers, and Stucco Masons n n n n n n n none | none | Short OJT47-3015 Helpers--Pipelayers, Plumbers,
Pipefitters, and Steamfitters 113 133 20 17.7% 5 12 19 High School | none | Short OJT47-3016 Helpers--Roofers n n n n n n n none | none | Short OJT47-3019 Helpers, Construction Trades, All
Other 63 67 4 6.3% 3 6 9 none | none | Short OJT47-4011 Construction and Building
Inspectors 335 360 25 7.5% 17 20 39 High School | 5+ yrs | none47-4031 Fence Erectors n n n n n n n none | none | Moderate OJT47-4041 Hazardous Materials Removal
Workers n n n n n n n High School | none | Moderate OJT47-4051 Highway Maintenance Workers 1,766 1,829 63 3.6% 76 103 185 High School | none | Moderate OJT47-4061 Rail-Track Laying and Maintenance
Equipment Operators n n n n n n n High School | none | Moderate OJT47-4071 Septic Tank Servicers and Sewer
Pipe Cleaners 124 145 21 16.9% 7 10 19 High School | none | Moderate OJT47-4099 Construction and Related Workers,
All Other 304 321 17 5.6% 12 20 34 High School | none | Moderate OJT47-5021 Earth Drillers, Except Oil and Gas 140 162 22 15.7% 4 12 18 High School | none | Moderate OJT47-5031 Explosives Workers, Ordnance
Handling Experts, and Blasters n n n n n n n High School | < 5 yrs | Long OJT47-5042 Mine Cutting and Channeling
Machine Operators n n n n n n n High School | none | Moderate OJT47-5051 Rock Splitters, Quarry n n n n n n n none | none | Short OJT47-5081 Helpers--Extraction Workers 45 54 9 20.0% 2 5 8 High School | none | Moderate OJT49-0000 Installation, Maintenance, and
Repair Occupations 26,542 28,258 1,716 6.5% 934 1,633 2,73849-1011 First-Line Supervisors of
Mechanics, Installers, and Repairers 2,327 2,485 158 6.8% 78 124 218 High School | < 5 yrs | none
49-2011 Computer, Automated Teller, and Office Machine Repairers 883 908 25 2.8% 29 57 88 Some College | none | Short OJT
49-2021 Radio, Cellular, and Tower Equipment Installers and Repairers n n n n n n n Associate's | none | Moderate OJT

New Hampshire Long-term Employment Projections — 2016 to 2026
Economic and Labor Market Information Bureau June 2018 New Hampshire Employment Security 23 www.nhes.gov/elmi/products/proj
Occupational Projections, 2016 to 2026
n = Employment data do not meet disclosure standards
SOC 2016 2026 Numeric PercentCode Occupation Title Estimated Projected Change Change Exits Transfers Total Outlook Education | Experience | Training
Average Annual Openings
49-2022 Telecommunications Equipment Installers and Repairers, Except Line Installers 1,165 1,095 -70 -6.0% 38 80 111 Postsecondary | none | Moderate OJT
49-2091 Avionics Technicians n n n n n n n Associate's | none | none49-2092 Electric Motor, Power Tool, and
Related Repairers n n n n n n n High School | < 5 yrs | Moderate OJT49-2093 Electrical and Electronics Installers
and Repairers, Transportation Equipment 27 29 2 7.4% 1 2 3 Postsecondary | none | Long OJT
49-2094 Electrical and Electronics Repairers, Commercial and Industrial Equipment 374 394 20 5.3% 10 23 35 Postsecondary | none | Long OJT
49-2095 Electrical and Electronics Repairers, Powerhouse, Substation, and Relay n n n n n n n Postsecondary| < 5 yrs | Moderate OJT
49-2096 Electronic Equipment Installers and Repairers, Motor Vehicles 45 22 -23 -51.1% 1 2 1 High School | none | Moderate OJT
49-2097 Electronic Home Entertainment Equipment Installers and Repairers 296 307 11 3.7% 11 20 32 Postsecondary | none | Short OJT
49-2098 Security and Fire Alarm Systems Installers 333 378 45 13.5% 12 27 43 High School | none | Moderate OJT
49-3011 Aircraft Mechanics and Service Technicians 236 259 23 9.7% 8 11 21 Postsecondary | none | none
49-3021 Automotive Body and Related Repairers 707 763 56 7.9% 25 44 75 High School | none | Long OJT
49-3022 Automotive Glass Installers and Repairers 70 75 5 7.1% 3 4 7 High School | none | Moderate OJT
49-3023 Automotive Service Technicians and Mechanics 4,162 4,393 231 5.6% 135 258 416 Postsecondary | none | Short OJT
49-3031 Bus and Truck Mechanics and Diesel Engine Specialists 944 1,064 120 12.7% 31 57 100 High School | none | Long OJT
49-3041 Farm Equipment Mechanics and Service Technicians n n n n n n n High School | none | Long OJT
49-3042 Mobile Heavy Equipment Mechanics, Except Engines 382 423 41 10.7% 12 25 41 High School | none | Long OJT
49-3043 Rail Car Repairers n n n n n n n High School | none | Long OJT49-3051 Motorboat Mechanics and Service
Technicians 184 188 4 2.2% 8 12 20 High School | none | Long OJT49-3052 Motorcycle Mechanics 220 220 0 0.0% 9 14 23 Postsecondary | none | Short OJT49-3053 Outdoor Power Equipment and
Other Small Engine Mechanics 386 424 38 9.8% 16 25 45 High School | none | Moderate OJT49-3091 Bicycle Repairers 175 225 50 28.6% 7 17 29 High School | none | Moderate OJT49-3092 Recreational Vehicle Service
Technicians 184 177 -7 -3.8% 7 16 22 High School | none | Long OJT49-3093 Tire Repairers and Changers 400 405 5 1.3% 15 34 49 High School | none | Short OJT49-9011 Mechanical Door Repairers 200 220 20 10.0% 5 10 17 High School | none | Moderate OJT49-9012 Control and Valve Installers and
Repairers, Except Mechanical Door 125 133 8 6.4% 3 6 10 High School | none | Moderate OJT49-9021 Heating, Air Conditioning, and
Refrigeration Mechanics and Installers 2,023 2,198 175 8.7% 58 142 218 Postsecondary | none | Long OJT
49-9031 Home Appliance Repairers 184 192 8 4.3% 9 8 18 High School | none | Moderate OJT49-9041 Industrial Machinery Mechanics 2,210 2,405 195 8.8% 78 119 217 High School | none | Long OJT49-9043 Maintenance Workers, Machinery 221 231 10 4.5% 10 13 24 High School | none | Long OJT49-9044 Millwrights 136 144 8 5.9% 4 8 13 High School | none | Apprenticeship49-9051 Electrical Power-Line Installers and
Repairers 732 787 55 7.5% 19 40 65 High School | none | Long OJT49-9052 Telecommunications Line Installers
and Repairers 534 523 -11 -2.1% 13 39 51 High School | none | Long OJT

New Hampshire Long-term Employment Projections — 2016 to 2026
Economic and Labor Market Information Bureau June 2018 New Hampshire Employment Security 24 www.nhes.gov/elmi/products/proj
Occupational Projections, 2016 to 2026
n = Employment data do not meet disclosure standards
SOC 2016 2026 Numeric PercentCode Occupation Title Estimated Projected Change Change Exits Transfers Total Outlook Education | Experience | Training
Average Annual Openings
49-9061 Camera and Photographic Equipment Repairers n n n n n n n High School | none | Long OJT
49-9062 Medical Equipment Repairers 116 126 10 8.6% 5 6 12 Associate's | none | Moderate OJT49-9063 Musical Instrument Repairers and
Tuners n n n n n n n High School | none | Apprenticeship49-9064 Watch Repairers n n n n n n n High School | none | Long OJT49-9069 Precision Instrument and
Equipment Repairers, All Other 148 153 5 3.4% 6 7 13 High School | none | Long OJT49-9071 Maintenance and Repair Workers,
General 4,711 5,067 356 7.6% 199 272 507 High School | none | Moderate OJT49-9081 Wind Turbine Service Technicians n n n n n n n Postsecondary | none | Long OJT49-9091 Coin, Vending, and Amusement
Machine Servicers and Repairers n n n n n n n High School | none | Short OJT49-9092 Commercial Divers n n n n n n n Postsecondary | none | Moderate OJT49-9093 Fabric Menders, Except Garment n n n n n n n High School | none | Long OJT49-9094 Locksmiths and Safe Repairers 84 79 -5 -6.0% 4 3 7 High School | none | Long OJT49-9095 Manufactured Building and Mobile
Home Installers n n n n n n n High School | none | Short OJT49-9096 Riggers 28 31 3 10.7% 1 2 3 High School | none | Moderate OJT49-9098 Helpers--Installation, Maintenance,
and Repair Workers 546 609 63 11.5% 28 44 78 High School | none | Short OJT49-9099 Installation, Maintenance, and
Repair Workers, All Other 476 527 51 10.7% 18 29 52 High School | none | Moderate OJT51-0000 Production Occupations 45,776 43,291 -2,485 -5.4% 1,823 3,153 4,72751-1011 First-Line Supervisors of
Production and Operating Workers 3,008 3,012 4 0.1% 96 193 289 High School | < 5 yrs | none51-2011 Aircraft Structure, Surfaces,
Rigging, and Systems Assemblers n n n n n n n High School | none | Moderate OJT51-2021 Coil Winders, Tapers, and Finishers 66 53 -13 -19.7% 3 4 6 High School | none | Moderate OJT51-2022 Electrical and Electronic Equipment
Assemblers 2,212 1,728 -484 -21.9% 100 129 181 High School | none | Moderate OJT51-2023 Electromechanical Equipment
Assemblers 1,224 954 -270 -22.1% 55 71 99 High School | none | Moderate OJT51-2031 Engine and Other Machine
Assemblers 197 174 -23 -11.7% 5 14 17 High School | none | Moderate OJT51-2041 Structural Metal Fabricators and
Fitters 271 223 -48 -17.7% 8 18 21 High School | none | Moderate OJT51-2091 Fiberglass Laminators and
Fabricators n n n n n n n High School | none | Moderate OJT51-2092 Team Assemblers 4,415 3,726 -689 -15.6% 174 295 400 High School | none | Moderate OJT51-2093 Timing Device Assemblers and
Adjusters n n n n n n n High School | none | Moderate OJT51-2099 Assemblers and Fabricators, All
Other 749 630 -119 -15.9% 29 50 67 High School | none | Moderate OJT51-3011 Bakers 981 1,076 95 9.7% 66 77 153 none | none | Long OJT51-3021 Butchers and Meat Cutters 510 540 30 5.9% 24 40 67 none | none | Long OJT51-3022 Meat, Poultry, and Fish Cutters and
Trimmers 94 104 10 10.6% 4 8 13 none | none | Short OJT51-3023 Slaughterers and Meat Packers 37 38 1 2.7% 2 3 5 none | none | Short OJT51-3091 Food and Tobacco Roasting,
Baking, and Drying Machine Operators and Tenders 58 64 6 10.3% 2 4 7 none | none | Moderate OJT
51-3092 Food Batchmakers 413 435 22 5.3% 23 35 60 High School | none | Moderate OJT51-3093 Food Cooking Machine Operators
and Tenders n n n n n n n High School | none | Moderate OJT51-3099 Food Processing Workers, All
Other 139 153 14 10.1% 6 10 17 none | none | Moderate OJT
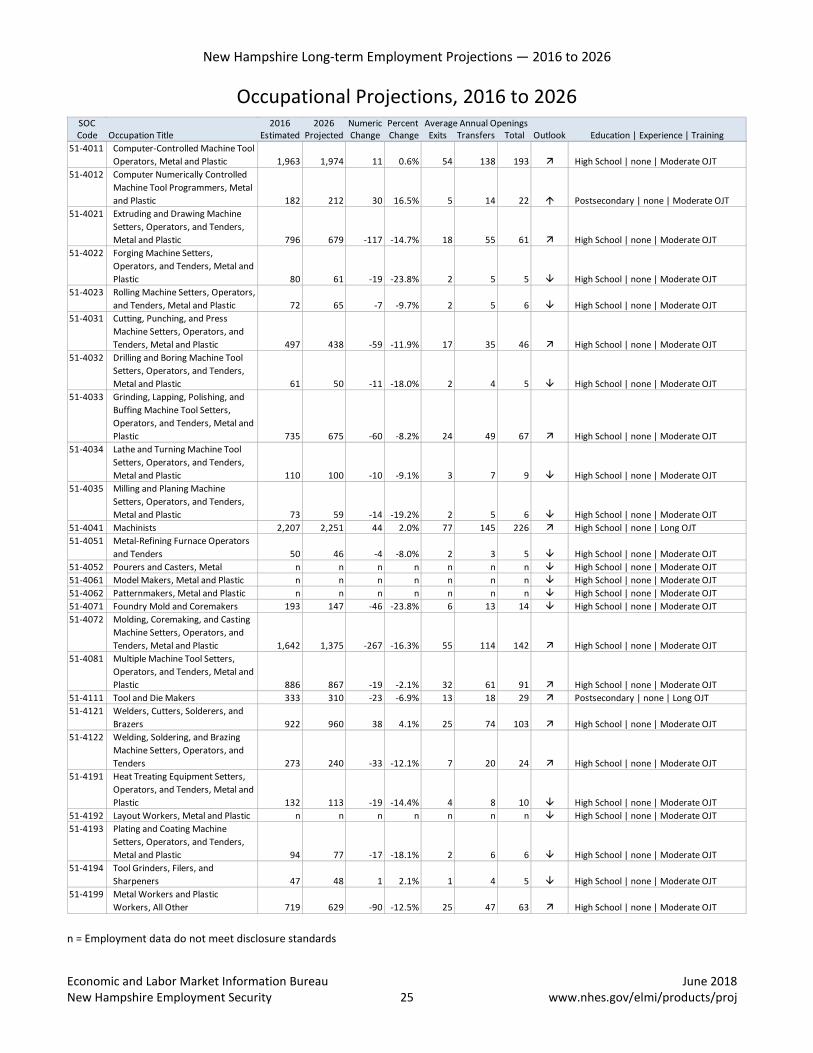
New Hampshire Long-term Employment Projections — 2016 to 2026
Economic and Labor Market Information Bureau June 2018 New Hampshire Employment Security 25 www.nhes.gov/elmi/products/proj
Occupational Projections, 2016 to 2026
n = Employment data do not meet disclosure standards
SOC 2016 2026 Numeric PercentCode Occupation Title Estimated Projected Change Change Exits Transfers Total Outlook Education | Experience | Training
Average Annual Openings
51-4011 Computer-Controlled Machine Tool Operators, Metal and Plastic 1,963 1,974 11 0.6% 54 138 193 High School | none | Moderate OJT
51-4012 Computer Numerically Controlled Machine Tool Programmers, Metal and Plastic 182 212 30 16.5% 5 14 22 Postsecondary | none | Moderate OJT
51-4021 Extruding and Drawing Machine Setters, Operators, and Tenders, Metal and Plastic 796 679 -117 -14.7% 18 55 61 High School | none | Moderate OJT
51-4022 Forging Machine Setters, Operators, and Tenders, Metal and Plastic 80 61 -19 -23.8% 2 5 5 High School | none | Moderate OJT
51-4023 Rolling Machine Setters, Operators, and Tenders, Metal and Plastic 72 65 -7 -9.7% 2 5 6 High School | none | Moderate OJT
51-4031 Cutting, Punching, and Press Machine Setters, Operators, and Tenders, Metal and Plastic 497 438 -59 -11.9% 17 35 46 High School | none | Moderate OJT
51-4032 Drilling and Boring Machine Tool Setters, Operators, and Tenders, Metal and Plastic 61 50 -11 -18.0% 2 4 5 High School | none | Moderate OJT
51-4033 Grinding, Lapping, Polishing, and Buffing Machine Tool Setters, Operators, and Tenders, Metal and Plastic 735 675 -60 -8.2% 24 49 67 High School | none | Moderate OJT
51-4034 Lathe and Turning Machine Tool Setters, Operators, and Tenders, Metal and Plastic 110 100 -10 -9.1% 3 7 9 High School | none | Moderate OJT
51-4035 Milling and Planing Machine Setters, Operators, and Tenders, Metal and Plastic 73 59 -14 -19.2% 2 5 6 High School | none | Moderate OJT
51-4041 Machinists 2,207 2,251 44 2.0% 77 145 226 High School | none | Long OJT51-4051 Metal-Refining Furnace Operators
and Tenders 50 46 -4 -8.0% 2 3 5 High School | none | Moderate OJT51-4052 Pourers and Casters, Metal n n n n n n n High School | none | Moderate OJT51-4061 Model Makers, Metal and Plastic n n n n n n n High School | none | Moderate OJT51-4062 Patternmakers, Metal and Plastic n n n n n n n High School | none | Moderate OJT51-4071 Foundry Mold and Coremakers 193 147 -46 -23.8% 6 13 14 High School | none | Moderate OJT51-4072 Molding, Coremaking, and Casting
Machine Setters, Operators, and Tenders, Metal and Plastic 1,642 1,375 -267 -16.3% 55 114 142 High School | none | Moderate OJT
51-4081 Multiple Machine Tool Setters, Operators, and Tenders, Metal and Plastic 886 867 -19 -2.1% 32 61 91 High School | none | Moderate OJT
51-4111 Tool and Die Makers 333 310 -23 -6.9% 13 18 29 Postsecondary | none | Long OJT51-4121 Welders, Cutters, Solderers, and
Brazers 922 960 38 4.1% 25 74 103 High School | none | Moderate OJT51-4122 Welding, Soldering, and Brazing
Machine Setters, Operators, and Tenders 273 240 -33 -12.1% 7 20 24 High School | none | Moderate OJT
51-4191 Heat Treating Equipment Setters, Operators, and Tenders, Metal and Plastic 132 113 -19 -14.4% 4 8 10 High School | none | Moderate OJT
51-4192 Layout Workers, Metal and Plastic n n n n n n n High School | none | Moderate OJT51-4193 Plating and Coating Machine
Setters, Operators, and Tenders, Metal and Plastic 94 77 -17 -18.1% 2 6 6 High School | none | Moderate OJT
51-4194 Tool Grinders, Filers, and Sharpeners 47 48 1 2.1% 1 4 5 High School | none | Moderate OJT
51-4199 Metal Workers and Plastic Workers, All Other 719 629 -90 -12.5% 25 47 63 High School | none | Moderate OJT

New Hampshire Long-term Employment Projections — 2016 to 2026
Economic and Labor Market Information Bureau June 2018 New Hampshire Employment Security 26 www.nhes.gov/elmi/products/proj
Occupational Projections, 2016 to 2026
n = Employment data do not meet disclosure standards
SOC 2016 2026 Numeric PercentCode Occupation Title Estimated Projected Change Change Exits Transfers Total Outlook Education | Experience | Training
Average Annual Openings
51-5111 Prepress Technicians and Workers 106 89 -17 -16.0% 4 7 9 Postsecondary | none | none51-5112 Printing Press Operators 1,025 993 -32 -3.1% 39 66 102 High School | none | Moderate OJT51-5113 Print Binding and Finishing
Workers 113 108 -5 -4.4% 8 6 14 High School | none | Moderate OJT51-6011 Laundry and Dry-Cleaning Workers 978 976 -2 -0.2% 66 66 132 none | none | Short OJT51-6021 Pressers, Textile, Garment, and
Related Materials 238 225 -13 -5.5% 14 15 28 none | none | Short OJT51-6031 Sewing Machine Operators 535 491 -44 -8.2% 29 25 50 none | none | Short OJT51-6041 Shoe and Leather Workers and
Repairers n n n n n n n High School | none | Moderate OJT51-6051 Sewers, Hand n n n n n n n none | none | Moderate OJT51-6052 Tailors, Dressmakers, and Custom
Sewers 113 105 -8 -7.1% 10 4 13 none | none | Moderate OJT51-6061 Textile Bleaching and Dyeing
Machine Operators and Tenders 83 80 -3 -3.6% 4 5 9 High School | none | Short OJT51-6062 Textile Cutting Machine Setters,
Operators, and Tenders 93 87 -6 -6.5% 6 6 11 High School | none | Moderate OJT51-6063 Textile Knitting and Weaving
Machine Setters, Operators, and Tenders 67 65 -2 -3.0% 4 4 8 High School | none | Short OJT
51-6064 Textile Winding, Twisting, and Drawing Out Machine Setters, Operators, and Tenders n n n n n n n High School | none | Moderate OJT
51-6091 Extruding and Forming Machine Setters, Operators, and Tenders, Synthetic and Glass Fibers 156 150 -6 -3.8% 8 10 17 High School | none | Moderate OJT
51-6092 Fabric and Apparel Patternmakers n n n n n n n High School | none | Moderate OJT51-6093 Upholsterers n n n n n n n High School | none | Moderate OJT51-6099 Textile, Apparel, and Furnishings
Workers, All Other 46 44 -2 -4.3% 2 3 5 High School | none | Short OJT51-7011 Cabinetmakers and Bench
Carpenters 531 488 -43 -8.1% 24 28 48 High School | none | Moderate OJT51-7021 Furniture Finishers 36 34 -2 -5.6% 2 1 3 High School | none | Short OJT51-7031 Model Makers, Wood n n n n n n n High School | none | Moderate OJT51-7041 Sawing Machine Setters,
Operators, and Tenders, Wood 246 239 -7 -2.8% 10 18 27 High School | none | Moderate OJT51-7042 Woodworking Machine Setters,
Operators, and Tenders, Except Sawing 614 575 -39 -6.4% 23 41 60 High School | none | Moderate OJT
51-7099 Woodworkers, All Other n n n n n n n High School | none | Moderate OJT51-8011 Nuclear Power Reactor Operators n n n n n n n High School | none | Long OJT51-8012 Power Distributors and
Dispatchers 52 54 2 3.8% 1 3 4 High School | none | Long OJT51-8013 Power Plant Operators 163 163 0 0.0% 4 10 14 High School | none | Long OJT51-8021 Stationary Engineers and Boiler
Operators 121 126 5 4.1% 4 9 13 High School | none | Long OJT51-8031 Water and Wastewater Treatment
Plant and System Operators 379 362 -17 -4.5% 11 20 29 High School | none | Long OJT51-8091 Chemical Plant and System
Operators n n n n n n n High School | none | Moderate OJT51-8092 Gas Plant Operators n n n n n n n High School | none | Long OJT51-8093 Petroleum Pump System
Operators, Refinery Operators, and Gaugers n n n n n n n High School | none | Moderate OJT
51-8099 Plant and System Operators, All Other 58 62 4 6.9% 1 4 5 High School | none | Moderate OJT
51-9011 Chemical Equipment Operators and Tenders 309 330 21 6.8% 9 25 36 High School | none | Moderate OJT
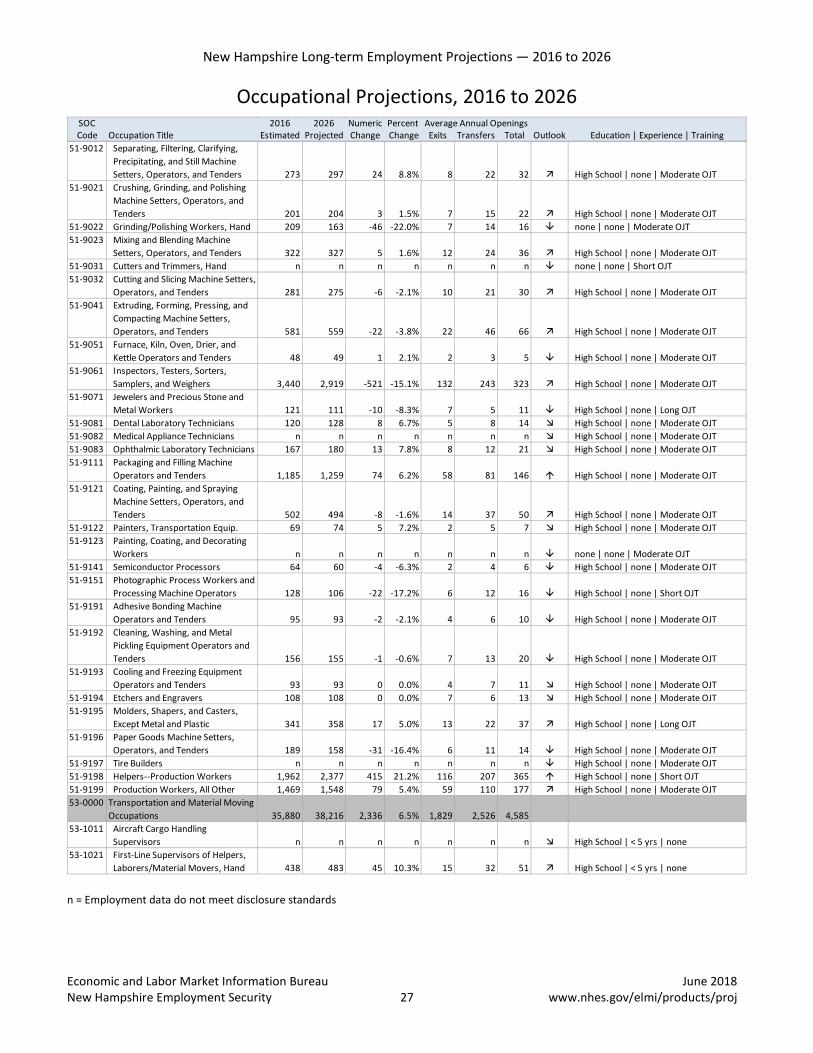
New Hampshire Long-term Employment Projections — 2016 to 2026
Economic and Labor Market Information Bureau June 2018 New Hampshire Employment Security 27 www.nhes.gov/elmi/products/proj
Occupational Projections, 2016 to 2026
n = Employment data do not meet disclosure standards
SOC 2016 2026 Numeric PercentCode Occupation Title Estimated Projected Change Change Exits Transfers Total Outlook Education | Experience | Training
Average Annual Openings
51-9012 Separating, Filtering, Clarifying, Precipitating, and Still Machine Setters, Operators, and Tenders 273 297 24 8.8% 8 22 32 High School | none | Moderate OJT
51-9021 Crushing, Grinding, and Polishing Machine Setters, Operators, and Tenders 201 204 3 1.5% 7 15 22 High School | none | Moderate OJT
51-9022 Grinding/Polishing Workers, Hand 209 163 -46 -22.0% 7 14 16 none | none | Moderate OJT51-9023 Mixing and Blending Machine
Setters, Operators, and Tenders 322 327 5 1.6% 12 24 36 High School | none | Moderate OJT51-9031 Cutters and Trimmers, Hand n n n n n n n none | none | Short OJT51-9032 Cutting and Slicing Machine Setters,
Operators, and Tenders 281 275 -6 -2.1% 10 21 30 High School | none | Moderate OJT51-9041 Extruding, Forming, Pressing, and
Compacting Machine Setters, Operators, and Tenders 581 559 -22 -3.8% 22 46 66 High School | none | Moderate OJT
51-9051 Furnace, Kiln, Oven, Drier, and Kettle Operators and Tenders 48 49 1 2.1% 2 3 5 High School | none | Moderate OJT
51-9061 Inspectors, Testers, Sorters, Samplers, and Weighers 3,440 2,919 -521 -15.1% 132 243 323 High School | none | Moderate OJT
51-9071 Jewelers and Precious Stone and Metal Workers 121 111 -10 -8.3% 7 5 11 High School | none | Long OJT
51-9081 Dental Laboratory Technicians 120 128 8 6.7% 5 8 14 High School | none | Moderate OJT51-9082 Medical Appliance Technicians n n n n n n n High School | none | Moderate OJT51-9083 Ophthalmic Laboratory Technicians 167 180 13 7.8% 8 12 21 High School | none | Moderate OJT51-9111 Packaging and Filling Machine
Operators and Tenders 1,185 1,259 74 6.2% 58 81 146 High School | none | Moderate OJT51-9121 Coating, Painting, and Spraying
Machine Setters, Operators, and Tenders 502 494 -8 -1.6% 14 37 50 High School | none | Moderate OJT
51-9122 Painters, Transportation Equip. 69 74 5 7.2% 2 5 7 High School | none | Moderate OJT51-9123 Painting, Coating, and Decorating
Workers n n n n n n n none | none | Moderate OJT51-9141 Semiconductor Processors 64 60 -4 -6.3% 2 4 6 High School | none | Moderate OJT51-9151 Photographic Process Workers and
Processing Machine Operators 128 106 -22 -17.2% 6 12 16 High School | none | Short OJT51-9191 Adhesive Bonding Machine
Operators and Tenders 95 93 -2 -2.1% 4 6 10 High School | none | Moderate OJT51-9192 Cleaning, Washing, and Metal
Pickling Equipment Operators and Tenders 156 155 -1 -0.6% 7 13 20 High School | none | Moderate OJT
51-9193 Cooling and Freezing Equipment Operators and Tenders 93 93 0 0.0% 4 7 11 High School | none | Moderate OJT
51-9194 Etchers and Engravers 108 108 0 0.0% 7 6 13 High School | none | Moderate OJT51-9195 Molders, Shapers, and Casters,
Except Metal and Plastic 341 358 17 5.0% 13 22 37 High School | none | Long OJT51-9196 Paper Goods Machine Setters,
Operators, and Tenders 189 158 -31 -16.4% 6 11 14 High School | none | Moderate OJT51-9197 Tire Builders n n n n n n n High School | none | Moderate OJT51-9198 Helpers--Production Workers 1,962 2,377 415 21.2% 116 207 365 High School | none | Short OJT51-9199 Production Workers, All Other 1,469 1,548 79 5.4% 59 110 177 High School | none | Moderate OJT53-0000 Transportation and Material Moving
Occupations 35,880 38,216 2,336 6.5% 1,829 2,526 4,58553-1011 Aircraft Cargo Handling
Supervisors n n n n n n n High School | < 5 yrs | none53-1021 First-Line Supervisors of Helpers,
Laborers/Material Movers, Hand 438 483 45 10.3% 15 32 51 High School | < 5 yrs | none

New Hampshire Long-term Employment Projections — 2016 to 2026
Economic and Labor Market Information Bureau June 2018 New Hampshire Employment Security 28 www.nhes.gov/elmi/products/proj
Occupational Projections, 2016 to 2026
n = Employment data do not meet disclosure standards
SOC 2016 2026 Numeric PercentCode Occupation Title Estimated Projected Change Change Exits Transfers Total Outlook Education | Experience | Training
Average Annual Openings
53-1031 First-Line Supervisors of Transportation and Material-Moving Machine and Vehicle Oper. 643 702 59 9.2% 22 46 74 High School | < 5 yrs | none
53-2011 Airline Pilots, Copilots, and Flight Engineers 37 40 3 8.1% 1 2 3 Bachelor's | < 5 yr | Moderate OJT
53-2012 Commercial Pilots 214 220 6 2.8% 6 14 21 High School | none | Moderate OJT53-2021 Air Traffic Controllers 400 403 3 0.8% 13 24 37 Associate's | none | Long OJT53-2022 Airfield Operations Specialists n n n n n n n High School | none | Long OJT53-2031 Flight Attendants n n n n n n n High School | < 5 yrs | Moderate OJT53-3011 Ambulance Drivers and Attendants,
Except Emergency Medical n n n n n n n High School | none | Moderate OJT53-3021 Bus Drivers, Transit and Intercity 248 276 28 11.3% 21 11 35 High School | none | Moderate OJT53-3022 Bus Drivers, School or Special Client 2,650 2,979 329 12.4% 221 115 369 High School | none | Short OJT53-3031 Driver/Sales Workers 2,516 2,537 21 0.8% 107 159 268 High School | none | Short OJT53-3032 Heavy and Tractor-Trailer Truck
Drivers 6,935 7,505 570 8.2% 306 454 817 Postsecondary | none | Short OJT53-3033 Light Truck or Delivery Services
Drivers 4,910 5,290 380 7.7% 216 320 574 High School | none | Short OJT53-3041 Taxi Drivers and Chauffeurs 1,810 1,856 46 2.5% 109 74 188 none | none | Short OJT53-3099 Motor Vehicle Operators, All Other 282 311 29 10.3% 34 16 53 none | none | Short OJT53-4011 Locomotive Engineers 29 33 4 13.8% 1 2 3 High School | < 5 yrs | Moderate OJT53-4013 Rail Yard Engineers, Dinkey
Operators, and Hostlers n n n n n n n High School | none | Moderate OJT53-4031 Railroad Conductors/Yardmasters 27 30 3 11.1% 1 2 3 High School | none | Moderate OJT53-4099 Rail Transport Workers, All Other n n n n n n n High School | none | Moderate OJT53-5011 Sailors and Marine Oilers n n n n n n n none | none | Moderate OJT53-5021 Captains, Mates, and Pilots of
Water Vessels 57 63 6 10.5% 2 4 7 Postsecondary | < 5 yrs | none53-5022 Motorboat Operators n n n n n n n Postsecondary | < 5 yrs | none53-5031 Ship Engineers n n n n n n n Postsecondary | < 5 yrs | none53-6011 Bridge and Lock Tenders n n n n n n n High School | none | Short OJT53-6021 Parking Lot Attendants 343 364 21 6.1% 21 31 54 none | none | Short OJT53-6031 Automotive and Watercraft Service
Attendants 434 480 46 10.6% 24 50 79 none | none | Short OJT53-6041 Traffic Technicians n n n n n n n High School | none | Moderate OJT53-6051 Transportation Inspectors 50 52 2 4.0% 2 3 5 High School | none | Moderate OJT53-6061 Transportation Attendants, Except
Flight Attendants n n n n n n n High School | none | Short OJT53-6099 Transportation Workers, All Other n n n n n n n High School | none | Short OJT53-7011 Conveyor Operators and Tenders 36 39 3 8.3% 2 3 5 none | none | Short OJT53-7021 Crane and Tower Operators n n n n n n n High School | < 5 yrs | Moderate OJT53-7032 Excavating and Loading Machine
and Dragline Operators 447 470 23 5.1% 17 33 52 High School | < 5 yrs | Moderate OJT53-7041 Hoist and Winch Operators n n n n n n n none | none | Short OJT53-7051 Industrial Truck and Tractor Oper. 1,538 1,652 114 7.4% 56 119 186 none | none | Short OJT53-7061 Cleaners of Vehicles and Equipment 1,147 1,291 144 12.6% 63 106 183 none | none | Short OJT53-7062 Laborers and Freight, Stock, and
Material Movers, Hand 6,778 7,279 501 7.4% 348 601 999 none | none | Short OJT53-7063 Machine Feeders and Offbearers 537 600 63 11.7% 31 46 83 none | none | Short OJT53-7064 Packers and Packagers, Hand 2,099 1,921 -178 -8.5% 136 164 282 none | none | Short OJT53-7071 Gas Compressor and Gas Pumping
Station Operators n n n n n n n High School | none | Moderate OJT53-7072 Pump Operators, Except Wellhead
Pumpers n n n n n n n High School | none | Moderate OJT53-7081 Refuse and Recyclable Material
Collectors 821 884 63 7.7% 39 62 107 none | none | Short OJT53-7121 Tank Car, Truck, and Ship Loaders n n n n n n n none | none | Short OJT53-7199 Material Moving Workers, All
Other n n n n n n n none | none | Short OJT
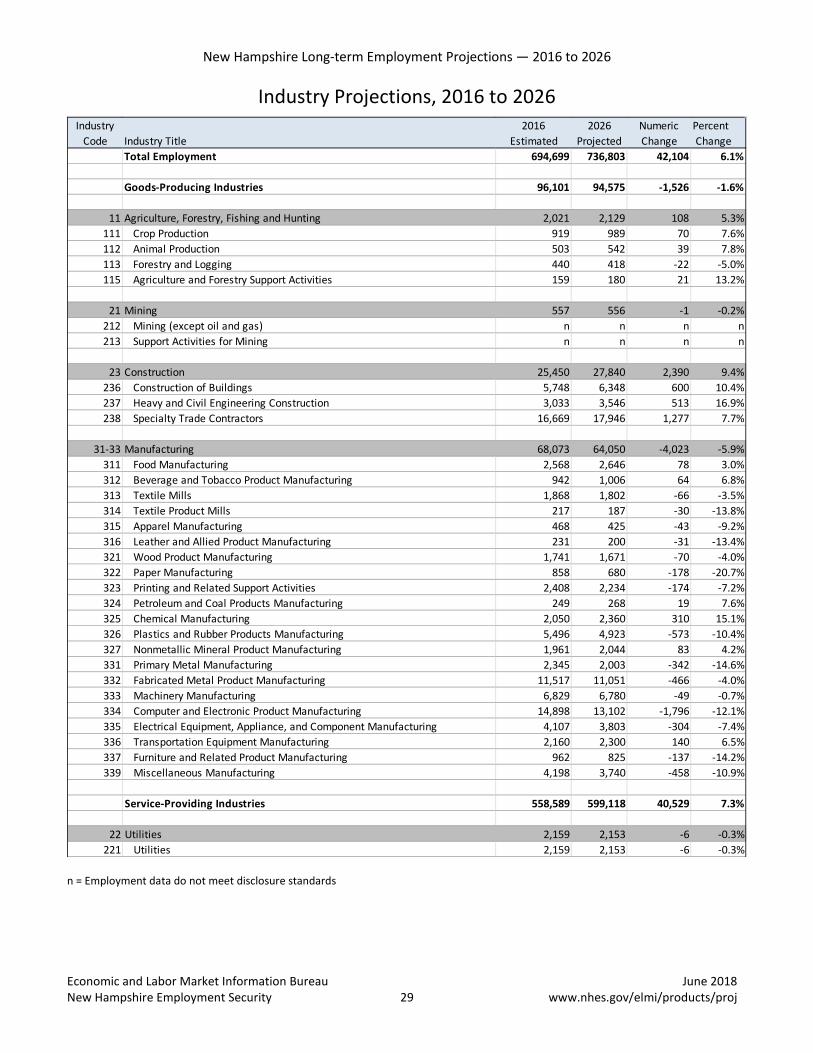
New Hampshire Long-term Employment Projections — 2016 to 2026
Economic and Labor Market Information Bureau June 2018 New Hampshire Employment Security 29 www.nhes.gov/elmi/products/proj
Industry Projections, 2016 to 2026
n = Employment data do not meet disclosure standards
Industry 2016 2026 Numeric PercentCode Industry Title Estimated Projected Change Change
Total Employment 694,699 736,803 42,104 6.1%
Goods-Producing Industries 96,101 94,575 -1,526 -1.6%
11 Agriculture, Forestry, Fishing and Hunting 2,021 2,129 108 5.3%111 Crop Production 919 989 70 7.6%112 Animal Production 503 542 39 7.8%113 Forestry and Logging 440 418 -22 -5.0%115 Agriculture and Forestry Support Activities 159 180 21 13.2%
21 Mining 557 556 -1 -0.2%212 Mining (except oil and gas) n n n n213 Support Activities for Mining n n n n
23 Construction 25,450 27,840 2,390 9.4%236 Construction of Buildings 5,748 6,348 600 10.4%237 Heavy and Civil Engineering Construction 3,033 3,546 513 16.9%238 Specialty Trade Contractors 16,669 17,946 1,277 7.7%
31-33 Manufacturing 68,073 64,050 -4,023 -5.9%311 Food Manufacturing 2,568 2,646 78 3.0%312 Beverage and Tobacco Product Manufacturing 942 1,006 64 6.8%313 Textile Mills 1,868 1,802 -66 -3.5%314 Textile Product Mills 217 187 -30 -13.8%315 Apparel Manufacturing 468 425 -43 -9.2%316 Leather and Allied Product Manufacturing 231 200 -31 -13.4%321 Wood Product Manufacturing 1,741 1,671 -70 -4.0%322 Paper Manufacturing 858 680 -178 -20.7%323 Printing and Related Support Activities 2,408 2,234 -174 -7.2%324 Petroleum and Coal Products Manufacturing 249 268 19 7.6%325 Chemical Manufacturing 2,050 2,360 310 15.1%326 Plastics and Rubber Products Manufacturing 5,496 4,923 -573 -10.4%327 Nonmetallic Mineral Product Manufacturing 1,961 2,044 83 4.2%331 Primary Metal Manufacturing 2,345 2,003 -342 -14.6%332 Fabricated Metal Product Manufacturing 11,517 11,051 -466 -4.0%333 Machinery Manufacturing 6,829 6,780 -49 -0.7%334 Computer and Electronic Product Manufacturing 14,898 13,102 -1,796 -12.1%335 Electrical Equipment, Appliance, and Component Manufacturing 4,107 3,803 -304 -7.4%336 Transportation Equipment Manufacturing 2,160 2,300 140 6.5%337 Furniture and Related Product Manufacturing 962 825 -137 -14.2%339 Miscellaneous Manufacturing 4,198 3,740 -458 -10.9%
Service-Providing Industries 558,589 599,118 40,529 7.3%
22 Utilities 2,159 2,153 -6 -0.3%221 Utilities 2,159 2,153 -6 -0.3%
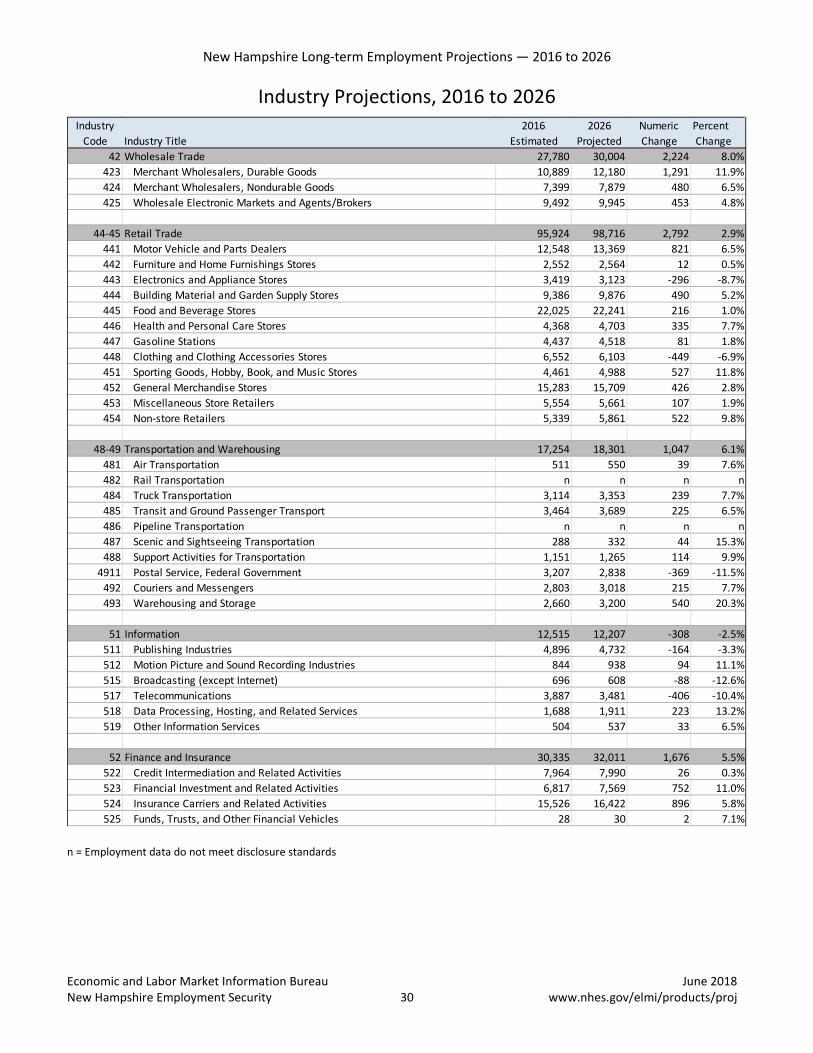
New Hampshire Long-term Employment Projections — 2016 to 2026
Economic and Labor Market Information Bureau June 2018 New Hampshire Employment Security 30 www.nhes.gov/elmi/products/proj
Industry Projections, 2016 to 2026
n = Employment data do not meet disclosure standards
Industry 2016 2026 Numeric PercentCode Industry Title Estimated Projected Change Change
42 Wholesale Trade 27,780 30,004 2,224 8.0%423 Merchant Wholesalers, Durable Goods 10,889 12,180 1,291 11.9%424 Merchant Wholesalers, Nondurable Goods 7,399 7,879 480 6.5%425 Wholesale Electronic Markets and Agents/Brokers 9,492 9,945 453 4.8%
44-45 Retail Trade 95,924 98,716 2,792 2.9%441 Motor Vehicle and Parts Dealers 12,548 13,369 821 6.5%442 Furniture and Home Furnishings Stores 2,552 2,564 12 0.5%443 Electronics and Appliance Stores 3,419 3,123 -296 -8.7%444 Building Material and Garden Supply Stores 9,386 9,876 490 5.2%445 Food and Beverage Stores 22,025 22,241 216 1.0%446 Health and Personal Care Stores 4,368 4,703 335 7.7%447 Gasoline Stations 4,437 4,518 81 1.8%448 Clothing and Clothing Accessories Stores 6,552 6,103 -449 -6.9%451 Sporting Goods, Hobby, Book, and Music Stores 4,461 4,988 527 11.8%452 General Merchandise Stores 15,283 15,709 426 2.8%453 Miscellaneous Store Retailers 5,554 5,661 107 1.9%454 Non-store Retailers 5,339 5,861 522 9.8%
48-49 Transportation and Warehousing 17,254 18,301 1,047 6.1%481 Air Transportation 511 550 39 7.6%482 Rail Transportation n n n n484 Truck Transportation 3,114 3,353 239 7.7%485 Transit and Ground Passenger Transport 3,464 3,689 225 6.5%486 Pipeline Transportation n n n n487 Scenic and Sightseeing Transportation 288 332 44 15.3%488 Support Activities for Transportation 1,151 1,265 114 9.9%
4911 Postal Service, Federal Government 3,207 2,838 -369 -11.5%492 Couriers and Messengers 2,803 3,018 215 7.7%493 Warehousing and Storage 2,660 3,200 540 20.3%
51 Information 12,515 12,207 -308 -2.5%511 Publishing Industries 4,896 4,732 -164 -3.3%512 Motion Picture and Sound Recording Industries 844 938 94 11.1%515 Broadcasting (except Internet) 696 608 -88 -12.6%517 Telecommunications 3,887 3,481 -406 -10.4%518 Data Processing, Hosting, and Related Services 1,688 1,911 223 13.2%519 Other Information Services 504 537 33 6.5%
52 Finance and Insurance 30,335 32,011 1,676 5.5%522 Credit Intermediation and Related Activities 7,964 7,990 26 0.3%523 Financial Investment and Related Activities 6,817 7,569 752 11.0%524 Insurance Carriers and Related Activities 15,526 16,422 896 5.8%525 Funds, Trusts, and Other Financial Vehicles 28 30 2 7.1%
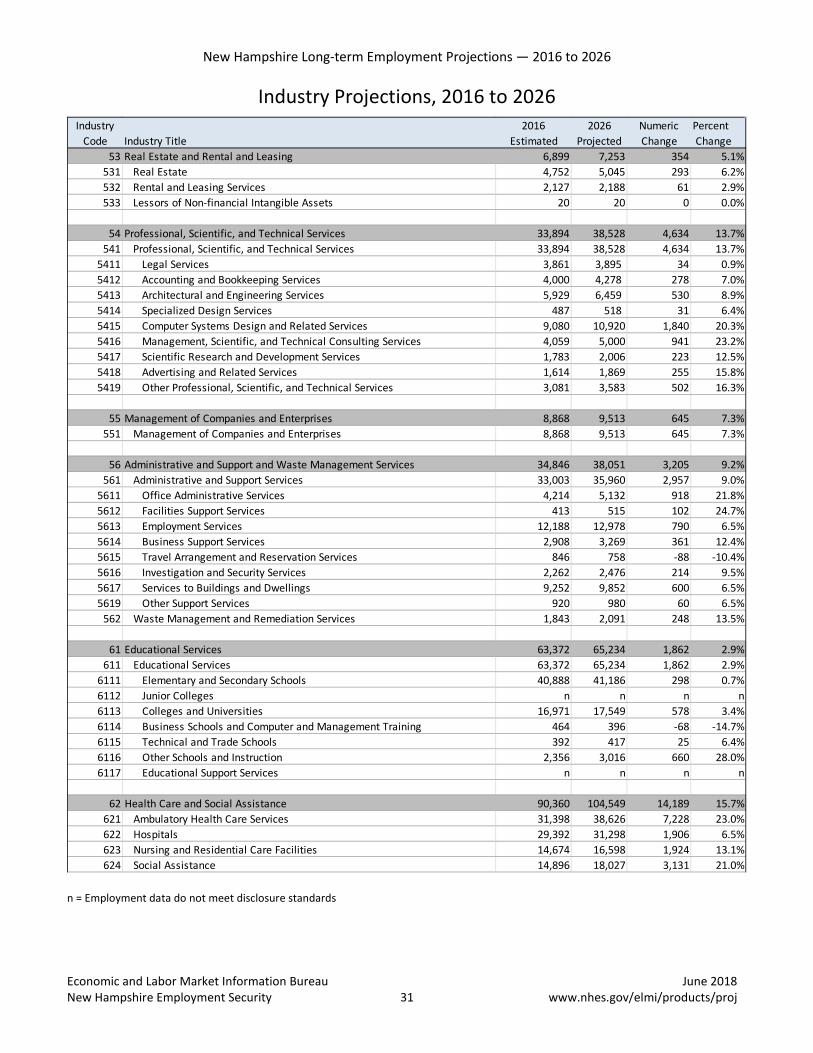
New Hampshire Long-term Employment Projections — 2016 to 2026
Economic and Labor Market Information Bureau June 2018 New Hampshire Employment Security 31 www.nhes.gov/elmi/products/proj
Industry Projections, 2016 to 2026
n = Employment data do not meet disclosure standards
Industry 2016 2026 Numeric PercentCode Industry Title Estimated Projected Change Change
53 Real Estate and Rental and Leasing 6,899 7,253 354 5.1%531 Real Estate 4,752 5,045 293 6.2%532 Rental and Leasing Services 2,127 2,188 61 2.9%533 Lessors of Non-financial Intangible Assets 20 20 0 0.0%
54 Professional, Scientific, and Technical Services 33,894 38,528 4,634 13.7%541 Professional, Scientific, and Technical Services 33,894 38,528 4,634 13.7%
5411 Legal Services 3,861 3,895 34 0.9%5412 Accounting and Bookkeeping Services 4,000 4,278 278 7.0%5413 Architectural and Engineering Services 5,929 6,459 530 8.9%5414 Specialized Design Services 487 518 31 6.4%5415 Computer Systems Design and Related Services 9,080 10,920 1,840 20.3%5416 Management, Scientific, and Technical Consulting Services 4,059 5,000 941 23.2%5417 Scientific Research and Development Services 1,783 2,006 223 12.5%5418 Advertising and Related Services 1,614 1,869 255 15.8%5419 Other Professional, Scientific, and Technical Services 3,081 3,583 502 16.3%
55 Management of Companies and Enterprises 8,868 9,513 645 7.3%551 Management of Companies and Enterprises 8,868 9,513 645 7.3%
56 Administrative and Support and Waste Management Services 34,846 38,051 3,205 9.2%561 Administrative and Support Services 33,003 35,960 2,957 9.0%
5611 Office Administrative Services 4,214 5,132 918 21.8%5612 Facilities Support Services 413 515 102 24.7%5613 Employment Services 12,188 12,978 790 6.5%5614 Business Support Services 2,908 3,269 361 12.4%5615 Travel Arrangement and Reservation Services 846 758 -88 -10.4%5616 Investigation and Security Services 2,262 2,476 214 9.5%5617 Services to Buildings and Dwellings 9,252 9,852 600 6.5%5619 Other Support Services 920 980 60 6.5%
562 Waste Management and Remediation Services 1,843 2,091 248 13.5%
61 Educational Services 63,372 65,234 1,862 2.9%611 Educational Services 63,372 65,234 1,862 2.9%
6111 Elementary and Secondary Schools 40,888 41,186 298 0.7%6112 Junior Colleges n n n n6113 Colleges and Universities 16,971 17,549 578 3.4%6114 Business Schools and Computer and Management Training 464 396 -68 -14.7%6115 Technical and Trade Schools 392 417 25 6.4%6116 Other Schools and Instruction 2,356 3,016 660 28.0%6117 Educational Support Services n n n n
62 Health Care and Social Assistance 90,360 104,549 14,189 15.7%621 Ambulatory Health Care Services 31,398 38,626 7,228 23.0%622 Hospitals 29,392 31,298 1,906 6.5%623 Nursing and Residential Care Facilities 14,674 16,598 1,924 13.1%624 Social Assistance 14,896 18,027 3,131 21.0%

New Hampshire Long-term Employment Projections — 2016 to 2026
Economic and Labor Market Information Bureau June 2018 New Hampshire Employment Security 32 www.nhes.gov/elmi/products/proj
Industry Projections, 2016 to 2026
n = Employment data do not meet disclosure standards
1 Employment for public schools and colleges is included in sector 61, Educational Services 2 Employment at the State Hospital is included in subsector 622, Hospitals
Industry 2016 2026 Numeric PercentCode Industry Title Estimated Projected Change Change
71 Arts, Entertainment, and Recreation 11,590 12,601 1,011 8.7%711 Performing Arts, Spectator Sports, and Related Industries 1,477 1,560 83 5.6%712 Museums, Historical Sites, and Similar Institutions 570 658 88 15.4%713 Amusements, Gambling, and Recreation 9,543 10,383 840 8.8%
72 Accommodation and Food Services 58,139 62,993 4,854 8.3%721 Accommodation 9,478 9,744 266 2.8%722 Food Services and Drinking Places 48,661 53,249 4,588 9.4%
81 Other Services (Except Government) 25,136 27,016 1,880 7.5%811 Repair and Maintenance 6,778 7,265 487 7.2%812 Personal and Laundry 6,875 7,680 805 11.7%813 Membership Organizations 10,670 11,268 598 5.6%814 Private Households 813 803 -10 -1.2%
Government 39,518 39,988 470 1.2%Federal Government, excluding Postal Service 4,455 4,426 -29 -0.7%State Government, excluding Education and Hospitals1,2 12,533 12,392 -141 -1.1%Local Government, excluding Education1 22,530 23,170 640 2.8%
Self-employed Workers 40,009 43,110 3,101 7.8%