Embed Size (px)
Citation preview
NEW HIGH STRENGTH AND FASTER DRILLING TSP DIAMOND CUTTERS
DOE Award Number: DE-FC26-97FT34368
FINAL REPORT
Principal Investigator Robert Radtke
Technology International, Inc.
2103 River Falls Drive Kingwood, TX 77339-3154
Ph: (281) 359-8520 FAX: (281) 359-8527
Email: [email protected]
July 2006

DISCLAIMER
This report was prepared as an account of work sponsored by an agency of the United States Government. Neither the United States Government nor any agency thereof, nor any of their employees, makes any warranty, express or implied, or assumes any legal liability or responsibility for the accuracy, completeness, or usefulness of any information, apparatus, product, or process disclosed, or represents that its use would not infringe privately owned rights. Reference herein to any specific commercial product, process, or service by trade name, trademark, manufacturer, or otherwise does not necessarily constitute or imply its endorsement, recommendation, or favoring by the United States Government or any agency thereof. The views and opinions of authors expressed herein do not necessarily state or reflect those of the United States Government or any agency thereof.
Available to the public from the National Technical Information Service, U.S. Department of Commerce, 5285 Port Royal Road, Springfield, VA 22161; phone orders are accepted at (703) 487-4650.
i
ABSTRACT
The manufacture of thermally stable diamond (TSP) cutters for drill bits used in petroleum drilling requires the brazing of two dissimilar materials -- TSP diamond and tungsten carbide. The ENDURUSTM thermally stable diamond cutter developed by Technology International, Inc. exhibits (i) high attachment (shear) strength, exceeding 345 MPa (50,000 psi), (ii) TSP diamond impact strength increased by 36%, (iii) prevents TSP fracture when drilling hard rock, and (iv) maintains a sharp edge when drilling hard and abrasive rock. A novel microwave brazing (MWB) method for joining dissimilar materials has been developed. A conventional braze filler metal is combined with microwave heating which minimizes thermal residual stress between materials with dissimilar coefficients of thermal expansion. The process results in preferential heating of the lower thermal expansion diamond material, thus providing the ability to match the thermal expansion of the dissimilar material pair. Methods for brazing with both conventional and exothermic braze filler metals have been developed. Finite element modeling (FEM) assisted in the fabrication of TSP cutters controllable thermal residual stress and high shear attachment strength. Further, a unique cutter design for absorbing shock, the densification of otherwise porous TSP diamond for increased mechanical strength, and diamond ion implantation for increased diamond fracture resistance resulted in successful drill bit tests.
ii
Table of Contents
1.0 Executive Summary .....................................................................................................1
2.0 Introduction..................................................................................................................3
3.0 Results and Discussion ................................................................................................7
3.1 Physical Properties of TSP Diamond...................................................................7
3.1.1 Coefficient of Thermal Expansion (CTE)............................................8
3.1.2 Heat Capacity.......................................................................................9
3.1.3 Mechanical Properties........................................................................11
3.1.4 Surface Roughness.............................................................................14
3.1.5 Density and Porosity ..........................................................................16
3.1.6 Microstructure Characterization ........................................................17
3.1.7 Fracture Toughness and Impact Energy ............................................17
3.2 TSP Diamond Material Processing....................................................................29
3.2.1 Densification ......................................................................................29
3.2.2 Ion Implantation.................................................................................31
3.3 Cutter Finite Element Modeling ........................................................................39
3.3.1 Effect of Braze Filler Material Thickness..........................................41
3.3.2 Effect of Braze Temperature..............................................................42
3.3.3 Effect of TSP Diamond Diameter......................................................42
3.3.4 Equivalent Plastic Strain ....................................................................43
3.3.5 Minimization of Stresses-Effect of Temperature Differential (∆T) ..43
iii

3.4 Cutter Design .....................................................................................................50
3.4.1 Conventional Cylindrical Designs .....................................................50
3.4.2 Shock Resistant Cutter Design...........................................................50
3.4.3 Continuous Self Sharpening Cutter Design .......................................52
3.4.4 Compression Joint Design .................................................................53
3.5 Cutter Microwave Brazing ................................................................................53
3.5.1 Materials ............................................................................................53
3.5.2 Microwave Brazing Process ..............................................................54
3.6 Cutter Laboratory Testing..................................................................................61
3.6.1 Visual Examination and Ultrasonic Testing ......................................61
3.6.2 Shear Test...........................................................................................62
3.6.3 Rock Abrasion Test............................................................................63
3.6.4 Rock Wear Test..................................................................................65
3.6.5 Rock Drilling Tests ............................................................................66
3.7 Field Drilling Tests ............................................................................................79
3.7.1 Catoosa Well Tests ............................................................................79
4.0 Conclusions................................................................................................................82
5.0 References..................................................................................................................84
6.0 List of Acronyms and Abbreviations.........................................................................85
7.0 SI Metric Conversions ...............................................................................................86
8.0 Acknowledgements....................................................................................................86
iv
Table List
Table 1 – Physical Property Test Schedule........................................................................7
Table 2 – Data for Calculation of the Coefficient of the Thermal Expansion of
TSP Diamond.....................................................................................................9
Table 3 – Heat Capacity Data for the As-Received TSP Diamond Samples...................10
Table 4 – Summary of Laser Flash Thermal Conductivity Results.................................10
Table 5a – Compressive Strength of As-Received TDP Diamond Discs........................11
Table 5b – Leached TSP Diamond Bars..........................................................................12
Table 6 – Flexural Strength of the As-Received TSP Diamond Bars..............................13
Table 7 – Shear strength of the As-Received TSP Diamond Samples ............................14
Table 8 – TSP Diamond Surface Finish ..........................................................................15
Table 9 – Fracture Toughness Data for Aluminum Alloys .............................................23
Table 10 – Load and Energy as a Function of Specimen Thickness ...............................27
Table 11 – Details of Impact Tests on TSP Diamond Samples.......................................28
Table 12 – Properties of TiNi Ion Implantation Species .................................................37
Table 13 – Impact Test Data of 1.5Mm Thick TSP Diamond Samples Implanted with
Titanium and Nickel ......................................................................................37
Table 14 – Percentage Changes in Impact Energy ..........................................................38
Table 15 – Physical and Mechanical Properties of the Components Involved................44
Table 16 – Conventional Cutter Designs .........................................................................50
Table 17 – Braze Quality .................................................................................................56
Table 18 – Attachment Shear Strength of ENDURUS™ Cutters ...................................62
Table 19 – Lathe Abrasion Test Data ..............................................................................64
v

Table 20 – Horizontal Mill Wear Tests ...........................................................................66
Table 21 – Test Cutter Modifications ..............................................................................71
Table 22 – CWTF Data for Cutter Series No. C525 through C529.................................71
vi

Figure List
Figure 1 – Effect of PDC and TSP Cutter Temperature on Wear Rate ...............................5
Figure 2 – Effect of PDC Cutter Speed on Wear Rate ....................................................... 5
Figure 3 – Effect of Bit Type and RPM on Relative ROP.................................................. 5
Figure 4 – Density and Porosity of TSP Diamond ..................................................... 16, 17
Figure 4a – Density Variation........................................................................................... 16
Figure 4b – Porosity Variation.......................................................................................... 17
Figure 5a – Relation between K1C and CVN Values in the Upper Shelf Region ............. 24
Figure 5b–Transition Temperature Correlation between K1C and CV from a Series on
Unradiated Steels ............................................................................................ 24
Figure 5c – Fracture Toughness of Irradiated Materials................................................... 25
Figure 6 – Instrumented Drop Weight Impact Test Machine ........................................... 25
Figure 7 – Load Time Curves for Nominally 1.5Mm Thick TSP Diamond Samples ...... 27
Figure 8 – Energy to Maximum Load as a Function of TSP Diamond Specimen
Thickness ......................................................................................................... 27
Figure 9 – Schematic of the Effect of Ion Implantation ................................................... 34
Figure 10 – Schematic of the Direct Ion Implantation System......................................... 34
Figure 11 – Photograph of the Ion Source ........................................................................ 35
Figure 12 – Impact Test Load versus Time Curves.......................................................... 38
Figure 13 – Impact Strength/Fracture Toughness of TSP Diamond................................. 39
Figure 14 – Schematic - Origin of Cool-Down Stresses Using Conventional Brazing
Methods......................................................................................................... 44
vii

Figure 15 – Boundary Conditions Applied in the WC-Braze Filler Metal TSP Diamond
Joint............................................................................................................... 45
Figure 16 – Axial Stresses as a Function of the Braze Filler Metal Thickness ................ 45
Figure 17 – Shear Stresses at Filler Metal Thickness of 30 and 100um........................... 46
Figure 18 – Radial Stresses as a Function of the Braze Filter Metal Thickness............... 46
Figure 19 a– Axial Stresses as a Function of the Braze Temperature .............................. 47
Figure 19b – Radial Stresses as a Function of the Braze Temperature ............................ 47
Figure 20 – (a) Axial (b) Shear, (c) Radial Stresses as a Function of TSP Diamond
Diameter........................................................................................................ 48
Figure 21 – Counter Plots of the Equivalent Plastic Strain with Braze Filler Metal
Thicknesses ................................................................................................... 49
Figure 22 – Axial Stresses as a Function of ΔT Between the TSP Diamond and
Tungsten Carbide ........................................................................................... 49
Figure 23 – NASA JPL Research Single Mode Microwave Brazing Cavity ................... 55
Figure 24 – Illustration of Single Cavity Microwave Brazing System............................. 55
Figure 25 – Desired Time-Temperature Profile................................................................ 56
Figure 26 – TSP Diamond Brazed to Tungsten Carbide Substrate .................................. 57
Figure 27 – Prototype Microwave Materials Processing Facility..................................... 59
Figure 28 – Ultrasonic Test......................................................................................... 61, 62
Figure 28a – Ultrasonic Test Equipment .......................................................................... 61
Figure 28b – Ultrasonic Reflections ................................................................................. 62
Figure 29 – Granite Log Abrasion Test ............................................................................ 64
Figure 30 – Horizontal Mill-Fly-Cutter Across Granite Rock Face ................................. 65
viii

Figure 31 – 5 ¼” Diameter Prototype Drill Bit ................................................................ 67
Figure 32 – Prototype Drill Bit Cutting Structure ............................................................ 67
Figure 33 – Sandia Hard Rock Test Facility..................................................................... 68
Figure 34 – Sandia HRTF Drill Bit................................................................................... 69
Figure 35 – Illustration of a CSS Type 1c Diamond Cutter ............................................. 71
Figure 36 – Continuous Self Sharpening (CSS) Cutter Design Wear Tests..................... 73
Figure 36a – Wear Flat Growth for PDC Cutters ............................................................. 73
Figure 36b – Least Square Fit of PDC Cutter Wearflat Growth....................................... 73
Figure 37 – Long Duration TSP v PDC Cutter................................................................. 74
Figure 38 – Typical Microfracture to Conventional TSP Cutter ...................................... 75
Figure 39 – No Impact Damage to ENDURUS™ Cutter................................................. 75
Figure 40a – TSP Brazed to Tungsten Carbide Substrate................................................. 76
Figure 40b – TSP Brazed to Tungsten Carbide with Shock Absorbing Interlayer........... 76
Figure 41 – Drill Test of ENDURUS™ Cutters on a Hybrid Fixed Cutter-Roller
Drill Bit ................................................................................................... 78, 79
Figure 41a – Hybrid TSP Roller Drill Bit......................................................................... 78
Figure 41b – Tested TSP Diamond Cutter........................................................................ 79
Figure 42 – Catoosa Turbodrill Drill Bit .......................................................................... 81
Figure 42a – 4 1/8” Turbodrill Drill Bit............................................................................ 81
Figure 42b – Tested TSP Cutters ...................................................................................... 81
ix
1.0 EXECUTIVE SUMMARY
The goal of this project was to develop faster drilling TSP (thermally stable diamond) drill bits for the economical drilling of petroleum wells. TSP diamond cutters in the past have not been practical due to (a) insufficient attachment shear strength when brazed to a tungsten carbide substrate, and (b) limited cutter exposure and poor impact strength when set in matrix-type fixed cutter diamond drill bits. For deep gas drilling in the USA the (1) rock is often hard and abrasive, (2) temperatures are elevated, and (3) the Turbodrill is the motor of choice. Under these conditions, the inherent thermal stability of the TSP cutter will maintain a sharp edge required to drill at a higher rate of penetration. Today, there are over 5,000 kilometers of hard and abrasive rock drilled in petroleum wells a year worldwide using primarily roller cone drill bits. Eighty percent of the worlds’ hard rock is drilled within the continental U.S.A. and 11 percent in Canada. With a TSP cutter, higher rates of penetration can potentially reduce well costs by 15%, and overall project cost by 7.5%. This presents a real and timely opportunity for economic development of deep natural gas resources in the U.S., and for strengthening the development of the U.S. Drilling Industry.
Conventional polycrystalline diamond compact (PDC) cutters drill efficiently. The PDC drill bit is currently used to drill 55% of petroleum well footage. The PDC bit, typically with cylindrical cutters of various diameters, drills 2-3 times faster than the conventional roller cone bit. However, the PDC wear rate increases exponentially when cutter tip temperatures exceed 300 ºC. A newly processed PDC has demonstrated increased thermal stability. Cobalt is removed from the PDC diamond surface by acid leaching. Nevertheless, the new PDC has higher wear rates when compared to a fully leached thermally stable TSP diamond cutter.
TSP diamond can be made in two steps. First, a diamond material is formed using a high- temperature high-pressure process similar to that for a PDC with a cobalt binder. Thereafter, the cobalt binder is removed by acid leaching resulting in a thermally stable diamond with approximately 3 volume percent porosity. While TSP diamond has demonstrated constant low wear rates up to 1200 °C, the fracture resistance is lower when compared to PDC diamond. In addition to high attachment strength, a prime objective of this project was also to investigate unique TSP diamond processes and cutter designs for improving diamond strength, fracture resistance, and cutter impact strength. Three new methods were developed: (i) densification of the porous diamond to increase mechanical strength, (ii) ion implantation of the diamond surface to increase fracture resistance, and (iii) unique cutter designs which absorbs shock. There is no standard test to measure the fracture resistance of TSP diamond. Drop weight tests have previously have been correlated with fracture resistance for metallic materials. It was found during this investigation that measurements made with an Instron Instrumented Drop Weight Impact Test Machine provided the information needed. Indeed, using this calibrated drop weight test, it was possible to determine that with proper processing the energy required to cause diamond to fracture had been increased by 36%.
When brazing thermally stable diamond to tungsten carbide, critical residual thermal stress is developed which can cause the diamond to fracture. The origin of the stress is the mismatch between the coefficients of thermal expansion of the two components. A unique Microwave Brazing (MWB) process was developed for material pairs with widely different coefficients of thermal expansion (CTE). Tungsten carbide has a greater CTE than diamond. The process uses
1
conventional braze filler metal foils and multilayer exothermic multilayer thin film braze filler metal coatings. MWB was initially performed in a research single-mode microwave reactor. Subsequent brazing was done in a specially designed single mode reactor designed by Technology International, Inc. The microwaves preferentially heat the diamond hotter than the tungsten carbide. The residual thermal stress is reduced as the lower expanding diamond shrinks at the same rate as the higher expanding tungsten carbide. The NASA Space Act Award for Innovation was awarded to the inventors. TSP diamond cutters can now be brazed with high attachment shear strength greater than 345 MPa (50,000 psi).
Both conventional and new TSP cutter designs were investigated. Conventional PDC diamond cutter designs are typically 5 to 19 mm diameter cylinders of various lengths. Several alternative cutter designs were investigated with the purpose of increase cutter durability. The cutters are described as (i) shock absorbing, (ii) continuous self-sharpening, (iii) compression joint, and (iv) wedge shaped.
FEM analysis was performed to determine (i) the magnitude of the critical thermal residual stresses that could cause the diamond to crack while brazing, and (ii) the differential temperature (ΔT) between the TSP diamond and tungsten carbide required to control the stress level. FEM has predicted thermal residual stress levels in both the diamond and tungsten carbide layers after brazing. It was found that brazing temperatures from 850 °C to 1150 °C increases braze interface peak stress by over 48 %. Conclusions were as follows:
1. Critical stresses in the TSP diamond increase with increasing braze temperature. Braze temperatures in excess of 700 ºC cause high residual thermal stresses, which cause the TSP diamond to crack during brazing.
2. Critical residual thermal stress occur in the TSP diamond with braze filler metal thickness of less than 50 micron. The thicker the braze layer the greater is the stress relaxation, with a maximum occurring when the braze layer deforms plastically.
3. Preferential heating of the TSP diamond with microwaves, and maintaining a ΔT of 200 ºC between the diamond and tungsten carbide contributes to the control of thermal residual stress in the diamond.
“Bit whirl” is a wellbore drilling phenomenon that describes the unsymmetrical rotation of a drill bit. Every effort is made to drill without “bit whirl.” Nevertheless, when it does occur, high dynamic forces are applied to the cutters. Typical damage to TSP diamond cutter in the field reported by other investigators has been a fracture pattern called a “halo microfracture.” This term describes the semi-circular shape of the fracture about the cutting tip. ENDURUSTM cutters have tested successfully for hard rock abrasion resistance, wear, and impact strength at the laboratories of GE Superabrasives (now Diamond Innovations), Smith Bits, and the Sandia National Laboratories Hard Rock Test Facility (HRTF). The HRTF laboratory drilling test is the only one which reproduced “halo micro-fractures” observed in the field. ENDURUSTM cutters were not damaged at the HRTF when drilling White Sierra Granite at 9.1 m/hr (30 ft/hr). The ENDURUSTM thermally stable cutter is now being evaluated in various petroleum drilling applications.
2
2.0 Introduction
The project goal is to develop advanced drilling systems which employ TSP diamond drill bits. TSP diamond drill bit cutters are revolutionary in nature due to the fact that they are able to remain sharp when drilling hard and abrasive rock at conventional and higher rotary speeds. High cutting tip temperatures currently cause the PDC cutter to wear resulting in a decreasing in rate of penetration and bit life. Harder rock associated with drilling deeper gas reserves requires that the cutter remain sharp and not fracture in such a manner as to limit rate of penetration and the operational life of the drill bit. The petroleum drill bits employing ENDURUSTM TSP cutters are capable of reducing overall system costs by 15%, and the overall drilling project cost by 7.5%. Thus, there is the opportunity for reducing drilling costs and improving the economics for drilling deep petroleum resources.
The product of this work will improve the performance of existing petroleum drilling systems. As frequently occurs, revolutionary advances in materials science are often required. This project combined the knowledge of material science with new TSP diamond cutter designs. The history of the development of diamond cutters for drilling hard rock reveals similarities over the ages. The Chinese in the year 1700 BC learned how to cut through several hundred feet of hard limestone. They were able to use natural diamond hand-held cutters developed with new metallurgy. This new metallurgy was the ability to pound a single diamond stone into a unique brass alloy, which formed a tool holder. With this invention, a method to manually impact rock without shattering the brittle diamond was born. Hundreds of workers would excavate man-sized holes 0.06 kilometer deep to gain access to fresh water. Today, there are over 5,000 kilometers of hard and abrasive rock drilled a year worldwide using primarily tri-cone drill bits.
The PDC diamond cutter was introduced to the petroleum bit industry in 1972 by General Electric (GE) Superabrasives [now Diamond Innovations, Inc. (DI)]. Low attachment strength and impact resistance is reminiscent of the limitations of PDC in the early 1970’s. After years of vacuum furnace brazing process development, shear strengths attained were still not sufficient for petroleum drill bit cutters. Then, a unique Long Substrate (LS) induction brazing process was developed by GE in 1975. The LS braze attachment shear strength was increased over a period of several years from 207 MPa (30,000 psi) to greater than what was considered the minimum required strength, 345 MPa (50,000 psi). Drill bits using conventional PDC cutters fail as they reach higher cutter temperatures (e.g., above about 700 oC) due to internal stresses developed within the PDC diamond by the expansion of the cobalt binder, and chemical degradation of the diamond structure by cobalt. Then, in recent years, the so called “leached” PDC, whereby cobalt binder is removed from just the surface, has shown increased thermal stability. However, the fully leached diamond continues to have greater wear resistance.
The first commercially available TSP diamond was introduced by GE in 1979. [Ref. 1, 2] It was a porous polycrystalline diamond offered produced by acid leaching the thermally incompatible cobalt binder from the PDC. However, since the early 1980’s, the industry has attempted to produce a durable TSP diamond cutter. This requires, in part, that the TSP diamond be brazed to a rigid tungsten carbide support with high attachment strength.
3
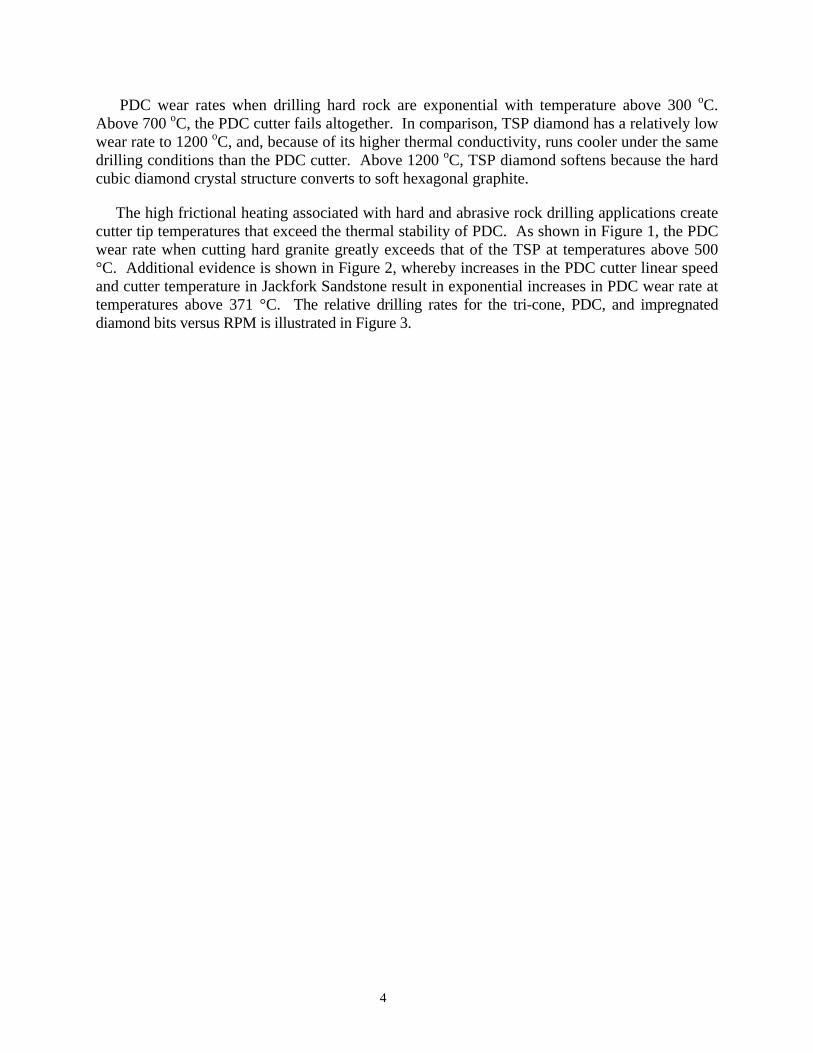
PDC wear rates when drilling hard rock are exponential with temperature above 300 oC. Above 700 oC, the PDC cutter fails altogether. In comparison, TSP diamond has a relatively low wear rate to 1200 oC, and, because of its higher thermal conductivity, runs cooler under the same drilling conditions than the PDC cutter. Above 1200 oC, TSP diamond softens because the hard cubic diamond crystal structure converts to soft hexagonal graphite.
The high frictional heating associated with hard and abrasive rock drilling applications create cutter tip temperatures that exceed the thermal stability of PDC. As shown in Figure 1, the PDC wear rate when cutting hard granite greatly exceeds that of the TSP at temperatures above 500 °C. Additional evidence is shown in Figure 2, whereby increases in the PDC cutter linear speed and cutter temperature in Jackfork Sandstone result in exponential increases in PDC wear rate at temperatures above 371 °C. The relative drilling rates for the tri-cone, PDC, and impregnated diamond bits versus RPM is illustrated in Figure 3.
4
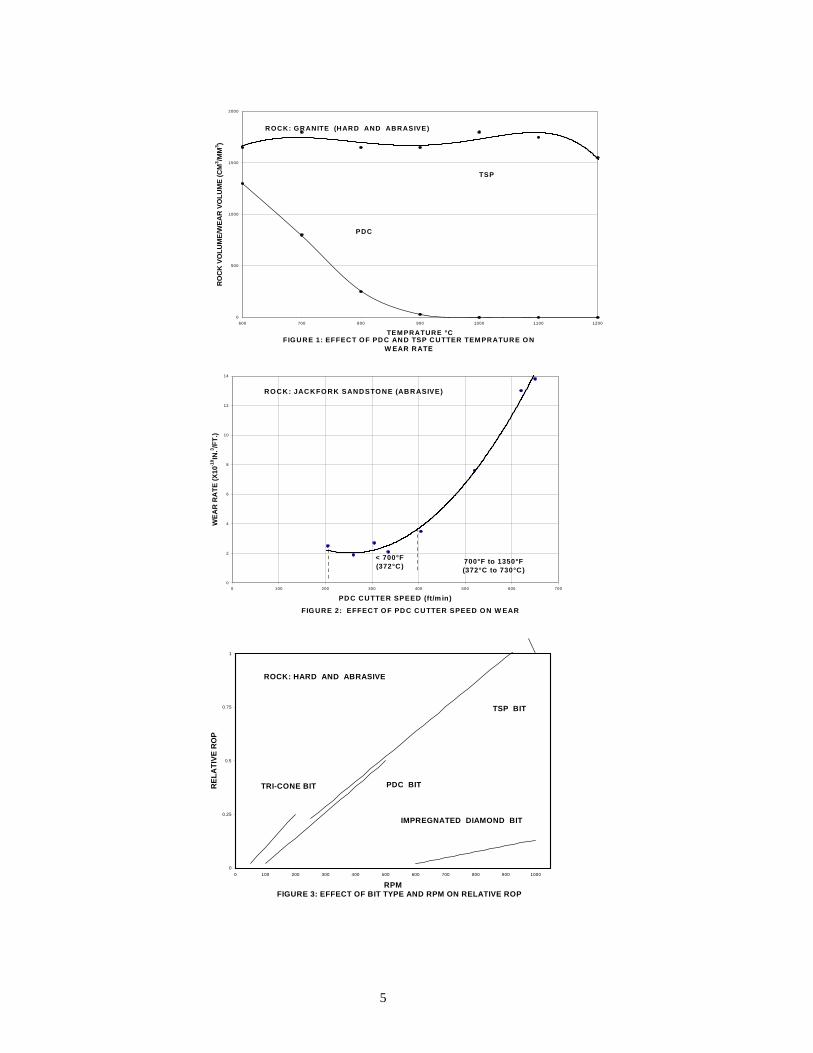
FIGURE 1: EFFECT OF PDC AND TSP CUTTER TEM PRATURE O N W EAR RATE
0
500
1000
1500
2000
600 700 800 900 1000 1100 1200
TEM PRATURE °C
RO
CK
VO
LUM
E/W
EAR
VO
LUM
E (C
M3 /M
M3 )
ROCK: GRANITE (HARD AND ABRASIVE)
TSP
PDC
FIG URE 2: EFFECT O F PDC CUTTER SPEED O N W EAR
0
2
4
6
8
10
12
14
0 100 200 300 400 500 600 700
PDC CUTTER SPEED (ft/m in)
WEA
R R
ATE
(X10
-10 IN
.3 /FT.
)
RO CK: JACKFO RK SANDSTO NE (ABRASIVE)
IIIII
IIIIIII
< 700°F(372°C)
700°F to 1350°F(372°C to 730°C)
FIGURE 3: EFFECT OF BIT TYPE AND RPM ON RELATIVE ROP
0
0.25
0.5
0.75
1
0 100 200 300 400 500 600 700 800 900 1000
RPM
REL
ATI
VE R
OP
TRI-CONE BIT PDC BIT
IMPREGNATED DIAMOND BIT
TSP BIT
ROCK: HARD AND ABRASIVE
5

The state-of-the-art TSP diamond cutter attachment procedure is to braze 13 mm diameter x 3.5 mm thick TSP diamond to 6 weight percent cobalt-bonded tungsten carbide substrates with a titanium-copper-silver braze filler metal (TiCuSil, 4.5 wt.% Ti – 26.7 wt.% Cu – 68.8 wt.% Ag). The attachment shear strength level using conventional brazing methods has been reported by various investigators to be between 138 to 241 MPa (20,000 to 35,000 psi). Direct resistance, induction, and furnace convective heating methods had been used to produce these braze joints. Random fracture has been reported in the TSP diamond on cool-down due to the bimetal effect caused by the mismatch in the coefficient of thermal expansion between the TSP diamond (3.0 x 10⁻⁶ /ºC) and tungsten carbide (5.6 x 10⁻⁶ /ºC).
There were six research areas needing closure before brazed TSP diamond cutters could be used extensively by commercial drill bit manufacturers.
(1) A TSP diamond to tungsten carbide brazing method that achieves over 345 MPa (50,000 psi) attachment shear strength.
(2) Thermal and mechanical property characterization of today’s commercially available TSP diamond materials (TSP suppliers offer limited data due to low sales volumes)
(3) Increased TSP diamond mechanical strength and fracture resistance.
(4) A 2x increase in TSP cutter impact strength (TSP diamond bit manufacturers report TSP diamond cutter “halo” shaped fractures and “edge chipping” in field drilling applications.
(5) TSP diamond single cutter and drill bit design models (modifications of existing PDC models).
(6) New TSP cutter designs for improved attachment and impact strength, drilling rate, and bit life performance gains.
A complete set of publications which relate to this project are given in References 3 to 19.
6
3.0 Results and Discussions
3.1 Physical Properties of TSP Diamond
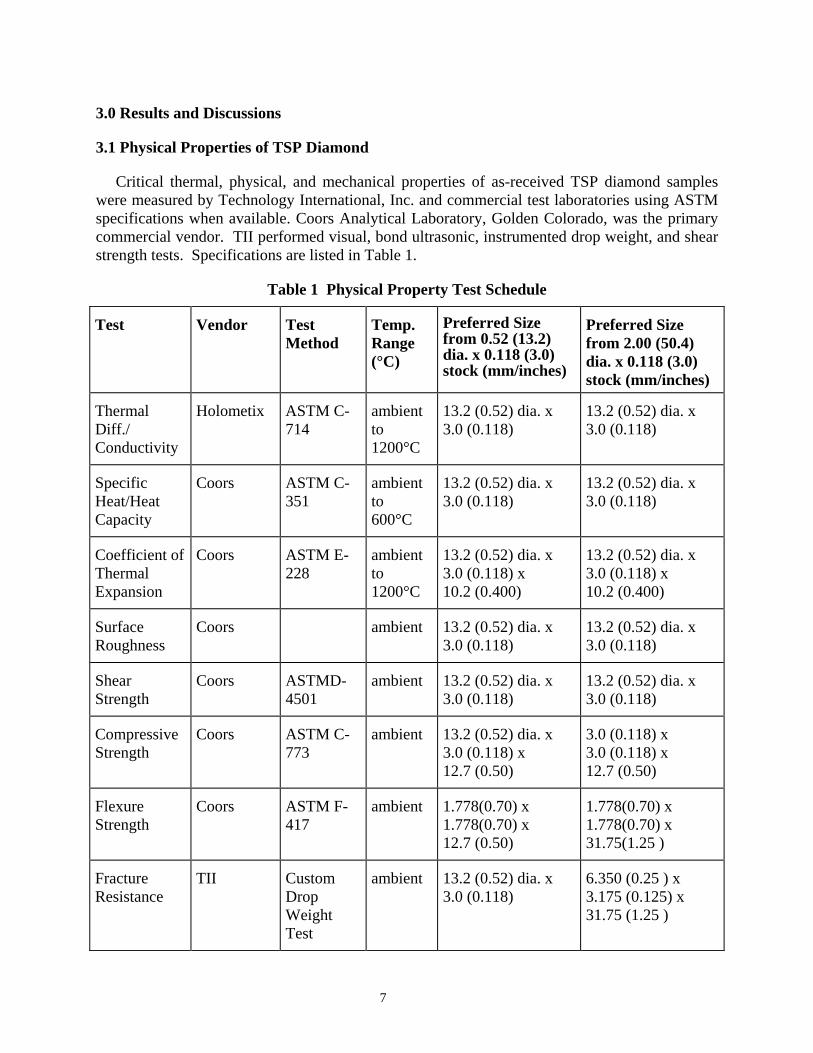
Critical thermal, physical, and mechanical properties of as-received TSP diamond samples were measured by Technology International, Inc. and commercial test laboratories using ASTM specifications when available. Coors Analytical Laboratory, Golden Colorado, was the primary commercial vendor. TII performed visual, bond ultrasonic, instrumented drop weight, and shear strength tests. Specifications are listed in Table 1.
Table 1 Physical Property Test Schedule
Test
Vendor Test Method
Temp. Range (°C)
Preferred Size from 0.52 (13.2) dia. x 0.118 (3.0) stock (mm/inches)
Preferred Size from 2.00 (50.4) dia. x 0.118 (3.0) stock (mm/inches)
Thermal Diff./ Conductivity
Holometix ASTM C-714
ambient to 1200°C
13.2 (0.52) dia. x 3.0 (0.118)
13.2 (0.52) dia. x 3.0 (0.118)
Specific Heat/Heat Capacity
Coors ASTM C-351
ambient to 600°C
13.2 (0.52) dia. x 3.0 (0.118)
13.2 (0.52) dia. x 3.0 (0.118)
Coefficient of Thermal Expansion
Coors ASTM E-228
ambient to 1200°C
13.2 (0.52) dia. x 3.0 (0.118) x 10.2 (0.400)
13.2 (0.52) dia. x 3.0 (0.118) x 10.2 (0.400)
Surface Roughness
Coors ambient 13.2 (0.52) dia. x 3.0 (0.118)
13.2 (0.52) dia. x 3.0 (0.118)
Shear Strength
Coors ASTMD-4501
ambient 13.2 (0.52) dia. x 3.0 (0.118)
13.2 (0.52) dia. x 3.0 (0.118)
Compressive Strength
Coors ASTM C-773
ambient 13.2 (0.52) dia. x 3.0 (0.118) x 12.7 (0.50)
3.0 (0.118) x 3.0 (0.118) x 12.7 (0.50)
Flexure Strength
Coors ASTM F-417
ambient 1.778(0.70) x 1.778(0.70) x 12.7 (0.50)
1.778(0.70) x 1.778(0.70) x 31.75(1.25 )
Fracture Resistance
TII Custom Drop Weight Test
ambient 13.2 (0.52) dia. x 3.0 (0.118)
6.350 (0.25 ) x 3.175 (0.125) x 31.75 (1.25 )
7
3.1.1 Coefficient of Thermal Expansion (CTE)
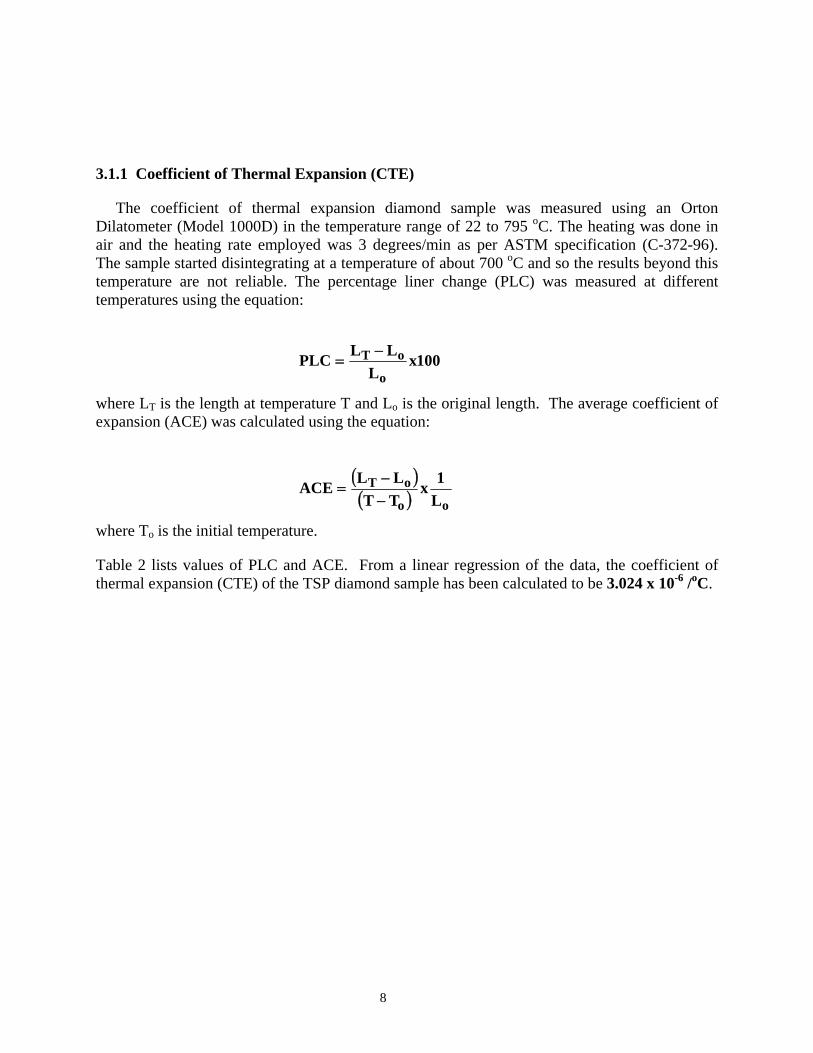
The coefficient of thermal expansion diamond sample was measured using an Orton Dilatometer (Model 1000D) in the temperature range of 22 to 795 oC. The heating was done in air and the heating rate employed was 3 degrees/min as per ASTM specification (C-372-96). The sample started disintegrating at a temperature of about 700 oC and so the results beyond this temperature are not reliable. The percentage liner change (PLC) was measured at different temperatures using the equation:
100xL
LLPLCo
oT −=
where LT is the length at temperature T and Lo is the original length. The average coefficient of expansion (ACE) was calculated using the equation:
( )( ) oo
oTL1x
TTLLACE
−−
=
where To is the initial temperature.
Table 2 lists values of PLC and ACE. From a linear regression of the data, the coefficient of thermal expansion (CTE) of the TSP diamond sample has been calculated to be 3.024 x 10⁻⁶ /oC.
8
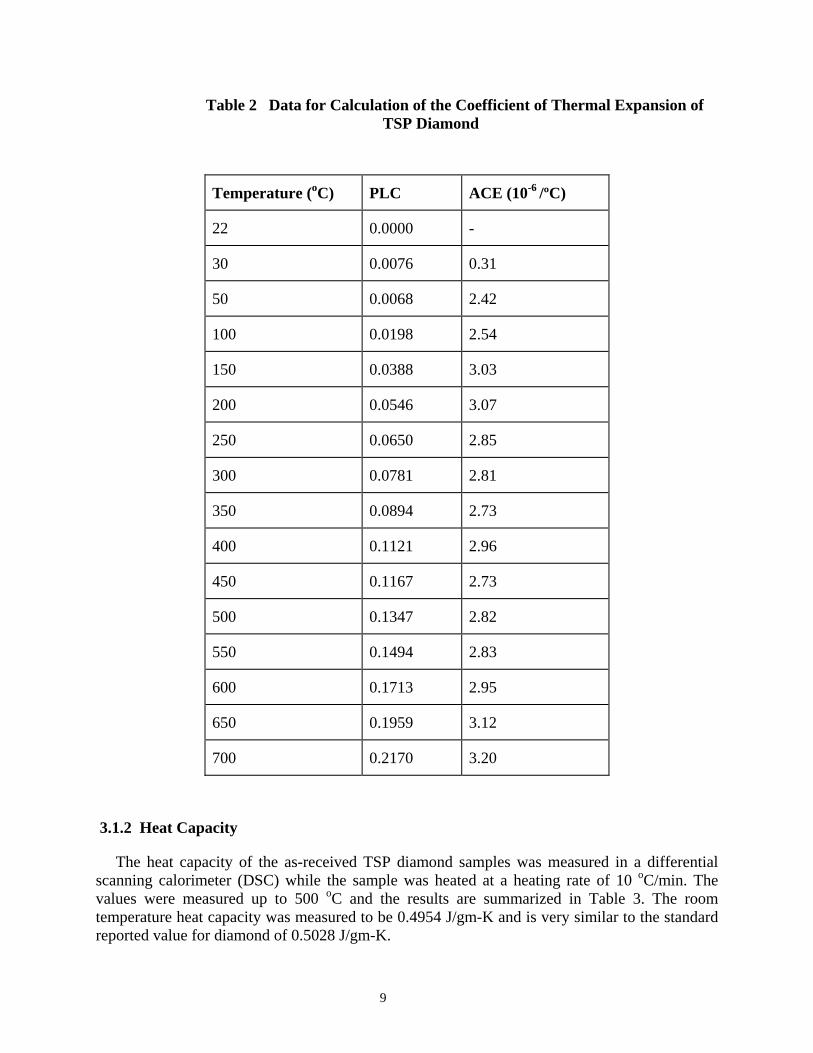
Table 2 Data for Calculation of the Coefficient of Thermal Expansion of TSP Diamond
Temperature (oC) PLC ACE (10-6 /ºC)
22 0.0000 -
30 0.0076 0.31
50 0.0068 2.42
100 0.0198 2.54
150 0.0388 3.03
200 0.0546 3.07
250 0.0650 2.85
300 0.0781 2.81
350 0.0894 2.73
400 0.1121 2.96
450 0.1167 2.73
500 0.1347 2.82
550 0.1494 2.83
600 0.1713 2.95
650 0.1959 3.12
700 0.2170 3.20
3.1.2 Heat Capacity
The heat capacity of the as-received TSP diamond samples was measured in a differential scanning calorimeter (DSC) while the sample was heated at a heating rate of 10 oC/min. The values were measured up to 500 oC and the results are summarized in Table 3. The room temperature heat capacity was measured to be 0.4954 J/gm-K and is very similar to the standard reported value for diamond of 0.5028 J/gm-K.
9
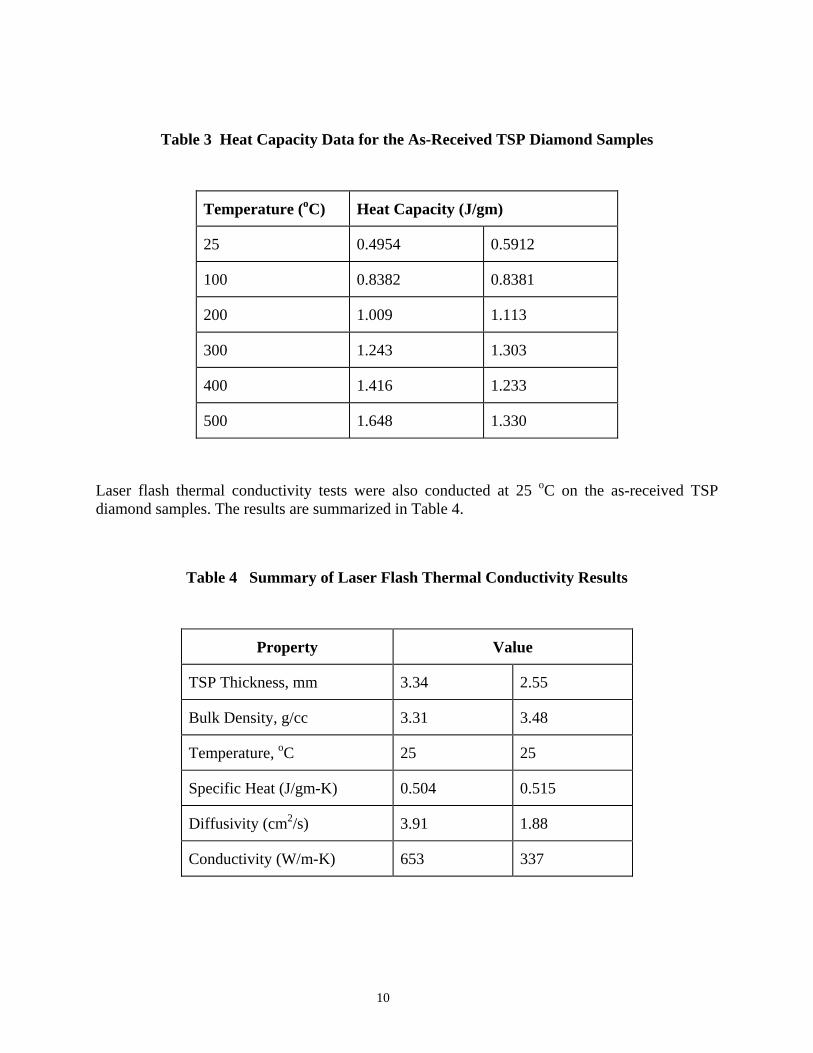
Table 3 Heat Capacity Data for the As-Received TSP Diamond Samples
Temperature (oC) Heat Capacity (J/gm)
25 0.4954 0.5912
100 0.8382 0.8381
200 1.009 1.113
300 1.243 1.303
400 1.416 1.233
500 1.648 1.330
Laser flash thermal conductivity tests were also conducted at 25 oC on the as-received TSP diamond samples. The results are summarized in Table 4.
Table 4 Summary of Laser Flash Thermal Conductivity Results
Property Value
TSP Thickness, mm 3.34 2.55
Bulk Density, g/cc 3.31 3.48
Temperature, oC 25 25
Specific Heat (J/gm-K) 0.504 0.515
Diffusivity (cm2/s) 3.91 1.88
Conductivity (W/m-K) 653 337
10
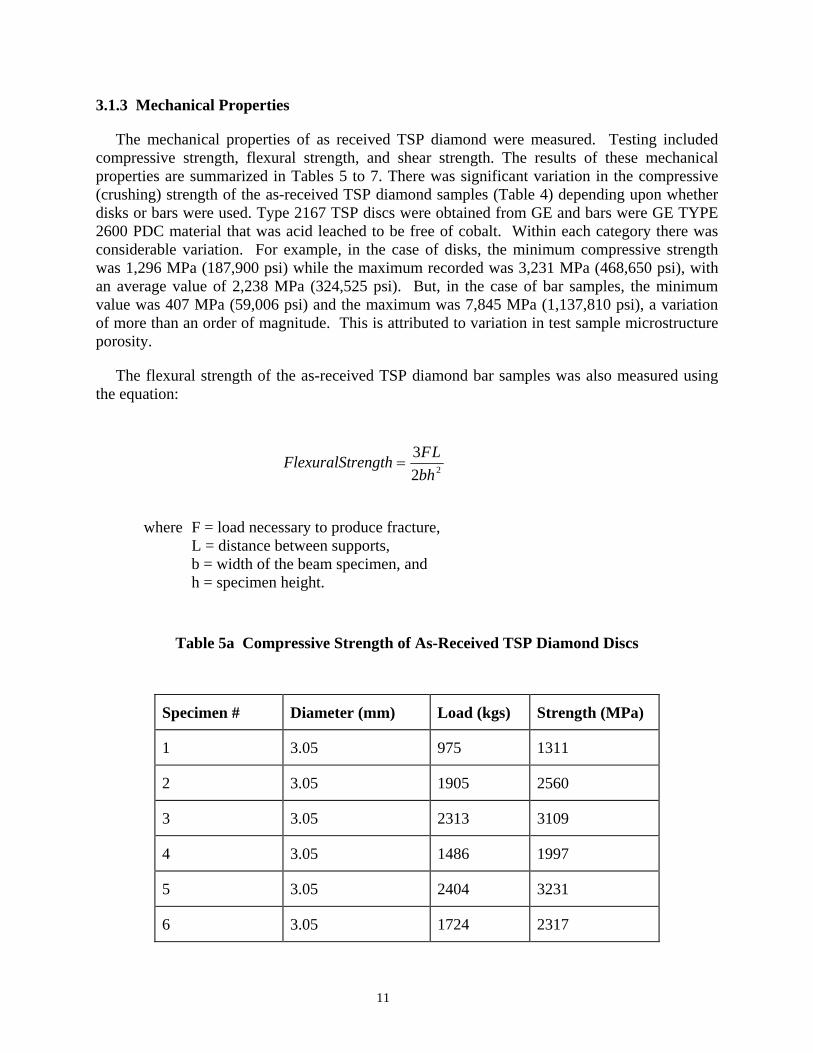
3.1.3 Mechanical Properties
The mechanical properties of as received TSP diamond were measured. Testing included compressive strength, flexural strength, and shear strength. The results of these mechanical properties are summarized in Tables 5 to 7. There was significant variation in the compressive (crushing) strength of the as-received TSP diamond samples (Table 4) depending upon whether disks or bars were used. Type 2167 TSP discs were obtained from GE and bars were GE TYPE 2600 PDC material that was acid leached to be free of cobalt. Within each category there was considerable variation. For example, in the case of disks, the minimum compressive strength was 1,296 MPa (187,900 psi) while the maximum recorded was 3,231 MPa (468,650 psi), with an average value of 2,238 MPa (324,525 psi). But, in the case of bar samples, the minimum value was 407 MPa (59,006 psi) and the maximum was 7,845 MPa (1,137,810 psi), a variation of more than an order of magnitude. This is attributed to variation in test sample microstructure porosity.
The flexural strength of the as-received TSP diamond bar samples was also measured using the equation:
223bh
LFrengthFlexuralSt =
where F = load necessary to produce fracture, L = distance between supports, b = width of the beam specimen, and h = specimen height.
Table 5a Compressive Strength of As-Received TSP Diamond Discs
Specimen # Diameter (mm) Load (kgs) Strength (MPa)
1 3.05 975 1311
2 3.05 1905 2560
3 3.05 2313 3109
4 3.05 1486 1997
5 3.05 2404 3231
6 3.05 1724 2317
11

7 3.05 1894 2546
8 3.05 964 1296
9 3.05 1769 2378
10 3.05 1213 1631
AVERAGE COMPRESSIVE STRENGTH: 2,238 MPa +/- 644 MPa
Table 5b Leached TSP Diamond Bars
Specimen # Width (mm) Thickness (mm)
Load (kg) Strength (MPa)
1 3.505 3.556 517.1 407
2 3.353 3.505 530.7 443
3 3.556 3.505 5,248 4,129
4 3.480 3.531 7,983 6,372
5 3.531 3.505 8,,505 6,739
6 3.505 3.531 1,043 837
7 3.505 3.556 5,897 4,639
8 3.581 3.531 10,115 7,845
9 3.581 3.531 5,869 4,552
10 3.531 3.353 3,856 3,194
AVERAGE COMPRESSIVE STRENGTH:3,915 MPa +/- 2,545 MPa
12
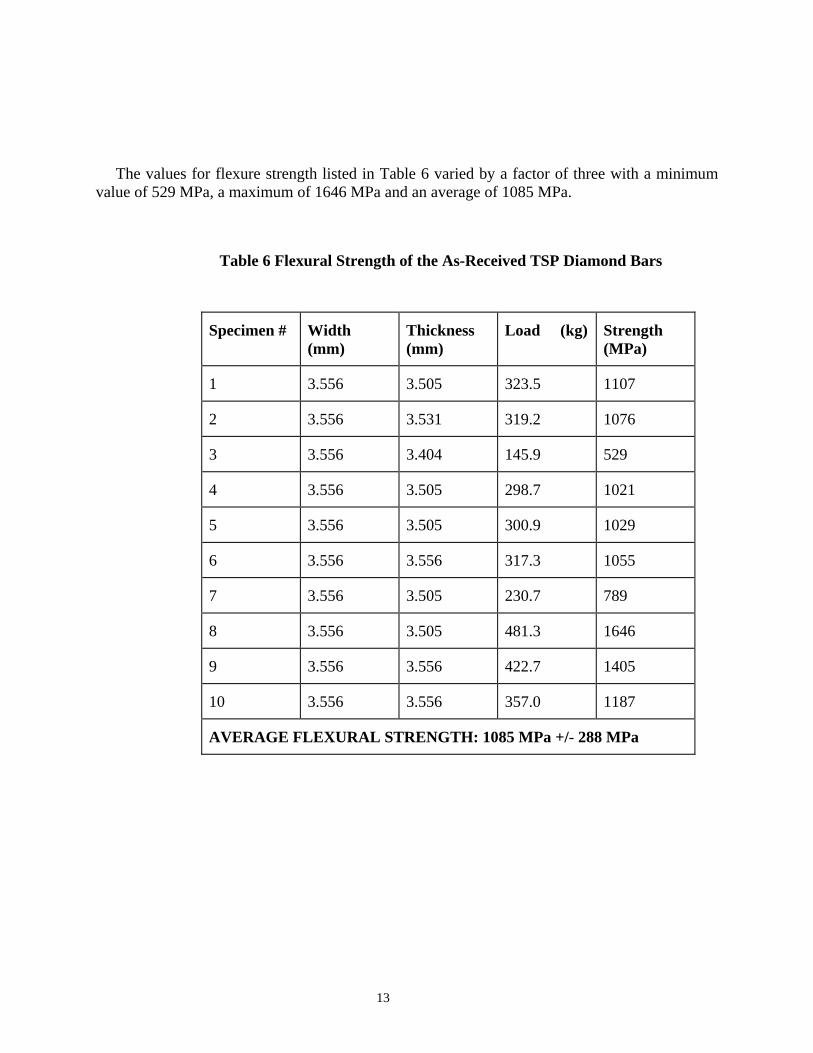
The values for flexure strength listed in Table 6 varied by a factor of three with a minimum value of 529 MPa, a maximum of 1646 MPa and an average of 1085 MPa.
Table 6 Flexural Strength of the As-Received TSP Diamond Bars
Specimen # Width (mm)
Thickness (mm)
Load (kg) Strength (MPa)
1 3.556 3.505 323.5 1107
2 3.556 3.531 319.2 1076
3 3.556 3.404 145.9 529
4 3.556 3.505 298.7 1021
5 3.556 3.505 300.9 1029
6 3.556 3.556 317.3 1055
7 3.556 3.505 230.7 789
8 3.556 3.505 481.3 1646
9 3.556 3.556 422.7 1405
10 3.556 3.556 357.0 1187
AVERAGE FLEXURAL STRENGTH: 1085 MPa +/- 288 MPa
13
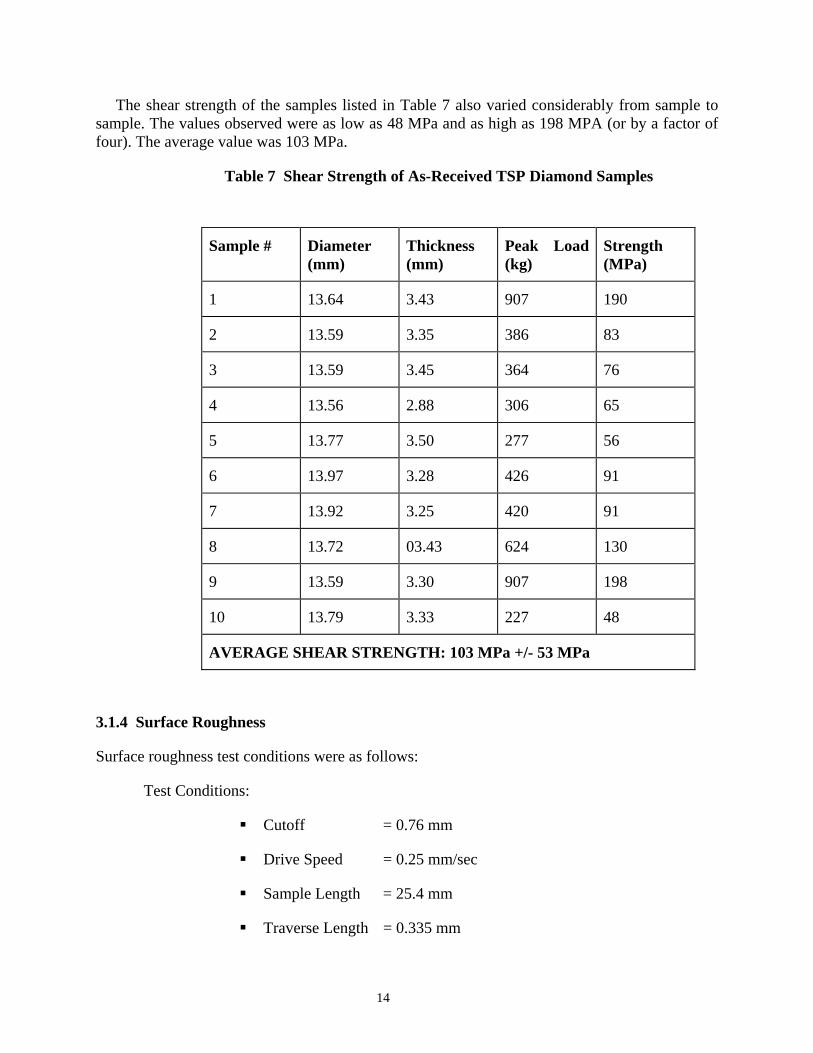
The shear strength of the samples listed in Table 7 also varied considerably from sample to sample. The values observed were as low as 48 MPa and as high as 198 MPA (or by a factor of four). The average value was 103 MPa.
Table 7 Shear Strength of As-Received TSP Diamond Samples
Sample # Diameter (mm)
Thickness (mm)
Peak Load (kg)
Strength (MPa)
1 13.64 3.43 907 190
2 13.59 3.35 386 83
3 13.59 3.45 364 76
4 13.56 2.88 306 65
5 13.77 3.50 277 56
6 13.97 3.28 426 91
7 13.92 3.25 420 91
8 13.72 03.43 624 130
9 13.59 3.30 907 198
10 13.79 3.33 227 48
AVERAGE SHEAR STRENGTH: 103 MPa +/- 53 MPa
3.1.4 Surface Roughness
Surface roughness test conditions were as follows:
Test Conditions:
Cutoff = 0.76 mm
Drive Speed = 0.25 mm/sec
Sample Length = 25.4 mm
Traverse Length = 0.335 mm
14
Cutting Depth = 0 mm
Bandwidth = 0 mm
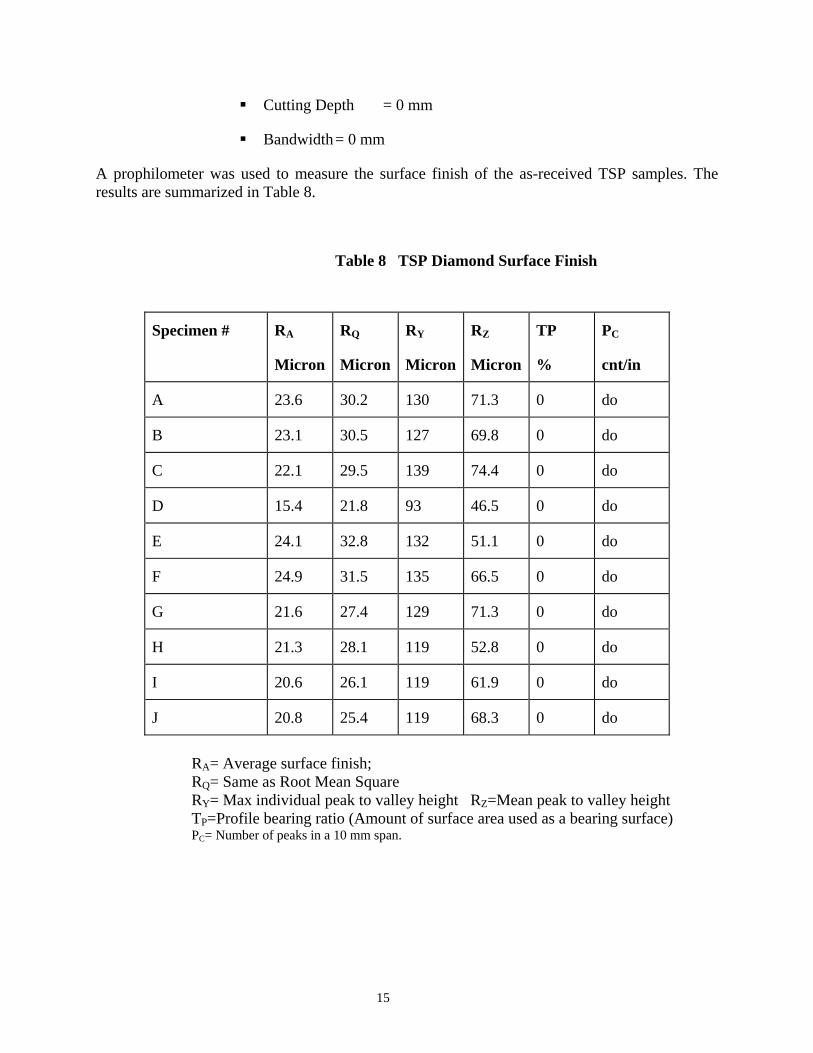
A prophilometer was used to measure the surface finish of the as-received TSP samples. The results are summarized in Table 8.
Table 8 TSP Diamond Surface Finish
Specimen # RA
Micron
RQ
Micron
RY
Micron
RZ
Micron
TP
%
PC
cnt/in
A 23.6 30.2 130 71.3 0 do
B 23.1 30.5 127 69.8 0 do
C 22.1 29.5 139 74.4 0 do
D 15.4 21.8 93 46.5 0 do
E 24.1 32.8 132 51.1 0 do
F 24.9 31.5 135 66.5 0 do
G 21.6 27.4 129 71.3 0 do
H 21.3 28.1 119 52.8 0 do
I 20.6 26.1 119 61.9 0 do
J 20.8 25.4 119 68.3 0 do
RA= Average surface finish; RQ= Same as Root Mean Square RY= Max individual peak to valley height RZ=Mean peak to valley height TP=Profile bearing ratio (Amount of surface area used as a bearing surface) PC= Number of peaks in a 10 mm span.
15
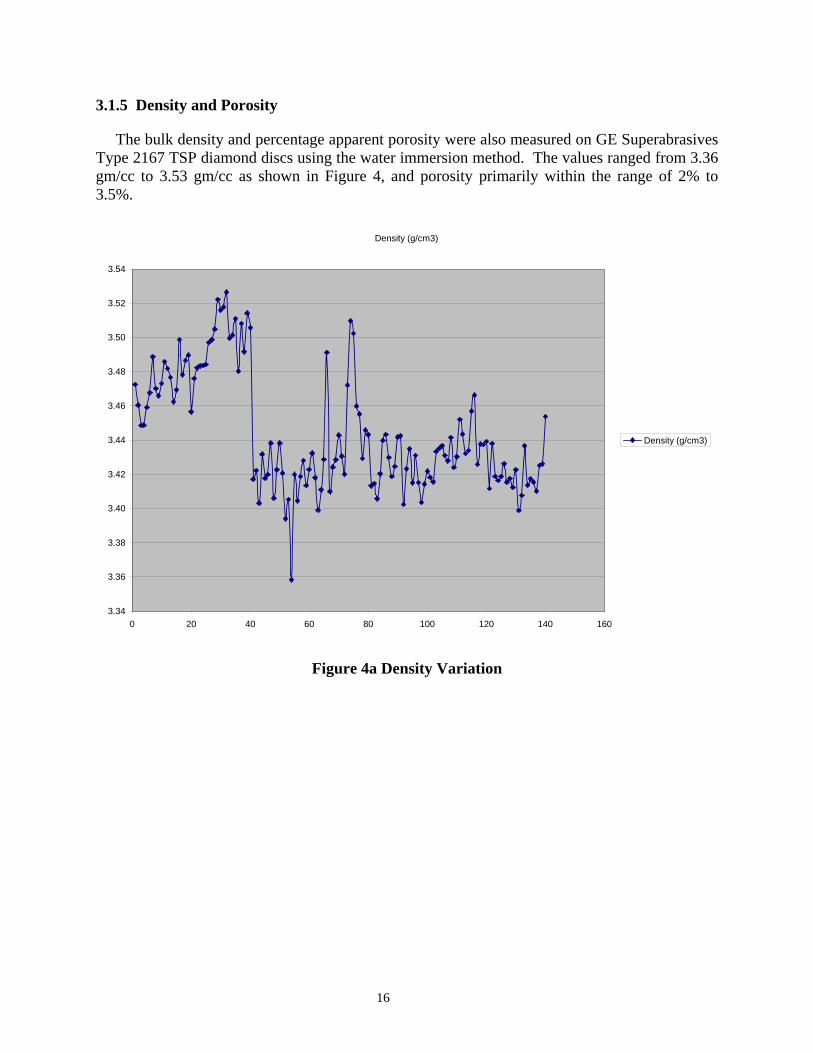
3.1.5 Density and Porosity
The bulk density and percentage apparent porosity were also measured on GE Superabrasives Type 2167 TSP diamond discs using the water immersion method. The values ranged from 3.36 gm/cc to 3.53 gm/cc as shown in Figure 4, and porosity primarily within the range of 2% to 3.5%.
Density (g/cm3)
3.34
3.36
3.38
3.40
3.42
3.44
3.46
3.48
3.50
3.52
3.54
0 20 40 60 80 100 120 140 160
Density (g/cm3)
Figure 4a Density Variation
16

Porosity (volume %)
0.00
0.50
1.00
1.50
2.00
2.50
3.00
3.50
4.00
4.50
5.00
0 20 40 60 80 100 120 140 160
Porosity (volume %)
Figure 4b Porosity Variation
Figure 4 Density and Porosity of TSP Diamond
3.1.6 Microstructure Characterization
The as-received GE Type 2167 TSP diamond discs had a wide range of porosity which varied from about 2 to 5 volume %. Areas of higher porosity are highly localized in some cases and tend to be on the edges of the discs. The average grain size was 40 microns, with a particle size distribution from 5 to 80 microns. This variation resulted in the relatively large range in physical property measurements, high standard deviations, and performance differences reported herein. Recently newer TSP materials have been produced by Diamond Innovations, Inc. (formerly GE) and other diamond manufacturers which have more consistent and improved properties. These newly available materials will contribute to the commercial success of the ENDURUSTM cutter for petroleum drill bits.
3.1.7 Fracture Toughness and Impact Energy
Fracture toughness is an important property of a material and describes its ability in reducing the rate of propagation of a pre-existing crack. Thus, a material with higher fracture toughness fails more slowly than one with lower fracture toughness. For comparison, gem-type diamonds used in diamond drill bits have a fracture toughness of 3.4 MPa.m1/2, polycrystalline diamond used in PDC drill bits is 6.9 MPa.m1/2, and the cobalt-bonded tungsten carbide substrate of a
17
PDC or TSP cutter is 10.8 MPa.m1/2. Consequently, if a crack is either existent or develops in a diamond material during processing, it grows much more rapidly under stress when compared to the carbide substrate. A primary objective of this project is to determine whether or not an ion implanted TSP diamond cutter has higher fracture toughness, and thus fails more slowly in a hard rock drilling application.
It is well known that the hardness of a material is the analog of strength measured by the tensile test. Similarly, impact energy, the energy necessary to fracture a standard test piece under an impact load, is a similar analog of toughness. Therefore, the higher the toughness of the material the higher is its impact energy. The existence of such correlations would be of obvious practical value, because it would then be possible to estimate the fracture toughness of a material on the basis of data obtained by means of a simple impact test. In fact, empirical relationships were established between the KIC fracture toughness (ksi.in1/2) and Charpy V-notch absorbed energy, CVN (ft-lb) for different steel samples in the ductile and ductile-brittle regions as:
(KIC/sy)2 = 5 (CVN/sy – 0.25) for 100% ductile fracture region KIC2/E = 8 (CVN)
for the ductile-brittle transition region
where sy = yield strength (ksi)
E = modulus of elasticity (ksi)
However, for brittle materials, the relationship was found to be:
KIC = 19 (CVN)1/2
where KIC is in MPa.m1/2 and CVN is in Joules.
From the above description it is clear that, by improving the impact energy of a TSP diamond material, it should be possible to increase its fracture resistance and toughness.
Irrespective of the actual relationship, it is clear that the fracture toughness and impact energy could be related to each other. It should also be noted that the exact nature of the relation could be altered by the microstructure of the specimen.
3.1.7.1 Fracture Resistance Test Alternatives
In recent years, a substantial effort has been made to quantify the nature of material failures. The term fracture mechanics has come to mean the general analysis of failure of structural materials with pre-existing flaws. Even before the development of formal fracture mechanics methodology, engineers realized the importance of material toughness in avoiding brittle fracture. For example, an investigation of the Liberty ship failures during World War II revealed that fracture was much more likely in steels with Charpy impact test results of less than 20 J. Conventionally, the (a) Charpy (a pendulum test that measured the energy of separation in notched metallic specimens), (b) Pellini drop weight test (developed during the 1950’s at the Naval Research Laboratory in Washington, DC), (c) Izod, drop weight tear, and (d) dynamic tear tests have been conducted to evaluate the impact energy (resistance to brittle fracture) of the material. Although impact tests lack the mathematical rigor and predictive capabilities of
18

fracture mechanics methods, these approaches provide a qualitative indication of the material toughness. The advantage of these qualitative methods is that they are cheaper and easier to perform than fracture mechanics tests. These tests are suitable material screening and quality control, but are not reliable indicators of structural integrity.
A number of investigators have attempted to correlate Charpy energy to fracture toughness parameters such as KIC. Since the literature generally used inch-lbs units, this section of the report will also. For all these cases, linear-elastic fracture mechanics (LEFM) has been used extensively and results of these studies showed that there is a certain correlation between KIC value and the absorbed impact energy.
These empirical correlations seem to work reasonably well in some cases, but are unreliable in general. There are several important differences between the Charpy test and fracture mechanics tests that preclude simple relationships between the qualitative and quantitative measures of toughness. The Charpy test contains a blunt notch, while fracture mechanics specimens have sharp fatigue cracks. The Charpy specimen is sub size, and thus has low constraint. In addition, the Charpy specimen experiences impact loading, while most fracture toughness tests are conducted under quasi-static conditions.
It is possible to obtain quantitative information from fatigue pre-cracked Charpy specimens, provided the tup (i.e., the striker) is instrumented. Such an experiment is essentially a miniature dynamic fracture toughness test.
The fracture energy values vary depending on the test conditions and sample parameters (i.e., structure, grain size, number of phases, etc.). Further, in some instances, it is not possible to conduct one of the tests, and therefore, it would be desirable to be able to relate the impact energy to the fracture toughness. A task of this project was to review the literature and establish the success in making correlations between the fracture toughness values obtained by the Charpy V-notch (CVN) test, and the Instron Instrumented Drop Weight Test (IDWT).
The toughness of a material is the ability to carry load or deform plastically in the presence of a notch for slow loading and linear elastic behavior. It is equal to the area under the stress-strain curve obtained during conventional tensile testing. The fracture toughness is represented by the symbol KIC and is the critical value of the stress-intensity factor at a crack tip necessary to produce catastrophic failure under simple uniaxial loading. The subscript “I” stands for “mode I” (uniaxial) loading and “C” stands for “critical”. In general, the value of fracture toughness is given by:
KIC = Y σf ( π a )1/2 (1)
where KIC = Stress intensity factor at a crack tip necessary to produce catastrophic ailure (ksi.in1/2), Y = a dimensionless geometry factor, that depends on crack type, generally on the order of 1, σf = the applied stress at failure (ksi), π = a constant,
19
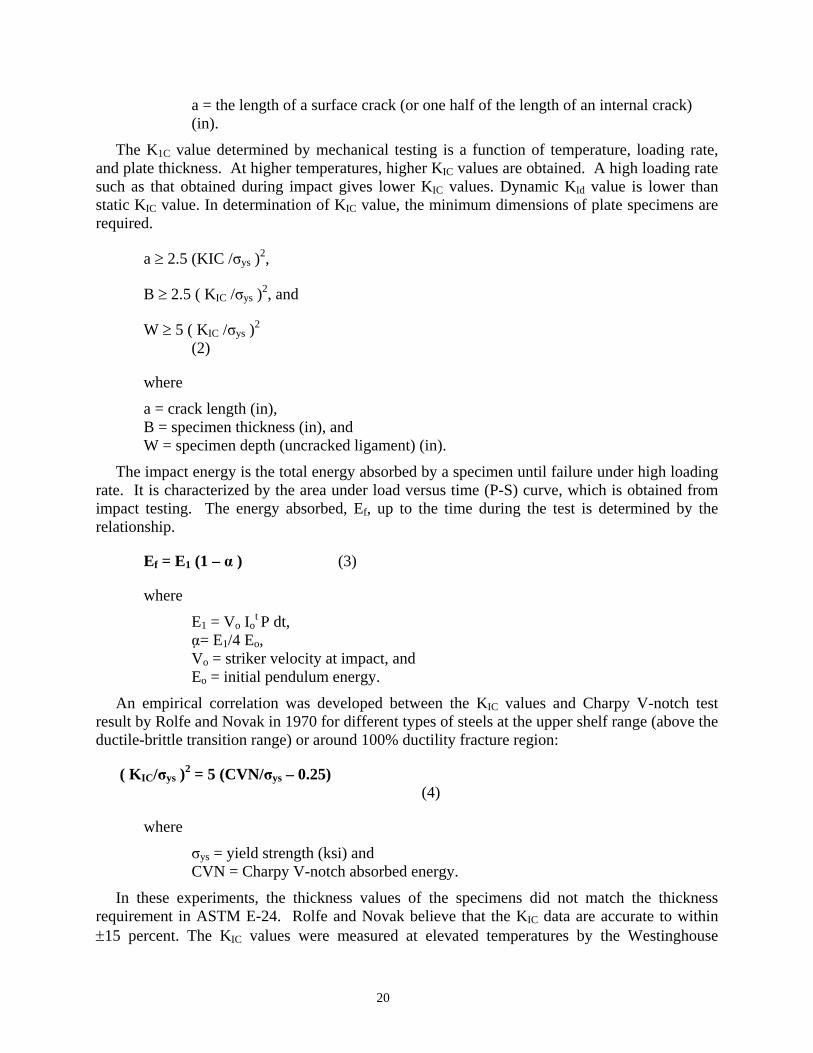
a = the length of a surface crack (or one half of the length of an internal crack) (in).
The K1C value determined by mechanical testing is a function of temperature, loading rate, and plate thickness. At higher temperatures, higher KIC values are obtained. A high loading rate such as that obtained during impact gives lower KIC values. Dynamic KId value is lower than static KIC value. In determination of KIC value, the minimum dimensions of plate specimens are required.
a ≥ 2.5 (KIC /σys )2,
B ≥ 2.5 ( KIC /σys )2, and
W ≥ 5 ( KIC /σys )2 (2)
where
a = crack length (in), B = specimen thickness (in), and W = specimen depth (uncracked ligament) (in).
The impact energy is the total energy absorbed by a specimen until failure under high loading rate. It is characterized by the area under load versus time (P-S) curve, which is obtained from impact testing. The energy absorbed, Ef, up to the time during the test is determined by the relationship.
Ef = E1 (1 – α ) (3)
where
E1 = Vo Iot P dt,
α= E1/4 Eo, Vo = striker velocity at impact, and Eo = initial pendulum energy.
An empirical correlation was developed between the KIC values and Charpy V-notch test result by Rolfe and Novak in 1970 for different types of steels at the upper shelf range (above the ductile-brittle transition range) or around 100% ductility fracture region:
( KIC/σys )2 = 5 (CVN/σys – 0.25) (4)
where
σys = yield strength (ksi) and CVN = Charpy V-notch absorbed energy.
In these experiments, the thickness values of the specimens did not match the thickness requirement in ASTM E-24. Rolfe and Novak believe that the KIC data are accurate to within ±15 percent. The KIC values were measured at elevated temperatures by the Westinghouse
20

researchers using large specimens, which satisfied the thickness requirement and thus four extra points were added. Data in Figures 5 show the results of these experiments and confirms the validity of equation.
Barsom and Rolfe conducted same experiments and concluded with the same results.
They also determined the correlation between KIC and CVN in the transition temperature range and brittle-ductile region, for low and medium-strength steels:
KIC2/E = 2 (CVN) 3/2
(5)
where E = Modulus of elasticity [ksi]
Sailors and Corten [4] derived similar empirical relationship:
KIC = 15.5 (CVN) 0.5 (6)
or this is equivalent to:
KIC2/E = 8 (CVN) (7)
Equations (6) and (7) are considered to provide good representation of the relationship between KIC and CVN for thick section steels in the range of 5 ft-lb < CVN < 50 ft-lb, in the low and transition temperature range. They also determined the correlation between dynamic fracture toughness (KId) and CVN. The resulting empirical relationship is given by:
KId = 15.873 (CVN)0.375 (8)
All these cases of determining the empirical relationship between KIC value and impact energy listed above are concerned only with different types of steels.
Measuring KIC value in practice by mechanical testing of brittle materials is difficult for two reasons. One is material availability. Brittle materials such as diamond are firstly expensive and second hard to obtain ASTM required size specimens. Another reason is particle size distribution and porosity of thermally stable polycrystalline (TSP) diamond are important factors and could influence the result of fracture testing. If there is a certain relationship that could be derived from the absorbed energy of impact testing, this would be desirable.
Instead, measuring absorbed energy for brittle materials is relatively easy by conducting drop weight tests or similar impact tests. Using the standard drop weight testing machine, a number of tests can be conducted at different test conditions and very precise values for certain materials can be determined. The specimen size is small enough. Therefore, the availability of material is not a big concern for drop weight impact tests.
21
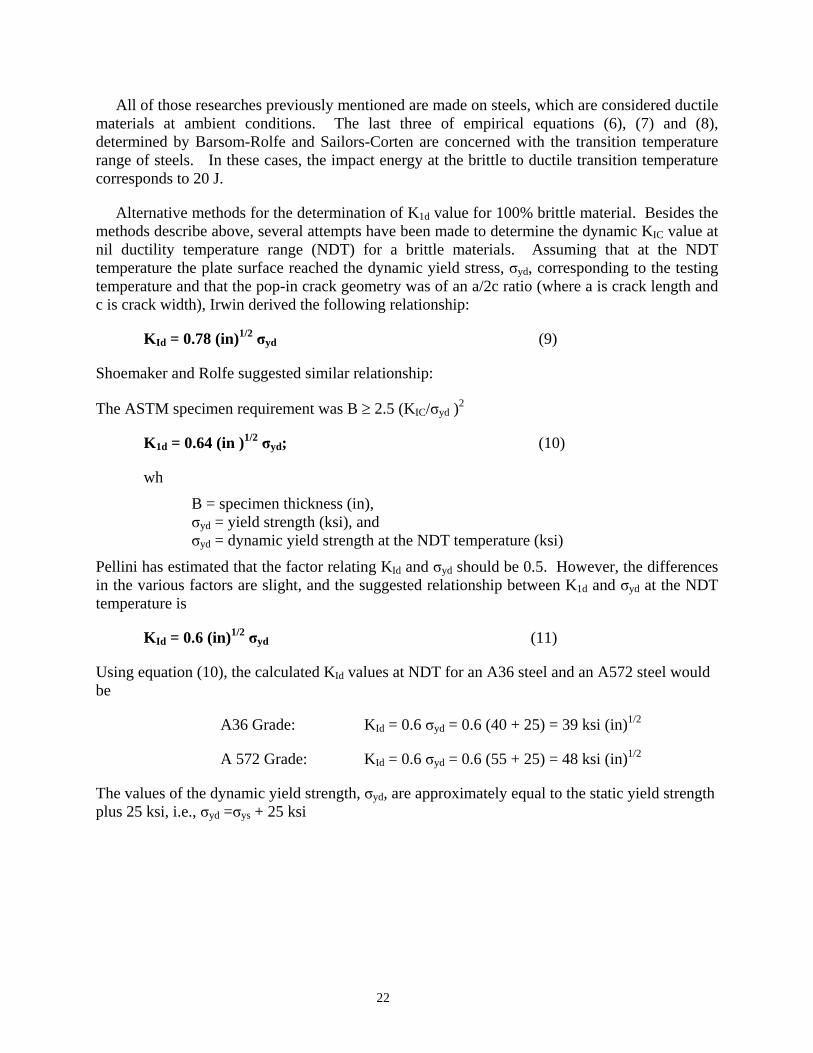
All of those researches previously mentioned are made on steels, which are considered ductile materials at ambient conditions. The last three of empirical equations (6), (7) and (8), determined by Barsom-Rolfe and Sailors-Corten are concerned with the transition temperature range of steels. In these cases, the impact energy at the brittle to ductile transition temperature corresponds to 20 J.
Alternative methods for the determination of K1d value for 100% brittle material. Besides the methods describe above, several attempts have been made to determine the dynamic KIC value at nil ductility temperature range (NDT) for a brittle materials. Assuming that at the NDT temperature the plate surface reached the dynamic yield stress, σyd, corresponding to the testing temperature and that the pop-in crack geometry was of an a/2c ratio (where a is crack length and c is crack width), Irwin derived the following relationship:
KId = 0.78 (in)1/2 σyd (9)
Shoemaker and Rolfe suggested similar relationship:
The ASTM specimen requirement was B ≥ 2.5 (KIC/σyd )2
K1d = 0.64 (in )1/2 σyd; (10)
wh
B = specimen thickness (in), σyd = yield strength (ksi), and σyd = dynamic yield strength at the NDT temperature (ksi)
Pellini has estimated that the factor relating KId and σyd should be 0.5. However, the differences in the various factors are slight, and the suggested relationship between K1d and σyd at the NDT temperature is
KId = 0.6 (in)1/2 σyd (11)
Using equation (10), the calculated KId values at NDT for an A36 steel and an A572 steel would be
A36 Grade: KId = 0.6 σyd = 0.6 (40 + 25) = 39 ksi (in)1/2
A 572 Grade: KId = 0.6 σyd = 0.6 (55 + 25) = 48 ksi (in)1/2
The values of the dynamic yield strength, σyd, are approximately equal to the static yield strength plus 25 ksi, i.e., σyd =σys + 25 ksi
22
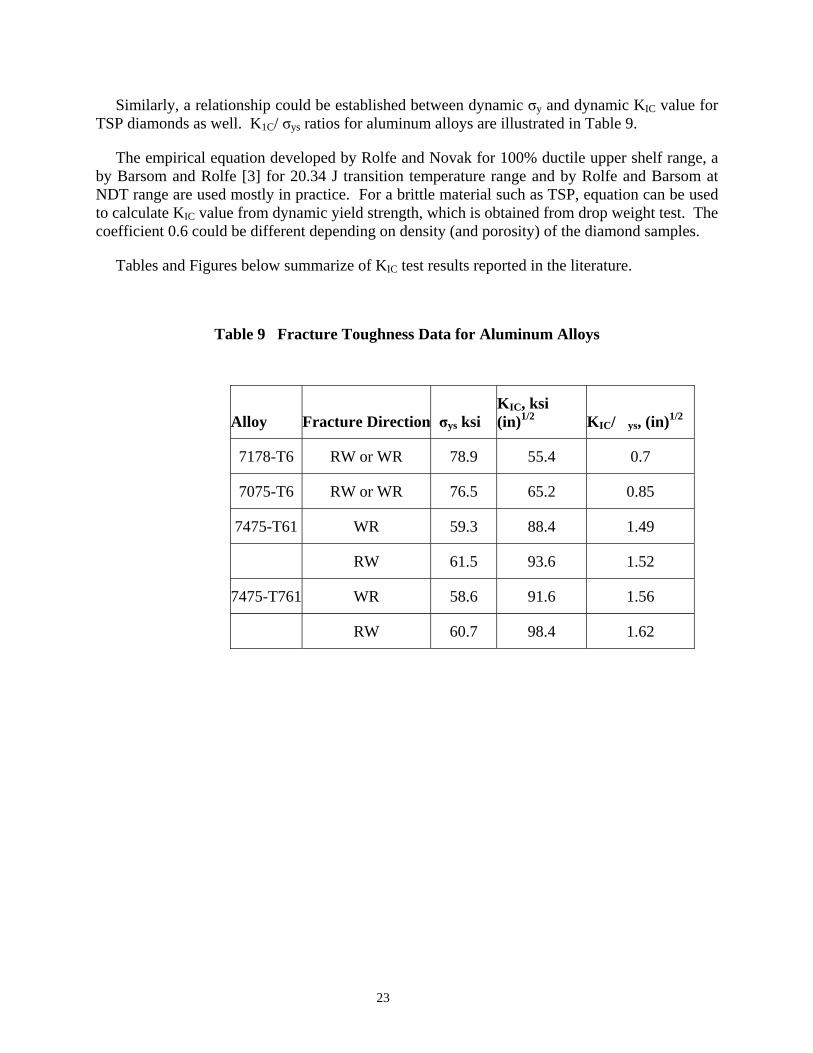
Similarly, a relationship could be established between dynamic σy and dynamic KIC value for TSP diamonds as well. K1C/ σys ratios for aluminum alloys are illustrated in Table 9.
The empirical equation developed by Rolfe and Novak for 100% ductile upper shelf range, a by Barsom and Rolfe [3] for 20.34 J transition temperature range and by Rolfe and Barsom at NDT range are used mostly in practice. For a brittle material such as TSP, equation can be used to calculate KIC value from dynamic yield strength, which is obtained from drop weight test. The coefficient 0.6 could be different depending on density (and porosity) of the diamond samples.
Tables and Figures below summarize of KIC test results reported in the literature.
Table 9 Fracture Toughness Data for Aluminum Alloys
Alloy Fracture Direction σys ksi KIC, ksi (in)1/2 KIC/�ys, (in)1/2
7178-T6 RW or WR 78.9 55.4 0.7
7075-T6 RW or WR 76.5 65.2 0.85
7475-T61 WR 59.3 88.4 1.49
RW 61.5 93.6 1.52
7475-T761 WR 58.6 91.6 1.56
RW 60.7 98.4 1.62
23
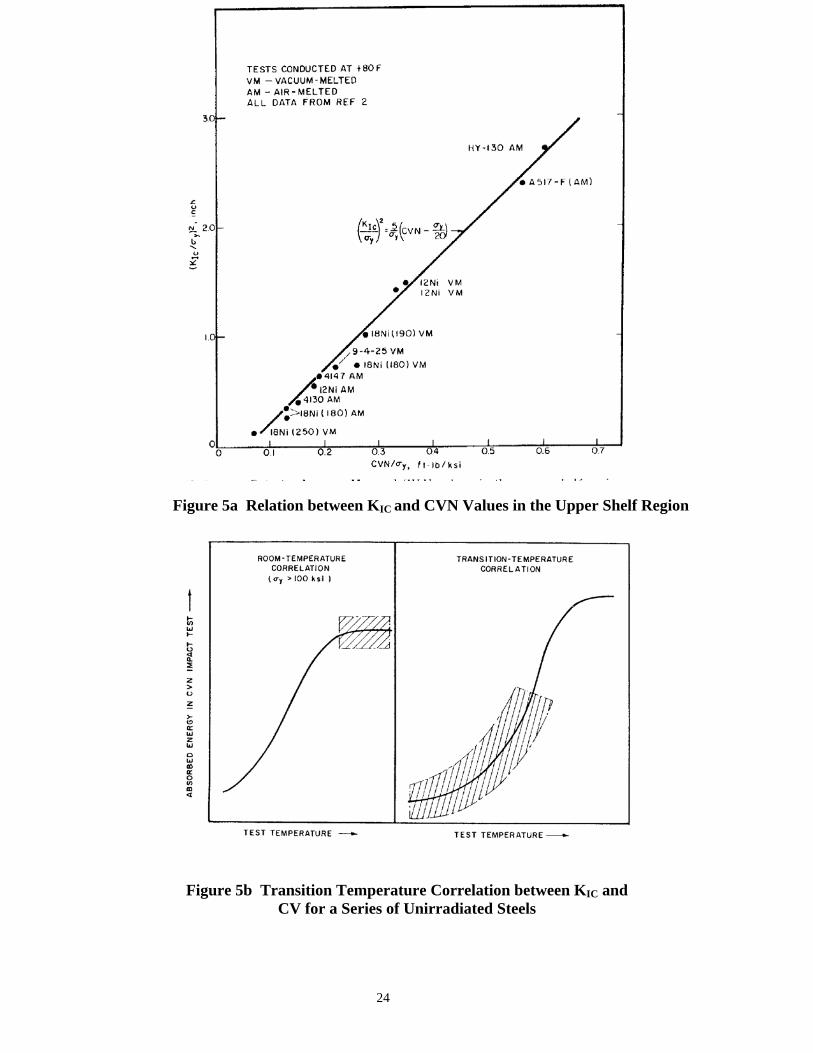
Figure 5a Relation between KIC and CVN Values in the Upper Shelf Region
Figure 5b Transition Temperature Correlation between KIC and CV for a Series of Unirradiated Steels
24
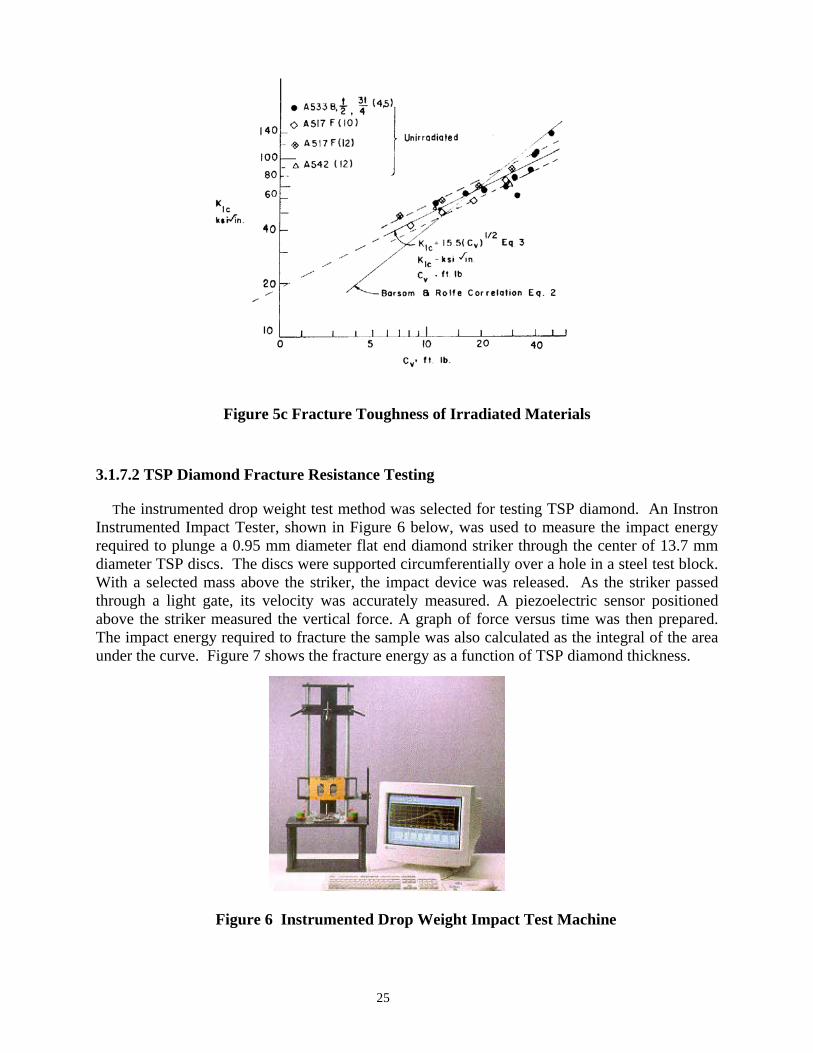
Figure 5c Fracture Toughness of Irradiated Materials
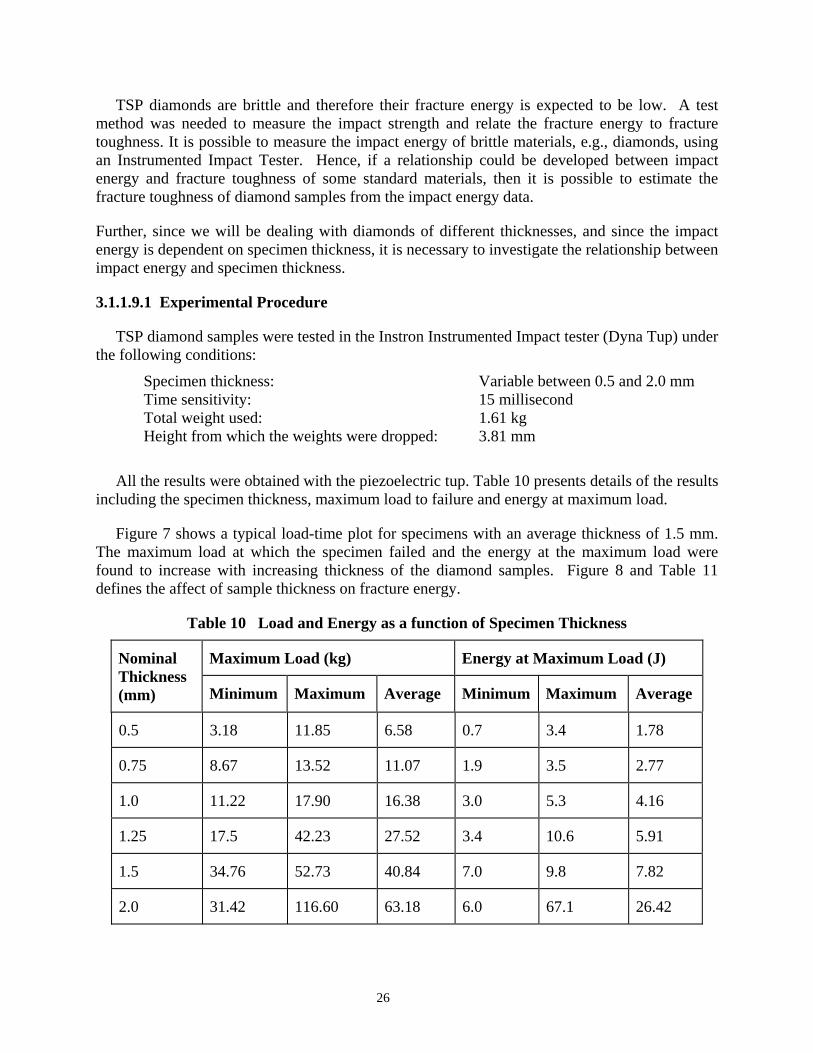
3.1.7.2 TSP Diamond Fracture Resistance Testing
The instrumented drop weight test method was selected for testing TSP diamond. An Instron Instrumented Impact Tester, shown in Figure 6 below, was used to measure the impact energy required to plunge a 0.95 mm diameter flat end diamond striker through the center of 13.7 mm diameter TSP discs. The discs were supported circumferentially over a hole in a steel test block. With a selected mass above the striker, the impact device was released. As the striker passed through a light gate, its velocity was accurately measured. A piezoelectric sensor positioned above the striker measured the vertical force. A graph of force versus time was then prepared. The impact energy required to fracture the sample was also calculated as the integral of the area under the curve. Figure 7 shows the fracture energy as a function of TSP diamond thickness.
Figure 6 Instrumented Drop Weight Impact Test Machine
25
TSP diamonds are brittle and therefore their fracture energy is expected to be low. A test method was needed to measure the impact strength and relate the fracture energy to fracture toughness. It is possible to measure the impact energy of brittle materials, e.g., diamonds, using an Instrumented Impact Tester. Hence, if a relationship could be developed between impact energy and fracture toughness of some standard materials, then it is possible to estimate the fracture toughness of diamond samples from the impact energy data.
Further, since we will be dealing with diamonds of different thicknesses, and since the impact energy is dependent on specimen thickness, it is necessary to investigate the relationship between impact energy and specimen thickness.
3.1.1.9.1 Experimental Procedure
TSP diamond samples were tested in the Instron Instrumented Impact tester (Dyna Tup) under the following conditions:
Specimen thickness: Variable between 0.5 and 2.0 mm Time sensitivity: 15 millisecond Total weight used: 1.61 kg Height from which the weights were dropped: 3.81 mm
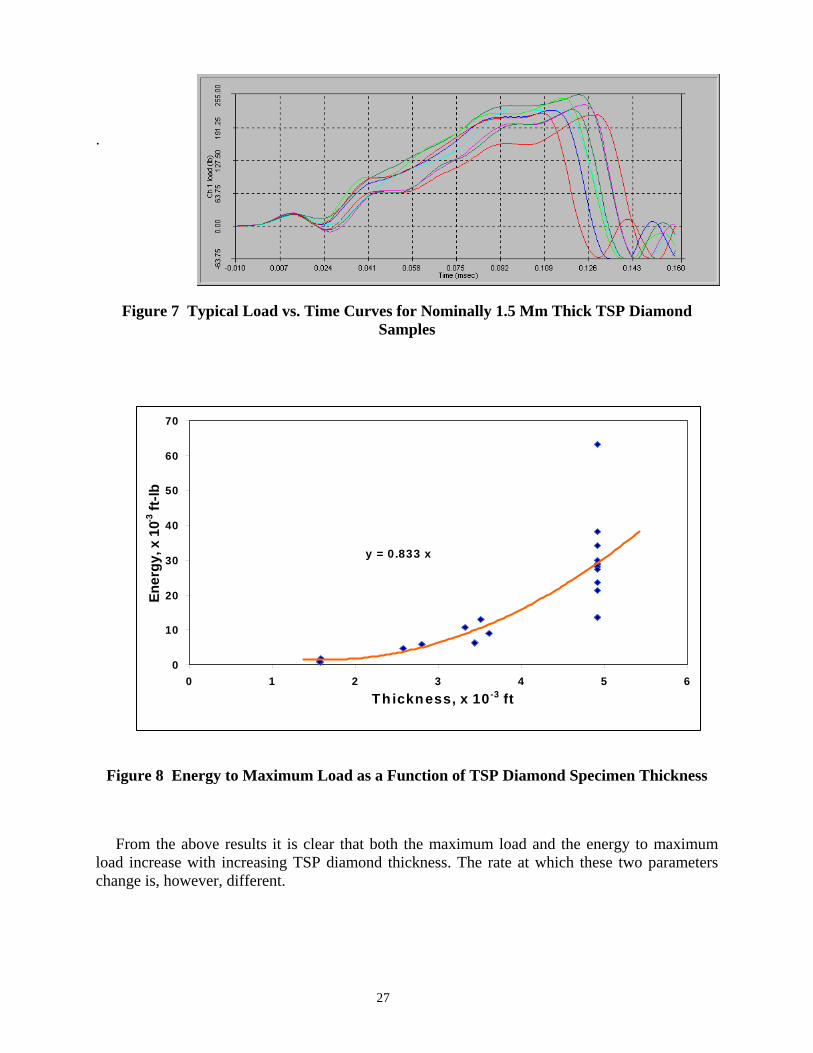
All the results were obtained with the piezoelectric tup. Table 10 presents details of the results including the specimen thickness, maximum load to failure and energy at maximum load.
Figure 7 shows a typical load-time plot for specimens with an average thickness of 1.5 mm. The maximum load at which the specimen failed and the energy at the maximum load were found to increase with increasing thickness of the diamond samples. Figure 8 and Table 11 defines the affect of sample thickness on fracture energy.
Table 10 Load and Energy as a function of Specimen Thickness
Maximum Load (kg) Energy at Maximum Load (J) Nominal Thickness (mm) Minimum Maximum Average Minimum Maximum Average
0.5 3.18 11.85 6.58 0.7 3.4 1.78
0.75 8.67 13.52 11.07 1.9 3.5 2.77
1.0 11.22 17.90 16.38 3.0 5.3 4.16
1.25 17.5 42.23 27.52 3.4 10.6 5.91
1.5 34.76 52.73 40.84 7.0 9.8 7.82
2.0 31.42 116.60 63.18 6.0 67.1 26.42
26
y = 0.833 x
0
10
20
30
40
50
60
70
0 1 2 3 4 5 6Th ickness, x 10-3 ft
Ener
gy, x
10-3
ft-lb
.
Figure 7 Typical Load vs. Time Curves for Nominally 1.5 Mm Thick TSP Diamond Samples
Figure 8 Energy to Maximum Load as a Function of TSP Diamond Specimen Thickness
From the above results it is clear that both the maximum load and the energy to maximum load increase with increasing TSP diamond thickness. The rate at which these two parameters change is, however, different.
27
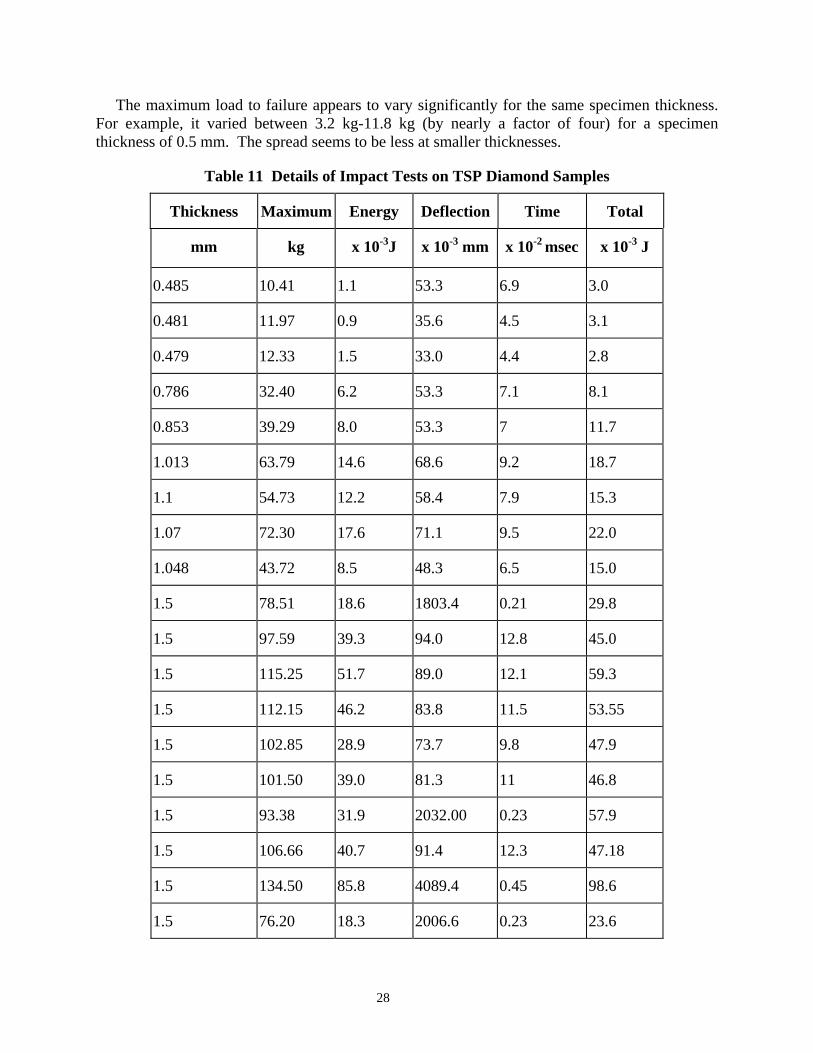
The maximum load to failure appears to vary significantly for the same specimen thickness. For example, it varied between 3.2 kg-11.8 kg (by nearly a factor of four) for a specimen thickness of 0.5 mm. The spread seems to be less at smaller thicknesses.
Table 11 Details of Impact Tests on TSP Diamond Samples
Thickness Maximum Energy Deflection Time Total
mm kg x 10-3J x 10-3 mm x 10-2 msec x 10-3 J
0.485 10.41 1.1 53.3 6.9 3.0
0.481 11.97 0.9 35.6 4.5 3.1
0.479 12.33 1.5 33.0 4.4 2.8
0.786 32.40 6.2 53.3 7.1 8.1
0.853 39.29 8.0 53.3 7 11.7
1.013 63.79 14.6 68.6 9.2 18.7
1.1 54.73 12.2 58.4 7.9 15.3
1.07 72.30 17.6 71.1 9.5 22.0
1.048 43.72 8.5 48.3 6.5 15.0
1.5 78.51 18.6 1803.4 0.21 29.8
1.5 97.59 39.3 94.0 12.8 45.0
1.5 115.25 51.7 89.0 12.1 59.3
1.5 112.15 46.2 83.8 11.5 53.55
1.5 102.85 28.9 73.7 9.8 47.9
1.5 101.50 39.0 81.3 11 46.8
1.5 93.38 31.9 2032.00 0.23 57.9
1.5 106.66 40.7 91.4 12.3 47.18
1.5 134.50 85.8 4089.4 0.45 98.6
1.5 76.20 18.3 2006.6 0.23 23.6
28
1.5 99.14 30.1 78.7 10.7 44.1
1.5 102.37 37.0 86.4 11.8 43.4
3.2 TSP Diamond Material Processing
A basic premise of this project was that the development of a successful TSP diamond cutter required that the TSP diamond properties of available materials produced by any supplier were not adequate. Therefore, a major objective was to develop post processing that would increase the physical properties of existing available materials. The porous TSP diamond produced by GE had both variable and relatively low mechanical strength. It is well known that the mechanical strength of a porous ceramic is reduced by up to 50% with a porosity of only 2 volume percent. Furthermore, initial impact testing showed that the fracture resistance was not sufficient. It has been known in the industry that TSP diamond” halo fracture” occurs in field drilling applications. The initial project task was to review the state-of-the-art for diamond post processing. Impregnation techniques had been evaluated without success. The primary problem was that the impregnant reacted with the diamond structure, causing a decrease in performance. Several alternative methods were investigated to densify the porous diamond structure. In addition, recent studies in plasma physics had shown that ion implantation techniques can treat the surface of brittle materials to increase the resistance to fracture – both initiation of cracking and the crack propagation.
3.2.1 Densification
Densification of porous TSP diamond creates filled diamond which has improved mechanical strength. Removing cobalt in the manufacture of TSP diamond results in 2 to 3 volume percent porosity and up to a 50% reduction in mechanical strength. The empty porosity increases the thermal stability from about 700 to 1200° C. By the nature of the acid leaching process utilized, the pore structure of the TSP diamond is primarily continuous open porosity which, with suitable processing, can be filled to restore fracture resistance and mechanical strength. The difficulty in regaining full strength are (1) the inability to substantially fill the porosity, (2) chemical reactions which attack and weaken the diamond matrix, and (3) pore filling with elements or compounds with incompatible thermal expansion.
Both gaseous and liquid pore-filling fluids were investigated. By definition, infiltration shall mean pore filling without the aid of pressure, and impregnation shall mean pore-filling with the aid of pressure. Gases included carbon deposition with gaseous methane, and silicon and silicon and silicon carbide deposition with gaseous silicon compounds. Liquids included several pre-ceramic polymers which form silicon carbide or silicon-oxy-carbide. During the densification process, the pores may be lined with multiple layers deposited throughout the preform by successive pore filling cycles. It is generally recognized that it would be very desirable to have TSP diamond that exhibit a combination of properties, including high heat resistance, high fracture resistance, and low wear rates. Numerous generally unsuccessful attempts had previously been made to achieve such a
29

combination of properties. Typically, such previous attempts resulted in achieving to some limited degree one or two of these properties at the expense of the others. It had been previously proposed to apply chemical vapor deposition (CVD) procedures to deposit diamond in the pores of TSP compacts. CVD experiments were conducted for Technology International, Inc. by Goodyear, Inc. Goodyear is the major manufacture of methane infiltrated carbon-carbon composites for the aerospace industry. Attempts to infiltrate TSP diamond with methane to form carbon, and gaseous silicon compounds to form silicon and silicon carbide were not successful. There was no increase in density after the process attempts. The experience major manufacturers of CVD infiltrated materials verify that the minimum pore diameter necessary to densify a porous material is 25 micron diameter. While it has been recognized that fine structured TSP diamond were difficult to infiltrate, the densification of TSP diamond containing less than about 3 volume percent void volume with average pore sizes of less than about 1 micron was generally considered to be impractical or impossible to fully densify.. Partial impregnation of TSP diamond with liquid silicon metal was reported by Smith Metadiamond. Under heat and pressure (45-55 Kbars and above 1,000° C), previously formed self-bonded porous diamond compacts with a molten silicon containing alloys such as Ni-Si, Al-Si, or Cu-Si. While these silicon alloys have coefficients of thermal expansion that are close to that of diamond, the conversion of a small amount of diamond to silicon carbide or graphite seriously reduced the fracture toughness of the TSP material. Furthermore, silicon metal impregnant penetrated does not fill the pores uniformly. Chemical reaction with the diamond matrix and partial pore filling by the liquid impregnant would further degrade the mechanical properties of the densified TSP diamond. A wide variety of pyrolyzable liquid polymeric materials had been investigated for use as ceramic precursors which were investigated as compatible impregnants for TSP diamond. Such materials include, for example, polysilazanes, polyureasilazanes, polythioureasilazanes, polycarbosilanes, polysilanes, polysiloxanes, siloxazanes, silsesquioxanes, silylated silicate resins, and the like. The inclusion of various organometallics in liquid ceramic precursors that yield metal silicates or silicides upon pyrolysis had been utilized. Typically, liquid ceramic precursors were cured to form a solid, which is then pyrolized to a ceramic form by heating at a rate of, for example, 200 ° C per hour to a final temperature of between approximately 300 and 900 ° C. It is, of course, not possible to exceed 1200 ° C at typical impregnation pressures without degrading the TSP diamond. The volume of the resulting ceramic, after pyrolysis, is typically up to 80 percent by volume of the uncured liquid ceramic precursor. Repeated impregnation cycles results is nearly 100% densification. Conducting the pyrolysis operation in an inert atmosphere or vacuum produces a silicon carbide or silicon oxycarbide ceramic which fills the pores. Thus, the impregnant is deposited successively in several layers throughout the compact. When densification is complete, the pore linings are not be visible as separate layers. The deposited impregnant lines the pore system within the TSP diamond and thus substantially fully densifies, and is thermally and chemically compatible with the diamond. After densification the TSP diamond has an impact strength which is at least one and one half to two times that of the undensified TSP as measured by the instrumented drop weight impact test.
30
The TSP densification process is performed initially in vacuum to evacuate the gases from the network of pores. Then, the diamond is immersed in the liquid impregnant. The evacuation is followed by liquid impregnation at pressures above approximately 1,500 or more pounds per square inch. Liquid impregnation results in substantially complete pore filling with the liquid impregnant. As the liquid pre-ceramic impregnant is cured and then thermally reduced (pyrolized) to a ceramic its volume typically shrinks by from approximately up to 20 percent. The first cycle of impregnation-curing-firing typically leaves some significant void volume in the ceramic impregnated TSP diamond. The formed in situ imoregnant thus forms a pore lining where the average size of the pores is reduced, but most of the pores are not fully blocked. The liquid impregnation-curing-firing operation is carried out several times. With each successive cycle the pores and the remaining void volume become smaller. After a sufficient number of cycles, the void volume of the TSP diamond to below 0.3 percent. Densification will prevent or substantially retard the propagation of cracks through the preform. Densification also substantially blocks the pores thus substantially reducing the surface area of the preform to chemical reaction, thus protecting the TSP diamond from chemical attack during the drilling operation.
3.2.2 Ion Implantation The ion implantation process has been known to improve the surface properties of materials since the late 1960’s. For example, it has been shown that ion implantation can reduce the wear rate of tungsten carbide cutting tools. However, performance benefits have been found to be application specific, and the process is not universally accepted.
Several ions and suitable combinations thereof,, including Al3+, Ar+, B3+, C4+, Ca2+, Cr3+, H+, N5+, Ni2+, O+, Si4+, Ti2+, and Zr4+ have been implanted into many different types of materials. Even though no reasons or models for the selection of these ions were available, empirical studies have shown that primarily the electrical properties of the materials were modified. Thus, there are numerous applications for ion implantation in the electronics industry.
In the ion implantation process, high-energy ions bombard the substrate surface to a depth of about 0.1 um. This bombardment alters the surface structure resulting in increased surface hardness and improved wear resistance through the inhibition of microcrack propagation and micro-chipping.
It has also been shown that when this process is applied to tool steels, the tools last longer and stay sharper over their extended life. Another significant observation is that the fracture toughness of tool steels is improved after ion implantation. Since this is an implant and not a coating, dimensional and bulk properties remain unchanged, and the implanted surfaces have no problems with adhesion, residual stress, or chemical reaction which alters the parent material. It is interesting to note, that in spite of the ion bombardment, the tool steel surface temperature generally remains below 150 oC. This also prevents damage to the parent material, and makes tool handling easier after implantation. Even though vapor deposition coatings could improve tool life by 32%, the metal ion implantation process has been shown to improve tool life by about 400% while machining titanium. In some cases, the tool life has increased by as much as 1000%. In other cases, the tool life has doubled, even though the cutting speed was tripled.
31
As mentioned above, the ions penetrate the surface to a depth of about 0.1 micron (even though the actual range may vary from 0.05 to 0.2 micron). But, they cause structural changes in the tool material that enhance its performance to a depth of several microns. The mechanism for the improvement of surface properties is, however, becoming clear only in recent times. Four different mechanisms have been proposed for the improvement of surface properties of ion-implanted specimens.
1. One theory suggests that ion implantation produces compressive stresses in the surface of the material. This surface compressive stress “shuts” any pre-existing cracks and prevents new ones from forming. When inserts chip, the problem often occurs at the lips of cracks. With the cracks eliminated, this source of chipping is no longer a threat. However, recent studies have indicated that ion implantation does not always increase the compressive stresses on the surface. In fact, a reduction in residual compressive stresses was seen in some cases. Even in these cases, a reduction in wear was observed.
2. A second theory suggests that ion implantation provides inward diffusion of the ions, particularly where nitrogen is the element. However, this concept failed to explain the improvements seen when noble gas ions were implanted, where diffusion is not possible.
3. Another theory suggested that ion implantation promotes oxide formation on the surface, thus reducing wear of the native material. But, improvement in wear resistance was observed even when oxidation did not occur. A clear example is the observation of improved fracture toughness and wear resistance when the surface was implanted with TiN, where oxidation of the surface was not possible.
4. Yet another theory suggests that ion implantation induces or otherwise causes the formation of a dislocation network structure in the material, and that this structure suppresses both crack formation and crack propagation. Formation of the dislocation network occurs to depths far below the depth of ion implantation Up to about 100 micron). This has been shown to be the operative mechanism during ion implantation by many Russian investigations.
It has been shown that the dislocation density in ion-implanted materials increases with increasing distance from the surface, reaching its maximum some 1 to 10 micron, even though it may be as large as 50 micron, below the implanted surface and then gradually decreasing. Further, an increase in the radius or mass of the implant ion results in an increase of the dislocation density.
It has been suggested that defects (vacancies and interstitials) are formed in the implanted zone. Some of these annihilate at the surface and the energy released by the annihilation acts as a shock wave propagating into the bulk. This shock wave causes the production of defects at grain boundaries, which cause the release of defects in the form of dislocation loops and a stress build-up causing dislocation generation in the interior of the sample. Thus, ion implantation forms two regions near the surface of the material: (i) an implantation zone on the order of 0.1 micron deep, and (ii) an implantation-affected zone that could be many microns deep. A high-
32
density of (both loop and line) dislocations, as illustrated in Figure 9, characterizes the latter region. The dislocation network peaks at 1 to 10 micron below the implanted surface.
Recent work has demonstrated that the performance of tungsten carbide machine tools can be significantly improved after ion implantation. . Physical property testing verified that the fracture and wear resistance have improved to a considerable depth below the surface. Based on these studies on the improved performance of tungsten carbide cutting tools subjected to ion implantation, it can be concluded that:
• The density of dislocations increased with the mass and radius of the implant ion elements,
• Largest effects occur when
- the implanted atoms are not on lattice sites.
- the diameter of the implanted atoms is much larger than the constituents of the material being implanted.
• The density of the dislocations depends on the number of ions hitting the surface, not the number staying in the surface, and
• The dislocation structures are similar to those observed in cold-worked metals and alloys.
Some work has been conducted earlier on investigating the effects of ion implantation on the behavior of cobalt-bonded tungsten carbide and diamond samples. It was shown that the improvement in wear resistance observed in tungsten carbide samples could be understood if the wear mechanism is cobalt extrusion by pull-out of carbide grains. The cobalt phase, hardened by precipitation hardening due to ion implantation, hinders its extrusion and also delays the wear process. Consequently, the service life of the components is lengthened. Some investigators have studied the maximum depth up to which ions could be implanted into diamond. Some other investigators studied the effect of ion implantation in diamond on physical properties such as luminescent control, formation of multilayer impurity defect structures, and doping. But, there do not appear to be any reports on the mechanical properties of ion-implanted diamond. Because of the success using TiNi ion species, the results for the ion implantation of TSP diamond is reported herein.
33

Implantation zone(0.05-0.2 μm)
Implantataion-Affected Zone
(1-100 μm)
Incident High- EnergyIons (>20 keV)
Line Dislocations
Loop Dislocations
Figure 9 Schematic of the Effect of Ion Implantation.
Ion SourceIsolation Valve
End Station
Target Holder
Figure 10 Schematic of the Direct Ion Implantation System.
34

Figure 11 Photograph of the Ion Source.
The ion implantation process used a direct metal ion implantation system. The system uses a pulsed cathodic arc to produce metal ion plasma in a source chamber. The ions are extracted from the source through a series of perforated plates, or electrodes, forming a multi-aperture, accel-decel ion source. One plate or electrode is connected to the ionization chamber and is held at the positive acceleration voltage. A second plate is placed parallel to the first, at a negative potential and with its holes aligned with the holes in the first, or source, electrode. If the distance between the two plates is approximately the same as the holes, the ions will be extracted through the two holes without many hitting the second plate. A third electrode, at ground potential, is often used to minimize beam spread. A schematic of this system, designated as a “direct” ion implantation system, is shown in Figure 10 and a photograph of the advanced vacuum ion source is shown in Figure 11.
35

The advantage of such a system is that very high beam currents can be extracted at relatively low cost. Additionally, the implant coverage can be controlled with high-energy efficiency and with no heating of the chamber walls.
3.2.2.1 Implantation Procedure The specimens are mounted in the path of the beam such that the critical surfaces are exposed. The implants are carried out in vacuum, usually at a pressure in the mid-10-6 Torr range. The normal procedure is to load the chamber with three titanium and three nickel cathodes, and fire these in two alternating sequences, one of the three titanium cathodes and one of the three nickel cathodes.
Nickel has sufficient mass to produce a good dislocation structure at low cost, and also provides a bit of corrosion resistance for high-speed steel tools. The titanium was added because titanium and nickel form a lubricious oxide at temperatures encountered in tool applications.
The ions are implanted to a dose of 5x10²⁰/m2, ±30%. The ion source is operated with an extraction voltage of 67 kV. The average charge of titanium ions from the arc source is +2, so the titanium ions have an average energy of 134 keV. For nickel, the values are +1.5 and 100 keV. The beam current density is kept below 200 mA/m2 during implantation to keep the temperatures low, typically below 150 °C.
Ion implant treatments were applied to 13-mm diameter TSP diamond cylinders with a thickness of about 1.5 mm. The Ni-Ti ions were implanted onto the lapped surface of the TSP diamond substrates at different implantation doses.
3.2.2.2 Implantation Ion Species Pertinent physical properties of carbon plus Ni-Ti ion species is listed in Table 12. The Ni-Ti ion species was selected based on earlier experience with tungsten carbide plus the following reasons:
Titanium/Nickel: Both titanium and nickel are heavy atoms to produce a good dislocation structure and the combination of titanium and nickel forms a lubricious oxide at high enough temperatures.
Titanium is a strong carbide former with a high hardness of 3200 kg/mm2. Thus, it appears that its chemical affinity to carbon plays an important role in increasing the fracture energy of the TSP diamond specimens.
36
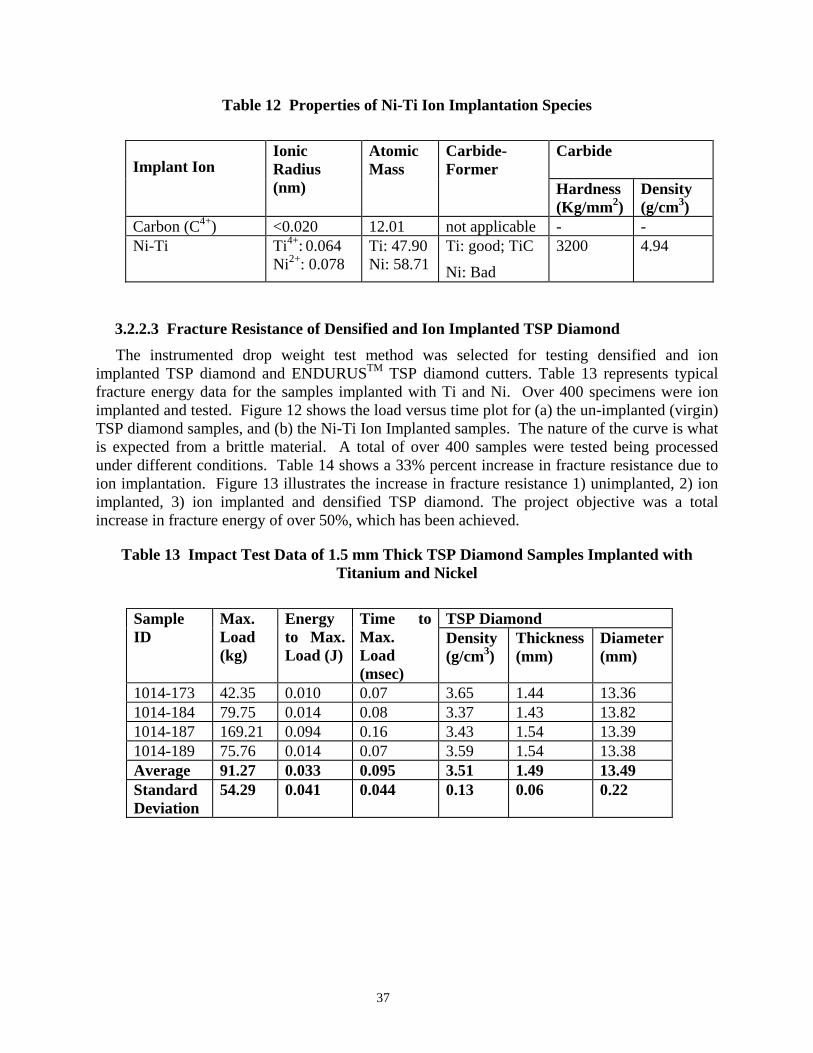
Table 12 Properties of Ni-Ti Ion Implantation Species
Carbide Implant Ion
Ionic Radius (nm)
Atomic Mass
Carbide- Former
Hardness (Kg/mm2)
Density (g/cm3)
Carbon (C4+) <0.020 12.01 not applicable - - Ni-Ti Ti4+: 0.064
Ni2+: 0.078 Ti: 47.90 Ni: 58.71
Ti: good; TiC
Ni: Bad
3200 4.94
3.2.2.3 Fracture Resistance of Densified and Ion Implanted TSP Diamond
The instrumented drop weight test method was selected for testing densified and ion implanted TSP diamond and ENDURUSTM TSP diamond cutters. Table 13 represents typical fracture energy data for the samples implanted with Ti and Ni. Over 400 specimens were ion implanted and tested. Figure 12 shows the load versus time plot for (a) the un-implanted (virgin) TSP diamond samples, and (b) the Ni-Ti Ion Implanted samples. The nature of the curve is what is expected from a brittle material. A total of over 400 samples were tested being processed under different conditions. Table 14 shows a 33% percent increase in fracture resistance due to ion implantation. Figure 13 illustrates the increase in fracture resistance 1) unimplanted, 2) ion implanted, 3) ion implanted and densified TSP diamond. The project objective was a total increase in fracture energy of over 50%, which has been achieved.
Table 13 Impact Test Data of 1.5 mm Thick TSP Diamond Samples Implanted with Titanium and Nickel
TSP Diamond Sample
ID Max. Load (kg)
Energy to Max. Load (J)
Time to Max. Load (msec)
Density (g/cm3)
Thickness (mm)
Diameter (mm)
1014-173 42.35 0.010 0.07 3.65 1.44 13.36 1014-184 79.75 0.014 0.08 3.37 1.43 13.82 1014-187 169.21 0.094 0.16 3.43 1.54 13.39 1014-189 75.76 0.014 0.07 3.59 1.54 13.38 Average 91.27 0.033 0.095 3.51 1.49 13.49 Standard Deviation
54.29 0.041 0.044 0.13 0.06 0.22
37
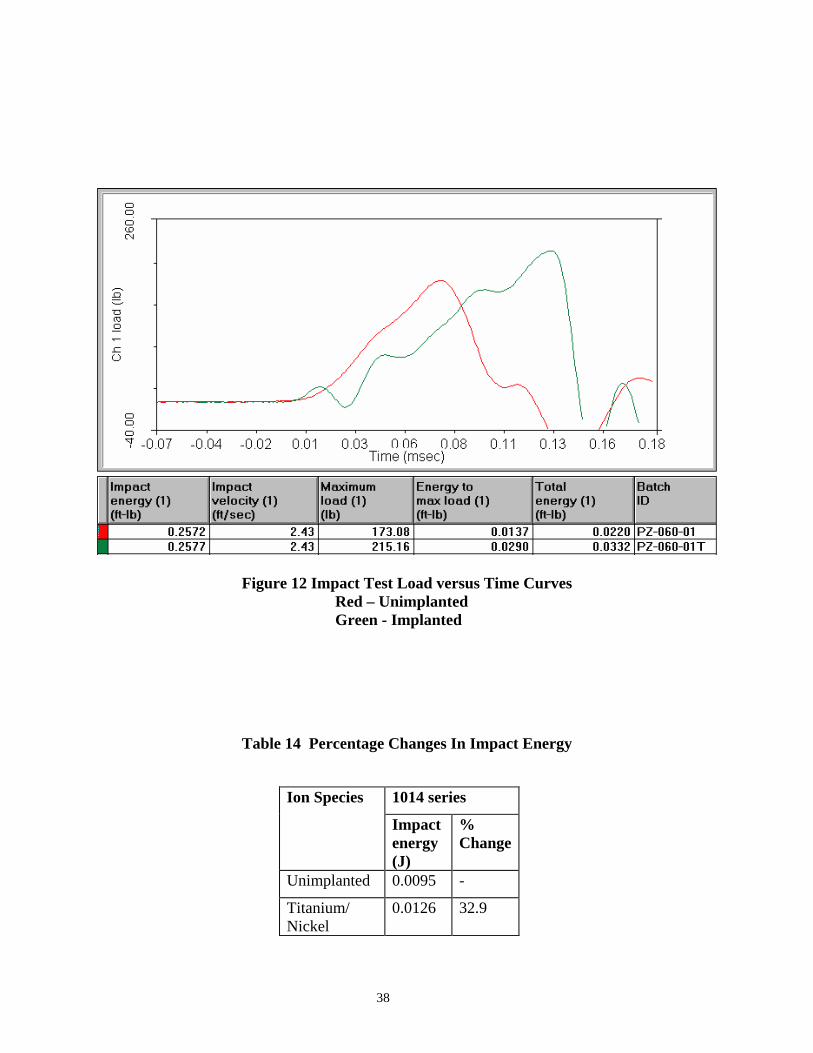
Figure 12 Impact Test Load versus Time Curves Red – Unimplanted Green - Implanted
Table 14 Percentage Changes In Impact Energy
1014 series Ion Species
Impact energy (J)
% Change
Unimplanted 0.0095 -
Titanium/ Nickel
0.0126 32.9
38
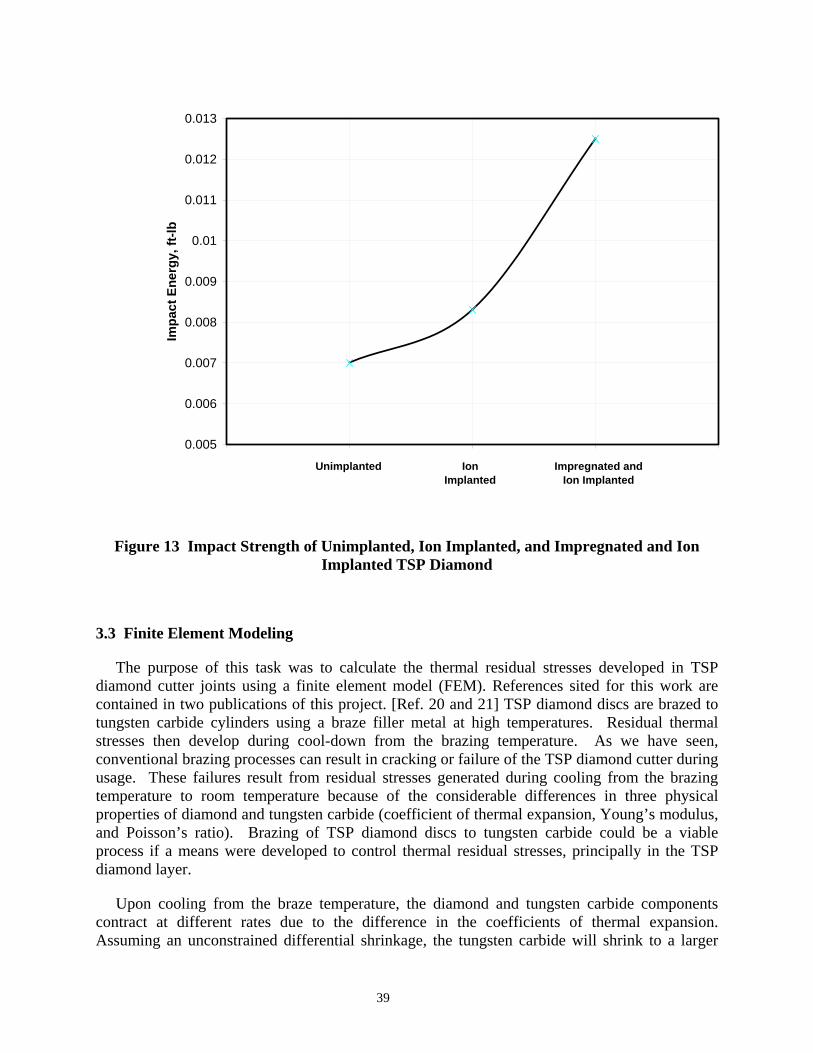
0.005
0.006
0.007
0.008
0.009
0.01
0.011
0.012
0.013
Impa
ct E
nerg
y, ft
-lb
Unimplanted Ion Implanted
Impregnated and Ion Implanted
Figure 13 Impact Strength of Unimplanted, Ion Implanted, and Impregnated and Ion Implanted TSP Diamond
3.3 Finite Element Modeling
The purpose of this task was to calculate the thermal residual stresses developed in TSP diamond cutter joints using a finite element model (FEM). References sited for this work are contained in two publications of this project. [Ref. 20 and 21] TSP diamond discs are brazed to tungsten carbide cylinders using a braze filler metal at high temperatures. Residual thermal stresses then develop during cool-down from the brazing temperature. As we have seen, conventional brazing processes can result in cracking or failure of the TSP diamond cutter during usage. These failures result from residual stresses generated during cooling from the brazing temperature to room temperature because of the considerable differences in three physical properties of diamond and tungsten carbide (coefficient of thermal expansion, Young’s modulus, and Poisson’s ratio). Brazing of TSP diamond discs to tungsten carbide could be a viable process if a means were developed to control thermal residual stresses, principally in the TSP diamond layer.
Upon cooling from the braze temperature, the diamond and tungsten carbide components contract at different rates due to the difference in the coefficients of thermal expansion. Assuming an unconstrained differential shrinkage, the tungsten carbide will shrink to a larger
39
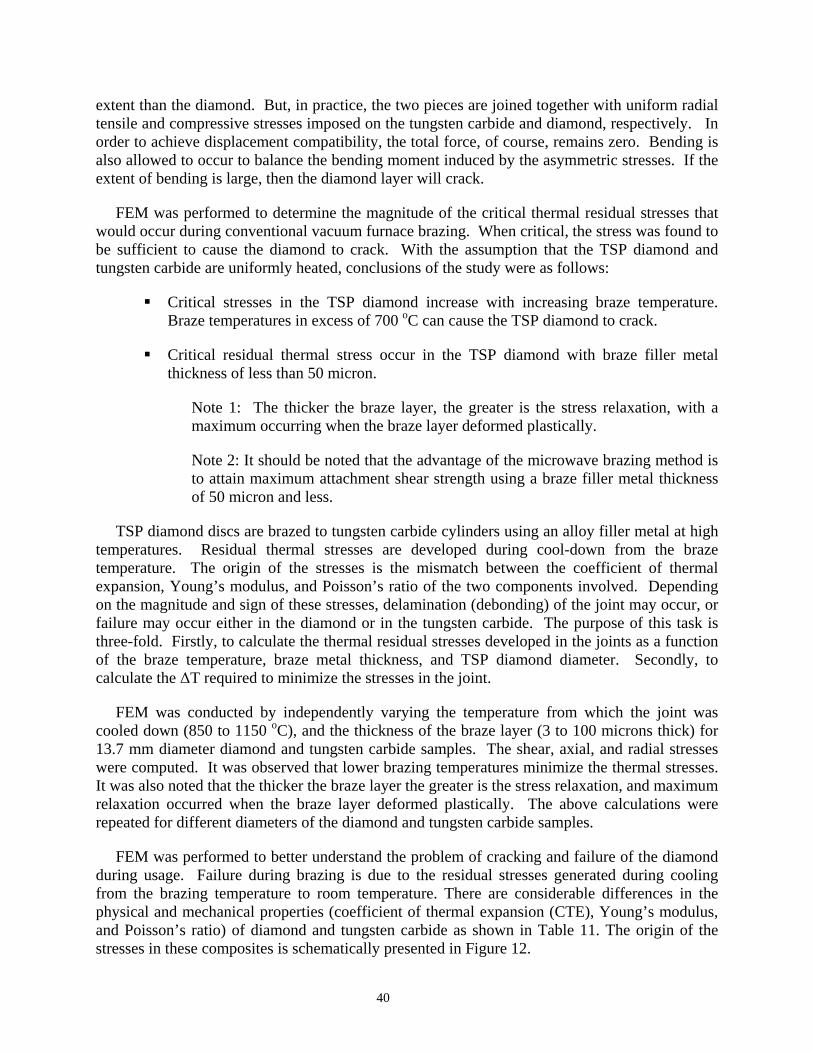
extent than the diamond. But, in practice, the two pieces are joined together with uniform radial tensile and compressive stresses imposed on the tungsten carbide and diamond, respectively. In order to achieve displacement compatibility, the total force, of course, remains zero. Bending is also allowed to occur to balance the bending moment induced by the asymmetric stresses. If the extent of bending is large, then the diamond layer will crack.
FEM was performed to determine the magnitude of the critical thermal residual stresses that would occur during conventional vacuum furnace brazing. When critical, the stress was found to be sufficient to cause the diamond to crack. With the assumption that the TSP diamond and tungsten carbide are uniformly heated, conclusions of the study were as follows:
Critical stresses in the TSP diamond increase with increasing braze temperature. Braze temperatures in excess of 700 oC can cause the TSP diamond to crack.
Critical residual thermal stress occur in the TSP diamond with braze filler metal thickness of less than 50 micron.
Note 1: The thicker the braze layer, the greater is the stress relaxation, with a maximum occurring when the braze layer deformed plastically.
Note 2: It should be noted that the advantage of the microwave brazing method is to attain maximum attachment shear strength using a braze filler metal thickness of 50 micron and less.
TSP diamond discs are brazed to tungsten carbide cylinders using an alloy filler metal at high temperatures. Residual thermal stresses are developed during cool-down from the braze temperature. The origin of the stresses is the mismatch between the coefficient of thermal expansion, Young’s modulus, and Poisson’s ratio of the two components involved. Depending on the magnitude and sign of these stresses, delamination (debonding) of the joint may occur, or failure may occur either in the diamond or in the tungsten carbide. The purpose of this task is three-fold. Firstly, to calculate the thermal residual stresses developed in the joints as a function of the braze temperature, braze metal thickness, and TSP diamond diameter. Secondly, to calculate the ΔT required to minimize the stresses in the joint.
FEM was conducted by independently varying the temperature from which the joint was cooled down (850 to 1150 oC), and the thickness of the braze layer (3 to 100 microns thick) for 13.7 mm diameter diamond and tungsten carbide samples. The shear, axial, and radial stresses were computed. It was observed that lower brazing temperatures minimize the thermal stresses. It was also noted that the thicker the braze layer the greater is the stress relaxation, and maximum relaxation occurred when the braze layer deformed plastically. The above calculations were repeated for different diameters of the diamond and tungsten carbide samples.
FEM was performed to better understand the problem of cracking and failure of the diamond during usage. Failure during brazing is due to the residual stresses generated during cooling from the brazing temperature to room temperature. There are considerable differences in the physical and mechanical properties (coefficient of thermal expansion (CTE), Young’s modulus, and Poisson’s ratio) of diamond and tungsten carbide as shown in Table 11. The origin of the stresses in these composites is schematically presented in Figure 12.
40

We have undertaken a finite element modeling (FEM) study to evaluate the residual stresses developed in the diamond/tungsten carbide joints for the purpose of calculating:
• The thermal residual stresses in the joint as a function of the brazing process parameters such as brazing temperature and thickness of the braze metal,
• The minimum temperature difference (ΔT) required having no stresses in the TSP diamond.
In practice, the TSP diamond (13.7 mm in diameter and 3 mm in height) is brazed to tungsten carbide (13.7 mm in diameter and 8 mm in height) using a Ti-Cu-Ag filler metal. Figure 14 shows the braze joint schematically. The following variables in the braze temperature and braze filler metal thickness were used to compute the stresses generated in the assembly.
• Brazing temperature: 850, 950, 1000, 1050, and 1150 oC
• Braze filler metal thickness: 3, 10, 50, 75, and 100 micron
The stresses were calculated assuming that the thickness of the braze metal was constant and the braze temperature was changed, or the braze temperature was maintained constant and the braze metal thickness was changed. For calculating the ΔT required to have no stresses in the TSP diamond, we used ΔT values of 0, 100, 200, 300, and 400 oC for a constant thickness of the braze metal, 50micron.
In the determination of thermal residual stresses using the finite element approach an axisymmetric type of model was employed. Axisymmetry was assumed based on the cylindrical geometry of the joint and the thermal loading symmetry, and the model allows use of two-dimensional four-node elements. Roller boundary conditions were applied on the left-hand side and bottom nodes as shown in Figure 15. The physical and mechanical properties of the diamond and the tungsten carbide were considered isotropic and temperature independent. Elastic behavior was assumed for TiC and diamond while 20% elongation and strain hardening were assumed for the braze metal. Thermal residual stresses were calculated between a stress free temperature and a reference temperature (room temperature).
The ABAQUS computer code version 5.7 was used to calculate the thermal residual stresses, considering both the elastic and plastic behavior of the components involved. The axial (s22), radial (s11), and shear (s12) stresses were determined.
3.3.1 Effect of Braze Filler Material Thickness
Figure 16 shows the magnitudes of the axial stresses as a function of braze filler metal thickness developed in the diamond/tungsten carbide assembly assuming that the whole assembly was maintained at a temperature of 1000 oC. In all the figures the 8 mm-high tungsten carbide sample is assumed to be on the left side and the 3 mm-high TSP diamond on the right hand side. Since the thickness of the braze metal is very small in comparison with the dimensions of the TSP diamond and tungsten carbide, it is not clearly indicated. The interface is at the position of 8 mm. The braze filler metal thickness was changed from 3 micron to 100 micron. It may be noted from the figure that the stresses are compressive in nature in the
41

tungsten carbide and tensile in the diamond part. Another important point to be noted is that the magnitude of stresses is not significantly different when the filler metal thickness is very small. For example, the stresses were almost the same for the filler metal thickness of 3 and 10 micron. But, the magnitude of the stresses decreased with increasing filler metal thickness, even though they continued to be compressive in nature in the tungsten carbide and tensile in the diamond part. The magnitude of the stresses suddenly decreased near the joint interface and the sign of the stresses changed to tensile in nature in the diamond part. The fact that the filler metal thickness is usually in the range of 50-75 μm suggests that the stresses generated in the joint are not going to be significant. However, a point of interest is that there appears to be some amount of plastic deformation of the filler metal, as indicated by the sudden changes in the slopes of the stress distribution curves near the interface. This is particularly true at large filler metal thickness.
The braze filler metal undergoes plastic deformation is clearly brought about in Figure 16 which shows the variation of shear stress in the joint as a function of the filler metal thickness. Here again it is assumed that the whole joint was maintained at 1000 oC. It may be noted from this figure that the amount of plastic deformation increases with the filler metal thickness. This is clear when one compares the variation of the stress distribution in Figure 17, especially near the interface. Plastic deformation is clearly observed by the sudden change in the direction of shear stress in the 100-μm thick filler metal. This is conspicuous by its absence in the 3-μm thick filler metal.
Figure 18 shows the distribution of radial stresses in the joint as a function of the braze metal thickness. The radial stresses are tensile in the tungsten carbide and compressive in the TSP diamond.
3.3.2 Effect of Braze Temperature
Figure 19a shows the axial stresses as a function of the braze temperature for a filler metal thickness of 50 micron. One again notices that there are compressive stresses in the tungsten carbide and tensile stresses in the diamond part. Even though the observed trend suggests that the magnitude of stresses is higher the higher the braze temperature, it should be noted that the actual values are not significantly different. Thus, the temperature at which brazing is carried out does not change the axial stress conditions significantly.
The variation of radial stresses as a function of the braze temperature is shown in Figure 19b. Note again that the stresses are tensile in nature in the tungsten carbide and compressive in nature in the TSP diamond part. The situation is very similar to what was observed as a function of braze metal thickness. Thus, the radial stresses are always tensile in nature in the tungsten carbide and compressive in nature in the TSP diamond.
3.3.3 Effect of TSP Diamond Diameter
Figures 20(a), (b), and (c) show the axial, shear, and radial stresses in the tungsten carbide-TSP diamond joint. The nature of the stresses is identical to what was calculated for the 13.7 mm diameter specimens. Thus, changing the diameter of the tungsten carbide and the TSP diamond does not change either the magnitude or nature of the stresses in the system.
42
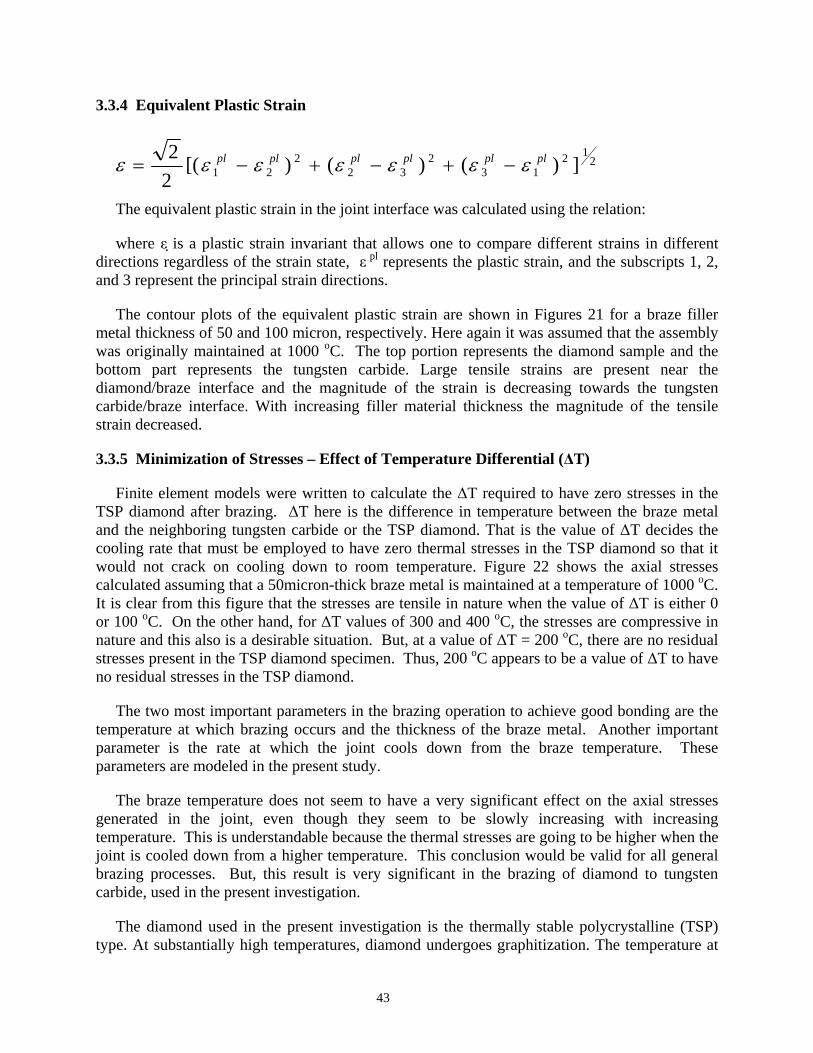
3.3.4 Equivalent Plastic Strain
212
132
322
21 ])()()[(22 plplplplplpl εεεεεεε −+−+−=
The equivalent plastic strain in the joint interface was calculated using the relation:
where ε is a plastic strain invariant that allows one to compare different strains in different directions regardless of the strain state, ε pl represents the plastic strain, and the subscripts 1, 2, and 3 represent the principal strain directions.
The contour plots of the equivalent plastic strain are shown in Figures 21 for a braze filler metal thickness of 50 and 100 micron, respectively. Here again it was assumed that the assembly was originally maintained at 1000 oC. The top portion represents the diamond sample and the bottom part represents the tungsten carbide. Large tensile strains are present near the diamond/braze interface and the magnitude of the strain is decreasing towards the tungsten carbide/braze interface. With increasing filler material thickness the magnitude of the tensile strain decreased.
3.3.5 Minimization of Stresses – Effect of Temperature Differential (ΔT)
Finite element models were written to calculate the ΔT required to have zero stresses in the TSP diamond after brazing. ΔT here is the difference in temperature between the braze metal and the neighboring tungsten carbide or the TSP diamond. That is the value of ΔT decides the cooling rate that must be employed to have zero thermal stresses in the TSP diamond so that it would not crack on cooling down to room temperature. Figure 22 shows the axial stresses calculated assuming that a 50micron-thick braze metal is maintained at a temperature of 1000 oC. It is clear from this figure that the stresses are tensile in nature when the value of ΔT is either 0 or 100 oC. On the other hand, for ΔT values of 300 and 400 oC, the stresses are compressive in nature and this also is a desirable situation. But, at a value of ΔT = 200 oC, there are no residual stresses present in the TSP diamond specimen. Thus, 200 oC appears to be a value of ΔT to have no residual stresses in the TSP diamond.
The two most important parameters in the brazing operation to achieve good bonding are the temperature at which brazing occurs and the thickness of the braze metal. Another important parameter is the rate at which the joint cools down from the braze temperature. These parameters are modeled in the present study.
The braze temperature does not seem to have a very significant effect on the axial stresses generated in the joint, even though they seem to be slowly increasing with increasing temperature. This is understandable because the thermal stresses are going to be higher when the joint is cooled down from a higher temperature. This conclusion would be valid for all general brazing processes. But, this result is very significant in the brazing of diamond to tungsten carbide, used in the present investigation.
The diamond used in the present investigation is the thermally stable polycrystalline (TSP) type. At substantially high temperatures, diamond undergoes graphitization. The temperature at
43
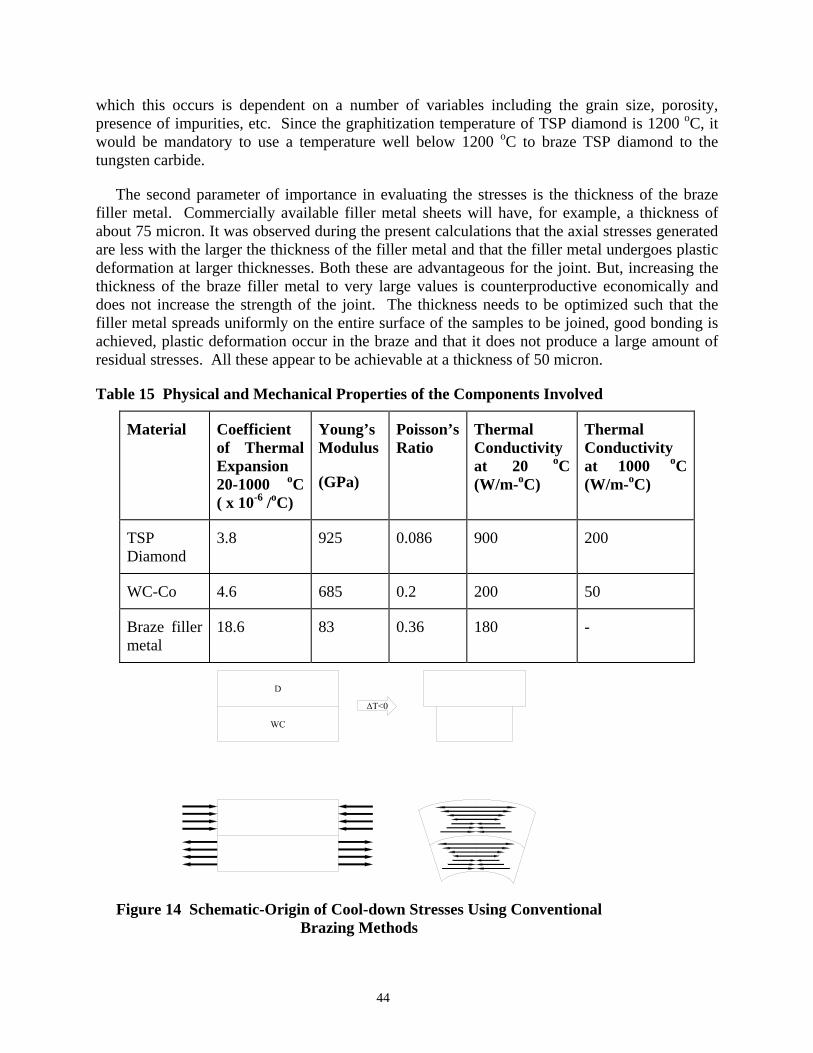
which this occurs is dependent on a number of variables including the grain size, porosity, presence of impurities, etc. Since the graphitization temperature of TSP diamond is 1200 oC, it would be mandatory to use a temperature well below 1200 oC to braze TSP diamond to the tungsten carbide.
The second parameter of importance in evaluating the stresses is the thickness of the braze filler metal. Commercially available filler metal sheets will have, for example, a thickness of about 75 micron. It was observed during the present calculations that the axial stresses generated are less with the larger the thickness of the filler metal and that the filler metal undergoes plastic deformation at larger thicknesses. Both these are advantageous for the joint. But, increasing the thickness of the braze filler metal to very large values is counterproductive economically and does not increase the strength of the joint. The thickness needs to be optimized such that the filler metal spreads uniformly on the entire surface of the samples to be joined, good bonding is achieved, plastic deformation occur in the braze and that it does not produce a large amount of residual stresses. All these appear to be achievable at a thickness of 50 micron.
Table 15 Physical and Mechanical Properties of the Components Involved
Material Coefficient of Thermal Expansion 20-1000 oC ( x 10-6 /oC)
Young’s Modulus
(GPa)
Poisson’s Ratio
Thermal Conductivity at 20 oC (W/m-oC)
Thermal Conductivity at 1000 oC (W/m-oC)
TSP Diamond
3.8 925 0.086 900 200
WC-Co 4.6 685 0.2 200 50
Braze filler metal
18.6 83 0.36 180 -
Figure 14 Schematic-Origin of Cool-down Stresses Using Conventional Brazing Methods
44

Note: The tungsten carbide cools down faster and shrinks more due to the higher CTE than diamond. This develops tensile (in-plane) stresses in the tungsten carbide and compressive stresses in the diamond part.
TSP
WC
Figure 15 Boundary Conditions Applied in the
WC –Braze Filler Metal - TSP Diamond Joint
0 2 4 6 8 10 12
-300
-200
-100
0
100
200
Diamond WC
100 μm 75 μm 50 μm 10 μm 3 μm
Axi
al S
tress
(MPa
)
Position (mm)
Figure 16 Axial Stresses as a Function of the Braze Filler Metal Thickness
45

The whole assembly was assumed to be present at 1000 oC and cooled down to room temperature. The stresses are compressive in nature in the tungsten carbide and tensile in the diamond part. Plastic deformation occurs in the filler material, especially at larger thicknesses.
0 2 4 6 8 10 12-50
0
50
100
150
200
Diamond WC
100 μm 3 μm
Shea
r Stre
ss (M
Pa)
Position (mm)
Figure 17 Shear Stresses at Filler Metal Thicknesses of 3.0 and 100 u.m
There is a substantial difference in the behavior of the stresses. Calculations predict that significant plastic deformation would occur at a braze filler metal thickness of 100 micron, but hardly any plastic deformation occurs at a thickness of 3.0 micron.
0 2 4 6 8 10 12
-400
-200
0
200
400 Thickness=3μm Thickness=7μm Thickness=10μm Thickness=15μm
Radi
al S
tress
, (M
Pa)
Position, (mm)
Figure 18 Radial Stresses as a Function of the Braze Filler Metal Thickness
46
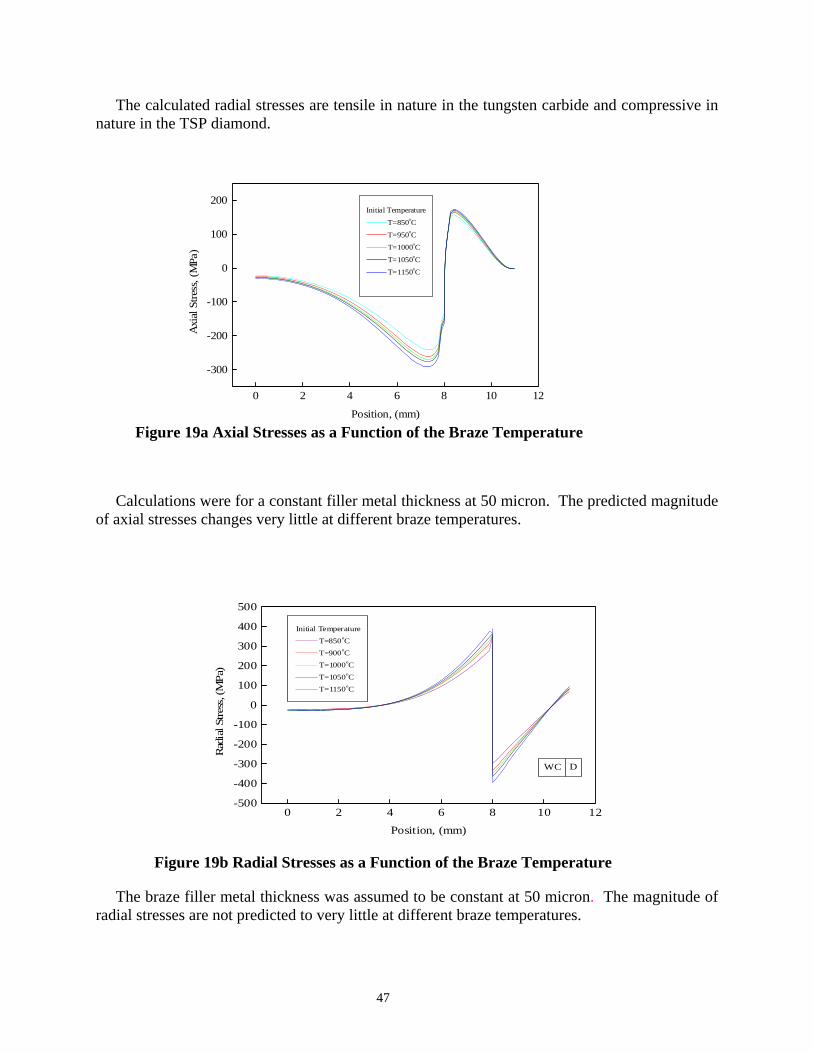
The calculated radial stresses are tensile in nature in the tungsten carbide and compressive in nature in the TSP diamond.
0 2 4 6 8 10 12
-300
-200
-100
0
100
200Initial Temperature
T=850oC
T=950oC
T=1000oC
T=1050oC
T=1150oC
Axi
al S
tress
, (M
Pa)
Position, (mm)
Figure 19a Axial Stresses as a Function of the Braze Temperature
Calculations were for a constant filler metal thickness at 50 micron. The predicted magnitude of axial stresses changes very little at different braze temperatures.
0 2 4 6 8 10 12
-500
-400
-300
-200
-100
0
100
200
300
400
500
DWC
Initial Temperature
T=850oC
T=900oC
T=1000oC
T=1050oC
T=1150oC
Rad
ial S
tress
, (M
Pa)
Position, (mm)
Figure 19b Radial Stresses as a Function of the Braze Temperature
The braze filler metal thickness was assumed to be constant at 50 micron. The magnitude of radial stresses are not predicted to very little at different braze temperatures.
47

Figure 20 (a) Axial, (b) Shear, (c) Radial Stresses as a Function of TSP Diamond Diameter
48
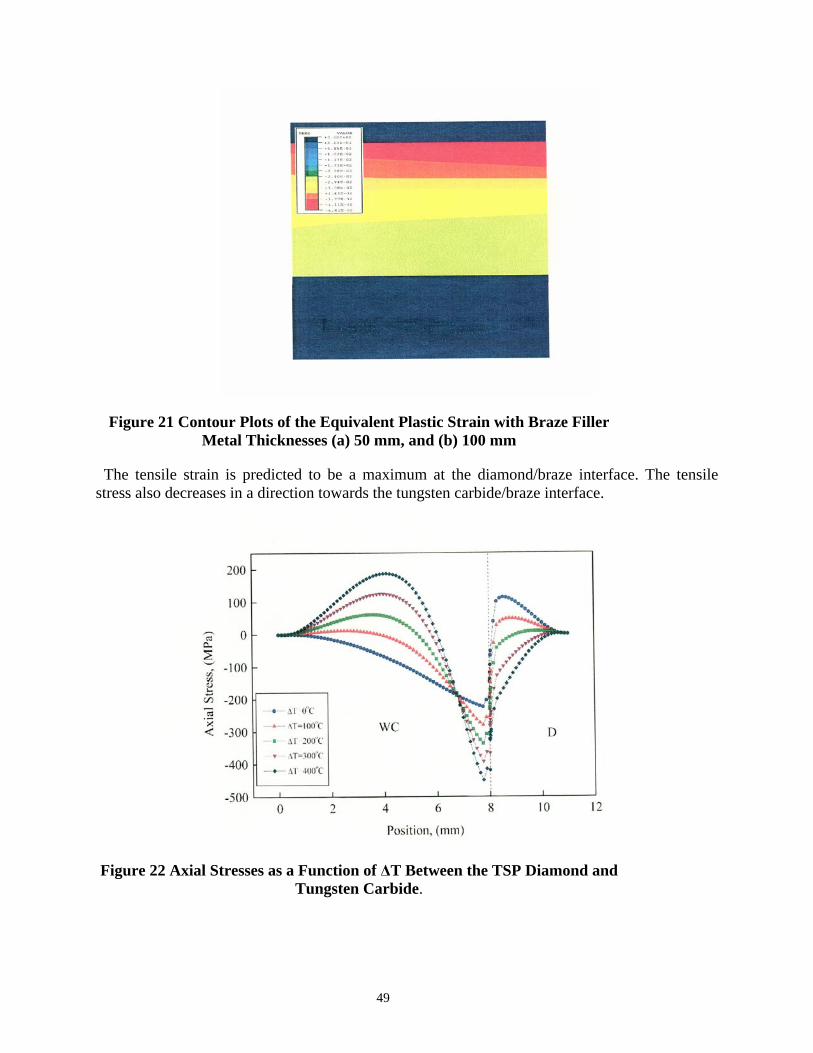
Figure 21 Contour Plots of the Equivalent Plastic Strain with Braze Filler Metal Thicknesses (a) 50 mm, and (b) 100 mm
The tensile strain is predicted to be a maximum at the diamond/braze interface. The tensile stress also decreases in a direction towards the tungsten carbide/braze interface.
Figure 22 Axial Stresses as a Function of ΔT Between the TSP Diamond and Tungsten Carbide.
49

The above graph shows axial stresses when the ΔT is assumed to be 0, 100° C, 200° C, 300° C, and 400°C. The braze filler metal is a constant at 50 mm thickness, and the braze temperature constant at 1000 OC. It is considered significant that at ΔT = 200° C, the axial stress in the TSP diamond is predicted to be zero
3.4 Cutter Design
3.4.1 Conventional Cylindrical Design
TSP diamond cutter configurations and dimensions equivalent to current PDC diamond cutter designs are listed in Table 16.
Table 16 - Conventional Cutter Designs
Cutter Type
TSP Diamond mm
TSP Cutter mm
Diameter
Thickness
Diameter
Length
Cylinder
5.3
2.1
5.3
13.0
Cylinder
8.0
2.5
8.0
5.0
Cylinder
8.0
3.5
8.0
13.0
Cylinder
13.7
3.5
13.7
13.0
Cylinder
19.0
3.5
19.0
35.0
3.4.2 Shock Resistant Cutter Design It has been understood by the industry that brazing a TSP diamond to a rigid substrate, having a relatively high modulus of elasticity, such as cobalt bonded tungsten carbide or molybdenum, improves the shock resistance of the TSP cutting elements, as compared to the shock resistance of TSP diamond currently set in the diamond drill bit matrix. TSP diamond cutter failure has continued with fractures in the diamond layer caused by mechanical affects. Two of the mechanical affects which lead to such fracture may include vibration and impact, which may be termed “chatter.” Drilling hard rock requires higher cutting forces A chamfer protects the edge, but it also reduces the edge’s shear capability. The higher forces may produce chatter, which may destroy the cutter. A dull tool also causes chatter. Rather than a chamfer, using a smaller nose radius can reduce chatter. In motor drilling, the closer the drill bit is relative to the bottom bearing can reduce chatter. The greater the distance between the bearings and the point where
50
the cutter contacts the rock, the larger the potential for the assembly to flex; and the greater the possibility of chatter. A vibration dampener above the drill bit can reduce chatter and increase the life of the cutter. The purpose of the vibration dampener is increase the dynamic compliance at the frequency of the chatter. Chatter can be defined as vibration with amplitude that exceeds the depth of the cut. It may cause cutter damage via microfracture and reduce the rate of penetration of drilling. The vibrating chatter can cause a wavy surface on the bottom hole profile. When the wave of the leading cutter matches a trailing cutter, the cutting thickness is constant and results in a smoother cutting action. If the waves are out of sync, the chip thickness varies, and the regenerative vibration causes chatter. Chatter may be controlled by maintaining a constant chip thickness and by absorbing or redirecting the energy that generates chatter. In the brazing process, a braze filler metal approximately 0.003” thick is positioned between the diamond layer and the substrate. The interlayer is melted and, upon subsequent solidification, is bonded to the diamond component and the substrate forming a braze joint. The differential in the coefficients of thermal expansion between tungsten carbide substrate and the diamond layer often results in thermal residual stress. To minimize problems caused by thermal residual stress, a metal interlayer is included between two braze filler metal foils to control these stresses. The thickness of the metal interlayer is typically about 50% of the entire joint thickness: for example, a 0.006 inches metal layer sandwiched between two 0.003 braze foils. Another approach has been to provide metallic bonding layers between tungsten and copper layers, which serve as a coating for bonding thermally stable diamond to a matrix. The differential in the coefficients of thermal expansion between the substrate and the diamond layer often results in thermal residual stress. To minimize problems caused by thermal residual stress, a metal interlayer is included between two braze foils to control these stresses. The thickness of the metal interlayer is typically about 50% of the entire joint thickness: for example, a 0.006 inches metal layer sandwiched between two 0.003 braze foils. Another investigation used metallic bonding layers between tungsten and copper layers, which serve as a coating for bonding polycrystalline diamond to a matrix. The metallic bonding interlayers are taught to preferably be between 1.0 and 3.0 microns thick. There have been postulations that this metal interlayer was sufficient to absorb impact energy. Nevertheless, there still exists a need for methods for attachment of TSP to a substrate with stronger joint and improved shear strength with reduced cracking in the cutting elements.
The field experience for over a decade is that when the TSP diamond fractures, it fails in a so-called “halo” semi-circular crack about the cutting tip. It was the desire of this project to prevent “halo” cracking by three means: (1) increasing the mechanical strength of the currently available TSP diamond materials, (2) to increase the fracture resistance of TSP diamond, and (3) create cutter designs which absorb impact energy. The initial design concept was to investigate the affect of a TSP diamond layer with a suitable metal physical properties and thickness such that the interlayer between the substrate and the diamond layer acted as an effective shock absorber. And, of course, maintain attachment shear strength greater than345 MPa) (50,000 psi)
A method of forming a cutting element having a TSP diamond layer, a substrate and a metal interlayer between the diamond layer and the substrate that includes the steps of selecting a thickness of the TSP diamond layer, selecting a metal for the metal interlayer having a modulus of elasticity, determining a thickness for the metal interlayer according to:
51
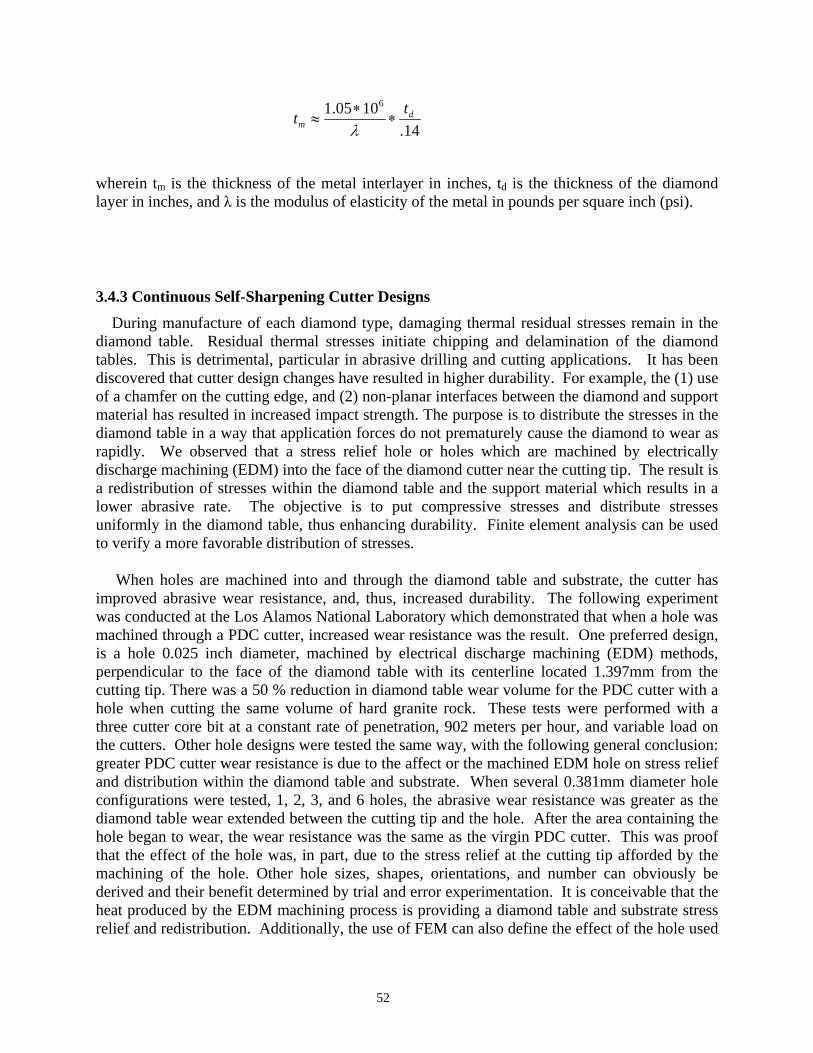
14.
1005.1 6d
mtt ∗
∗≈
λ
wherein tm is the thickness of the metal interlayer in inches, td is the thickness of the diamond layer in inches, and λ is the modulus of elasticity of the metal in pounds per square inch (psi).
3.4.3 Continuous Self-Sharpening Cutter Designs During manufacture of each diamond type, damaging thermal residual stresses remain in the diamond table. Residual thermal stresses initiate chipping and delamination of the diamond tables. This is detrimental, particular in abrasive drilling and cutting applications. It has been discovered that cutter design changes have resulted in higher durability. For example, the (1) use of a chamfer on the cutting edge, and (2) non-planar interfaces between the diamond and support material has resulted in increased impact strength. The purpose is to distribute the stresses in the diamond table in a way that application forces do not prematurely cause the diamond to wear as rapidly. We observed that a stress relief hole or holes which are machined by electrically discharge machining (EDM) into the face of the diamond cutter near the cutting tip. The result is a redistribution of stresses within the diamond table and the support material which results in a lower abrasive rate. The objective is to put compressive stresses and distribute stresses uniformly in the diamond table, thus enhancing durability. Finite element analysis can be used to verify a more favorable distribution of stresses. When holes are machined into and through the diamond table and substrate, the cutter has improved abrasive wear resistance, and, thus, increased durability. The following experiment was conducted at the Los Alamos National Laboratory which demonstrated that when a hole was machined through a PDC cutter, increased wear resistance was the result. One preferred design, is a hole 0.025 inch diameter, machined by electrical discharge machining (EDM) methods, perpendicular to the face of the diamond table with its centerline located 1.397mm from the cutting tip. There was a 50 % reduction in diamond table wear volume for the PDC cutter with a hole when cutting the same volume of hard granite rock. These tests were performed with a three cutter core bit at a constant rate of penetration, 902 meters per hour, and variable load on the cutters. Other hole designs were tested the same way, with the following general conclusion: greater PDC cutter wear resistance is due to the affect or the machined EDM hole on stress relief and distribution within the diamond table and substrate. When several 0.381mm diameter hole configurations were tested, 1, 2, 3, and 6 holes, the abrasive wear resistance was greater as the diamond table wear extended between the cutting tip and the hole. After the area containing the hole began to wear, the wear resistance was the same as the virgin PDC cutter. This was proof that the effect of the hole was, in part, due to the stress relief at the cutting tip afforded by the machining of the hole. Other hole sizes, shapes, orientations, and number can obviously be derived and their benefit determined by trial and error experimentation. It is conceivable that the heat produced by the EDM machining process is providing a diamond table and substrate stress relief and redistribution. Additionally, the use of FEM can also define the effect of the hole used
52
and other hole configurations on internal stress and distribution within the diamond table and substrate materials.
The principal of the CSS design is as the cutter wears, the wear proceed from the initial cutting tip, through full radius diamond, and then enters a void in the cutter. Thus the area of engagement increases until the void is reach. Thereafter, the area of engagement is limited by the geometry of the void. The affect is to be able to control the area of diamond that engages the rock throughout the life of the cutter.
3.4.4 Compression Joint Designs
A prime issue for the compression joint (CJ) design is fabricability. During a meeting at GE Superabrasives, Worthington, Ohio, we discussed methods available to fabricate the desires shapes. TSP diamond can be pressed to shape, within the design limitations of the powder metallurgy process. Therefore, there are almost unlimited possibilities for the compression joint design once a commercial shape has been established, and a sufficient quantity is ordered to justify the set-up cost. For research purposes, it is proposed that we limit our candidates to that which minimize the TSP machining requirement. Therefore, a TSP diamond cutter 13-mm diameter x 3.5 mm thick with a tapered OD is one top candidate. A female tapered TSP diamond OD would have a matching male ID within the top surface of the tungsten carbide substrate. FEA stress analysis will be performed on all candidate CJ cutter designs.
3.5 Cutter Microwave Brazing
Prior to recent investigations, state-of-the-art TSP diamond cutter attachment procedure was to braze 13 mm diameter x 2 to 3 mm thick TSP diamond to 6% cobalt-bonded, fine-grain, tungsten carbide substrates with a commercial titanium-copper-silver (4.5Ti-26.7Cu-68.8Ag) braze filler metal. The braze filler metal, when heated to 800°C, flows and wets the TSP diamond to form a uniform microstructure with dispersed TiC regions near the TSP diamond interface. Average attachment shear strength levels of 137 MPa to 241 MPa have been reported using direct resistance, induction, and vacuum furnace heating methods. These shear strength levels are not adequate for medium-to-hard rock drilling.
TII and JPL have developed suitable braze filler metals and a proprietary microwave heating technique for brazing TSP diamond to tungsten carbide support materials. Cracking which has occurred when using other heating methods, such as resistance, induction, and furnace brazing, has been caused by a bi-metal effect between these two dissimilar materials. The coefficient of expansion of TSP diamond is less than tungsten carbide. Thereby, the TSP diamond contracts less than tungsten carbide while cooling from the brazing temperature. The cause of the cracking is thought to be an excessive bending load created within the TSP diamond layer during cool-down.
3.5.1 Materials
3.5.1.1 TSP Diamond
Thermally Stable Polycrystalline (TSP) diamond materials are available from several sources, including de Beers, South Africa; and GE Superabrasives (now Diamond Innovations, Inc.),
53
Worthington, OH. TSP diamonds available from deBeers contain silicon and silicon carbide, and the surface is not wet by molten braze filler metals as well as the all diamond GE material. Therefore, only the GE material was tested. The TSP diamonds available from GE Superabrasives come in different sizes, and have a porosity of 2 to 5 volume %. Because of the limited capacity of the impact machine, only specimens’ 1.5 mm in thickness have been used.
3.5.1.2 Tungsten Carbide
The tungsten carbide substrates used in this investigation is cylindrical in shape, with a diameter of 13.7 mm and the height that varied between 4.75 mm to 10 mm. These have been purchased from Kennametal.
3.5.1.3 Braze Filler Metals
Several possibilities exist for the braze filer metals. These include the traditional TiCuSil (Ag-Cu eutectic alloy to which 4.5 wt% Ti is added to improve the wetability of the diamond), supplied by WESGO Metals, San Carlos, CA. SHS (combustion synthesis) braze compositions has been limited to NiTi because of its unusually high ductility and braze strength.
3.5.2 Microwave Brazing Process
3.5.2.1 Microwave Research Facility
The present experimental set-up, shown in Figure 23 below, consists of a single-mode microwave cylindrical cavity 127 mm in diameter and 101.6 mm in length. The sample is inserted from the cylindrical side of the cavity (as oppose to the ends) into a depth that corresponds to either the maximum field (electric or magnetic) intensity position within the cavity. The power is fed into the cavity from one end of the cavity through a small antenna. The power is supplied by a Traveling Wave Tube (TWT) that amplifies the input signal coming from a 0.200MHz-4 GHz frequency source (HP E4000). This signal is found by tuning the cavity to its resonance frequency with the sample in it. The input signal frequency is varied; the ratio of the reflected power to the input power is monitored until it reaches its minimum value. With input frequency sweeping, one could determine this minimum with the help of a pick-up antenna and an oscilloscope. The sample volume is evacuated to the appropriate level and the sample is processed.
54
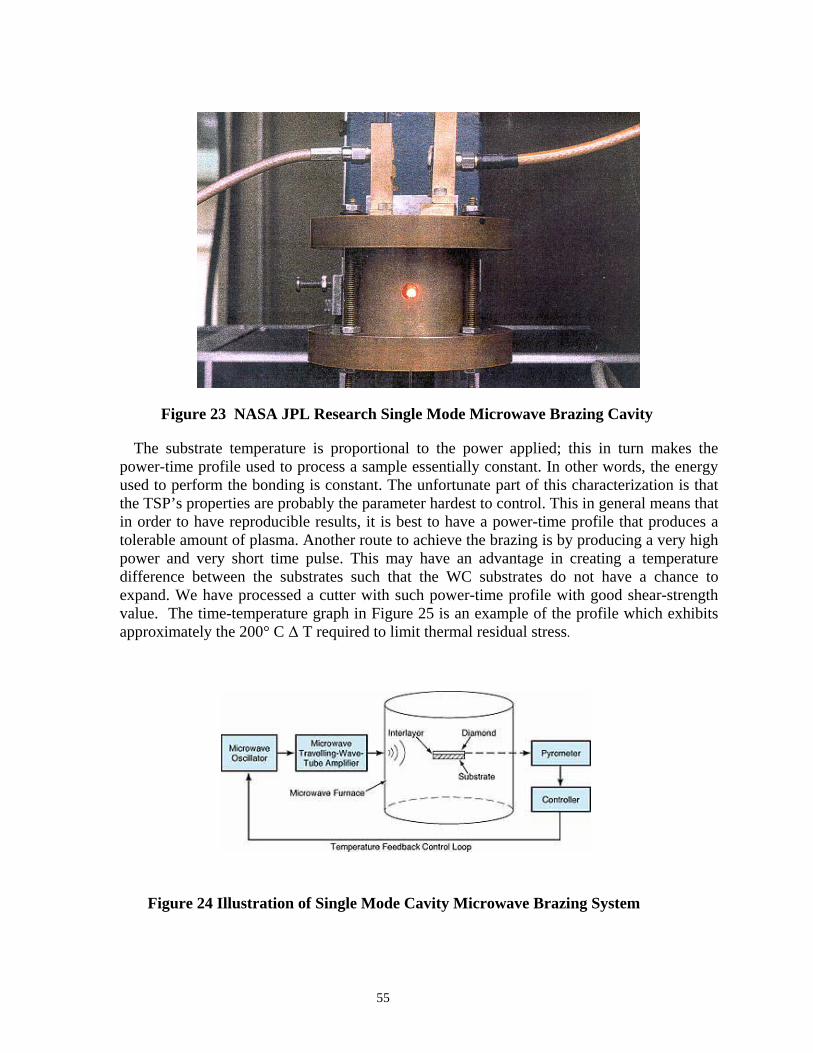
Figure 23 NASA JPL Research Single Mode Microwave Brazing Cavity
The substrate temperature is proportional to the power applied; this in turn makes the power-time profile used to process a sample essentially constant. In other words, the energy used to perform the bonding is constant. The unfortunate part of this characterization is that the TSP’s properties are probably the parameter hardest to control. This in general means that in order to have reproducible results, it is best to have a power-time profile that produces a tolerable amount of plasma. Another route to achieve the brazing is by producing a very high power and very short time pulse. This may have an advantage in creating a temperature difference between the substrates such that the WC substrates do not have a chance to expand. We have processed a cutter with such power-time profile with good shear-strength value. The time-temperature graph in Figure 25 is an example of the profile which exhibits approximately the 200° C Δ T required to limit thermal residual stress.
Figure 24 Illustration of Single Mode Cavity Microwave Brazing System
55
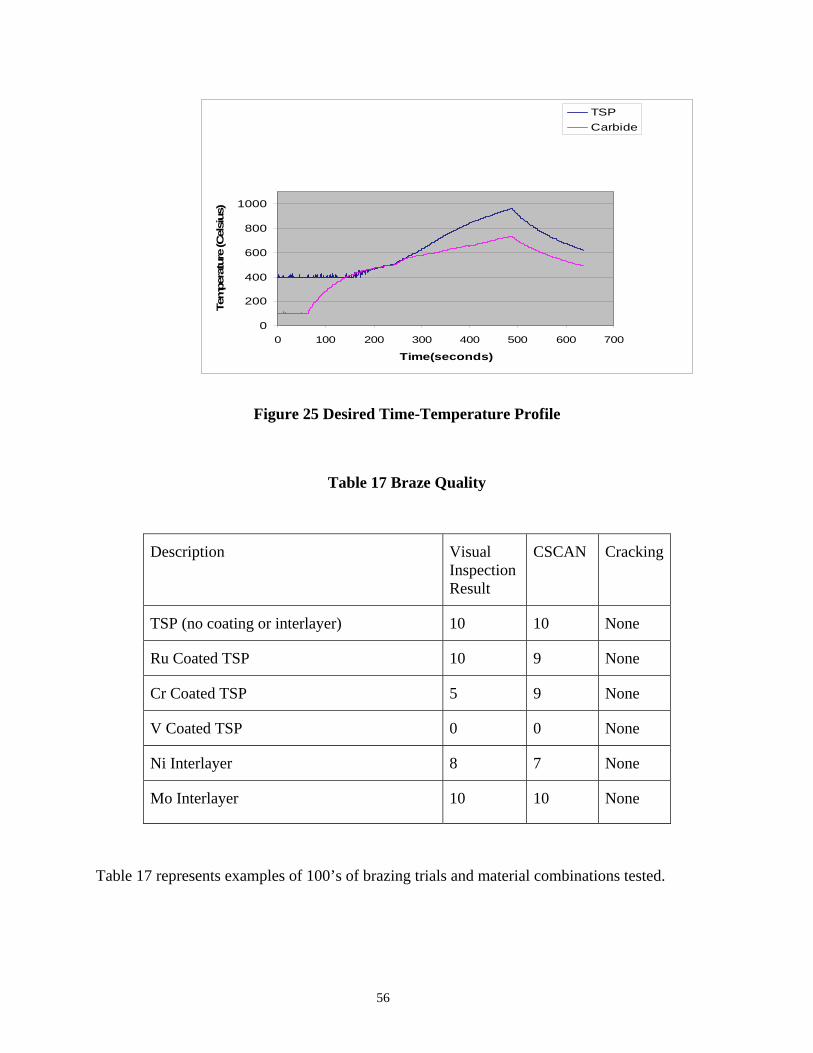
0
200
400
600
800
1000
0 100 200 300 400 500 600 700
Time(seconds)
Tem
pera
ture
(Cel
sius
)
TSPCarbide
Figure 25 Desired Time-Temperature Profile
Table 17 Braze Quality
Description Visual Inspection Result
CSCAN Cracking
TSP (no coating or interlayer) 10 10 None
Ru Coated TSP 10 9 None
Cr Coated TSP 5 9 None
V Coated TSP 0 0 None
Ni Interlayer 8 7 None
Mo Interlayer 10 10 None
Table 17 represents examples of 100’s of brazing trials and material combinations tested.
56
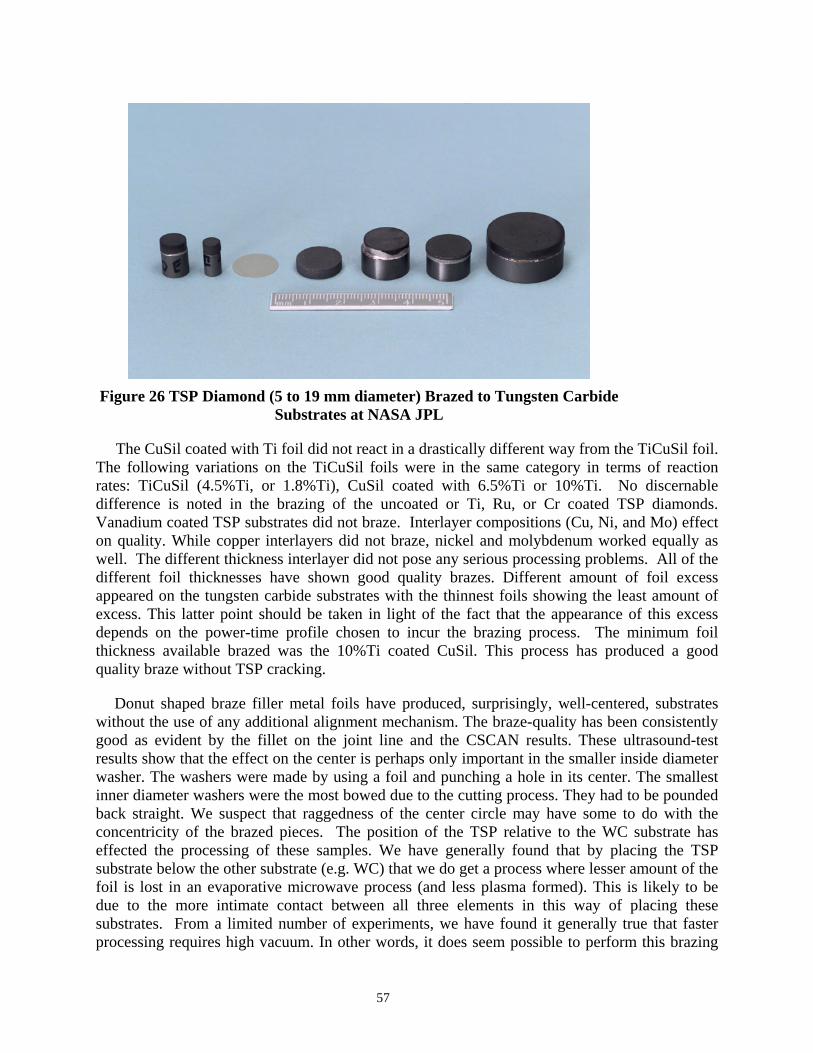
Figure 26 TSP Diamond (5 to 19 mm diameter) Brazed to Tungsten Carbide Substrates at NASA JPL
The CuSil coated with Ti foil did not react in a drastically different way from the TiCuSil foil. The following variations on the TiCuSil foils were in the same category in terms of reaction rates: TiCuSil (4.5%Ti, or 1.8%Ti), CuSil coated with 6.5%Ti or 10%Ti. No discernable difference is noted in the brazing of the uncoated or Ti, Ru, or Cr coated TSP diamonds. Vanadium coated TSP substrates did not braze. Interlayer compositions (Cu, Ni, and Mo) effect on quality. While copper interlayers did not braze, nickel and molybdenum worked equally as well. The different thickness interlayer did not pose any serious processing problems. All of the different foil thicknesses have shown good quality brazes. Different amount of foil excess appeared on the tungsten carbide substrates with the thinnest foils showing the least amount of excess. This latter point should be taken in light of the fact that the appearance of this excess depends on the power-time profile chosen to incur the brazing process. The minimum foil thickness available brazed was the 10%Ti coated CuSil. This process has produced a good quality braze without TSP cracking.
Donut shaped braze filler metal foils have produced, surprisingly, well-centered, substrates without the use of any additional alignment mechanism. The braze-quality has been consistently good as evident by the fillet on the joint line and the CSCAN results. These ultrasound-test results show that the effect on the center is perhaps only important in the smaller inside diameter washer. The washers were made by using a foil and punching a hole in its center. The smallest inner diameter washers were the most bowed due to the cutting process. They had to be pounded back straight. We suspect that raggedness of the center circle may have some to do with the concentricity of the brazed pieces. The position of the TSP relative to the WC substrate has effected the processing of these samples. We have generally found that by placing the TSP substrate below the other substrate (e.g. WC) that we do get a process where lesser amount of the foil is lost in an evaporative microwave process (and less plasma formed). This is likely to be due to the more intimate contact between all three elements in this way of placing these substrates. From a limited number of experiments, we have found it generally true that faster processing requires high vacuum. In other words, it does seem possible to perform this brazing
57
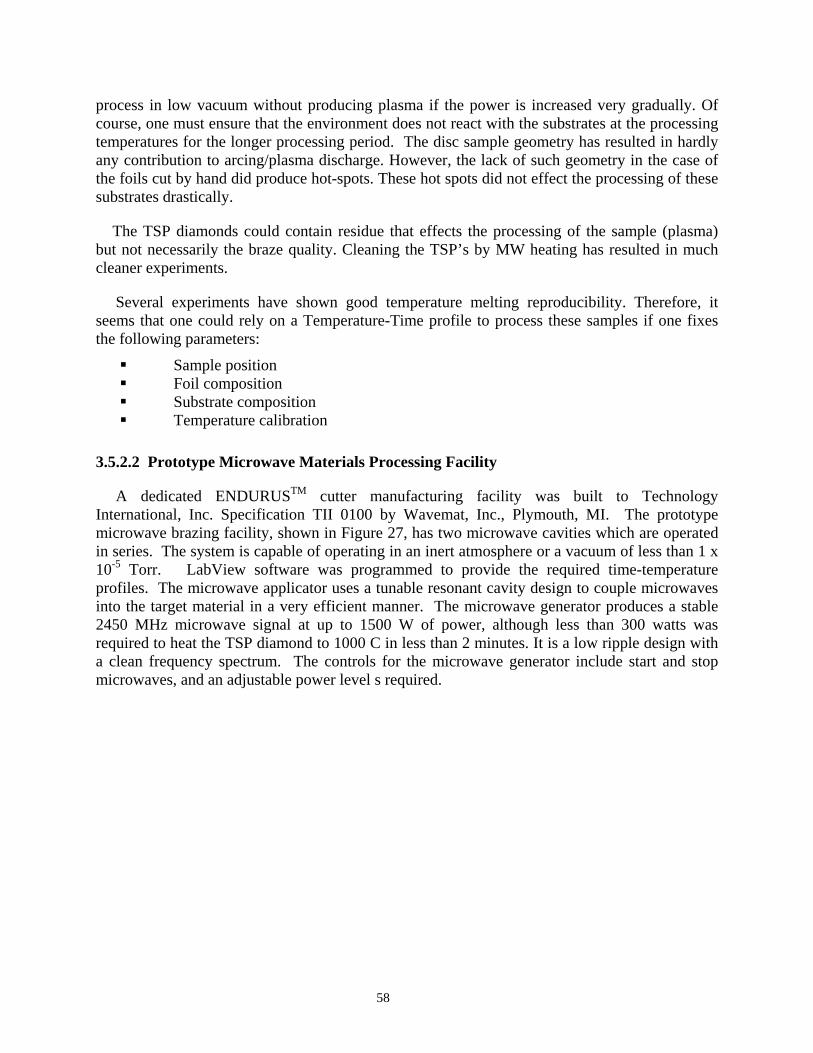
process in low vacuum without producing plasma if the power is increased very gradually. Of course, one must ensure that the environment does not react with the substrates at the processing temperatures for the longer processing period. The disc sample geometry has resulted in hardly any contribution to arcing/plasma discharge. However, the lack of such geometry in the case of the foils cut by hand did produce hot-spots. These hot spots did not effect the processing of these substrates drastically.
The TSP diamonds could contain residue that effects the processing of the sample (plasma) but not necessarily the braze quality. Cleaning the TSP’s by MW heating has resulted in much cleaner experiments.
Several experiments have shown good temperature melting reproducibility. Therefore, it seems that one could rely on a Temperature-Time profile to process these samples if one fixes the following parameters:
Sample position Foil composition Substrate composition Temperature calibration
3.5.2.2 Prototype Microwave Materials Processing Facility
A dedicated ENDURUSTM cutter manufacturing facility was built to Technology International, Inc. Specification TII 0100 by Wavemat, Inc., Plymouth, MI. The prototype microwave brazing facility, shown in Figure 27, has two microwave cavities which are operated in series. The system is capable of operating in an inert atmosphere or a vacuum of less than 1 x 10⁻⁵ Torr. LabView software was programmed to provide the required time-temperature profiles. The microwave applicator uses a tunable resonant cavity design to couple microwaves into the target material in a very efficient manner. The microwave generator produces a stable 2450 MHz microwave signal at up to 1500 W of power, although less than 300 watts was required to heat the TSP diamond to 1000 C in less than 2 minutes. It is a low ripple design with a clean frequency spectrum. The controls for the microwave generator include start and stop microwaves, and an adjustable power level s required.
58
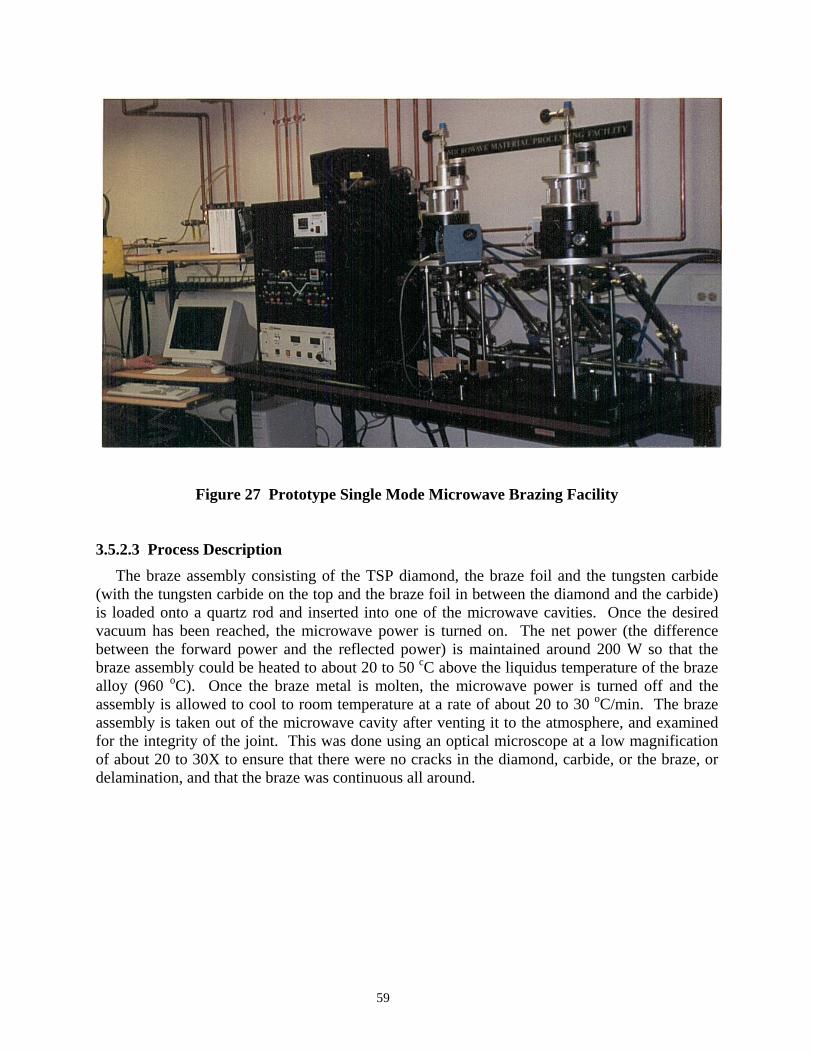
59
Figure 27 Prototype Single Mode Microwave Brazing Facility
3.5.2.3 Process Description The braze assembly consisting of the TSP diamond, the braze foil and the tungsten carbide (with the tungsten carbide on the top and the braze foil in between the diamond and the carbide) is loaded onto a quartz rod and inserted into one of the microwave cavities. Once the desired vacuum has been reached, the microwave power is turned on. The net power (the difference between the forward power and the reflected power) is maintained around 200 W so that the braze assembly could be heated to about 20 to 50 cC above the liquidus temperature of the braze alloy (960 oC). Once the braze metal is molten, the microwave power is turned off and the assembly is allowed to cool to room temperature at a rate of about 20 to 30 oC/min. The braze assembly is taken out of the microwave cavity after venting it to the atmosphere, and examined for the integrity of the joint. This was done using an optical microscope at a low magnification of about 20 to 30X to ensure that there were no cracks in the diamond, carbide, or the braze, or delamination, and that the braze was continuous all around.
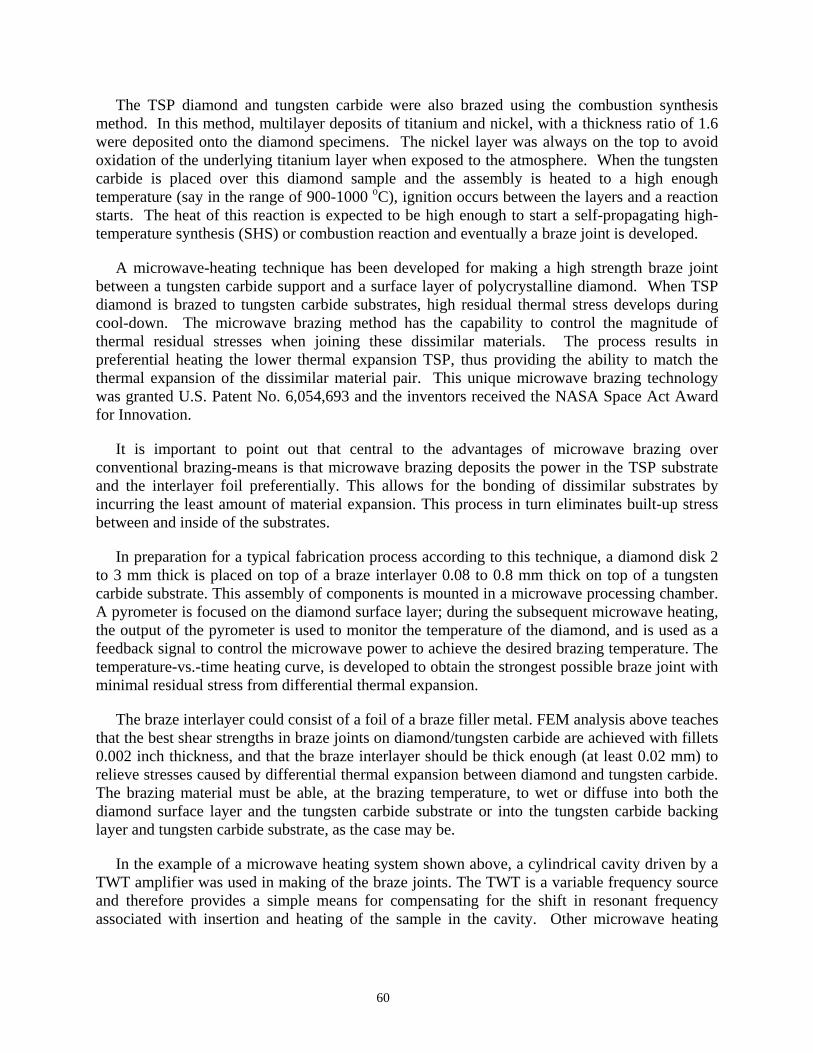
The TSP diamond and tungsten carbide were also brazed using the combustion synthesis method. In this method, multilayer deposits of titanium and nickel, with a thickness ratio of 1.6 were deposited onto the diamond specimens. The nickel layer was always on the top to avoid oxidation of the underlying titanium layer when exposed to the atmosphere. When the tungsten carbide is placed over this diamond sample and the assembly is heated to a high enough temperature (say in the range of 900-1000 oC), ignition occurs between the layers and a reaction starts. The heat of this reaction is expected to be high enough to start a self-propagating high-temperature synthesis (SHS) or combustion reaction and eventually a braze joint is developed.
A microwave-heating technique has been developed for making a high strength braze joint between a tungsten carbide support and a surface layer of polycrystalline diamond. When TSP diamond is brazed to tungsten carbide substrates, high residual thermal stress develops during cool-down. The microwave brazing method has the capability to control the magnitude of thermal residual stresses when joining these dissimilar materials. The process results in preferential heating the lower thermal expansion TSP, thus providing the ability to match the thermal expansion of the dissimilar material pair. This unique microwave brazing technology was granted U.S. Patent No. 6,054,693 and the inventors received the NASA Space Act Award for Innovation.
It is important to point out that central to the advantages of microwave brazing over conventional brazing-means is that microwave brazing deposits the power in the TSP substrate and the interlayer foil preferentially. This allows for the bonding of dissimilar substrates by incurring the least amount of material expansion. This process in turn eliminates built-up stress between and inside of the substrates.
In preparation for a typical fabrication process according to this technique, a diamond disk 2 to 3 mm thick is placed on top of a braze interlayer 0.08 to 0.8 mm thick on top of a tungsten carbide substrate. This assembly of components is mounted in a microwave processing chamber. A pyrometer is focused on the diamond surface layer; during the subsequent microwave heating, the output of the pyrometer is used to monitor the temperature of the diamond, and is used as a feedback signal to control the microwave power to achieve the desired brazing temperature. The temperature-vs.-time heating curve, is developed to obtain the strongest possible braze joint with minimal residual stress from differential thermal expansion.
The braze interlayer could consist of a foil of a braze filler metal. FEM analysis above teaches that the best shear strengths in braze joints on diamond/tungsten carbide are achieved with fillets 0.002 inch thickness, and that the braze interlayer should be thick enough (at least 0.02 mm) to relieve stresses caused by differential thermal expansion between diamond and tungsten carbide. The brazing material must be able, at the brazing temperature, to wet or diffuse into both the diamond surface layer and the tungsten carbide substrate or into the tungsten carbide backing layer and tungsten carbide substrate, as the case may be.
In the example of a microwave heating system shown above, a cylindrical cavity driven by a TWT amplifier was used in making of the braze joints. The TWT is a variable frequency source and therefore provides a simple means for compensating for the shift in resonant frequency associated with insertion and heating of the sample in the cavity. Other microwave heating
60
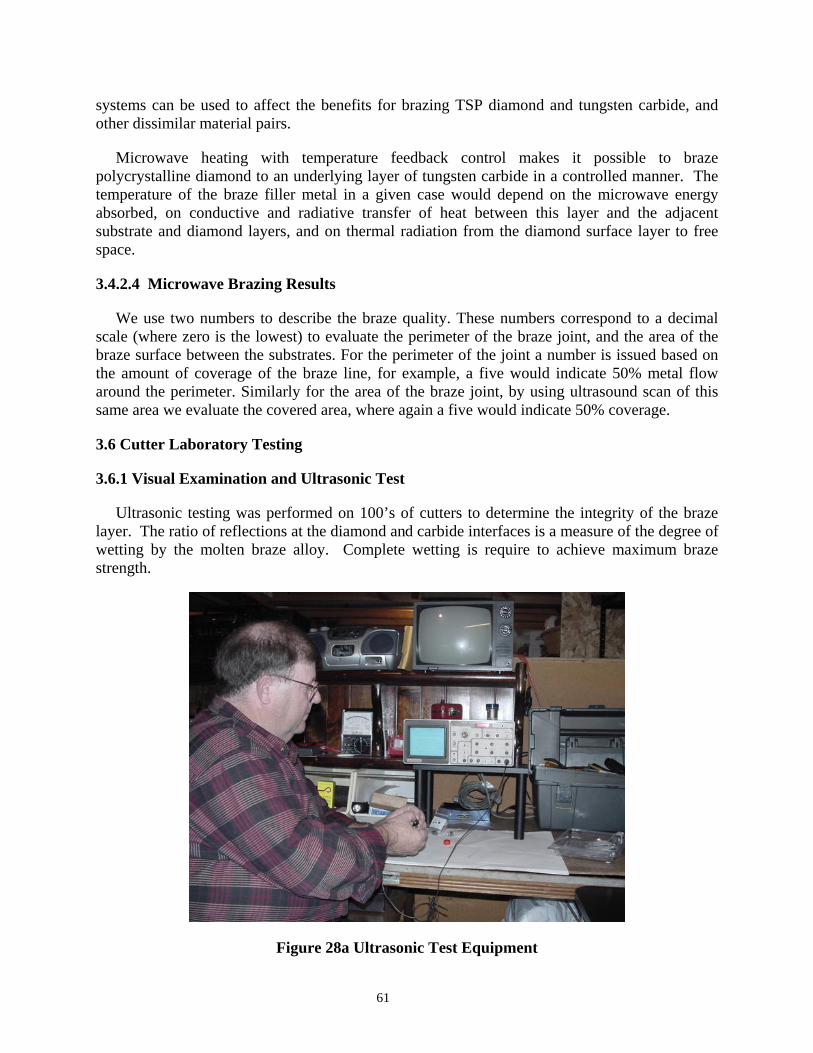
systems can be used to affect the benefits for brazing TSP diamond and tungsten carbide, and other dissimilar material pairs.
Microwave heating with temperature feedback control makes it possible to braze polycrystalline diamond to an underlying layer of tungsten carbide in a controlled manner. The temperature of the braze filler metal in a given case would depend on the microwave energy absorbed, on conductive and radiative transfer of heat between this layer and the adjacent substrate and diamond layers, and on thermal radiation from the diamond surface layer to free space.
3.4.2.4 Microwave Brazing Results
We use two numbers to describe the braze quality. These numbers correspond to a decimal scale (where zero is the lowest) to evaluate the perimeter of the braze joint, and the area of the braze surface between the substrates. For the perimeter of the joint a number is issued based on the amount of coverage of the braze line, for example, a five would indicate 50% metal flow around the perimeter. Similarly for the area of the braze joint, by using ultrasound scan of this same area we evaluate the covered area, where again a five would indicate 50% coverage.
3.6 Cutter Laboratory Testing
3.6.1 Visual Examination and Ultrasonic Test
Ultrasonic testing was performed on 100’s of cutters to determine the integrity of the braze layer. The ratio of reflections at the diamond and carbide interfaces is a measure of the degree of wetting by the molten braze alloy. Complete wetting is require to achieve maximum braze strength.
Figure 28a Ultrasonic Test Equipment
61
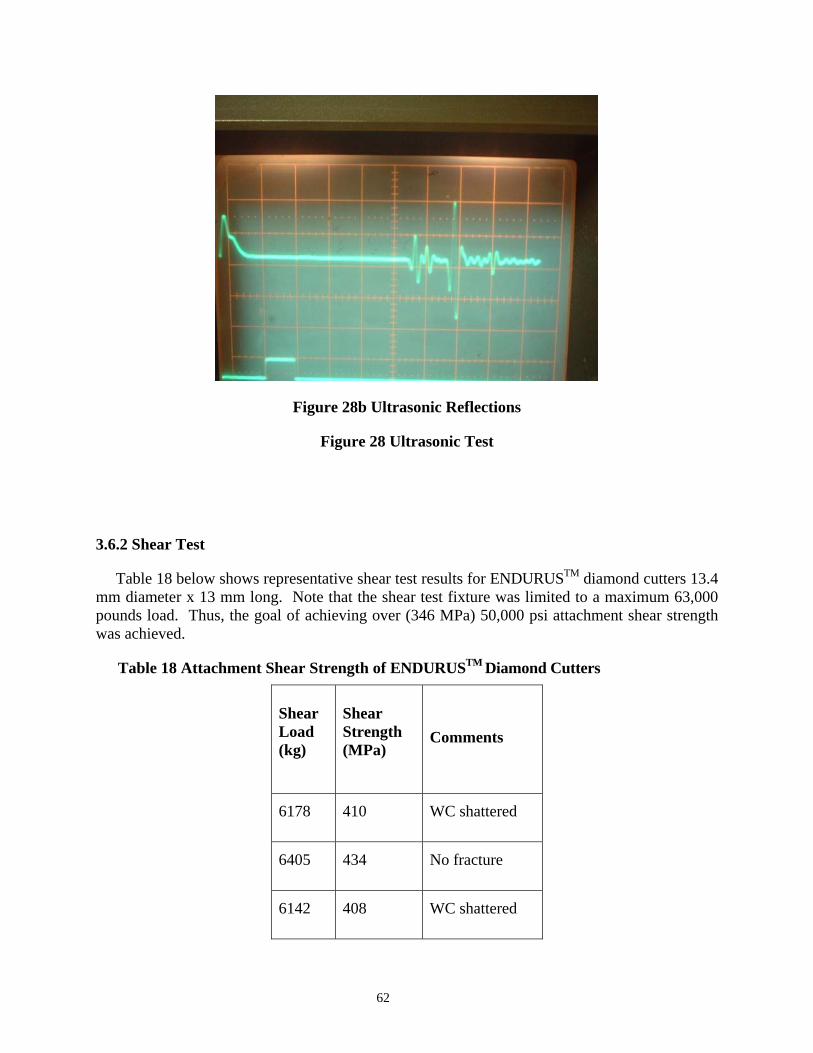
Figure 28b Ultrasonic Reflections
Figure 28 Ultrasonic Test
3.6.2 Shear Test
Table 18 below shows representative shear test results for ENDURUSTM diamond cutters 13.4 mm diameter x 13 mm long. Note that the shear test fixture was limited to a maximum 63,000 pounds load. Thus, the goal of achieving over (346 MPa) 50,000 psi attachment shear strength was achieved.
Table 18 Attachment Shear Strength of ENDURUSTM Diamond Cutters
Shear Load (kg)
Shear Strength (MPa)
Comments
6178 410 WC shattered
6405 434 No fracture
6142 408 WC shattered
62
3.6.3 Rock Abrasion Test
The petroleum industry has used the lathe rock wear test as a first step in the evaluation of diamond cutters for drill bits. Typically the rock is granite which is both hard and abrasive. While the load may be controlled, by the nature of the lathe operation, will not be as great as in the field drilling application. For this reason, the test is primarily to measure the abrasion resistance of the diamond. Cutter wear is, of course, a combination of abrasion, higher loading, and vibration. This combination of parameters is more closely duplicated in the laboratory with a vertical turret lathe and a sub-scale drill bit test machine.
The lathe test used for the TSP diamond cutters is shown in Figure 23 below, the Granite Log Test. Test results are expressed as the volume of rock removed divided by the wear flat area on the cutter. These data for the PDC and TSP cutter are listed in Table 19 below. The abrasion resistance commonly expressed in in3/in2 of the commercial PDC diamond, as measured by this test, has increased considerably, and will continue to increase as the PDC diamond particle size and distribution and processing is further optimized. Nevertheless, the PDC and TSP diamond have eccentrically comparable abrasion resistance. The reason is that this test does not create a sufficiently high cutter tip temperature to address the inherent thermal stability of the TSP diamond.
63
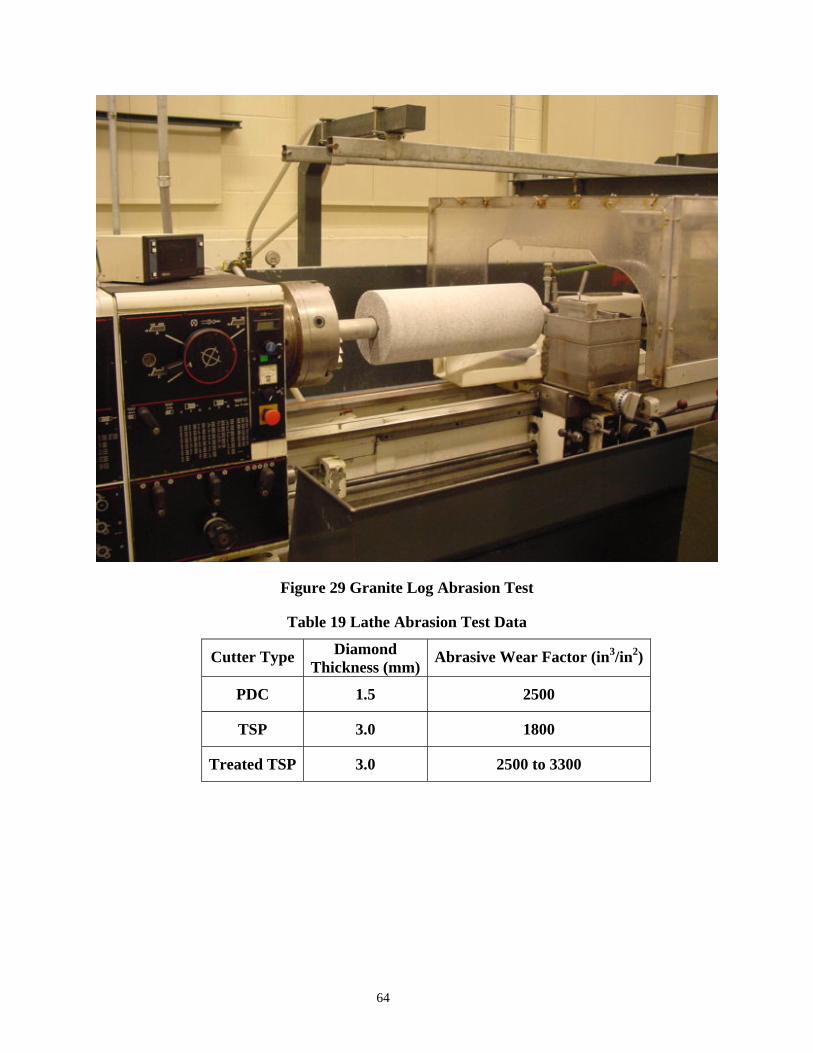
Figure 29 Granite Log Abrasion Test
Table 19 Lathe Abrasion Test Data
Cutter Type Diamond Thickness (mm) Abrasive Wear Factor (in3/in2)
PDC 1.5 2500
TSP 3.0 1800
Treated TSP 3.0 2500 to 3300
64
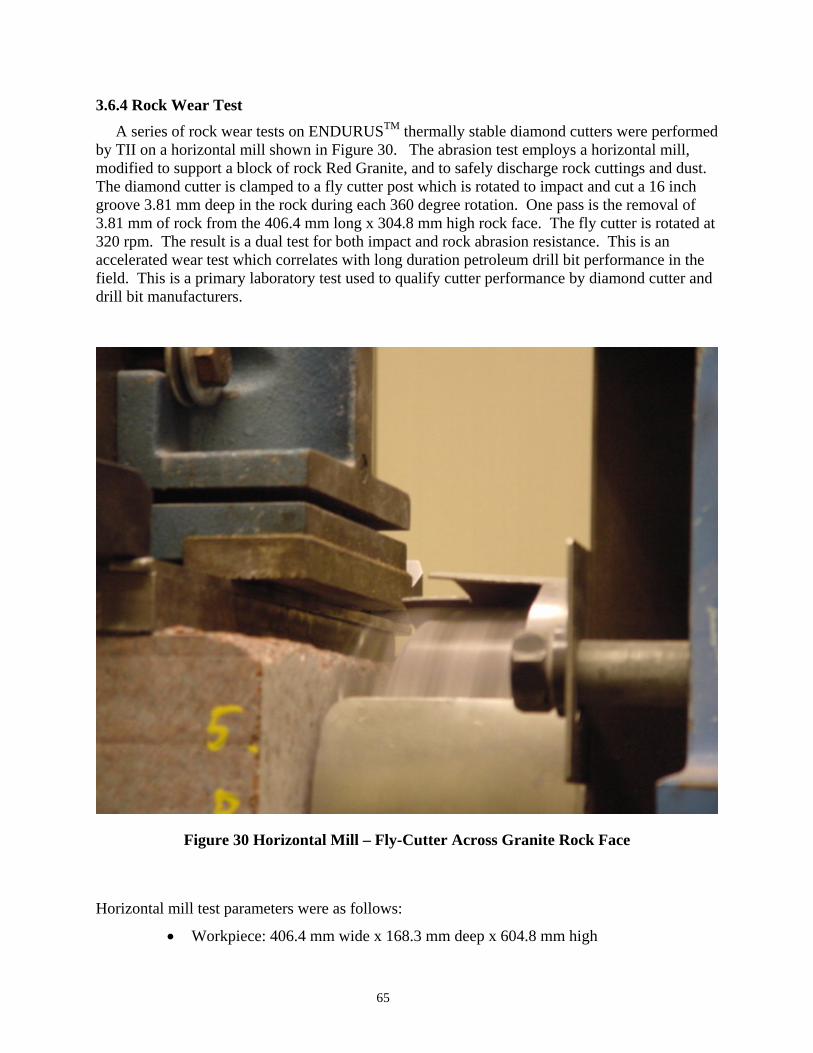
3.6.4 Rock Wear Test A series of rock wear tests on ENDURUSTM thermally stable diamond cutters were performed by TII on a horizontal mill shown in Figure 30. The abrasion test employs a horizontal mill, modified to support a block of rock Red Granite, and to safely discharge rock cuttings and dust. The diamond cutter is clamped to a fly cutter post which is rotated to impact and cut a 16 inch groove 3.81 mm deep in the rock during each 360 degree rotation. One pass is the removal of 3.81 mm of rock from the 406.4 mm long x 304.8 mm high rock face. The fly cutter is rotated at 320 rpm. The result is a dual test for both impact and rock abrasion resistance. This is an accelerated wear test which correlates with long duration petroleum drill bit performance in the field. This is a primary laboratory test used to qualify cutter performance by diamond cutter and drill bit manufacturers.
Figure 30 Horizontal Mill – Fly-Cutter Across Granite Rock Face
Horizontal mill test parameters were as follows:
• Workpiece: 406.4 mm wide x 168.3 mm deep x 604.8 mm high
65
• Lubricant: none - dry cutting • Speed: 320 rpm • Depth of cut:3.81 mm • Feed rate: 0.1702 mm per pass • Time per pass: 7.5 minutes • Cycles (impacts) per pass: 2400
Table 20 Horizontal Mill Wear Tests Cutter Type
Condition Grain Size
(microns)
Diameter
(mm/inch)
Diamond Thickness (mm/inch)
Passes
(no.)
Impacts
(no.)
Change
PDC Premium Oilfield Cutter 25 13.3/0.524 1.5/0.060 5 12,000 Baseline
TSP
Treated
(TII Leach and Cut) 25 13.3/0.524 1.5/0.060 9 27,600 2.3 x
TSP
MW Brazed (Shock Absorber
Design) 40 13.7/0.540 3.5/0.140 18 43,200 3.6 x
TSP
MW Brazed (Shock Absorber Design and Diamond Treated
for Strength)
40 13.7/0.540 3.5/0.140 23 55,200 4.6 x
3.6.5 Rock Drilling Tests
3.6.6.1 Fast Prototype Drilling Test
Prototype drilling tests were run at the Living Waters, Inc. Facility in Stafford, TX. Living Waters is an organization which drills water wells in Third World countries, where clean water is often not available. The objective was to test cutters for brazability, diamond-to-carbide attachment strength, and wear and fracture resistance when drilling hard and abrasive sandstone. The test rock, provided by the Grant Prideco Hycalog drill bit company, was Torrey Buff Sandstone which has an unconfined compressive strength of 76 MPa (11,000 psi). The drill bits provided by Living Waters contained both TSP and PDC cutters to be able compare the wear rates of each. The cutters were brazed to the steel blades of a 5 ¼” diameter bladed bit shown in Figure 31.
After the bits were spudded in, they ran smoothly on the Model 250 water well rig. The rig ran at 66 rpm with 362.8 kg of weight. Water flowed through the bits at a rate of 5 gpm. When the bits were pulled, it was evident that the PDC cutters had more wear than the TSP’s. With 0 back rake angle, the wear rates were greater than at 15 degrees. This cutter structure shown in Figure 32 prevented chatter, and facilitated cuttings removal. The Torrey Buff Sandtone proved to be very abrasive and a good test to compare the wear rates of PDC and TSP cutters.
66
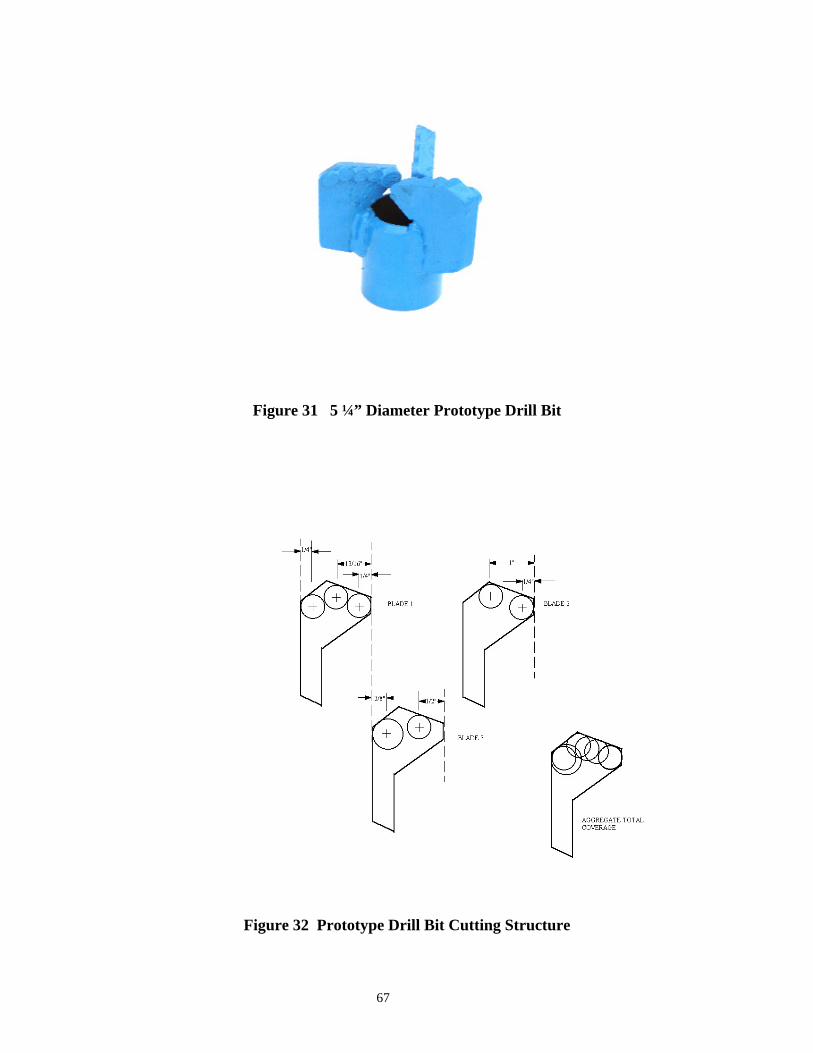
Figure 31 5 ¼” Diameter Prototype Drill Bit
Figure 32 Prototype Drill Bit Cutting Structure
67

3.6.6.2 Sandia Hard Rock Drilling Test
Drilling tests on ENDURUSTM diamond cutters were conducted at the Sandia National Laboratories’ Hard-Rock Drilling Facility (HRDF) shown in Figure 32. A 3x3x3 foot (91 cm x 91 cm x 91 cm) White Sierra Granite block was drilled at 30 feet (9.14 meters) per hour with varying bit weight and 100 RPM applied to a 3.25-inch (8.255 cm) core bit. The bit had three approximately 0.5 inch (12.7 mm) diameter cutters. The TSP test cutter was located in the center of the bit kerf. Outside and inside cutters were replaced periodically to maintain bit balance. The TSP cutter was inspected under magnification for any microcracking after drilling each 3-foot (91 cm) hole.
Figure 33 Sandia Hard Rock Test Facility
68

Figure 34 Sandia HRTF Drill Bit
3.6.6.2.1 Continuous Self-Sharpening (CSS) Cutter Wear Tests Sandia employed the Hard Rock Wear Test Facility (HRTF) at Sandia National Laboratories (SNL) to drill several series of boreholes in Sierra White Granite using nonstandard polycrystalline diamond compact (PDC) test cutters provided by Technology International. In all, five (5) series of boreholes were produced where each series featured a different test cutter. This testing was designed to examine the influence on cutter wearflat growth of one or more premachined holes (circular or triangular) in the vicinity of the cutting edge; these holes penetrated the diamond table and, in some cases, the cutter substrate. Premachined holes were present in four of the current test cutters; the fifth was unmodified. For reference, the modifications to the GE 2541 test cutter used for a particular cutter series (CS) are described in Table 21. All boreholes were produced with a "standard" SNL three-cutter coring bit. In each case, the center, or test, cutter was one of the GE 2541 cutters that you supplied. The inner and outer gage cutters were chamfered PDC, type GE 2741. A particular pair of gage cutters was used for exactly four boreholes, with each gage cutter being rotated 90o between successive boreholes. This procedure assured that every borehole was started with unworn cutting edges on the gage cutters. After completion of each borehole, we used a magnifying lens coupled to a color video camera to project an image of the test cutter on a monitor screen for photographic documentation via perpendicular views showing the condition of the wearflat and the cutter face (including the
69

cutting-edge profile). A video measurement system computed the wearflat area and chord lengths using operator-selected points on the image.
In order to assure proper break-in of each test cutter, the first borehole in a given cutter series was drilled at a low (1.52 m/hr) rate of penetration (ROP). The remaining boreholes in each series were produced with a 30 ft/hr ROP. Test results for all five of the type 2541 cutters are reported in Table 2, which includes the ROP, bit rotation rate (revolutions per minute, RPM), final hole depth, and wearflat area and chord (length and width) measurements for each borehole that was generated. As seen in Table 22, the total number of boreholes drilled with each cutter varied from a minimum of three for CS29 (large triangular hole) to a maximum of fourteen for CS26 (small hole through diamond table and partially through substrate). The wearflat area data for each cutter are plotted versus borehole number in Graph I. From this plot, it is evident that the wearflat growth rate generally tends to be higher in proportion to the amount of material removed from the vicinity of the cutting edge by the introduction of a premachined hole. This effect is most apparent for the case (CS29) of a large triangular hole. The only exception to this trend was obtained for series CS26, where the test cutter had a single small hole that went through the diamond table and partially into the tungsten carbide substrate. In this case, the wearflat area after the first borehole was 33% smaller than the wearflat area obtained for a cutter with no hole, and the wearflat area continued to remain smaller than that for the unmachined cutter after completion of a matching number of boreholes in the SWG. This result is consistent with previous observations at SNL by D. A. Glowka that a small hole through a cutter near the cutting edge (e.g., for thermocouple installation) seemed to correlate with a lower wearflat growth rate than achieved for a cutter with no hole. Two additional tests were proposed to validate the present result: (1) rotate the cutter with small hole used for CS26 by 180o and retest by drilling one borehole at 5 RPM to see if the data match those for the baseline case (CS25, no hole); and, (2) prepare and test another cutter with the same hole configuration used for CS26 to see if the data match the low wearflat areas reported herein. The first of these additional tests has already been performed (as CS26A), and the resultant wearflat length, width, and area measurements are, respectively, 1.364 mm, 6.141 mm, and 4.562 mm2. This result is inconclusive since the CS26A wearflat area after one borehole lies between that obtained for CS25 (no hole) and CS26 (small hole); hence, the apparently anomalous result for CS26 may be due, at least in part, to variations in material properties relative to those of the cutters used for CS25, 27, and 28. However, the possibility remains that the CS26 results are, indeed, a consequence of the small premachined hole. Linear regression analysis has been performed to obtain a least-squares fit to the wearflat data for each cutter. These linear fits and their corresponding mathematical expressions are shown along with the data in Figures 36. Observation of the slopes of the fitted lines shows a consistent increase in wearflat growth per borehole in proportion to the initial amount of material removed from the cutter by premachining.
70
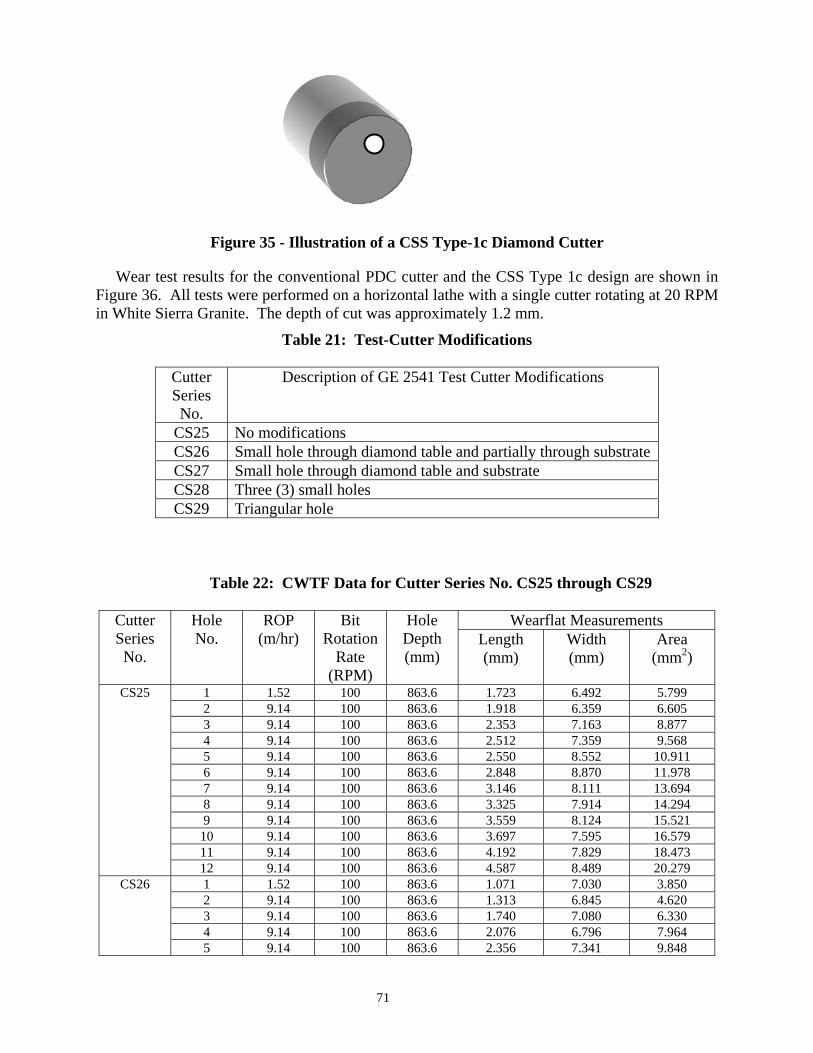
Figure 35 - Illustration of a CSS Type-1c Diamond Cutter
Wear test results for the conventional PDC cutter and the CSS Type 1c design are shown in Figure 36. All tests were performed on a horizontal lathe with a single cutter rotating at 20 RPM in White Sierra Granite. The depth of cut was approximately 1.2 mm.
Table 21: Test-Cutter Modifications
Cutter Series No.
Description of GE 2541 Test Cutter Modifications
CS25 No modifications CS26 Small hole through diamond table and partially through substrate CS27 Small hole through diamond table and substrate CS28 Three (3) small holes CS29 Triangular hole
Table 22: CWTF Data for Cutter Series No. CS25 through CS29
Wearflat Measurements Cutter Series No.
Hole No.
ROP (m/hr)
Bit Rotation
Rate (RPM)
Hole Depth (mm)
Length (mm)
Width (mm)
Area (mm2)
1 1.52 100 863.6 1.723 6.492 5.799 2 9.14 100 863.6 1.918 6.359 6.605 3 9.14 100 863.6 2.353 7.163 8.877 4 9.14 100 863.6 2.512 7.359 9.568 5 9.14 100 863.6 2.550 8.552 10.911 6 9.14 100 863.6 2.848 8.870 11.978 7 9.14 100 863.6 3.146 8.111 13.694 8 9.14 100 863.6 3.325 7.914 14.294 9 9.14 100 863.6 3.559 8.124 15.521
10 9.14 100 863.6 3.697 7.595 16.579 11 9.14 100 863.6 4.192 7.829 18.473
CS25
12 9.14 100 863.6 4.587 8.489 20.279 1 1.52 100 863.6 1.071 7.030 3.850 2 9.14 100 863.6 1.313 6.845 4.620 3 9.14 100 863.6 1.740 7.080 6.330 4 9.14 100 863.6 2.076 6.796 7.964
CS26
5 9.14 100 863.6 2.356 7.341 9.848
71

Wearflat Measurements Cutter Series No.
Hole No.
ROP (m/hr)
Bit Rotation
Rate (RPM)
Hole Depth (mm)
Length (mm)
Width (mm)
Area (mm2)
6 9.14 100 863.6 2.615 7.305 10.585 7 9.14 100 863.6 2.946 7.710 12.629 8 9.14 100 863.6 3.243 7.313 13.503 9 9.14 100 863.6 3.421 6.964 15.255
10 9.14 100 863.6 3.837 7.129 15.838 11 9.14 100 863.6 3.799 7.241 16.990 12 9.14 100 863.6 4.271 7.317 18.320 13 9.14 100 863.6 4.536 7.198 19.642 14 9.14 100 863.6 5.117 6.913 20.989 1 1.52 100 863.6 6.791 1.641 5.725 2 9.14 100 863.6 7.197 1.898 7.093 3 9.14 100 863.6 7.303 2.373 8.647 4 9.14 100 863.6 7.559 2.652 10.566 5 9.14 100 863.6 6.469 3.414 12.108 6 9.14 100 863.6 7.689 3.475 13.191 7 9.14 100 863.6 7.606 3.760 15.134 8 9.14 100 863.6 7.121 3.873 15.313 9 9.14 100 863.6 7.815 4.044 18.559
CS27
10 9.14 100 863.6 7.848 3.995 19.620 1 1.52 100 863.6 5.828 1.621 5.787 2 9.14 100 863.6 6.970 1.980 7.830 3 9.14 100 863.6 9.211 2.235 7.920 4 9.14 100 863.6 7.395 2.514 10.189 5 9.14 100 863.6 7.268 2.788 11.520 6 9.14 100 863.6 7.561 3.016 13.169 7 9.14 100 863.6 7.100 3.108 14.117
CS28
8 9.14 100 863.6 7.537 3.441 14.941 1 1.52 100 863.6 7.058 3.409 11.378 2 9.14 100 863.6 6.083 4.172 14.892
CS29
3 9.14 100 863.6 8.030 5.103 25.502
72
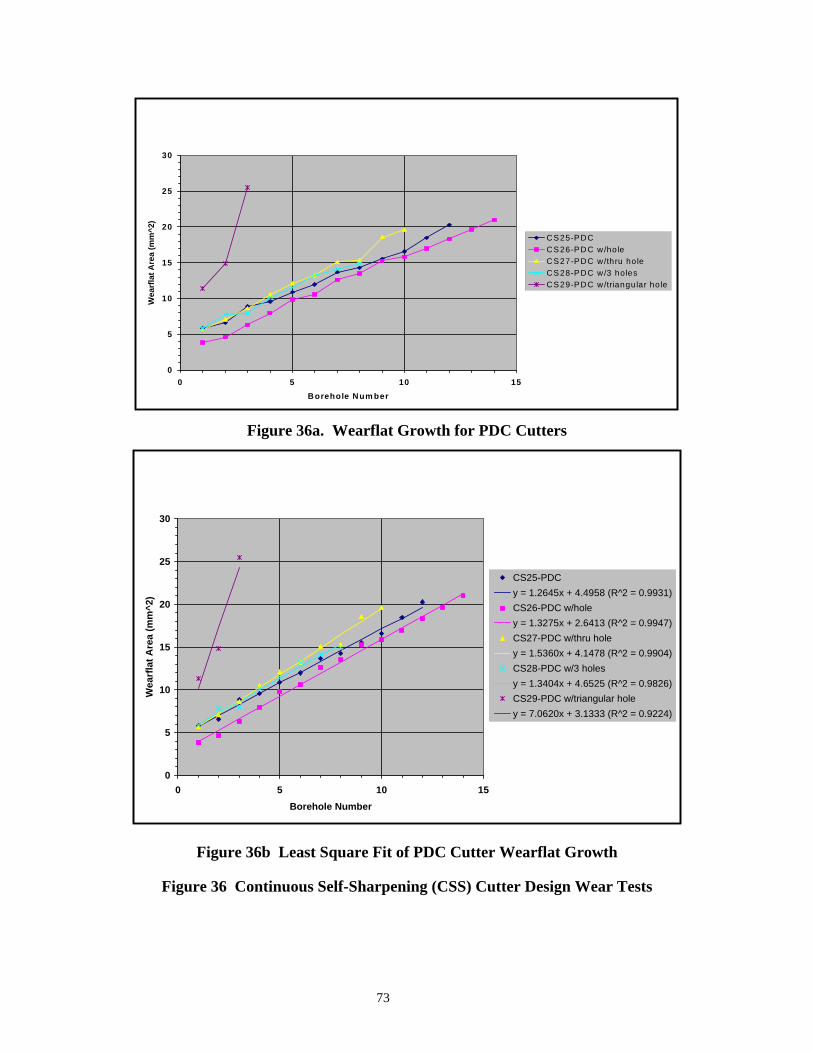
0
5
10
15
20
25
30
0 5 10 15Borehole Num ber
Wea
rfla
t Are
a (m
m^2
)
CS25-PDCCS26-PDC w/holeCS27-PDC w/thru holeCS28-PDC w/3 holesCS29-PDC w/triangular hole
Figure 36a. Wearflat Growth for PDC Cutters
0
5
10
15
20
25
30
0 5 10 15Borehole Number
Wea
rfla
t Are
a (m
m^2
)
CS25-PDCy = 1.2645x + 4.4958 (R^2 = 0.9931)CS26-PDC w/holey = 1.3275x + 2.6413 (R^2 = 0.9947)CS27-PDC w/thru holey = 1.5360x + 4.1478 (R^2 = 0.9904)CS28-PDC w/3 holesy = 1.3404x + 4.6525 (R^2 = 0.9826)CS29-PDC w/triangular holey = 7.0620x + 3.1333 (R^2 = 0.9224)
Figure 36b Least Square Fit of PDC Cutter Wearflat Growth
Figure 36 Continuous Self-Sharpening (CSS) Cutter Design Wear Tests
73
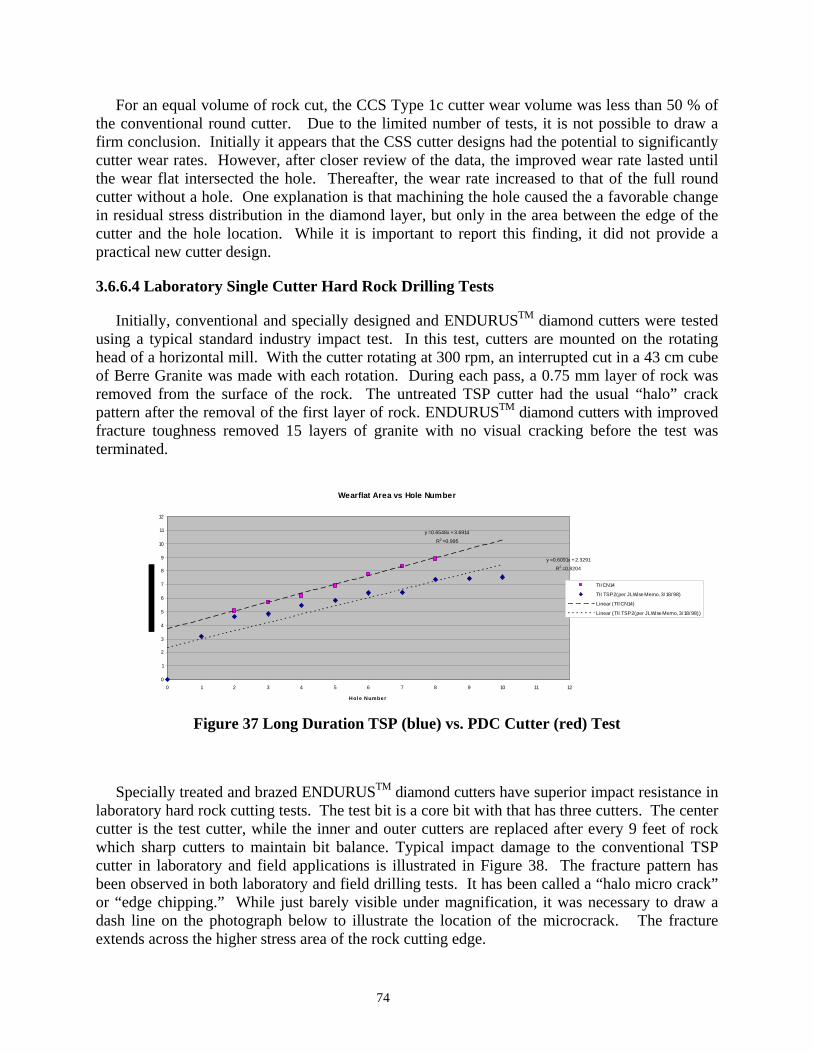
For an equal volume of rock cut, the CCS Type 1c cutter wear volume was less than 50 % of the conventional round cutter. Due to the limited number of tests, it is not possible to draw a firm conclusion. Initially it appears that the CSS cutter designs had the potential to significantly cutter wear rates. However, after closer review of the data, the improved wear rate lasted until the wear flat intersected the hole. Thereafter, the wear rate increased to that of the full round cutter without a hole. One explanation is that machining the hole caused the a favorable change in residual stress distribution in the diamond layer, but only in the area between the edge of the cutter and the hole location. While it is important to report this finding, it did not provide a practical new cutter design.
3.6.6.4 Laboratory Single Cutter Hard Rock Drilling Tests
Initially, conventional and specially designed and ENDURUSTM diamond cutters were tested using a typical standard industry impact test. In this test, cutters are mounted on the rotating head of a horizontal mill. With the cutter rotating at 300 rpm, an interrupted cut in a 43 cm cube of Berre Granite was made with each rotation. During each pass, a 0.75 mm layer of rock was removed from the surface of the rock. The untreated TSP cutter had the usual “halo” crack pattern after the removal of the first layer of rock. ENDURUSTM diamond cutters with improved fracture toughness removed 15 layers of granite with no visual cracking before the test was terminated.
Figure 37 Long Duration TSP (blue) vs. PDC Cutter (red) Test
Wearflat Area vs Hole Number
y = 0.6548x + 3.6914
R2 = 0.995
y = 0.6091x + 2.3291
R2 = 0.8204
0
1
2
3
4
5
6
7
8
9
10
11
12
0 1 2 3 4 5 6 7 8 9 10 11 12
Hol e Numbe r
TII CN14
TII TSP2(per JLWise Memo, 3/ 18/ 98)
Linear (TII CN14)
Linear (TII TSP2(per JLWise Memo, 3/ 18/ 98))
Specially treated and brazed ENDURUSTM diamond cutters have superior impact resistance in laboratory hard rock cutting tests. The test bit is a core bit with that has three cutters. The center cutter is the test cutter, while the inner and outer cutters are replaced after every 9 feet of rock which sharp cutters to maintain bit balance. Typical impact damage to the conventional TSP cutter in laboratory and field applications is illustrated in Figure 38. The fracture pattern has been observed in both laboratory and field drilling tests. It has been called a “halo micro crack” or “edge chipping.” While just barely visible under magnification, it was necessary to draw a dash line on the photograph below to illustrate the location of the microcrack. The fracture extends across the higher stress area of the rock cutting edge.
74
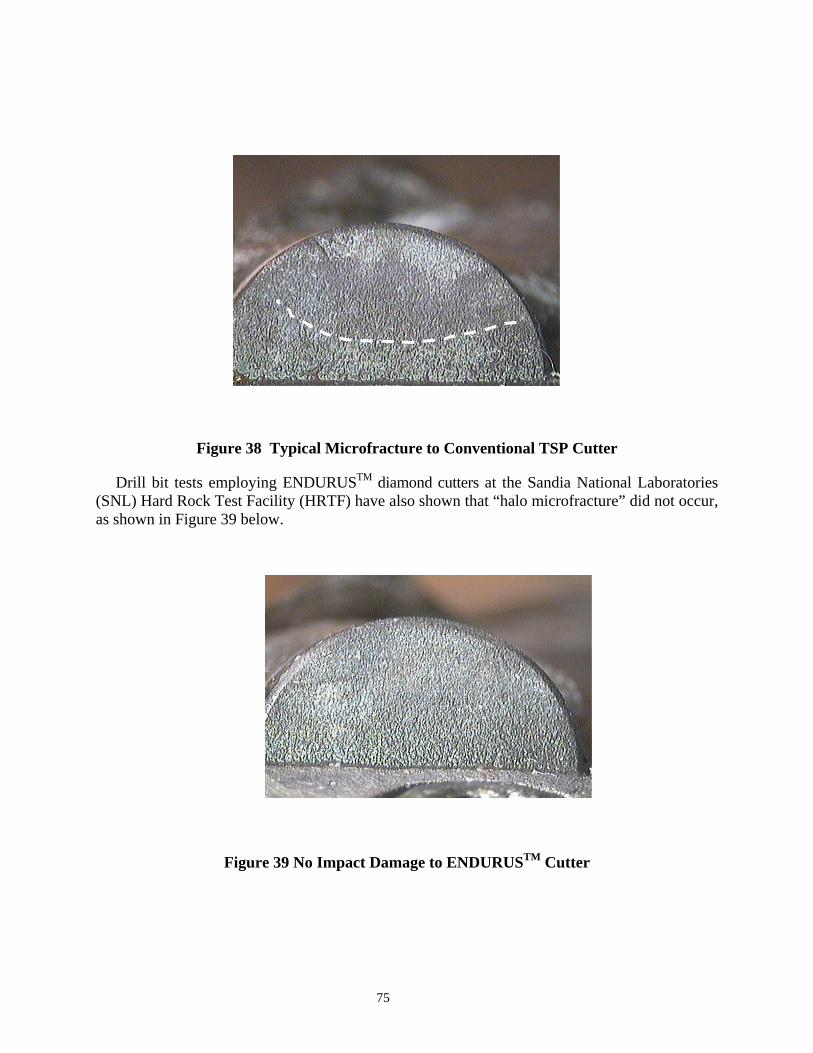
Figure 38 Typical Microfracture to Conventional TSP Cutter
Drill bit tests employing ENDURUSTM diamond cutters at the Sandia National Laboratories (SNL) Hard Rock Test Facility (HRTF) have also shown that “halo microfracture” did not occur, as shown in Figure 39 below.
Figure 39 No Impact Damage to ENDURUSTM Cutter
75
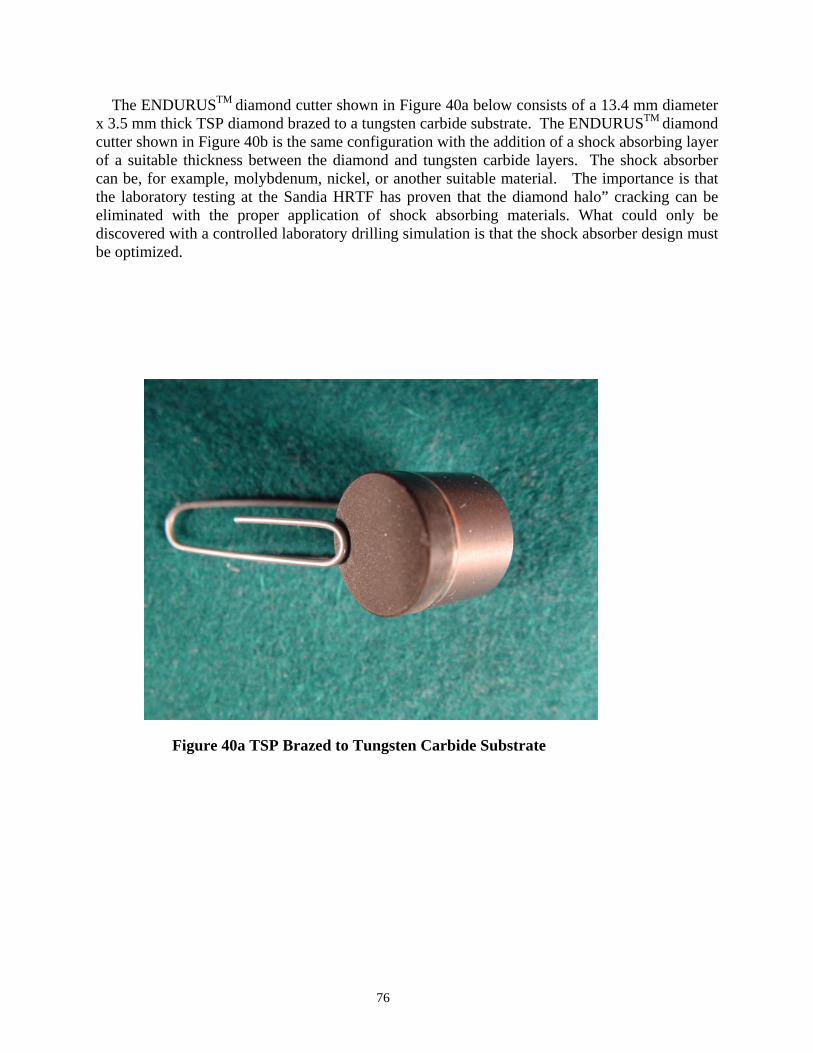
The ENDURUSTM diamond cutter shown in Figure 40a below consists of a 13.4 mm diameter x 3.5 mm thick TSP diamond brazed to a tungsten carbide substrate. The ENDURUSTM diamond cutter shown in Figure 40b is the same configuration with the addition of a shock absorbing layer of a suitable thickness between the diamond and tungsten carbide layers. The shock absorber can be, for example, molybdenum, nickel, or another suitable material. The importance is that the laboratory testing at the Sandia HRTF has proven that the diamond halo” cracking can be eliminated with the proper application of shock absorbing materials. What could only be discovered with a controlled laboratory drilling simulation is that the shock absorber design must be optimized.
Figure 40a TSP Brazed to Tungsten Carbide Substrate
76
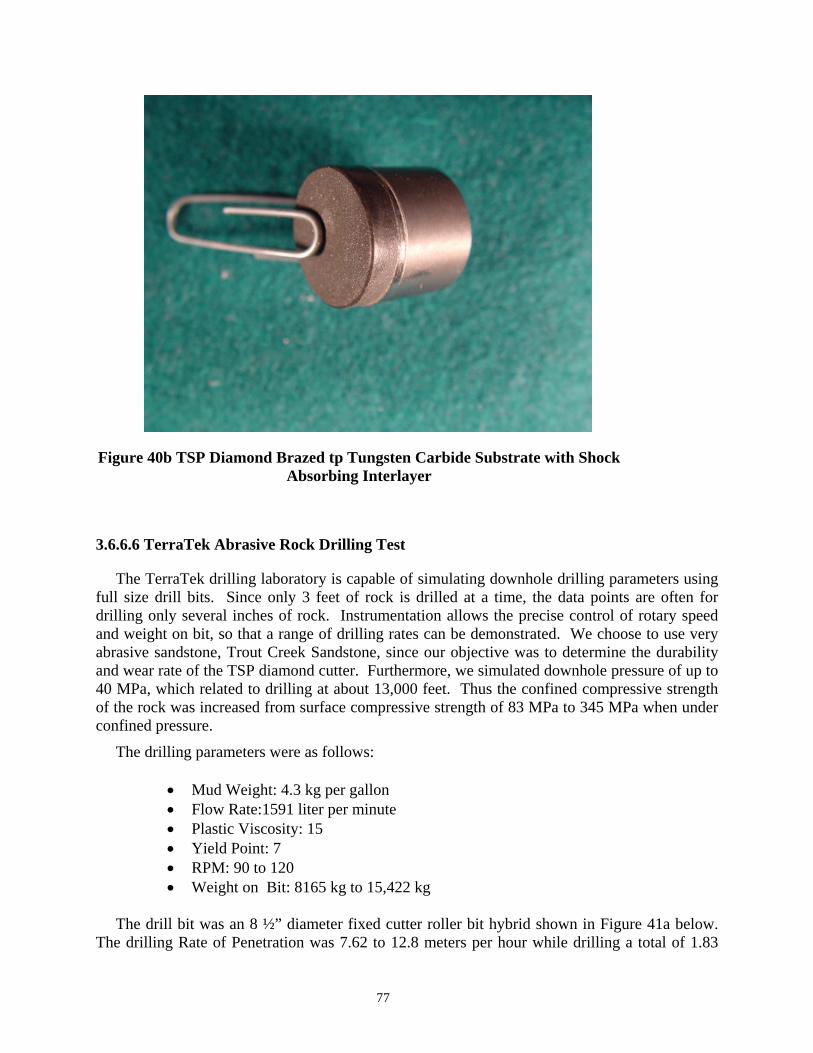
Figure 40b TSP Diamond Brazed tp Tungsten Carbide Substrate with Shock Absorbing Interlayer
3.6.6.6 TerraTek Abrasive Rock Drilling Test
The TerraTek drilling laboratory is capable of simulating downhole drilling parameters using full size drill bits. Since only 3 feet of rock is drilled at a time, the data points are often for drilling only several inches of rock. Instrumentation allows the precise control of rotary speed and weight on bit, so that a range of drilling rates can be demonstrated. We choose to use very abrasive sandstone, Trout Creek Sandstone, since our objective was to determine the durability and wear rate of the TSP diamond cutter. Furthermore, we simulated downhole pressure of up to 40 MPa, which related to drilling at about 13,000 feet. Thus the confined compressive strength of the rock was increased from surface compressive strength of 83 MPa to 345 MPa when under confined pressure.
The drilling parameters were as follows:
• Mud Weight: 4.3 kg per gallon • Flow Rate:1591 liter per minute • Plastic Viscosity: 15 • Yield Point: 7 • RPM: 90 to 120 • Weight on Bit: 8165 kg to 15,422 kg
The drill bit was an 8 ½” diameter fixed cutter roller bit hybrid shown in Figure 41a below. The drilling Rate of Penetration was 7.62 to 12.8 meters per hour while drilling a total of 1.83
77
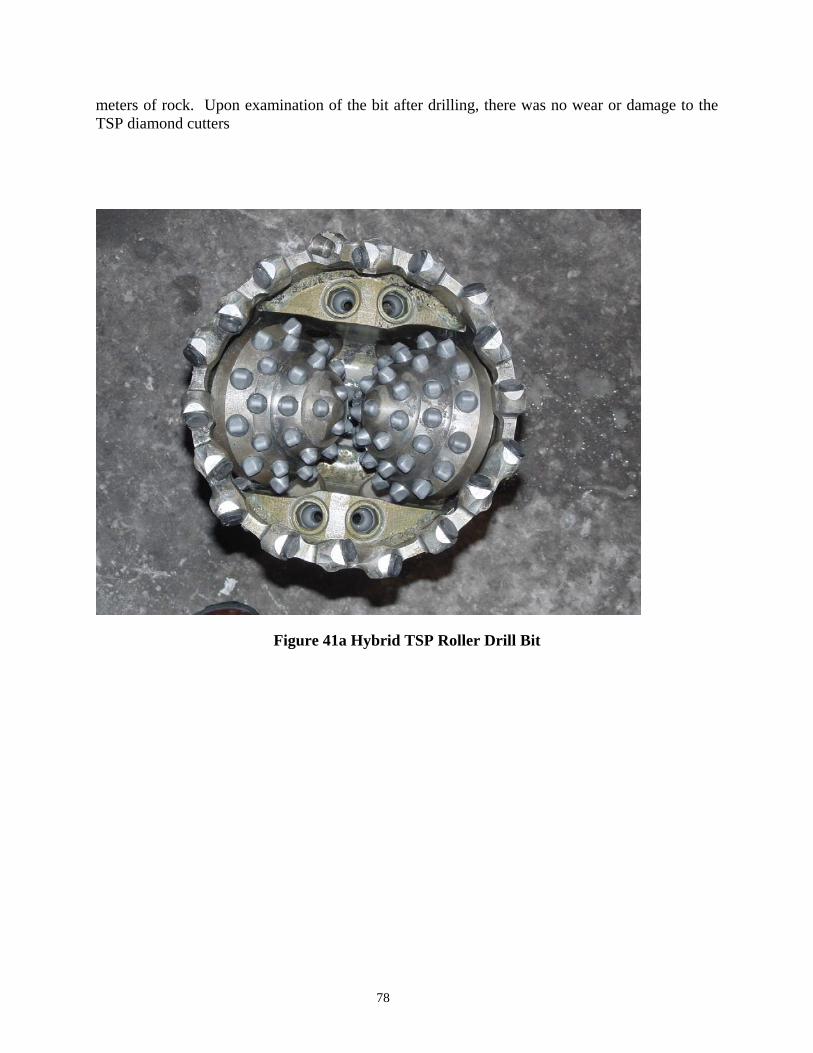
meters of rock. Upon examination of the bit after drilling, there was no wear or damage to the TSP diamond cutters
Figure 41a Hybrid TSP Roller Drill Bit
78

Figure 41b Tested TSP Diamond Cutter
Figure 41 Drilling Test of ENDURUSTM Cutters on a Hybrid Fixed Cutter-Roller Drill Bit
3.7 Field Drilling Test
3.7.1 Catoosa Test Well
3.7.1.1 Turbodrill Drilling Test
A 4 1/8” Smith Model M09CQTPX drill bit test was run at the GTI Catoosa Drilling Test Site. The test was performed to compare the performance of the ENDURUSTM TSP cutter with the Smith Bits HOT cutter on a 2-7/8” Smith Neyrfor Model TS1-MK2 Turbodrill. The PDC Hot cutters are conventional PDC cutters upon which the surface cobalt has been leached away to increase the thermal stability of the cutter. These cutters were strategically placed at various points on the shoulder of the bit to establish performance benchmarks. The subsurface geology of Catoosa has 1250 feet of reservoir in quality sandstone with shale and limestone sequences. From 1250 to 1600 feet the formation is very dense with compressive strength reaching in excess of 50,000 psi unconfined compressive strength. This diverse geology provides the opportunity to adequately compare the performance of the PDC and the ENDURUSTM Cutter.
The Catoosa well selected for this test was NELDA 6, which has 13-3/8” surface casing set at 185 feet and 7” intermediate casing set to 523 feet. The well was cemented back to 397 feet. The cement was drilled to 540 feet at 82 ft/hr before starting to sidetrack. Rotary speeds during this section varied between 24-30 rpm and string torque varied between 1037-1500 ft-lb.
Sliding commences at 540 feet. After sliding for 41 feet at a controlled rate of 15 ft/hr, the bit was pulled to increase the angle of the bent housing from one degree to two degrees. The bit has
79
experienced damage when it had rotated into the steel casing. This caused damage to both the PDC and TSP cutters located on the outside diameter of the drill bit. Sliding resumed and the sidetrack was built over the interval 581-668 feet. The ROP for this sliding section was controlled at 35 ft/hr. avg. The bit was again pulled to return the bent angle to one degree for straight drilling. Drilling continued to a depth of 1,012 feet at 76 ft/hr. The bit was pulled at 1000 feet due to a pump failure. When drilling resumed, the bit drilled to 1,280 at 48 f/hr. An ENDURUSTM TSP cutter was less worn than the PDC cutters around it.
It must be noted that the PDC cutters suffered additional wear due to the loss of the surrounding cutting structure. Therefore, a clear comparison of the difference in wear properties cannot be made.
80

Figure 42a 4 1/8” Turbodrill Drill Bit
Figure 42b Tested TSP Cutters
Figure 42 Catoosa Turbodrill Drill Bit
81

4.0 Conclusions 1. TSP diamond materials available to this project had a wide variation in physical properties. Specifically, variations were found in the particle size distribution, pore size differences, and bulk density. Recently, improved TSP diamond has become available. This new diamond material has already accelerated the commercial introduction of the ENDURUS TM diamond cutter to a petroleum drill bit manufacturer. 2. Finite Element Modeling) has estimated the magnitude of residual thermal stresses, which can result as a function of various brazing process parameters. With this information, it has been possible to predict and produce ENDURUS TM diamond brazed cutters with controlled and desirable stress levels.
• Based on FEM calculations, when using uniformly- heating brazing methods, TSP to cobalt-bonded tungsten carbide joint residual thermal stress increases with increasing braze temperature when using a smaller thickness of braze filler metal.
• The lowest permissible brazing temperatures should be used consistent with attaining maximum attachment shear strength.
• The filler metal thickness to preclude delamination or TSP fracture should be 0.002 inch (50 microns).
• Brazing temperature over the range from 850 to 1150° C (1562 to 2102° F) has a significant effect on peak stresses at the braze interface.
• Braze interface thickness does not have a significant effect on peak stresses at the braze interface with a brazing temperature of 1000° C (1832° F), and the braze interface thickness range of 3 to 15 microns,
• A differential temperature between the low thermal expansion diamond and higher thermal expansion tungsten carbide of at least 200º C (392° F) will limit the thermal residual stress in the diamond layer and prevent cracking during brazing.
3. Microwave brazing, combustion synthesis brazing, or combinations thereof, produces ENDURUSTM diamond cutters with controllable levels of residual thermal stress and high attachment shear strength.
• A shear strength test was developed which directs the shear stress plain at the interface between the diamond and tungsten carbide substrate; thus the true strength of the braze was measured.
• Microwave brazed ENDURUSTM diamond cutters have an attachment shear strength of over 345 MPa (50,000 psi)
4. Unique processes developed by this project creates a TSP diamond material are now available with greater fracture resistance.
• Fracture resistance was measured with a modified Instron Instrumented Impact Test Instrument and tooling specifically designed for TSP diamond disc testing.
• Ion implantation of commercial TSP diamond materials has resulted in a 33% increase in fracture resistance
• Ion implantation plus the densification of commercially available porous TSP diamond has resulted in over a 60% increase in fracture resistance.
82
5. ENDURUSTM thermally stable diamond cutters outperformed PDC baseline performance in the laboratory rock lathe testing for abrasion resistance and horizontal mill testing for combined impact abrasion resistance.
• The ENDURUSTM cutter (same grain size and dimension as the PDC) withstood 2.3 x more impacts when compared to PDC baseline performance.
• The ENDURUSTM cutter (larger grain size and thicker diamond table than the PDC) was 3.6 x more impacts.
• The ENDURUSTM cutter (larger grain size, thicker diamond table than the PDC, and specially treated for increased diamond strength) was 4.6 x more impacts.
6. New cutter designs have been developed.
• The conventional cylindrical cutter configuration is well suited to replace the PDC cutter is existing drill bit designs.
• While the continuous self-sharpening cutter design with a hole drilled in the cutter face showed good potential for increasing the wear resistance of cutters, it was found that the affect lasted only until the wear path reached the hole. Apparently, a reduction in diamond thermal residual stress between the cutter edge and the hole caused a reduction in wear rate. The wear rate as the cutter wear flat was within hole was equivalent to the same cutter without a hole.
• Based on fabricability issues, the compression joint design tested was not practical. • Testing at the Sandia Hard Rock Test Facility has demonstrated that the ENDURUSTM
cutter shock absorber design prevented the detrimental “halo” cracking while drilling White Sierra Granite at 9.14 meters (30 feet) per hour.
7. Hard rock drill bit tests with the ENDURUSTM cutter has shown reduced cutter wear.
• Prototype drill bit testing showed TSP diamond to have less wear than the state-of-the-art PDC diamond when drilling abrasive sandstone with a surface compressive strength of 13,000 psi.
• Laboratory drill bit tests in White Sierra Granite at the Sandia Hard Test Facility was able to duplicate the “halo” cracking observed in the field; and to verify that such cracking would not occur with the new ENDURUSTM cutter shock absorber design.
• Full scale laboratory drilling tests at the TerraTek Drilling Simulator showed that when drilling abrasive sandstone with a confined compressive strength of 345 MPa (50,000 psi), the ENDURUSTM cutter has no measurable wear.
• Field testing at the Gas Technology Institute Catoosa Test site showed that the ENDURUSTM cutter had less wear than the state-of-the-art PDC cutter when Turbodrilling at 1100 rpm..
8. Technology International, Inc., with the support a major petroleum drill bit manufacturer, is supporting field applications to demonstrate the integrity of the ENDURUSTM cutter when drilling a variety of rock types.
83
5.0 References 1. Lee, M. and Hibbs, L.B. Jr., “Role of Deformation Twin Bands in the Wear Processes of
Polycrystalline Diamond Tools,” Wear of Materials, eds. K.C. Ludana, American Society of Mechanical Engineers, New York City, (1979), pp. 485-91.
2. Clark, L.E. and G.R. Shafto, “Core Drilling with SYNDAX3 PCD, “Industrial Diamond Review, April 1987.
3. Radtke, Robert P., US Patent No. 4,350,215, “Drill Bit and Method of Manufacture,” September, 1982.
4. Radtke, R.P. and. Pain, D.D, “Optimization of Hydraulics for Polycrystalline Diamond Composite Bits in Gulf Coast Shales with Water-Based Muds,” IADC/SPE 11411, IADC/SPE Drilling Conference, New Orleans, LA, February 20-23, 1983.
5. J. J. Moore, “Combustion Synthesis of Advanced Composite Materials," 31st Aerospace Sciences Meeting and Exhibit, AIAA Paper #93-0830 (1993)
6. H.W. Jackson, M. Barmatz, and P. Wagner, “Transient Temperature Distributions in a Cylinder Heated by Microwaves,” Proceedings of the 1996 Spring MRS Meeting, and references therein
7. C. Suryanarayana. J.J. Moore and R.P. Radtke, “A Novel Approach to the Joining of Dissimilar Materials,” Advanced Materials & Processes, Journal of the ASM International, March 2000, pp. 29-31.
8. Robert P. Radtke, “Higher Strength and Faster Drilling Thermally Stable Diamond Drill Bit Cutters”, Presented at INTERTECH 2000, July 17-21, 2000, Vancouver, B.C., Canada.
9. Suryanarayana, C. and Robert Radtke, “Novel Method of Brazing Dissimilar Materials,” ASM Advanced Materials and Processes, March 2001 10. Radtke, Robert, “Fracture Resistant TSP Diamond Cutters for Drag Bits,” US DOE
Geothermal Technologies, Volume 6, Issue 2, July/August 2001 11. C. Suryanarayana, J.J. Moore, and R.P. Radtke, “A Novel Approach to the Joining of
Dissimilar Materials,” First Annual ASM Brazing and Soldering Conference, Albuquerque, NM, August 2001
12. Radtke, R.P. ,C. Suryanarayana, and J.J. Moore, A Novel Approach to the Joining of Dissimilar Materials, ACS Annual Conference on Composites, Materials, and Structures, Cape Canaveral/Cocoa Beach, FL, January 31, 2002
13. Radtke, Robert. New High Strength and Faster Drilling,“ Thermally Stable Polycrystalline Diamond Cutters for Drill Bits,” SPE Paper Number 74515, 2002 IADC/SPE Drilling Conference, Dallas, TX, 26–28 February 2002
14. Radtke, R, J. Moore, and D. Hauser, “Joining Metals and Ceramics that Exhibit a Large Mismatch on Coefficient of Thermal Expansion,” 27th Annual Conference on Composites, Materials and Structures, 27-31 January 2003
15. Radtke, Robert, Richard Riedel, and John Hanaway, “New Faster Drilling TSP Diamond Drill Bits,” Natural Gas Technologies II Conference and Exhibition, February 8-11, 2004
16. Radtke, Robert, Richard Riedel, and John Hanaway, “New Faster Drilling Longer Life Thermally Stable Diamond Drill Bit Cutters,” Gas Tips, April 27, 2004
84
17. Radtke, Robert, “Thermally Stable Polycrystalline Diamond Cutters for Drill Bits,” SPE Paper Number 90845, 2004 SPE Annual Technical Conference and Exhibition held in Houston, TX, 27–29 October 2004.
18. Radtke, Robert, “Microwave Brazing of Ceramic Metals, 3rd International Brazing and Soldering Conference, San Antonio, TX, April 23-26, 2006
19. Radtke, R., “Microwave Brazing, An Energy Efficient Method for Joining Ceramics to Metals,” National Academy of Engineering Northeastern Regional Meeting,” The Pennsylvania State University June 15 - 16, 2006
20. R.E. Torres, G.G.W. Mustoe, L.E. Reimanis, and J.J. Moore, "Evaluation of Residual Stresses Developed in a Functionally Grade Material Using the Finite Element Technique," Processing and Fabrication of Advanced Materials IV, The Minerals, Metals & Materials Society, 1996
21. R.D. Torres, C. Suryanarayana, J.J. Moore, J. Chapa, and R.P. Radtke, “A Finite Element Modeling of Thermal Residual Stresses During Brazing of Diamond to Tungsten Carbide,” eds. A. Kumar, Y.W. Chang, J.J. Moore, and J.E. Smugeresky Surface Engineering: Science and Technology I, TMS, Warrendale, PA, 1999, pp. 497-506.
6.0 List of Acronyms and Abbreviations
1. X - radial wear - intermediate calculation
2. Y - straight line length of the chord (wear flat)
3. Angle - angle of the arc described by the chord
4. °C - degrees centigrade
5. cm. - centimeter
6. CSS - continuous self-sharpening
7. CSM - Colorado School of Mines
8. CY - calendar year
9. EDM - electrical discharge machining
10. FEA - finite element analysis
11. GE - General Electric
12. GRI - Gas Research Institute
13. JPL - Jet Propulsion Laboratory
14. mm - millimeter
85
15. NADET - National Advanced Drilling and Excavation Technology Institute
16. RPM - revolutions per minute
17. PDC - polycrystalline diamond composite
18. R - cutter radius
19. Rad. - arc angle
20. Sandia - Sandia National Laboratories
21. TII - Technology International, Inc.
22. Thk - thickness of the diamond table
23. TSP - thermally stable diamond
24. WC - tungsten carbide
7.0 SI Metric Conversion Factors
°F (°F-32)/1.8 = °C in. x 2.54 E+00 = cm in2 x 6.4516 E+00 = cm2 ft x 3.048 E-01 = m psi x 6.895 E-03 = MPa ft-lb x 7.376 E-01 = J
8.0 Acknowledgements
Technology International, Inc. employees and consultants who have conducted this work included John Hanaway, Dr. Joseph Geddes, Richard Riedel, Melody Smith, Dr, Jim Treglio, Sheila Unterreiner, and Virlen Wagner. Subcontractors included NASA Jet Propulsion Laboratory – Drs. Martin Barmatz, W. Jackson, and Nasser Budraa; the Colorado School of Mines – Drs. John Moore, C. Suryanarayana and Earl Hixon. Technical support was provided by DOE Sandia National Laboratories – David Glowka, Michael Prairie, David Raymond, and David Adams. We also wish to thank GE Superabrasives (now Diamond Innovations, Inc.) –David Briggs. Recognition is expressed for the support by the Gas Research Institute (now the Gas Technology Institute) - Brian Gahan and Mike Weiss. The project would not have been successful without the support of industry partners.
86

87