Embed Size (px)
Citation preview
[Type text]
New Jersey Diabetes Action Plan Report April 13, 2016
Report to the Governor and the New Jersey Legislature on diabetes-related efforts in the
Department of Health, Department of Human Services, and Department of Children and
Families.

1
Diabetes Action Plan Committee Members
The following people participated in the preparation of this report.
New Jersey Department of Health (DOH) Division of Family Health Services, Community Health and Wellness Unit Melita J. Jordan, CNM, MSN, APRN C, CPM, Senior Executive Director LorieAnn Wilkerson-Leconte, MPH, Diabetes Prevention and Control Program Coordinator Serita M. Reels, MPH, MCHES, Public Health Program Prevention Specialist Melissa Santorelli, PhD, MPH, Research Scientist New Jersey Department of Human Services Division of Medical Assistance and Health Services (DMAHS) Thomas Lind, MD, FAAP, DMAHS Medical Director Margaret Springer, RN, MSN, APN-C, Healthcare Administrator JoAnn Baxter, RN, AAS, Regional Staff Nurse Patric Mac, Program Specialist Vanessa Wills, RN, BSN, Nursing Consultant New Jersey Department of Children and Families (DCF) Charmaine L. Thomas, MSW, Assistant Commissioner, Family and Community Partnerships Mollie A. Brodsky-Greene, MA, Director, Clinical Services Sunday Gustin, RN, MPH, Administrator, Early Childhood Services Arnesha Roper-Lewis, County Services Specialist Marilyn Panella, RN, MAS, Quality Assurance Specialist Rutgers University School of Nursing Francois-Xavior Bagnoud Center Mary Weglarz DNP, RN, APN, CPNP, CPMHS, Assistant Director, Child Health Family Nurse Program National Association of Chronic Disease Directors Marti Macchi, MEd, MPH, Senior Consultant for Diabetes

2
Table of Contents
Executive Summary ....................................................................................................................................... 5
Introduction .................................................................................................................................................. 8
Understanding Diabetes ............................................................................................................................. 11
Scope of Diabetes Burden in New Jersey.................................................................................................... 17
Current Diabetes Efforts ............................................................................................................................. 38
Proposed Recommendations ...................................................................................................................... 47
Next Steps ................................................................................................................................................... 48
References .................................................................................................................................................. 49
Technical Notes ........................................................................................................................................... 52
Appendix A (N.J.S.A. §26:2-142.1) .............................................................................................................. 54

3
List of Figures: Figure 1. Model for Community Change ......................................................................................... 9 Figure 2. Diabetes Prevalence Estimates for NJ Adults, BRFSS .................................................... 17 Figure 3. Diabetes Prevalence Estimates for NJ Adults by Gender, BRFSS 2013 .......................... 17 Figure 4. Diabetes Prevalence Estimates for NJ Adults by Age, BRFSS 2013................................ 18 Figure 5. Diabetes Prevalence Estimates for NJ Adults by Race/Ethnicity, BRFSS 2013 .............. 18 Figure 6. Diabetes Prevalence Estimates for NJ Adults by Annual Household Income, BRFSS 2013 ..................................................................................................................... 19 Figure 7. Diabetes Prevalence Estimates for NJ Adults by Educational Attainment, BRFSS 2013 .................................................................................................................... 19 Figure 8. Prevalence of Diabetes among NJ FamilyCare Members 20 Years and Older
by Gender, 2013………………………………………………….…………………………….………………………21 Figure 9. New Jersey Age-Adjusted Diabetes Death Rate by Race/Ethnicity, 2011 ..................... 33
List of Tables: Table 1. Adult Diabetes Prevalence Estimates by NJ County, BRFSS 2011-2013 ......................... 20 Table 2. Prevalence of Diabetes among NJ FamilyCare Members 20 Years and Older,
by County, 2013………………………………………………………………………………………………………….22 Table 3. Prevalence of Diabetes among NJ FamilyCare Members Age 20 and Younger
by County, 2013………………………………………………………………………………………………………….23 Table 4. Preventative Care Practices among Adults with Diabetes – NJ and United States,
BRFSS 2013 ..................................................................................................................... 24 Table 5. Vaginal Deliveries and C-Sections Performed by Maternal Diabetes Diagnosis, 2013 ... 25 Table 6. Emergency Department (ED) Visits for Diabetes among NJ Residents by Diagnosis, 2013 ......................................................................................................... 26 Table 7. ED Visits for Diabetes among NJ Residents by County of Residence, 2013 .................... 27 Table 8. ED Visits for Chronic Conditions among NJ Residents by Diagnosis, 2013 ..................... 28 Table 9. ED Visits for Chronic Conditions among NJ Residents with and without Diabetes,
2013 ................................................................................................................................. 28 Table 10. Hospitalizations for Diabetes among NJ Residents by Diagnosis, 2013 ....................... 29 Table 11. Hospitalizations for Diabetes among NJ Residents by County of Residence,
2013 ................................................................................................................................. 30 Table 12. Hospitalizations for Select Chronic Conditions among NJ Residents by Diagnosis,
2013 ................................................................................................................................. 31 Table 13. Diabetes Deaths among NJ Residents, 2011 ................................................................. 32 Table 14. Total Cost for Diabetes and Related Complications for NJ FamilyCare Members, 2013 ............................................................................................................. 34 Table 15. Cost of Pre-existing Diabetes and Gestational Diabetes Compared to All
Pregnancies for NJ FamilyCare Members, 2013………………………………………………………..35 Table 16. Total Cost of Diabetes among NJ FamilyCare Members by County and Per
Member, 2013 ………………………………………………………………………………………………………..36

4
Table 17. Comparison of Overall and Per Member Diabetes Costs and Other Chronic Disease Costs among NJ Family Members, 2013……………………………………………………………………37 Table 18. NJ FamilyCare Cost for Diabetes and Other Common Chronic Disease, 2013 ............. 42 Table 19. DCF Child Health Unit Program Serving Children in Out-of-Home Placement, 2015 ... 44 Table 20. DCF Family and Community Partnerships and Nurse Family Partnership Programs,
2014 .............................................................................................................................. 45

5
EXECUTIVE SUMMARY
Diabetes mellitus is a chronic disease in which blood glucose levels are above normal. The
pancreas makes a hormone called insulin to help glucose get into the cells of our bodies. When
diabetes occurs, the body either doesn't make enough insulin, (known as Type 1 diabetes) or
can't use its own insulin as well as it should (known as Type 2 diabetes). Diabetes mellitus is a
leading cause of death in New Jersey, ranking sixth among the most common causes and
accounting for more than 2,200 deaths in 2011, the most recent year for this data (New Jersey
State Health Assessment Data, 2015). An estimated 9.2% of New Jersey adults (632,785
residents) have diabetes mellitus (New Jersey Behavioral Risk Factor Surveillance System, 2013).
From 1996 to 2010, the estimated rate of new adult diabetes mellitus cases more than doubled
in New Jersey (New Jersey Behavioral Risk Factor Surveillance System, 2010). Both type 1 and 2
diabetes are associated with long-term complications that significantly impact quality of life.
Individuals with diabetes mellitus are at increased risk for serious health complications, such as
lower limb amputations, blindness, kidney failure, and cardiovascular disease. Furthermore, the
number of people with diagnosed type 2 diabetes is rapidly increasing, having tripled in the
United States over the last 30 years (Centers for Disease Control and Prevention (CDC), 2013).
The rise of type 2 diabetes is linked to the growing obesity epidemic. As of 2013, 26.3% of New
Jersey adults were obese (Behavioral Risk Factor Surveillance System, 2013). It is estimated that
almost 50% of overweight or obese adults have prediabetes, and about 25% of Americans with
prediabetes are expected to develop diabetes within three to five years of a prediabetes
diagnosis (New Jersey State Report, Providing Access to Healthy Solutions (PATHS), 2014). As of
2011, data from the Pediatric Nutrition Surveillance System showed 14.2% of low-income
children under five in New Jersey were obese. These obese children are more likely to grow into
overweight teens and adults who will be at increased risk for a chronic condition like diabetes in
the future.
According to the Study on the Economic Cost of Diabetes, the nationwide total costs of
diagnosed diabetes mellitus have risen from $174 billion in 2007 to $245 billion in 2012, which
included $176 billion in direct medical costs and $69 billion in reduced productivity (American

6
Diabetes Association, 2013). By 2025, the total number of people with diabetes mellitus
(diagnosed and undiagnosed) in New Jersey is projected to be 1,500,400 individuals, and the
cost to the State is projected to reach $14.5 billion, including lost productivity (Institute for
Alternative Futures, 2011).
This report demonstrates that diabetes mellitus is a rapidly growing and costly disease in New
Jersey. Consider the following highlights:
An estimated 9.2% of New Jersey adults (632,785 residents) have diabetes mellitus (NJ
BRFSS, 2013).
Adult diabetes mellitus prevalence is highest in Salem (11.6%), Cumberland (11.6%), and
Cape May (11.4%) counties (NJ BRFSS, 2011-2013).
The proportion of New Jersey adults with diabetes mellitus who have ever taken a self-
management class is about 42.3%, which is below the national estimate of 54.2% (NJ
BRFSS and United States BRFSS, 2013). Diabetes self-management education (DSME)
helps people gain the knowledge, skills, and the ability necessary for diabetes self-care.
Among pregnant NJ FamilyCare recipients, the highest total paid per person in 2013 was
for women with pre-existing diabetes at $26,473, followed by $24,175 for women who
had gestational diabetes (NJ FamilyCare claims data, 2013).
NJ FamilyCare managed care and fee-for-service members with diabetes mellitus incur
significant healthcare costs. In 2013, the total cost of diabetes mellitus for adult and
youth NJ FamilyCare and fee-for-service members was $161,420,327 (NJ FamilyCare
claims data, 2013).
This report also includes findings from the 2014 New Jersey State Report, Providing Access to
Healthy Solutions (PATHS): An Analysis of New Jersey’s Opportunities to Enhance Prevention and
Management of Type 2 Diabetes, prepared by the Center for Health Law and Policy Innovation
of Harvard Law School. The PATHS report was funded through Together on Diabetes™, the
flagship philanthropic program of the Bristol-Myers Squibb Foundation.
Diabetes Action Plan Committee Proposed Recommendations
1. Encourage providers to establish, maintain, and implement as part of normal operating
procedures a verifiable system to:
Screen patients with risk factors for prediabetes and diabetes according to the
latest clinical guidelines set forth by the American Diabetes Association;

7
Encourage immediate communication regarding the results and implications of
said screenings with patients as part of the patient’s electronic medical record;
and
Educate patients identified as prediabetic about the potential risks to their health
and available resources for further education.
2. Communicate the results and implications of diabetic screenings with patients as part of
the medical record.
Educate patients identified as prediabetic about the potential risks and available
resources.
Refer at-risk individuals to appropriate prevention and treatment programs.
3. Encourage evidence-based diabetes self-management education, training, and services
for patients diagnosed with type 2 diabetes and gestational diabetes.
4. Encourage evidence-based diabetes prevention education and CDC-recognized lifestyle
change programs for the primary prevention of type 2 diabetes among patients
diagnosed with prediabetes or at those at high risk for type 2 diabetes.
5. Work to reduce the cost of diabetes mellitus in the community by providing education
for families and providers, and by specifically targeting diabetics over the age of 65.
8
INTRODUCTION
Purpose of the Report
This report is generated in accordance with a statute passed by the New Jersey Legislature and
signed by the Governor. The statute, N.J.S.A. §26:2-142.1, requires three State agencies – the
New Jersey Department of Health (DOH), the New Jersey Department of Children and Families
(DCF), and the New Jersey Department of Human Services (DHS) – to collaborate to develop a
biennial report on the impact of diabetes mellitus in New Jersey, with a set of actionable items
to be considered by the Legislature.
Report Development
The Diabetes Action Plan Committee (DAPC) consisted of key individuals designated by the three
State agencies to participate in the development of the report. The DAPC used the Model for
Community Change, created by the Workgroup for Community Health and Development at the
University of Kansas, as a conceptual framework to guide the process (Figure 1). The framework
outlines a dynamic process for facilitating community change and improvement. In addition, the
DAPC used a community engagement and participatory process with principles that included: 1)
building on collective strengths and shared resources, 2) facilitating partnership and capacity
building throughout the process, and 3) transparency. To that end, it was recognized that each
of the three State agencies brought to the table assets, strengths, expertise, and resources that
could be leveraged to develop a comprehensive report that would ultimately improve health
outcomes for those living with or at risk for diabetes mellitus in New Jersey.
9
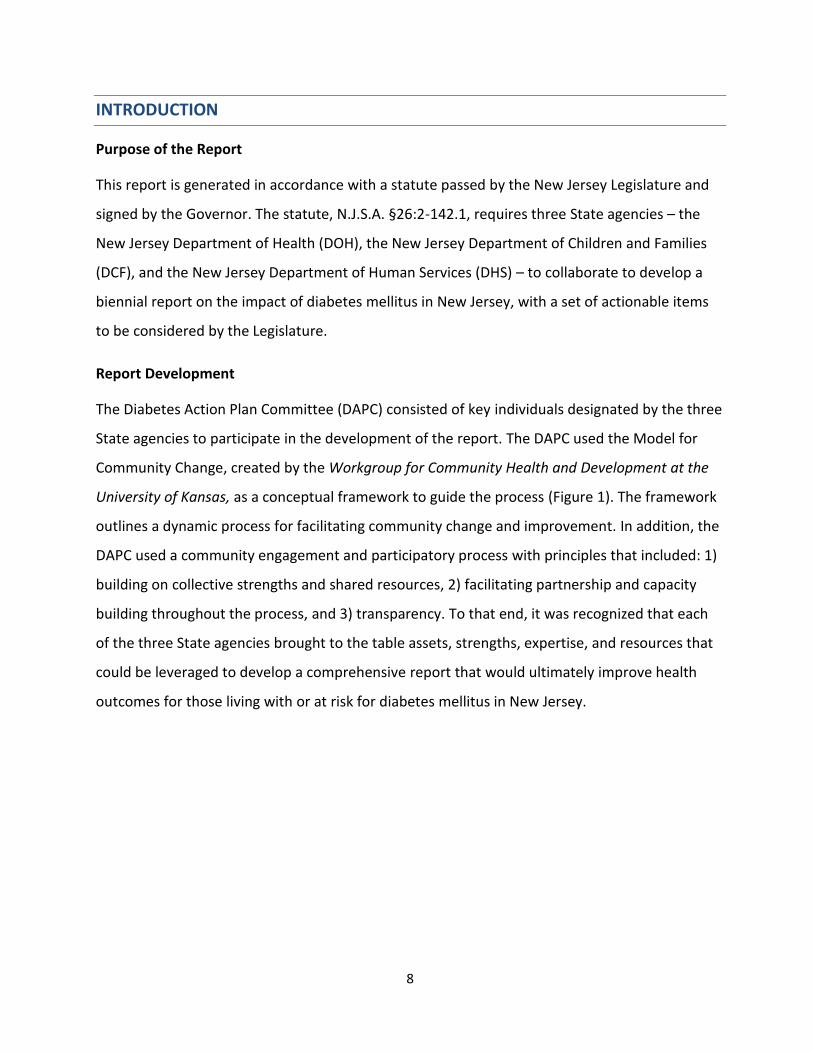
Figure 1: Model for Community Change (Developed by the Workgroup for Community Health
and Development at the University of Kansas)
6 Phases for Building a Healthier Community
Collaborative Planning Utilization of community-level indicators to measure and document the extent of problems at the local level.
Development of Action Plan Identification of the specific actions and/or strategies to address the issues.
Community Action &
Intervention
Execution of actions and/or strategies outlined in the action plan.
Community & System Changes Development of a new program (or modifying an existing one), to bring about a change in policy.
Risk and Protective Factors Widespread System Change
Changes to the environment in which a person behaves and that greatly impacts risk and protective factors.
Improvements in Outcomes Reducing the risk factors (and enhancing the protective factors) for the issue being addressed is the ultimate goal of collaborative partnerships.
The Community Toolbox. (2014). Workgroup for Community Health and Development Model for Building Healthier Communities. Retrieved from
http://ctb.ku.edu/en/table-of-contents/overview/model-for-community-change-and-improvement/building-capacity/main.
The first DAPC meeting was held to construct the foundation for the implementation of the
Diabetes Action Plan (DAP). Members gained an understanding of the genesis and purpose of
the legislation. The DAPC discussed the framework for collaborative partnerships and model for

10
reducing the burden of diabetes in New Jersey. The committee also established partnership
roles and responsibilities and identified key data indicators for data analysis. From that meeting,
the group established a project timeline and work plan.
Leveraging an established partnership with the National Association of Chronic Disease Directors
(NACDD), the Department of Health invited the organization to meet with the DAPC to help
shape the preliminary work plan. NACDD works with states to assist them through the process of
developing a DAP. NACDD presented DAP activities from the national perspective, and shared
experiences from other states that have implemented similar legislation. Evidence-based
interventions and strategies were provided for consideration by the DAPC.
Subsequent meetings focused on each agency’s priorities for addressing diabetes mellitus, data
collection and analysis, and the collaborative development of actionable items to be considered
by the Legislature.
This report describes the work of the DAPC that was completed in a spirit of cooperation and
mutual respect, and could not have been accomplished without the active participation of all
members.
11
UNDERSTANDING DIABETES
Diabetes Trends
Diabetes mellitus is a leading cause of death in New Jersey, ranking sixth among the most
common causes and accounting for more than 2,200 deaths in 2011, the most recent year for
this data (New Jersey State Health Assessment Data, 2015). An estimated 9.2% New Jersey
adults (632,785 residents) have diabetes (New Jersey Behavioral Risk Factor Surveillance System,
2013). From 1996 to 2010, the estimated rate of new adult diabetes mellitus cases more than
doubled in New Jersey (New Jersey Behavioral Risk Factor Surveillance System, 2010). According
to the CDC Infographics on Diabetes: A Snapshot: Diabetes In The United States, diabetes
mellitus affects 9.3% of the US population, including 21 million with diagnosed diabetes mellitus
and another 8.1 million who remain undiagnosed. An additional 37% of U.S. adults, or 86 million
(more than one in three adults) have prediabetes and are at an increased risk for developing
type 2 diabetes, heart disease, and stroke.
Diabetes Risk Factors
Social determinants, such as income, education, housing, and access to health care play a critical
role in the development and progression of type 2 diabetes (Hills JO, Galloway JM, Goley A, et al,
2013). Individuals with lower incomes and education are two to four times more likely to
develop diabetes (Hill J, Nielsen M, Fox M, 2013). In New Jersey, diabetes mellitus prevalence is
higher among adults with household incomes below $50,000, and adults with less than a high
school education (New Jersey Behavioral Risk Factor Surveillance System, 2013).
Over 26% of New Jersey residents aged 65 and older have diabetes mellitus (CDC, 2014).
Although less prevalent than type 1 diabetes, type 2 is increasing among children, adolescents
and younger adults (CDC, 2014). In New Jersey, 14.2% of low-income children under the age of
five are obese (Pediatric Nutrition Surveillance System, 2011). Nearly one out of four (24.7%)
children aged 10-17 is overweight or obese (National Survey of Children’s Health 2011-2012).
Obese children are more likely to grow into adults who will be at an increased risk for a chronic
health condition like diabetes in the future.

12
The rise of type 2 diabetes in the last 30 years parallels the increase in obesity, suggesting that
weight plays a major role in the development of the disease. With the increased consumption of
processed foods that are high in carbohydrates and sugars, supersized portions, and sedentary
lifestyles, the Body Mass Index (BMI) of adults and children have been expanding over the years.
More than one in three (35.3%) New Jersey adults eat fruits less than once a day and more than
one in five (21.4%) eat vegetables less than once a day (New Jersey Behavioral Risk Factor
Survey, 2013). Only 19% of New Jersey high school students eat the recommended servings of
five or more fruits and vegetables per day (New Jersey Student Health Survey, 2013). In New
Jersey, only 21.6% of adults (New Jersey Behavioral Risk Factor Survey, 2013) and 49% of high
school students meet the national physical activity guideline for their age (New Jersey Student
Health Survey, 2013).
Complications and Costs
Individuals with diabetes mellitus are at an increased risk for serious health complications such
as lower limb amputations, blindness, kidney failure, and cardiovascular disease (CDC, 2015).
Poorly controlled diabetes can complicate pregnancy resulting in preterm birth, preeclampsia,
intrauterine growth restriction, and congenital anomalies (CDC, 2015).
In 2012, the total cost of diabetes mellitus in the United States was $245 billion, which included
$176 billion in direct cost and $69 billion in reduced productivity (American Diabetes
Association, 2013). The total annual diabetes mellitus cost for New Jersey in 2010 was estimated
to have been $9.3 billion, of which $6.6 billion was for medical costs and $2.7 billion for
nonmedical costs (Institute for Alternative Futures, 2011). By 2025, the total number of people
affected by diabetes mellitus (diagnosed and undiagnosed) in New Jersey is projected to be
1,500,400 individuals, and its cost to the State is projected to reach $14.5 billion, including lost
productivity (Institute for Alternative Futures, 2011). Currently, one in five healthcare dollars is
spent on caring for someone diagnosed with diabetes mellitus (Kaiser Commission on Medicaid
and Uninsured, 2012).

13
Diabetes Control & Management
The nation’s leading healthcare experts recommend a combination of clinical and community-
based interventions to address the growing prevalence of diabetes and prediabetes.
The Guide to Community Preventive Services (Guide) is a resource to help public health
professionals choose programs and policies to improve health and prevent disease. Developed
by the Community Preventive Services Task Force, an independent group established by the U.S.
Department of Health and Human Services, the Guide offers evidence-based recommendations
for effective public health strategies. Strategies and interventions recommended for managing
diabetes mellitus include:
ensuring that persons with diabetes or who are at risk for diabetes get the care needed
from healthcare providers;
teaching people self-care practices to prevent complications from diabetes, and;
helping people change their lifestyles to prevent type 2 diabetes.
The Guide recommends the following strategies for effectively managing diabetes mellitus: 1)
diabetes disease management, 2) diabetes care management, 3) diabetes self-management
education (DSME), and 4) combined diet and physical activity promotion programs.
1. Diabetes Disease Management
Disease management is a system of coordinated healthcare interventions across the
spectrum of the disease and tailored communications to empower individuals to manage
their diabetes and prevent complications. Disease management is designed to improve
the quality of clinical care for populations with the greatest diabetes burden and risk in
order to improve clinical outcomes, such as hemoglobin A1C, blood pressure, and
cholesterol. The Community Preventive Services Task Force recommends diabetes
disease management, noting strong evidence of effectiveness in improving glycemic
control, providing monitoring of glycated hemoglobin (GHb), and screening for diabetic
retinopathy (The Guide to Community Preventive Services, 2015).

14
The American Diabetes Association, Standards of Medical Care in Diabetes, 2015,
provides specific medical guidelines that healthcare providers should follow when caring
for a person with diabetes mellitus. They are as follows:
Measure blood pressure at every visit;
Conduct comprehensive foot exams and risk assessments at every office visit, or
at least annually;
Perform an hemoglobin A1C test at least twice a year in patients who have stable
glycemic control;
Perform an A1C test quarterly in patients whose therapy has changed or who are
not meeting glycemic goals;
Assess kidney function through urine and renal function blood tests at least once
a year;
Test blood lipids (fats)—total cholesterol; LDL or low-density lipoprotein (“bad”
cholesterol); HDL or high-density lipoprotein (“good” cholesterol) and
triglycerides at least once a year;
Perform a dilated eye exam once a year; and
Provide an annual flu shot.
2. Diabetes Care Management
Care management is a set of patient-centered, goal-oriented, culturally relevant and
logical steps to assure that a patient receives needed services in a supportive, results-
driven, efficient, timely and cost-effective manner. Care management emphasizes
prevention, continuity of care and coordination of care, which advocates for, and links
patients to, services across providers and settings. At a minimum, care management
functions include, but are not limited to:
Early identification of patients who have or may have special needs;
Assessment of a patient's risk factors;
Development of a plan of care;
Referrals and assistance to ensure timely access to providers;

15
Coordination of care actively linking the patient to providers; medical services;
and residential, social, behavioral, and other support services where needed;
Monitoring blood glucose levels;
Continuity of care; and
Follow-up and documentation.
Care management is driven by quality-based outcomes such as: improved/maintained
functional status, improved/maintained clinical status, enhanced quality of life, patient
satisfaction, adherence to the care plan, improved patient safety, cost savings, and
patient autonomy (MCO Care Management Work Book, 2015).
3. Diabetes Self-Management Education (DSME)
Diabetes Self-Management Education helps people gain the knowledge, skills, and the
ability necessary for diabetes self-care. DSME supports informed decision-making,
problem-solving, and active collaboration with the healthcare team. DSME held in
community gathering places has shown to be an effective strategy for improving
glycemic control, health status, and quality of life for adults with type 2 diabetes (The
Guide to Community Preventive Services, 2015).
4. Combined Diet and Physical Activity Promotion Programs to Prevent Type 2 Diabetes
Among People at Increased Risk
According to the Guide, combined diet and physical activity promotion programs have
proven to be effective in reducing new onset diabetes. These programs have
demonstrated that they can improve diabetes and cardiovascular disease risk factors,
such as obesity, high blood glucose, high blood pressure, and abnormal lipid profile (The
Guide to Community Preventive Services, 2015). It is estimated that 15% to 30% of
people with prediabetes will go on to develop type 2 diabetes within five years (The
Guide to Community Preventive Services, 2015). Combined diet and physical activity
promotion programs have been successfully implemented by several national and state-
wide organizations, the majority of which are part of the National Diabetes Prevention
Program (DPP). The CDC-led DPP is a one-year evidence-based lifestyle change program
16
that helps people with prediabetes (or high risk for type 2 diabetes) prevent or delay the
onset of type 2 diabetes. Lifestyle Coaches work with participants in a group setting to
provide education on nutrition, physical fitness, and skills-building instruction during 16
core sessions (usually one per week) and six post-core sessions (one per month). The
program has proven to help people make achievable and realistic lifestyle changes and
cut their risk of developing type 2 diabetes by 58% (National Diabetes Prevention
Program, 2015).

17
SCOPE OF DIABETES BURDEN IN NEW JERSEY
Figure 2: Diabetes Prevalence Estimates for NJ Adults, BRFSS
6.8%7.7% 7.5%
9.2%8.4% 8.7% 9.2% 8.8% 9.3% 9.2%
0.0%
2.0%
4.0%
6.0%
8.0%
10.0%
12.0%
14.0%
2004 2005 2006 2007 2008 2009 2010 *2011 *2012 *2013
Source: Behavioral Risk Factor Surveillance System data was analyzed by the New Jersey Department of Health, Community Health and Wellness Unit.
2011-2013 not comparable to previous years due to changes in survey methodology.
Key Points:
An estimated 9.2% of New Jersey adults have diabetes (632,785 residents).
Diabetes prevalence has been increasing over time.
Figure 3: Diabetes Prevalence Estimates for NJ Adults by Gender, 2013 BRFSS
8.3%
10.2%
0.0%
2.0%
4.0%
6.0%
8.0%
10.0%
12.0%
Female Male
Source: Behavioral Risk Factor Surveillance System data was analyzed by the New Jersey Department of Health, Community Health and Wellness Unit.
Key Point:
Diabetes prevalence is higher for male adults as compared to female adults.

18
Figure 4: Diabetes Prevalence Estimates for NJ Adults by Age, 2013 BRFSS
1.6%3.2%
9.6%
14.0%
21.4%
0.0%
5.0%
10.0%
15.0%
20.0%
25.0%
25-34 35-44 45-54 55-64 65+
Source: Behavioral Risk Factor Surveillance System data was analyzed by the New Jersey Department of Health, Community Health and Wellness Unit.
Estimates are not available for adults 18-24 due to a low survey sample size.
Key Point:
Diabetes prevalence increases with age.
Figure 5: Diabetes Prevalence Estimates for NJ Adults by Race/Ethnicity, 2013 BRFSS
8.9%
11.9%
8.8%
0.0%
2.0%
4.0%
6.0%
8.0%
10.0%
12.0%
14.0%
White Black Hispanic
Source: Behavioral Risk Factor Surveillance System data was analyzed by the New Jersey Department of Health, Community Health and Wellness Unit.
Key Point:
Diabetes prevalence is higher for black adults as compared to white and Hispanic adults.

19
Figure 6: Diabetes Prevalence Estimates for NJ Adults by Annual Household Income, 2013 BRFSS
Source: Behavioral Risk Factor Surveillance System data was analyzed by the New Jersey Department of Health,
Community Health and Wellness Unit.
Key Point:
Diabetes prevalence is higher among adults with annual household incomes below $50,000.
Figure 7: Diabetes Prevalence Estimates for NJ Adults by Educational Attainment, 2013 BRFSS
12.0%
10.5%9.3%
6.9%
0.0%
2.0%
4.0%
6.0%
8.0%
10.0%
12.0%
14.0%
Less than H.S. H.S. or G.E.D. Some post-H.S. College Graduate
Source: Behavioral Risk Factor Surveillance System data was analyzed by the New Jersey Department of Health, Community Health and Wellness Unit.
Key Point:
Diabetes prevalence is higher among adults with lower levels of education.
10.5%
13.6%
10.4% 10.7%
7.5%
0.0%
2.0%
4.0%
6.0%
8.0%
10.0%
12.0%
14.0%
16.0%
< $15K $15K to < $25K $25K to < $35K $35K to < $50K $50K+

20
Table 1: Adult Diabetes Prevalence Estimates by NJ County, 2011-2013 BRFSS County Percentage Number
ATLANTIC 10.6% 21,761 BERGEN 7.6% 52,747
BURLINGTON 9.5% 32,387 CAMDEN 10.0% 38,113
CAPE MAY 11.4% 8,747 CUMBERLAND 11.6% 13,525
ESSEX 10.2% 58,341 GLOUCESTER 10.9% 23,225
HUDSON 7.4% 37,536 HUNTERDON 6.4% 6,060
MERCER 9.6% 26,282 MIDDLESEX 9.5% 58,321
MONMOUTH 8.8% 41,276 MORRIS 7.6% 27,963 OCEAN 10.9% 47,249
PASSAIC 9.0% 32,922 SALEM 11.6% 5,701
SOMERSET 8.3% 20,112 SUSSEX 8.2% 9,038 UNION 7.9% 31,495
WARREN 8.7% 7,006 Data Source: Centers for Disease Control and Prevention. Diabetes Data and Statistics. Accessed from
http://www.cdc.gov/diabetes/atlas/countydata/atlas.html?filter=filter4,New%20Jersey&indicator=i3 on March 24, 2015.
Key Point:
Adult diabetes prevalence is highest in the southern counties of Salem (11.6%), Cumberland (11.6%), and Cape May (11.4%). The number of adults with diabetes is highest in Essex (58,341), Middlesex (58,321), Bergen (52,747), and Ocean (47,249) counties.

21
Prevalence of Diabetes Among NJ FamilyCare Members in New Jersey
Figure 8: Prevalence of Diabetes among NJ FamilyCare Members 20 Years and Older by Gender, 2013
Source: Actual Cost-Paid fee-for-service claims and managed care encounter for services provided to NJ FamilyCare eligible
individuals between 1/1/2013 and 12/31/2013.
Key Point:
Diabetes prevalence is higher for female compared to male adult NJ FamilyCare recipients;
however, among the general population, diabetes prevalence is lower for females. See
Figure 3: Diabetes Prevalence Estimates for NJ Adults by Gender, 2013 BRFSS.

22
Table 2: Prevalence of Diabetes among NJ FamilyCare Members 20 Years and Older, by County, 2013
Females Males
County Members Percent Members Percent ATLANTIC 1,663 9.8% 1,141 6.8%
BERGEN 3,136 18.6% 1,914 11.3%
BURLINGTON 1,520 9.0% 1,063 6.3%
CAMDEN 4,013 23.8% 2,545 15.1%
CAPE MAY 435 2.6% 367 2.2%
CUMBERLAND 1,410 8.4% 829 4.9%
ESSEX 8,183 48.4% 4,415 26.1%
GLOUCESTER 1,071 6.3% 687 4.1%
HUDSON 7,550 44.7% 4,298 25.4%
HUNTERDON 186 1.1% 157 0.9% MERCER 1,978 11.7% 1,268 7.5%
MIDDLESEX 3,790 22.4% 2,471 14.6%
MONMOUTH 1,881 11.1% 1,150 6.8%
MORRIS 1,122 6.6% 846 5.0%
OCEAN 1,714 10.2% 1,399 8.3%
PASSAIC 5,417 32.1% 3,028 17.9%
SALEM 457 2.7% 264 1.6%
SOMERSET 805 4.8% 511 3.0%
SUSSEX 313 1.9% 246 1.5%
UNION 3,371 20.0% 1,826 10.8% WARREN 391 2.3% 208 1.2%
Total 50,406 16.9% 30,633 10.3%
Source: Actual Cost-Paid fee-for-service claims and managed care encounter for services provided to NJ FamilyCare eligible individuals between 1/1/2013 and 12/31/2013.
Key Point:
Diabetes prevalence among female and male adult NJ FamilyCare recipients is highest in Essex (48.4% for females, 26.1% for males), Hudson (44.7% for females, 25.4% for males), and Passaic (32.1% females, 17.9% males) counties.

23
Table 3: Prevalence of Diabetes among NJ FamilyCare Members Age 20 and Younger by County, 2013
County Members Percentages
ATLANTIC 103 0.6% BERGEN 159 0.9% BURLINGTON 81 0.5% CAMDEN 187 1.1% CAPE MAY 23 0.1% CUMBERLAND 66 0.4% ESSEX 379 2.2% GLOUCESTER 68 0.4% HUDSON 288 1.7% HUNTERDON 11 0.1% MERCER 117 0.7% MIDDLESEX 193 1.1% MONMOUTH 122 0.7% MORRIS 53 0.3% OCEAN 153 0.9% PASSAIC 292 1.7% SALEM 22 0.1% SOMERSET 50 0.3% SUSSEX 19 0.1% UNION 361 2.1% WARREN 19 0.1% Total 2,766 0.7%
Source: Actual Cost-Paid fee-for-service claims and managed care encounter for services provided to NJ FamilyCare eligible individuals between 1/1/2013 and 12/31/2013.
*For information about the application of the business rule, refer to technical notes # 9.
Key Point:
Diabetes prevalence among youth NJ FamilyCare recipients is highest in Essex (2.2%), Union (2.1%), Passaic (1.7%), and Hudson (1.7%) counties. Overall, the prevalence of diabetes among NJ FamilyCare youth members below 20 years of age is low.

24
Diabetes Preventative Care Practices
Table 4: Preventative Care Practices among Adults with Diabetes, 2013 BRFSS NJ and United States
Preventative Care Practice
New Jersey
United States*
Had Professional Foot Exam in Prior Year
71.0% 72.9%
Had Annual Dilated Eye Exam in Prior Year
69.4% 68.5%
Had 2+ A1C Tests in Prior Year 73.2% 71.7% Performs Daily Self Foot Exams 61.3% 63.1% Performs Daily Self Blood Glucose Monitoring
58.4% 63.7%
Had Flu Vaccine in Prior Year 53.5% 55.5% Ever Had Pneumonia Shot 51.8% 59.2% Ever took a Self-Management Class 42.3% 54.2%
Source: Behavioral Risk Factor Surveillance System data was analyzed by the New Jersey Department of Health, Community Health and Wellness Unit.
Thirty-nine States participated in the survey module.
Key Points
The proportion of New Jersey adults with diabetes who have taken a self-management class
is 42.3%, which is below the national estimate of 54.2%.
It is unknown whether this percentage of adults attended an evidence-based DSME such as
the American Diabetes Association-recognized program, the American Association of
Diabetes Educators-accredited program, or the Stanford Licensed Diabetes Self-Management
Program.
In 2012, about 3.5% of people diagnosed with diabetes indicated that they participated in
these programs.
Diabetes Awareness
According to national estimates, about 37% of adults 20+ years have prediabetes, while only
about 7% of New Jersey adults are aware of ever having the condition (2012 BRFSS). DOH is
monitoring prediabetes awareness using BRFSS to observe trends over time.
Diabetes Complications
An estimated 137,036 adults with diabetes were told by a doctor that the disease affected
their eyes or that they had retinopathy, representing 22.0% of New Jersey adults with
diabetes (BRFSS, 2013).
An estimated 2,749 lower limb amputations related to diabetes were performed among
residents at general acute care hospitals in New Jersey (Uniform Billing Data, 2013).

25
An estimated 1,408 new cases of end-stage renal disease were diagnosed among New Jersey
adults with diabetes (Quality Insights Renal Network 3 Annual Report, 2013).
Diabetes and Pregnancy
Approximately 11.2% of New Jersey women 18-44 years who had a live birth were diagnosed
with gestational diabetes (PRAMS, 2009-2011).
Approximately 2.8% of New Jersey women 18-44 years who had a live birth were diagnosed
with type 1 or type 2 diabetes prior to pregnancy (PRAMS, 2009-2011).
Table 5: Vaginal Deliveries and C-Sections Performed by Maternal Diabetes Diagnosis, 2013 Vaginal Delivery Cesarean Section Number Percent Number Percent
With Gestational Diabetes 3,067 49.6% 3,113 50.4% With Diabetes Complicating Pregnancy 269 33.4% 537 66.6% All Maternal Delivery Stays 59,076 62.1% 36,122 37.9%
Source: The data source for hospitalization and ED visits is the 2013 New Jersey UB data file, analyzed by the New Jersey Department of Health, Community Health and Wellness Unit.
Excludes deliveries that do not take place in a New Jersey general acute care hospital.
Among 2013 maternal delivery hospital stays, women with gestational diabetes and women
with pre-existing diabetes that complicated pregnancy both had a higher proportion of
cesarean section births relative to all maternal delivery stays.

26
Diabetes Emergency Department Visits
Table 6: Emergency Department (ED) Visits for Diabetes among NJ Residents by Diagnosis, 2013
Primary Diabetes ICD-9-CM Diagnosis Code Number Percent
(250.0) Without mention of complication 8,621 57.9%
(250.1) Ketoacidosis 395 2.7%
(250.2) Hyperosmolarity 100 0.7%
(250.3) With other coma 19 0.1%
(250.4) With renal manifestations 33 0.2%
(250.5) With ophthalmic manifestations 71 0.5%
(250.6) With neurological manifestations 935 6.3%
(250.7) With peripheral circulatory disorders
57 0.4%
(250.8) With hypoglycemic manifestations
4,366 29.3%
(250.9) Unspecified complications 301 2.0%
14,898 100%
Source: The data source for hospitalization and ED visits is the 2013 New Jersey UB data file, analyzed by the New Jersey Department of Health,
Community Health and Wellness Unit. Excludes out of state ED visits and visits that result in hospital admission.
Key Point:
In 2013, the most common diagnosis reported for diabetes ED visits was diabetes without
mention of complication (57.9%) followed by diabetes with hypoglycemic manifestations
(29.3%).
27
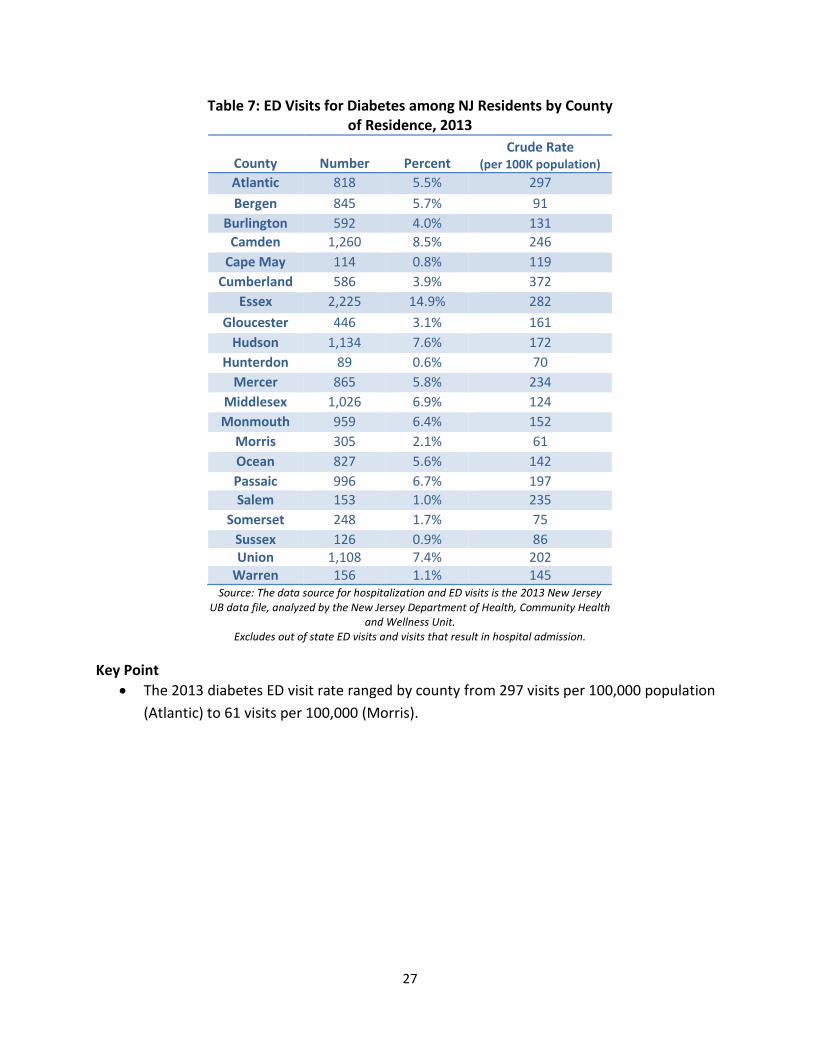
Table 7: ED Visits for Diabetes among NJ Residents by County of Residence, 2013
County Number Percent Crude Rate
(per 100K population)
Atlantic 818 5.5% 297
Bergen 845 5.7% 91
Burlington 592 4.0% 131
Camden 1,260 8.5% 246
Cape May 114 0.8% 119
Cumberland 586 3.9% 372
Essex 2,225 14.9% 282
Gloucester 446 3.1% 161
Hudson 1,134 7.6% 172
Hunterdon 89 0.6% 70
Mercer 865 5.8% 234
Middlesex 1,026 6.9% 124
Monmouth 959 6.4% 152
Morris 305 2.1% 61
Ocean 827 5.6% 142
Passaic 996 6.7% 197
Salem 153 1.0% 235
Somerset 248 1.7% 75
Sussex 126 0.9% 86 Union 1,108 7.4% 202
Warren 156 1.1% 145 Source: The data source for hospitalization and ED visits is the 2013 New Jersey
UB data file, analyzed by the New Jersey Department of Health, Community Health and Wellness Unit.
Excludes out of state ED visits and visits that result in hospital admission.
Key Point
The 2013 diabetes ED visit rate ranged by county from 297 visits per 100,000 population
(Atlantic) to 61 visits per 100,000 (Morris).

28
Table 8: ED Visits for Chronic Conditions among NJ Residents by Diagnosis, 2013
Primary Diagnosis Number
Rate (per 100K
population)
Diabetes 14,898 167
Adult Asthma 33,944 494
Child Asthma 18,528 916
COPD 24,882 280
Ischemic Heart Disease 4,552 51
Heart Failure 3,393 38
Hypertension 21,935 246
Chronic Kidney Disease 2,547 29
Stroke 4,827 54
Source: The data source for hospitalization and ED visits is the 2013 New Jersey UB data file, analyzed by the New Jersey Department of Health, Community Health and Wellness Unit.
Excludes out-of-state ED visits and visits that result in hospital admission.
Key Point:
The diabetes ED visit rate in 2013 was 167 visits per 100,000 population, which was higher than the corresponding rates for ischemic heart disease, heart failure, chronic kidney disease, and stroke.
Table 9: ED Visits for Chronic Conditions among NJ
Residents with and without Diabetes, 2013 With Diabetes Without Diabetes
Primary Diagnosis
Number Percent Number Percent
Ischemic Heart Disease
1,292 28.4% 3,260 71.6%
Heart Failure 1,166 34.4% 2,227 65.6%
Hypertension 3,409 15.5% 18,526 84.5%
Chronic Kidney Disease
694 27.3% 1,853 72.8%
Stroke 947 19.6% 3,880 80.4%
Source: The data source for hospitalization and ED visits is the 2013 New Jersey UB data file, analyzed by the New Jersey Department of Health, Community Health and Wellness Unit.
Excludes out-of-state ED visits and visits that result in hospital admission.
Key Point:
A high percentage of NJ residents who visited the ED for other chronic conditions in 2013
also had diabetes. For example, 34.4% of ED visits for heart failure in 2013 were among
residents with diabetes.
29
Diabetes Hospitalizations
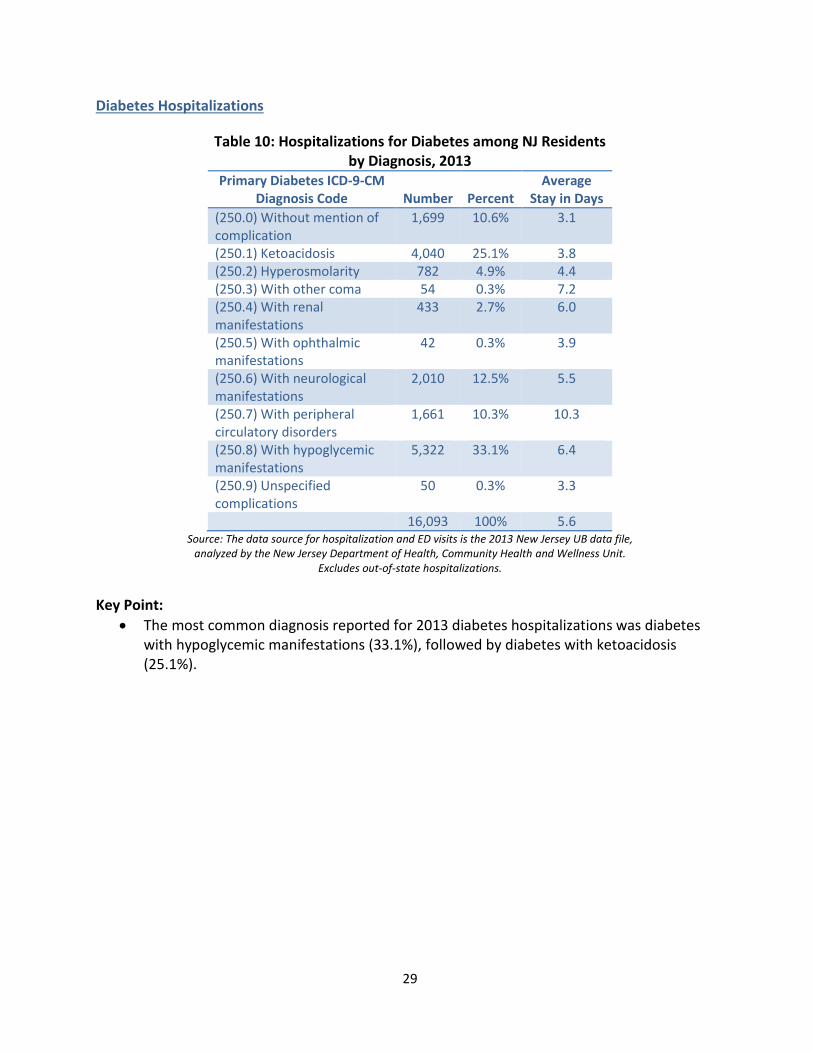
Table 10: Hospitalizations for Diabetes among NJ Residents by Diagnosis, 2013
Primary Diabetes ICD-9-CM Diagnosis Code Number Percent
Average Stay in Days
(250.0) Without mention of complication
1,699 10.6% 3.1
(250.1) Ketoacidosis 4,040 25.1% 3.8 (250.2) Hyperosmolarity 782 4.9% 4.4 (250.3) With other coma 54 0.3% 7.2 (250.4) With renal manifestations
433 2.7% 6.0
(250.5) With ophthalmic manifestations
42 0.3% 3.9
(250.6) With neurological manifestations
2,010 12.5% 5.5
(250.7) With peripheral circulatory disorders
1,661 10.3% 10.3
(250.8) With hypoglycemic manifestations
5,322 33.1% 6.4
(250.9) Unspecified complications
50 0.3% 3.3
16,093 100% 5.6 Source: The data source for hospitalization and ED visits is the 2013 New Jersey UB data file,
analyzed by the New Jersey Department of Health, Community Health and Wellness Unit. Excludes out-of-state hospitalizations.
Key Point:
The most common diagnosis reported for 2013 diabetes hospitalizations was diabetes with hypoglycemic manifestations (33.1%), followed by diabetes with ketoacidosis (25.1%).

30
Table 11: Hospitalizations for Diabetes among NJ Residents by County of Residence, 2013
County Number Percent
Rate (per 100K population)
Atlantic 600 3.7% 218 Bergen 963 6.0% 104
Burlington 868 5.4% 193 Camden 1,360 8.5% 265
Cape May 198 1.2% 206 Cumberland 470 2.9% 299
Essex 1,973 12.3 250
Gloucester 506 3.1% 174 Hudson 1,319 8.2% 200
Hunterdon 111 0.7% 88 Mercer 851 5.3% 230
Middlesex 1,264 7.9% 152 Monmouth 1,092 6.8% 173
Morris 495 3.1% 99 Ocean 1,072 6.7% 184 Passaic 1,041 6.5% 206 Salem 181 1.1% 278
Somerset 341 2.1% 103 Sussex 237 1.5% 162 Union 998 6.2% 182
Warren 153 1.0% 142 Source: The data source for hospitalization and ED visits is the 2013 New Jersey UB data file,
analyzed by the New Jersey Department of Health, Community Health and Wellness Unit. Excludes out-of-state hospitalizations.
Key Point:
The 2013 diabetes hospitalization rate ranged by county from 299 hospitalizations per 100,000 population (Cumberland) to 88 hospitalizations per 100,000 (Hunterdon).

31
Table 12: Hospitalizations for Select Chronic Conditions among NJ Residents by Diagnosis, 2013
Primary Diagnosis Number
Rate (per 100K
population)
Average Stay in Days
Chronic Kidney Disease 18,685 210 6.2
Heart Failure 30,206 339 6.0
Stroke 20,532 231 5.7
Diabetes 16,093 181 5.6
COPD 17,253 194 5.2
Hypertension 9,883 111 5.1
Ischemic Heart Disease 33,373 375 4.6
Adult Asthma 10,402 151 4.3
Child Asthma 3,687 182 2.4 Source: The data source for hospitalization and ED visits is the 2013 New Jersey UB data file,
analyzed by the New Jersey Department of Health, Community Health and Wellness Unit. Excludes out-of-state hospitalizations.
Key Point:
The average length of stay for diabetes hospitalizations in 2013 was 5.6 days, which is
longer than the corresponding average for adult asthma, child asthma, COPD, ischemic
heart disease, and hypertension hospitalizations.

32
Diabetes Deaths
Table 13: Diabetes Deaths among NJ Residents, 2011
County Number Percent Crude Rate
(per 100K population)
Age-Adjusted Rate (per 100K standard population)
ATLANTIC 74 3.3% 26.9 22.8 BERGEN 190 8.6% 20.8 16.0
BURLINGTON 96 4.3% 21.3 18.1 CAMDEN 133 6.0% 25.9 23.2
CAPE MAY 37 1.7% 38.3 23.7 CUMBERLAND 65 2.9% 41.2 39.4
ESSEX 222 10.0% 28.2 28.8 GLOUCESTER 65 2.9% 22.5 21.7
HUDSON 191 8.6% 29.6 34.2 HUNTERDON 16 0.7% ** **
MERCER 101 4.6% 27.5 25.2 MIDDLESEX 148 6.7% 18.1 16.9
MONMOUTH 179 8.1% 28.4 23.7 MORRIS 90 4.1% 18.2 15.5 OCEAN 188 8.5% 32.4 20.7
PASSAIC 112 5.0% 22.2 21.2 SALEM 34 1.5% 51.5 41.1
SOMERSET 62 2.8% 19.0 16.8 SUSSEX 35 1.6% 23.6 21.5 UNION 159 7.2% 29.4 27.2
WARREN 21 0.9% 19.4 16.4 The value has been suppressed because it does not meet standards of reliability or precision.
Source: Diabetes Query for the Age-Adjusted Mortality Rates for Counties Measure, 2011. Retrieved from NJDOH on 7/30/15, Center for Health Statistics, NJSHAD website http://nj.gov/health/shad.
Key Points:
Diabetes is the sixth leading cause of death in NJ and seventh in the United States.
In 2011, a total of 2,218 NJ adults died from diabetes. The age-adjusted death rate ranged
from 15.5 deaths per 100,000 standard population (Morris County) to 41.1 deaths per
100,000 standard population (Salem County).

33
Figure 9: New Jersey Age-Adjusted Diabetes Death Rate by Race/Ethnicity, 2011
Source: Age-Adjusted Death Rate due to Diabetes by Year and Race/Ethnicity, New Jersey, 2000-2011.
Retrieved from NJDOH on 7/30/15, Center for Health Statistics, NJSHAD website http://nj.gov/health/shad.
Key Point: • The age-adjusted diabetes death rate in NJ is highest among black, non-Hispanic individuals,
followed by Hispanic residents.

34
Diabetes Costs
Table 14: Total Cost for Diabetes and Related Complications for NJ FamilyCare Members, 2013
DIABETES & COMPLICATIONS
TOTAL MEMBER COST
ADULT MEMBER
COST % OF COST
YOUTH MEMBER
COST % OF COST
DIABETES WITHOUT
COMPLICATIONS $111,938,210 $108,344,310 70% $3,593,900 61%
GESTATIONAL DIABETES
$12,453,056 $12,098,417 8% $354,639 6%
DIABETES WITH OTHER SPECIFIED MANIFESTATIONS
$8,185,263 $8,007,892 5% $177,371 3%
DIABETES WITH PERIPHERAL
CIRCULATORY DISORDERS
$5,957,837 $5,957,151 4% $686 0%
DIABETES WITH KETOACIDOSIS
$6,956,529 $5,450,500 4% $1,506,029 26%
DIABETES WITH NEUROLOGICAL MANIFESTATION
$5,270,439 $5,229,811 3% $40,628 1%
DIABETES WITH UNSPECIFIED
COMPLICATIONS
$4,747,610
$4,577,349 3% $170,261 3%
DIABETES WITH OPHTHALMIC
MANIFESTATIONS
1,771,298
$1,764,731 1% $6,567 0%
DIABETES WITH HYPEROSMOLARITY
$1,638,506
$1,634,270 1% $4,236 0%
DIABETES WITH RENAL
MANIFESTATIONS $1,571,739 $1,569,271 1% $2,468 0%
DIABETES WITH OTHER COMA
$929,839 $927,814 1% $2,025 0%
TOTAL: $161,420,326 $155,561,516
100% $5,858,810
100% Source: Actual Cost-Paid fee-for-service claims and managed care encounter for services provided to NJ FamilyCare eligible
individuals between 1/1/2013 and 12/31/2013.
Key Point:
NJ FamilyCare managed care and fee for service plans incur significant costs for members
with diabetes. The total cost of diabetes for adult and youth NJ FamilyCare members in 2013
(managed care and fee for service) was $161,420,326.

35
Table 15: Cost of Pre-existing Diabetes and Gestational Diabetes Compared to All Pregnancies for NJ FamilyCare Members, 2013
Pregnancy Complications Total Cost
Member Count
Average Total Cost/Member
Pre-existing Diabetes
(All Inclusive) $13,104,048 495 $26,473
Gestational Diabetes (All Inclusive)
$22,506,888 931 $24,175
All Pregnancy $893,488,167 51,251 $17,434
Source: Actual Cost-Paid fee-for-service claims and managed care encounter for services provided to NJ FamilyCare eligible individuals between 1/1/2013 and 12/31/2013.
Key Point:
Among pregnant NJ FamilyCare recipients, the highest total paid per person in 2013 was for women with pre-existing diabetes at $26,473, followed by $24,175 for women with gestational diabetes.

36
Table 16: Total Cost of Diabetes among NJ FamilyCare Members by County and Per Member, 2013
County Member Cost Per County
Cost Per Member
ATLANTIC 3,176 $5,164,506 $1,626
BERGEN 5,572 $11,009,236 $1,976 BURLINGTON 2,950 $5,734,241 $1,944
CAMDEN 7,283 $11,446,008 $1,572 CAPE MAY 879 $1,347,978 $1,534
CUMBERLAND 2,518 $3,725,250 $1,479 ESSEX 13,790 $19,720,468 $1,430
GLOUCESTER 1,979 $1,936,834 $979 HUDSON 12,929 $20,234,153 $1,565
HUNTERDON 401 $586,537 $1,463 MERCER 3,606 $5,550,104 $1,539
MIDDLESEX 6,945 $13,444,076 $1,936 MONMOUTH 3,405 $7,490,710 $2,200
MORRIS 2,169 $4,953,178 $2,284 OCEAN 3,510 $4,729,697 $1,347
PASSAIC 9,296 $14,313,311 $1,540 SALEM 801 $1,460,214 $1,823
SOMERSET 1,449 $3,131,363 $2,161 SUSSEX 620 $955,089 $1,540 UNION 5,879 $10,965,684 $1,865
WARREN 653 $1,156,937 $1,772 Total 89,810 $149,055,574 $1,660
Source: Actual Cost-Paid fee-for-service claims and managed care encounter for services provided to NJ FamilyCare eligible individuals between 1/1/2013 and 12/31/2013.
Key Points:
Diabetes carries the highest total costs in Hudson ($20,234,153), Essex ($19,720,468), and Passaic ($14,313,311) counties.
Diabetes carries the highest cost per member in Monmouth ($2,200), Morris ($2,284) and Somerset ($2,161) counties.

37
Table 17: Comparison of Overall and Per Member Diabetes Costs and Other Chronic Disease Costs among NJ FamilyCare Members, 2013
Chronic Conditions
Total Members with Chronic
Condition
Total Cost per Chronic Condition
Cost per
Member Percentage
Diabetes ≥ 20 Years
83,774 $149,068,319 $1,779 19%
Diabetes ≤ 20 Years
54 $45,675 $846 0%
Congestive Heart Failure
20,050 $84,163,020 $4,198 11%
Coronary Heart
Disease 34,570 $77,345,202 $2,237 10%
COPD and Allied
Conditions 47,426 $65,925,881 $1,390 9%
Hypertension 133,831 $327,046,119 $2,444 43%
Asthma ≥ 20 Years
35,282 $31,511,168 $893 4%
Asthma ≤ 20 Years
72,294 $34,248,088 $474 4%
Sum: $769,353,472 100%
Source: Actual Cost-Paid fee-for-service claims and managed care encounter for services provided to NJ FamilyCare eligible individuals between 1/1/2013 and 12/31/2013 Key Point:
Of the more than $769 million in costs for the above conditions, 43% of the costs are associated with hypertension, followed by 19% associated with adult diabetes.

38
CURRENT DIABETES EFFORTS
Department of Health
The New Jersey Diabetes Prevention and Control Program (DPCP) is committed to increasing
awareness of diabetes mellitus and its complications, improving the quality of diabetes care and
access to care, developing community-clinical linkages, and using data to better allocate
resources and improve health outcomes. The key strategies of the program focus on population-
based public health interventions that support the control and management of diabetes by
optimizing healthcare systems. DPCP partners with health care providers to enhance screening
and treatment protocols for diabetes management; and promote community resources that
prevent and control diabetes.
The DPCP is supported by federal funding from the Preventive Health and Health Services Block
Grant and the CDC DP13-1305 Grant: State Public Health Action to Prevent & Control Diabetes,
Heart Disease, Obesity, and Associated Risk Factors and Promote School Health. The DPCP
receives $1.5 million in funding to address diabetes. Key efforts of the DPCP are described
below.
Community Clinical Linkages Pilot Project: DPCP has established three Diabetes
Resources Coordination Centers (DRCCs) at the Center for Human Services (Cumberland
County), the New Jersey Medical School at Rutgers University (Essex and Hudson
Counties) and Zufall Health Center (Morris and Hunterdon Counties). The DRCCs promote
community clinical linkages to increase access to, referrals to, and use of Diabetes Self-
Management Education (DSME) and Diabetes Prevention Programs (DPPs) by engaging
healthcare providers to develop health system policies and practices that facilitate
patient referrals to community DSME. The current state inventory for DSME is 75 and
there are 13 DPPs.
Diabetic Eye Disease Detection: The DPCP supports the Commission for the Blind and
Visually Impaired - Diabetic Eye Disease Detection Program (DEDD) to provide dilated eye
screenings to underserved populations. In addition to providing eye examinations, blood

39
pressure screenings, and nutrition education, provider referral and follow-up services are
included with the DEDD’s basic services. The DEDD also leverages strategic partnerships
to offer hemoglobin A1C tests, podiatric and dental screenings, and eyeglasses.
Vocational training, limited to residents with vision impairment or blindness, is available
at no cost to equip individuals with skills to maintain their independence.
DSME and Support: The DPCP partners with the New Jersey Medical School at Rutgers
University (Rutgers) to increase community-clinical linkages to increase the use of
diabetes prevention and management programs for residents with, or at risk for, type 2
diabetes. Rutgers collaborates with local Stanford model Diabetes Self-Management
Program delivery sites, YMCA Diabetes Prevention Programs, and healthcare providers in
Essex and Hudson counties to facilitate referral systems for patients’ participation.
Health Systems Quality Improvement: The DPCP works with healthcare systems to
increase the implementation of quality improvement processes, increase electronic
health records (EHR) adoption and the use of health information technology, and
increase the use of team-based care to control hemoglobin A1C and blood pressure.
Currently, DOH supports a clinical decision support system project at the Trenton Health
Team to optimize clinical workflows, EHR functionality, and reporting for diagnosing and
managing prediabetes, diabetes, and high blood pressure.
Worksite Wellness Tool Kit for Employers: In September 2012, New Jersey Heart Disease
and Stroke Prevention Program awarded a grant to Rutgers University/Rutgers
Cooperative Extension/Department of Family and Community Health Sciences, to pilot a
worksite wellness toolkit for employers – Working Well in New Jersey (WWNJ). Originally
developed to specifically address heart healthy strategies that employers can adopt in
the workplace, WWNJ’s offerings have expanded beyond blood pressure control best
practices to include obesity prevention and smoking cessation.
The DOH relaunched the new WWNJ Toolkit on January 28, 2015, at the Partnering for a
Healthy NJ stakeholders meeting. To date, more than 100 employers have registered

40
with DOH to obtain the WWNJ toolkit, and have been offered technical assistance four to
six weeks post-receipt of the toolkit.
The Delivery System Reform Incentive Payment (DSRIP) Program is a major component
of New Jersey's Comprehensive Medicaid Waiver as approved by the Centers for
Medicare & Medicaid Services (CMS). DSRIP is a demonstration program designed to
result in better care for New Jersey’s low-income individuals (including access to care,
quality of care, health outcomes), better health for the general population, and lower
costs by transitioning hospital funding to a model where payment is contingent on
achieving health improvement goals.
As part of DSRIP, hospitals may choose one of eight chronic diseases or medical
conditions on which to focus improvements. Hospitals have chosen among the following
diseases and conditions: HIV/AIDS, Cardiac Care, Asthma, Diabetes, Obesity, Pneumonia,
Behavioral Health and Substance Abuse. Thirteen hospitals are implementing
demonstration projects aimed at improving diabetes control, including: increasing the
overall quality of care for patients diagnosed with diabetes mellitus and hypertension,
and increasing opportunities for patient, provider, and community education.
DOH also uses funds from the Preventive Health and Health Services Block Grant and Prevention
and Public Health Fund to expand statewide capacity to implement and support population-
based strategies to promote wellness and prevent chronic disease. DOH supports several
programs that create healthy communities and build environments in efforts to increase access
to health education and encourage physical activity and healthy food choices. Funding supports
the following primary prevention programs:
Shaping NJ Community Grants: ShapingNJ is the statewide public/private partnership for
nutrition, physical activity and obesity prevention. The goal of this partnership is to
implement obesity prevention strategies that improve the health of New Jersey’s most
vulnerable populations. Nineteen municipalities statewide have received community
grants to create environmental and policy changes that increase access to healthy food

41
and routine physical activity in an effort to improve health outcomes for low-income
communities.
ShapingNJ also utilizes funds to support HealthCorps sites at Memorial High School
located in West New York, New Jersey, Hudson County; Admiral William F. Halsey
Leadership Academy located in Elizabeth, New Jersey, Union County; and Millville Senior
High School located in Cumberland County. HealthCorps is a nationwide movement
founded by heart surgeon Dr. Mehmet Oz to combat the childhood obesity epidemic.
This funding supports schools to recruit and hire a school-based youth coordinator to
serve as a peer mentor to address nutrition, physical activity and healthy lifestyles with
students, teachers and the external school community.
Faith In Prevention: Faith In Prevention is a pilot program that employs the Faithful
Families Eating Smart, Moving More framework to expand the role of faith-based
organizations in the delivery of an evidence-based health prevention curriculum in
Trenton, Camden, and Newark. The program links faith-based organizations to the
healthcare delivery system and provides training to lay leaders to curb obesity through
increased physical activity and nutrition education. Moreover, grantees link congregants
with or at-risk for diabetes to diabetes self-management resources.
DOH also convenes the New Jersey Council on Physical Fitness and Sports. The council is
dedicated to good health, nutrition, regular physical activity and recreation. Comprised
of governor-appointed volunteers from a variety of wellness, fitness, sports and nutrition
agencies and entities throughout the state; the Council works to promote public
awareness and to ensure that all citizens of New Jersey have the opportunity to pursue
healthy lifestyles.

42
Department of Human Services, Division of Medical Assistance and Health Services
The Division of Medical Assistance and Health Services (DMAHS) provides services to 89,810
members with diabetes. Family members are not included in the Division’s records as a data
set, and cannot be tracked. Nonetheless, DMAHS supports patient-centered care that
recognizes family members in their role as caregiver. In 2013, the total expenditure paid by
DMAHS for treatment of diabetes mellitus care, and for complications linked to the primary
diagnosis of diabetes mellitus, was $161,420,327. The following table summarizes the
financial impact of diabetes mellitus in comparison to other chronic diseases:
Table 18: NJ FamilyCare Cost for Diabetes and other Common Chronic Disease, 2013
CONDITION MEMBERS TOTAL SERVICE COST COST PER MEMBER
CONGESTIVE HEART FAILURE 20,050 $84,163,020.01 $4,197.66
OSTEOARTHRITIS 7,174 $18,738,410.86 $2,611.99
HYPERTENSION 133,831 $327,046,119.10 $2,443.72
CORONARY HEART DISEASE 34,570 $77,345,201.54 $2,237.35
DIABETES MELLITUS
(with complications only)86,929 $154,799,166.02 $1,780.75
COPD 47,426 $65,925,881.05 $1,390.08
ASTHMA 107,576 $65,759,256.63 $611.28
OVERWEIGHT/OBESITY 28,737 $14,020,115.82 $487.88
CHRONIC BACK 79,243 $34,006,526.58 $429.14
NJ FamilyCare Costs for Diabetes and Other Common Chronic Diseases, Calendar Year 2013
So urce: "M embers" and "Total Service Costs" from paid fee for service claims and managed care encounters for services provided to NJ FamilyCare
eligible individuals between 1/1/2013 and 12/31/2013. "Congestive Heart Failure", "Hypertension", "Coronary Heart Disease", "Diabetes M ellitus (with
complications only)", "COPD", and "Asthma" based on US Centers for Disease Contro l and Prevention definitions
(http://www.cdc.gov/pcd/issues/2013/pdf/12_0239.pdf); o ther conditions defined by NJ FamilyCare clinical staff based on ICD-9 diagnoses
N o tes: $2,815,022.66 duplicated between “ Congestive Heart Failure” and “ Hypertension” ; diagnosis codes 402.01, 402.11, 402.91, 404.03, 404.13, 404.91,
404.93 are included in the CDC definitions for both conditions
DMAHS reviewed diabetes-specific programmatic narratives provided by the NJ FamilyCare
managed care plans. DMAHS is confident that all plans were consistent in measuring Healthcare
Effectiveness Data and Information Set (HEDIS) scores, providing tobacco cessation services to
diabetics, providing patient self-management education, and supporting evidence-based disease
management. DMAHS receives federal funding for provision of care to eligible populations, but
no funding is specifically directed toward the treatment of diabetes mellitus.
In support of the DAP, DMAHS has provided relevant data to DOH and DCF, assigned staff to
consult with DOH and DCF to support implementation of the DAP, and developed a working
group to assist in meeting the overall goals of the DAP.
43
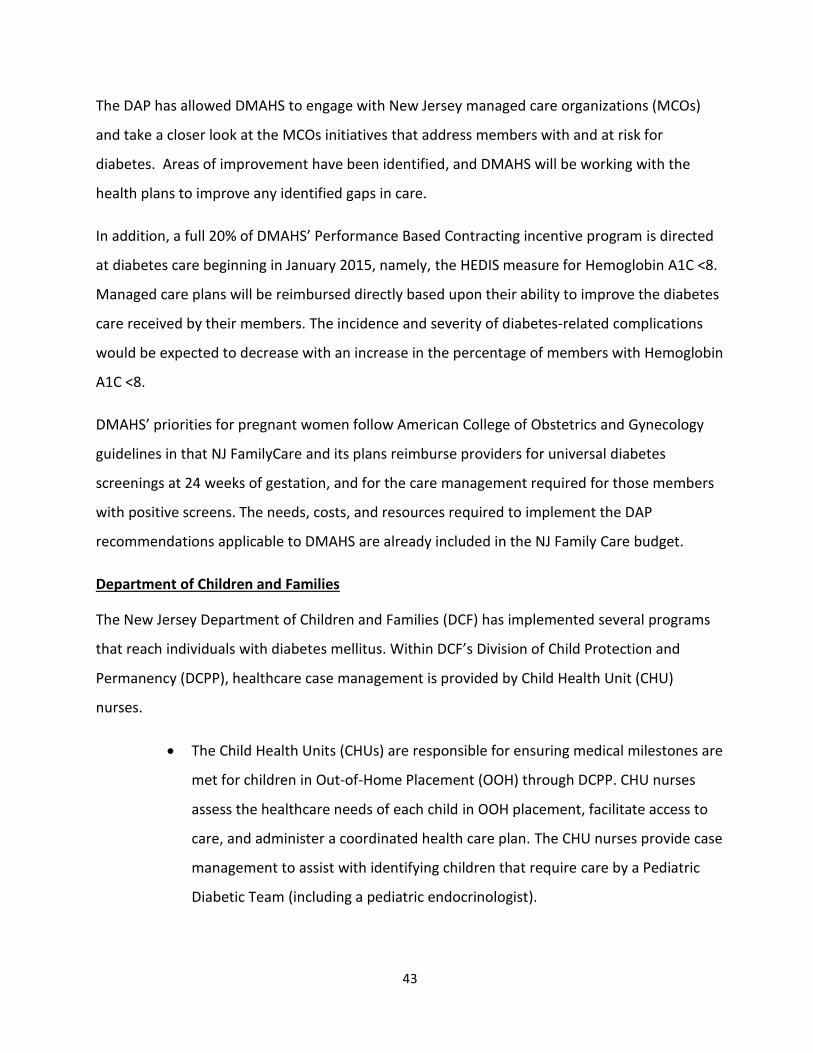
The DAP has allowed DMAHS to engage with New Jersey managed care organizations (MCOs)
and take a closer look at the MCOs initiatives that address members with and at risk for
diabetes. Areas of improvement have been identified, and DMAHS will be working with the
health plans to improve any identified gaps in care.
In addition, a full 20% of DMAHS’ Performance Based Contracting incentive program is directed
at diabetes care beginning in January 2015, namely, the HEDIS measure for Hemoglobin A1C <8.
Managed care plans will be reimbursed directly based upon their ability to improve the diabetes
care received by their members. The incidence and severity of diabetes-related complications
would be expected to decrease with an increase in the percentage of members with Hemoglobin
A1C <8.
DMAHS’ priorities for pregnant women follow American College of Obstetrics and Gynecology
guidelines in that NJ FamilyCare and its plans reimburse providers for universal diabetes
screenings at 24 weeks of gestation, and for the care management required for those members
with positive screens. The needs, costs, and resources required to implement the DAP
recommendations applicable to DMAHS are already included in the NJ Family Care budget.
Department of Children and Families
The New Jersey Department of Children and Families (DCF) has implemented several programs
that reach individuals with diabetes mellitus. Within DCF’s Division of Child Protection and
Permanency (DCPP), healthcare case management is provided by Child Health Unit (CHU)
nurses.
The Child Health Units (CHUs) are responsible for ensuring medical milestones are
met for children in Out-of-Home Placement (OOH) through DCPP. CHU nurses
assess the healthcare needs of each child in OOH placement, facilitate access to
care, and administer a coordinated health care plan. The CHU nurses provide case
management to assist with identifying children that require care by a Pediatric
Diabetic Team (including a pediatric endocrinologist).

44
The total number of children in OOH placement is approximately 7,500; less than
1% have been diagnosed with diabetes mellitus (DCF Safe Measures, January
2015). The number of children in OOH placement represents 15% of the children
involved with DCPP (DCF Safe Measures, January 2015).
CHU nurses report that among children in OOH placement, approximately 13.09%
of children are overweight and 14.60% are obese, with a total of 27.69% of
children who may be at increased risk for type 2 diabetes (Table 19).
The CHU nurses provide health education to caregivers, children, and youth on
nutrition and healthy activity.
Table 19. Child Health Unit Program Serving Children in Out-of-Home Placement,
January 2015
Program Population Served Members with Diabetes Members at Increased Risk of Diabetes
CHU Nurses
Children in out-of-home placement (OOH) through the state’s child welfare system (DCPP)
Type 1: 16 children in OOH
Type 2: 7 children in OOH
13.09% of children in OOH are overweight; 14.60% of children in OOH are obese
Source: DCF Child Health Unit records, 2015.
The Division of Family and Community Partnerships (FCP), Office of Early Childhood Services,
funds three evidence-based homes visiting models that begin working with families during
pregnancy. While diabetes management is not a primary function of home visiting, one of these
three models employs nurse home visitors who track data for gestational diabetes mellitus
(GDM) and help to facilitate access to prenatal care to ensure that women with GDM receive
appropriate medical care and adhere to health and nutritional recommendations.

45
The Nurse Family Partnership program, managed by FCP’s Office of Early
Childhood Services, had 722 families enrolled in FY14 (per the NFP data system).
Of these, nine women (1.2%) were identified as having GDM.
Table 20: DCF Family & Community Partnerships and Nurse Family Partnership (NFP)
Programs, 2014
Program Population Served Participants with Diabetes
Family & Community Partnerships (FCP) Home Visiting–Nurse-Family Partnership (NFP)
First-time pregnant women enrolled during the second trimester of pregnancy and participate until the child reaches age 2
9 pregnant (1.2%) women enrolled in NFP had a report of GDM
Source: DCF New Jersey NFP program data, 2014.
There are also services available to address the needs of a specific subset of the child diabetic
population, through the Children’s System of Care (CSOC):
CSOC is the lead agency for developing the Children’s Behavioral Health Home
(BHH) Program, working with the Department of Human Services-Division of
Mental Health and Addiction Services and DMAHS, under the direction of CMS;
BHH services are provided to families through the MCOs. BHH is currently
available in Bergen and Mercer Counties, and will be available in Atlantic, Cape
May, and Monmouth Counties in January 2016.
As designated BHH providers, the MCOs will integrate and coordinate primary,
acute, behavioral health, and other services and supports for children with
qualifying chronic conditions;
The BHH model will provide services to children with diabetes;
In addition to BHH, CSOC offers services to those youth who require out-of-
home treatment to address behavioral health challenges but also need to
manage diabetes.

46
EFFECTIVENESS:
The CHUs were implemented in 2008, and have ensured that children in OOH
placement have access to a broad array of healthcare services. Specific to
diabetes, the nurses ensure that: 1) children with diabetes are managed by a
Pediatric Diabetic Team, 2) families understand the care needs outlined in the
health plan developed by the treatment team, 3) caregivers are educated on
diabetes and the child’s unique needs, and 4) the child’s response to treatment is
monitored.
Currently, diabetes management is not a primary function of FCP’s prevention
programs. However, as a part of DCF’s commitment to the Diabetes Action Team,
DCF will begin to examine ways to support New Jersey’s efforts for the prevention
and early detection of type 2 diabetes across FCP programs and services—Early
Childhood, School-Linked Services, Family Support Services, and the Division on
Women (DOW).
FUNDING:
DCF funds the CHUs to support its coordinated health plan for children in OOH
placements.
Currently, no FCP or DOW funds are directed specifically to diabetes
management.

47
DIABETES ACTION PLAN COMMITEEE PROPOSED RECOMMENDATIONS
1. Encourage providers to establish, maintain, and implement as part of normal operating
procedures a verifiable system to:
Screen patients with risk factors for prediabetes and diabetes according to the
latest clinical guidelines set forth by the American Diabetes Association;
Encourage immediate communication regarding the results and implications of
said screenings with patients as part of the patient’s electronic medical record;
and
Educate patients identified as prediabetic about the potential risks to their health
and available resources for further education.
2. Communicate the results and implications of diabetes screenings with patients as part of
the medical record.
Educate patients identified as prediabetic about the potential risks and available
resources.
Refer at-risk individuals to appropriate prevention and treatment programs.
3. Encourage evidence-based diabetes self-management education, training, and services
for patients diagnosed with type 2 diabetes and gestational diabetes.
4. Encourage evidence-based diabetes prevention education and CDC-recognized lifestyle
change programs for the primary prevention of type 2 diabetes among patients
diagnosed with prediabetes or those at high risk for type 2 diabetes.
5. Work to reduce the cost of diabetes mellitus in the community by providing education
for families and providers, and by specifically targeting diabetics over the age of 65.

48
NEXT STEPS
Access to Health Care Coverage
Many NJ residents who receive services from the Department of Children and Families
(DCF) are also receiving or are eligible for NJ FamilyCare. DCF and DMAHS will continue to
collaborate to ensure that families served by DCF are able to access coverage for medical
services in the timeliest fashion.
Stakeholder identification and analysis
The DAP Committee will implement a systematic process for identifying and engaging
new internal and external stakeholders for the development of the second DAP report.
The group will work to establish criteria for identifying and prioritizing stakeholders’
involvement.
The group will identify hospitals, non-profit organizations, federally qualified health
centers, and universities to participate on the committee for the next report cycle.
Measures will be taken to ensure equitable stakeholder contribution while remaining
focused on the legislative charge.
Development of Joint Benchmarks
Moving forward in the collaboration to address diabetes mellitus, DOH, DMAHS, and DCF
will develop joint benchmarks and strategies to achieve them.

49
REFERENCES
1. New Jersey State Health Assessment Data Site (2015). Retrieved July 29, 2015, from
https://www26.state.nj.us/doh-shad/indicator/view/DiabetesDeath.Trend.html.
2. Centers for Disease Control and Prevention, National Center for Health Statistics, Division
of Health Interview Statistics, (2013, November 19). Diabetes Public Health Resource.
Retrieved June 1, 2015, from
http://www.cdc.gov/Diabetes/statistics/prev/national/figpersons.htm.
3. Kaiser Commission on Medicaid and the Uninsured. (2012, November). Fact Sheet: The
Role for Medicaid for People with Diabetes. Retrieved March 15, 2015, from
https://kaiserfamilyfoundation.files.wordpress.com/2013/01/8383_d.pdf.
4. Centers for Disease Control Website (2015, April). Retrieved June 29, 2015, from
http://www.cdc.gov/diabetes/library/socialmedia/infographics.html.
5. American Diabetes Association. (2013, March). The economic cost of diabetes in the U.S.
in 2012. Diabetes Care. doi: 10.2337/dc12-2625.
6. The Community Toolbox. (2014). Workgroup for Community Health and Development
Logic Model for Building Healthier Communities. Retrieved January 19, 2015, from
http://ctb.ku.edu/en/table-of-contents/overview/model-for-community-change-and-
improvement/building-capacity/main.
7. Centers for Disease Control, National Center for Chronic Disease Prevention and Health
Promotion, Division of Diabetes Translation. (2014). National Diabetes Statistic Report,
2014. Retrieved March 9, 2015, from
http://www.cdc.gov/diabetes/pubs/statsreport14/national-diabetes-report-web.pdf.
8. 2014 New Jersey State Report, Providing Access to Healthy Solutions (PATHS): An analysis
of New Jersey’s Opportunities to Enhance Prevention and Management of Type 2
Diabetes. (2014). Retrieved June 16, 2015, from http://www.chlpi.org/wp-
content/uploads/2013/12/PATHS_NJ_Report_3.18.14.pdf.
9. Institute for Alternative Futures. (2011). Diabetes 2025 Forecast, 2011, New Jersey’s
Diabetes Crisis: Today and Future Trends. Retrieved June 16, 2015, from

50
http://www.altfutures.org/pubs/diabetes2025/NEW_JERSEY_Diabetes2025_DataAndFor
ecasts_2011.pdf.
10. Pediatric Nutrition Surveillance System, National Center for Chronic Disease Prevention
and Health Promotion, Centers for Disease Control. (2011).
11. Behavioral Risk Factor Surveillance System. (2013). Prevalence and Trend Data. Retrieved
June 16, 2015, from
http://apps.nccd.cdc.gov/brfss/age.asp?cat=OB&yr=2013&qkey=8261&state=NJ.
12. Hills JO, Galloway JM, Goley A, et al. (2013, August). Scientific statement: sociological
determinants of prediabetes and type 2 diabetes. Diabetes Care. 36(8):2430-2439.
13. Hill J, Nielsen M, Fox M. (2013). Understanding the social factors that contribute to
diabetes: a means to informing healthcare and social policy for the chronically ill. The
Permanente Journal. 17(2):67-72.
14. The Guide to Community Preventive Services Site (2015, May 27). Retrieved June 10,
2015, from http://www.thecommunityguide.org/diabetes/index.html.
15. National Diabetes Prevention Program Site (2015, April 17). Retrieved August 19, 2015,
from http://www.cdc.gov/diabetes/prevention/about.htm
16. American Diabetes Association. (2015) Standards of Medical Care in Diabetes, 2015.
Diabetes Care. 38 (2). Retrieved June 10, 2015, from
http://care.diabetesjournals.org/content/suppl/2014/12/23/38.Supplement_1.DC1/Janu
ary_Supplement_Combined_Final.6-99.pdf.
17. New Jersey Student Health Survey. (2013). Retrieved June 29, 2015.
18. MCO Care Management Workbook DMAHS definition (revised July 2015).

51
THIS PAGE IS INTENTIONALLY LEFT BLANK

52
TECHNICAL NOTES
1. Unless otherwise indicated, Behavioral Risk Factor Surveillance System data was analyzed by the New Jersey Department of Health, Community Health and Wellness Unit.
2. Hospitalization and ED visits represent hospital discharges and ED discharges from acute care hospitals in New Jersey.
3. The data source for hospitalization and ED visits is the 2013 New Jersey UB data file.
4. Diabetes was defined in hospital and ED discharge records using ICD-9 code 250.x.
5. Diabetes-related lower limb amputations were defined in hospital discharge records using ICD-9 procedure code 841.x as any-listed procedure and ICD-9 diagnosis code 250.x as any-listed diagnosis with transfers and maternal hospitalizations excluded.
6. Chronic conditions were defined in hospital and ED discharge records as follows:
Condition ICD-9 Diagnosis Code2
Asthma 493
COPD 490 - 492, 494, 496
Ischemic Heart Disease 410, 411, 412, 413, 414.0, 414.12, 414.2, 414.3, 414.4, 414.8, 414.9
Heart Failure 398.91, 402.01, 402.11, 402.91, 404.01, 404.11, 404.91, 404.03, 404.13, 404.93, 428
Hypertension 362.11, 401, 402, 403, 404, 405, 437.2
Chronic Kidney Disease 16.0, 095.4, 189.0, 189.9, 223.0, 236.91, 249.4, 250.4, 271.4, 274.10, 283.11, 403.01, 403.11, 403.91, 404.02, 404.03, 404.12, 404.13, 404.92, 404.93, 440.1, 442.1, 572.4, 580, 581, 582, 583, 584, 585, 586, 587, 588, 591, 753.12, 753.13, 753.14, 753.15, 753.16, 753.17, 753.19, 753.2, 794.4
Stroke 430, 431, 433.01, 433.11, 433.21, 433.31, 433.81, 433.91, 434.00, 434.01, 434.10, 434.11, 434.90, 434.91, 435.0, 435.1, 435.3, 435.8, 435.9, 436, 997.02
7. Gestational diabetes was identified in hospital records using ICD-9 diagnosis code 648.8x as any-listed diagnosis. Diabetes complicating pregnancy was identified using ICD-9 diagnosis code 648.0x as any-listed diagnosis. Non-delivery maternal hospital stays were

53
identified using ICD-9 diagnosis codes 630-679 as any-listed diagnosis. Maternal delivery hospital stays for cesarean section were identified using MS-DRG codes 765 and 766. Maternal delivery hospital stays for vaginal delivery were identified using MS-DRG codes 767, 768, 774, and 775.
8. Age-adjusted rates were calculated using 2000 US Standards Population.
9. Prevalence and cost data from Department of Human Services was obtained from "Members" and "Total Actual Costs" from paid fee-for-service claims and managed care encounters for services provided to NJ FamilyCare-eligible individuals between 1/1/2013 and 12/31/2013, based on US Centers for Disease Control and Prevention definitions (http://www.cdc.gov/pcd/issues/2013/pdf/12_0239.pdf). Counts were obtained using the business rule.
10. Safe Measures is a data and management tool that transforms case management data into actionable information. The tool is used to improve performance with key indicators and process and outcome measures, such as safety, permanency, and well-being of children.
11. The definition of overweight and obesity for children was obtained by the US Center for
Disease Control and Prevention. (CDC, 2015). Body Mass Index (BMI) is calculated as
weight divided by height. For children, their BMI is compared to children of the same
age and sex, because there are differences in weight, height, and body fat with age and
sex. A child is overweight if their BMI is at or above the 85th percentile and below the
95th percentile, or the child is obese if their BMI is above the 95th percentile compared
to children of the same sex and age. BMI percentile is calculated after accurate
measurement of height and weight, and interpreted from the CDC growth charts, which
were based on national survey data collected from 1963-65 to 1988-944” (CDC, 2015).
http://www.cdc.gov/healthyweight/assessing/bmi/childrens_bmi/about_childrens_bmi.
html#normalWeightRanges

54
Appendix A: N.J.S.A. §26:2-142.1
CHAPTER 104 AN ACT concerning diabetes and supplementing Title 26 of the Revised Statutes. BE IT ENACTED by the Senate and General Assembly of the State of New Jersey: C.26:2-142.1 Diabetes action plan, report to Governor, Legislature. 1. a. The Department of Health, in consultation with the Department of Human Services and the Department of Children and Families, shall develop a diabetes action plan to reduce the impact of diabetes in the State of New Jersey. The plan shall identify goals and benchmarks related to reducing the incidence of diabetes in New Jersey, improving diabetes care, and controlling complications associated with diabetes. b. The Department of Health, in consultation with the Department of Human Services and the Department of Children and Families, shall, no later than 24 months after the effective date of this act and biannually thereafter, present a report to the Governor, and to the Legislature pursuant to section 2 of P.L.1991, c.164 (C.52:14-19.1), on the following: (1) The financial impact and reach of diabetes of all types on the Department of Health, the Department of Human Services, and the Department of Children and Families, as well as the population Statewide and in specific areas of the State. The report shall include: (a) the number of people with diabetes receiving services provided by each department; (b) the number of people with diabetes and family members impacted by diabetes prevention and control programs implemented by each department; (c) the financial impact of diabetes and its complications on each department; and (d) the financial impact of diabetes and its complications on each department in comparison to other chronic diseases and conditions; (2) The benefits of implemented programs and activities aimed at preventing or controlling diabetes. This assessment shall document the amount and source of any funding directed to each department for programs and activities aimed at reaching those with diabetes; (3) The level of coordination among the three departments and the divisions and agencies thereof on activities, programmatic activities, and messaging related to the management, treatment, or prevention of all forms of diabetes and its complications; (4) The development or revision of a detailed action plan for preventing and controlling diabetes with a range of actionable items for consideration by the Legislature. The plan shall identify proposed actions to reduce the impact of all forms of diabetes, pre-diabetes, and complications related to diabetes; identify expected outcomes of the proposed actions in the following biennium; and establish benchmarks for preventing and controlling relevant forms of diabetes, reducing the incidence of diabetes, improving diabetes care, and controlling complications associated with diabetes; and (5) The development of a detailed budget blueprint identifying needs, costs, and resources required to implement the plan pursuant to paragraph (4) of this subsection. This blueprint shall include a budget range for each proposed action presented in the plan pursuant to paragraph (4) of this subsection for consideration by the Legislature. 2. This act shall take effect immediately. Approved August 7, 2013.