Embed Size (px)
Citation preview
Plant Physiol. (1982) 69, 998-10030032-0889/82/69/0998/06/$00.50/0
A New Method for the Determination of Hydraulic Conductivityand Cell Volume of Plant Cells by Pressure Clamp'
Received for publication August 18, 1981 and in revised form December 14, 1981
STEPHAN WENDLER AND ULRICH ZIMMERMANNArbeitsgruppe Membranforschung, am Institutffur Medizin, der Kernforschungsanlage Julich, 5170Julich, Federal Republic ofGermany
ABSTRACT
Intemodes of Chara coraNa were used for experiments in which celturgor pressure was clamped by means of the pressure probe technique.Essentially, the procedure consisted of a combination of volume and turgorpressure relaxations.Tis technique permits the determination of the cellvolume by nonoptical means. The values obtained are in agreement withthe ones determined by optical means. Furthermore, the hydrauUc conduc-tivity (L4) was determined from the initial slope of the volume relaxation;the vahies thus obtained are In arent with those calculated from thehalf-times of pressure relaxations. The determination of Lp from volumerelaxation measurements has the advantage that the cell volume, thevolumetric elastic modulus of the cell wal, and the internal osmoticpressure do not have to be known. Furthermore, the half-time of volumerelaxation is longer than that of pressure relaxation, as shown by theoryand experiment. This may be used to enhance the resolution of therelaxation measurement and, thus, to improve the accuracy of Lp deter-minations for higber plant cells which exhibit a very fast pressure relaxa-tion.
constant level different from the equilibrium turgor pressure bymeans of the pressure probe. Simultaneously, the correspondingvolume relaxation (=volume change due to water flow) is mea-sured. The pressure clamp technique permits the accurate deter-mination of the cell volume which, in turn, allows the volumetricelastic modulus to be calculated with greater accuracy. In addition,the half-time of a volume relaxation can be considerably longerthan that of the corresponding turgor relaxation, which may beadvantageous for higher plant cell measurements.
Pressure clamp and pressure relaxation experiments were per-formed on the internodes of Chara corallina. The volume of thegiant internodes can be determined accurately by optical means.Therefore, for a given cell, the values of the cell volume and thehydraulic conductivity derived from pressure clamp experimentscan be compared with the corresponding values obtained byoptical means and from turgor pressure relaxation measurementsto test the accuracy of the new experimental approach. Theagreement of the water relation parameters obtained by the dif-ferent methods and the different theoretical approaches is verygood. It seems that pressure clamp experiments have great futurepotential for water relation measurements in higher plant tissues.
The pressure probe technique has been extensively used for theinvestigation of the water relations and osmoregulatory processesin single algal cells and in individual cells of higher plant tissues(2, 3, 7, 9, 11, 12, 15-17). The Lp2 of the cell membrane can bedetermined from turgor pressure relaxation curves, i.e. from theresponse of the cell's turgor pressure to a sudden change of thewater equilibrium brought about either osmotically or hydrostat-ically. The volumetric elastic modulus of the cell wall, e, ismeasured by applying pressure pulses to the cell by means of thepressure probe. Both of these parameters control the dynamicwater relations of a plant cell, whereas, in the stationary state, thewater transport processes are controlled only by the hydraulicconductivity of the cell membrane (2, 16). With the aid of thepressure probe, it is possible to measure with great accuracy verysmall changes both in turgor pressure and in cell volume (7). Theerror involved in the calculation of Lp and e, therefore, mainlydepends on the errors in the geometric determination of cell sizeand the membrane area involved in water exchange, particularlyin the case of single cells of irregular shape or cells which aredeeply buried in plant tissue (7, 9, 11, 17).
In this communication, we present for the first time 'pressureclamp' experiments in which, by analogy to voltage clamp andcurrent clamp experiments, the turgor pressure is maintained at a
'Supported by Grant Zi 99/8 from the Deutsche Forschungsgemein-schaft (to U. Z.).
2 Abbreviations: Lp, hydraulic conductivity; APW, artificial pond water.
THEORETICAL CONSIDERATIONS
Volume Determination. The two membranes, tonoplast andplasmalemma, arranged in series are considered as one barrier.The water flow, J, across this barrier is described by the phenom-enological equation of the thermodynamics of irreversible pro-cesses (2, 8, 13):
J = L4P - OTI- V7e)] eqn I
where L is hydraulic conductivity, P is turgor pressure, a isreflection coefficient, si is internal osmotic pressure, and 7Te isexternal osmotic pressure. At water flow equilibrium, ie. Ju = 0,eqn 1 yields:
P. = (eT - 7e) eqn 2
where P0 is equilibrium turgor pressure and f7T is equilibriuminternal osmotic pressure.We assume that the equilibrium turgor pressure, PO, changes in
response to an injected pressure pulse, AP, whereby the turgorpressure is raised to Pf(AP = Pf - P,). The turgor pressure, Pf, isheld constant by continuous displacement of the oil/cell sapboundary in the microcapillary of the pressure probe. This dis-placement corresponds to the net induced water flow, J4, (see eqn1) through the membrane. Because of this water flow, the internalosmotic pressure, v, will change, until a new equilibrium isestablished between the turgor pressure and the osmotic pressuregradient:
Pf = a(7rf - 7Te) eqn 3
998

PRESSURE CLAMP EXPERIMENTS
where 7ff is final internal osmotic pressure. Assuming that the cellbehaves like an ideal osmometer, the following equation holds:
VI VIV0+A
where V. is initial volume, Vf is final volume, and AV = VJSubstitution of eqn 2 and eqn 4 into eqn 3 and rearrangyields:
AVV, = -- (a7r, + AP)AP
Equation 5 represents the key equation for the determinatthe cell volume, V.. Ifwe assume in a first and good approxinthat the reflection coefficients of the solutes in the vacucequal to unity (15), the cell volume can be calculated accordeqn 5 from the applied pressure step, AP, and from the chaicell volume, A V, which is equal to the displacement of the osap meniscus in the microcapillary. ffo can be calculated froi2; se is determined cryoscopically.The cell volume can also be determined by instantan(
changing the initial external osmolarity, lTei, to a constantlre2 and clamping the pressure at P.. Under these conditiorfollowing equations hold for water equilibrium, by analogy 12 to eqn 5:
P. = U(71o- 7Tel)
Po = (Q7Tf - 7FTe2)
V,V, + AV
and
in which the relaxation time, TV, and the half-time, T1/2, are givenby:
eqn 4 Tv = L VI
A * Lp * air,,
-V.. andrement = ln 2.v
respectively.eqn 5 For t , the total volume change, A VX, is:
ton of AVX = - V,nation arole are and correspondingly the cell volume is:ling tonge in V A V*oil/cell V. P *asro
eqn 14
eqn 15
eqn 16
eqn 17
Thus, the cell volume can also be calculated from the volumeLeously relaxation curve. The difference between eqn 17 and eqn 5 arisesvalue from the approximation A V(t)/ V. <« I used in the derivation. The
ns, the error in the determination of the cell volume when eqn 17 is usedto eqn instead of eqn 5 depends on the ratio of AP to 1T. + AP. In any
case, it is better to use the correct eqn 5 for the volume determi-nation. Equations 14 and 15 show that Lp can be determined from
eqn 6 the half-time of the volume relaxation without knowledge of theeqn 7 volumetric elastic modulus, E, defined by the Philip equation E =eqn ~ V, -(dP/dV) (quoted in Ref. 15). Only A, VO, a, and 7r, have to be
determined. However, careful inspection of the equations showseqn 8 that Lp can be calculated even without knowledge of the cell
volume and the internal osmolarity when the initial slope, sv =(dA V/dt)t..o, of the volume relaxation is evaluated:
V0 = V(o + A7Te)
where AIfe = Te2-Te. With this procedure, it is not necessary forthe reflection coefficient of the osmotically active solutes withinthe vacuole to be known.
Determination of the Hydraulic Conductivity. In this section, wewill consider the time course for the change in cell volume duringa pressure clamp experiment, as described above. Jv as a functionof time is given by (2, 13):
I
=-A Vdt) = Lp.{Pf - [rst)7Te]) eqn 10
with A V(t) = V(t) - V, where A is membrane surface area.In contrast to turgor pressure relaxation experiments, Pf is the
clamped pressure generated by the injection of a pressure pulse ofa given amplitude. As long as the volume change, A V(t), is smallin comparison to the volume of the cell at any time, t, ir4(t) can beapproximated by expansion in a Taylor series and by truncationafter the second term:
Ti(t) TI[l- VO] for AVO) eqnllVI ~~VI
Substitution of eqn 11 into eqn 10 and rearrangement yields asimple differential equation for A V(t):
dAV(t) fAv(t)1
dt -ALp {Pf - - + a7reJ eqn l2
With the boundary condition A V(t =0) = 0, this linear differentialequation has the solution:
AV(t) = * V.(e-'/'- 1) eqn 130
The corresponding equations for calculation of Lp from the initialslope, sp = (dP/dt)t0, and from the half-time, TI/2, of the turgorpressure relaxation are given by:
sp V.
A *AP Eeqn 193
and (15):
ln2. VO
A * TJ/2 (e + asO.)eqn 20
Note that the half-time ofa volume relaxation at constant pressureis longer than that of a turgor pressure relaxation because of theterm (1 + E/aTr0):
eqn 21
Typical values for the giant cell of C. corallina show that the half-time of the volume relaxation should be about 3 min, in compar-ison to a half-time of 3 s for the pressure relaxation. The totalvolume change, AV, is on the order of 5 to 8% for practicalamplitudes of the pressure pulse.
In the case ofsuch large volume changes, a considerable amountof cell sap has to be pushed through the tip of the microcapillaryof the pressure probe. This procedure might change the propertiesof the cell. Furthermore, the assumption which forms the basis forthe derivation of eqn 13, namely that the volume changes aresmall, is no longer valid. Therefore, it is advantageous to modify
3Note that V0/e = dP/dV. The ratio dP/dV can be determined more
accurately than V. and e.
eqn 9 svLp=A eqn 18
999
Tvl/2= I + 'TI/2criro

WENDLER AND ZIMMERMANN
IPF=
PO -, -,-T
sured, since the oil/cell sap boundary is held constant. Thus, thedisplacement of the metal rod in the pressure probe is equivalentto the sum ofA Vl and A V2, termed A V'. The total volume change,A Vm, associated with the water flow across the membrane, is givenby:
Al,m = AV2 + AV3 = AV'- AV1 + AV3 eqn 22
The two correction terms, A V1 and A V3, can be rewritten as AVl= dV/dP. AP and A V3 = dV/dP. (AP - AP2), which yields:
AV,m = AV- AP2.dV/dP eqn 23
'-
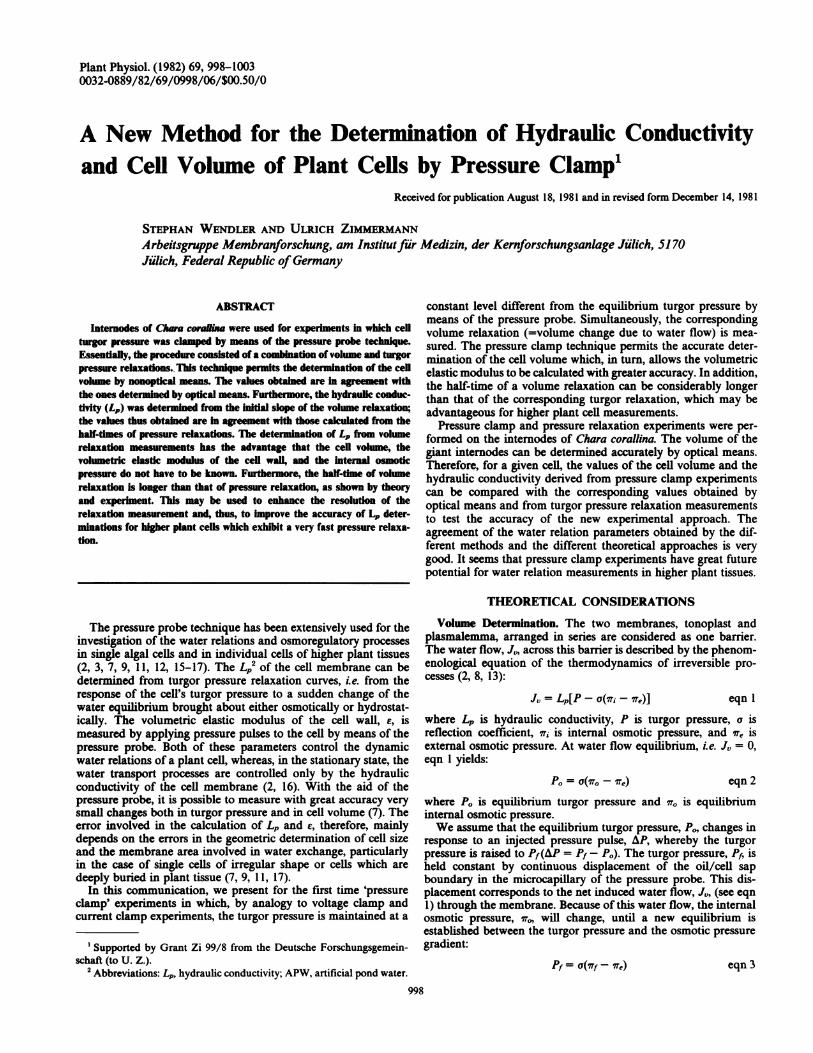
to t1 tFIG. 1. Schematic diagram of a combined volume-turgor-relaxation.
A, Pressure versus time; B, volume versus time. The volume relaxation isgenerated at a pressure (Pf = P. + AP,), clamped for the time interval (t,- t.) (A). Note that the pressure step, AP1, at t. is achieved by pushing a
volume AlV' through the tip of the pressure probe into the cell (B). Thecorresponding volume change during the pressure clamp is plotted in B,the total amount being denoted by A V2. At time t1, the cell is allowed toreach a new water equilibrium state by turgor relaxation brought about bya relatively small water flow directed outwards. The water flow is associ-ated with a change in cell volume denoted by V3. Note that A V1 = changeof the cell volume at constant cell sap volume, A V2 = change of the cellsap volume at constant cell volume, A V3 = change of both the cell sap andcell volume. Although the AlV values refer to different volumes, they are
plotted here against the same axis. A V' = A Vl + A V2 is the experimentallydetermined volume change. The Lp of the cell membrane is calculatedeither from the initial slope of the volume relaxation, s, or from the half-time of the pressure relaxation, according to eqn 18 or eqn 20, respectively.For calculation of the cell volume from these combined pressure clamp/pressure relaxation experiments, see text. B, -- -, Continuation of thevolume regulation, provided that the pressure clamp is maintained until a
new equilibrium state is reached when A V(t oo) = A V'.
the experimental conditions of a pressure clamp experiment.Figure I shows a schematic representation of the experimental
procedure. The first part of the experiment is composed of avolume relaxation at a constant pressure Pf = P, + AP. Thispressure is held constant for 60 to 90 s, a sufficiently long timeinterval to measure accurately the initial slope of the volumerelaxation, which is then used to determine Lp with the aid of eqn18. The cell is then allowed to reach its new water equilibriumstate by a normal turgor relaxation, in which the oil/cell sapboundary is held constant (Fig. IA). Lp can also be calculatedfrom the half-time of the turgor pressure relaxation, provided thate has been determined in an independent experiment. It is, there-fore, possible to compare the Lp values obtained from both avolume and a turgor pressure relaxation. In the experimentalprocedure described here, the cell volume can still be calculatedaccording to eqn 5. AP in eqn 5 has to be replaced by AP2, whichis the pressure difference between the initial and final states ofwater flux equilibrium. The final equilibrium state is reached afterthe turgor pressure relaxation is completed.The volume change of the cell during the whole experiment can
be subdivided into 3 parts: A Vl; A V2; and A V3 (Fig. IB). A Vl is thechange in volume necessary to change the turgor pressure at thebeginning of the pressure clamp experiment. This volume doesnot cross the membrane but passes through the tip ofthe capillary.A 2 and A V3 are the volume changes arising from the water flowacross the membrane during the pressure clamp and the subse-quent turgor pressure relaxation, respectively. A V3 is not mea-
The term dV/dP = E/ VO must be determined in an independentexperiment. This is performed with the aid of the pressure probeby injecting pressure pulses of increasing amplitude into the celland simultaneously determining the corresponding volumechange. The process is repeated using pulses of opposite polarity.On the basis of the preceding considerations, it is evident that,
for the combined pressure clamp/pressure relaxation experiment,the total water flow, A Vm, has to be used in eqn 5 instead of A V.In our experiments, the correction term AP2.dV/dP was only onthe order of 1 to 3%. The volume change, AVm, was generally 80to 900 nl. The combined volume and pressure relaxation mea-surements were completed within 100 s. The volume change andthe duration of the measurement were such that changes in thebiological properties of the cell can reasonably be excluded.
MATERIALS AND METHODS
Cells of C. corallina, originally obtained from Sydney (NewSouth Wales), Australia, were grown in APW (for composition,see Ref. 14). Only regularly shaped cells were used for experi-ments. The volume of the internodes, which were taken from themain axis or from side branches, ranged between 5 and 35 ,ul. Thecells were placed in a special Plexiglas holder and bathed incirculating APW (driven by a peristaltic pump). The temperaturewas kept at 23 ± 2°C. A pressure probe was used to record andhydrostatically change the turgor; changes were also accomplishedosmotically by adding sucrose or mannitol to the medium. Thepressure probe is described in detail elsewhere (12, 15, 16).
Small changes in cell volume and, thus, in cell turgor pressurewere achieved by displacing the oil/cell sap meniscus in themicrocapillary of the pressure probe. This, in turn, was achievedby displacing the metal rod inserted into the chamber of thepressure probe by using a micrometer screw. In the pressure clampexperiments, the turgor pressure was held constant by continuous,manual displacement of the metal rod. The voltage signal fromthe pressure transducer was amplified by an electrometer (Keithley602). In a first approximation, the change in volume produced bythe displacement of the oil/cell sap meniscus, A V', was equal tothe volume ofwater which flowed into or out ofthe cell (dependingon the direction of the displacement). AV' was calculated fromthe diameter of the metal rod and its displacement (measured bythe turns of the micrometer screw). In order to obtain the timecourse for A V', either the position of the micrometer was read atregular intervals signalled by a timer, or the time needed forconstant volume changes was measured. After removal of thepressure clamp (after 60-90 s), the pressure relaxation was mea-
sured in the usual way. The pressure signals were recorded withboth a chart recorder and a digital computer (MINC 11, equippedwith an A/D converter and an adjustable preamplifier interface).The sampling rate was usually 10 values per s. The data, stored ona magnetic disc, could be displayed on a monitor and fitted to anexponential equation using a weighted least squares fit. Theparameters thus obtained had better resolution and accuracy thanthose derived from data taken by chart recorder.
VI
AV'= VI +AV2
AVm = &V2 + AV3 B
1000 Plant Physiol. Vol. 69, 1982

PRESSURE CLAMP EXPERIMENTS
RESULTS AND DISCUSSION
Several endosmotic and exosmotic pressure step experimentscould usually be performed on the same cell at different turgorpressures. Most of them were started with a decrease in turgorpressure (Fig. 2) generated by the displacement of the oil/cell sap
meniscus in the capillary in the direction of the pressure probechamber. Reversal of the sequence of experiments has the distinctdisadvantage that oil from the microcapillary has to be pushedinto the vacuole in order to hold the turgor pressure constant,although no changes in the measured and calculated water relationparameters were observed under these conditions.A set of two typical combined volume and turgor pressure
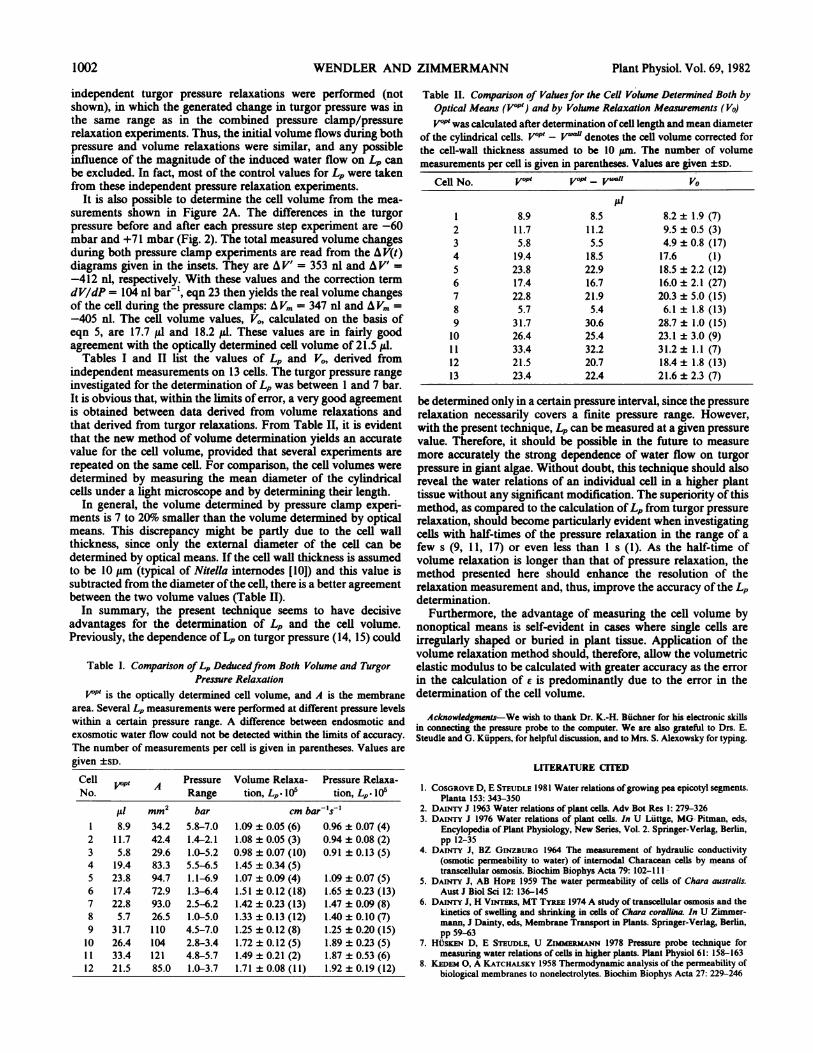
relaxation experiments, as described schematically in Figure 1, isshown in Figure 2A for a cell of C. corallina. The volume andsurface area of this cell were determined to be 21.5 Al and 85 mm2,respectively (Tables I and II, cell number 12). The sequence ofturgor pressure manipulation using the pressure probe was as
follows. The steady state turgor pressure of 1.4 bar, established bythe addition of mannitol to APW, was decreased by 370 mbar andclamped for 64 s. The turgor pressure was then raised again bypressure relaxation to a pressure level which was 60 mbar lowerthan the original one. In a second experimental run, performedon the same cell, the turgor pressure was increased by 350 mbarand clamped at this value for 72 s, prior to the onset of the turgorpressure relaxation.The corresponding changes in volume, A V, with time, t, during
the pressure clamp are presented in the insets. Data points were
taken by measuring the time required for a constant volumechange of 39.2 nl. Note that A V(t) is determined from the displace-ment of the metal rod in the pressure probe. Therefore, extrapo-
C-0
1.5
1.0
A
lation to zero time (i.e. at the onset of the pressure clamp) yieldsthe initially induced volume change, AV1, causing the pressurestep (Fig. 1).As indicated in the insets of Figure 2A, the change of A V with
time can be approximated by a straight line in the first 40-s timeinterval, fitted by the method of least squares; the slope, s, isequal to the initially induced volume change per s due to outwardor inward flow with regard to the cell. These rates of volumechange are calculated to be 5.1 nl s-1 and -5.3 nl s-', respectively,for each pressure clamp. According to eqn 18, these data yieldLpend = 1.6. 10-5 cm bar-'-s-1 and LpeX = 1.8. 10-5 cm bar-l s-1for the endosmotic and exosmotic water flow, respectively (cf 4-6, 16). These values are in good agreement with the values for Lpdetermined from the turgor pressure relaxations directly followingthe pressure clamps (Lpend = 1.5.* O-5 cm bar-' * s-1 and LpeX = 1.8.10- cm bar-l' s-) due to eqn 20. For the calculation of the lattervalues, the elastic modulus of the cell wall and the osmolarity ofthe cell sap have to be known. The E values were determined inthe usual way, by injecting pressure pulses of increasing amplitudeand opposite sign into the cell and measuring the correspondingvolume change from the shift of the metal rod in the pressureprobe.
Figure 2B shows a sequence of positive and negative pressurepulses, from which E = V.- dP/dV is calculated to be 207 bar. Thecompressibility of the measuring system is already taken intoaccount. The osmolarity of the cell sap was calculated to be 3.12bar, using eqn 2; the turgor pressure and the osmolarity of thebathing solution were both measured experimentally, and thereflection coefficient, a, was assumed to be 1 (15).
In addition, following a series of pressure step experiments,
A& (ni) B39.2-
71mbor60mbar--I-
f0.5 - >
0
0'
-sl Iv0S
20 40 60t(s)
ZE
19.69.8
9.8-
-29.4 --39.2 -
AV1 (ni)
1 2 3 4 5t (min)
6 7 9 10 11
FIG. 2. Typical course of a combined pressure clamp/pressure relaxation experiment on an internode of C. corallina. A, Turgor pressure of 1.4 barwas established by adding mannitol to the APW. In the first run, the pressure was reduced in the cell and clamped for 64 s, then the cell was allowedto reach a new water equilibrium state by a turgor relaxation. In a second run, the same experiment was repeated with a pressure step of opposite sign.The corresponding volume changes occurring during the pressure clamp are given in the insets. See text for further details. B, Volume changes ofincreasing amplitude in both directions were applied to the cell with the pressure probe in order to determine the elastic modulus of the cell wall, c =
dP0dV
-I
L
1001
WENDLER AND ZIMMERMANN
independent turgor pressure relaxations were performed (notshown), in which the generated change in turgor pressure was inthe same range as in the combined pressure clamp/pressurerelaxation experiments. Thus, the initial volume flows during bothpressure and volume relaxations were similar, and any possibleinfluence of the magnitude of the induced water flow on 4 canbe excluded. In fact, most of the control values for Lp were takenfrom these independent pressure relaxation experiments.
It is also possible to determine the cell volume from the mea-surements shown in Figure 2A. The differences in the turgorpressure before and after each pressure step experiment are -60mbar and +71 mbar (Fig. 2). The total measured volume changesduring both pressure clamp experiments are read from the A V(t)diagrams given in the insets. They are AV' = 353 nl and AV' =
-412 nl, respectively. With these values and the correction termdV/dP = 104 nl bar-', eqn 23 then yields the real volume changesof the cell during the pressure clamps: A Vm = 347 nl and A Km =-405 nl. The cell volume values, VO, calculated on the basis ofeqn 5, are 17.7 ,tl and 18.2 ,ul. These values are in fairly goodagreement with the optically determined cell volume of 21.5 yl.
Tables I and II list the values of Lp and V., derived fromindependent measurements on 13 cells. The turgor pressure rangeinvestigated for the determination of Lp was between 1 and 7 bar.It is obvious that, within the limits of error, a very good agreementis obtained between data derived from volume relaxations andthat derived from turgor relaxations. From Table II, it is evidentthat the new method of volume determination yields an accuratevalue for the cell volume, provided that several experiments arerepeated on the same cell. For comparison, the cell volumes weredetermined by measuring the mean diameter of the cylindricalcells under a light microscope and by determining their length.
In general, the volume determined by pressure clamp experi-ments is 7 to 20%o smaller than the volume determined by opticalmeans. This discrepancy might be partly due to the cell wallthickness, since only the external diameter of the cell can bedetermined by optical means. If the cell wall thickness is assumedto be 10 ,im (typical of Nitella internodes [10]) and this value issubtracted from the diameter ofthe cell, there is a better agreementbetween the two volume values (Table II).
In summary, the present technique seems to have decisiveadvantages for the determination of Lp and the cell volume.Previously, the dependence of Lp on turgor pressure (14, 15) could
Table I. Comparison ofLp Deducedfrom Both Volume and TurgorPressure Relaxation
PVP' is the optically determined cell volume, and A is the membranearea. Several Lp measurements were performed at different pressure levelswithin a certain pressure range. A difference between endosmotic andexosmotic water flow could not be detected within the limits of accuracy.The number of measurements per cell is given in parentheses. Values are
given ±SD.
CellNo.
r't'p' A Pressure Volume Relaxa- Pressure Relaxa-
Range tion, Lp lI1 tion, Lp l10
,Il mm2 bar cm bar-'s-'1 8.9 34.2 5.8-7.0 1.09 0.05 (6) 0.96 ± 0.07 (4)2 11.7 42.4 1.4-2.1 1.08 0.05 (3) 0.94 ± 0.08 (2)3 5.8 29.6 1.0-5.2 0.98 0.07 (10) 0.91 ± 0.13 (5)4 19.4 83.3 5.5-6.5 1.45 0.34 (5)5 23.8 94.7 1.1-6.9 1.07 0.09 (4) 1.09 ± 0.07 (5)6 17.4 72.9 1.3-6.4 1.51 0.12 (18) 1.65 ± 0.23 (13)7 22.8 93.0 2.5-6.2 1.42 0.23 (13) 1.47 ± 0.09 (8)8 5.7 26.5 1.0-5.0 1.33 0.13 (12) 1.40 ± 0.10 (7)9 31.7 110 4.5-7.0 1.25 ±0.12 (8) 1.25 ± 0.20 (15)10 26.4 104 2.8-3.4 1.72 ± 0.12 (5) 1.89 ± 0.23 (5)11 33.4 121 4.8-5.7 1.49 ± 0.21 (2) 1.87 ± 0.53 (6)12 21.5 85.0 1.0-3.7 1.71 ± 0.08 (11) 1.92 ± 0.19 (12)
Table II. Comparison of Valuesfor the Cell Volume Determined Both byOptical Means (V-Pt) and by Volume Relaxation Measurements (Vo)V'O was calculated after determination ofcell length and mean diameter
of the cylindrical cells. Vt" - VaKl denotes the cell volume corrected forthe cell-wall thickness assumed to be 10 ,um. The number of volumemeasurements per cell is given in parentheses. Values are given ±SD.
Cell No. V0°t Vopt -Vwall VO
'l1 8.9 8.5 8.2 + 1.9 (7)2 11.7 11.2 9.5 ± 0.5 (3)3 5.8 5.5 4.9 ± 0.8 (17)4 19.4 18.5 17.6 (1)5 23.8 22.9 18.5 ± 2.2 (12)6 17.4 16.7 16.0 ± 2.1 (27)7 22.8 21.9 20.3 + 5.0 (15)8 5.7 5.4 6.1 ± 1.8 (13)9 31.7 30.6 28.7 ± 1.0 (15)10 26.4 25.4 23.1 ± 3.0 (9)11 33.4 32.2 31.2 ± 1.1 (7)12 21.5 20.7 18.4 ± 1.8 (13)13 23.4 22.4 21.6 ± 2.3 (7)
be determined only in a certain pressure interval, since the pressurerelaxation necessarily covers a finite pressure range. However,with the present technique, 4 can be measured at a given pressurevalue. Therefore, it should be possible in the future to measuremore accurately the strong dependence of water flow on turgorpressure in giant algae. Without doubt, this technique should alsoreveal the water relations of an individual cell in a higher planttissue without any significant modification. The superiority of thismethod, as compared to the calculation ofLp from turgor pressurerelaxation, should become particularly evident when investigatingcells with half-times of the pressure relaxation in the range of afew s (9, 11, 17) or even less than 1 s (1). As the half-time ofvolume relaxation is longer than that of pressure relaxation, themethod presented here should enhance the resolution of therelaxation measurement and, thus, improve the accuracy of the L.determination.
Furthermore, the advantage of measuring the cell volume bynonoptical means is self-evident in cases where single cells areirregularly shaped or buried in plant tissue. Application of thevolume relaxation method should, therefore, allow the volumetricelastic modulus to be calculated with greater accuracy as the errorin the calculation of e is predominantly due to the error in thedetermination of the cell volume.
Acknowledgments-We wish to thank Dr. K.-H. Buchner for his electronic skillsin connecting the pressure probe to the computer. We are also grateful to Drs. E.Steudle and G. Kuppers, for helpful discussion, and to Mrs. S. Alexowsky for typing.
LITERATURE CITED
1. COSGROVE D, E STEUDLE 1981 Water relations ofgrowing pea epicotyl segments.Planta 153: 343-350
2. DAiNTY J 1963 Water relations of plant cclls. Adv Bot Res 1: 279-3263. DAINTY J 1976 Water relations of plant cells. In U Luttge, MG- Pitman, eds,
Encylopedia of Plant Physiology, New Series, Vol. 2. Springer-Verlag, Berlin,pp 12-35
4. DAINTY J, BZ GINZBURG 1964 The measurement of hydraulic conductivity(osmotic permeability to water) of intemodal Characean cells by means oftranscellular osmosis. Biochim Biophys Acta 79: 102-111
5. DAINTY J, AB HOPE 1959 The water permeability of cells of Chara australis.Aust J Biol Sci 12: 136-145
6. DAINTY J, H ViNTrs, MT TYREE 1974 A study of transcellular osmosis and thekinetics of swelling and shrinking in cells of Chara coralltna In U Zinmer-mann, J Dainty, eds, Membrane Transport in Plants. Springer-Verlag, Berlin,pp 59-63
7. HUsKEN D, E STEUDLE, U ZIMMERMANN 1978 Pressure probe technique formeasuring water relations of cells in higher plants. Plant Physiol 61: 158-163
8. KEDEM 0, A KATCHALSKY 1958 Thermodynamic analysis of the permeability ofbiological membranes to nonelectrolytes. Biochim Biophys Acta 27: 229-246
1002 Plant Physiol. Vol. 69, 1982

PRESSURE CLAMP EXPERIMENTS
9. STEUDLE E, JAC SMITH, U LUTrGE 1980 Water relation parameters of individualmesophyll cells of the CAM plant Kalanchoe daigremontiana Plant Physiol 66:1155-1163
10. TAZAWA M, N KAMIYA 1965 Water relations of Characean internodal cell. AnnRep Biol Works Fac Sci Osaka Univ 13: 123-157
11. ToMOs AD, E STEUDLE, U ZimmERmANN, E-D SCHULZE 1981 Water relations ofleaf epidermal cells of Tradescantia virguuana Plant Physiol 68: 1135-1143
12. ZIMMERMANN U 1980 Pressure mediated osmoregulatory processes and pressure
sensing mechanism. In R Gilles, ed, Animals and Environmental Fitness.Pergamon Press, Oxford, pp 441-459
13. ZIMMERMANN U, E STEUDLE 1974 The pressure-dependence of the hydraulic
conductivity, the membrane resistance and membrane potential during turgorpressure regulation in Valonia utricularis. J Membr Biol 16: 331-352
14. ZIMMERMANN U, E STEUDLE 1975 The hydraulic conductivity and volumetricelastic modulus of cells and isolated cell walls of Nitella and Chara spp:Pressure and volume effects. Aust J Plant Physiol 2: 1-12
15. ZImMERMANN U, E STEUDLE 1978 Physical aspects of water relations of plantcells. Adv Bot Res 6: 45-117
16. ZNmmRmANN U, E STEuDLE 1980 Fundamental water relation parameters. InRE Spanswick, WJ Lucas, J Dainty, eds, Plant Membrane Transport: CurrentConceptual Issues. Elsevier/North Holland, Amsterdam, pp 113-128
17. ZimmsAsNN U, D HUsKEN, E SCHULZE 1980 Direct turgor pressure measure-ments in individual leaf cells of Tradescantia virguiuana. Planta 149: 445-453
1003