Embed Size (px)
Citation preview

NEW METHODOLOGY FOR TRANSMISSION LINE
RELAY TESTING AND EVALUATION USING ADVANCED TOOLS
A Thesis
by
DRAGAN RISTANOVIC
Submitted to the Office of Graduate Studies of Texas A&M University
in partial fulfillment of the requirements for the degree of
MASTER OF SCIENCE
December 2003
Major Subject: Electrical Engineering

NEW METHODOLOGY FOR TRANSMISSION LINE
RELAY TESTING AND EVALUATION USING ADVANCED TOOLS
A Thesis
by
DRAGAN RISTANOVIC
Submitted to Texas A&M University in partial fulfillment of the requirements
for the degree of
MASTER OF SCIENCE
Approved as to style and content by:
__________________________________ Mladen Kezunovic
(Chair of Committee)
__________________________________ Ali Abur (Member)
__________________________________ Zixiang Xiong
(Member)
__________________________________ William M. Lively
(Member)
__________________________________ Chanan Singh
(Head of Department)
December 2003
Major Subject: Electrical Engineering
iii
ABSTRACT
New Methodology for Transmission Line Relay Testing and Evaluation
Using Advanced Tools. (December 2003)
Dragan Ristanovic, B.S., University of Belgrade, Yugoslavia
Chair of Advisory Committee: Dr. Mladen Kezunovic
Protective relays are important parts of the power system. The protection guards
valuable equipment, and protective relays play a vital role in performing the task. The
relay detects fault conditions within an assigned area, opens and closes output contacts
to cause the operation of other devices under its control. The relay acts to operate the
appropriate circuit breakers to prevent damage to personnel and property. To ensure
consistent reliability and proper operation, protective relay equipment must be evaluated
and tested.
The importance of the relay evaluation issue is linked to capability to test the
relays and relaying systems using very accurate waveform representation of a fault
event. The purpose of testing protective relays is to ensure correct operation of the relay
for all possible power system conditions and disturbances. To fulfill this purpose, relay
testing in varying network configurations and with different fault types is required.
There are a variety of options that have different performance potentials and
implementation constraints. Use of digital simulators to test protective relays has proven
to be an invaluable mean to evaluate relay performance under realistic conditions.
This thesis describes a new methodology that attempts to improve the existing
practices in testing relays by using advanced digital simulator hardware, different
software packages for network modeling, and new software tools for generating and
replaying test waveforms.
Various types of microprocessor relays are tested and evaluated through the set
of scenarios. New methodology that combines different software packages to facilitate
particular testing objectives is applied.

iv
ACKNOWLEDGMENTS
I would like to express sincere gratitude to my advisor, Dr. Mladen Kezunovic,
for his guidance and support throughout my study at Texas A&M University. Sincere
thanks and gratitude are also given to my teachers and committee members.
v
TABLE OF CONTENTS
Page
ABSTRACT ................................................................................................................ iii
ACKNOWLEDGMENTS ............................................................................................iv
TABLE OF CONTENTS ..............................................................................................v
LIST OF TABLES.......................................................................................................vii
LIST OF FIGURES ......................................................................................................ix
CHAPTER
I INTRODUCTION...............................................................................................1
Problem Definition.....................................................................................1 Existing Testing Tools and Practices .........................................................3 Conclusion..................................................................................................4
II THEORETICAL CONSIDERATION OF RELAY RESPONSES ....................5
Introduction ................................................................................................5 Functional Elements of Protective Relays .................................................5 Operating Characteristics of Protective Relays..........................................6 Relay Responses to Transients .................................................................13 Transient Responses of Numerical Relays...............................................17 Conclusion................................................................................................23
III PROTECTIVE RELAY TESTING BACKGROUND .....................................24
Introduction ..............................................................................................24 Generating Test Signals ...........................................................................24 Test Aparatus for Relay Testing...............................................................27 Relay Tests ...............................................................................................31 Equipment and Tools in Transient Testing ..............................................37 Relay Test Procedures in Transient Testing.............................................41 Conclusion................................................................................................43

vi
CHAPTER Page
IV NEW METHODOLOGY FOR RELAY TESTING AND EVALUATION ....45
Introduction ..............................................................................................45 Definition of the New Methodology ........................................................46 Hardware Options ....................................................................................50 Software Architecture ..............................................................................52 Network Models .......................................................................................55 Test Procedure..........................................................................................57 Conclusion................................................................................................65
V TEST METHODOLOGY APPLICATION AND RESULTS ..........................67
Introduction ..............................................................................................67 Protective Relays......................................................................................67 Relay Testing Scenarios and Results .......................................................71 Comparisons of Hardware Tools and Software Packages .......................93 Conclusion................................................................................................98
VI CONCLUSION ...............................................................................................100
Summary ................................................................................................100 Contribution ...........................................................................................101
REFERENCES ..........................................................................................................103
VITA .........................................................................................................................107
vii
LIST OF TABLES TABLE Page
I Test accuracies for relays .....................................................................................34
II I/O hardware characteristics.................................................................................52
III Summary of the events .........................................................................................65
IV Relay A – AG fault...............................................................................................79
V Relay A – BC fault ...............................................................................................80
VI Relay A – BCG fault ............................................................................................80
VII Relay A – ABC fault ............................................................................................81
VIII Relay A – ABCG fault .........................................................................................82
IX Relay A – special faults........................................................................................82
X Relay B – AG fault...............................................................................................84
XI Relay B – BC fault ...............................................................................................84
XII Relay B – BCG fault ............................................................................................85
XIII Relay B – ABC fault ............................................................................................86
XIV Relay B – ABCG fault .........................................................................................86
XV Relay B – special faults ........................................................................................87
XVI Relay C – AG fault...............................................................................................88
XVII Relay C – BC fault ...............................................................................................88
XVIII Relay C – BCG fault ............................................................................................89
XIX Relay C – ABC fault ............................................................................................89
XX Relay C – ABCG fault .........................................................................................89
viii TABLE Page
XXI Relay C – special faults ........................................................................................90
XXII Relay D – AG fault...............................................................................................91
XXIII Relay D – BC fault ...............................................................................................91
XXIV Relay D – BCG fault ............................................................................................91
XXV Relay D – ABC fault ............................................................................................92
XXVI Relay D – ABCG fault .........................................................................................92
XXVII Relay D – special faults.....................................................................................92
XXVIII Requirements: hardware options.......................................................................95
XXIX Requirements: software packages .....................................................................97
XXX Main features of Package 4 ...............................................................................98
ix
LIST OF FIGURES FIGURE Page
1 Protective device functional elements....................................................................6
2 Inverse time overcurrent characteristic ..................................................................7
3 An operating characteristic of a percentage differential relay ...............................9
4 Mho operating characteristic of a distance relay..................................................10
5 Major components of a digital relay ....................................................................13
6 The front end of a digital relay.............................................................................14
7 DTFT algorithm with eight sample full cycle window ........................................17
8 Algorithm evaluation criterion function...............................................................21
9 Steady state representation of a set of current and voltage signals ......................28
10 Dynamic representation of a set of current and voltage signals...........................29
11 Transient representation of a set of voltage and current signals ..........................30
12 Operating characteristic – phasor testing .............................................................32
13 Flow chart – one method for phasor testing of distance relays ............................33
14 One terminal test configuration............................................................................36
15 Two terminal test configuration ...........................................................................36
16 Hardware options used in simulations .................................................................51
17 Software architecture used in simulations............................................................54
18 Model 1 ................................................................................................................55
19 Model 2 ................................................................................................................56
20 Model 3 ................................................................................................................57

x FIGURE Page
21 Test procedure – flowchart...................................................................................58
22 Test procedure – standard faults...........................................................................59
23 Parallel line out of service ....................................................................................61
24 Fault in reverse direction......................................................................................62
25 Cross-country fault ...............................................................................................64
26 Parallel line in service – waveform ......................................................................72
27 Parallel line out of service – waveform................................................................73
28 Switching on-to fault – waveform........................................................................74
29 Weak infeed system – waveform .........................................................................75
30 Fault in reverse direction – waveform..................................................................76
31 Cross-country fault – waveform...........................................................................77
32 Evolving fault – waveform...................................................................................78
1
CHAPTER I
INTRODUCTION
Problem Definition Modern power transmission and distribution systems need high-performance
protection devices. Relays must have high speed of operation for internal system fault
conditions and high level of discrimination between internal and external power system
faults. Relays, together with the circuit breakers, shall disconnect faulty parts of the
power system. Their main role is to protect the primary equipment against unnecessary
damages, save people in vicinity of the electrical plant from injuries, and enable
continued service in the undamaged parts of the network [1] .
To accomplish its main tasks, requirements on protection system are: speed,
sensitivity, selectivity and reliability [2], [3]. Evaluation and testing protective devices
must be conducted to check and predict how capable the relays are to fulfill the main
requirements for system protection.
Two major approaches in relay testing exist in practice. The first, conventional
approach uses phasor values of currents and voltages to verify the operating
characteristic of a protective relay and tripping time for steady state currents and
voltages [4]. The second, advanced approach uses transient values of currents and
voltages to check selectivity of a protective relay and to check if the average tripping
time is within tolerances [5]. Modern approaches in transient testing are to test the relays
using the inputs the relays will see in the actual system during faults [5], [6].
Transient testing becomes necessary with modern microprocessor based relays.
Information-processing techniques and random properties of numerical relay responses
require testing with current and voltage waveforms similar to the ones that the relay
would be exposed to in a real network. Faults and disturbances that occur in a real
network are of a transient nature. Testing numerical protective relays and verifying their
This thesis follows the style and format of IEEE Transactions on Power Delivery.
2
characteristics by conventional methods using steady state fault quantities, may not be
sufficient to conclude whether these relays would operate correctly in a real system. The
crucial issue is selectivity and operating time of the relays exposed to transients.
Two cases where transient testing evaluations proved very useful were observed.
One situation where such approach can be used is in trouble-shooting relay
misoperations. Being able to recreate the conditions of the fault and associated relay
operation allows one to reconstruct the course of events very accurately. Another case is
when the new relays need to be procured. User can assure weather a given relay is
suitable for the specific power system application by testing a relay under realistic
conditions. Although the benefits of transient testing are identified in these two cases,
transient tests are still not widely used in practice. There is no methodology to use when
the transient tests are to be performed.
While considerable activity continues in the research and development of
microprocessor based relays, generally, little work is being done in developing a testing
methodology for the microprocessor relays. When used, transient testing procedures are
defined randomly and intuitively, to achieve particular task to test relay for a specific
scenario. There is no methodology established for transient testing procedures.
In the analysis of the existing transient testing approaches, it is important to
observe that for the same fault location, but different fault type and fault inception time,
which is a random value, transient waveform may look different [7]. Operating time of
numerical relay is also a random value. It is necessary to perform a large number of
tests, to determine statistical properties of the relay responses, to check its selectivity and
average tripping time. There is no methodology defined with theoretical background and
explicit recommendations how the transient tests should be conducted to evaluate
random behavior of numerical relays.
In summary, the new methodology would need to give the answers to the
following important questions:
- Why and when the transient tests are needed?
- What procedures should be applied in transient testing?
3
- How the transient tests should be created and implemented?
Development of a new methodology that will improve transient testing and its
implementation is the major focus of this thesis.
Existing Testing Tools and Practices Several concepts are realized in practice to conduct transient testing. These
concepts include application of various hardware and software tools to create test cases
and generate transient waveforms. These concepts do not provide comprehensively
defined methodology. Theoretical considerations of transient testing and its application
with numerical relays are not well understood. Existing concepts in transient testing are
focused on testing tools application with random and intuitive definition of test
scenarios.
The latest approaches in transient testing use digital simulators and model the
power network and faults with electromagnetic transient programs for testing protective
relays. This offers the user flexibility and accuracy while performing tests. Researchers
designed such simulator modeling the transients similar to those occurring in real
networks [8], [9], [10]. Such simulators may be used not only for protective relays
testing, but also for research related to evaluation of power systems performance.
Another advanced practice in transient testing of protective relays is the use of
digital real time simulators, together with replaying software and software for transient
simulations. Such arrangement provides flexible adjustment of testing parameters and
rapid execution of test cases [6]. The flexibility to change the power system network
model connected to protective relays being tested is important. Using a batch-testing
feature, it is possible to automatically test the relay in varying network configurations
and with different fault types. The batch testing mode meets the need to have many
simulation cases for varying parameters, for example: length of a line, source
impedance, location of a fault, fault type, fault resistance, etc.
Relay test sets and digital simulators can also utilize recordings from digital fault
recorders [11]. Waveforms from a real event can be replayed to the relay under test. That
is very useful in diagnostic applications, particularly if some unexpected or wrong relay
4
operation has taken place in the field. The IEEE COMTRADE standardizes the format
of such files and greatly facilitates the transportability of recorded or simulated files
between different platforms [12].
The existing approaches do not define methodology for transient testing of
protective relays.
Conclusion This thesis explores the current state of relay test practices, analyzes possible
trends and finally demonstrates how a new methodology is needed to enhance relay
testing. The new methodology for transient tests of numerical transmission line relays
will be defined, with main objective to emphasize why the transient tests are necessary,
what procedures should be applied in transient tests and how these tests should be
created and conducted.
To answer why the transient tests are necessary, theoretical background of
protective relay responses will be given. Random behavior of numerical relay responses
will be considered.
After describing software and hardware tools used in relay testing, procedures for
transient testing of transmission line relays will be defined. It will be explained when the
transient tests should be applied. Procedures will be established to check selectivity and
average tripping time of protective relays. Criteria for proper relay operation and cases
for relay testing will be proposed. It will be explained how to execute the test cases in
repetitive shots. Several aspects in implementation will be analyzed: advanced hardware
tools for relay testing, software packages for network modeling and event simulation,
new software tools for generating test signals and replaying the waveforms obtained in
different applications. Defining scenarios for relay tests will be discussed in detail.
Practical implementation of the new methodology to test and evaluate various types of
microprocessor relays will be presented.

5
CHAPTER II
THEORETICAL CONSIDERATION OF RELAY RESPONSES
Introduction System protection has evolved, over the years, from relatively primitive devices
with limited capability, to complex systems that involve extensive use of modern
hardware components and software solutions. These modern protective systems are more
selective in their detection and operation. They often require greater analytical effort in
the analysis and application as well as advanced methods for evaluation and testing.
This chapter provides basic theoretical background of protective relay responses.
Functional elements of protective relays will be presented and basic types of relay
operating characteristics will be given. Difference between protective relay responses for
steady state voltages and currents and for transient voltages and currents will be
explained with particular emphasis on random characteristics of numerical relay
responses. Basic operation principle of numerical relays will be shown. It will be
explained why the transient tests are required. Theoretical background given in this
chapter will be used in further considerations of how the transient tests should be
conducted to reflect the random nature of relay responses.
Functional Elements of Protective Relays Before proceeding with analysis of protective relay responses, functional
elements of protective relays will be described. The protective device usually consists of
several elements that are arranged to detect the system condition, make a decision if the
observed variables are over/under the acceptable limit, and take proper action if
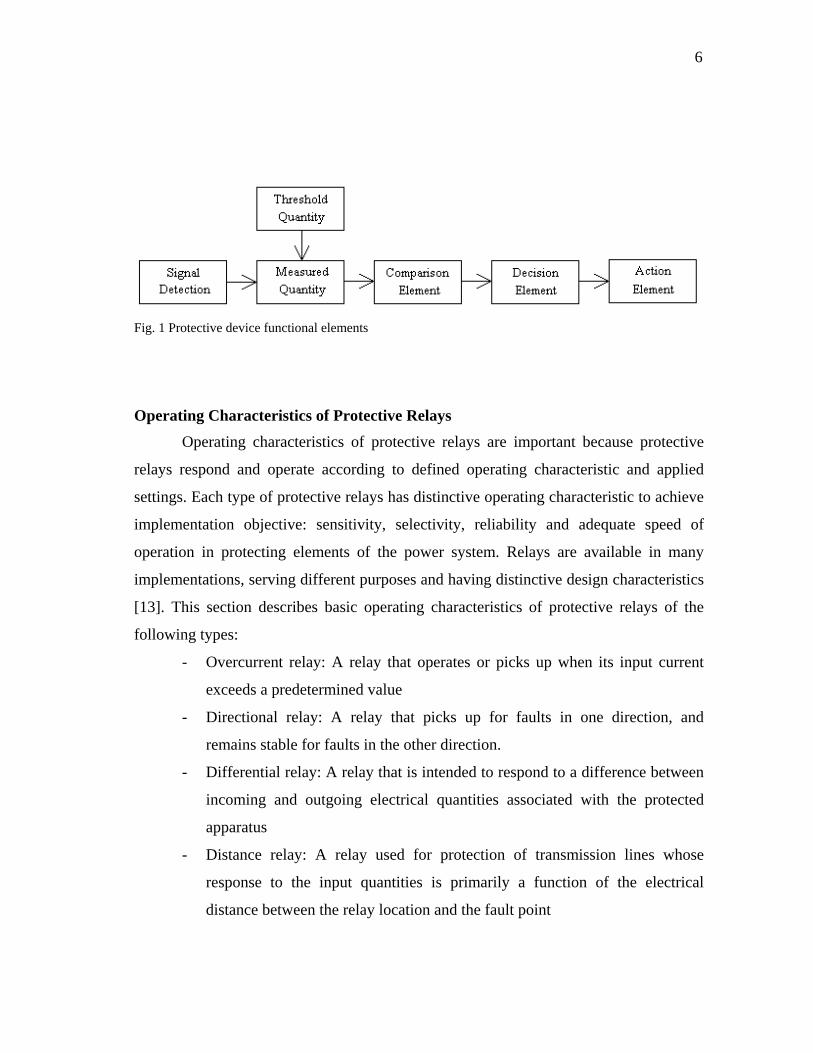
acceptable limits are crossed [2]. These elements are arranged as shown in Fig. 1
Protective system measures system quantities such as voltages and currents, and
compares these quantities or their combination against a threshold setting. If this
comparison indicates that the thresholds are crossed, a decision element is triggered.
This may involve a timing element, to determine if the condition is permanent or
temporary. If all checks are satisfied, the relay (action element) operates.
6
Fig. 1 Protective device functional elements
Operating Characteristics of Protective Relays Operating characteristics of protective relays are important because protective
relays respond and operate according to defined operating characteristic and applied
settings. Each type of protective relays has distinctive operating characteristic to achieve
implementation objective: sensitivity, selectivity, reliability and adequate speed of
operation in protecting elements of the power system. Relays are available in many
implementations, serving different purposes and having distinctive design characteristics
[13]. This section describes basic operating characteristics of protective relays of the
following types:
- Overcurrent relay: A relay that operates or picks up when its input current
exceeds a predetermined value
- Directional relay: A relay that picks up for faults in one direction, and
remains stable for faults in the other direction.
- Differential relay: A relay that is intended to respond to a difference between
incoming and outgoing electrical quantities associated with the protected
apparatus
- Distance relay: A relay used for protection of transmission lines whose
response to the input quantities is primarily a function of the electrical
distance between the relay location and the fault point
7
- Pilot protection: A form of the transmission line protection that uses a
communication channel as the means of comparing electrical quantities at the
line terminals
Overcurrent relays
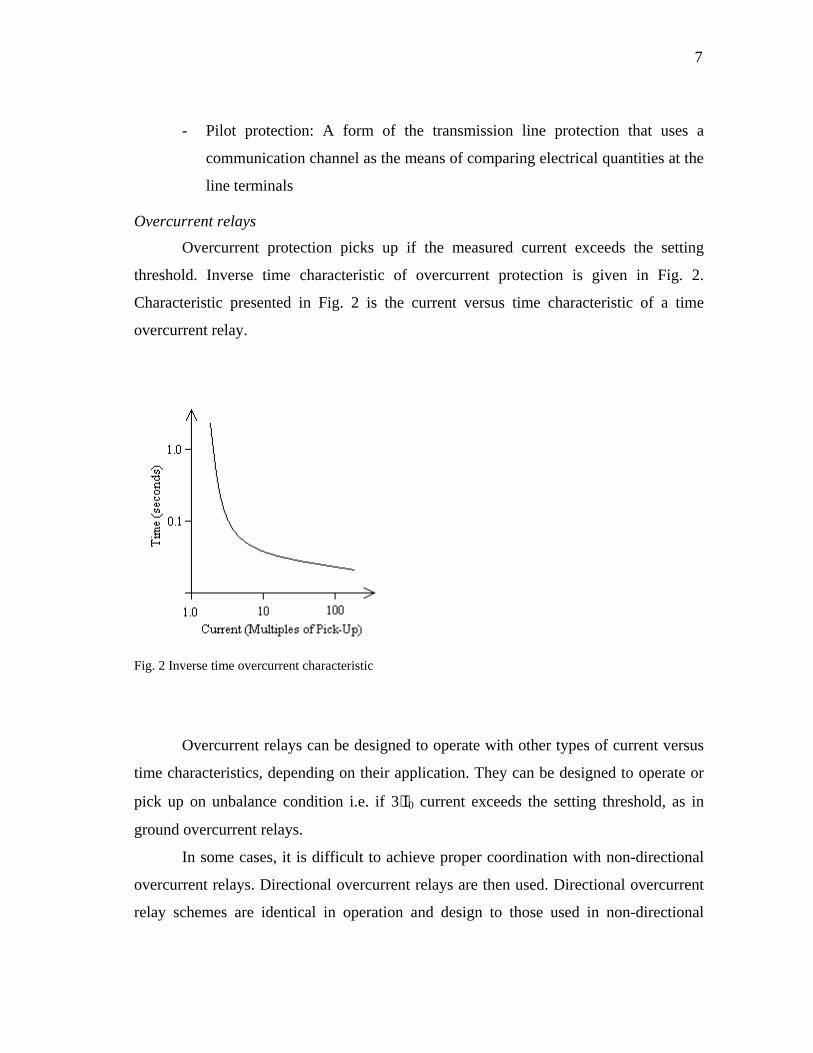
Overcurrent protection picks up if the measured current exceeds the setting
threshold. Inverse time characteristic of overcurrent protection is given in Fig. 2.
Characteristic presented in Fig. 2 is the current versus time characteristic of a time
overcurrent relay.
Fig. 2 Inverse time overcurrent characteristic
Overcurrent relays can be designed to operate with other types of current versus
time characteristics, depending on their application. They can be designed to operate or
pick up on unbalance condition i.e. if 3⋅I0 current exceeds the setting threshold, as in
ground overcurrent relays.
In some cases, it is difficult to achieve proper coordination with non-directional
overcurrent relays. Directional overcurrent relays are then used. Directional overcurrent
relay schemes are identical in operation and design to those used in non-directional
8
overcurrent relay schemes, with the exception that the operation will be controlled and
supervised by the directional unit. Directional overcurrent relays respond to faults in
only one direction which allows the relay to be set in coordination with other relays
downstream from the relay location. Testing the directional overcurrent relays by
applying new methodology will be analyzed in this research.
Differential relays
Differential relays are commonly used to protect generators, buses and
transformers. Although not used in this research, they are widely used in practice and
their operation characteristic is explained. Differential relay is applied on a multi
terminal element such as two-winding power transformer. In case there is no internal
fault and assuming CT’s with matching ratios, currents measured at terminals are
identical I1 = I2. Current in the relay operating coil is zero and relay does not operate.
For the internal fault, I1 ≠ I2, and differential current I1 – I2 flows in the relay
operating coil, which may cause the relay to operate. Since the relay operation depends
on a differential current, it is called a differential relay.
In reality, if protected element (i.e. power transformer) is in a normal service,
there will be a small differential current due to a mismatch of the CT ratio (auxiliary
CT’s normally have limited number of taps and will not get an exact adjustment), power
transformer magnetizing current and position of the tap changer.
Differential current increases for an external fault. A “through-fault” current of
10 times the rated current (with a tap changer at end position) can cause a differential
current of 1 to 2 times the power transformer rated current. In order to avoid operation
under these conditions, the differential protection is provided with a percentage,
“through-fault”, restraint circuit. The percentage restraint ensures that tripping is
obtained only if the differential current reaches a certain percentage of the total
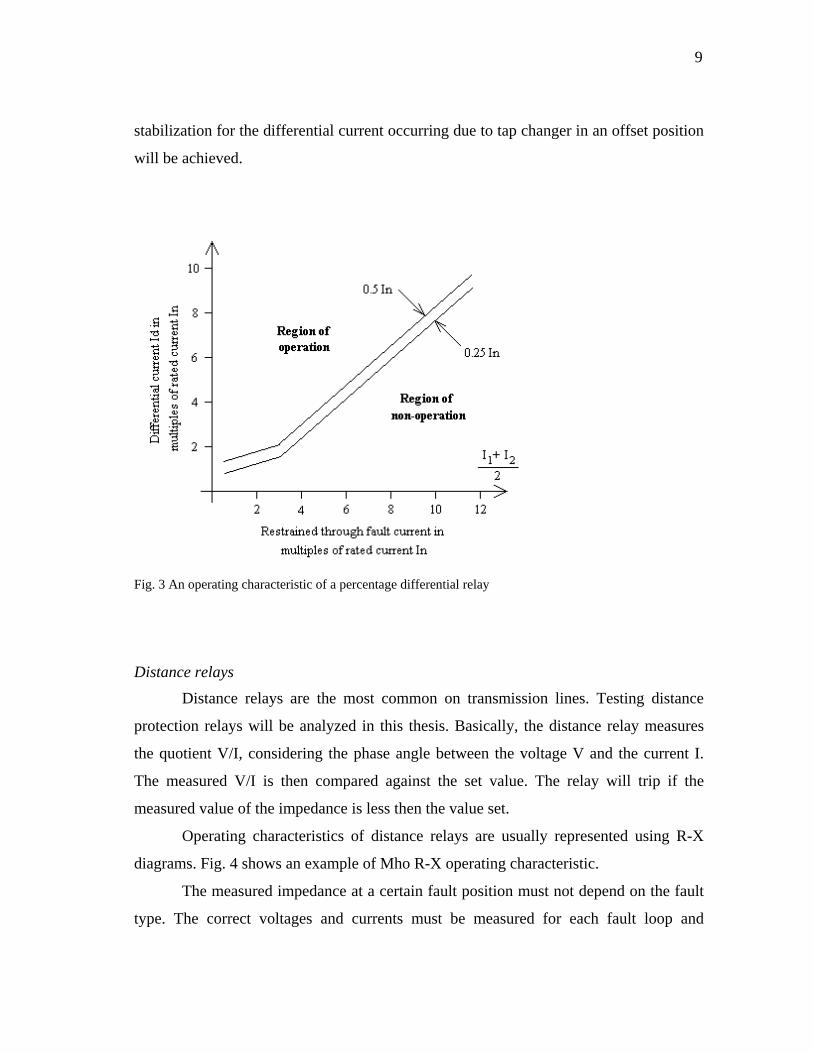
“through-fault” current. A typical operating characteristic is given in Fig. 3.
The current (I1 + I2)/2 is the measured “through-fault” current and the differential
current required for operation will increase with increasing “through-fault” current, and
9
stabilization for the differential current occurring due to tap changer in an offset position
will be achieved.
Fig. 3 An operating characteristic of a percentage differential relay
Distance relays
Distance relays are the most common on transmission lines. Testing distance
protection relays will be analyzed in this thesis. Basically, the distance relay measures
the quotient V/I, considering the phase angle between the voltage V and the current I.
The measured V/I is then compared against the set value. The relay will trip if the
measured value of the impedance is less then the value set.
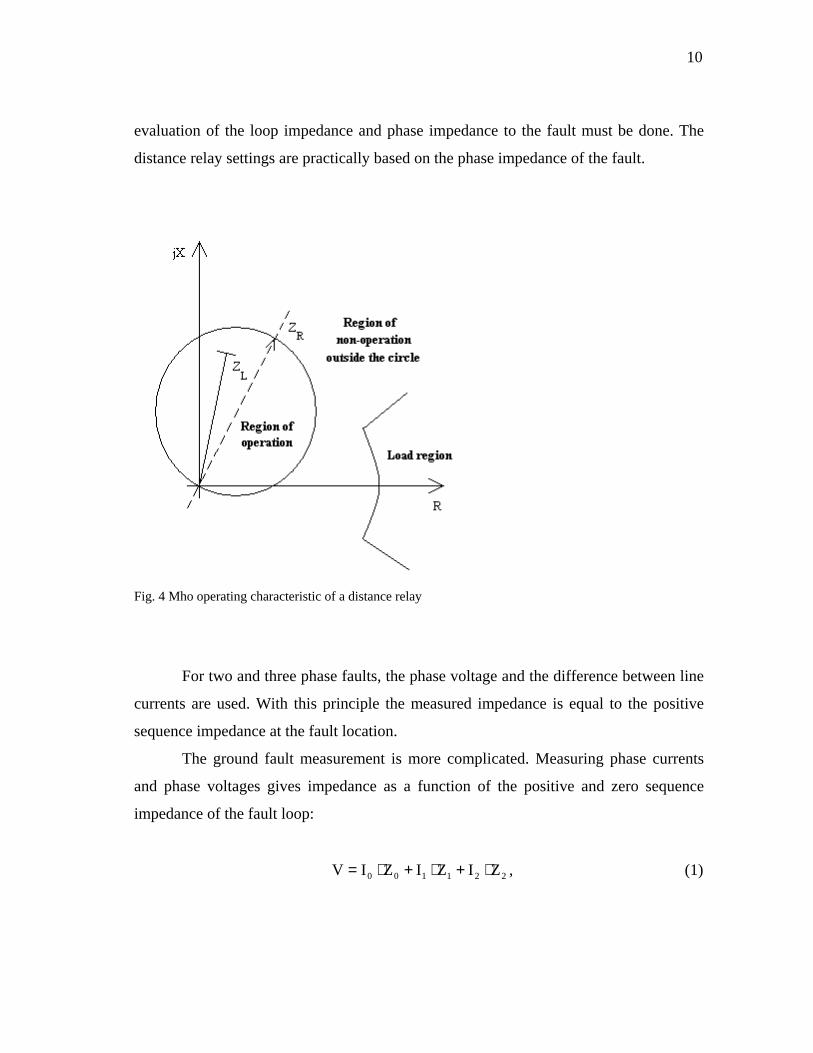
Operating characteristics of distance relays are usually represented using R-X
diagrams. Fig. 4 shows an example of Mho R-X operating characteristic.
The measured impedance at a certain fault position must not depend on the fault
type. The correct voltages and currents must be measured for each fault loop and
10
evaluation of the loop impedance and phase impedance to the fault must be done. The
distance relay settings are practically based on the phase impedance of the fault.
Fig. 4 Mho operating characteristic of a distance relay
For two and three phase faults, the phase voltage and the difference between line
currents are used. With this principle the measured impedance is equal to the positive
sequence impedance at the fault location.
The ground fault measurement is more complicated. Measuring phase currents
and phase voltages gives impedance as a function of the positive and zero sequence
impedance of the fault loop:
221100 ZIZIZIV ⋅+⋅+⋅= , (1)

11
where 21 ZZ =
10002101 ZIZI)III(ZV ⋅−⋅+++⋅= (2)
210 IIII ++= (3)
−⋅⋅+⋅=
−⋅⋅+⋅= 1
ZZZ
3IZI1
ZZZIZIV
1
01
N1
1
0101 (4)
Fundamental equation for impedance measurement of a single line to ground
fault is:
NN
1 IKIVZ
⋅+= (5)
The current used is the phase current plus the neutral current times a factor KN.
The zero sequence compensation factor is 110N Z3/)ZZ(K ⋅−= . The factor KN is a
transmission line constant and Z0/Z1 is assumed to be identical throughout the whole line
length. The total loop impedance for the ground loop can be described with (1+KN)⋅Z1.
Neutral compensation factor KN should be taken into account when checking the
distance relay characteristics for ground faults.
Pilot protection
In most distance protection scheme applications, at least at voltages ≥130kV,
communication channel between the two ends are utilized to improve the protection
system behavior. The most common communication link is the power line carrier (PLC)
equipment. The distance protection relays can communicate in two basic schemes
“Permissive” or “Blocking” or in a number of versions of these two basic schemes [2].
12
In the permissive scheme, an acceleration signal is sent by a relay at one end to
the relay at the remote end when the fault is detected in a forward direction. Tripping is
initiated when the acceleration signal is received and if the local relay has detected a
forward fault as well.
In the blocking scheme, a blocking signal is sent by a relay at one end to the
relay at the remote end when the fault is detected in reverse direction. Tripping is
initiated when the blocking signal is not received within a time of T0 and if the local
relay has detected a forward fault. A time margin T0 of 20 – 40 ms is always needed to
check if the blocking signal is received.
Testing pilot protection schemes will not be analyzed in this research, but basic
explanation was given because pilot protection schemes are commonly applied in power
systems.
Conclusion
Operating characteristics play important role in implementation of protective
relays. This section described the most common operating characteristics and schemes.
These characteristics are defined by relay design and settings. They can be obtained
from relay manuals or calculated according to the relay manufacturer recommendations.
It is expected that protective relay responds and operates according to its operating
characteristic, and therefore it is usual practice to verify the operating characteristic by
testing. Shape of the operating characteristic is defined for steady state values of currents
and voltages. Classical approach in relay testing with phasors of currents and voltages is
used to verify the operating characteristics. When transient test is used, shape of the
operating characteristic cannot be verified, but transient tests are aimed at another
important goal: to check selectivity of protective relay and average speed of operation.
Although the shape of the operating characteristic is not explicitly verified in transient
testing, the main functional purposes of the operating characteristic to provide
selectivity, reliability, sensitivity and satisfactory speed of operation are implicitly
checked in transient testing.
13
Relay Responses to Transients When settings of protective relays are calculated and applied, it is expected that
the relay responds to currents and voltages measured at its terminals according to its
settings and applied characteristics. In a real network, protective relays are exposed to
transients. Electromechanical and solid state protective relays respond to such transients
similarly as if they would respond to steady state fault currents and voltages, because of
the inertia and averaging effect in measuring and processing the analogue transient fault
signal.
Numerical relays respond to transients differently. They use signal processing
techniques and numerical algorithms to calculate the fault. In each calculation step,
samples of transient voltages and currents are processed [14]. Based on sampled values,
measurement element calculates the fundamental frequency component or desired
harmonic component in some applications. Decision-making element makes decision
whether the relay will trip or not. Operating time (time from fault detection to making
decision and tripping) and selectivity of relays exposed to transients are the most critical
and the most important properties in applying the numerical relays. Basic principles of
operation of numerical relays are given in the sequel.
Numerical relays
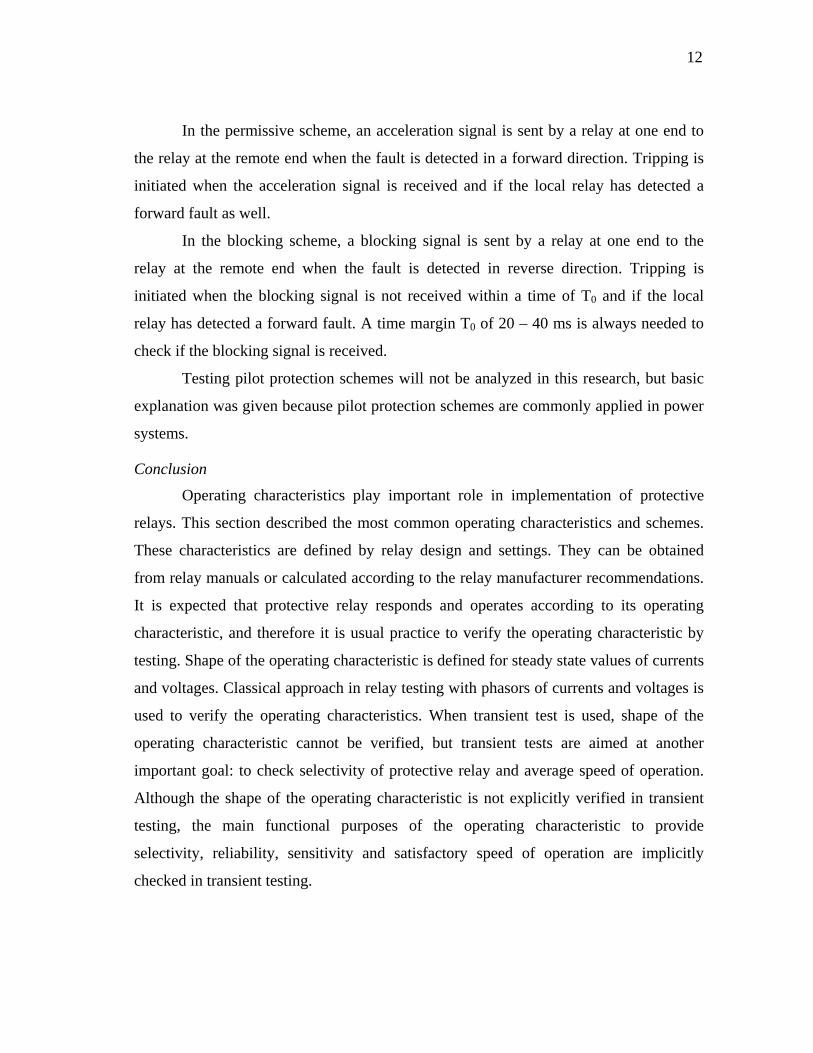
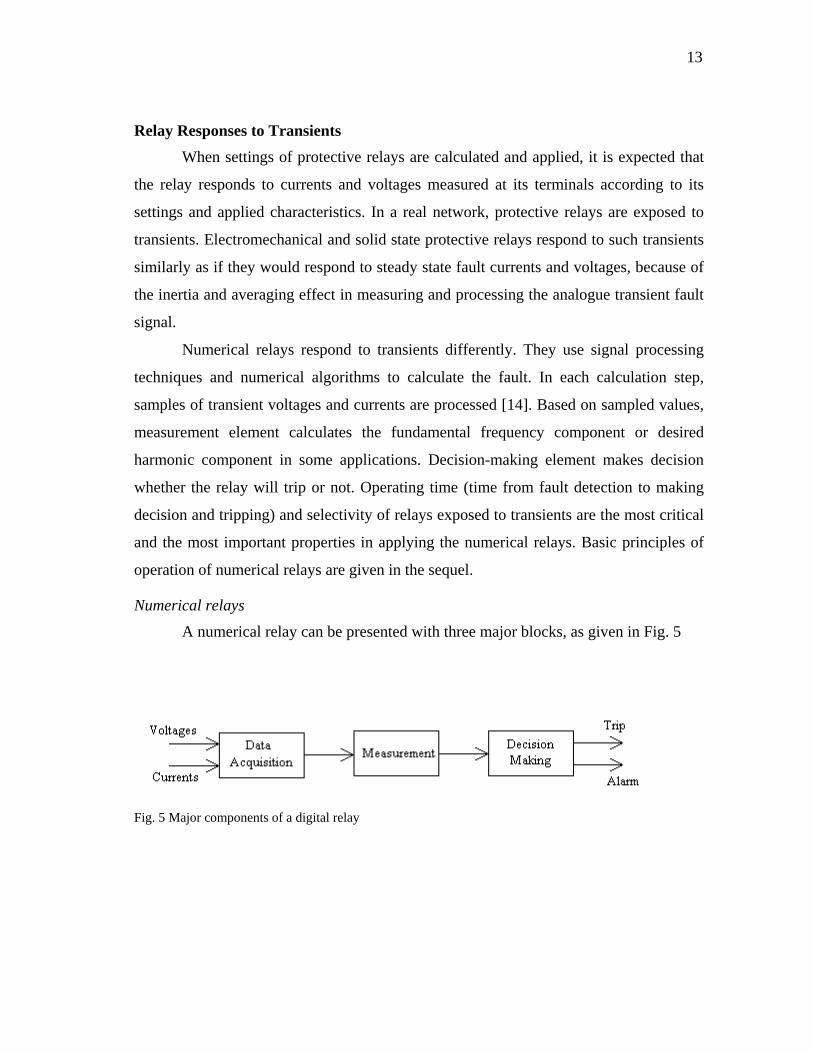
A numerical relay can be presented with three major blocks, as given in Fig. 5
Fig. 5 Major components of a digital relay

14
Data acquisition block constitutes the front end of the relay and links the digital-
processing segment of the relay with its analog inputs. Measuring block estimates certain
input signal parameters (magnitude, phase angle, resistance and reactance, as well as the
active and reactive power). A decision making block applies basic relaying principles to
compare estimated signal parameters with given settings (thresholds). It also applies
certain delays and logic functions in order to issue the tripping and alarm signals.
Data acquisition
The front end of a digital relay consists of the following four elements: input
transducer, signal conditioner, analog anti-aliasing filter and analog to digital (A/D)
converter, as shown in Fig. 6.
Fig. 6 The front end of a digital relay
The auxiliary transformers ensure that the level of standard secondary voltages
and currents match the rated values of input signals for numerical protective relays. They
also convert currents into voltages and isolate the relay circuits from the secondary
wiring of the substation. The signal conditioner then scales the signal down to match the
input rate of the subsequent signal processing elements.
The analog filter provides the necessary anti-aliasing filtering. It passes all the
signal components that are used by the relaying algorithm, but it blocks out all the
remaining components. For example, if samples are taken at frequency ω the raw data
should be digitally filtered to cutoff below one half that frequency ωc = 0.5 ⋅ ω.
The sample and hold (S/H) together with analog to digital (A/D) converter
samples the input signal at regular time intervals and converts the samples into their
15
digital representation. The sampling process is essential for numerical protection in that
the analog signals must be converted into appropriate digital form so that the processor
can perform calculations and reach relaying decisions. Most relay applications involve
sampling at a fixed rate that is a multiple of the nominal power frequency. Sampling is a
process in which values of an analog signal are sampled at regular time intervals and
then converted into digital representation. This operation is accomplished by a sample
and hold (S/H) element.
Algorithms used in numerical relays - measurement
A large class of relaying algorithms is based on extracting information about the
waveforms from current and voltage signals for making relaying decisions [14], [15].
Examples include:
- the rms value of current computed from samples for use in an overcurrent
relay
- current and voltage phasors computed from samples for calculating
impedance
- the harmonic content of a current for restraining a transformer differential
relay during magnetizing inrush
Many analog and digital distance relays use phasors as the operating signals in
the distance functions. The phase angle comparator is a well known operating principle
that uses the phasor information contained in the input signals. A digital filter that both
removes the non-fundamental frequencies and also provides phasor information is
therefore desirable for a digital implementation of a phase angle comparator distance
relay. One such filter, which is widely used in digital distance relays, is the Discrete
Time Fourier Transform (DTFT) [14], [15].
Discrete Time Fourier Transform will be described on a simple example of
voltage signal. A steady state voltage signal in the analog time domain can be described
by the equation:
)t(V)t(v max θ+ω= (6)

16
In a digital relay, this signal is sampled N times per cycle. Thus the input signal
can be represented by a series of samples, Vk, where k = 0 to N – 1
Digital filters process the sampled data points, Vk, by multiplying each sample by
one or more coefficients determined by the type of digital filter employed. In the
traditional Fourier calculation, each sampled value is multiplied by a sine term and a
cosine term. The Discrete Fourier Transform calculation of the fundamental components
can be defined by the following equations:
∑−
=
⋅π⋅⋅⋅
=
1N
0kkreal N
k2cosVN2V (7)
∑−
=
⋅π⋅⋅−⋅
=
1N
0kkimag N
k2sinVN2V (8)
The magnitude of the voltage phasor can be calculated by the following equation:
2imag
2realmag VVV += (9)
The phase angle of the voltage phasor can be calculated by the following
equations:
real
imagangle V
VarctanV = (10)
VangleV θ= (11)
17
With these definitions, the Fourier Transform calculation is able to convert the
sinusoidal voltage waveform to a phasor. The phasor is represented by two forms, the
first form is the rectangular form where the real and imaginary components define the
phasor; the second form is the polar form where the magnitude and phase angle define
the phasor.
It is essential that numerical relays recognize fundamental frequency component
of measured quantities (i.e. currents and/or voltages) during transients and make the
right decision by comparing estimated signal parameters with given settings (thresholds).
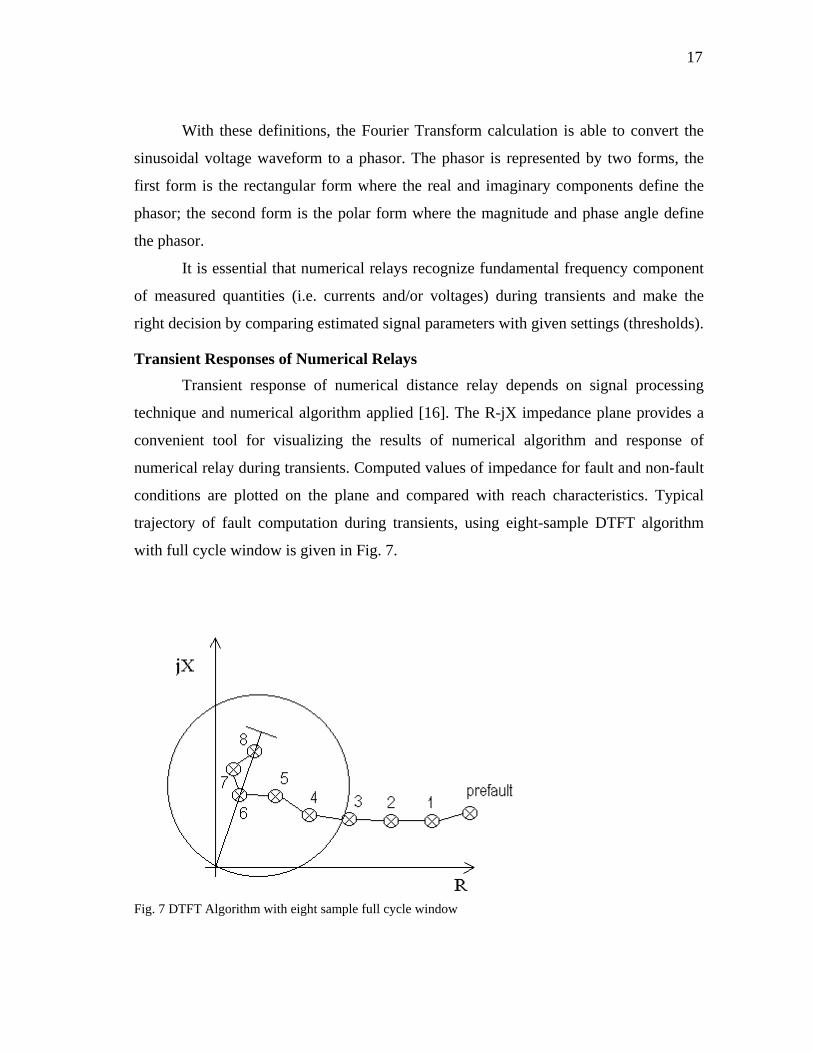
Transient Responses of Numerical Relays Transient response of numerical distance relay depends on signal processing
technique and numerical algorithm applied [16]. The R-jX impedance plane provides a
convenient tool for visualizing the results of numerical algorithm and response of
numerical relay during transients. Computed values of impedance for fault and non-fault
conditions are plotted on the plane and compared with reach characteristics. Typical
trajectory of fault computation during transients, using eight-sample DTFT algorithm
with full cycle window is given in Fig. 7.
Fig. 7 DTFT Algorithm with eight sample full cycle window

18
When a fault strikes the protected line, the voltage and current signals change to
their fault values via a transient disturbance. If the algorithm properly estimates the
fundamental frequency from transient waveform, the calculated voltage and current
signals change smoothly and stabilize after the window is full of fault data samples. In
each step voltage V, current I and impedance V/I are computed.
It is important to notice that if numerical distance relay was exposed to steady
state values of currents and voltages; calculated impedance would be fixed at desired
point in R-jX plain. That is not happening in reality when numerical relays are used.
Numerical relay exposed to transients calculates the fault impedance, which encroaches
characteristic at some point and represents a trajectory inside the characteristic. It shows
excursion alternatively inside and outside, until its value eventually settles down. It is
crucial for relay design to provide proper interpretation of calculated values and to
define adequate criteria for relay operation.
Random nature of the numerical relay operation Random nature of the numerical relay operation is described and criteria for
relaying algorithm sensitivity and evaluation are defined based on a random response of
various relaying algorithms [17]. The raw algorithm outputs are the estimates of R, X or
Z at each sampling instant.
The following analysis illustrates the random nature of the response [17]. The
actual value of the parameter used to make a tripping decision is denoted by Z(t). This
parameter changes from a prefault value of Zpr to a post fault value of Zpo. The
calculated or estimated values of this parameter in discrete time n are Z(n), where
)n(SZ)n(Z po += (12)
S(n) is the error of the estimate. A common technique to optimize the estimate is to
apply the minimum mean square error criterion

19
)n(SEmin 2 (13)
subject to the constraint
0)n(SE = (14)
where E denotes the expected value averaged over the population.
To implement the above principles in a protective relay testing, we consider that
for a given test run r, )N,k(rZ is the average value of Z(n) calculated over a time interval
T=N∆t beginning with discrete time constant k, i.e.,
∑−+
=⋅=
1Nk
kn
)N,k(r )n(Z
N1Z (15)
If the number of test conditions used to evaluate the algorithm is R, then the
average value of )N,k(rZ for the algorithm is:
∑=
⋅=R
1r
)N,k(rZ
R1MEAN (16)
In an ideal situation the following expression could be applied:
0ZMEANE po =− (17)
Hence, the following can be taken as one measure of algorithm random
performance:
poZMEAN − (18)
The parameter Z(n), for the algorithm can be expressed as:
20
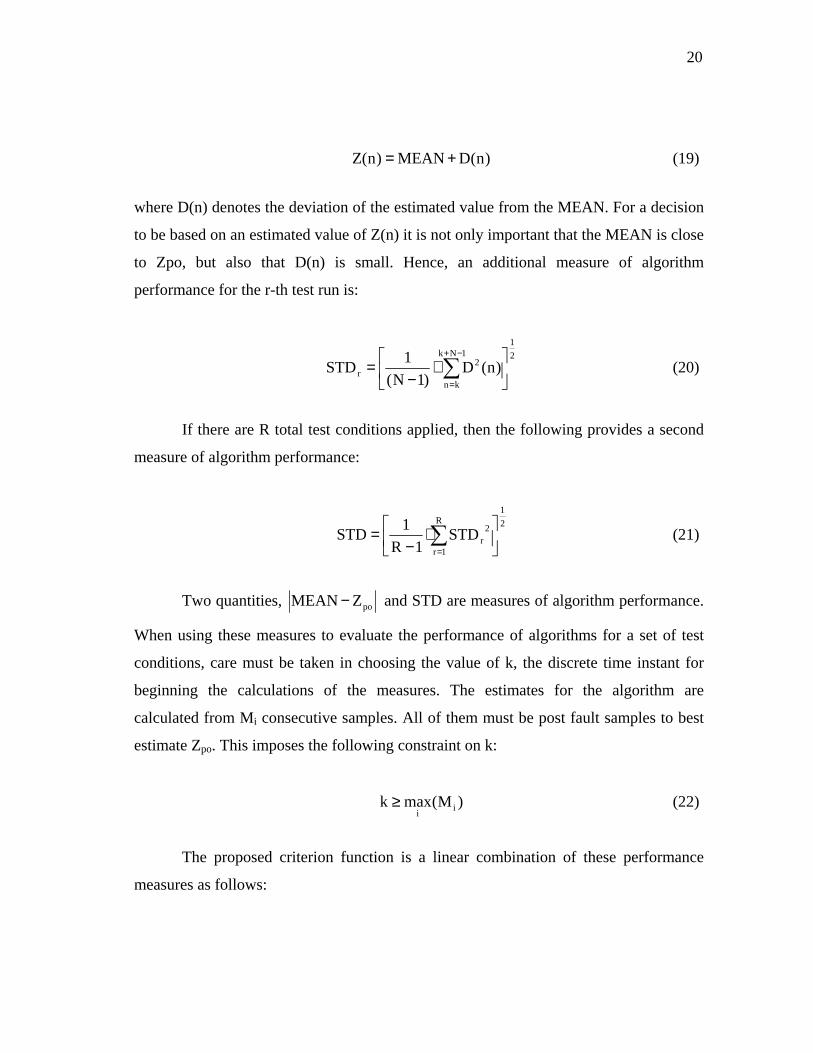
)n(DMEAN)n(Z += (19)
where D(n) denotes the deviation of the estimated value from the MEAN. For a decision
to be based on an estimated value of Z(n) it is not only important that the MEAN is close
to Zpo, but also that D(n) is small. Hence, an additional measure of algorithm
performance for the r-th test run is:
21
1Nk
kn
2r )n(D
)1N(1STD
⋅
−= ∑
−+
=
(20)
If there are R total test conditions applied, then the following provides a second
measure of algorithm performance:
21
R
1r
2rSTD
1R1STD
⋅−
= ∑=
(21)
Two quantities, poZMEAN − and STD are measures of algorithm performance.
When using these measures to evaluate the performance of algorithms for a set of test
conditions, care must be taken in choosing the value of k, the discrete time instant for
beginning the calculations of the measures. The estimates for the algorithm are
calculated from Mi consecutive samples. All of them must be post fault samples to best
estimate Zpo. This imposes the following constraint on k:
)M(maxk ii≥ (22)
The proposed criterion function is a linear combination of these performance
measures as follows:
21
STDaZMEANJ po ⋅+−= (23)
where the coefficient “a” is zero or a positive real number which determines the relative
importance of the STD term. Lower value of J indicates better relative performance.
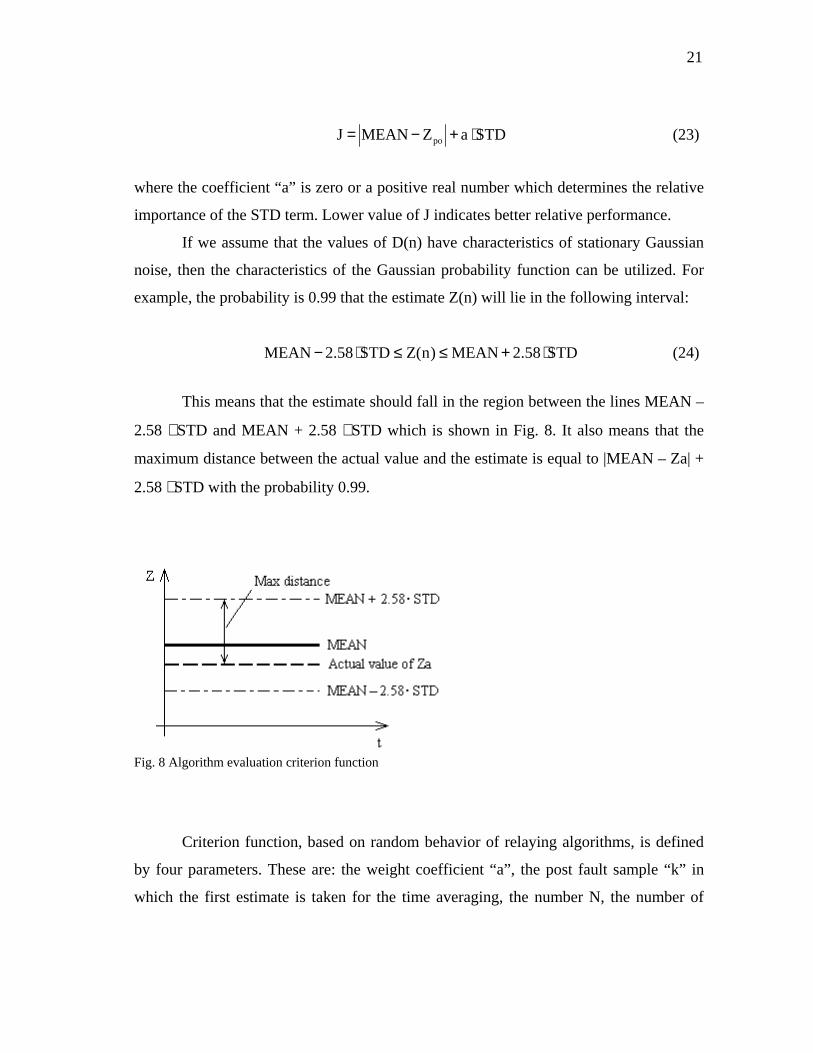
If we assume that the values of D(n) have characteristics of stationary Gaussian
noise, then the characteristics of the Gaussian probability function can be utilized. For
example, the probability is 0.99 that the estimate Z(n) will lie in the following interval:
STD58.2MEAN)n(ZSTD58.2MEAN ⋅+≤≤⋅− (24)
This means that the estimate should fall in the region between the lines MEAN –
2.58 ⋅ STD and MEAN + 2.58 ⋅ STD which is shown in Fig. 8. It also means that the
maximum distance between the actual value and the estimate is equal to |MEAN – Za| +
2.58 ⋅ STD with the probability 0.99.
Fig. 8 Algorithm evaluation criterion function
Criterion function, based on random behavior of relaying algorithms, is defined
by four parameters. These are: the weight coefficient “a”, the post fault sample “k” in
which the first estimate is taken for the time averaging, the number N, the number of

22
samples used in the time average and the number R, the number of test conditions or
simulation runs in the test.
Impedance reach of a numerical distance relay exposed to transients is random.
Statistical properties of reach decision (selectivity) of numerical distance relays depends
on signal processing techniques and algorithms applied in relay design.
Different transient waveforms, with different fault inception time and harmonic
content are of stochastic nature. Time for a numerical relay to process the fault signal,
calculate the fault loop impedance and reach its decision depends on shape of the
transient waveform and is a random value. In other words, tripping time of a numerical
distance relay exposed to transients is a random value.
Conclusion
The following conclusions are derived from the analysis of transient response of
numerical relays:
- Transient response of numerical relays is random. To take into account the
random nature of numerical relay’s response, it is essential to test its
selectivity and average tripping time.
- To conclude if operation of a numerical relay is satisfactory, it is not
sufficient to verify its operating characteristic by phasors of currents and
voltages. Phasors cannot be used to test selectivity and average tripping time
of a numerical relay. To test numerical relays it is necessary to utilize
transient tests.
- Because of random response of numerical relays exposed to transients,
transient tests should be defined accordingly. To perform transient tests, it is
necessary to define test cases with different fault types, fault inception angles
for the same scenario and to apply large number of repetitive tests.
23
Conclusion
This chapter briefly described some of the most common operating
characteristics of protective relays. It also described commonly applied principles of
operation of numerical relays and addressed the issues of relaying responses to system
transients. This chapter provided background and explanations for random behavior of
protective relays exposed to transients. It gave reasons why the transient tests are
necessary.
It was concluded that testing numerical relays and verifying their characteristics
by conventional methods using steady state fault currents, may not be sufficient to test
whether these relays would operate correctly in a real system. It was shown that random
nature of numerical relays’ response cannot be analyzed by applying phasor values of
currents and voltages. In a real system protective relays are exposed to different types of
transients and they must be capable of responding correctly in such cases, as well as in
various scenarios involving faults and disturbances. Random response of numerical relay
must be checked by testing relay’s selectivity and average tripping time. It was
concluded that selectivity and average tripping time can only be checked in transient
tests.
It was shown that because of the random nature of numerical relay responses, it
is necessary to perform tests with large number of cases, and several shots for each case.
Criteria for satisfactory operation of protective relay were given in this chapter. These
criteria are selectivity in operation and average tripping time within acceptable limits. To
check if those criteria are satisfied, it is necessary to establish procedures for
comprehensive testing of numerical relays with large number of scenarios and large
number of test cases. This chapter gave directions how to establish procedures in
transient testing. Basic idea will be developed in further chapters.

24
CHAPTER III
PROTECTIVE RELAY TESTING BACKGROUND
Introduction Two major concepts in protective relay testing exist in practice. Conventional
approach uses phasors of currents and voltages to test the operating characteristic and
tripping time of protective relays. Advanced approach uses transient waveforms of
currents and voltages to test selectivity and average tripping time of protective relays.
Hardware and software tools have been developed to create test cases, generate test
signals and apply them to protective relays. Different concepts have been used to define
test cases and to apply them in practice.
Before proceeding with a new methodology for evaluation and transient testing
protective relays in the next chapter, a background of relay test practices will be
discussed. This review will give basic definitions, analyze test equipment, hardware and
software components and different concepts in protective relays’ testing and evaluation.
Examples of how the classical approach and advanced approach in relay testing can be
implemented will be given. Analysis of present approaches in transient testing will
include explanation when the transient tests are needed.
Generating Test Signals Three approaches can be used to generate signals for testing relays. The first
approach is to use the outputs of a waveform generator. The second option is to simulate
disturbances, create analog signals and use the outputs of the simulations to test the
relays. The third option is to use fault waveforms recorded by relays or fault recorders.
The first approach is used in phasor testing of protective relays, the second and the third
one are used in transient tests.
Waveform generators
The initial design of test sets provided facilities to generate voltages and currents
of the fundamental frequency [18]. These instruments provide one to six outputs. The

25
levels of the outputs and to some degree the phase angle between the outputs, could be
controlled. Later designs included provisions for outputs that were linear combinations
of signals of the fundamental and harmonic frequencies [19]. Some designs could add a
DC offset [19], [20].
Traditionally, electromechanical and solid state relays were and are being tested
using waveform generators. The tests provide information on the performance of relays
under steady-state fundamental frequency conditions. Operating characteristics and
tripping time for steady state quantities are checked using these instruments. The
performance of many electromechanical relays and solid state relays during system
disturbances matched that observed during the tests because of the inertia of the relays.
These instruments cannot effectively test numerical relays because numerical relays do
not have inertia and signals generated by the test sets are not similar to those
encountered during system disturbances.
Simulated waveforms
To overcome the downsides of waveform generators, digital or hybrid simulators
are being used for testing relays [21], [22]. The issues involved in digital and hybrid
approach are generating numerical data, converting the data to analog form and then
using the data to test the relays.
For testing numerical relays, it is essential to generate waveforms that closely
resemble waveforms experienced during power system disturbances. It is important to
use such tools to generate signals in transient tests in order to check selectivity and
average tripping time of numerical protective relay. One of the popular techniques used
for this purpose is to simulate disturbances using transient programs such as EMTP,
EMTDC and ATP [23], [24].
Three important issues must be considered when simulations are performed [11]:
- The first issue concerns the size of the power system used for modeling. To
keep the computation effort and time, reduced-size models are used. It is
essential that the reduced size model represents the large-scale system
adequately. The components of the power system such as lines, transformers
26
and the generators must be modeled in such manner that the results provided
by the simulator are accurate. Therefore, attention must be paid to the
selection of models for these and other components.
- The current and voltage transformers, used to convert the high current and
voltage signals to the relay level signals, are non-linear devices. They must
be properly modeled including the impacts of the core of the transformers
and inductances and capacitances in the secondary circuitry.
- Since a time continuous process is modeled in discrete steps, attention must
be paid to the time step used in simulations. Using larger than needed time
step would provide information that does not represent the waveforms of the
disturbance adequately. On the other hand, using smaller than needed steps
would increase the computation time as well as the size of the waveform
files.
Once the transient data have been generated in a sampled form, they are
converted to the analog form. This is done by taking the numerical data and converting
them to the analog form using digital to analog (D/A) converters. The outputs provided
by the D/A conversion are staircase representations of smooth waveforms of voltages
and currents [15]. To remove the high frequency components from these outputs, low-
pass filters are used. It is essential that the bandwidth of the amplifiers should be suitable
to faithfully amplify the signals without introducing the additional noise.
Recorded fault waveforms
Digital fault recorders are intelligent electronic devices primarily used for
recording waveforms with high accuracy. They do not perform real time processing of
obtained waveforms [25]. This allows them to use the whole processing power for
converting and storing samples, which in turn enables using very high sampling
frequency. Therefore, monitored signals are recorded with great precision in both the
magnitude and higher frequency harmonics.
Sampled waveforms of input signals and contact data are used in variety of
monitoring applications. DFRs are usually connected in parallel with protective relays.
27
They do not continuously store the waveforms, but start upon being triggered by relay
trip signals. They provide detailed information about transient waveforms of monitored
quantities during the fault. Triggering may also be accomplished through a separate
triggering function being provided by DFR. Capability of triggering function to detect
desired disturbance reflects on DFR’s ability to capture relevant waveform.
Digital protective relays can also record the waveforms. They use analog current
and voltage signals acquired by instrument transformers and digitize them by A/D
converters. Process of digitizing assumes sampling analog signals with certain sampling
rate and representing the created samples by certain number of binary digits. Protective
relaying function requires fast operation and therefore the digitization process must not
be a bottleneck of the operation. In order to speed up A/D conversion, relatively low
sampling rate is implemented. Obtained signal samples are enough for protective
relaying purposes, but the content of higher harmonics is limited. However,
developments in microprocessor technology increased the processing power of digital
relays and made them capable of sampling signals with faster rate. Since the digital fault
recorder may not be connected to the same instrument transformers as protective relay
under investigation, relay recordings are preferable when available. Typical relay
recording rates are now 16 to 64 samples in a 60 Hz period [11]. With 64 samples per
cycle, acceptable waveforms can be obtained. They require minimal smoothing when
played out through a D/A converter. Digital Fault Recorders and data obtained from
digital protective relays are used in transient testing of protective relays.
In some testing practices, recorded fault waveforms are replayed through testing
equipment to test protective relays.
Test Apparatus for Relay Testing
Manufacturers offer three types of equipment that use analogue data generated by
simulations for testing relays. They are relay test sets, playback digital simulators and
real time digital simulators [11]. Simulator is a system of software and hardware that
generates output waveforms that are, ideally, identical to the secondary level waveforms

28
produced by the power system being modeled [26]. These waveforms are used to drive a
relay under test.
Relay test sets
Most commercial relay test sets have facilities for simulating fundamental
frequency and transient waveforms. They can also use sampled waveforms recorded
from power systems or generated by simulations. These test sets consist of two major
components, a personal computer and a test set. The disturbances are modeled in the PC
and the outputs of the simulations are applied to the test set. The numerical data
generated by the PC is converted to the analog form by using D/A converters and
smoothing filters.
Steady state testing usually provides 6 analogue channels in a balanced three
phase format with 3 voltage channels and 3 current channels. The control features of the
test set usually allow controlling the channels to be set independently to simulate
unbalanced conditions. Some test sets provide the feature of adding harmonics and
exponential components to specific signals. One example of current and voltage
parameters for steady state relay testing is given in Fig. 9.
Fig. 9. Steady state representation of a set of current and voltage signals
29
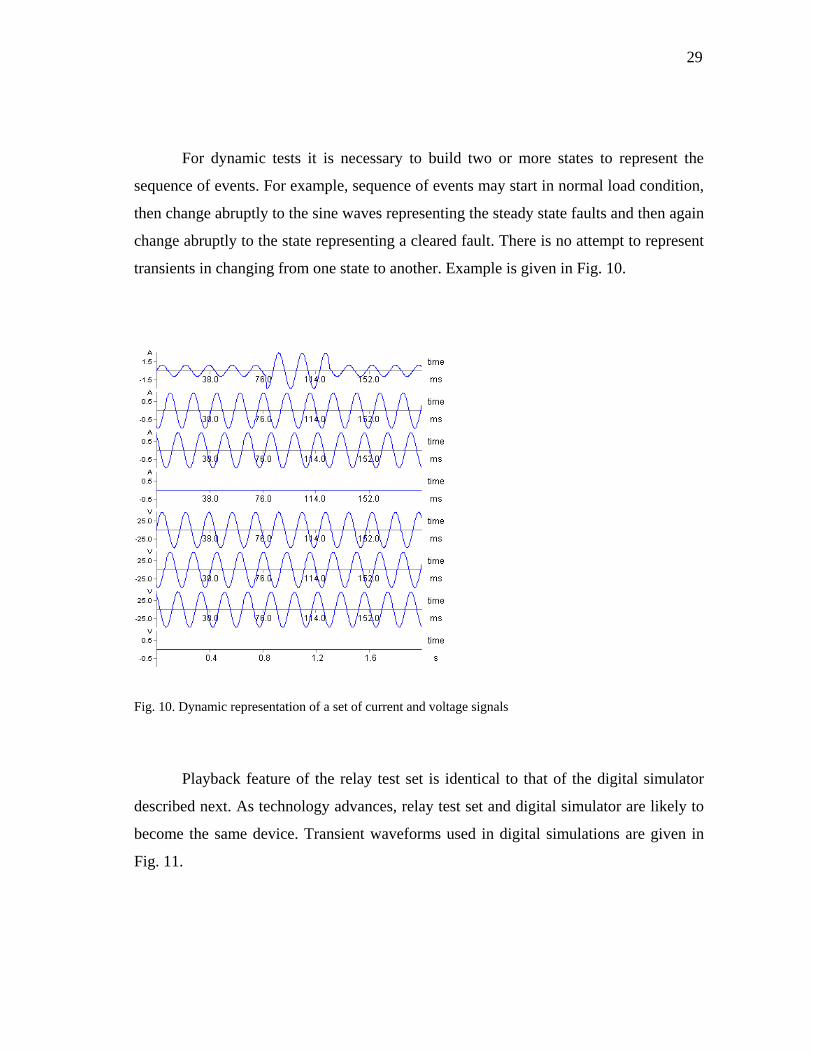
For dynamic tests it is necessary to build two or more states to represent the
sequence of events. For example, sequence of events may start in normal load condition,
then change abruptly to the sine waves representing the steady state faults and then again
change abruptly to the state representing a cleared fault. There is no attempt to represent
transients in changing from one state to another. Example is given in Fig. 10.
Fig. 10. Dynamic representation of a set of current and voltage signals
Playback feature of the relay test set is identical to that of the digital simulator
described next. As technology advances, relay test set and digital simulator are likely to
become the same device. Transient waveforms used in digital simulations are given in
Fig. 11.
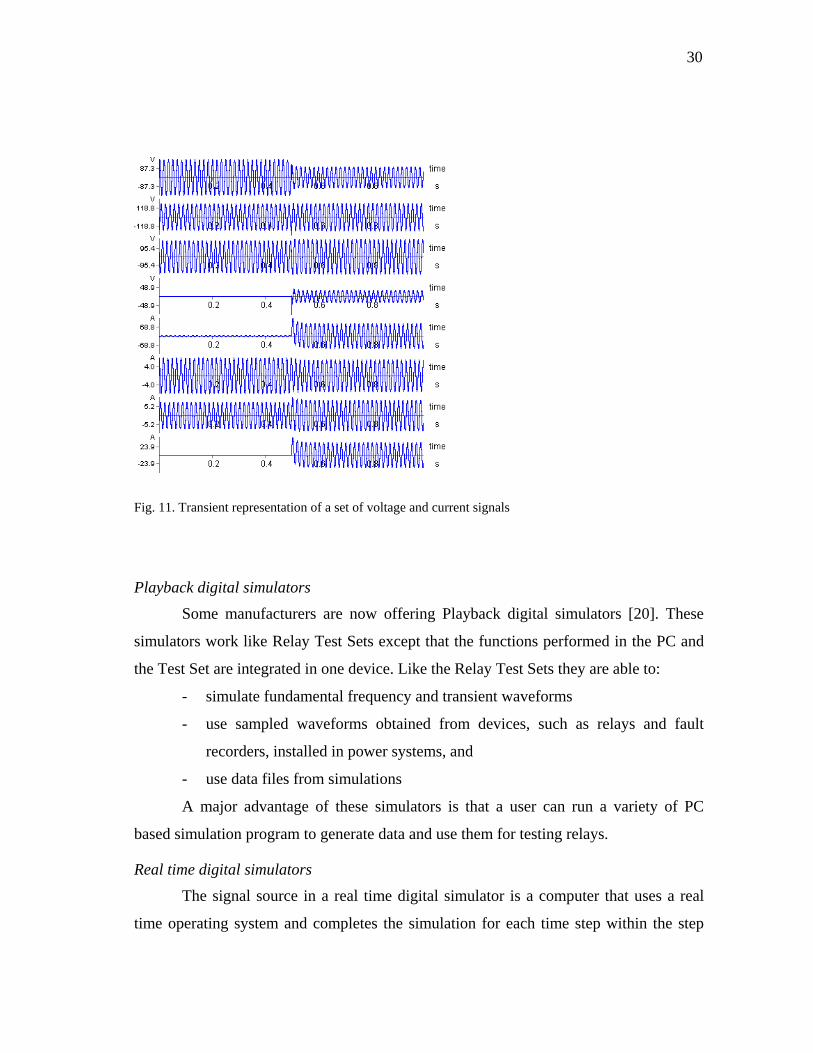
30
Fig. 11. Transient representation of a set of voltage and current signals
Playback digital simulators
Some manufacturers are now offering Playback digital simulators [20]. These
simulators work like Relay Test Sets except that the functions performed in the PC and
the Test Set are integrated in one device. Like the Relay Test Sets they are able to:
- simulate fundamental frequency and transient waveforms
- use sampled waveforms obtained from devices, such as relays and fault
recorders, installed in power systems, and
- use data files from simulations
A major advantage of these simulators is that a user can run a variety of PC
based simulation program to generate data and use them for testing relays.
Real time digital simulators
The signal source in a real time digital simulator is a computer that uses a real
time operating system and completes the simulation for each time step within the step

31
[22], [26], [27], [28], [29]. The operating system passes data to the relay under test and
receives in real time the output of the relay. Real time digital simulators do not store
simulated waveforms but use the instantaneous values provided by the simulations at the
end of each time step. Computer must be capable of completing the calculations for each
time step within one time step and it must have real time operating system.
An alternative approach uses a multi-processor based system in which several
DSPs operate in parallel and share the tasks to provide results in real time [30]. At the
end of each time step, the processors exchange data over the backplane and proceed to
perform calculations for the next time step.
The size of the power system that can be modeled on these simulators depends
on the computing facility of the simulator, such as the number of DSPs in it.
Real Time Digital Simulators are time-effective for studies that must take into
account interactions between the relays, power system, other controllers etc. The real
time computations allow many outputs and inputs to be connected to the relays being
tested.
Real Time Digital Simulators are rather expensive solutions and they are not
available in a portable format at present time.
Relay Tests Approaches used for relay testing can be classified into two categories. The first
category uses phasor values of voltages and currents to test the operating characteristics
of protective relays. That category is designated as phasor testing or classical approach
in relay testing. The second category uses transient waveforms of fault voltages and
currents to test selectivity and average operation time of protective relays. That category
is designated as transient testing or advanced approach in relay testing. Basic
explanations and examples of both approaches are given in this section.
Classical approach in relay testing
The classical approach in relay testing is well defined and supported by the
existing engineering tools. Relay settings are calculated using short circuit programs and
relay setting coordination programs. Setting computation is based on the knowledge
32
about the relay setting options (described in the relay manuals) and assumptions about
the worst case faults (obtained from a short circuit study). Phasor simulation of steady
state fault values can be utilized to test the relays [4]. Standard relay test sets are usually
used. As mentioned earlier, classical approach using phasor values of currents and
voltages is used primarily to check the operating characteristic of a protective relay.
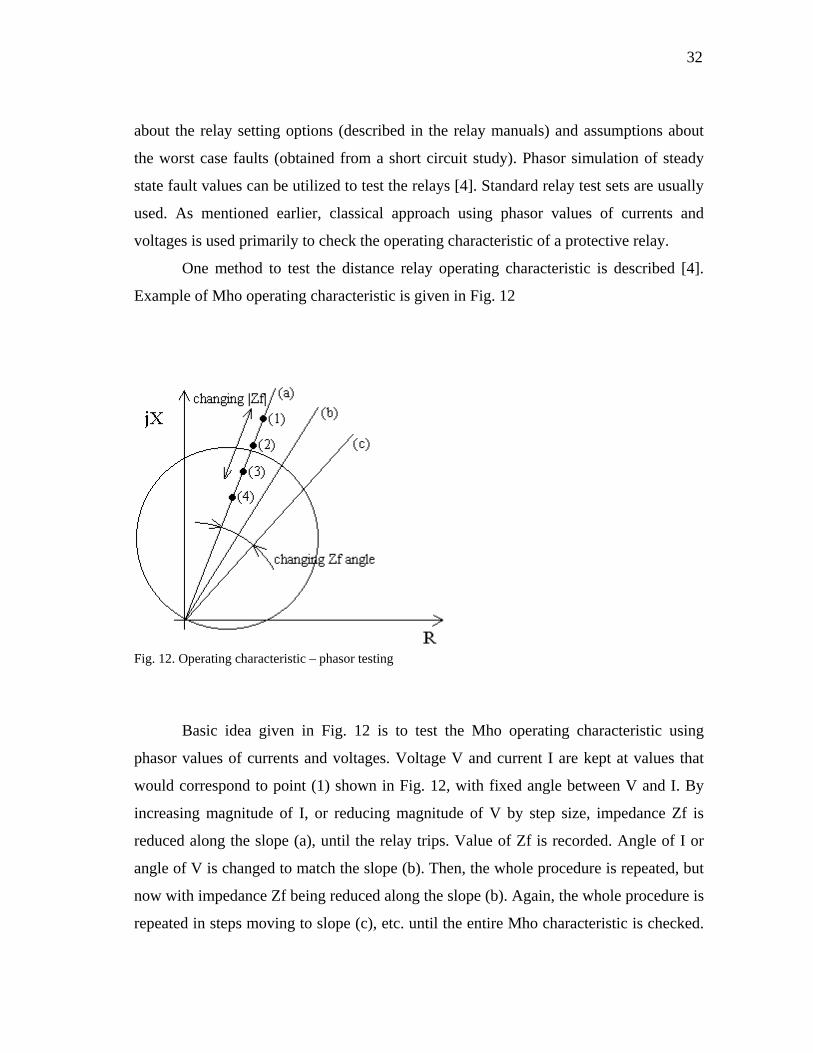
One method to test the distance relay operating characteristic is described [4].
Example of Mho operating characteristic is given in Fig. 12
Fig. 12. Operating characteristic – phasor testing
Basic idea given in Fig. 12 is to test the Mho operating characteristic using
phasor values of currents and voltages. Voltage V and current I are kept at values that
would correspond to point (1) shown in Fig. 12, with fixed angle between V and I. By
increasing magnitude of I, or reducing magnitude of V by step size, impedance Zf is
reduced along the slope (a), until the relay trips. Value of Zf is recorded. Angle of I or
angle of V is changed to match the slope (b). Then, the whole procedure is repeated, but
now with impedance Zf being reduced along the slope (b). Again, the whole procedure is
repeated in steps moving to slope (c), etc. until the entire Mho characteristic is checked.

33
Basic procedure would assume that pre fault currents and voltages were zero. More
realistic tests would be conducted with pre fault voltages and currents applied before the
steady state fault voltages and currents. Flow chart of one method in classical approach
in relay testing is given in Fig. 13
Fig. 13. Flow chart – one method for phasor testing of distance relays
Important issue in phasor testing of protective relays is to what accuracy a relay
should be tested. This depends very much on the quoted accuracy of the relay under test.
Classification of protective relays, based on accuracy is given in Table I.
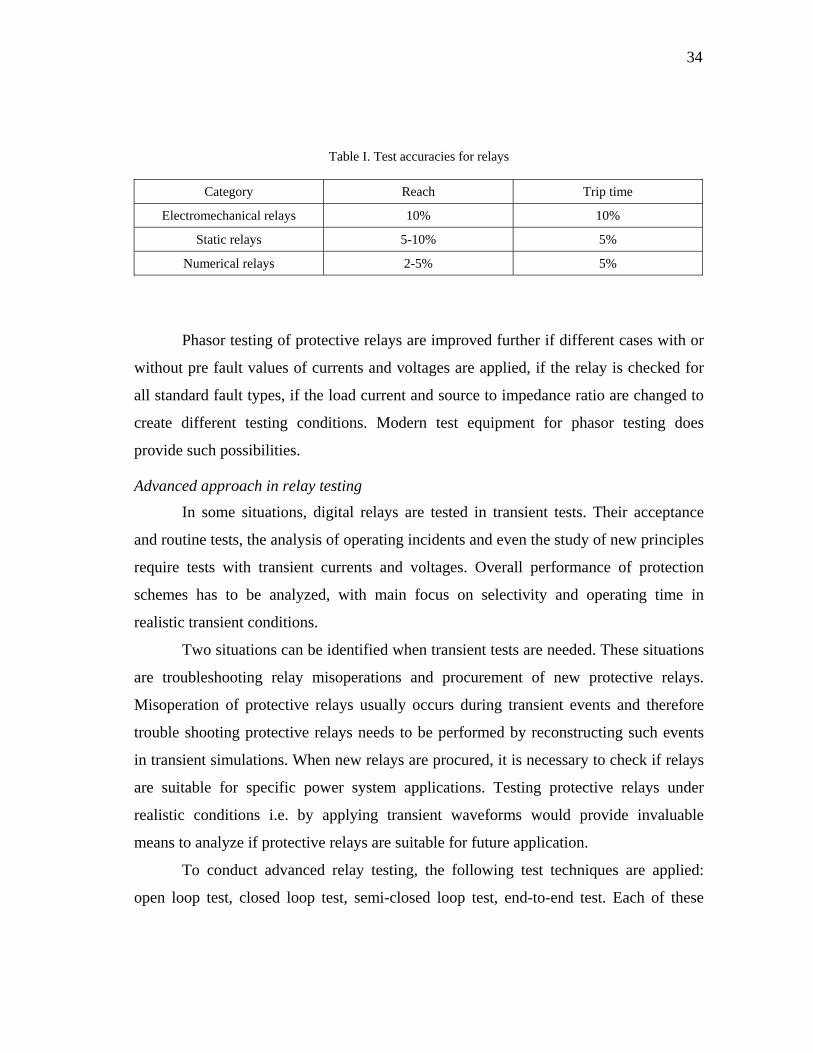
34
Table I. Test accuracies for relays
Category Reach Trip time
Electromechanical relays 10% 10%
Static relays 5-10% 5%
Numerical relays 2-5% 5%
Phasor testing of protective relays are improved further if different cases with or
without pre fault values of currents and voltages are applied, if the relay is checked for
all standard fault types, if the load current and source to impedance ratio are changed to
create different testing conditions. Modern test equipment for phasor testing does
provide such possibilities.
Advanced approach in relay testing
In some situations, digital relays are tested in transient tests. Their acceptance
and routine tests, the analysis of operating incidents and even the study of new principles
require tests with transient currents and voltages. Overall performance of protection
schemes has to be analyzed, with main focus on selectivity and operating time in
realistic transient conditions.
Two situations can be identified when transient tests are needed. These situations
are troubleshooting relay misoperations and procurement of new protective relays.
Misoperation of protective relays usually occurs during transient events and therefore
trouble shooting protective relays needs to be performed by reconstructing such events
in transient simulations. When new relays are procured, it is necessary to check if relays
are suitable for specific power system applications. Testing protective relays under
realistic conditions i.e. by applying transient waveforms would provide invaluable
means to analyze if protective relays are suitable for future application.
To conduct advanced relay testing, the following test techniques are applied:
open loop test, closed loop test, semi-closed loop test, end-to-end test. Each of these

35
approaches in transient testing usually use one hardware tool for generating test signals,
a simulation software package for creating test cases and a software package for
replaying test cases.
One concept in advanced relay testing is presented here as illustration. To check
the transient performance of a distance relay, approach that uses open loop simulation,
one terminal testing and two terminals testing can be performed [5]. Checking transient
performance means that selectivity and tripping time (average tripping time) should be
analyzed by applying transients. A computer is used for generating test waveforms,
signal processing and converting data files, data displaying and tests result reporting.
The DSP board and the I/O subsystem are used for data dispatching, data channel
synchronization and D/A conversion. Trip contacts of the relay under test are fed back to
the simulator through the I/O subsystem. Test set-up diagram for one terminal testing is
shown in Fig. 14
To test the selectivity and tripping time that is of a random nature, large number
of tests is executed. A batch of test data is converted to a specific format and sent to the
DSP board. Analog signals from the D/A are amplified to the level of currents and
voltages as they would appear on secondaries of the instrument transformers.
Sensitivity study to test the Zone-1 selectivity and operating time is performed
using a large number of cases. Fault types AG, BC, ABC and BCG, at five different fault
locations 50%, 75%, 80%, 90% and 95%, at three inception angles 0°, 45° and 90° are
applied. Each test is repeated for 10 times.
Influence of the CTs and CCVTs is taken into account by incorporating EMTP
models. The CT saturation level changes if different CT burdens are used. AG faults at
50%, 80% and 90% of the line, with different CT burdens are applied to check the
influence of CTs and CCVTs.
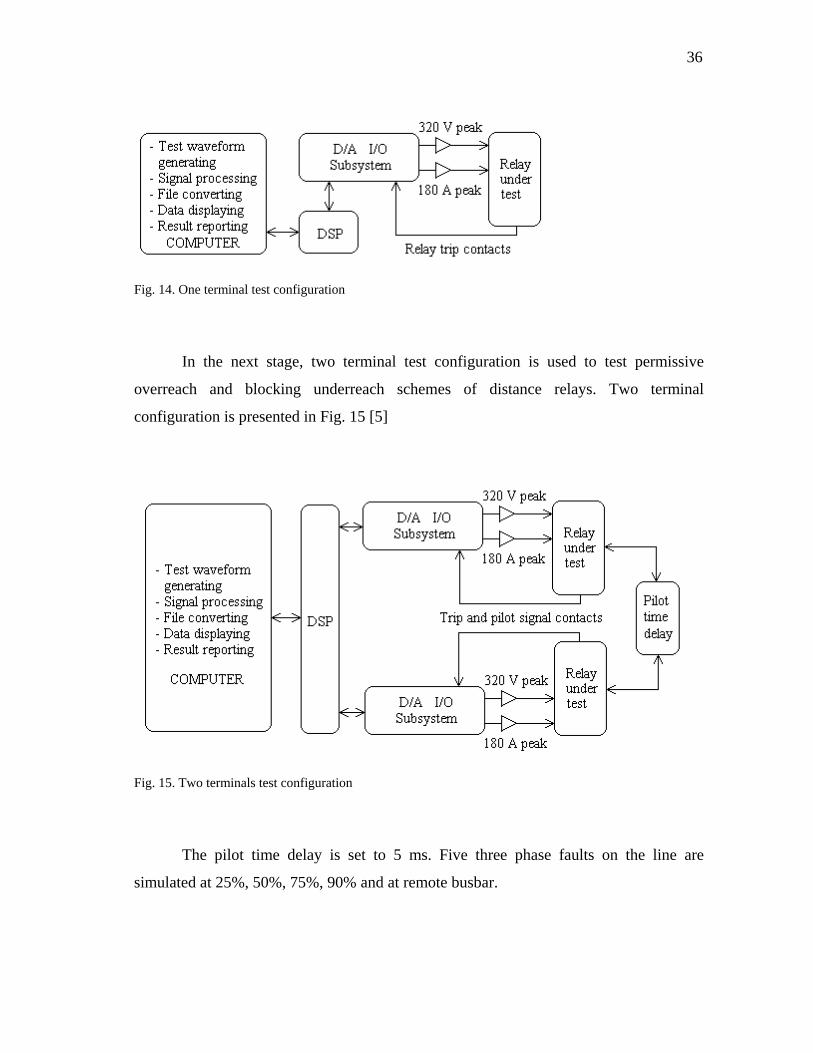
36
Fig. 14. One terminal test configuration
In the next stage, two terminal test configuration is used to test permissive
overreach and blocking underreach schemes of distance relays. Two terminal
configuration is presented in Fig. 15 [5]
Fig. 15. Two terminals test configuration
The pilot time delay is set to 5 ms. Five three phase faults on the line are
simulated at 25%, 50%, 75%, 90% and at remote busbar.
37
Equipment and Tools in Transient Testing The focus of this Thesis is on advanced transient testing of protective relays. In
advanced testing of protective relays that exists in practice, a complex system of
hardware components and software tools is used. Hardware and software tools need to
comply to performance requirements of transient tests [31]. Several main parts of
transient test set-up can be identified: simulation computer with its functions, hardware,
software and user interface, then I/O subsystem and power amplifier subsystem. In this
section equipment and tools and their functions for advanced approach in testing
protective relays are discussed. Some of these tools will be used to achieve different
testing objectives of the new methodology in transient testing of transmission line relays.
Simulation computer - functions
The simulation computer is primarily devoted to computation of the fault
transients using one of the commercial packages such as EMTP, ATP, EMTDC, etc.
Simulation computer may also be used to perform signal analysis, signal replaying,
signal acquisition and operator interfacing.
Signal analysis is related to the signal processing and editing needed to generate
a set of test waveforms. A common example is preparation of the digital fault recorder
files for replaying. Study of the influence of the instrument transformers is yet another
example of the signal analysis needs.
A dedicated controller, separate from a simulation computer, may perform signal
replaying in an open loop simulation application. In this case, the simulation computer
may be used to download test signals to the controller, which is not a particularly
demanding requirement. The simulation computer should also be capable of taking DFR
files.
If relay testing is conducted in real time, that requires a very demanding I/O
performance for the simulation computer since an interaction between the simulator and
the relay has to be carried out on-line and in real time.
38
Signal acquisition is related to recording of the test waveforms and contacts
presented to the relay and contacts generated by the relay. This may be done by
dedicated instrumentation, but the simulation computer may do it as well.
Operator interfacing is one of the main functions of the simulation computer
since the simulation, as well as the signal analysis, replaying and acquisition require
intensive interaction between the operator and the system. Depending on the type of the
user interaction, the requirements may be quite demanding. This is, in particular, the
case if a graphical user interface is used for interaction with several application programs
in a multi tasking, multi user environment.
Simulation computer - hardware
The simulation computer may have a number of different configurations. It could
be a workstation dedicated to electromagnetic transient simulations and user interfaces.
The waveforms are downloaded to a controller which takes care of signal replaying. In
some other instances, the simulator may be a PC, which serves both as the
electromagnetic transient program workstation and the signal-replaying controller. In
other instances, the simulation computer may be a multiprocessor system capable of
parallel processing and I/O interactions in real time.
The I/O requirements for signal replaying and signal acquisition as well as the
requirements for electromagnetic transient simulation and signal analysis determine the
performance requirements in selection of the simulator hardware. User interfaces also
place a requirement for a particular type of the graphical interface standards. The other
considerations are the memory space, both the hard disk and for the working memory.
More elaborate system and application software may require demanding memory
specifications.
Simulation computer – system software
System software primarily relates to the choice of an operating system. Simulator
applications require careful selection of the operating system that supports a particular
version of the electromagnetic transient program package and signal processing package.
Software tools for development of graphical user interfaces are also a part of this
39
consideration. A choice of a data management requires compatibility with the operating
system. If several commercial packages are used, then the type of user interaction is
directly driven by the choice of the operating system.
Simulation computer – user interface
The choice of the user interface may be considered as the most important aspect
of the simulator computer requirements. The simulator computer hardware and software
represent a complex computer environment. This may require a complex solution to the
user interface in order to allow an operator to efficiently use the simulator.
Application software requirements may be reduced to the selection of the
commercial packages used for various applications. A typical choice may include:
EMTP, a signal processing package, a database management package and a graphical
user interface package. Advanced software applications comprise signal processing,
database management and graphical user interface packages in one software tool [21].
Special categories are real time simulators that may have custom EMTP
implementation and I/O interactions to support the real time capability [22].
Graphical user interfaces are an essential feature of an easy to use operator
interface. Typical features of such an interface include data entry using an editing
window, graphical entry of a sequence of events scenario, plotting of analog waveforms
as the simulation proceeds, or at the end of the simulation run, mouse driven editing of
waveforms and multi-window control of application programs [21].
COMTRADE files
COMTRADE Standard defines a common format for the exchange of electrical
power system transient data [12]. These files comprise a record of real or simulated
power system events. They contain digitalized records of voltage and current
waveforms, and logical events, such as relay operations, in a time coherent record. The
format is intended for use when individuals who use different proprietary recording or
simulation systems need to exchange data. COMTRADE provides common format in
which those interested in power system and protection analysis may exchange digital
data files. It is very important that data files generated in computer simulations or

40
recorded by digital fault recorders are in COMTRADE format. It is very important that
software packages designed for editing and generating test waveforms are compatible
with COMTRADE format. Even if simulation software is not designed to generate test
signals, data created in simulations or data recorded in a fault recorder can be used in
relay tests through specialized software packages utilized to generate test waveforms.
That is only possible if COMTRADE Standard is applied in all software components.
I/O subsystem
The Input/Output subsystem is the portion of the simulator concerned with
converting the digital information generated by the simulation program into analog
waveforms that will be applied to the relay under test. In general, the I/O system is
responsible for converting the digital data into low level analog signals (±10 to ±20 V
peak) required by the main amplifier system, filtering those signals to remove unwanted
high frequency components, synchronizing the signals on all channels, activating the
appropriate digital outputs, and continuously monitoring all available digital inputs.
Specifying the I/O subsystem is one of the most critical elements in designing a
simulator. This subsystem must be able to accept high speed digital data transfers,
perform necessary processing in both analog and digital domain, and drive the final
output amplifier stages. The exact demands are determined by the number of relay
terminals to be driven, the desired output signal bandwidth, and the characteristic of the
main system amplifiers.
Power amplifier subsystem
The power amplifier subsystem is critical to accurate testing of relays. Even if
the digital portion of the simulator followed by the I/O subsystem performs perfectly and
the power system model is accurate, improper amplifier performance may affect the test
results.
The amplifiers, used to supply currents and voltages to a protective relay in a test
system, must not only be able to deliver the signal magnitude required but also to deliver
it into the burden of the relay under test. If it is a requirement to test electro-mechanical
41
relays, a higher output VA rating and higher compliance voltage are needed than if only
solid state or digital systems are to be tested.
Conclusion
It can be concluded that the following equipment and tools used in advanced
testing of protective relays need to be specified:
- simulation computer options, including simulator functions, hardware,
software and user interfaces
- I/O subsystem design, including input and output capabilities as well as
AC performance and environmental impacts
- power amplifier specifications, including input and output capabilities,
AC performance and load constraints
Relay Test Procedures in Transient Testing The existing approaches in transient testing provide basic idea how the transient
tests should be conducted. The existing approaches do not provide precise formulation
when the transient tests are needed, general recommendations what procedures should be
applied and what approach should be used to conduct transient tests. The existing
approaches are in most cases aimed at some specific situation when transient tests are
required, they are conducted by random definition of testing scenarios. In many cases
transient tests of protective relays are defined intuitively based on experience of relay
engineers.
Test cases and scenarios
Defining test cases and scenarios is very important part of relay testing
procedures. The main purpose of transient tests, to check selectivity and average tripping
time of protective relays, should be achieved by proper definition of test cases and
scenarios.
If a relay misoperates for a condition that occurs in a power system, it is
necessary to examine reasons for relay’s misoperation. Intuitive approach in
troubleshooting relay’s misoperation is to recreate such condition and to apply
waveforms similar or the same as those that really occurred. If a relay misoperates, it
42
means that selectivity of protective relay was not achieved, or relay’s operation was
unacceptably slow or fast. Test cases are formed either by using digital fault recorder
data, or by modeling the event using EMTP transient software. Possible reasons for
relay’s misbehavior are: malfunctioning of protective relay, relay may not be appropriate
for a given application or incorrect settings may have been applied to the relay.
In case when new relays are purchased, it is very useful to analyze their behavior
under transient tests. By performing transient tests, possible problems in relay
application in the future may be avoided. It is already mentioned that misbehavior of
protective relays usually occurs because of malfunction, inappropriate application or
incorrect settings. By performing transient tests on new relays, first in procurement stage
and later in commissioning stage, various network conditions and scenarios can be
analyzed beforehand to avoid problems in future service. When protective relays are
purchased, they should be exposed to large number of test cases and scenarios to check
if their operation is selective and if their average operation time is within the limits. One
such approach how to test basic selectivity and average tripping time is already given in
this chapter. In a given example, test scenarios were created to check basic selectivity by
testing zone reach and average operating time for faults inside and outside the zone.
Complex scenarios that include large scale of fault or event cases relevant for relay
selectivity are not yet defined. They will be defined in the new methodology for transient
testing of transmission line relays.
Number of tests
Operation of numerical relays is random. Transient waveform that occurs during
fault may have different shape depending on fault type and fault inception angle. Signal
processing techniques used in protective relays for data acquisition, measurement and
decision making interpret the transient waveforms in a random fashion. Such behavior
has been identified and test cases were defined accordingly in some existing transient
test applications [5]. Example given in this chapter takes care of random nature of
numerical relay responses. Large number of repetitive tests has been performed to check
selectivity and average tripping time. Such approach shall be used as general

43
recommendation for all transient tests. It will be used in the new methodology for
transient testing of transmission line relays.
Conclusion
It can be concluded that the following facts should be considered in applying new
test procedures in transient testing:
- transient tests are very useful in troubleshooting protective relays and in
procurement and commissioning stage of the new relays
- test cases and scenarios need to be defined to cover a large number of
relevant events with aim to test selectivity and average tripping time of
numerical relays under test
- large number of repetitive tests need to be performed because relay
operation is random
Conclusion
This chapter gave examples of different concepts and approaches used in relay
testing. It addressed some background aspects of classical and advanced tools for relay
testing and evaluation used today. Most of the assumptions taken in the thesis will be
based on the material given in this chapter.
It was observed that the existing solutions do not provide methodological
approach to transient testing. They do not provide precise formulation why and when the
transient tests are needed. Comprehensively defined procedures to test protective relays
with transient waveforms are not yet available.
It was explained that transient tests are needed in two situations: troubleshooting
relay’s misoperations and when evaluating new relays to be purchased.
It was shown that hardware and software tools exist in practice to perform
transient tests. These tools have different performance characteristics and are utilized in
different applications. Some of these tools will be used in practical implementation of
the new methodology.
To recapitulate, new methodology in transient testing of protective relays need to
be established because there is no methodology defined so far in that area. New
44
methodology should define when the transient tests are needed. It should define
comprehensive procedures for transient testing. The new methodology should propose
solutions how to conduct transient testing of protective relays using available hardware
and software tools. New methodology that will be described in this thesis will use
advanced software tools to combine different simulation packages in order to create test
cases. Conventional test set as well as digital simulator will be used in practical
implementation of the new methodology.
45
CHAPTER IV
NEW METHODOLOGY FOR RELAY TESTING AND
EVALUATION
Introduction To improve existing practice in transient relay testing, new methodology with
testing scenarios and procedures will be defined. The new methodology will summarize
when the transient tests are needed and what the criteria for proper relay operation are
when transient tests are performed. The procedures and scenarios for transient tests of
protective relays will be defined. The new methodology will be applied by using
advanced software packages and hardware tools.
In previous chapters, it was already explained why and when the transient tests
are needed. Basic idea that transient tests should be performed with large number of tests
was set forth. Background of the existing relay testing practices with definitions of test
equipment, hardware and software components and different concepts in protective
relays’ testing and evaluation was presented.
Summary of previous conclusions will be given in this chapter as well. The focus
is to establish procedures and scenarios for transient testing of protective relays and to
propose hardware and software tools for implementation of the new methodology.
Procedures and scenarios for evaluation will allow detailed assessment of various
features of modern numerical protective relays and check random characteristic of their
responses. The existing approaches in transient relay testing do not offer comprehensive
definition of scenarios and procedures for relay testing. Criteria for proper relay
operation, cases for relay testing and number of shots in each case will be proposed as a
part of the new methodology.
Hardware and software tools used to implement the new methodology will be
capable of recreating transient events similar to those that the relay will be exposed to in
a real network. Simulation environment will be user friendly and suitable for application
46
in various conditions: in laboratory and in the field. When new protective relays are
procured, transient tests need to be performed in laboratory conditions with a large set of
simulated events and network conditions. In troubleshooting relay misoperations, it may
be required that transient tests are performed in the field by simulating smaller set of
events or by replaying data files from digital fault recorder. To achieve these tasks,
implementation of the new methodology will be possible with different types of testing
tools and equipment.
Definition of the New Methodology New methodology in transient testing of protective relays developed in this
research explains why the transient testing of numerical protective relays is necessary
and in what situations such tests should be applied. It proposes solution how to create
scenarios and procedures to test numerical relays.
As already pointed out, the main purpose of existing approaches in transient
testing of protective relays is to check selectivity and average tripping time. The new
methodology is developed for the same purpose. It improves existing practices with
particular emphasis on the fact that relay responses are random and large number of tests
needs to be performed to derive conclusion if protective relay operates properly.
Finally, hardware and software environment will be created for the new
methodology. The new methodology defines how to perform the tests and what
procedures to apply to achieve main objectives of transient testing.
Why and when the transient tests are needed?
Conventional approach is still the most common approach used in relay testing.
Relays are tested with phasors of currents and voltages, whereas in the real power
system relays are exposed to transients. By testing protective relays with phasor
quantities, operating characteristic can be verified and tripping time of protective relay
can be checked.
Development of the new technologies in protective relay design and application
requires more sophisticated techniques for relay testing. Numerical protective devices
use digital signal processing to extract phasors from transient current and voltage
47
waveforms that occur in a real network. Shape of a transient waveform is random even
for the same fault location. Transient waveforms are different for different faults and
fault inception times. Reach decision and average tripping time of a numerical relay are
random. It is necessary to check if the numerical relay will operate properly when
exposed to transients. When operation of protective relay is analyzed for a fault at a
given fault location, it is necessary to generate large number of transient waveforms,
with different fault inception times. Several repetitive shots have to be applied for each
case. Selectivity of protective relay and average tripping time should be tested.
In summary, there are two main reasons why the transient tests are necessary:
- Current and voltage waveforms that occur in a real power system during
faults are transient. Protective relays should be tested by applying waveforms
similar to the ones that will occur in a real network.
- Transient responses of numerical relays are random. Selectivity and average
tripping time of numerical relays need to be tested with large number of
transient tests.
Although application of transient testing is justified and proven as very useful,
transient tests are still not commonly used in practice. In regular testing practice,
protective relays are tested with conventional test sets. There are several possible reasons
why the transient tests are not yet widely implemented. One of the reasons is that
hardware and software tools used in transient tests are still not quite affordable. A lot of
tools are custom made solutions, sometimes relatively expensive, or more expensive
then classical solutions. Another reason is that implementation of these sophisticated
tools requires greater effort for maintenance personnel training. Yet another reason is
that testing procedures and practices in transient testing are not elaborately defined.
Two situations are identified where transient testing evaluations proved
indispensable:
- The first situation is in trouble-shooting relay misoperations. To reconstruct
the fault condition and course of events very accurately, transient tests need
to be used.

48
- The second situation is when the new relays need to be procured. User can
assure weather a given relay is suitable for the specific power system
application by testing the relay under realistic conditions.
What procedures should be applied in transient testing?
To conduct transient tests of protective relays, it is necessary to establish
procedures how the transient tests should be performed and what criteria should be
followed to conclude if relay operation is satisfactory.
Two different situations are already identified where transient tests are useful:
trouble-shooting relay misoperations and procurement of new protective relays. In both
situations testing procedures need to be defined.
When trouble-shooting relay misoperations, two approaches can be used. The
first approach is to use data from digital fault recorder and analyze specific fault
condition. The second approach is to reconstruct the fault condition and course of events
with modeling software. Combination of both approaches can also be used for detailed
investigations. New methodology will be applied by software and hardware tools
capable to create and execute such tests.
When new protective relays are procured, it is useful to test the relay under
realistic conditions and check if protective relay is suitable for specific power system
application. Procedures and scenarios in this research are defined for such relays, but
basic principles can be applied in trouble-shooting relay misoperations as well.
Procedures and scenarios should be defined to check if criteria for satisfactory
operation of protective relay are satisfied. To summarize, these criteria are:
- The first criterion is to check if selectivity of protective relay is achieved for
various network conditions.
- The second criterion is to check if the average tripping time is within the
acceptable limits, or as expected, for different test cases.
Various test scenarios should be created by modeling standard faults and special
faults. Because of random nature of protective relay response, it is very important that
each test is repeated several times, for different fault inception angles. Selectivity and
49
average tripping time should be determined after repeating several tests for each
simulation case. Detailed explanation of test scenarios and procedures will be given in
the following sections.
How the transient tests should be created and implemented?
To create and implement the transient tests, it is necessary to create hardware and
software environment for relay testing and to define simulation scenarios and
procedures. Clearly, major components used to implement the new methodology are:
hardware tools, software packages and testing procedures. Main characteristics of the
components used to implement the new methodology are given next.
The first component in implementation of the new methodology is the simulation
hardware. Application of the new methodology should be possible for practically all test
scenarios in laboratory conditions using digital simulators. At the same time, new
simulation approach should provide options to conduct large number of tests directly
inside the substation, using less expensive equipment such as standard test sets. Digital
simulator and standard test set are utilized to implement the new methodology.
The second component in implementation of the new methodology is related to
modeling and simulation software. Modeling and simulation software should be capable
of simulating variety of scenarios and testing conditions. Simulation software tools
should be capable to perform short circuit studies in order to calculate and check settings
of protective relay. In order to check selectivity and average tripping time, simulation
software tools should be capable of performing transient simulations and creating variety
of fault scenarios including dynamic long term events. Modeling and simulation
software should contain library of protective relay models to conduct complex dynamic
simulations and analyze response of protective relays at different locations in the
network. It should have user friendly software platform for signal editing and replaying
as well as results analysis. Software structure used in new methodology contains two
transient simulation software packages, designated as Package 1 and Package 2. It
contains one short circuit software package designated as Package 3. Software platform
is achieved through Package 4.
50
The third component in implementation of the new methodology is related to
defining procedures for relay testing. Modern numerical relays often contain integrated
functions in one device. As an example, modern numerical distance relays are not only
devices that contain zone underimpedance elements and a few auxiliary functions. They
contain a variety of functions to improve their performance, primarily their
dependability and security. Examples of additional functions are: weak infeed logic,
power swing blocking, switching onto fault, switching on reclosing, VT fuse failure,
implementation of several different setting groups, etc. These functions should be tested
and evaluated. It is often difficult to generate all relevant scenarios using only one
network model. To create scenarios for checking selectivity of relay operation during
transients and average tripping time, different network models should be used. Three
network models of different complexity, designated as Model 1, Model 2 and Model 3
are utilized for the new methodology.
Implementation of the new methodology by defining hardware options, software
architecture, network models and test procedure will be analyzed in the following
sections.
Hardware Options The first component in implementation of the new methodology - hardware
options are realized using digital simulator and standard test set. The major hardware
building blocks used in simulations are given in Fig. 16.
Proposed hardware options provide possibilities for conventional approach to
relay testing as well. Test signals can be generated through standard test set. Operating
characteristics and operating time of distance protective relays and overcurrent relays
can be checked by injecting phasors. Phasors of currents and voltages can be defined
through standard test set’s interface. The main focus remains on transient testing for
zone selectivity and average tripping time.
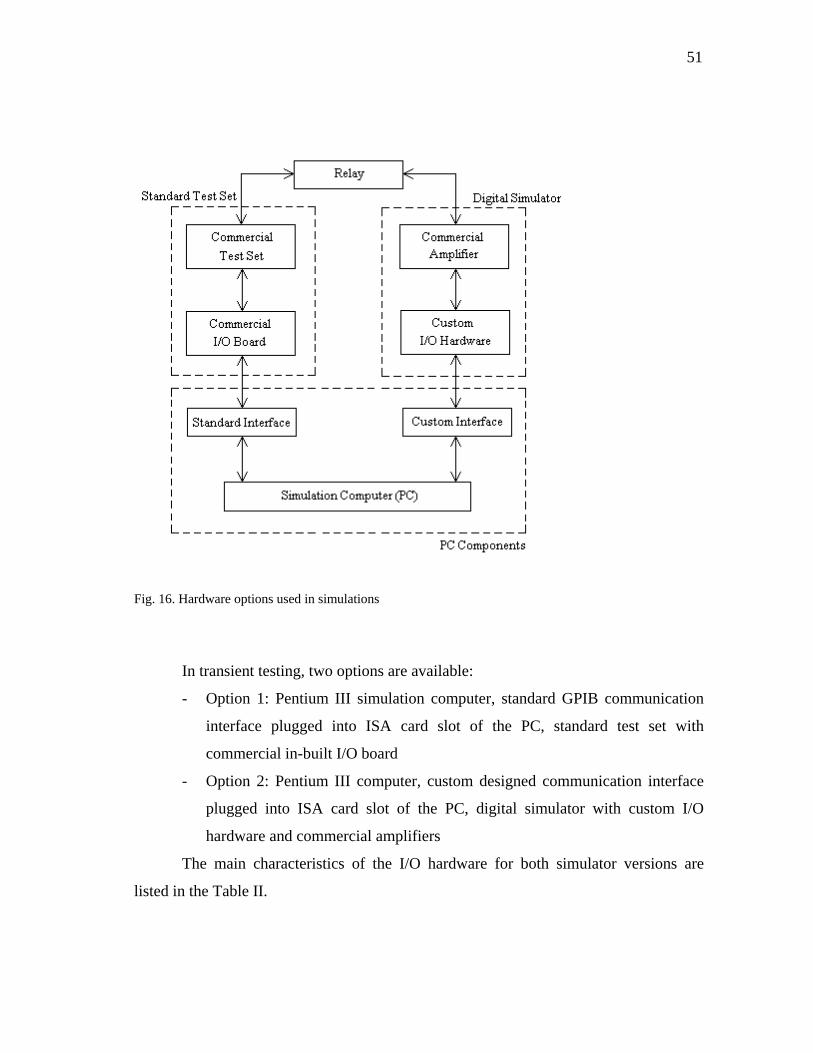
51
Fig. 16. Hardware options used in simulations
In transient testing, two options are available:
- Option 1: Pentium III simulation computer, standard GPIB communication
interface plugged into ISA card slot of the PC, standard test set with
commercial in-built I/O board
- Option 2: Pentium III computer, custom designed communication interface
plugged into ISA card slot of the PC, digital simulator with custom I/O
hardware and commercial amplifiers
The main characteristics of the I/O hardware for both simulator versions are
listed in the Table II.
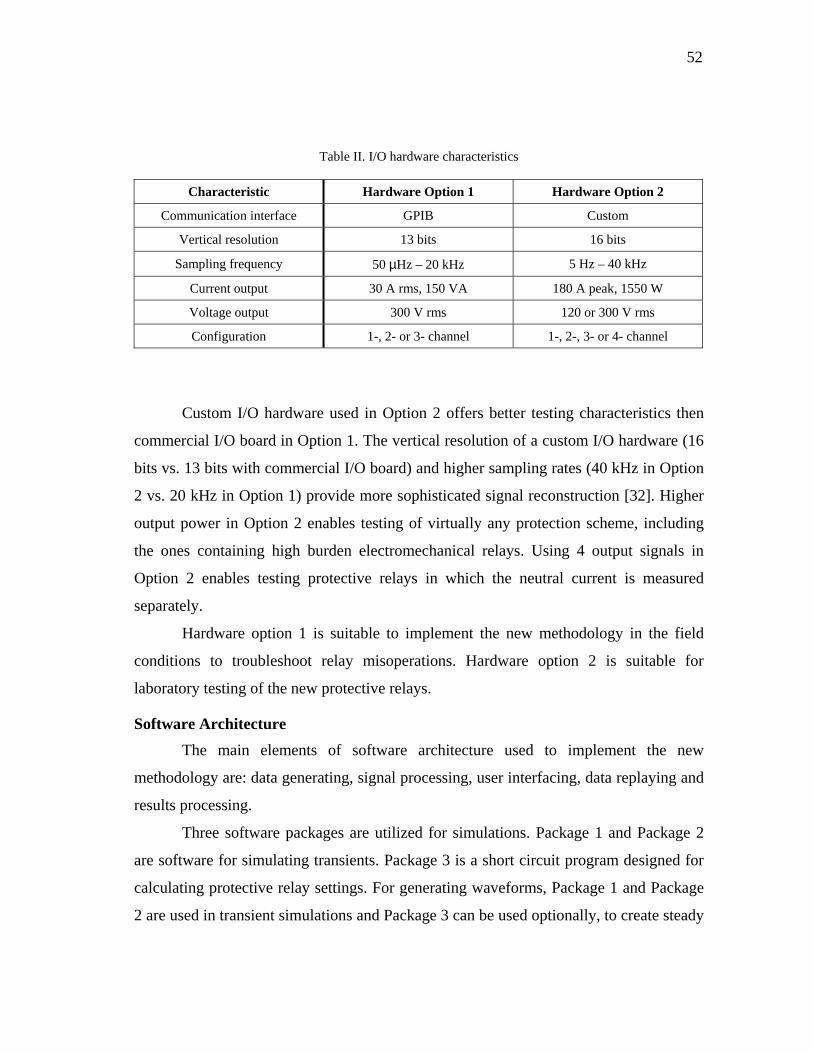
52
Table II. I/O hardware characteristics
Characteristic Hardware Option 1 Hardware Option 2
Communication interface GPIB Custom
Vertical resolution 13 bits 16 bits
Sampling frequency 50 µHz – 20 kHz 5 Hz – 40 kHz
Current output 30 A rms, 150 VA 180 A peak, 1550 W
Voltage output 300 V rms 120 or 300 V rms
Configuration 1-, 2- or 3- channel 1-, 2-, 3- or 4- channel
Custom I/O hardware used in Option 2 offers better testing characteristics then
commercial I/O board in Option 1. The vertical resolution of a custom I/O hardware (16
bits vs. 13 bits with commercial I/O board) and higher sampling rates (40 kHz in Option
2 vs. 20 kHz in Option 1) provide more sophisticated signal reconstruction [32]. Higher
output power in Option 2 enables testing of virtually any protection scheme, including
the ones containing high burden electromechanical relays. Using 4 output signals in
Option 2 enables testing protective relays in which the neutral current is measured
separately.
Hardware option 1 is suitable to implement the new methodology in the field
conditions to troubleshoot relay misoperations. Hardware option 2 is suitable for
laboratory testing of the new protective relays.
Software Architecture The main elements of software architecture used to implement the new
methodology are: data generating, signal processing, user interfacing, data replaying and
results processing.
Three software packages are utilized for simulations. Package 1 and Package 2
are software for simulating transients. Package 3 is a short circuit program designed for
calculating protective relay settings. For generating waveforms, Package 1 and Package
2 are used in transient simulations and Package 3 can be used optionally, to create steady

53
state waveforms and perform short circuit calculations. All three software packages are
capable of converting data to COMTRADE format. Simulation cases are created through
batch generating auxiliary software incorporated in Package 1. Built-in functions of
Package 2 and Package 3 are used to create test cases with these software packages.
The waveform files generated by all software packages sometimes require
processing in order to be actually used for the testing. The signal editing and processing
functions such as cut, paste, insert, resample, rescale, invert, and filter are examples of
the functions supported by Package 4. Package 4 is the main tool used in signal
processing.
Package 4 is also used as user interface (GUI). Its functions for test and
waveform handling as well as signal processing and displaying affect the effectiveness
of relay testing tremendously. In addition, GUI of Package 4 provides the required
software/hardware transparency.
Prepared waveform files are replayed to the relay under test through a digital to
analog conversion system. Depending on the selection of the I/O hardware, various
implementations of the replaying engines are available through Package 4.
After replaying the waveform file, the Package 4 assists the user in processing
the relay response. Processing extracts as much information as possible from the raw
relay trip data. The results obtained through the processing are suitable both for
immediate and for further analysis with independent software packages.
In summary, simulation software consists of four layers: test case creation,
waveform processing, graphical user interface and waveform replaying. All four
software layers are integrated in a single Windows application through Package 4.
The simulator software architecture applied in new methodology, showing all
four layers and layer components is presented in Fig 17.
Combining hardware components shown in Fig. 16 and applying software
architecture presented in Fig. 17 simulation environment for advanced relay testing is
prepared. Network models and test cases need to be created in all three software
packages: transient software packages Package 1 and Package 2 and short circuit
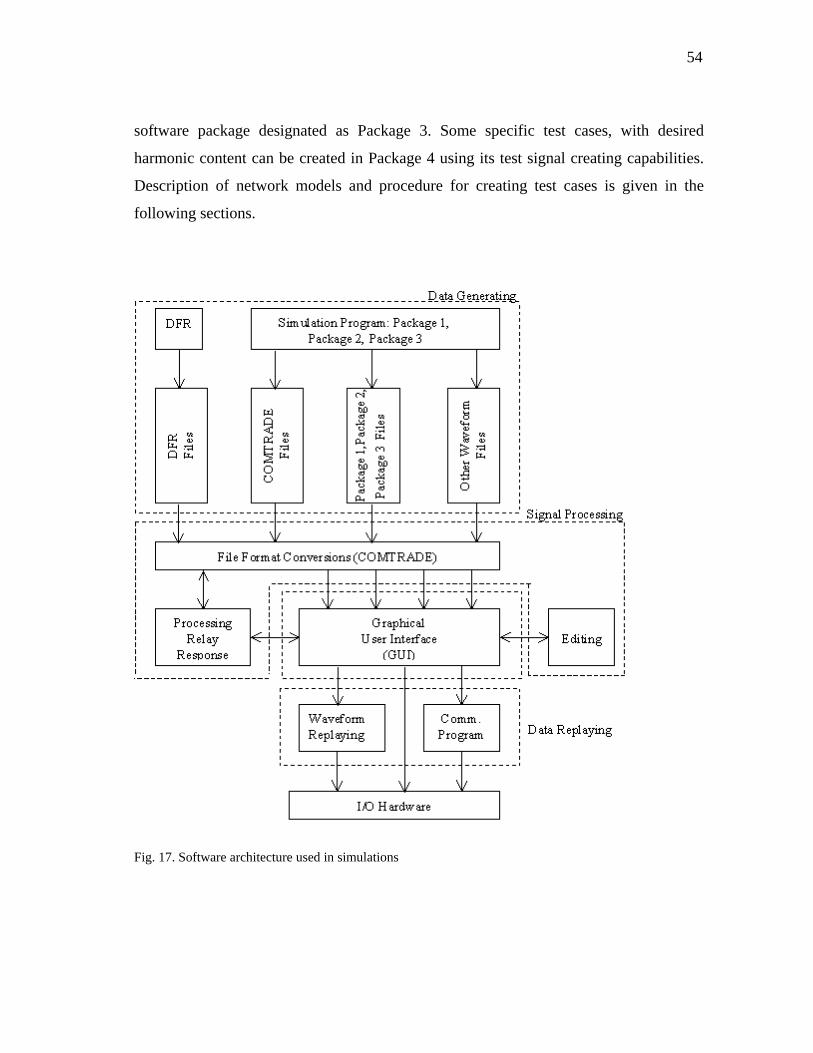
54
software package designated as Package 3. Some specific test cases, with desired
harmonic content can be created in Package 4 using its test signal creating capabilities.
Description of network models and procedure for creating test cases is given in the
following sections.
Fig. 17. Software architecture used in simulations
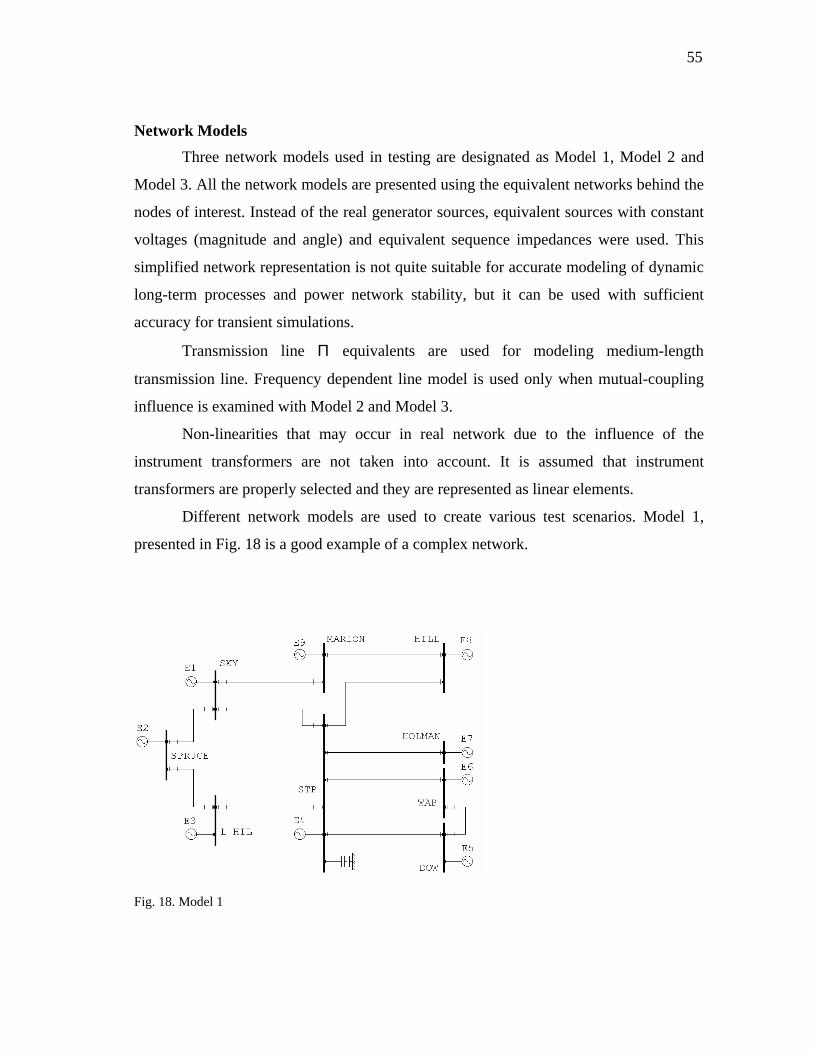
55
Network Models Three network models used in testing are designated as Model 1, Model 2 and
Model 3. All the network models are presented using the equivalent networks behind the
nodes of interest. Instead of the real generator sources, equivalent sources with constant
voltages (magnitude and angle) and equivalent sequence impedances were used. This
simplified network representation is not quite suitable for accurate modeling of dynamic
long-term processes and power network stability, but it can be used with sufficient
accuracy for transient simulations.
Transmission line Π equivalents are used for modeling medium-length
transmission line. Frequency dependent line model is used only when mutual-coupling
influence is examined with Model 2 and Model 3.
Non-linearities that may occur in real network due to the influence of the
instrument transformers are not taken into account. It is assumed that instrument
transformers are properly selected and they are represented as linear elements.
Different network models are used to create various test scenarios. Model 1,
presented in Fig. 18 is a good example of a complex network.
Fig. 18. Model 1
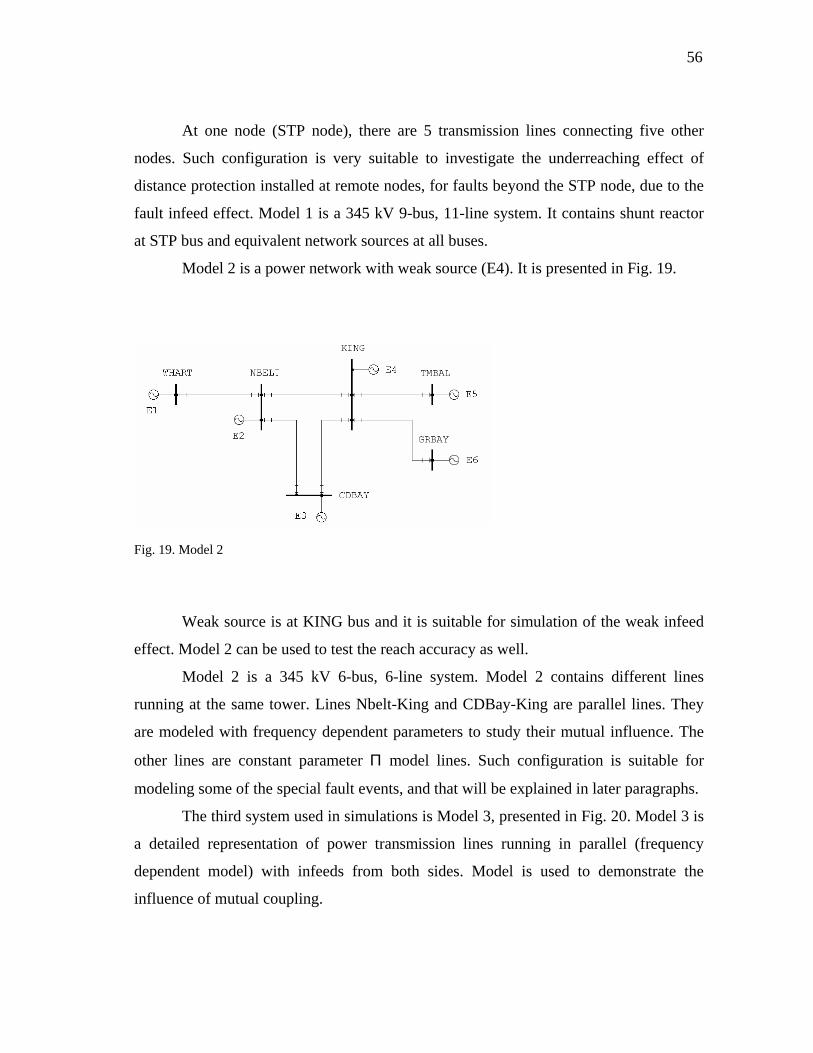
56
At one node (STP node), there are 5 transmission lines connecting five other
nodes. Such configuration is very suitable to investigate the underreaching effect of
distance protection installed at remote nodes, for faults beyond the STP node, due to the
fault infeed effect. Model 1 is a 345 kV 9-bus, 11-line system. It contains shunt reactor
at STP bus and equivalent network sources at all buses.
Model 2 is a power network with weak source (E4). It is presented in Fig. 19.
Fig. 19. Model 2
Weak source is at KING bus and it is suitable for simulation of the weak infeed
effect. Model 2 can be used to test the reach accuracy as well.
Model 2 is a 345 kV 6-bus, 6-line system. Model 2 contains different lines
running at the same tower. Lines Nbelt-King and CDBay-King are parallel lines. They
are modeled with frequency dependent parameters to study their mutual influence. The
other lines are constant parameter Π model lines. Such configuration is suitable for
modeling some of the special fault events, and that will be explained in later paragraphs.
The third system used in simulations is Model 3, presented in Fig. 20. Model 3 is
a detailed representation of power transmission lines running in parallel (frequency
dependent model) with infeeds from both sides. Model is used to demonstrate the
influence of mutual coupling.
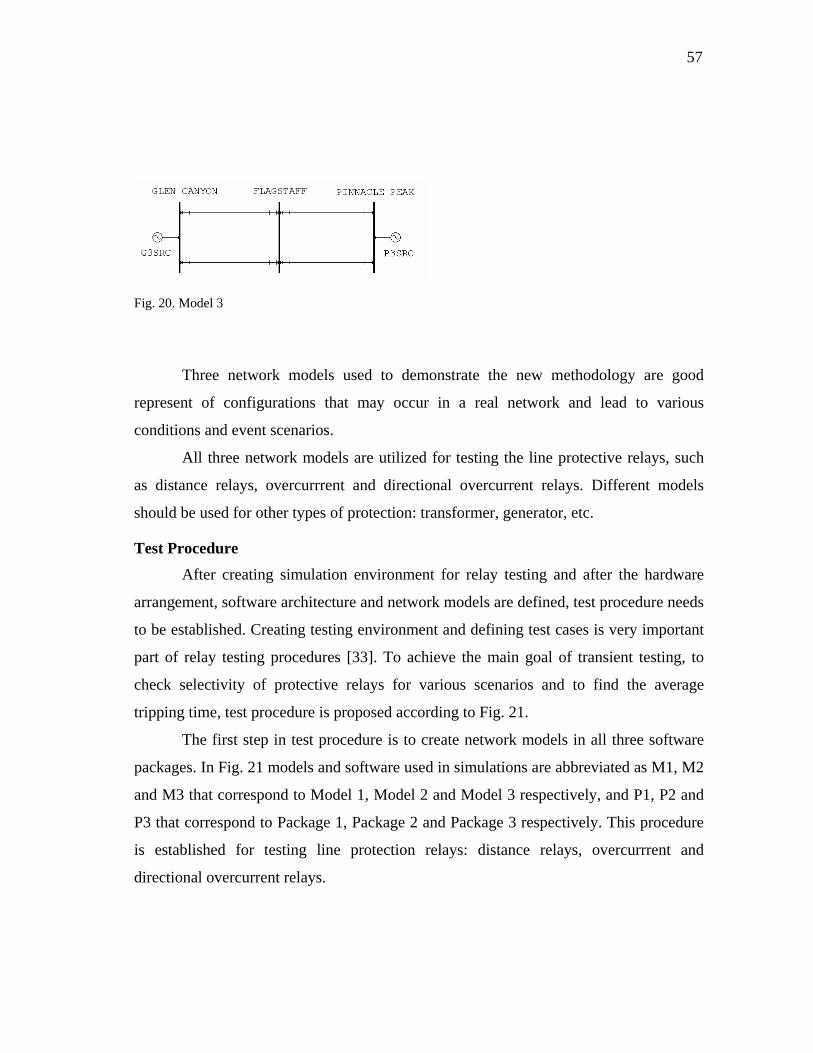
57
Fig. 20. Model 3
Three network models used to demonstrate the new methodology are good
represent of configurations that may occur in a real network and lead to various
conditions and event scenarios.
All three network models are utilized for testing the line protective relays, such
as distance relays, overcurrrent and directional overcurrent relays. Different models
should be used for other types of protection: transformer, generator, etc.
Test Procedure After creating simulation environment for relay testing and after the hardware
arrangement, software architecture and network models are defined, test procedure needs
to be established. Creating testing environment and defining test cases is very important
part of relay testing procedures [33]. To achieve the main goal of transient testing, to
check selectivity of protective relays for various scenarios and to find the average
tripping time, test procedure is proposed according to Fig. 21.
The first step in test procedure is to create network models in all three software
packages. In Fig. 21 models and software used in simulations are abbreviated as M1, M2
and M3 that correspond to Model 1, Model 2 and Model 3 respectively, and P1, P2 and
P3 that correspond to Package 1, Package 2 and Package 3 respectively. This procedure
is established for testing line protection relays: distance relays, overcurrrent and
directional overcurrent relays.

58
Fig. 21. Test procedure - flowchart
Although not used for transient testing, models created in short circuit software
Package 3 are included in the simulation environment. Using Package 3 is optional.
Package 3 can be applied in testing with phasors and in calculating relay settings. Since
Package 3 has excellent library of protective relay models it can also be used for
simulating complex events in dynamic simulations. These simulations are not done as a
part of this research.
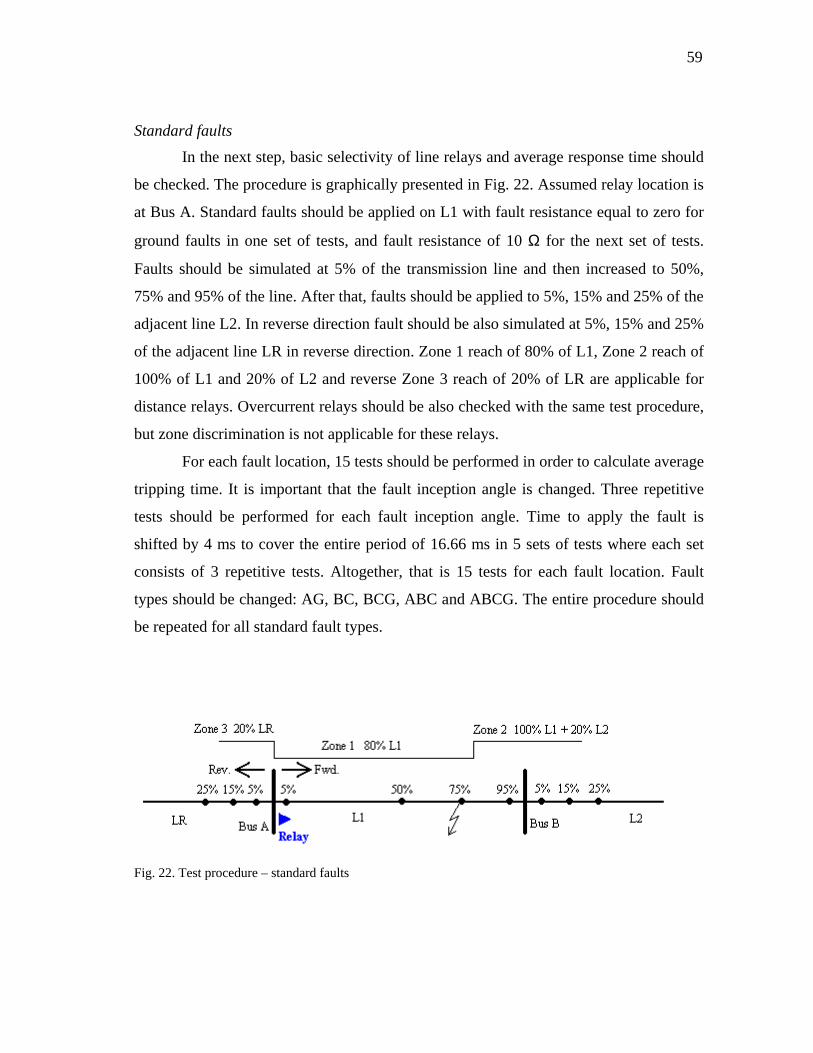
59
Standard faults
In the next step, basic selectivity of line relays and average response time should
be checked. The procedure is graphically presented in Fig. 22. Assumed relay location is
at Bus A. Standard faults should be applied on L1 with fault resistance equal to zero for
ground faults in one set of tests, and fault resistance of 10 Ω for the next set of tests.
Faults should be simulated at 5% of the transmission line and then increased to 50%,
75% and 95% of the line. After that, faults should be applied to 5%, 15% and 25% of the
adjacent line L2. In reverse direction fault should be also simulated at 5%, 15% and 25%
of the adjacent line LR in reverse direction. Zone 1 reach of 80% of L1, Zone 2 reach of
100% of L1 and 20% of L2 and reverse Zone 3 reach of 20% of LR are applicable for
distance relays. Overcurrent relays should be also checked with the same test procedure,
but zone discrimination is not applicable for these relays.
For each fault location, 15 tests should be performed in order to calculate average
tripping time. It is important that the fault inception angle is changed. Three repetitive
tests should be performed for each fault inception angle. Time to apply the fault is
shifted by 4 ms to cover the entire period of 16.66 ms in 5 sets of tests where each set
consists of 3 repetitive tests. Altogether, that is 15 tests for each fault location. Fault
types should be changed: AG, BC, BCG, ABC and ABCG. The entire procedure should
be repeated for all standard fault types.
Fig. 22. Test procedure – standard faults
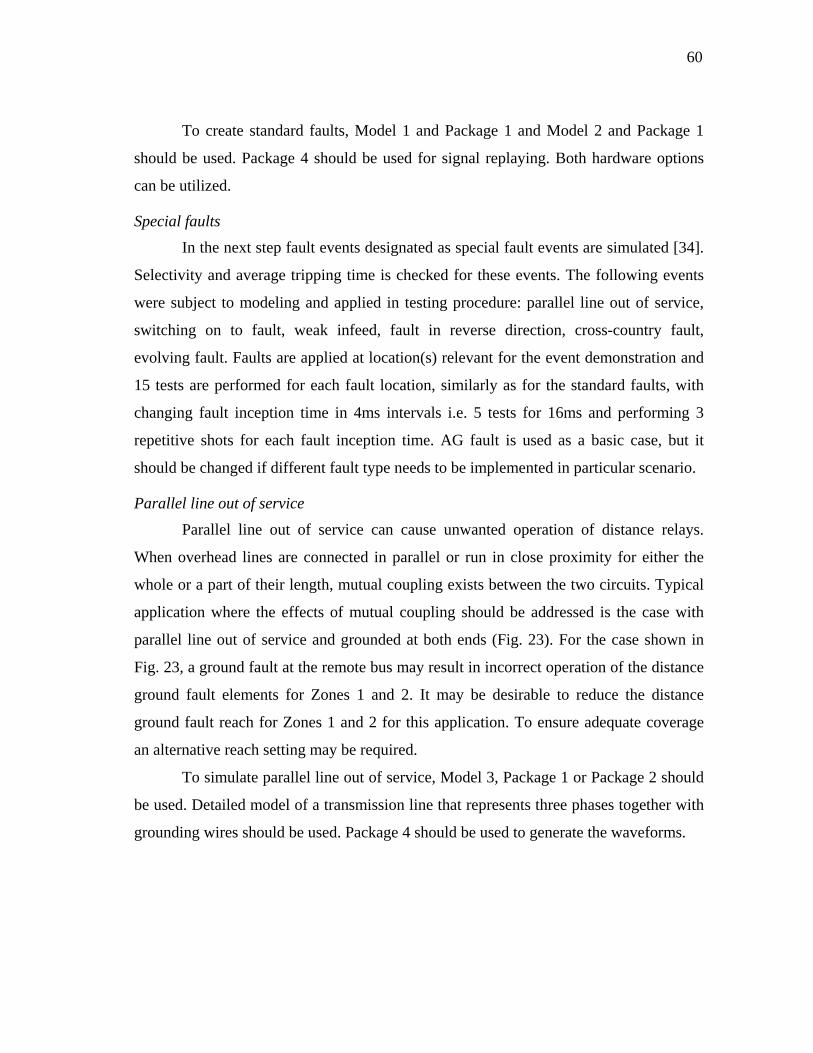
60
To create standard faults, Model 1 and Package 1 and Model 2 and Package 1
should be used. Package 4 should be used for signal replaying. Both hardware options
can be utilized.
Special faults
In the next step fault events designated as special fault events are simulated [34].
Selectivity and average tripping time is checked for these events. The following events
were subject to modeling and applied in testing procedure: parallel line out of service,
switching on to fault, weak infeed, fault in reverse direction, cross-country fault,
evolving fault. Faults are applied at location(s) relevant for the event demonstration and
15 tests are performed for each fault location, similarly as for the standard faults, with
changing fault inception time in 4ms intervals i.e. 5 tests for 16ms and performing 3
repetitive shots for each fault inception time. AG fault is used as a basic case, but it
should be changed if different fault type needs to be implemented in particular scenario.
Parallel line out of service
Parallel line out of service can cause unwanted operation of distance relays.
When overhead lines are connected in parallel or run in close proximity for either the
whole or a part of their length, mutual coupling exists between the two circuits. Typical
application where the effects of mutual coupling should be addressed is the case with
parallel line out of service and grounded at both ends (Fig. 23). For the case shown in
Fig. 23, a ground fault at the remote bus may result in incorrect operation of the distance
ground fault elements for Zones 1 and 2. It may be desirable to reduce the distance
ground fault reach for Zones 1 and 2 for this application. To ensure adequate coverage
an alternative reach setting may be required.
To simulate parallel line out of service, Model 3, Package 1 or Package 2 should
be used. Detailed model of a transmission line that represents three phases together with
grounding wires should be used. Package 4 should be used to generate the waveforms.

61
Fault
R SL2
L1
Zm0
Fig. 23. Parallel line out of service
Switching on-to-fault (recognizing fault after energizing the line)
This event occurs following manual circuit breaker switching on-to a persistent
fault. In such case, three pole instantaneous tripping (and auto-reclose blocking) should
occur for any fault detected on the protected element. One complication is possible in
case of switching on-to a fault close to the remote line end, when an underreach distance
protection scheme is used. If the fault is not recognized as an immediate fault after the
circuit breaker closing, fault clearance will be unnecessarily delayed.
To simulate switching on-to-fault, Model 1 or Model 2 and Package 2 should be
used. Package 2 provides flexibility in modeling such kind of events. Package 4 is used
to generate waveforms.
Weak infeed system
It may be considered whenever there are sources with high impedances in the
network. Long line transmission systems with remote generation may have these
characteristics. Weak infeed characteristics could also be found when small generators
are installed and connected to the system, or when some of the generators are
occasionally off line. Several protection complications may occur due to the weak
infeed: there may be insufficient current contribution to a fault on the protected line for a
relay to reliably detect a fault. In case of multiterminal lines with a weak source at one
terminal as compared to the other terminals, protection at the weak source will not detect
faults beyond the tap as successfully as relays at a strong source.
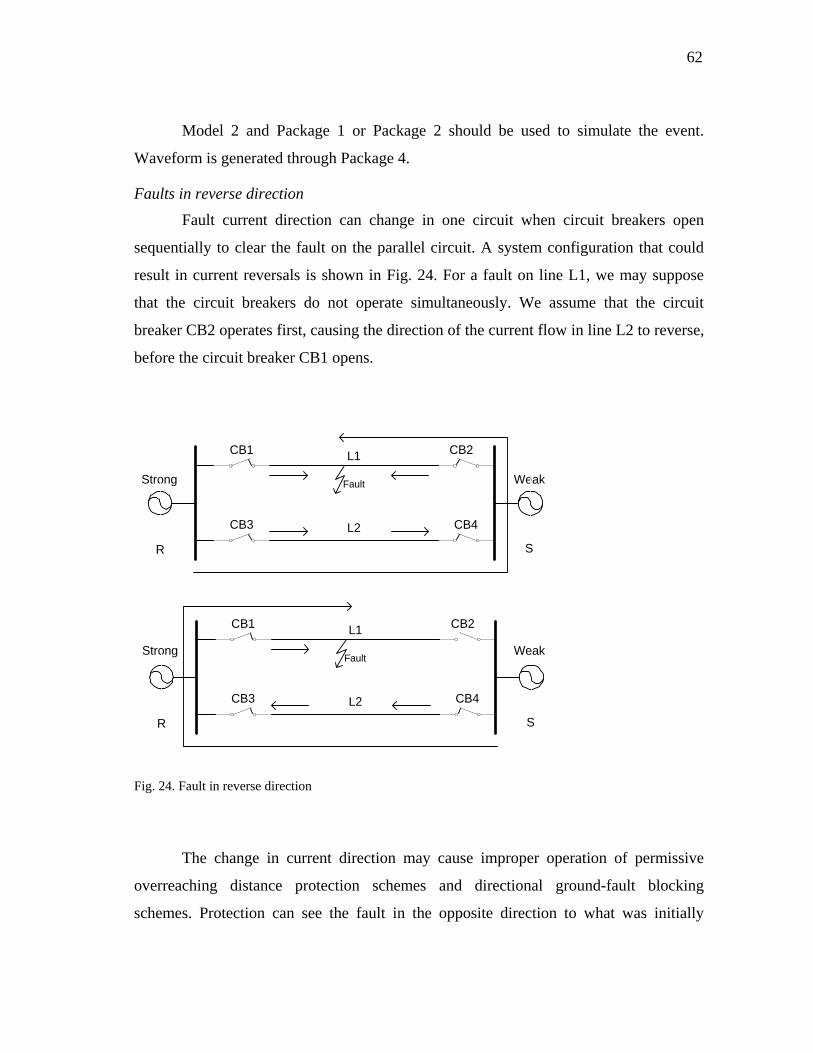
62
Model 2 and Package 1 or Package 2 should be used to simulate the event.
Waveform is generated through Package 4.
Faults in reverse direction
Fault current direction can change in one circuit when circuit breakers open
sequentially to clear the fault on the parallel circuit. A system configuration that could
result in current reversals is shown in Fig. 24. For a fault on line L1, we may suppose
that the circuit breakers do not operate simultaneously. We assume that the circuit
breaker CB2 operates first, causing the direction of the current flow in line L2 to reverse,
before the circuit breaker CB1 opens.
WeakStrong Fault
R S
CB1 CB2
CB3 CB4L2
L1
StrongFault
R S
CB1 CB2
CB3 CB4L2
L1Weak
Fig. 24. Fault in reverse direction
The change in current direction may cause improper operation of permissive
overreaching distance protection schemes and directional ground-fault blocking
schemes. Protection can see the fault in the opposite direction to what was initially
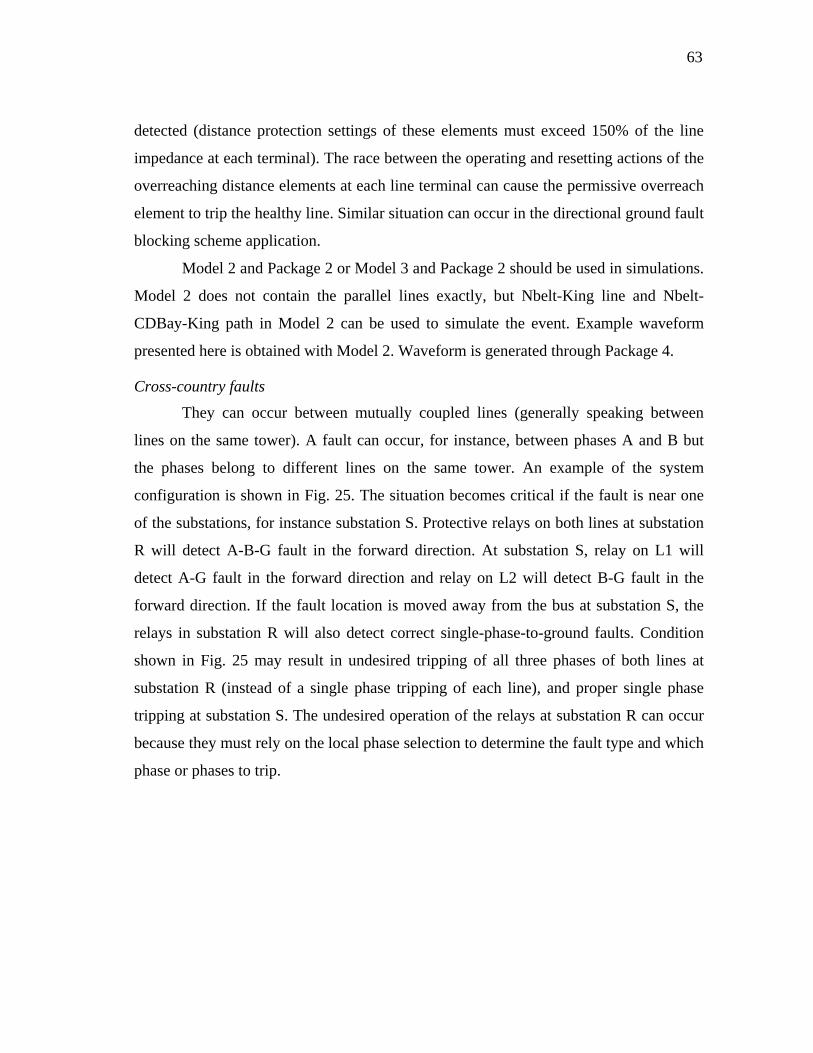
63
detected (distance protection settings of these elements must exceed 150% of the line
impedance at each terminal). The race between the operating and resetting actions of the
overreaching distance elements at each line terminal can cause the permissive overreach
element to trip the healthy line. Similar situation can occur in the directional ground fault
blocking scheme application.
Model 2 and Package 2 or Model 3 and Package 2 should be used in simulations.
Model 2 does not contain the parallel lines exactly, but Nbelt-King line and Nbelt-
CDBay-King path in Model 2 can be used to simulate the event. Example waveform
presented here is obtained with Model 2. Waveform is generated through Package 4.
Cross-country faults
They can occur between mutually coupled lines (generally speaking between
lines on the same tower). A fault can occur, for instance, between phases A and B but
the phases belong to different lines on the same tower. An example of the system
configuration is shown in Fig. 25. The situation becomes critical if the fault is near one
of the substations, for instance substation S. Protective relays on both lines at substation
R will detect A-B-G fault in the forward direction. At substation S, relay on L1 will
detect A-G fault in the forward direction and relay on L2 will detect B-G fault in the
forward direction. If the fault location is moved away from the bus at substation S, the
relays in substation R will also detect correct single-phase-to-ground faults. Condition
shown in Fig. 25 may result in undesired tripping of all three phases of both lines at
substation R (instead of a single phase tripping of each line), and proper single phase
tripping at substation S. The undesired operation of the relays at substation R can occur
because they must rely on the local phase selection to determine the fault type and which
phase or phases to trip.
64
Fault A-G
R SL2
L1
Fault B-G
A-G forwB-G rev
A-G revB-G forw
A-G forwB-G forw
A-G forwB-G forw
Fig. 25. Cross-country fault
To simulate the cross country fault Model 2 and Package 2 and Model 3 and
Package 2 can be used. Waveforms are generated through Package 4.
Evolving faults
They start as a single-phase-to-ground fault and then involve additional phases
during the time that the initial fault is being cleared or during the circuit breaker dead
time of the original faulted phase. Evolving fault may lead to difficulties in coordinating
the ground-fault relays and overcurrent relays.
Model 1 and Model 2 can be used in simulations. Package 2 is the best tool to
simulate the event. As in all other cases software platform (Package 4) should be used to
generate waveforms.
Summary of the events
Summary of software tools and network models used to create testing procedures
according to the new methodology is given in Table III. Package 4 is used as software
platform in all tests and it won’t be mentioned separately in this Table. Package 3 is a
short circuit software. It is a part of the new testing environment but it is not utilized in
given examples. Arrangements presented in Table III are empirically qualified as the
best and optimal solution, proved as such in a large number of test cases. Other
combinations of network models and software tools can also be used to simulate
particular event, but probably less efficiently. The whole process would often be more
involving to utilize particular network models and tools. The list of events presented in

65
Table III is not the final list of all events that can occur in a real network. These are
events that can be simulated with available tools.
Table III. Summary of the events
Network Model Software Tool
Event Model 1 Model 2 Model 3 Pack. 1 Pack. 2 Pack. 3*
Standard faults
Parallel line out of service
Switch on-to fault
Weak infeed
Fault in reverse direction
Cross country fault
Evolving fault
* Package 3 is a short circuit program
Conclusion This chapter gave summary of the objectives of the new methodology.
Procedures and scenarios for transient testing of protective relays, with main focus on
testing numerical transmission line relays were defined. Implementation of the new
methodology to create variety of test cases and scenarios was proposed. Implementation
of the new methodology was realized with compact equipment suitable for
troubleshooting relay misopertaions in the field and with high performance equipment
suitable for testing new protective relays in laboratory conditions.
The test cases and scenarios were selected based on the application relevance of
the operating conditions. In protective relays’ testing performed for this research, the
attempt was to discover and quantify random characteristics of relay behavior, by
checking their selectivity and average tripping time.
66
Different software packages were used to create test cases to demonstrate that in
some cases, some software packages may be better to use then the others. It was
demonstrated that to carry out a comprehensive procedure, combination of various
software packages may be needed.
Because of the fact that transient response of numerical relays is random, it was
emphasized that selectivity and average tripping time of numerical relays should be
checked through large number of transient scenarios and test cases. Repetitive tests
should be performed for a given scenario or fault location with different fault inception
times.
Implementation of the new methodology was proposed through a combination of
hardware options and software tools to achieve the best possible utilization of available
power system modeling and waveform replaying options.
67
CHAPTER V
TEST METHODOLOGY APPLICATION AND RESULTS
Introduction Application of the new methodology will be demonstrated in this chapter. The
new methodology will be implemented by modeling cases and scenarios defined for the
new methodology, by using software packages and utilizing hardware tools accordingly.
In the first part, description of relays under tests will be given. Setting principles
as well as how these settings are changed in some cases to achieve different testing
objectives defined by the new methodology will be explained.
Test cases and scenarios that include standard faults and special faults will be
created and example waveforms will be shown. Implementation of the new methodology
will include network modeling, waveform simulations and replays. To implement the
new methodology two hardware tools for generating signals and three software packages
for network modeling and simulations will be used. Software package for signal editing
and replaying will be used as well. Principle to change fault inception angle for the same
fault scenario and to perform several repetitive tests for the same inception angle will be
used to obtain results. Selectivity and average tripping time of protective relays will be
checked.
Test results will be analyzed and conclusions if selectivity criteria and average
tripping time of protective relays are satisfied will be derived. Comparison of hardware
and software components used to demonstrate the new methodology will be given as
well.
All obtained results will be listed in appropriate tables.
Protective Relays
Protective relays that were subject to tests are the microprocessor relays of the
following types: two distance relays and two overcurrent/ground fault relays. These
relays are used for transmission line protection. None of the relays are the same brand
and model. Brief description of protective relays used in simulations is given next.
68
Protective relay A: distance relay
Relay A is a flexible system available for power system protection, monitoring,
and control. Relay A is a microprocessor controlled, universal platform. The same
device can be used in different applications. For each application, a scheme file is
created in relay software application, and downloaded to Relay A. Relay software
application provides an integrated environment for the configuration and operation of
Relay A, as well as a complete programming system for developing power system
applications. Distance relay scheme with reclosing and POTT is uploaded to the relay.
Distance relay scheme uses three independent phase difference, or phase paired,
mho operating characteristics per zone of protection to account for phase-to-phase and
three phase faults. It also uses three independent residual current compensated phase
mho operating characteristics per zone of protection to account for ground faults. Three
forward zones and one reverse zone of ground distance protection are provided.
In addition to the distance protection provided, the distance relay scheme also
incorporates overcurrent protection, ground fault protection, undervoltage and
overvoltage, directional supervision and fault locator.
Distance relay scheme provides logic to prevent incorrect trip in case of current
reversals, weak infeed conditions at one terminal, breaker open at one terminal, switch
onto fault, load encroachment, VT fuse failure and power swing.
Hardware configuration tested has two contact terminal modules. The first
module contains 4 current and 4 voltage measurement inputs for the relay, as well as two
contact output drivers (one form electromechanical and one solid-state high speed trip
output). The second board contains most of the peripheral and I/O ports for the relay.
Protective relay B: distance relay
Relay B is a microprocessor-based device that protects, controls and monitors
EHV, HV and subtransmission lines. It is a protective relay package for pilot and non-
pilot schemes. The main protective functions of Relay B are: four zones of phase and
ground distance protection, independently set phase and ground distance elements,
69
independent phase, negative-sequence and time overcurrent elements, memory
polarization for directional overcurrent and ground fault elements and fault locator.
Similar to other modern digital distance relays, Relay B has logic to prevent
incorrect trip in case of current reversals, weak infeed conditions at one terminal, breaker
open at one terminal, switch onto fault, load encroachment, VT fuse failure and power
swing.
In its two I/O board version, Relay B provides 16 contacts inputs and 32 contact
outputs. The contact inputs can be assigned for control functions, monitoring logic and
general indication. Except for a dedicated alarm output, each contact output is
independently programmable.
The relay has six independent setting groups providing possibility to set the same
relay for different operating conditions such as line configuration changes, source
changes, etc.
The relay has three serial communication ports for local or remote access to relay
settings, metering and fault data.
Protective relay C: overcurrent/ground fault relay
Relay C is a microprocessor-based relay designed for feeder control, monitoring
and protection. This relay provides 2 phase, neutral, ground and negative sequence,
instantaneous and time overcurrent protection.
Overvoltage and undervoltage protection, overfrequency and underfrequency
protection, breaker failure protection, directional current supervision, fault diagnostics,
RTU, and programmable logic functions are provided. The time overcurrent function has
multiple curve shapes for optimum coordination. Automatic reclosing, synchrocheck,
and line fault locator features are also provided. Voltage, current, and power metering is
built into the relay as a standard feature.
The relay has 48 programmable leds plus fixed trip and alarm led. It has 8 user
definable displays, event recorder with capacity of 1024 events, data logger and single
ended fault locator. A faceplate RS232 port may be used to connect to a PC for the

70
programming of settings and the monitoring of actual values. A variety of
communications modules are available.
Protective relay D: overcurrent/ground fault relay
Relay D is a microprocessor based protection, control, metering and monitoring
system. Standard features include three phase and ground instantaneous and time
overcurrent function, metering, sequence of event reporting, breaker failure logic,
recloser and user-configurable logic. Additional features include negative sequence
instantaneous and time overcurrent functions, a phase directional function, a negative
sequence directional function, under and over voltage, under and over frequency and
fault location. Eight separate groups of relay settings are provided.
Configurable logic approach is implemented using custom application software
package. It allows the user to program output contacts using digital inputs, internally
generated protection flags, timers and latches. User interaction is provided at three
levels: leds on the front of the device, keypad/display module and external PC. PC
connection is established through three RS 232 ports.
The eight digital inputs and eight digital outputs are not hardwired to any
function within the relay. The effect of each input and driver for each output is
determined by a software definition, which is a part of each setting group.
Setting principles of distance relays A and B
Distance relays A and B are set to cover 80% of protected line in Zone 1 in
forward direction, 100% of protected line and 20% of the adjacent line in Zone 2 in
forward direction, and 20% of the adjacent line in Zone 3 in reverse direction. In case
there are several adjacent lines to chose from to set Zone 2 and Zone 3, the line is
selected arbitrarily. Time setting of Zone 1 is instantaneous, Zone 2 is set to operate after
300 ms and Zone 3 is set to operate after 600 ms.
Relay settings are based on impedances of transmission lines and guidelines from
relay manuals. Settings are not compensated to take into account the influence of
infeeds. Different strategies to calculate and determine settings of protective relays were

71
not subject of this research. Primary goal is to test selectivity and average tripping time
for given settings.
Setting principles of directional overcurrent/ground fault relays C and D
Directional overcurrent/ground fault relays are set to operate for faults in forward
direction and block for reverse faults. They are set to operate instantaneously, with
definite time operating characteristic. Current pickup setting applied is 2 times the
nominal current of the CT secondary. Thus, the current pickup setting is 10 A.
Selectivity and average tripping time is observed in transient tests.
Relay Testing Scenarios and Results
This section gives a summary of the results and conclusions obtained with new
methodology in transient testing. Examples of the results obtained in testing of Relays A,
B, C and D are given. Testing environment, cases, procedures and scenarios were
applied in accordance with descriptions and explanations given in Chapter IV. Some
practical applications are presented and discussed in this section.
Fault scenarios In the first stage, all relays are tested for standard faults: AG, BC, BCG, ABC
and ABCG. Network model used in testing for standard faults is Model 1 created in
Package 1. Assumed location of protective relays is Sky end of Sky-STP transmission
line. One set of tests is conducted with fault impedance equal to zero and another set of
tests is conducted with 10 Ω fault resistance. Each test case is repeated 15 times with
different fault inception times in 4ms intervals, to cover one full period of fault inception
angles and with 3 repetitive tests for each angle. Selectivity of protective relays and
average tripping time are checked. For distance protection relays, fault locations are
selected to test if zone reaches are appropriate. For directional overcurrent relays, less
number of fault locations is used then with distance relays, because with directional
overcurrent relays it is only checked if correct type of fault is detected in correct
direction, and if the entire line is covered with directional overcurrent protection.
In the second stage, relays are tested with special faults: fault when parallel line
is out of service, switching on-to fault, fault with weak infeed, fault in reverse direction,
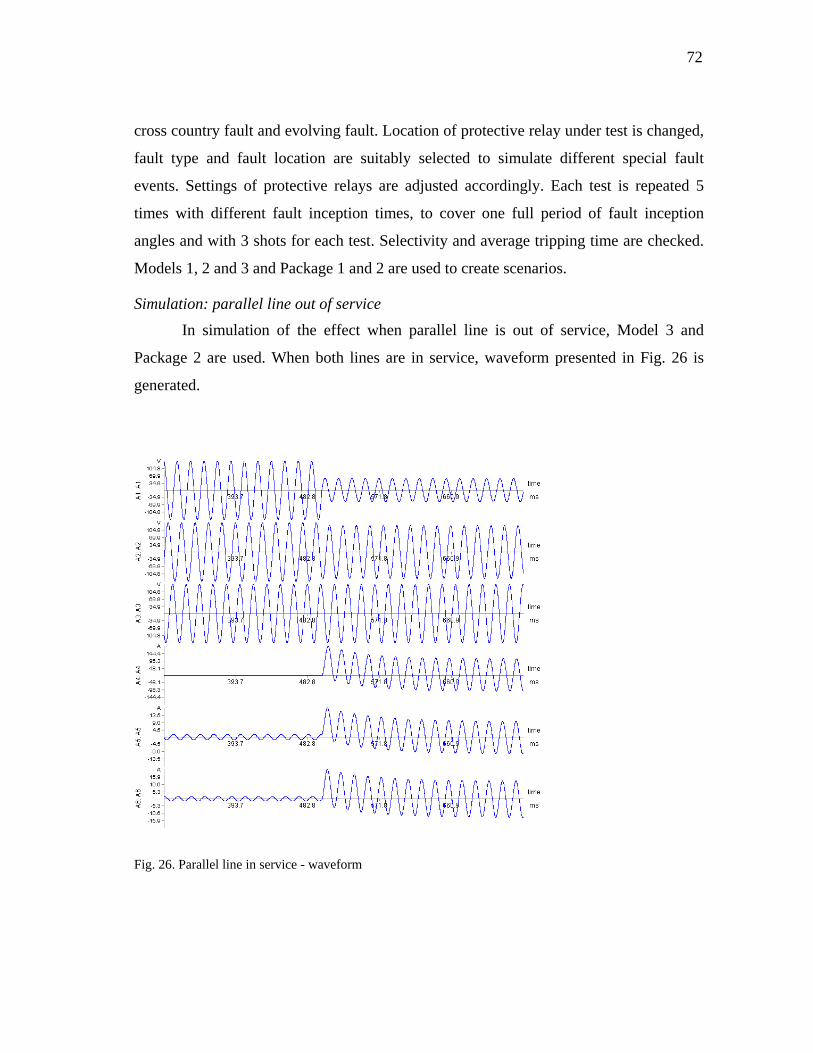
72
cross country fault and evolving fault. Location of protective relay under test is changed,
fault type and fault location are suitably selected to simulate different special fault
events. Settings of protective relays are adjusted accordingly. Each test is repeated 5
times with different fault inception times, to cover one full period of fault inception
angles and with 3 shots for each test. Selectivity and average tripping time are checked.
Models 1, 2 and 3 and Package 1 and 2 are used to create scenarios.
Simulation: parallel line out of service
In simulation of the effect when parallel line is out of service, Model 3 and
Package 2 are used. When both lines are in service, waveform presented in Fig. 26 is
generated.
Fig. 26. Parallel line in service - waveform

73
Relay is located on Glen Canyon – Flagstaff line at Glen Canyon end. Fault AG
is simulated at 75% of the line. Five tests are repeated for different fault inception
angles.
After one line from Glen Canyon to Flagstaff is taken out of service and
grounded, due to the effect of mutual coupling zero impedance of the remaining line is
reduced. If AG fault occurs at the remaining line, at the same fault location i.e. 75% of
the line, impedance measured at Glen Canyon is reduced and distance relay tends to
overreach. Example waveform is given in Fig. 27
Fig. 27. Parallel line out of service - waveform
Simulation: switching on-to fault
Switching on-to fault is simulated using Model 2 and Package 2. Relay is located
on Nbelt – King line at Nbelt end. Classical situation when switching on-to fault feature
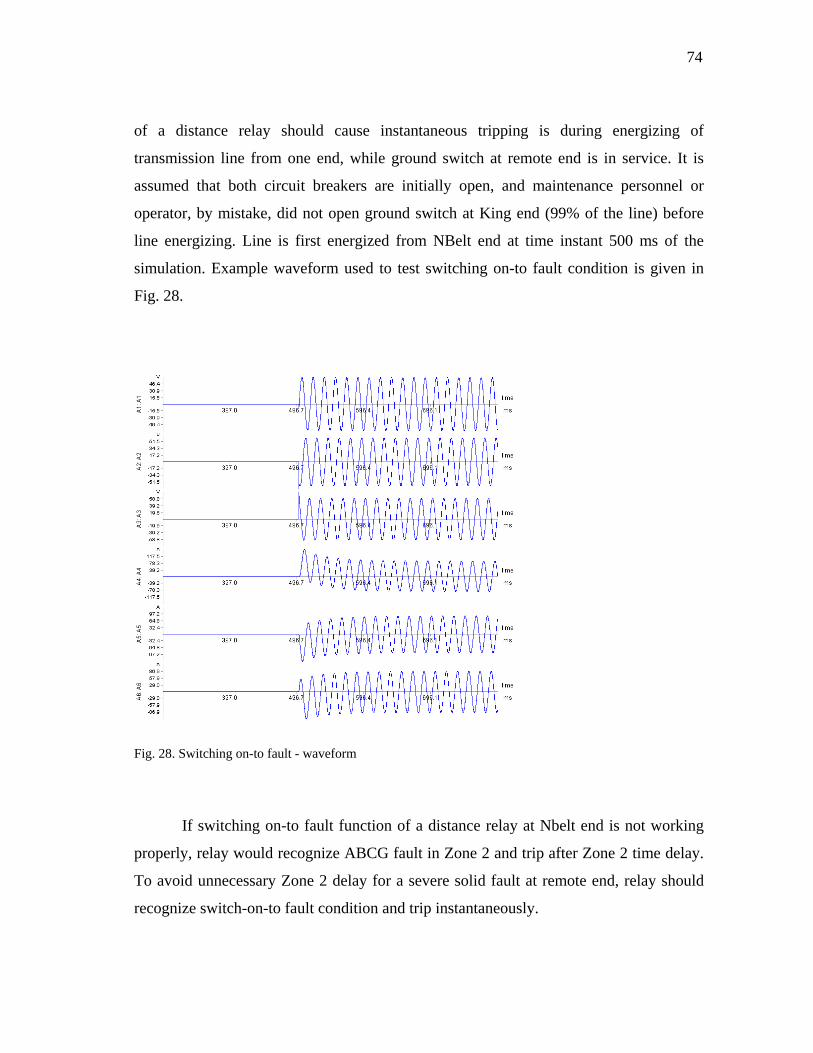
74
of a distance relay should cause instantaneous tripping is during energizing of
transmission line from one end, while ground switch at remote end is in service. It is
assumed that both circuit breakers are initially open, and maintenance personnel or
operator, by mistake, did not open ground switch at King end (99% of the line) before
line energizing. Line is first energized from NBelt end at time instant 500 ms of the
simulation. Example waveform used to test switching on-to fault condition is given in
Fig. 28.
Fig. 28. Switching on-to fault - waveform
If switching on-to fault function of a distance relay at Nbelt end is not working
properly, relay would recognize ABCG fault in Zone 2 and trip after Zone 2 time delay.
To avoid unnecessary Zone 2 delay for a severe solid fault at remote end, relay should
recognize switch-on-to fault condition and trip instantaneously.
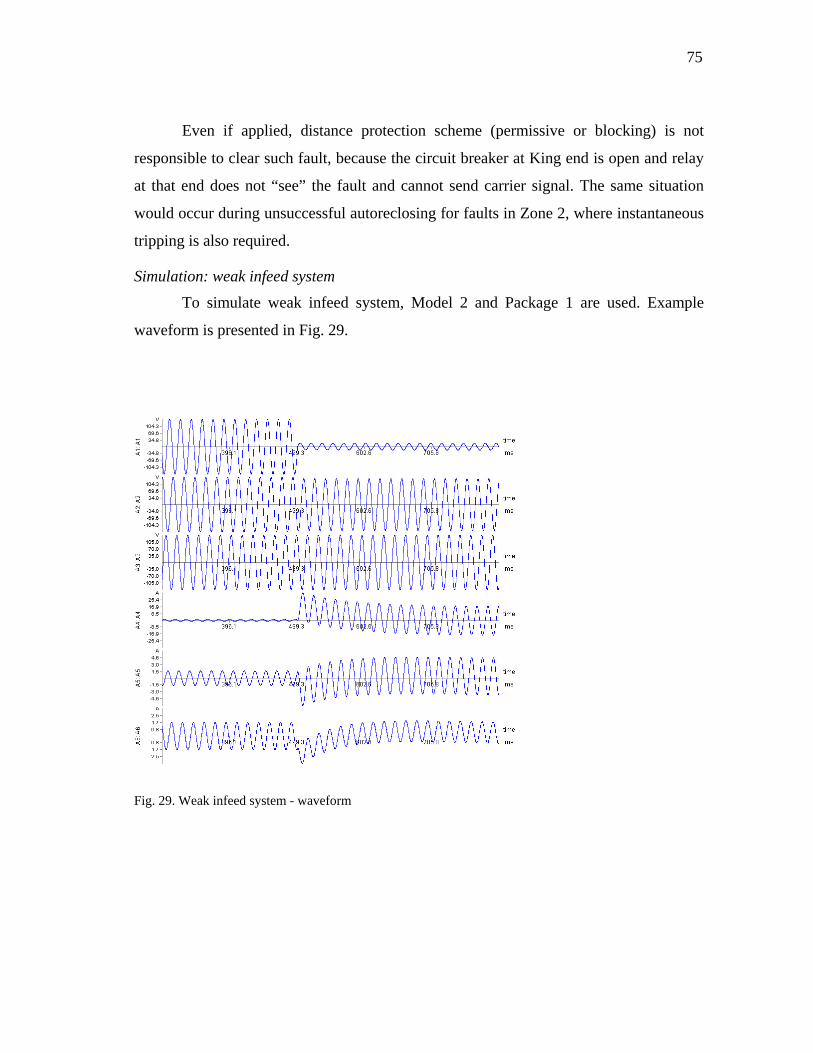
75
Even if applied, distance protection scheme (permissive or blocking) is not
responsible to clear such fault, because the circuit breaker at King end is open and relay
at that end does not “see” the fault and cannot send carrier signal. The same situation
would occur during unsuccessful autoreclosing for faults in Zone 2, where instantaneous
tripping is also required.
Simulation: weak infeed system
To simulate weak infeed system, Model 2 and Package 1 are used. Example
waveform is presented in Fig. 29.
Fig. 29. Weak infeed system - waveform
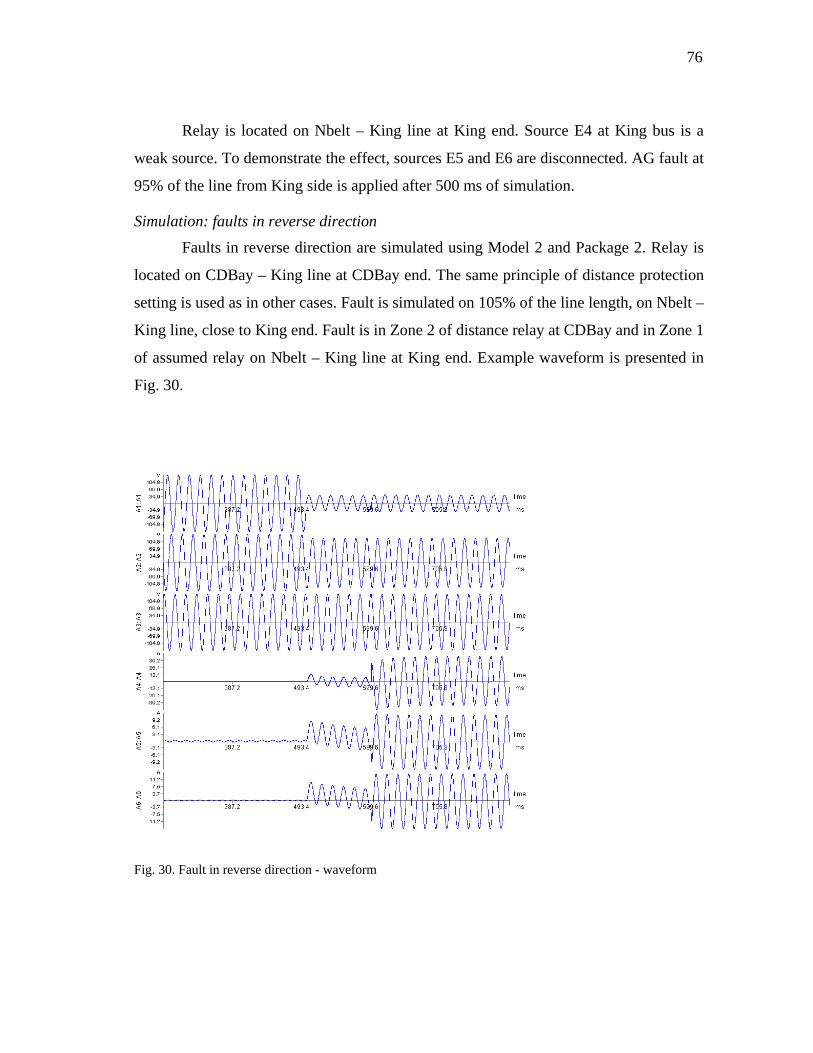
76
Relay is located on Nbelt – King line at King end. Source E4 at King bus is a
weak source. To demonstrate the effect, sources E5 and E6 are disconnected. AG fault at
95% of the line from King side is applied after 500 ms of simulation.
Simulation: faults in reverse direction
Faults in reverse direction are simulated using Model 2 and Package 2. Relay is
located on CDBay – King line at CDBay end. The same principle of distance protection
setting is used as in other cases. Fault is simulated on 105% of the line length, on Nbelt –
King line, close to King end. Fault is in Zone 2 of distance relay at CDBay and in Zone 1
of assumed relay on Nbelt – King line at King end. Example waveform is presented in
Fig. 30.
Fig. 30. Fault in reverse direction - waveform
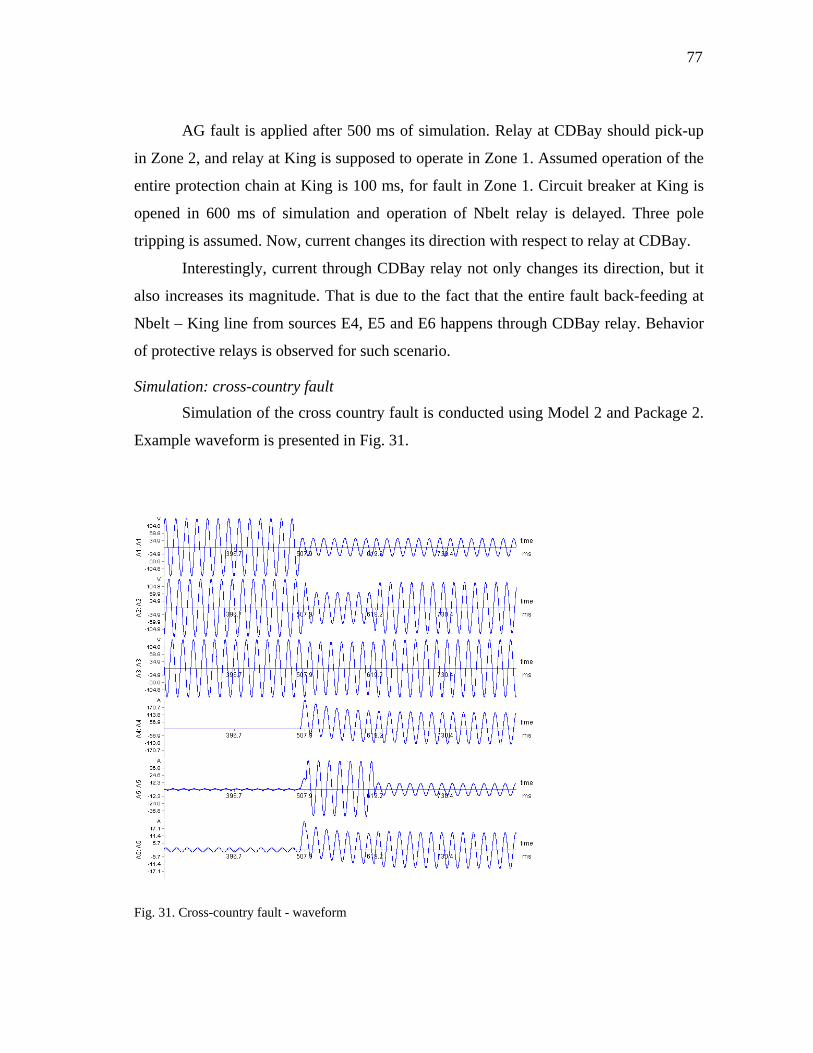
77
AG fault is applied after 500 ms of simulation. Relay at CDBay should pick-up
in Zone 2, and relay at King is supposed to operate in Zone 1. Assumed operation of the
entire protection chain at King is 100 ms, for fault in Zone 1. Circuit breaker at King is
opened in 600 ms of simulation and operation of Nbelt relay is delayed. Three pole
tripping is assumed. Now, current changes its direction with respect to relay at CDBay.
Interestingly, current through CDBay relay not only changes its direction, but it
also increases its magnitude. That is due to the fact that the entire fault back-feeding at
Nbelt – King line from sources E4, E5 and E6 happens through CDBay relay. Behavior
of protective relays is observed for such scenario.
Simulation: cross-country fault
Simulation of the cross country fault is conducted using Model 2 and Package 2.
Example waveform is presented in Fig. 31.
Fig. 31. Cross-country fault - waveform
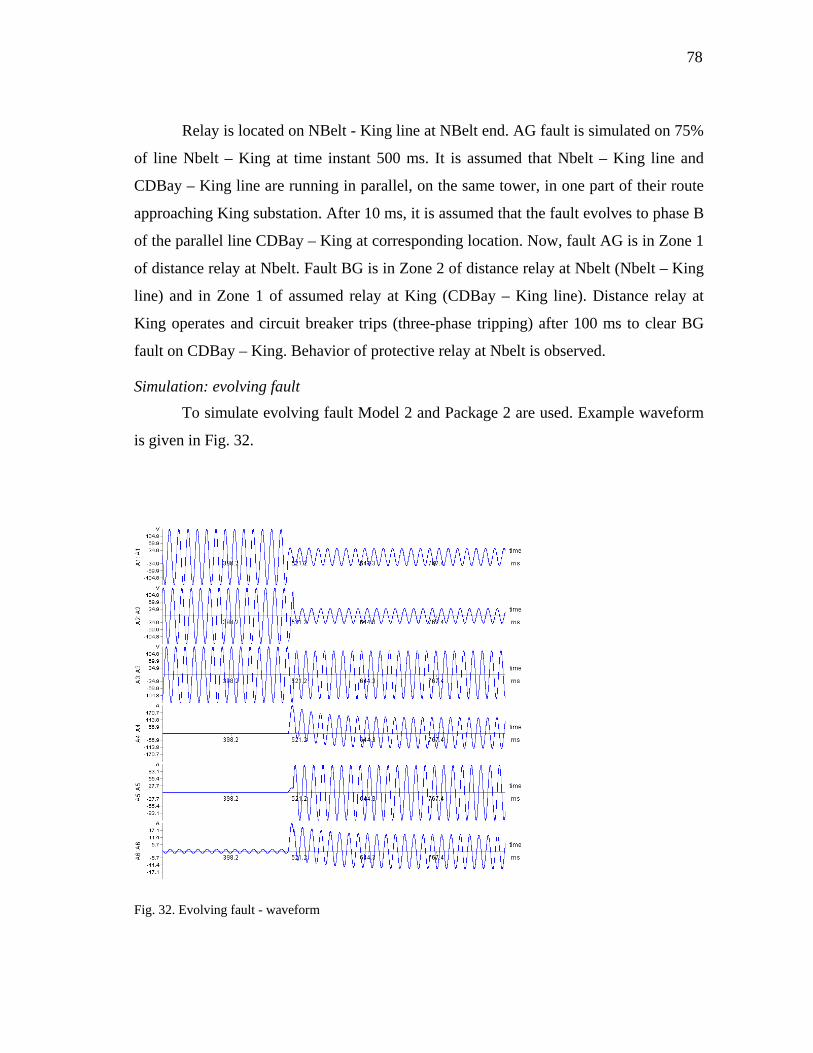
78
Relay is located on NBelt - King line at NBelt end. AG fault is simulated on 75%
of line Nbelt – King at time instant 500 ms. It is assumed that Nbelt – King line and
CDBay – King line are running in parallel, on the same tower, in one part of their route
approaching King substation. After 10 ms, it is assumed that the fault evolves to phase B
of the parallel line CDBay – King at corresponding location. Now, fault AG is in Zone 1
of distance relay at Nbelt. Fault BG is in Zone 2 of distance relay at Nbelt (Nbelt – King
line) and in Zone 1 of assumed relay at King (CDBay – King line). Distance relay at
King operates and circuit breaker trips (three-phase tripping) after 100 ms to clear BG
fault on CDBay – King. Behavior of protective relay at Nbelt is observed.
Simulation: evolving fault
To simulate evolving fault Model 2 and Package 2 are used. Example waveform
is given in Fig. 32.
Fig. 32. Evolving fault - waveform

79
Fault is simulated at 50% of line Nbelt – King. The relay is located at Nbelt end.
At time instant 500 ms, AG fault is applied. After 10 ms, fault evolves to phase B.
Operation of protective relay is observed. As in all other cases, 15 tests are performed
for different fault inception angles.
Transient testing of the distance relay: Relay A Results of transient testing for standard faults are given in Tables IV, V, VI, VII
and VIII for different fault types. Table IX presents the results for special faults. Shaded
fields represent situations when protective relay did not operate as expected. Average
operating times are rounded to 1 ms precision.
Table IV. Relay A – AG fault
AG Fault
Network: Model 1 Fault Location Line Sky-Stp Sky-Stp Sky-Stp Sky-Stp Stp-Wap
Fault Location 5% 50% 75% 95% 5% Fault Direction Forward Forward Forward Forward Forward
Expected Operation Z 1 Z 1 Z 1 Z 2 Z 2 Actual Operation Z 1 Z 1 Z 1 Z 2 Z 2
Actual Operation (R) Z 1 Z 1 Z 1 Z 2 Z 2 Expected Op. Time Inst. Inst. Inst. 300 ms 300 ms Average Op. Time 24 ms 24 ms 28 ms 302 ms 302 ms
Average Op. Time (R) 25 ms 24 ms 29 ms 302 ms 301 ms Detected Fault Type AG AG AG AG AG
AG Fault (continued) Network: Model 1 Fault Location
Line Stp-Wap Stp-Wap Sky-Spruce Sky-Spruce Sky-Spruce Fault Location 15% 25% 5% 15% 25% Fault Direction Forward Forward Reverse Reverse Reverse
Expected Operation Z 2 No Z 3 Z 3 No Actual Operation No No Z 3 Z 3 No
Actual Operation (R) No No Z 3 Z 3 No Expected Op. Time 300 ms No 600 ms 600 ms No Average Op. Time No No 600 ms 601 ms No
Average Op. Time (R) No No 601 ms 601 ms No Detected Fault Type No No AG AG No
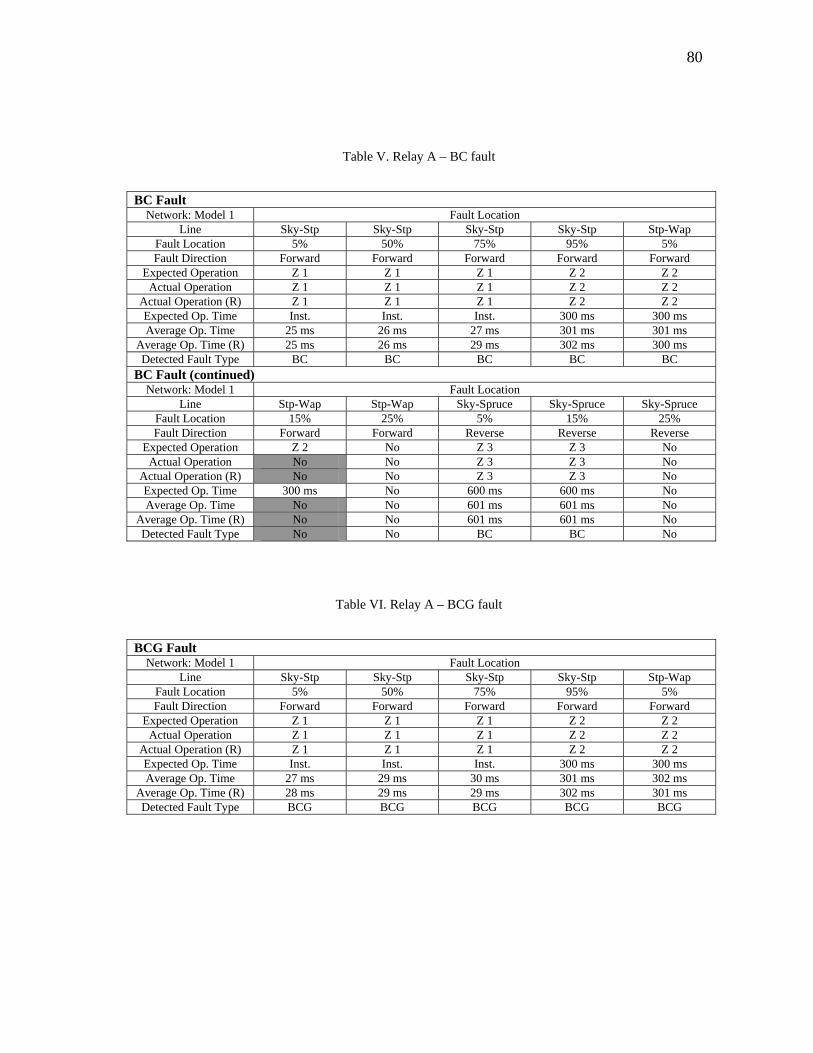
80
Table V. Relay A – BC fault
BC Fault
Network: Model 1 Fault Location Line Sky-Stp Sky-Stp Sky-Stp Sky-Stp Stp-Wap
Fault Location 5% 50% 75% 95% 5% Fault Direction Forward Forward Forward Forward Forward
Expected Operation Z 1 Z 1 Z 1 Z 2 Z 2 Actual Operation Z 1 Z 1 Z 1 Z 2 Z 2
Actual Operation (R) Z 1 Z 1 Z 1 Z 2 Z 2 Expected Op. Time Inst. Inst. Inst. 300 ms 300 ms Average Op. Time 25 ms 26 ms 27 ms 301 ms 301 ms
Average Op. Time (R) 25 ms 26 ms 29 ms 302 ms 300 ms Detected Fault Type BC BC BC BC BC
BC Fault (continued) Network: Model 1 Fault Location
Line Stp-Wap Stp-Wap Sky-Spruce Sky-Spruce Sky-Spruce Fault Location 15% 25% 5% 15% 25% Fault Direction Forward Forward Reverse Reverse Reverse
Expected Operation Z 2 No Z 3 Z 3 No Actual Operation No No Z 3 Z 3 No
Actual Operation (R) No No Z 3 Z 3 No Expected Op. Time 300 ms No 600 ms 600 ms No Average Op. Time No No 601 ms 601 ms No
Average Op. Time (R) No No 601 ms 601 ms No Detected Fault Type No No BC BC No
Table VI. Relay A – BCG fault
BCG Fault
Network: Model 1 Fault Location Line Sky-Stp Sky-Stp Sky-Stp Sky-Stp Stp-Wap
Fault Location 5% 50% 75% 95% 5% Fault Direction Forward Forward Forward Forward Forward
Expected Operation Z 1 Z 1 Z 1 Z 2 Z 2 Actual Operation Z 1 Z 1 Z 1 Z 2 Z 2
Actual Operation (R) Z 1 Z 1 Z 1 Z 2 Z 2 Expected Op. Time Inst. Inst. Inst. 300 ms 300 ms Average Op. Time 27 ms 29 ms 30 ms 301 ms 302 ms
Average Op. Time (R) 28 ms 29 ms 29 ms 302 ms 301 ms Detected Fault Type BCG BCG BCG BCG BCG
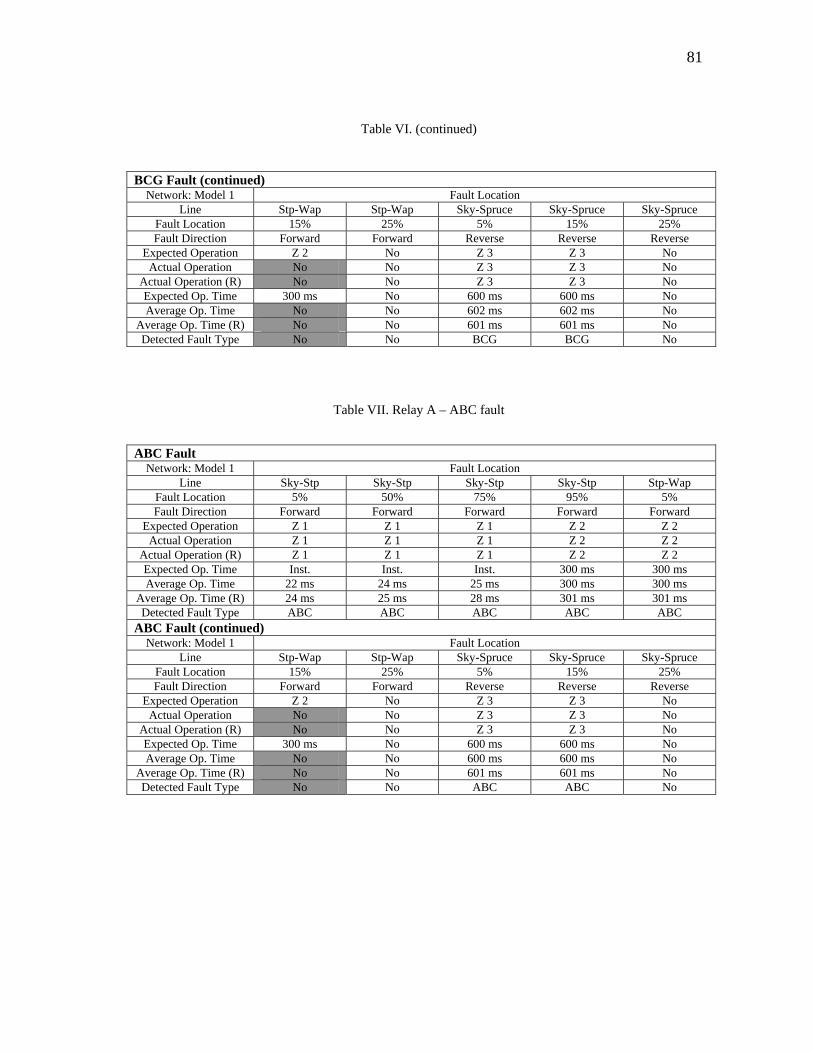
81
Table VI. (continued)
BCG Fault (continued)
Network: Model 1 Fault Location Line Stp-Wap Stp-Wap Sky-Spruce Sky-Spruce Sky-Spruce
Fault Location 15% 25% 5% 15% 25% Fault Direction Forward Forward Reverse Reverse Reverse
Expected Operation Z 2 No Z 3 Z 3 No Actual Operation No No Z 3 Z 3 No
Actual Operation (R) No No Z 3 Z 3 No Expected Op. Time 300 ms No 600 ms 600 ms No Average Op. Time No No 602 ms 602 ms No
Average Op. Time (R) No No 601 ms 601 ms No Detected Fault Type No No BCG BCG No
Table VII. Relay A – ABC fault
ABC Fault
Network: Model 1 Fault Location Line Sky-Stp Sky-Stp Sky-Stp Sky-Stp Stp-Wap
Fault Location 5% 50% 75% 95% 5% Fault Direction Forward Forward Forward Forward Forward
Expected Operation Z 1 Z 1 Z 1 Z 2 Z 2 Actual Operation Z 1 Z 1 Z 1 Z 2 Z 2
Actual Operation (R) Z 1 Z 1 Z 1 Z 2 Z 2 Expected Op. Time Inst. Inst. Inst. 300 ms 300 ms Average Op. Time 22 ms 24 ms 25 ms 300 ms 300 ms
Average Op. Time (R) 24 ms 25 ms 28 ms 301 ms 301 ms Detected Fault Type ABC ABC ABC ABC ABC
ABC Fault (continued) Network: Model 1 Fault Location
Line Stp-Wap Stp-Wap Sky-Spruce Sky-Spruce Sky-Spruce Fault Location 15% 25% 5% 15% 25% Fault Direction Forward Forward Reverse Reverse Reverse
Expected Operation Z 2 No Z 3 Z 3 No Actual Operation No No Z 3 Z 3 No
Actual Operation (R) No No Z 3 Z 3 No Expected Op. Time 300 ms No 600 ms 600 ms No Average Op. Time No No 600 ms 600 ms No
Average Op. Time (R) No No 601 ms 601 ms No Detected Fault Type No No ABC ABC No
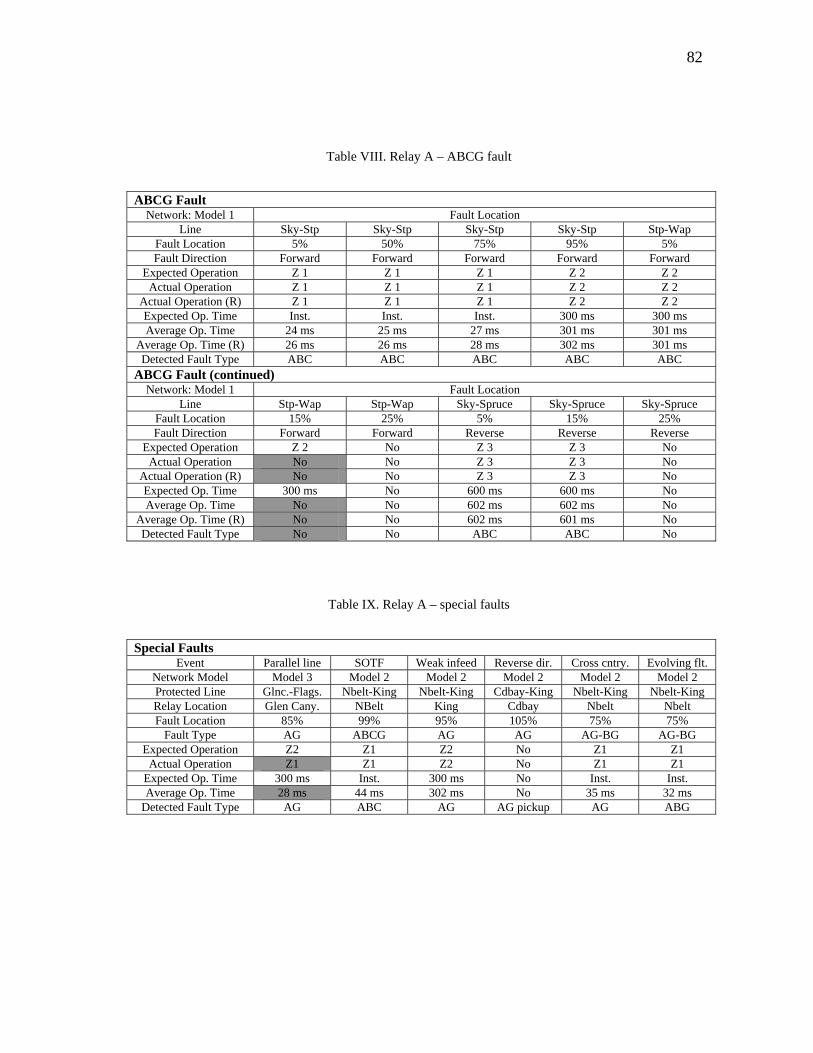
82
Table VIII. Relay A – ABCG fault
ABCG Fault
Network: Model 1 Fault Location Line Sky-Stp Sky-Stp Sky-Stp Sky-Stp Stp-Wap
Fault Location 5% 50% 75% 95% 5% Fault Direction Forward Forward Forward Forward Forward
Expected Operation Z 1 Z 1 Z 1 Z 2 Z 2 Actual Operation Z 1 Z 1 Z 1 Z 2 Z 2
Actual Operation (R) Z 1 Z 1 Z 1 Z 2 Z 2 Expected Op. Time Inst. Inst. Inst. 300 ms 300 ms Average Op. Time 24 ms 25 ms 27 ms 301 ms 301 ms
Average Op. Time (R) 26 ms 26 ms 28 ms 302 ms 301 ms Detected Fault Type ABC ABC ABC ABC ABC
ABCG Fault (continued) Network: Model 1 Fault Location
Line Stp-Wap Stp-Wap Sky-Spruce Sky-Spruce Sky-Spruce Fault Location 15% 25% 5% 15% 25% Fault Direction Forward Forward Reverse Reverse Reverse
Expected Operation Z 2 No Z 3 Z 3 No Actual Operation No No Z 3 Z 3 No
Actual Operation (R) No No Z 3 Z 3 No Expected Op. Time 300 ms No 600 ms 600 ms No Average Op. Time No No 602 ms 602 ms No
Average Op. Time (R) No No 602 ms 601 ms No Detected Fault Type No No ABC ABC No
Table IX. Relay A – special faults
Special Faults
Event Parallel line SOTF Weak infeed Reverse dir. Cross cntry. Evolving flt. Network Model Model 3 Model 2 Model 2 Model 2 Model 2 Model 2 Protected Line Glnc.-Flags. Nbelt-King Nbelt-King Cdbay-King Nbelt-King Nbelt-King Relay Location Glen Cany. NBelt King Cdbay Nbelt Nbelt Fault Location 85% 99% 95% 105% 75% 75%
Fault Type AG ABCG AG AG AG-BG AG-BG Expected Operation Z2 Z1 Z2 No Z1 Z1
Actual Operation Z1 Z1 Z2 No Z1 Z1 Expected Op. Time 300 ms Inst. 300 ms No Inst. Inst. Average Op. Time 28 ms 44 ms 302 ms No 35 ms 32 ms
Detected Fault Type AG ABC AG AG pickup AG ABG

83
Relay A operates correctly. The following can be concluded:
- Selectivity of protective relay is satisfactory
- Average tripping times were as expected for related zones
- Correct zone operation of the distance relay wasn’t achieved in case of Zone
2 faults on 15% of Stp – Wap line. Zone 2 is set to cover 20% of Stp – Wap
line, but relay did not operate. Relay tends to underreach due to heavy infeeds
from adjacent lines at bus Stp. By compensating infeeds with appropriate
relay settings, this problem can be resolved.
- Correct zone operation of the distance relay wasn’t achieved in case when
parallel line was out of service. Instead of operating in Zone 2, relay operates
in Zone 1. The relay tends to overreach. Situation as such is expected and
does not make any harm if appropriate scheme (PUTT) is applied. Relay at
Sky would trip instantaneously in any case; it would receive permissive
signal for faults on Sky – Stp line in Zone 2. To resolve overreaching effect
for faults beyond remote bus, which is more severe case, alternative setting
group should be applied to Relay A. Alternative setting group should take
into account the impedance change. Alternative setting group would be
activated by closing ground switches at parallel line, because such status of
the switching equipment indicates that parallel line is out of service and
grounded.
Transient testing of the distance relay: Relay B Results of transient testing for standard faults are given in Tables X, XI, XII, XIII
and XIV for different fault types. Table XV presents the results for special faults.
Shaded fields represent situations when protective relay did not operate as expected.
Average operating times are rounded to 1 ms precision.

84
Table X. Relay B – AG fault
AG Fault Network: Model 1 Fault Location
Line Sky-Stp Sky-Stp Sky-Stp Sky-Stp Stp-Wap Fault Location 5% 50% 75% 95% 5% Fault Direction Forward Forward Forward Forward Forward
Expected Operation Z 1 Z 1 Z 1 Z 2 Z 2 Actual Operation Z 1 Z 1 Z 1 Z 2 Z 2
Actual Operation (R) Z 1 Z 1 Z 1 Z 2 Z 2 Expected Op. Time Inst. Inst. Inst. 300 ms 300 ms Average Op. Time 25 ms 28 ms 35 ms 299 ms 300 ms
Average Op. Time (R) 25 ms 27 ms 38 ms 300 ms 301 ms Detected Fault Type AG AG BG AG AG*
AG Fault (continued) Network: Model 1 Fault Location
Line Stp-Wap Stp-Wap Sky-Spruce Sky-Spruce Sky-Spruce Fault Location 15% 25% 5% 15% 25% Fault Direction Forward Forward Reverse Reverse Reverse
Expected Operation Z 2 No Z 3 Z 3 No Actual Operation No No Z 3 Z 3 No
Actual Operation (R) No No Z 3 Z 3 No Expected Op. Time 300 ms No 600 ms 600 ms No Average Op. Time No No 600 ms 601 ms No
Average Op. Time (R) No No 600 ms 600 ms No Detected Fault Type No No AG AG No
* Relay operates correctly only for faults without R
Table XI. Relay B – BC fault
BC Fault
Network: Model 1 Fault Location Line Sky-Stp Sky-Stp Sky-Stp Sky-Stp Stp-Wap
Fault Location 5% 50% 75% 95% 5% Fault Direction Forward Forward Forward Forward Forward
Expected Operation Z 1 Z 1 Z 1 Z 2 Z 2 Actual Operation Z 1 Z 1 Z 1 Z 2 Z 2
Actual Operation (R) Z 1 Z 1 Z 1 Z 2 Z 2 Expected Op. Time Inst. Inst. Inst. 300 ms 300 ms Average Op. Time 25 ms 26 ms 27 ms 301 ms 301 ms
Average Op. Time (R) 25 ms 26 ms 29 ms 302 ms 300 ms Detected Fault Type BC BCG BC BC BG
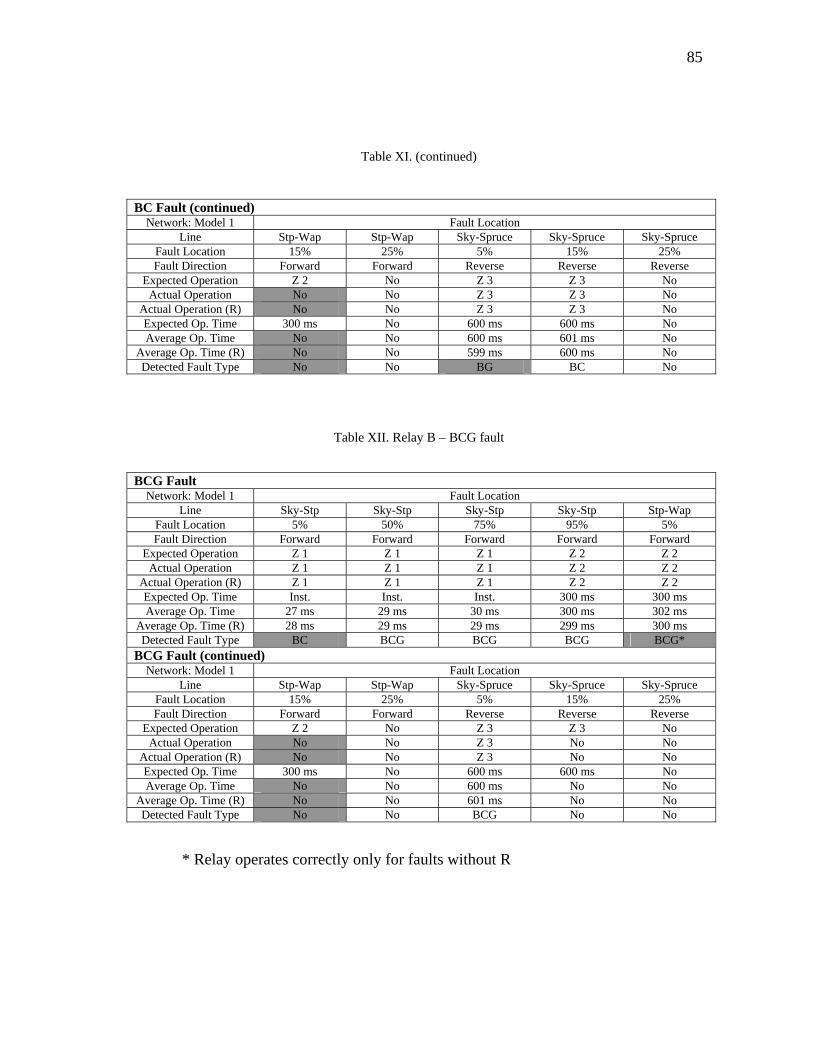
85
Table XI. (continued)
BC Fault (continued)
Network: Model 1 Fault Location Line Stp-Wap Stp-Wap Sky-Spruce Sky-Spruce Sky-Spruce
Fault Location 15% 25% 5% 15% 25% Fault Direction Forward Forward Reverse Reverse Reverse
Expected Operation Z 2 No Z 3 Z 3 No Actual Operation No No Z 3 Z 3 No
Actual Operation (R) No No Z 3 Z 3 No Expected Op. Time 300 ms No 600 ms 600 ms No Average Op. Time No No 600 ms 601 ms No
Average Op. Time (R) No No 599 ms 600 ms No Detected Fault Type No No BG BC No
Table XII. Relay B – BCG fault
BCG Fault
Network: Model 1 Fault Location Line Sky-Stp Sky-Stp Sky-Stp Sky-Stp Stp-Wap
Fault Location 5% 50% 75% 95% 5% Fault Direction Forward Forward Forward Forward Forward
Expected Operation Z 1 Z 1 Z 1 Z 2 Z 2 Actual Operation Z 1 Z 1 Z 1 Z 2 Z 2
Actual Operation (R) Z 1 Z 1 Z 1 Z 2 Z 2 Expected Op. Time Inst. Inst. Inst. 300 ms 300 ms Average Op. Time 27 ms 29 ms 30 ms 300 ms 302 ms
Average Op. Time (R) 28 ms 29 ms 29 ms 299 ms 300 ms Detected Fault Type BC BCG BCG BCG BCG*
BCG Fault (continued) Network: Model 1 Fault Location
Line Stp-Wap Stp-Wap Sky-Spruce Sky-Spruce Sky-Spruce Fault Location 15% 25% 5% 15% 25% Fault Direction Forward Forward Reverse Reverse Reverse
Expected Operation Z 2 No Z 3 Z 3 No Actual Operation No No Z 3 No No
Actual Operation (R) No No Z 3 No No Expected Op. Time 300 ms No 600 ms 600 ms No Average Op. Time No No 600 ms No No
Average Op. Time (R) No No 601 ms No No Detected Fault Type No No BCG No No
* Relay operates correctly only for faults without R
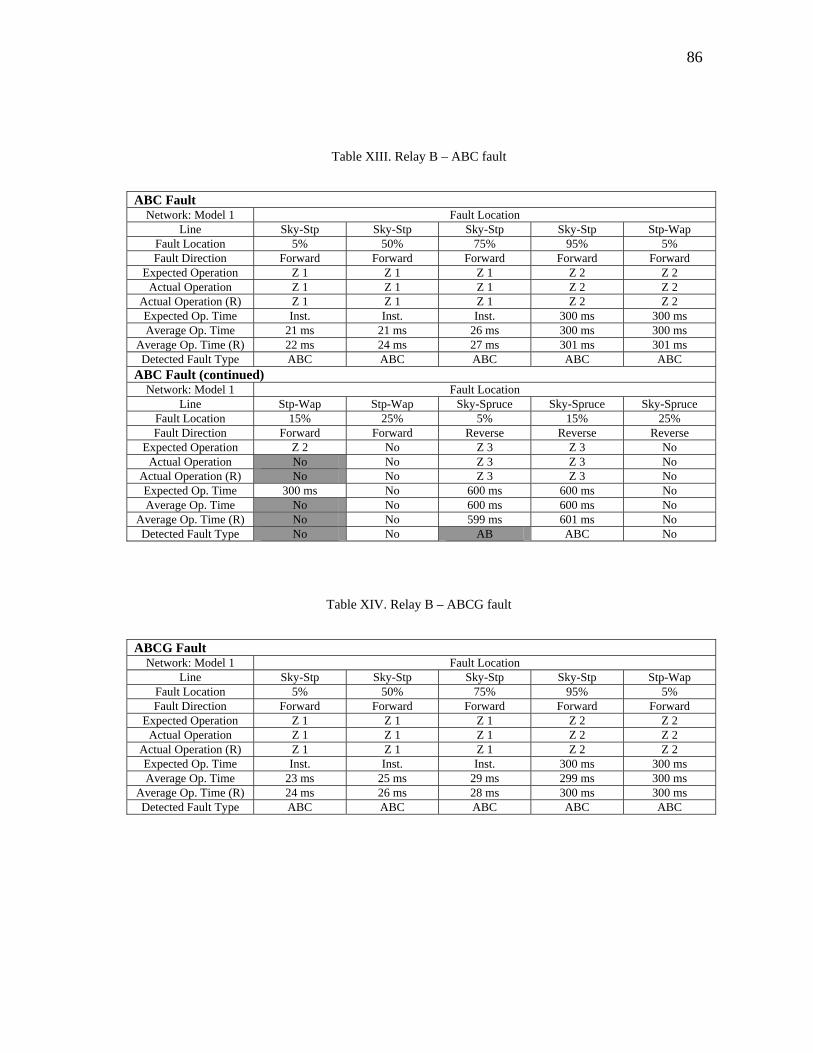
86
Table XIII. Relay B – ABC fault
ABC Fault
Network: Model 1 Fault Location Line Sky-Stp Sky-Stp Sky-Stp Sky-Stp Stp-Wap
Fault Location 5% 50% 75% 95% 5% Fault Direction Forward Forward Forward Forward Forward
Expected Operation Z 1 Z 1 Z 1 Z 2 Z 2 Actual Operation Z 1 Z 1 Z 1 Z 2 Z 2
Actual Operation (R) Z 1 Z 1 Z 1 Z 2 Z 2 Expected Op. Time Inst. Inst. Inst. 300 ms 300 ms Average Op. Time 21 ms 21 ms 26 ms 300 ms 300 ms
Average Op. Time (R) 22 ms 24 ms 27 ms 301 ms 301 ms Detected Fault Type ABC ABC ABC ABC ABC
ABC Fault (continued) Network: Model 1 Fault Location
Line Stp-Wap Stp-Wap Sky-Spruce Sky-Spruce Sky-Spruce Fault Location 15% 25% 5% 15% 25% Fault Direction Forward Forward Reverse Reverse Reverse
Expected Operation Z 2 No Z 3 Z 3 No Actual Operation No No Z 3 Z 3 No
Actual Operation (R) No No Z 3 Z 3 No Expected Op. Time 300 ms No 600 ms 600 ms No Average Op. Time No No 600 ms 600 ms No
Average Op. Time (R) No No 599 ms 601 ms No Detected Fault Type No No AB ABC No
Table XIV. Relay B – ABCG fault
ABCG Fault
Network: Model 1 Fault Location Line Sky-Stp Sky-Stp Sky-Stp Sky-Stp Stp-Wap
Fault Location 5% 50% 75% 95% 5% Fault Direction Forward Forward Forward Forward Forward
Expected Operation Z 1 Z 1 Z 1 Z 2 Z 2 Actual Operation Z 1 Z 1 Z 1 Z 2 Z 2
Actual Operation (R) Z 1 Z 1 Z 1 Z 2 Z 2 Expected Op. Time Inst. Inst. Inst. 300 ms 300 ms Average Op. Time 23 ms 25 ms 29 ms 299 ms 300 ms
Average Op. Time (R) 24 ms 26 ms 28 ms 300 ms 300 ms Detected Fault Type ABC ABC ABC ABC ABC
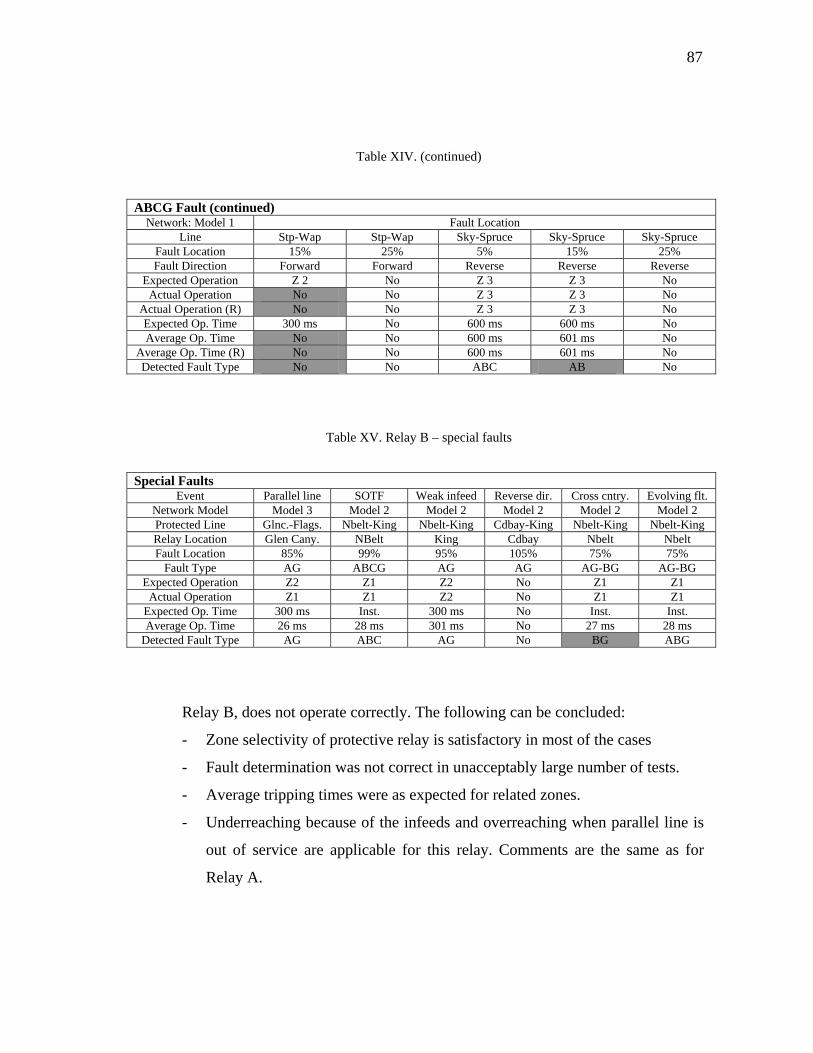
87
Table XIV. (continued)
ABCG Fault (continued)
Network: Model 1 Fault Location Line Stp-Wap Stp-Wap Sky-Spruce Sky-Spruce Sky-Spruce
Fault Location 15% 25% 5% 15% 25% Fault Direction Forward Forward Reverse Reverse Reverse
Expected Operation Z 2 No Z 3 Z 3 No Actual Operation No No Z 3 Z 3 No
Actual Operation (R) No No Z 3 Z 3 No Expected Op. Time 300 ms No 600 ms 600 ms No Average Op. Time No No 600 ms 601 ms No
Average Op. Time (R) No No 600 ms 601 ms No Detected Fault Type No No ABC AB No
Table XV. Relay B – special faults
Special Faults
Event Parallel line SOTF Weak infeed Reverse dir. Cross cntry. Evolving flt. Network Model Model 3 Model 2 Model 2 Model 2 Model 2 Model 2 Protected Line Glnc.-Flags. Nbelt-King Nbelt-King Cdbay-King Nbelt-King Nbelt-King Relay Location Glen Cany. NBelt King Cdbay Nbelt Nbelt Fault Location 85% 99% 95% 105% 75% 75%
Fault Type AG ABCG AG AG AG-BG AG-BG Expected Operation Z2 Z1 Z2 No Z1 Z1
Actual Operation Z1 Z1 Z2 No Z1 Z1 Expected Op. Time 300 ms Inst. 300 ms No Inst. Inst. Average Op. Time 26 ms 28 ms 301 ms No 27 ms 28 ms
Detected Fault Type AG ABC AG No BG ABG
Relay B, does not operate correctly. The following can be concluded:
- Zone selectivity of protective relay is satisfactory in most of the cases
- Fault determination was not correct in unacceptably large number of tests.
- Average tripping times were as expected for related zones.
- Underreaching because of the infeeds and overreaching when parallel line is
out of service are applicable for this relay. Comments are the same as for
Relay A.
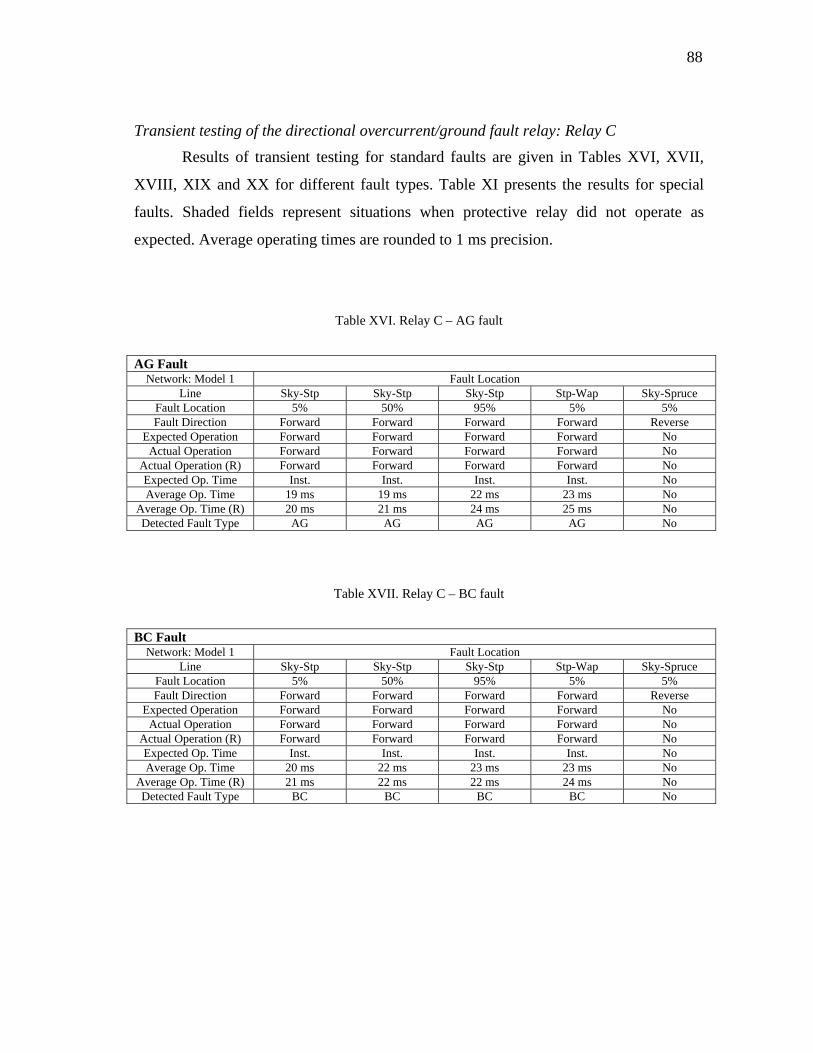
88
Transient testing of the directional overcurrent/ground fault relay: Relay C Results of transient testing for standard faults are given in Tables XVI, XVII,
XVIII, XIX and XX for different fault types. Table XI presents the results for special
faults. Shaded fields represent situations when protective relay did not operate as
expected. Average operating times are rounded to 1 ms precision.
Table XVI. Relay C – AG fault
AG Fault
Network: Model 1 Fault Location Line Sky-Stp Sky-Stp Sky-Stp Stp-Wap Sky-Spruce
Fault Location 5% 50% 95% 5% 5% Fault Direction Forward Forward Forward Forward Reverse
Expected Operation Forward Forward Forward Forward No Actual Operation Forward Forward Forward Forward No
Actual Operation (R) Forward Forward Forward Forward No Expected Op. Time Inst. Inst. Inst. Inst. No Average Op. Time 19 ms 19 ms 22 ms 23 ms No
Average Op. Time (R) 20 ms 21 ms 24 ms 25 ms No Detected Fault Type AG AG AG AG No
Table XVII. Relay C – BC fault
BC Fault
Network: Model 1 Fault Location Line Sky-Stp Sky-Stp Sky-Stp Stp-Wap Sky-Spruce
Fault Location 5% 50% 95% 5% 5% Fault Direction Forward Forward Forward Forward Reverse
Expected Operation Forward Forward Forward Forward No Actual Operation Forward Forward Forward Forward No
Actual Operation (R) Forward Forward Forward Forward No Expected Op. Time Inst. Inst. Inst. Inst. No Average Op. Time 20 ms 22 ms 23 ms 23 ms No
Average Op. Time (R) 21 ms 22 ms 22 ms 24 ms No Detected Fault Type BC BC BC BC No
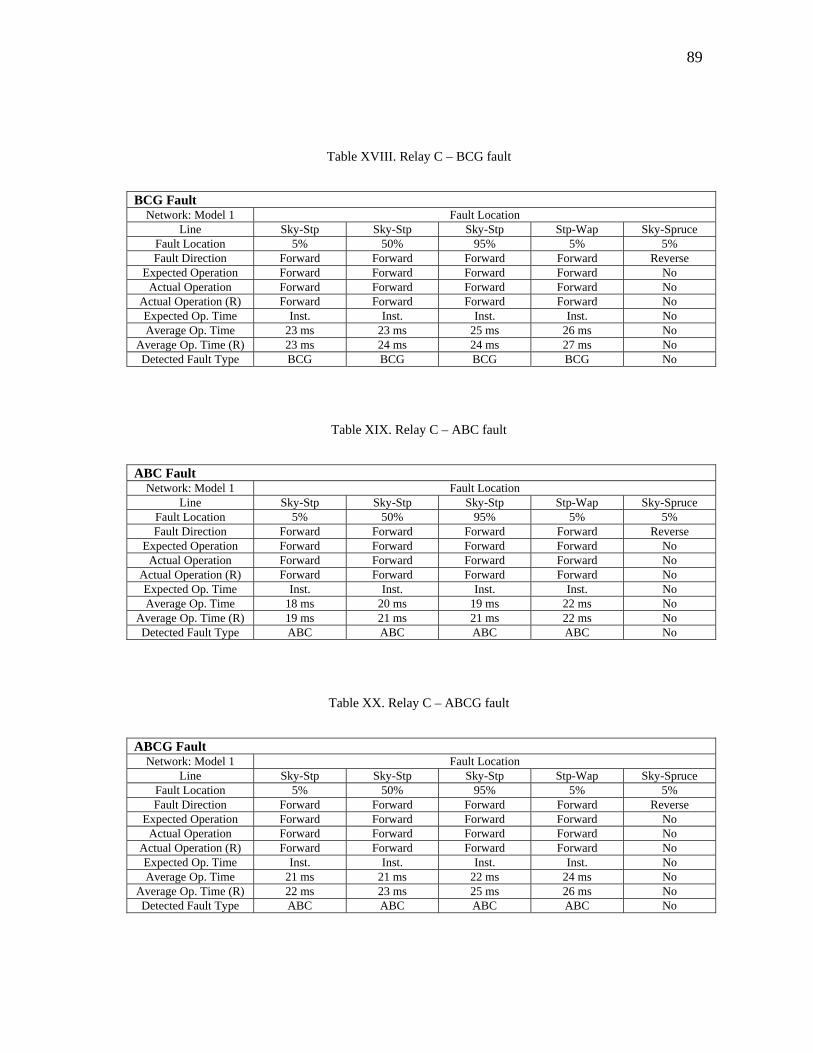
89
Table XVIII. Relay C – BCG fault
BCG Fault
Network: Model 1 Fault Location Line Sky-Stp Sky-Stp Sky-Stp Stp-Wap Sky-Spruce
Fault Location 5% 50% 95% 5% 5% Fault Direction Forward Forward Forward Forward Reverse
Expected Operation Forward Forward Forward Forward No Actual Operation Forward Forward Forward Forward No
Actual Operation (R) Forward Forward Forward Forward No Expected Op. Time Inst. Inst. Inst. Inst. No Average Op. Time 23 ms 23 ms 25 ms 26 ms No
Average Op. Time (R) 23 ms 24 ms 24 ms 27 ms No Detected Fault Type BCG BCG BCG BCG No
Table XIX. Relay C – ABC fault
ABC Fault
Network: Model 1 Fault Location Line Sky-Stp Sky-Stp Sky-Stp Stp-Wap Sky-Spruce
Fault Location 5% 50% 95% 5% 5% Fault Direction Forward Forward Forward Forward Reverse
Expected Operation Forward Forward Forward Forward No Actual Operation Forward Forward Forward Forward No
Actual Operation (R) Forward Forward Forward Forward No Expected Op. Time Inst. Inst. Inst. Inst. No Average Op. Time 18 ms 20 ms 19 ms 22 ms No
Average Op. Time (R) 19 ms 21 ms 21 ms 22 ms No Detected Fault Type ABC ABC ABC ABC No
Table XX. Relay C – ABCG fault
ABCG Fault
Network: Model 1 Fault Location Line Sky-Stp Sky-Stp Sky-Stp Stp-Wap Sky-Spruce
Fault Location 5% 50% 95% 5% 5% Fault Direction Forward Forward Forward Forward Reverse
Expected Operation Forward Forward Forward Forward No Actual Operation Forward Forward Forward Forward No
Actual Operation (R) Forward Forward Forward Forward No Expected Op. Time Inst. Inst. Inst. Inst. No Average Op. Time 21 ms 21 ms 22 ms 24 ms No
Average Op. Time (R) 22 ms 23 ms 25 ms 26 ms No Detected Fault Type ABC ABC ABC ABC No
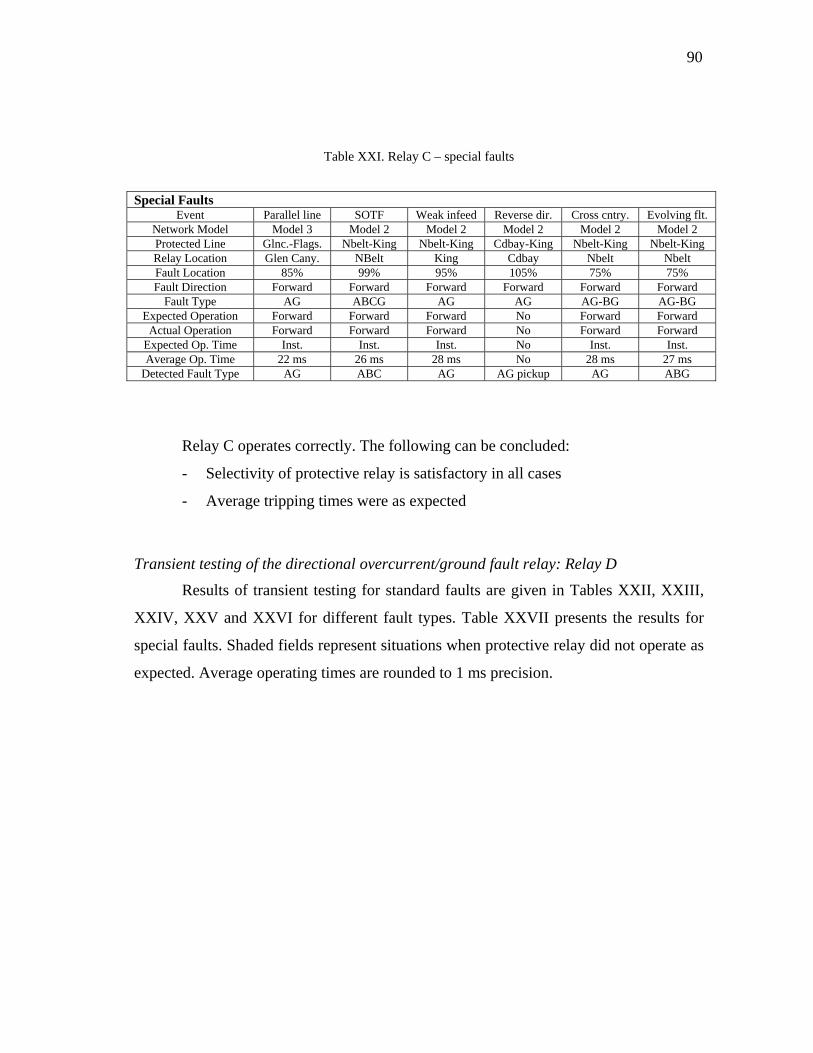
90
Table XXI. Relay C – special faults
Special Faults
Event Parallel line SOTF Weak infeed Reverse dir. Cross cntry. Evolving flt. Network Model Model 3 Model 2 Model 2 Model 2 Model 2 Model 2 Protected Line Glnc.-Flags. Nbelt-King Nbelt-King Cdbay-King Nbelt-King Nbelt-King Relay Location Glen Cany. NBelt King Cdbay Nbelt Nbelt Fault Location 85% 99% 95% 105% 75% 75% Fault Direction Forward Forward Forward Forward Forward Forward
Fault Type AG ABCG AG AG AG-BG AG-BG Expected Operation Forward Forward Forward No Forward Forward
Actual Operation Forward Forward Forward No Forward Forward Expected Op. Time Inst. Inst. Inst. No Inst. Inst. Average Op. Time 22 ms 26 ms 28 ms No 28 ms 27 ms
Detected Fault Type AG ABC AG AG pickup AG ABG
Relay C operates correctly. The following can be concluded:
- Selectivity of protective relay is satisfactory in all cases
- Average tripping times were as expected
Transient testing of the directional overcurrent/ground fault relay: Relay D Results of transient testing for standard faults are given in Tables XXII, XXIII,
XXIV, XXV and XXVI for different fault types. Table XXVII presents the results for
special faults. Shaded fields represent situations when protective relay did not operate as
expected. Average operating times are rounded to 1 ms precision.

91
Table XXII. Relay D – AG fault
AG Fault
Network: Model 1 Fault Location Line Sky-Stp Sky-Stp Sky-Stp Stp-Wap Sky-Spruce
Fault Location 5% 50% 95% 5% 5% Fault Direction Forward Forward Forward Forward Reverse
Expected Operation Forward Forward Forward Forward No Actual Operation Forward Forward Forward Forward No
Actual Operation (R) Forward Forward Forward Forward No Expected Op. Time Inst. Inst. Inst. Inst. No Average Op. Time 18 ms 20 ms 21 ms 22 ms No
Average Op. Time (R) 18 ms 21 ms 22 ms 23 ms No Detected Fault Type AG AG AG AG No
Table XXIII. Relay D – BC fault
BC Fault
Network: Model 1 Fault Location Line Sky-Stp Sky-Stp Sky-Stp Stp-Wap Sky-Spruce
Fault Location 5% 50% 95% 5% 5% Fault Direction Forward Forward Forward Forward Reverse
Expected Operation Forward Forward Forward Forward No Actual Operation Forward Forward Forward Forward No
Actual Operation (R) Forward Forward Forward Forward No Expected Op. Time Inst. Inst. Inst. Inst. No Average Op. Time 19 ms 22 ms 22 ms 24 ms No
Average Op. Time (R) 19 ms 23 ms 22 ms 25 ms No Detected Fault Type BC BC BC BC No
Table XXIV. Relay D – BCG fault
BCG Fault
Network: Model 1 Fault Location Line Sky-Stp Sky-Stp Sky-Stp Stp-Wap Sky-Spruce
Fault Location 5% 50% 95% 5% 5% Fault Direction Forward Forward Forward Forward Reverse
Expected Operation Forward Forward Forward Forward No Actual Operation Forward Forward Forward Forward No
Actual Operation (R) Forward Forward Forward Forward No Expected Op. Time Inst. Inst. Inst. Inst. No Average Op. Time 21 ms 22 ms 23 ms 22 ms No
Average Op. Time (R) 21 ms 21 ms 24 ms 24 ms No Detected Fault Type BCG BCG BCG BCG No
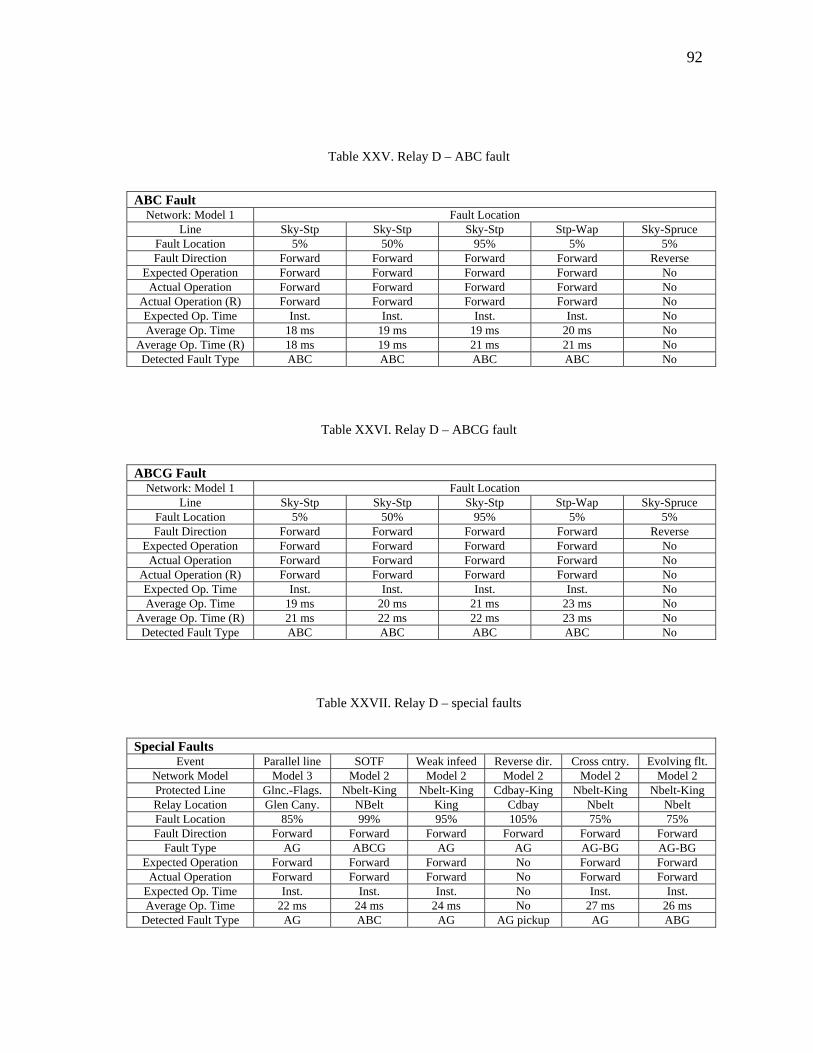
92
Table XXV. Relay D – ABC fault
ABC Fault
Network: Model 1 Fault Location Line Sky-Stp Sky-Stp Sky-Stp Stp-Wap Sky-Spruce
Fault Location 5% 50% 95% 5% 5% Fault Direction Forward Forward Forward Forward Reverse
Expected Operation Forward Forward Forward Forward No Actual Operation Forward Forward Forward Forward No
Actual Operation (R) Forward Forward Forward Forward No Expected Op. Time Inst. Inst. Inst. Inst. No Average Op. Time 18 ms 19 ms 19 ms 20 ms No
Average Op. Time (R) 18 ms 19 ms 21 ms 21 ms No Detected Fault Type ABC ABC ABC ABC No
Table XXVI. Relay D – ABCG fault
ABCG Fault
Network: Model 1 Fault Location Line Sky-Stp Sky-Stp Sky-Stp Stp-Wap Sky-Spruce
Fault Location 5% 50% 95% 5% 5% Fault Direction Forward Forward Forward Forward Reverse
Expected Operation Forward Forward Forward Forward No Actual Operation Forward Forward Forward Forward No
Actual Operation (R) Forward Forward Forward Forward No Expected Op. Time Inst. Inst. Inst. Inst. No Average Op. Time 19 ms 20 ms 21 ms 23 ms No
Average Op. Time (R) 21 ms 22 ms 22 ms 23 ms No Detected Fault Type ABC ABC ABC ABC No
Table XXVII. Relay D – special faults
Special Faults
Event Parallel line SOTF Weak infeed Reverse dir. Cross cntry. Evolving flt. Network Model Model 3 Model 2 Model 2 Model 2 Model 2 Model 2 Protected Line Glnc.-Flags. Nbelt-King Nbelt-King Cdbay-King Nbelt-King Nbelt-King Relay Location Glen Cany. NBelt King Cdbay Nbelt Nbelt Fault Location 85% 99% 95% 105% 75% 75% Fault Direction Forward Forward Forward Forward Forward Forward
Fault Type AG ABCG AG AG AG-BG AG-BG Expected Operation Forward Forward Forward No Forward Forward
Actual Operation Forward Forward Forward No Forward Forward Expected Op. Time Inst. Inst. Inst. No Inst. Inst. Average Op. Time 22 ms 24 ms 24 ms No 27 ms 26 ms
Detected Fault Type AG ABC AG AG pickup AG ABG
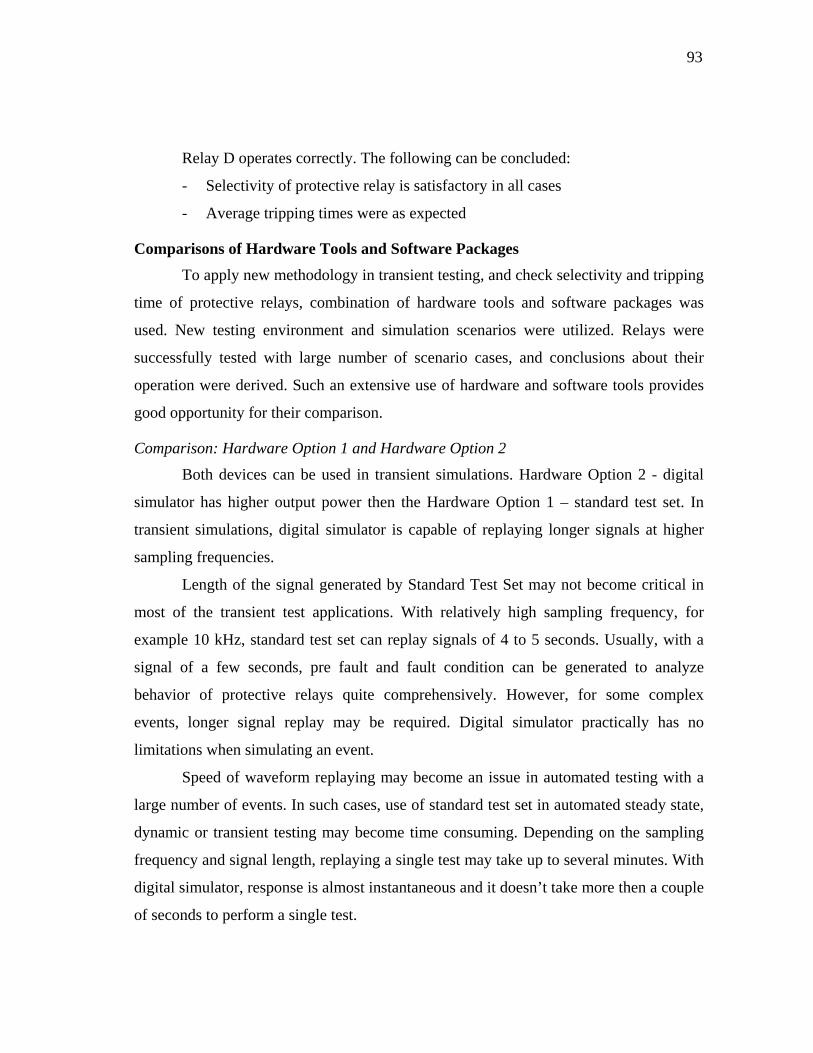
93
Relay D operates correctly. The following can be concluded:
- Selectivity of protective relay is satisfactory in all cases
- Average tripping times were as expected
Comparisons of Hardware Tools and Software Packages
To apply new methodology in transient testing, and check selectivity and tripping
time of protective relays, combination of hardware tools and software packages was
used. New testing environment and simulation scenarios were utilized. Relays were
successfully tested with large number of scenario cases, and conclusions about their
operation were derived. Such an extensive use of hardware and software tools provides
good opportunity for their comparison.
Comparison: Hardware Option 1 and Hardware Option 2
Both devices can be used in transient simulations. Hardware Option 2 - digital
simulator has higher output power then the Hardware Option 1 – standard test set. In
transient simulations, digital simulator is capable of replaying longer signals at higher
sampling frequencies.
Length of the signal generated by Standard Test Set may not become critical in
most of the transient test applications. With relatively high sampling frequency, for
example 10 kHz, standard test set can replay signals of 4 to 5 seconds. Usually, with a
signal of a few seconds, pre fault and fault condition can be generated to analyze
behavior of protective relays quite comprehensively. However, for some complex
events, longer signal replay may be required. Digital simulator practically has no
limitations when simulating an event.
Speed of waveform replaying may become an issue in automated testing with a
large number of events. In such cases, use of standard test set in automated steady state,
dynamic or transient testing may become time consuming. Depending on the sampling
frequency and signal length, replaying a single test may take up to several minutes. With
digital simulator, response is almost instantaneous and it doesn’t take more then a couple
of seconds to perform a single test.

94
For comprehensive testing of stand alone protective devices, provision for
checking digital inputs and outputs may be necessary. Digital inputs and outputs of test
cabinet are connected to digital terminals of protective relays, to test operation of
relaying schemes, alarm, control and SCADA functions. Operation can be monitored on
a protective device itself and cross-checked using PC software package such as Package
4. Standard test set provides basic set of I/O terminals for tripping signals and timers.
Digital simulator has 37 contacts for digital inputs and 37 contacts for digital outputs,
sufficient to test almost any configuration of input and output terminals applied in
protective relays.
For site testing and maintenance of protective equipment, it is convenient to use
test equipment of compact dimensions that can be easily moved inside the substation’s
control room and from one substation to another. For its compact design and single-
phase power supply, standard test set is more practical tool then digital simulator.
In conclusion, standard test set, together with Package 4 is a good tool for
performing routine test aimed at the maintenance of protective relays and
troubleshooting protective relay misoperation in the field. Various types of automated
steady state, dynamic and transient tests can be performed. On the other hand, the digital
simulator is an excellent testing tool in evaluating new protective devices as well as in
analyzing behavior of protective relays during complex events.
In summary, important characteristics of standard test set (Hardware Option 1)
and digital simulator (Hardware Option 2) and compliance to requirements are presented
in Table XXVIII.
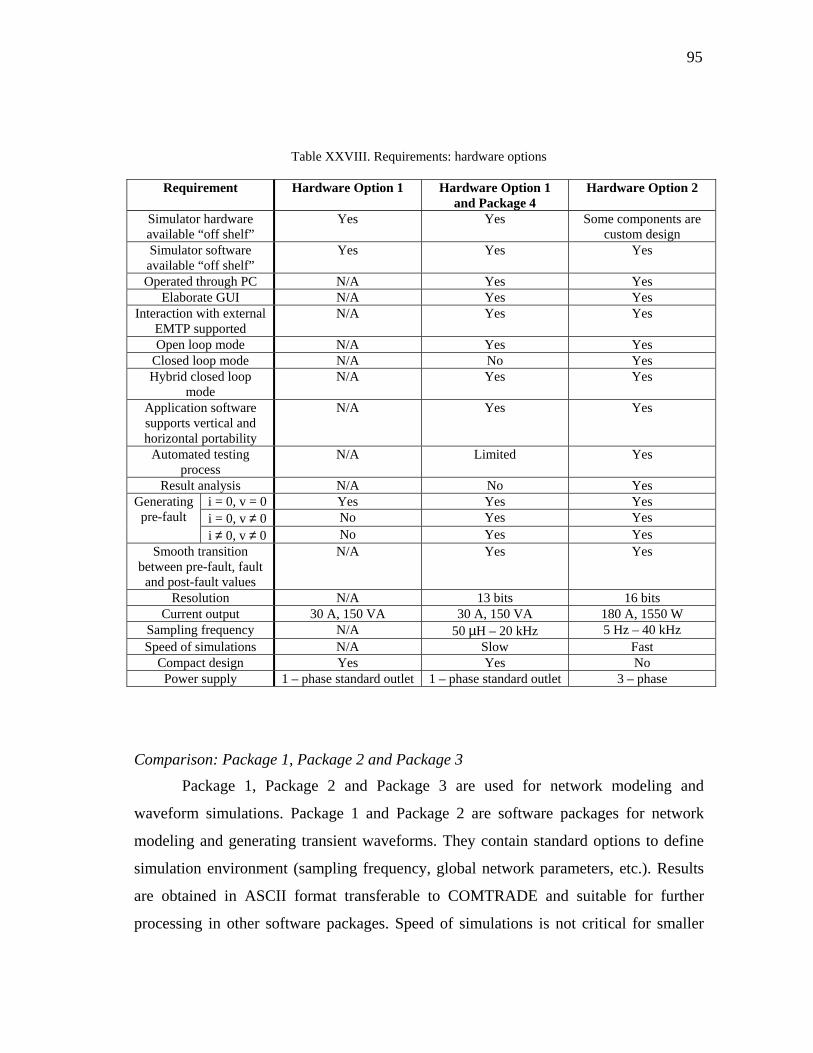
95
Table XXVIII. Requirements: hardware options
Requirement Hardware Option 1 Hardware Option 1
and Package 4 Hardware Option 2
Simulator hardware available “off shelf”
Yes Yes Some components are custom design
Simulator software available “off shelf”
Yes Yes Yes
Operated through PC N/A Yes Yes Elaborate GUI N/A Yes Yes
Interaction with external EMTP supported
N/A Yes Yes
Open loop mode N/A Yes Yes Closed loop mode N/A No Yes Hybrid closed loop
mode N/A Yes Yes
Application software supports vertical and horizontal portability
N/A Yes Yes
Automated testing process
N/A Limited Yes
Result analysis N/A No Yes i = 0, v = 0 Yes Yes Yes i = 0, v ≠ 0 No Yes Yes
Generating pre-fault
i ≠ 0, v ≠ 0 No Yes Yes Smooth transition
between pre-fault, fault and post-fault values
N/A Yes Yes
Resolution N/A 13 bits 16 bits Current output 30 A, 150 VA 30 A, 150 VA 180 A, 1550 W
Sampling frequency N/A 50 µH – 20 kHz 5 Hz – 40 kHz Speed of simulations N/A Slow Fast
Compact design Yes Yes No Power supply 1 – phase standard outlet 1 – phase standard outlet 3 – phase
Comparison: Package 1, Package 2 and Package 3
Package 1, Package 2 and Package 3 are used for network modeling and
waveform simulations. Package 1 and Package 2 are software packages for network
modeling and generating transient waveforms. They contain standard options to define
simulation environment (sampling frequency, global network parameters, etc.). Results
are obtained in ASCII format transferable to COMTRADE and suitable for further
processing in other software packages. Speed of simulations is not critical for smaller
96
networks. These programs are transient programs and they are not meant to be used on
large-scale network models. Smaller portion of a power network is modeled in details,
including network equivalents, and transient programs are supposed to run with such
networks. For larger networks, simulations are slower. Speed of simulation decreases
more rapidly with Package 2 then with Package 1. On the other hand, it is observed that
Package 2 has more options for network components representation, such as library of
relay components. Some simple protective relaying schemes can be created in Package
2, whereas Package 1 doesn’t provide such an option.
Package 3 is software designed to support short circuit studies and setting
calculations for protective relays. Network models are created in Package 3 using
database editor. Created database is a repository of network and protection data needed
for analysis and record-keeping that may be useful when maintaining the protection.
Package 3 can simulate traditional and user defined faults, as well as most of the types of
network contingencies. Package 3 contains a large library of protective relay models. A
network model can be created containing relay models and their settings assigned to all
circuit breakers in a given network. A dynamic simulation can be performed, and
waveforms could be recorded at assumed location of the relay under test. Those
waveforms can be replayed to a real relay to evaluate its behavior under dynamic
conditions. Simulation results are phasors of the pre-fault and fault currents and
voltages. To create a COMTRADE file, two macros are available in Package 3.
Waveforms in COMTRADE format can be replayed to an actual relay using compatible
software such as Package 4. Since Package 3 doesn’t calculate transients, but phasor
values of currents and voltages, speed of simulations is fast for large networks.
Short comparison of some characteristics of Package 1, Package 2 and Package 3
is given in Table XXIX.

97
Table XXIX. Requirements: software packages
Requirement Package 1 Package 2 Package 3
Simplified and easy creation of data
Yes Yes Yes
Batch processing of fault simulations
Yes No No
Automated creating test results
Yes Yes Interactive procedure
Graphical representation of results and waveforms
Yes Yes Yes
Automated graphical representation of results
and waveforms
No Yes No
Signal processing and editing
No No No
Relay elements No Yes Yes Relay models No No Yes
Protection schemes No No Yes Creates phasors Yes Yes Yes
Creates transients Yes Yes No Speed of simulation Good Satisfactory Very good
Compatible with COMTRADE
Yes Yes Yes
Package 4 - software for automated testing
Package 4 is used in testing protective relays. It is capable of replaying waveform
files that originate from variety of sources. The data format is the COMTRADE standard
enabling the use of data captured by digital fault recorders. Also, it can replay the
waveforms created in other software packages compatible with COMTRADE, such as
Package 1, 2 and 3. Package 4 can also generate the waveforms using its own tools. It
enables generation of the waveforms with desired harmonic and DC content. It contains
the set of useful tools for signal processing, waveform editing, etc. The software
automatically captures, processes and stores the relay response. Automated test reports
can also be generated through Package 4. The above features make the software an
excellent tool in testing practically all types of line relays: distance relays,
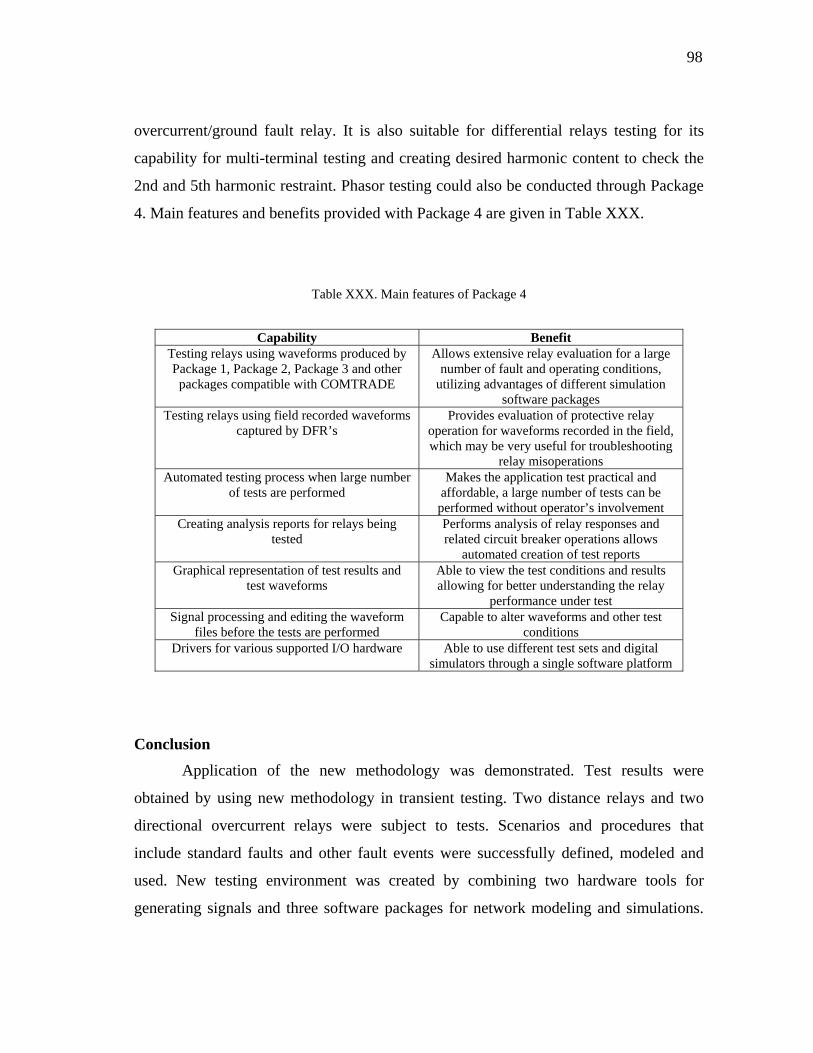
98
overcurrent/ground fault relay. It is also suitable for differential relays testing for its
capability for multi-terminal testing and creating desired harmonic content to check the
2nd and 5th harmonic restraint. Phasor testing could also be conducted through Package
4. Main features and benefits provided with Package 4 are given in Table XXX.
Table XXX. Main features of Package 4
Capability Benefit
Testing relays using waveforms produced by Package 1, Package 2, Package 3 and other packages compatible with COMTRADE
Allows extensive relay evaluation for a large number of fault and operating conditions,
utilizing advantages of different simulation software packages
Testing relays using field recorded waveforms captured by DFR’s
Provides evaluation of protective relay operation for waveforms recorded in the field, which may be very useful for troubleshooting
relay misoperations Automated testing process when large number
of tests are performed Makes the application test practical and
affordable, a large number of tests can be performed without operator’s involvement
Creating analysis reports for relays being tested
Performs analysis of relay responses and related circuit breaker operations allows
automated creation of test reports Graphical representation of test results and
test waveforms Able to view the test conditions and results allowing for better understanding the relay
performance under test Signal processing and editing the waveform
files before the tests are performed Capable to alter waveforms and other test
conditions Drivers for various supported I/O hardware Able to use different test sets and digital
simulators through a single software platform
Conclusion Application of the new methodology was demonstrated. Test results were
obtained by using new methodology in transient testing. Two distance relays and two
directional overcurrent relays were subject to tests. Scenarios and procedures that
include standard faults and other fault events were successfully defined, modeled and
used. New testing environment was created by combining two hardware tools for
generating signals and three software packages for network modeling and simulations.

99
Software platform was used for relay testing. Relays were tested for large number of
cases with repetitive tests for different fault inception angles. Sensitivity of protective
relays and average tripping time were checked according to the new methodology. For
each relay under test, it was concluded if it satisfies testing criteria. Out of four relays
that were tested, three of them passed the tests and one of them failed because of
unselective operation. This indicates that the new methodology, when utilized in
evaluating relays, provides very useful results. Comparison of hardware and software
components used to demonstrate the new methodology was given.
100
CHAPTER VI
CONCLUSION
Summary Standard practice of relay testing in majority of electric utilities is to use
conventional relay test sets to perform testing of protective relays by applying steady
state fault currents and voltages. Such concept is widely applied in testing all types of
protective relays: electromechanical, solid state and microprocessor relays.
Modern relays are mostly microprocessor-based. They use advanced processing
of transient signals to extract steady state phasors and to reach the trip decision. In the
real power system protective relays are exposed to transients. The latest trend in testing
protective relays is to model power systems and faults in electromagnetic transient
programs and to use digital simulators to apply the signals to the relay under test.
Standard approach to check the characteristic and tripping time of protective
relays by applying phasors of currents and voltages is still the most common approach in
testing numerical relays. Random nature of numerical relay’s response cannot be
analyzed in classical phasor tests. Transient tests need to be used to test selectivity and
average tripping time of numerical relays. Although proved necessary, transient tests are
still not widely used in relay testing practice. When used, they are usually conducted
randomly and intuitively to achieve specific testing objectives. Methodological approach
in transient testing is not yet established.
To meet the new requirements for advanced relay testing, new methodology was
defined in this thesis to provide theoretical explanations why and when the advanced
techniques in transient testing should be applied, to propose procedures how the transient
tests should be conducted and what criteria for evaluating relays should be considered in
transient tests.
Test procedures and scenarios proposed for the new methodology enabled
detailed analysis of protective relay operation in various situations and operating
conditions. Scenarios for testing protective relays and checking their functions were
101
defined. The new methodology also defined how the test scenarios should be conducted
and practically implemented. Test cases and scenarios were conducted for different fault
inception angles and replayed in repetitive tests to check the random response of a relay
under test. The main goal of transient testing, to test selectivity and average tripping
time, was achieved successfully with the new methodology.
It was shown that different test equipment hardware need to be used to
implement the new methodology. The new methodology should be applied with compact
test sets in troubleshooting relay misoperations directly in the field. The new
methodology should also be applied with high performance digital simulator in the
laboratory for the purpose of testing new protective relays before procurement. It was
demonstrated how to apply the new methodology with compact test sets and digital
simulators.
It was shown that various test scenarios need to be applied to test selectivity and
average tripping time of protective relays in transient tests. Test cases and scenarios
were modeled and replayed by using available software packages. Representative
network models were created in an attempt to cover variety of network conditions for a
relay under test. Network models were defined in different modeling and simulation
software packages, where each software package was used for specific applications.
Four types of microprocessor relays were subject to tests to demonstrate
implementation of the new methodology. The results indicated the usefulness of the new
methodology.
Contribution In today’s practice of relay testing, there is no methodology defined for transient
testing of numerical relays. The main contribution of this thesis is that a new
methodology is established. By defining and applying the new methodology, the
following contributions were achieved:
- Defining purpose of transient testing: It was shown theoretically why the
transient tests are necessary and when the transient tests are needed.

102
- Defining test procedures: It was proposed how the transient tests should be
defined and conducted to check selectivity and average tripping time of
transmission line protective relays.
- Using different test equipment hardware: It was proven that advanced testing
could be conducted with digital simulators of high output power in the
laboratory, as well as with compact test sets suitable for field application.
- Using variety of network models: It was demonstrated that relays could be
tested on a large number of scenarios using a set of representative models.
- Using different modeling and simulation tools: By applying modeling and
simulation tools in relay testing, it was shown how the advantages of
different software tools can be utilized to achieve best possible conditions for
testing applications.
- Testing different types of microprocessor relays: By testing various types of
microprocessor relays, it was demonstrated how the new methodology can be
practically implemented with modern numerical transmission line relays.
It is expected that this research and development effort contributes the following
to the area of power systems engineering:
- Extensive utilization of the modeling and simulation technology
- The relay evaluation and testing in the future may be made more detailed and
precise allowing for further improvements in the performance and reliability
of protective relays and relaying systems

103
REFERENCES
[1] A. R. Bergen, V. Vittal, Power System Analysis, 2nd ed. Upper Saddle River, NJ:
Prentice Hall, 2000.
[2] P. M. Anderson, Power System Protection, 1st ed. New York: IEEE Press, 1999.
[3] J. D. Glove, M. S. Sarma, Power System Analysis and Design, 3rd ed. Boston, MA:
Wadsworth Group, 2002.
[4] M. Kezunovic, Y. Q. Xia, Y. Guo, C. W. Fromen, D. R. Sevcik, “An Advanced
Method for Testing of Distance Relay Operating Characteristic,” IEEE Trans. on
Power Delivery, Vol. 11, pp. 149-157, Jan. 1996.
[5] M. Kezunovic, Y. Q. Xia, Y. Guo, C. W. Fromen, D. R. Sevcik, “Distance Relay
Application Testing Using a Digital Simulator,” IEEE Trans. on Power Delivery,
Vol. 12, No. 1, pp. 72-82, Jan. 1997.
[6] M. S. Sachdev, T. S. Sidhu, P. G. McLaren, “Issues and Opportunities for Testing
Numerical Relays,” Proc. IEEE/Power Eng. Soc. Summer Meeting, Seattle, WA,
July 2000, Vol. 2, pp. 1185-1190.
[7] J. A. Martinez-Velasco, Computer Analysis of Electric Power System Transients,
1st ed. New York: IEEE, Jan. 1997.
[8] M. Kezunovic, J. Domaszewicz, V. Skendzic, M. Aganagic, J. K. Bladow, S. M.
McKenna, D. M. Hamai, “Design, Implementation and Validation of a Real-time
Digital Simulator for Protection Relay Testing,” IEEE Trans. on Power Delivery,
Vol. 11, pp. 158-164, Jan. 1996.
[9] J.Y. Boussion, P. Erhard, P. Lasbleiz, Y. Pratti, “MORGAT: Digital Simulator
Used for Industrial Qualification of Protective Relays,” Fourth International
Conference on Developments in Power Protection, Edinburgh, U. K., Apr. 1989.
[10] P.G. McLaren, J. Song, B. Xiao, E. Dirks, L. Arendt, P. Wilson, “Incorporating
PSCAD/EMTDC into a Playback Digital Simulator,” IPST ’97, Seattle, WA, June
1997.
104
[11] M. Kezunovic, A. Abur, Lj. Kojovic, V. Skendzic, H. Singh, C.W. Fromen, D.R.
Sevcik, “DYNA – Test Simulator for Relay Testing. I. Design Characteristics,”
IEEE Trans. on Power Delivery, Vol. 6, No. 4, pp. 1423-1429, Oct. 1991.
[12] IEEE Std C37.111-1999, IEEE Standard Common Format for Transient Data
Exchange (COMTRADE) for Power Systems. New York: IEEE, 1999.
[13] IEEE Std C37.113-1999, IEEE Guide for Protective Relay Applications to
Transmission Lines. New York: IEEE, 1999.
[14] A. G. Phadke, J. S. Thorp, Computer Relaying for Power Systems. New York:
Wiley, Research Studies Press, 1988.
[15] A. T. Johns, S. K. Salman, Digital Protection for Power Systems. London, U.K.:
Peter Peregrims Ltd., 1995.
[16] M. S. Sachdev (Coordinator), IEEE Tutorial Course Text, Publication No. 88
EH0269-1-PWR, pp. 1-95, 1988.
[17] M. Kezunovic, J. T. Cain, B. Perunicic, “Digital Protective Relaying Algorithm
Sensitivity Study and Evaluation,” IEEE Trans. on Power Delivery, Vol. 3, No. 3,
pp. 912-922, July 1988.
[18] Working Group I10 of the Relaying Practices Subcommittee, “A Survey of Relay
Test Practices – 1991 Results,” IEEE Trans. on Power Delivery, Vol. 9, No. 3, pp.
1339-1351, July 1994.
[19] “AVO Testing Equipment, AVO Pulsar Test Set,” [Online], AVO International,
Inc., Available: http://www.avointl.com (accessed on July 27th 2003)
[20] “ABB Testing Equipment, FREJA,” [Online], ABB Programma, Available:
http://www.programma.se (accessed on July 27th 2003)
[21] “Relay Assistant,” [Online], TLI, Inc. Available: http://www.tli-inc.com (accessed
on July 27th 2003)
[22] “Real Time Digital Simulator,” [Online], RTDS Technologies, Available:
http://www.rtds.com (accessed on July 27th 2003)
[23] Manitoba HVDC Research Center, PSCAD /EMTDC Manual, Winnipeg,
Manitoba, 1988.
105
[24] “Alternative Transients Program,” [Online], Available: http://www.emtp.org
(accessed on July 27th 2003)
[25] M. Kezunovic, “Automation of Fault Analysis Using DFR Data,” 60th American
Power Conference, Chicago, IL, Apr. 1998.
[26] M. Kezunovic, S.M. McKenna, “Real-time Digital Simulator for Protective Relay
Testing,” IEEE Computer Applications in Power, Vol. 7, No. 3, pp. 30-35, July
1994.
[27] R. Kuffel, J. Giesbrecht, T. Maguire, R. P. Wierck, P. A. Forsyth, P. G. McLaren,
“A Fully Digital Real-time Simulator for Protective Relay Testing”, Proc. Sixth
Intl. Conference on Developments in Power System Protection, Conference
Publication No. 434, pp. 147-150, Mar. 1997
[28] “ARENE Power System Simulator,” [Online], HP-EDF Joint Venture Anhelco,
Available: http://www.anhelco.com (accessed on July 27th 2003)
[29] “TEQSIM Digital Real Time Power Network Simulator,” [Online], TransEnergie
Technologies, Inc., Available: http://www.teqsim.com (accessed on July 27th 2003)
[30] J. R. Marti, L. R. Linares, “Real Time EMTP-based Transient Simulation,” IEEE
Trans. on Power Systems, Vol. 9, No. 3, pp. 1309-1317, Aug. 1994.
[31] M. Kezunovic, B.A. Pickett, M.G. Adamiak, G.E. Alexander, K.R. Carr, G.
Chirco, J. Esztergalyos, M. Jerosolimski, W.C. Kotheimer, R. Marttila, J.L.
McElray, S.M. McKenna, P.G. McLaren, R.J. Murphy, J. Nordstrom, “Digital
Simulator Performance Requirements for Relay Testing,” IEEE Trans. on Power
Delivery, Vol. 13, No. 1, pp. 78-84, Jan. 1998.
[32] M. Kezunovic, Z. Galijasevic, “An Advanced PC-based Digital Simulator for
Protective Relay Testing,” Second International Conference on Digital Power
System Simulators (ICDS '97), Montreal, Canada, May 1997.
[33] J. Schilleci, G. Breaux, M. Kezunovic, Z. Galijasevic, T. Popovic, “Use of
Advanced Digital Simulators for Distance Relay Design and Application Testing,”
Texas A&M 54th Annual Relay Conference for Protective Relay Engineers,
College Station, TX, Apr. 2001.

106
[34] D. Ristanovic, S. Vasilic, M. Kezunovic, “Design and Implementation of Scenarios
for Evaluating and Testing Distance Relays,” North American Power Symposium -
NAPS, College Station, TX, Oct. 2001.
107
VITA
Dragan Ristanovic was born in 1971 in Belgrade, Yugoslavia. He received his
Bachelor of Science in electrical engineering (Diploma of Engineering) from the School
of Electrical Engineering, University of Belgrade, Yugoslavia in June 1996. In
undergraduate studies, he majored in power system networks.
Dragan Ristanovic worked as a school teacher in a technical high school from
1996 to 1997 in Belgrade, Yugoslavia and as an electrical engineer with Energoprojekt
Company (Belgrade, Yugoslavia) from 1997 to 2001 at company’s branches overseas.
He entered graduate school at Texas A&M University in the Spring of 2001 and earned
his Master of Science in electrical engineering in December 2003. His emphasis in
graduate school was in the area of power systems and protective relaying. During his
graduate studies, he worked on various research assignments as a research assistant,
Power Engineering Lab manager and as a grader for the Department of Electrical
Engineering.
Address:
Bulevar Arsenija Carnojevica 147
11070 Beograd
Yugoslavia


![protection of transmission lines[distance relay protection scheme]](https://img.pdfslide.net/doc/110x75/554a3baab4c905863d8b4a95/protection-of-transmission-linesdistance-relay-protection-scheme.jpg)