Embed Size (px)
Citation preview
August 2015
New Mexico Freight Plan Moving Freight Forward, through 2040

New Mexico Freight Plan i
Table of Contents
Executive Summary ...................................................................................................................................................................... 1
Economic Context of Freight Transportation Planning .................................................................................................................. 3
Use of Freight Transportation by New Mexico Industries .................................................................................................................. 6
Trends Influencing Freight Transportation .................................................................................................................................... 13
Conditions and Performance of the Freight Network .................................................................................................................. 27
Highways ................................................................................................................................................................................ 29
Freight Rail System .................................................................................................................................................................. 36
Cargo Airports ......................................................................................................................................................................... 45
Border Crossings ..................................................................................................................................................................... 46
Freight Volumes Forecast ........................................................................................................................................................... 50
New Mexico Freight Rail Demand ................................................................................................................................................ 50
Greenhouse Gas Emissions Analysis ............................................................................................................................................ 53
Significant Freight System Trends, Needs, Issues, Strengths, and Problems .............................................................................. 55
Freight Needs and Issues .......................................................................................................................................................... 55
Rail Issues and Opportunities ..................................................................................................................................................... 57
Freight Road Map ....................................................................................................................................................................... 63
Project Prioritization Process ...................................................................................................................................................... 64
Implementation Plan ................................................................................................................................................................ 69
Appendix A: Freight Survey Results ............................................................................................................................................ 75

New Mexico Freight Plan 1
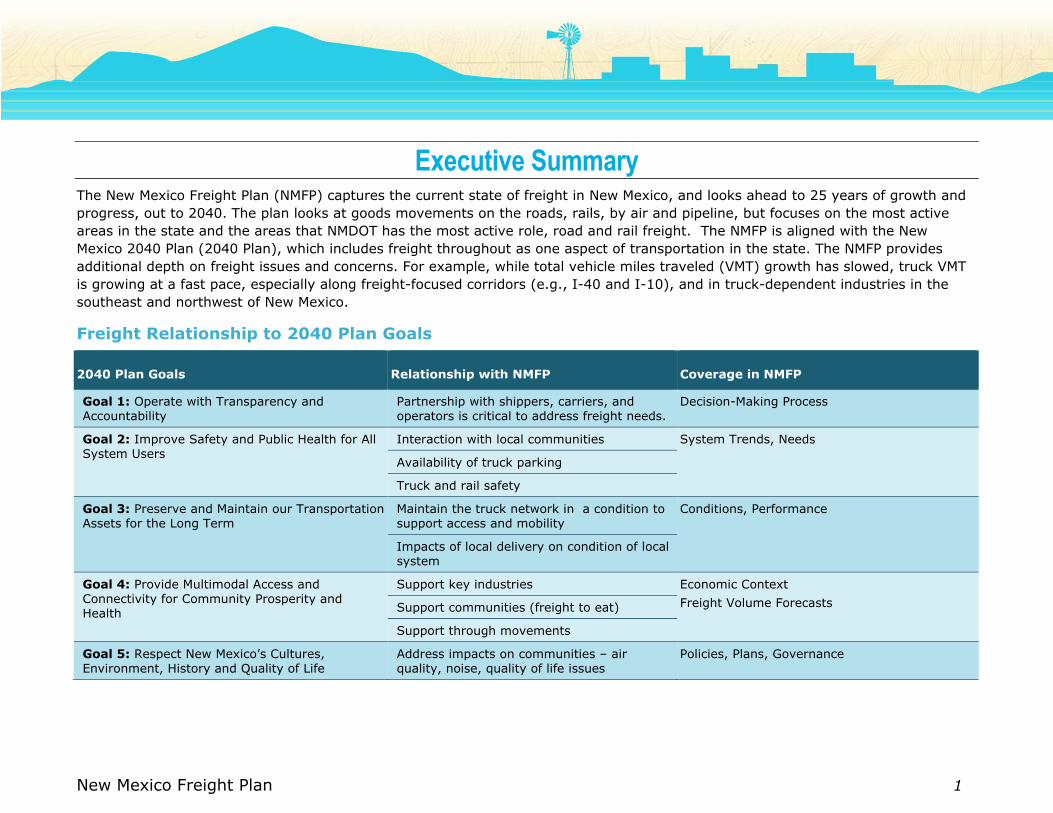
Executive Summary The New Mexico Freight Plan (NMFP) captures the current state of freight in New Mexico, and looks ahead to 25 years of growth and
progress, out to 2040. The plan looks at goods movements on the roads, rails, by air and pipeline, but focuses on the most active
areas in the state and the areas that NMDOT has the most active role, road and rail freight. The NMFP is aligned with the New
Mexico 2040 Plan (2040 Plan), which includes freight throughout as one aspect of transportation in the state. The NMFP provides
additional depth on freight issues and concerns. For example, while total vehicle miles traveled (VMT) growth has slowed, truck VMT
is growing at a fast pace, especially along freight-focused corridors (e.g., I-40 and I-10), and in truck-dependent industries in the
southeast and northwest of New Mexico.
Freight Relationship to 2040 Plan Goals
2040 Plan Goals Relationship with NMFP Coverage in NMFP
Goal 1: Operate with Transparency and Accountability
Partnership with shippers, carriers, and operators is critical to address freight needs.
Decision-Making Process
Goal 2: Improve Safety and Public Health for All System Users
Interaction with local communities System Trends, Needs
Availability of truck parking
Truck and rail safety
Goal 3: Preserve and Maintain our Transportation Assets for the Long Term
Maintain the truck network in a condition to support access and mobility
Conditions, Performance
Impacts of local delivery on condition of local system
Goal 4: Provide Multimodal Access and Connectivity for Community Prosperity and Health
Support key industries Economic Context
Freight Volume Forecasts Support communities (freight to eat)
Support through movements
Goal 5: Respect New Mexico’s Cultures, Environment, History and Quality of Life
Address impacts on communities – air quality, noise, quality of life issues
Policies, Plans, Governance

New Mexico Freight Plan 2
This plan includes freight-focused strategic goals for the near-term, mid-term, and long-term, and lays the ground-work for the next
iteration of the NMFP. This plan is consistent with Federal regulations and guidance. MAP-21 defined a set of requirements for the
freight plan that the 2040 Plan has been designed to meet. The following table lists the freight plan elements required by MAP-21, as
well as those recommended by U.S. DOT, and where in the 2040 Plan and its appendices these can be found.
Freight Plan Elements
Freight Plan Element MAP-21 Requirement U.S. DOT Recommends New Mexico Freight Plan
Describe how State Freight Plan supports national freight goals
pp. 69-74
Describe economic context (industries, supply chains)
pp. 3-26
Describe freight policies, strategies, performance measures
pp. 27-49, pp. 69-74
Identify freight transportation assets pp. 27-49
Report on conditions and performance pp. 27-49
Develop freight forecast pp. 50-54
Describe freight trends, needs, issues pp. 13-26 and pp. 55-62
Identify strengths and weaknesses pp. 55-62
Develop freight investment decision-making process
pp. 64-65 (for rail)
Inventory bottlenecks and develop freight improvement strategies
pp. 55-62 and pp. 66-74
Develop implementation plan, including funding and revenue sources
pp. 69-74 (missing funding and revenue
sources)
New Mexico Freight Plan 3
Economic Context of Freight Transportation Planning New Mexico has a diverse economy with many important and emerging industries, some of which depend on freight transportation
for their daily business operations. This section explores New Mexico’s economic makeup and industry mix and identifies those
industries in the State which are most dependent upon freight transportation.
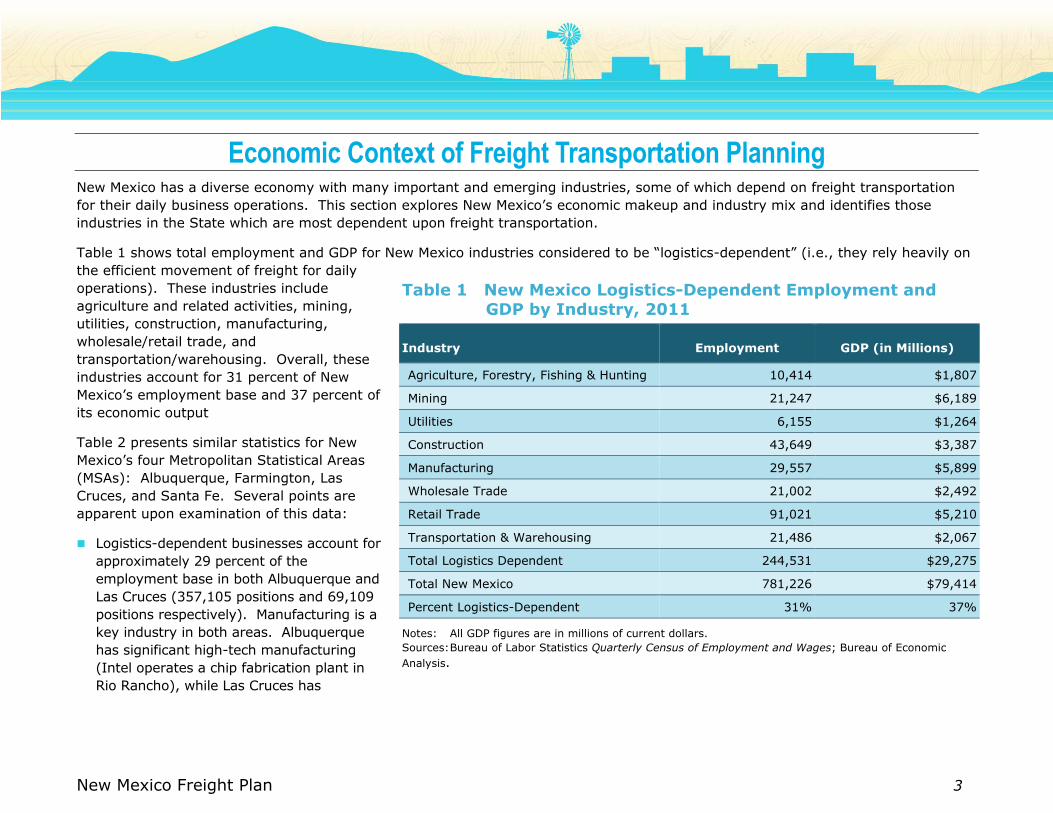
Table 1 shows total employment and GDP for New Mexico industries considered to be “logistics-dependent” (i.e., they rely heavily on
the efficient movement of freight for daily
operations). These industries include
agriculture and related activities, mining,
utilities, construction, manufacturing,
wholesale/retail trade, and
transportation/warehousing. Overall, these
industries account for 31 percent of New
Mexico’s employment base and 37 percent of
its economic output
Table 2 presents similar statistics for New
Mexico’s four Metropolitan Statistical Areas
(MSAs): Albuquerque, Farmington, Las
Cruces, and Santa Fe. Several points are
apparent upon examination of this data:
Logistics-dependent businesses account for
approximately 29 percent of the
employment base in both Albuquerque and
Las Cruces (357,105 positions and 69,109
positions respectively). Manufacturing is a
key industry in both areas. Albuquerque
has significant high-tech manufacturing
(Intel operates a chip fabrication plant in
Rio Rancho), while Las Cruces has
Table 1 New Mexico Logistics-Dependent Employment and GDP by Industry, 2011
Industry Employment GDP (in Millions)
Agriculture, Forestry, Fishing & Hunting 10,414 $1,807
Mining 21,247 $6,189
Utilities 6,155 $1,264
Construction 43,649 $3,387
Manufacturing 29,557 $5,899
Wholesale Trade 21,002 $2,492
Retail Trade 91,021 $5,210
Transportation & Warehousing 21,486 $2,067
Total Logistics Dependent 244,531 $29,275
Total New Mexico 781,226 $79,414
Percent Logistics-Dependent 31% 37%
Notes: All GDP figures are in millions of current dollars.
Sources: Bureau of Labor Statistics Quarterly Census of Employment and Wages; Bureau of Economic
Analysis.

New Mexico Freight Plan 4
aerospace and benefits from proximity to maquiladoras located across the Mexican border.1
The Las Cruces MSA has significantly higher employment in the agriculture sector compared to the other MSAs (almost 3,200 jobs,
compared to less than 350 for each of the other three MSAs), due to the presence of several dairy farms and other agricultural
producers in Doña Ana County. Agriculture is the third largest contributor to Las Cruces GDP at about $294 million in 2011.
The Farmington MSA, located in the northwestern part of the State, is especially reliant upon freight transportation-dependent
industries – they account for 62 percent of the area’s total output (about $3.5 billion) and 44 percent of its employment (21,333
jobs). Farmington has a sizeable concentration of mining employment (over 6,400 positions).2 Most of these jobs are in the oil and
gas extraction industry. Energy-related mining and production activities in San Juan County include two coal mines, two coal-fired
power plants, a natural gas hub (the Blanco Hub), a petroleum refinery, and a natural gas power plant.3 A substantial volume of the
freight generated by these industries moves by pipeline (e.g., crude oil, natural gas, and refined petroleum products), and both of
the coal-fired generating stations are fueled from mines in close proximity to the plants. Coal conveyor systems exist between the
mines and the power plants and do not have any connections to the North American rail or highway networks.
In Santa Fe, freight transportation-dependent industries make up 24 percent of total jobs, a slightly lower concentration which
reflects State government and tourism being the major employers in the Santa Fe economy.
1 New Mexico Department of Transportation, NMDOT Multimodal Freight Study, December 2008.
2 Bureau of Labor Statistics, Quarterly Census of Employment and Wages.
3 U.S. Energy Information Administration.

New Mexico Freight Plan 5
Table 2 Employment and GDP by Industry in New Mexico Metropolitan Statistical Areas 2011
Albuquerque1 Farmington2 Las Cruces3 Santa Fe4
Industry Employment GDP5 Employment GDP5 Employment GDP5 Employment GDP5
Agriculture, Forestry, Fishing & Hunting 341 n/a 194 $13 3,199 $294 142 $4
Mining 290 n/a 6,409 $2,078 45 $8 92 $181
Utilities 921 n/a 1,018 $398 669 $96 125 $34
Construction 19,938 $1,681 3,431 $281 3,545 $249 2,876 $227
Manufacturing 17,654 $4,632 1,283 $123 3,094 $408 772 $80
Wholesale Trade 11,445 $1,518 1,585 $201 1,099 $123 972 $131
Retail Trade 41,094 $2,411 6,093 $346 7,290 $371 8,630 $565
Transportation & Warehousing 8,157 $778 1,320 $120 1,647 $172 720 $47
Total Logistics-Dependent 99,840 n/a 21,333 $3,560 20,588 $1,721 14,329 $1,269
Total MSA 357,105 $37,875 48,272 $5,743 69,109 $5,775 60,477 $6,249
Percent Logistics-Dependent 28% n/a 44% 62% 30% 30% 24% 20%
Notes: 1 Bernalillo, Sandoval, Torrance, and Valencia Counties. 2 San Juan County. 3 Doña Ana County. 4 Santa Fe County. 5 All GDP figures are in millions of current dollars.
n/a: Data are not available for confidentiality reasons.
Sources: Bureau of Labor Statistics Quarterly Census of Employment and Wages; Bureau of Economic Analysis.
New Mexico Freight Plan 6
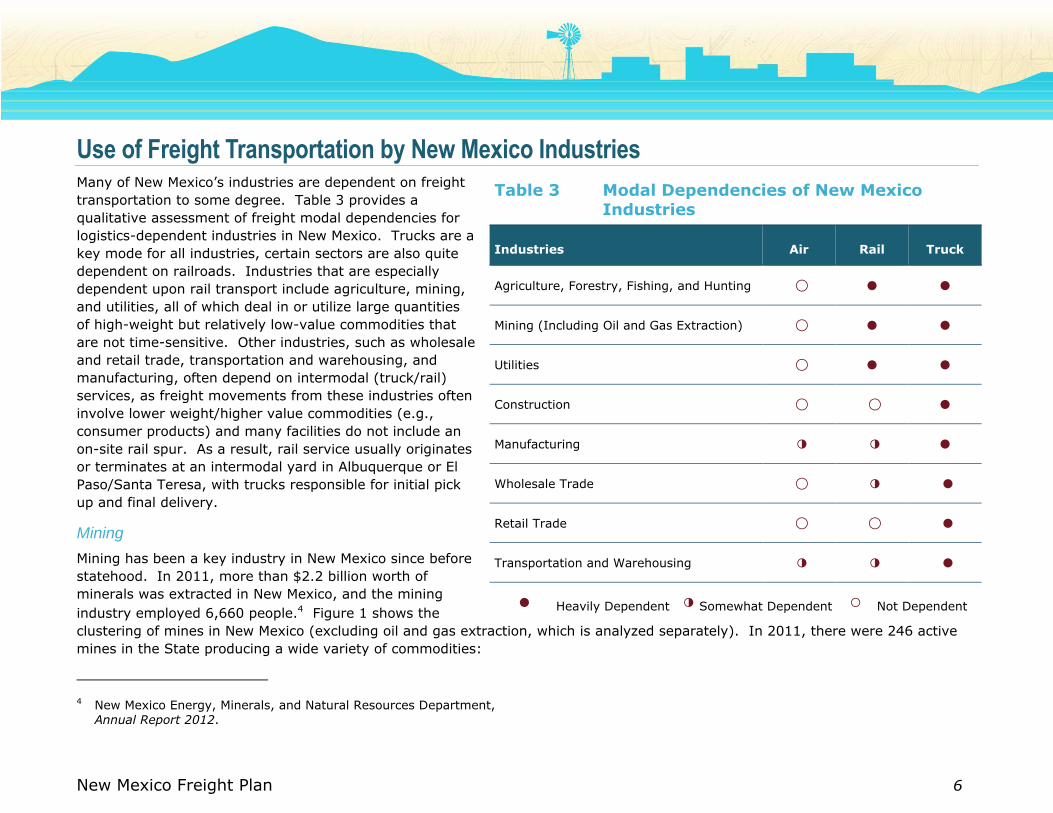
Use of Freight Transportation by New Mexico Industries Many of New Mexico’s industries are dependent on freight
transportation to some degree. Table 3 provides a
qualitative assessment of freight modal dependencies for
logistics-dependent industries in New Mexico. Trucks are a
key mode for all industries, certain sectors are also quite
dependent on railroads. Industries that are especially
dependent upon rail transport include agriculture, mining,
and utilities, all of which deal in or utilize large quantities
of high-weight but relatively low-value commodities that
are not time-sensitive. Other industries, such as wholesale
and retail trade, transportation and warehousing, and
manufacturing, often depend on intermodal (truck/rail)
services, as freight movements from these industries often
involve lower weight/higher value commodities (e.g.,
consumer products) and many facilities do not include an
on-site rail spur. As a result, rail service usually originates
or terminates at an intermodal yard in Albuquerque or El
Paso/Santa Teresa, with trucks responsible for initial pick
up and final delivery.
Mining
Mining has been a key industry in New Mexico since before
statehood. In 2011, more than $2.2 billion worth of
minerals was extracted in New Mexico, and the mining
industry employed 6,660 people.4 Figure 1 shows the
clustering of mines in New Mexico (excluding oil and gas extraction, which is analyzed separately). In 2011, there were 246 active
mines in the State producing a wide variety of commodities:
4 New Mexico Energy, Minerals, and Natural Resources Department,
Annual Report 2012.
Table 3 Modal Dependencies of New Mexico Industries
Industries Air Rail Truck
Agriculture, Forestry, Fishing, and Hunting ◯ ● ●
Mining (Including Oil and Gas Extraction) ◯ ● ●
Utilities ◯ ● ●
Construction ◯ ◯ ●
Manufacturing ◑ ◑ ●
Wholesale Trade ◯ ◑ ●
Retail Trade ◯ ◯ ●
Transportation and Warehousing ◑ ◑ ●
● Heavily Dependent ◑ Somewhat Dependent ○ Not Dependent
New Mexico Freight Plan 7
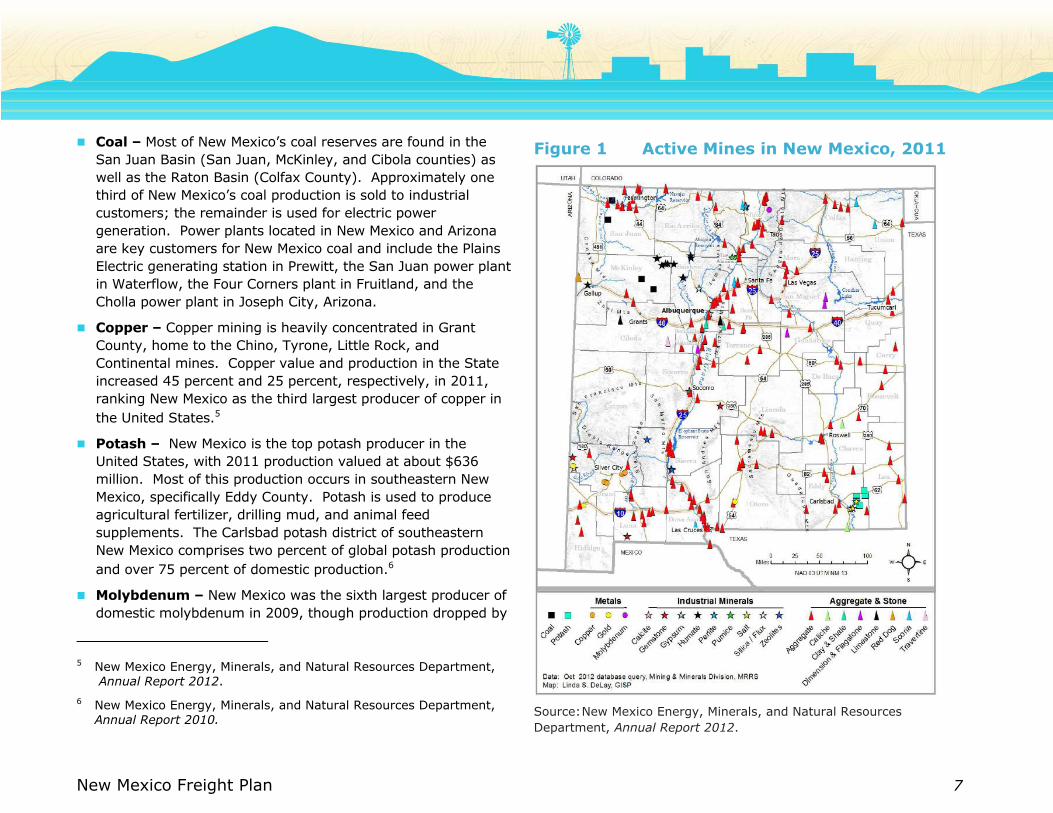
Coal – Most of New Mexico’s coal reserves are found in the
San Juan Basin (San Juan, McKinley, and Cibola counties) as
well as the Raton Basin (Colfax County). Approximately one
third of New Mexico’s coal production is sold to industrial
customers; the remainder is used for electric power
generation. Power plants located in New Mexico and Arizona
are key customers for New Mexico coal and include the Plains
Electric generating station in Prewitt, the San Juan power plant
in Waterflow, the Four Corners plant in Fruitland, and the
Cholla power plant in Joseph City, Arizona.
Copper – Copper mining is heavily concentrated in Grant
County, home to the Chino, Tyrone, Little Rock, and
Continental mines. Copper value and production in the State
increased 45 percent and 25 percent, respectively, in 2011,
ranking New Mexico as the third largest producer of copper in
the United States.5
Potash – New Mexico is the top potash producer in the
United States, with 2011 production valued at about $636
million. Most of this production occurs in southeastern New
Mexico, specifically Eddy County. Potash is used to produce
agricultural fertilizer, drilling mud, and animal feed
supplements. The Carlsbad potash district of southeastern
New Mexico comprises two percent of global potash production
and over 75 percent of domestic production.6
Molybdenum – New Mexico was the sixth largest producer of
domestic molybdenum in 2009, though production dropped by
5 New Mexico Energy, Minerals, and Natural Resources Department,
Annual Report 2012.
6 New Mexico Energy, Minerals, and Natural Resources Department,
Annual Report 2010.
Figure 1 Active Mines in New Mexico, 2011
Source: New Mexico Energy, Minerals, and Natural Resources
Department, Annual Report 2012.

New Mexico Freight Plan 8
more than 90 percent (to 100 tons).7 Between 2009 and 2011, the State’s production of molybdenum rebounded by 43 percent.
The sole molybdenum producer in the State - the Questa Mine in Taos County, closed in June 2014 and is now in remediation. The
Questa Mine had been one of the largest molybdenum mines in the country.
Industrial Minerals – New Mexico is a significant producer of industrial minerals, with approximately 1.5 million tons produced by
21 mines and 15 mills throughout the State. New Mexico is the country’s largest producer of perlite and zeolite and is one of the
main producers of pumice.8
Stone and Aggregate – Stone and aggregate, which includes construction sand and gravel, is a subset of industrial minerals and is
directly linked to the health of the local construction market. New Mexico aggregate production began to decline in 2006 and
aggregate demand for highway, residential, and commercial construction continues to remain depressed. New Mexico produced 9.8
million tons in 2011, a 50 percent drop from 2006.9
Other key mining products in New Mexico include gold and silver (often a byproduct of copper mining), and other precious metals.
Long-term prospects for New Mexico’s mining sector are strong, due to worldwide economic growth. As developing nations
industrialize, their demand for basic commodities increases. Rising commodity prices since 2000 have driven vigorous growth in the
State’s mining industry. For instance, expanding global crop production – especially in India, China, and Brazil – has contributed to
increased consumption of potash for fertilizer. High oil prices have also spurred demand, both for the production of drilling muds
(which are used in oil and gas exploration) and for producing ethanol and biodiesel feed stocks. Similarly, continued demand for
steel in growing Pacific Rim economies has bolstered the production of molybdenum, which is an input to steel production. For coal,
the future prospects are less clear, due to the concerns related to emissions from the combustion of coal, as well as the competitive
position of New Mexico’s coal deposits versus other western sources.
Oil and Gas Extraction
Figures 2 and 3 show the clustering of New Mexico’s oil and gas extraction industries, respectively. As the maps show, these
establishments are overwhelmingly concentrated in the Four Corners area (San Juan County) and the Permian Basin of southeast
New Mexico (Lea, Eddy, and Chaves counties). Production in the Permian Basin is increasing dramatically due to hydraulic fracturing.
7 Ibid.
8 New Mexico Energy, Minerals, and Natural Resources Department, Annual Report 2012.
9 Ibid.

New Mexico Freight Plan 9
Figure 2 Gas Production by County 2011
Source: New Mexico Energy, Minerals, and Natural Resources
Department, Annual Report 2012.
Figure 3 Oil Production by County 2011
Source: New Mexico Energy, Minerals, and Natural Resources
Department, Annual Report 2012.

New Mexico Freight Plan 10
New Mexico’s oil and gas sector provides approximately 4,800 jobs for the State’s residents.10 New Mexico’s proven crude oil
reserves were the fifth largest in the country at 700 million barrels in 2009; in 2010, New Mexico produced 171,000 barrels of oil per
day.11
More than 93 percent of the oil produced in New Mexico in 2011 came from just two counties. Lea County and Eddy County each
produced more than 33 million barrels of oil in 2011.12 Gas production, however, takes place mostly in northwest New Mexico
(Figure 3); San Juan and Rio Arriba counties combined accounted for about 68 percent of the State’s production in 2011 (480 billion
and 343 billion cubic feet respectively).13 Nonetheless, significant natural gas production also occurs in southeast New Mexico; Eddy
and Lea counties are the third and fourth largest natural gas producers in the State.
According to the U.S. Energy Information Administration, domestic crude oil production is expected to rise through 2035 due to a
number of factors, including rising world oil prices; growing use of shale oil resources; and the use of enhanced oil recovery (EOR)
techniques, which increases the amount of oil that can be extracted from a given field.14 Domestic natural gas production,
meanwhile, is expected to grow substantially from about 21 trillion cubic feet in 2009 to nearly 27 trillion cubic feet in 2035.15 This
will be driven primarily by the expansion of shale gas production using hydraulic fracturing and horizontal drilling technologies.
Although major gas producers have not yet begun to explore New Mexico for production of shale gas, preliminary analysis suggests
that there are recoverable deposits within the State.16 This new development could translate into additional demand for freight
transportation.
10 Bureau of Labor Statistics Quarterly Census of Employment and Wages, NAICS Code 211.
11 U.S. Energy Information Administration.
12 New Mexico Energy, Minerals, and Natural Resources Department, Annual Report 2012.
13 Ibid.
14 U.S. Energy Information Administration, Annual Energy Outlook 2011, April 2011.
15 Ibid.
16 Robinson-Avila, K., ‘New Mexico sidelined in shale gas-boom’. New Mexico Business Weekly, February 14, 2010.
New Mexico Freight Plan 11
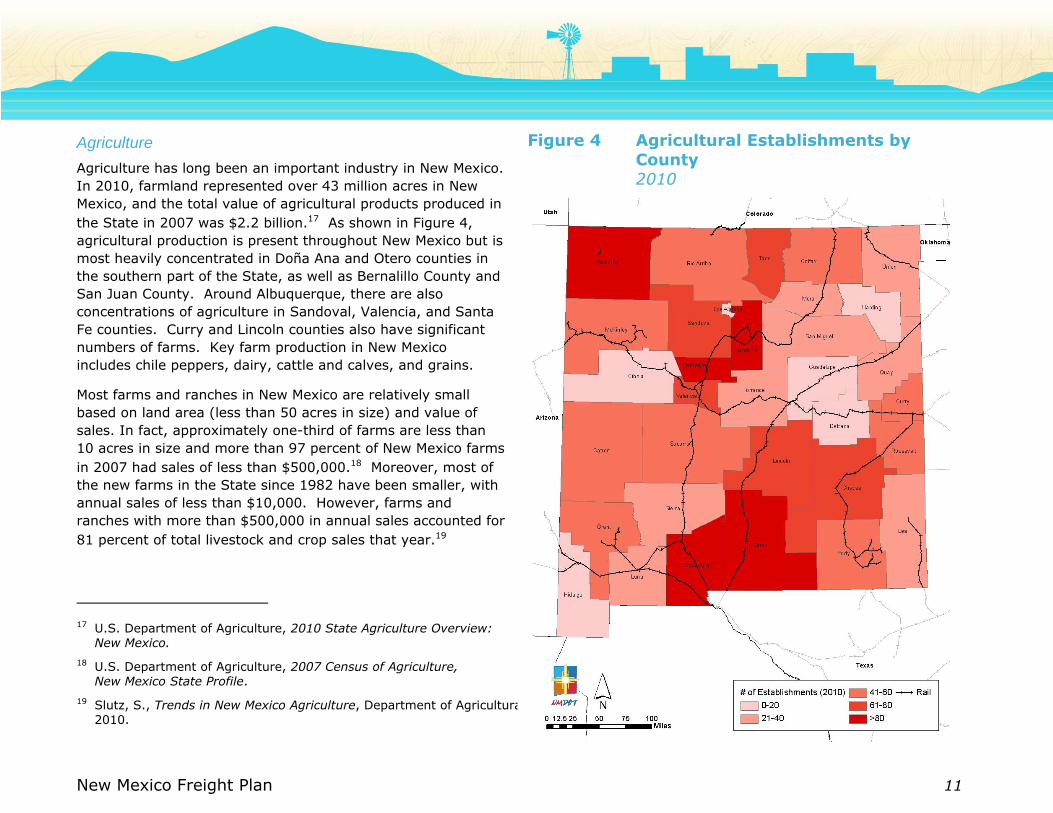
Agriculture
Agriculture has long been an important industry in New Mexico.
In 2010, farmland represented over 43 million acres in New
Mexico, and the total value of agricultural products produced in
the State in 2007 was $2.2 billion.17 As shown in Figure 4,
agricultural production is present throughout New Mexico but is
most heavily concentrated in Doña Ana and Otero counties in
the southern part of the State, as well as Bernalillo County and
San Juan County. Around Albuquerque, there are also
concentrations of agriculture in Sandoval, Valencia, and Santa
Fe counties. Curry and Lincoln counties also have significant
numbers of farms. Key farm production in New Mexico
includes chile peppers, dairy, cattle and calves, and grains.
Most farms and ranches in New Mexico are relatively small
based on land area (less than 50 acres in size) and value of
sales. In fact, approximately one-third of farms are less than
10 acres in size and more than 97 percent of New Mexico farms
in 2007 had sales of less than $500,000.18 Moreover, most of
the new farms in the State since 1982 have been smaller, with
annual sales of less than $10,000. However, farms and
ranches with more than $500,000 in annual sales accounted for
81 percent of total livestock and crop sales that year.19
17 U.S. Department of Agriculture, 2010 State Agriculture Overview:
New Mexico.
18 U.S. Department of Agriculture, 2007 Census of Agriculture,
New Mexico State Profile.
19 Slutz, S., Trends in New Mexico Agriculture, Department of Agricultural Economics and Agricultural Business, New Mexico State University, March
2010.
Figure 4 Agricultural Establishments by County 2010
Source: U.S. Census Bureau County Business Patterns
New Mexico Freight Plan 12
The two largest sectors of the agriculture industry, by value, are milk and dairy products (accounting for 46 percent of the value of
total agricultural products sold) and cattle and calves (26 percent of total agricultural market value). Approximately 87 percent of
agricultural land in New Mexico is devoted to pastureland.
The State’s large agriculture operations are the most likely users of rail transportation to transport fertilizers, feed, and some dairy
products needed to support their operations. While some dairy products are shipped by rail, the time-sensitive nature of the
products these farms and ranches produce means that they are typically transported by truck. Even though most farms in New
Mexico are small (as are most new farm operations), total production will likely continue to be dominated by larger operations.
Nonetheless, agriculture will remain a bedrock economic activity at all scales throughout the State.
New Mexico Freight Plan 13
Trends Influencing Freight Transportation The New Mexico freight system was built to serve key freight-intensive industries, including oil and gas and other mining activities,
agriculture and livestock, and manufacturing. As a large freight intensive state with a relatively small population, New Mexico has
concentrated employment centers in proximity to major generators including mines, border crossings, rail yards, and distribution
centers in order to take advantage of economies of scale and scope.
This section describes external trends that are influencing and will continue to impact the New Mexico freight transportation system
and its role in global merchandise trade. The trends are subdivided into the following five categories:
Cross Border Trends including issues related to New Mexico trade relationship with Mexico and internal developments within
Mexico, particularly the state of Chihuahua, that impact current trade and traffic patterns.
Trucking Industry Trends including issues related to truck drivers, trucking industry practices and emerging technologies that are
impacting the trucking sector in New Mexico and throughout the United States.
Rail Industry Trends including emerging trends in the railroad industry impacting New Mexico. It is taken largely from the recently
completed New Mexico Rail Plan.
Supply Chain Trends including New Mexico’s trading relationships with the rest of the world and external factors that impact these
relationships.
Warehousing and Distribution Center Trends including shifts in warehousing and distribution practices that impact freight
strategies.
Cross Border Trends
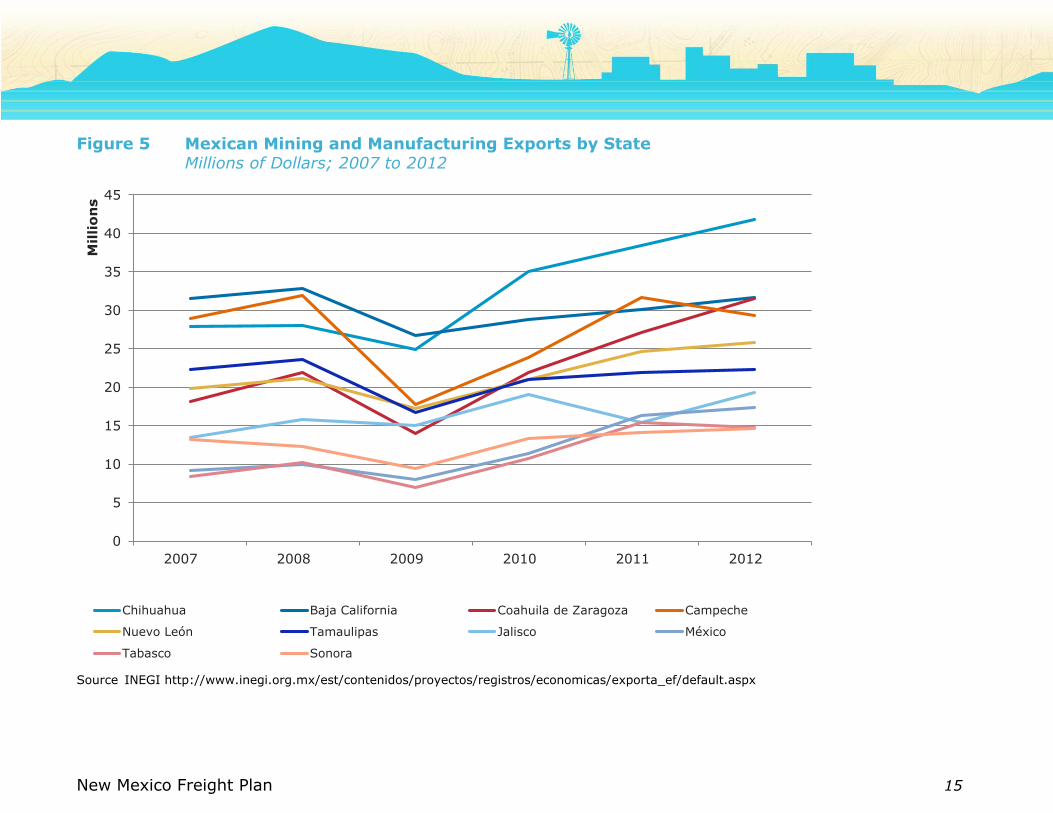
The rapid growth of export-driven industrial production within the state of Chihuahua creates a substantial opportunity for New
Mexico. The Mexican economy has shown remarkable resilience following the recession, and the resurgence of manufacturing within
Mexico is being led by the Mexican states that border Texas and New Mexico, including Chihuahua. According to data released by
INEGI(the Mexican Statistics Institute) in 2012, Chihuahua, with only 3 percent of the country’s population, accounted for 13 percent

New Mexico Freight Plan 14
of Mexico’s total exports (excluding petroleum extraction). This makes Chihuahua Mexico’s largest exporter.20 Since 2009, Chihuahua
has shown a rate of growth that is far higher than any other Mexican state as shown in Figure 5.
While exports from Mexico have traditionally been led from Maquilladora-based manufacturing facilities located near the border and
delivered by truck, the Mexican port and rail network has seen substantial improvement in recent years – opening opportunities for
new trading relationships. The Port of Manzanillo, which has a direct Ferromex rail connection to El Paso/Santa Teresa, has shown
consistent container growth and handled 2.1 million 20-foot equivalent units (TEU) in 2013.
The Mexican government has recently sought to open the rail system to greater competition including the open publication of prices
charged to customers for interconnections of routes owned by other companies. These reforms could broaden the range of
commodities that can be viably handled by rail. When combined with the Mexican government’s efforts to open energy production,
including shale gas reserves, to outside investment these changes could substantially expand rail freight within Mexico and the
potential for new export traffic to New Mexico.
20 “Chihuahua, Baja California y Coahuila, los estados más exportadores”, February 17, 2014 http://t21.com.mx/general/2014/02/17/chihuahua-
baja-california-coahuila-estados-mas-exportadores
New Mexico Freight Plan 15
Figure 5 Mexican Mining and Manufacturing Exports by State Millions of Dollars; 2007 to 2012
Source INEGI http://www.inegi.org.mx/est/contenidos/proyectos/registros/economicas/exporta_ef/default.aspx
0
5
10
15
20
25
30
35
40
45
2007 2008 2009 2010 2011 2012
Millio
ns
Chihuahua Baja California Coahuila de Zaragoza Campeche
Nuevo León Tamaulipas Jalisco México
Tabasco Sonora
New Mexico Freight Plan 16
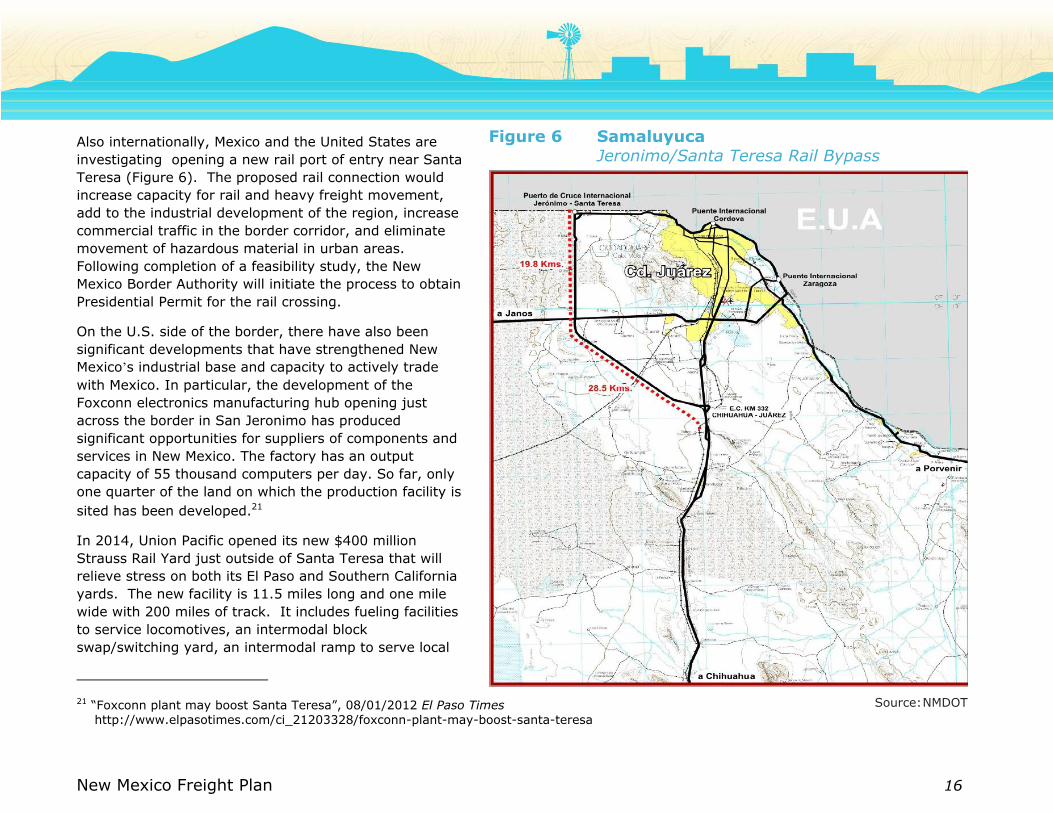
Also internationally, Mexico and the United States are
investigating opening a new rail port of entry near Santa
Teresa (Figure 6). The proposed rail connection would
increase capacity for rail and heavy freight movement,
add to the industrial development of the region, increase
commercial traffic in the border corridor, and eliminate
movement of hazardous material in urban areas.
Following completion of a feasibility study, the New
Mexico Border Authority will initiate the process to obtain
Presidential Permit for the rail crossing.
On the U.S. side of the border, there have also been
significant developments that have strengthened New
Mexico’s industrial base and capacity to actively trade
with Mexico. In particular, the development of the
Foxconn electronics manufacturing hub opening just
across the border in San Jeronimo has produced
significant opportunities for suppliers of components and
services in New Mexico. The factory has an output
capacity of 55 thousand computers per day. So far, only
one quarter of the land on which the production facility is
sited has been developed.21
In 2014, Union Pacific opened its new $400 million
Strauss Rail Yard just outside of Santa Teresa that will
relieve stress on both its El Paso and Southern California
yards. The new facility is 11.5 miles long and one mile
wide with 200 miles of track. It includes fueling facilities
to service locomotives, an intermodal block
swap/switching yard, an intermodal ramp to serve local
21 “Foxconn plant may boost Santa Teresa”, 08/01/2012 El Paso Times
http://www.elpasotimes.com/ci_21203328/foxconn-plant-may-boost-santa-teresa
Figure 6 Samaluyuca Jeronimo/Santa Teresa Rail Bypass
Source: NMDOT

New Mexico Freight Plan 17
customers, and capacity to handle 225,000 container lifts annually. Once fully operational in 2015, the Strauss Rail Yard is
forecasted to have a $48.5 million annual impact growing to $77.8 million in 2025.
The growth in trade and recent border development initiatives points to increased traffic and congestion at the border and connecting
facilities as well as congestion in proximity to distribution centers that handle cross border trade.
Trucking Industry Trends
For several years the United States has experienced an acute shortage of licensed truck drivers. Employment in trucking sharply
declined during the recession echoing a temporary fall off in freight demand led a number of qualified drivers to exit the industry. The
industry has been attempting to recover ever since but continues to suffer from a high turnover rate for large truckload (TL) carriers
(97 percent in 3Q2013).22 In addition, drivers have seen their real wages drop since the recession ended.23 The most recent state of
logistics report estimates a 30,000 driver shortage nationwide.
An additional challenge to allocating trucker labor resources is the changing hours of service restrictions that have been enacted by
the Federal Motor Carrier Administration (FMCSA). The regulations were intended to reduce incidence of fatigue-based crashes.
Recent research completed by Washington State University supports the thesis that the FMCSA’s new restart rule promulgated as
part of the Hours of Service of Drivers Final Rule has measureable fatigue reduction benefits.24
For New Mexico, the nationwide trucking shortage has significant implications. Truckers are by nature a mobile workforce, so a
national shortage is likely to have impacts on every state. Truckers will fill more lucrative positions; however, more utilitarian or
lower margin trucking jobs will become difficult to fill.
Rail Industry Trends
New Mexico’s position as a crossroads within the national freight rail network presents both opportunities and challenges for the
State. On one hand, these rail lines generate significant revenues for the railroads, which means that the lines will attract capital
spending for maintenance and expansion. On the other hand, the trains themselves are moving fast and bound for long-distance
22 https://www.joc.com/sites/default/files/u64286/Truck%20Driver%20Turnover%203Q2013.jpg
23 http://www.truckinginfo.com/blog/on-the-road/story/2013/09/why-drivers-do-not-believe-there-s-a-driver-shortage.aspx and http://www.truckinginfo.com/news/story/2013/09/atri-releases-updated-operation-costs-of-trucking-report.aspx
24 “Field Study on the Efficacy of the New Restart Provision for Hours of Service”, January 2014, Federal Motor Carrier Safety Administration
New Mexico Freight Plan 18
markets. This means that rail shippers in New Mexico will have to struggle harder to attract industrial development or initiate new or
expanded service within the State. Several current industry trends impact the development of freight rail in New Mexico.
Truck Size and Weight
Truck size and weight limits on Federal highways have been largely static since 1991, when Intermodal Surface Transportation
Efficiency Act of 1991 (ISTEA) prohibited states from increasing the size and weight of trucks beyond what they already allowed.
If truck size and weight limits were increased, it could potentially lead to significant mode shift from rail to truck for certain
commodity types and could impact rail industry financial performance, particularly short line and regional railroads.
286K Rail
A critical concern is the need to upgrade track to handle the 286,000-pound railcars that have become the industry standard. This
makes it increasingly difficult for shortline railroads to competitively handle certain types of traffic, as much of the shortline system is
inadequate to handle the new standard. While most Class I tracks and bridges are capable of carrying 286,000-pound railcars (some
are even designed to 315,000-pound standards), about half of shortline and regional railroad tracks are designed only for the old
industry standard of 263,000-pound cars. In New Mexico, lack of 286,000-pound-capable track limits access to the transcontinental
rail network for shippers located in areas not served by a Class I railroad, forcing them to use trucks to access markets. Only a
fraction of shortline track in New Mexico is 286,000-pound capable, including the Southwestern Railroad’s (SWRR)Clovis Line and
Texas-New Mexico Railroad (TNMR) track between Monahans, Texas and Hobbs, New Mexico. Santa Fe Southern Railway (SFS) track
is limited to 200,000 pounds and both Arizona Eastern Railroad (AZER) track and the portion of TNMR track between Hobbs and
Lovington have a maximum weight restriction of 263,000 pounds. In the longer term, some shortlines may not remain viable without
upgrading to 286,000-pound capacity, further limiting options for the State’s rail shippers.
Viability of Small Rail Shippers
Smaller rail shipments, what the railroads refer to as “carload” business, in the aggregate can represent significant revenue for the
railroads, but are more time consuming and expensive to handle, and can result in inconsistent rail service to shippers.
Additionally, many New Mexico shippers are located on major long-distance freight routes and serving these local shippers may
create conflicts with long-distance freight trains. Economies of scale have driven an increased prioritization of unit trains in the rail
industry that is making it harder for single carload shippers to access the system. This occurs for a number of commodities including
crude oil. If carload shippers are pushed aside by more profitable unit trains, this may mean that shippers have little choice but to
ship by truck. In New Mexico, this would raise shipping costs for shortline shippers and could divert natural rail cargo to truck. It
would also adversely impact shortline financial performance.
New Mexico Freight Plan 19
Trade and Supply Chain Trends
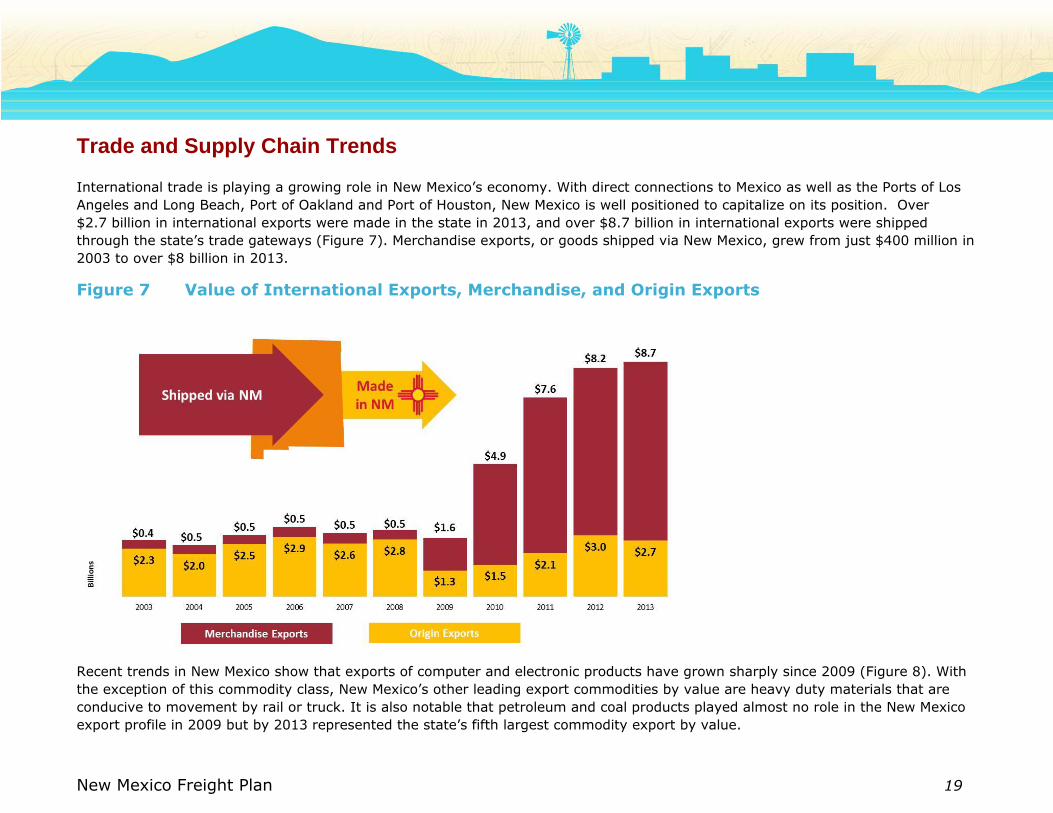
International trade is playing a growing role in New Mexico’s economy. With direct connections to Mexico as well as the Ports of Los
Angeles and Long Beach, Port of Oakland and Port of Houston, New Mexico is well positioned to capitalize on its position. Over
$2.7 billion in international exports were made in the state in 2013, and over $8.7 billion in international exports were shipped
through the state’s trade gateways (Figure 7). Merchandise exports, or goods shipped via New Mexico, grew from just $400 million in
2003 to over $8 billion in 2013.
Figure 7 Value of International Exports, Merchandise, and Origin Exports
Recent trends in New Mexico show that exports of computer and electronic products have grown sharply since 2009 (Figure 8). With
the exception of this commodity class, New Mexico’s other leading export commodities by value are heavy duty materials that are
conducive to movement by rail or truck. It is also notable that petroleum and coal products played almost no role in the New Mexico
export profile in 2009 but by 2013 represented the state’s fifth largest commodity export by value.
New Mexico Freight Plan 20
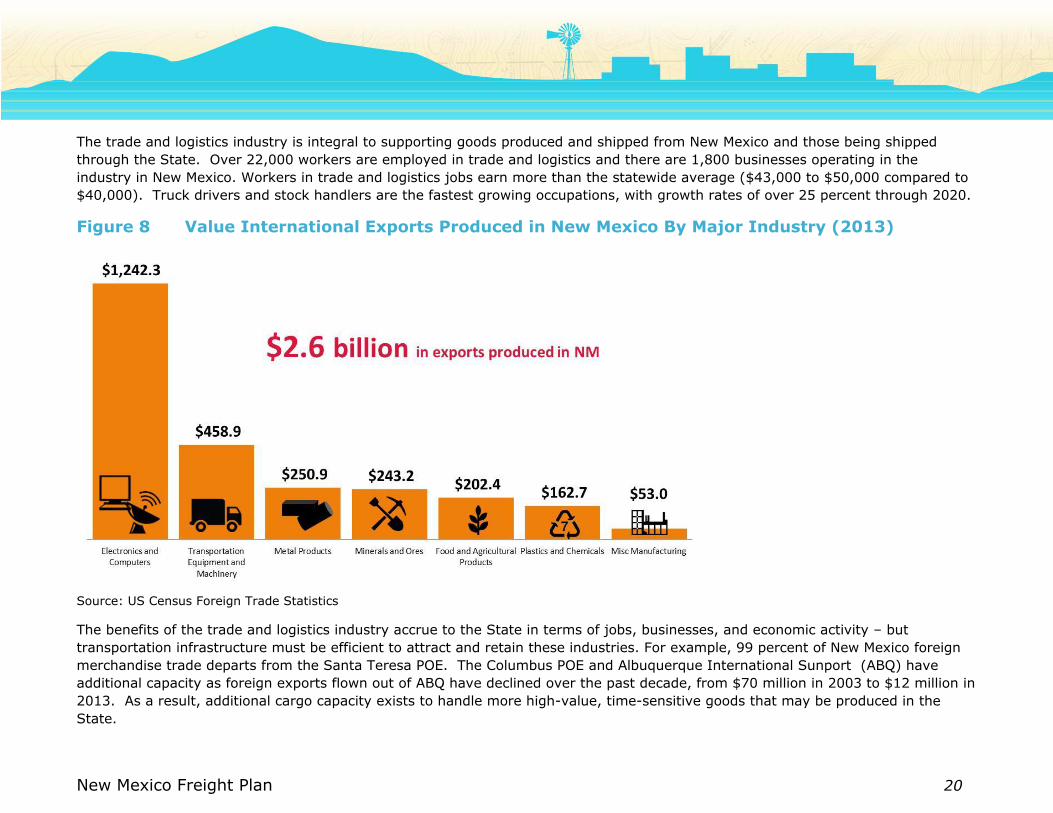
The trade and logistics industry is integral to supporting goods produced and shipped from New Mexico and those being shipped
through the State. Over 22,000 workers are employed in trade and logistics and there are 1,800 businesses operating in the
industry in New Mexico. Workers in trade and logistics jobs earn more than the statewide average ($43,000 to $50,000 compared to
$40,000). Truck drivers and stock handlers are the fastest growing occupations, with growth rates of over 25 percent through 2020.
Figure 8 Value International Exports Produced in New Mexico By Major Industry (2013)
Source: US Census Foreign Trade Statistics
The benefits of the trade and logistics industry accrue to the State in terms of jobs, businesses, and economic activity – but
transportation infrastructure must be efficient to attract and retain these industries. For example, 99 percent of New Mexico foreign
merchandise trade departs from the Santa Teresa POE. The Columbus POE and Albuquerque International Sunport (ABQ) have
additional capacity as foreign exports flown out of ABQ have declined over the past decade, from $70 million in 2003 to $12 million in
2013. As a result, additional cargo capacity exists to handle more high-value, time-sensitive goods that may be produced in the
State.
New Mexico Freight Plan 21
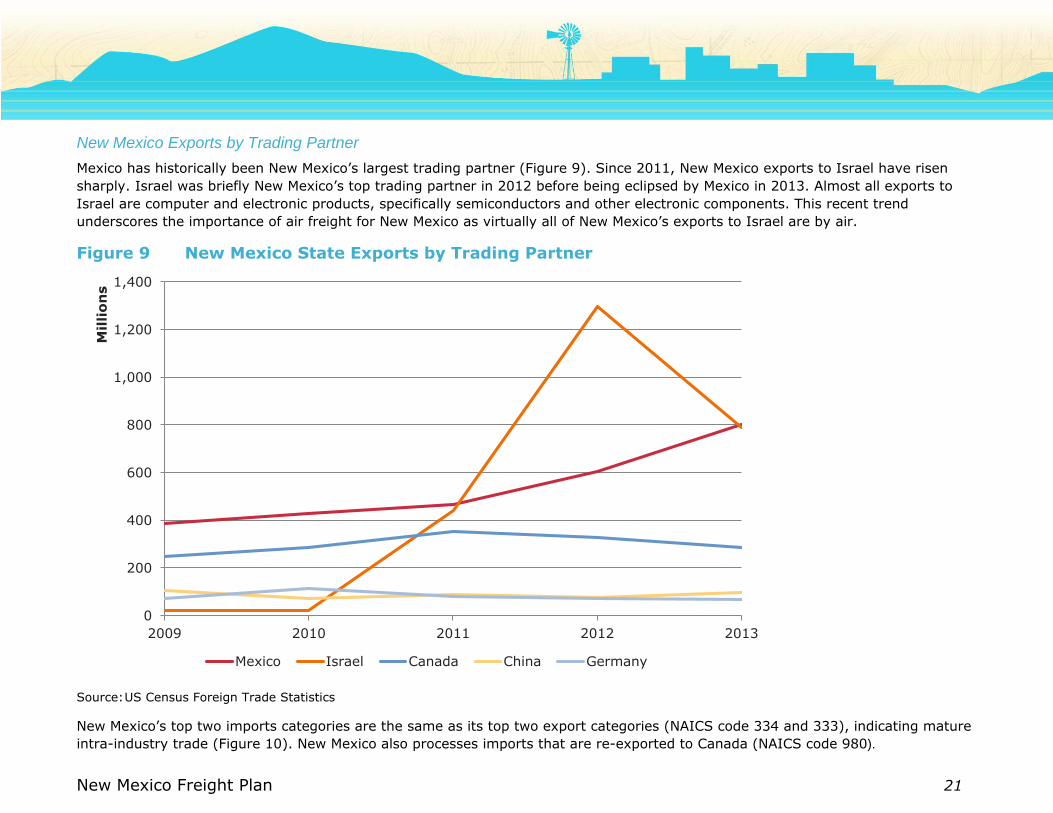
New Mexico Exports by Trading Partner
Mexico has historically been New Mexico’s largest trading partner (Figure 9). Since 2011, New Mexico exports to Israel have risen
sharply. Israel was briefly New Mexico’s top trading partner in 2012 before being eclipsed by Mexico in 2013. Almost all exports to
Israel are computer and electronic products, specifically semiconductors and other electronic components. This recent trend
underscores the importance of air freight for New Mexico as virtually all of New Mexico’s exports to Israel are by air.
Figure 9 New Mexico State Exports by Trading Partner
Source: US Census Foreign Trade Statistics
New Mexico’s top two imports categories are the same as its top two export categories (NAICS code 334 and 333), indicating mature
intra-industry trade (Figure 10). New Mexico also processes imports that are re-exported to Canada (NAICS code 980).
0
200
400
600
800
1,000
1,200
1,400
2009 2010 2011 2012 2013
Millio
ns
Mexico Israel Canada China Germany
New Mexico Freight Plan 22
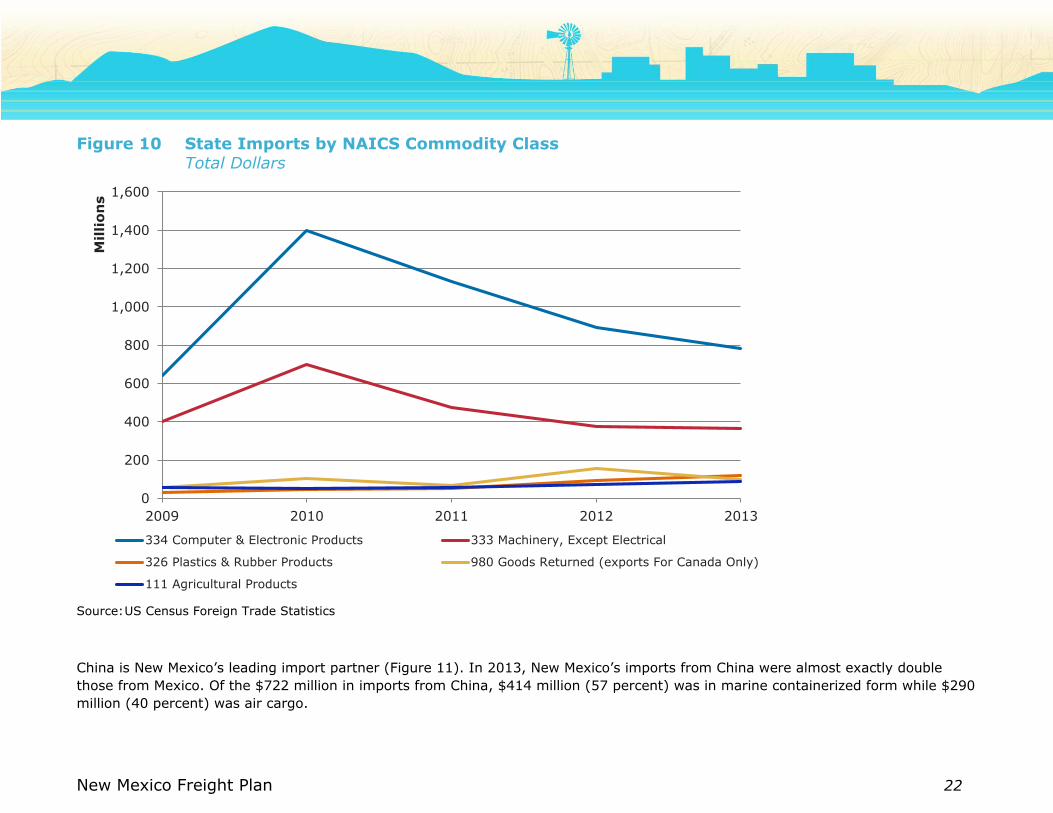
Figure 10 State Imports by NAICS Commodity Class Total Dollars
Source: US Census Foreign Trade Statistics
China is New Mexico’s leading import partner (Figure 11). In 2013, New Mexico’s imports from China were almost exactly double
those from Mexico. Of the $722 million in imports from China, $414 million (57 percent) was in marine containerized form while $290
million (40 percent) was air cargo.
0
200
400
600
800
1,000
1,200
1,400
1,600
2009 2010 2011 2012 2013
Millio
ns
334 Computer & Electronic Products 333 Machinery, Except Electrical
326 Plastics & Rubber Products 980 Goods Returned (exports For Canada Only)
111 Agricultural Products
New Mexico Freight Plan 23
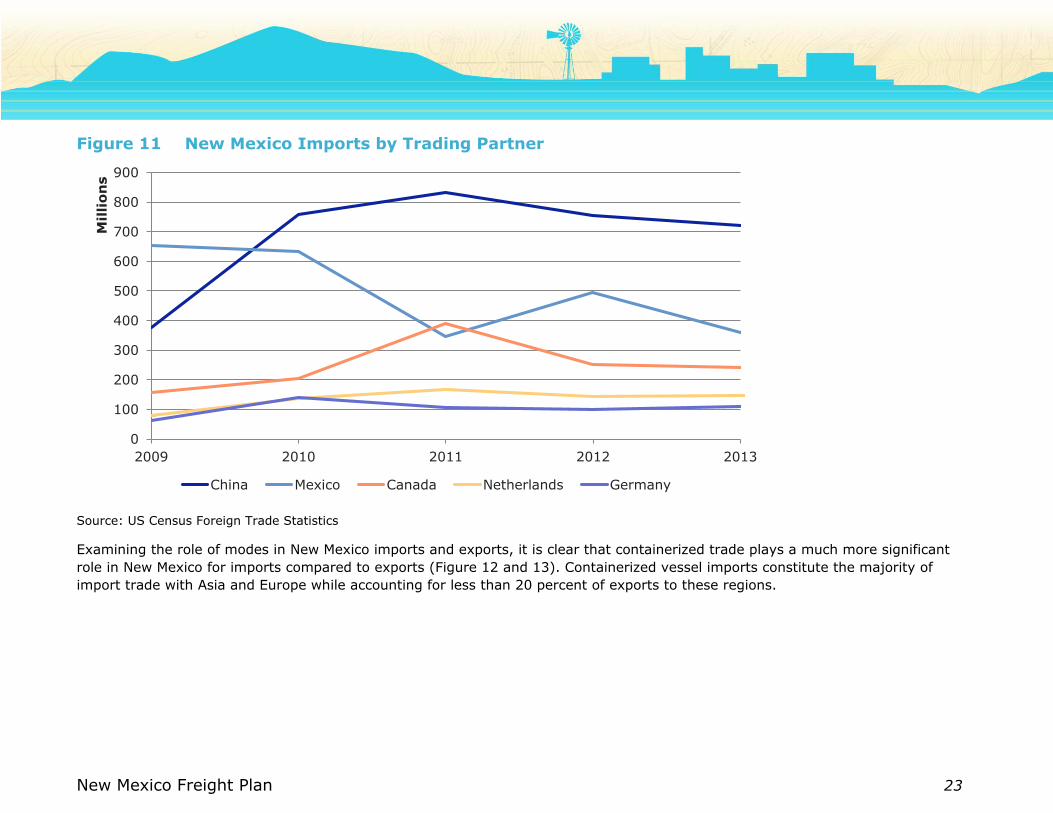
Figure 11 New Mexico Imports by Trading Partner
Source: US Census Foreign Trade Statistics
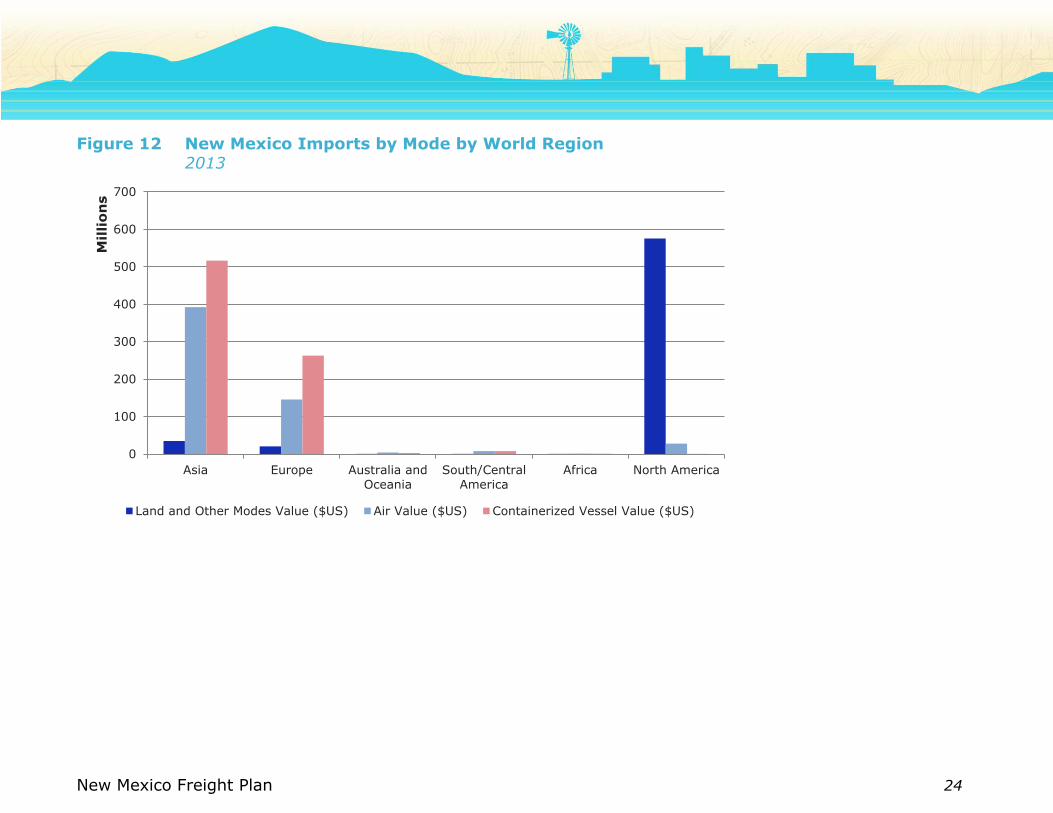
Examining the role of modes in New Mexico imports and exports, it is clear that containerized trade plays a much more significant
role in New Mexico for imports compared to exports (Figure 12 and 13). Containerized vessel imports constitute the majority of
import trade with Asia and Europe while accounting for less than 20 percent of exports to these regions.
0
100
200
300
400
500
600
700
800
900
2009 2010 2011 2012 2013
Millio
ns
China Mexico Canada Netherlands Germany
New Mexico Freight Plan 24
Figure 12 New Mexico Imports by Mode by World Region 2013
0
100
200
300
400
500
600
700
Asia Europe Australia and
Oceania
South/Central
America
Africa North America
Millio
ns
Land and Other Modes Value ($US) Air Value ($US) Containerized Vessel Value ($US)

New Mexico Freight Plan 25
Figure 13 New Mexico Exports by Mode by World Region
Infrastructure Factors
Several major infrastructure mega-projects underway around the world are changing the dynamics of global trade and will potentially
impact trade between New Mexico and its trading partners. The most well-known infrastructure megaproject is the expansion of the
Panama Canal to accommodate larger vessels. If, as predicted, the expansion of the Canal causes some rerouting of traffic from the
West Coast to the East Coast, it could potentially relieve pressure on the East-West rail network running through New Mexico and
open up greater opportunity for local carload shippers. The pattern of trade following canal expansion also depends on expansions of
East Coast ports. The extent of diversion could also be impacted by expansions planned or underway at the major Mexican ports of
Lazaro Cadenas, Manzanillo as well as smaller ports such as Mazatlan, Topolobambo and Guaymas.
Infrastructure will also be impacted by the privatization of Pemex (the Mexican state-owned petroleum company), which will allow
outside investment to develop resources that have been out of the technological range of Mexico’s state controlled energy monopoly.
0
200
400
600
800
1,000
1,200
Asia Europe Australia and
Oceania
South/Central
America
Africa North America
Millio
ns
Land and Other Modes ($US) Air Value ($US) Containerized Vessel Value ($US)
New Mexico Freight Plan 26
The privatization of Pemex will support offshore development in the Gulf Coast but also development of non-traditional oil and gas
such as shale gas.25 The majority of Mexico’s shale gas reserves are south of the Texas border; therefore, the impacts on New Mexico
are likely to be indirect.
Warehousing and Distribution Center Trends
Growth of e-commerce
Through the growth of e-commerce, New Mexico consumers are playing a more direct role in steering freight logistics planning in real
time. Integrators such as – UPS and FedEx – by expedited airfreight or ground, coordinate deliveries depending upon the delivery
timeframe desired by the consumer and level of shipping costs the consumer is willing to pay. The rise of E-commerce orders
through company-owned distribution centers, or through resellers like Amazon.com has resulted in a decrease in package size and an
increase in the volume of small packages moving through the integrator network.
Omnichannel commerce refers to retailers’ efforts to seamlessly integrate their store and e-commerce selling channels.26 It
represents a strategy utilized by online retailers. It often requires same day delivery. The extent to which broader numbers of
retailers can move into omnichannel commerce is still uncertain. If current trends towards e-commerce grow, it will likely result in an
excess of retail space, which could potentially be rededicated as industrial distribution space.
Transloading
Over the past decade, big box retailers and large importers of fast moving consumer goods, in particular, have adopted an
alternative supply chain and distribution strategy known as transloading. Transloading refers to the process in which a logistics
service provider transfers the contents of an import container directly into a 53-foot domestic truck or rail container in a warehouse
near a gateway port for onward movement to an U.S. inland point. Transloading delivers a lower per unit product cost for inland
transportation. The majority of transload locations have been in close proximity to major maritime ports. For this reason, New
Mexico is unlikely to become a major transload center.
25 “Shale Boom Forces Pemex to Find New Buyers Mexico's Oil Firm Seeks Sales in Europe, Elsewhere”,
http://online.wsj.com/news/articles/SB10001424052702304856504579338512815579366
26 Omnichannel navigator, James A. Cooke, Editor, Supply Chain Quarterly from the Quarter 1 2014
New Mexico Freight Plan 27
Conditions and Performance of the Freight Network
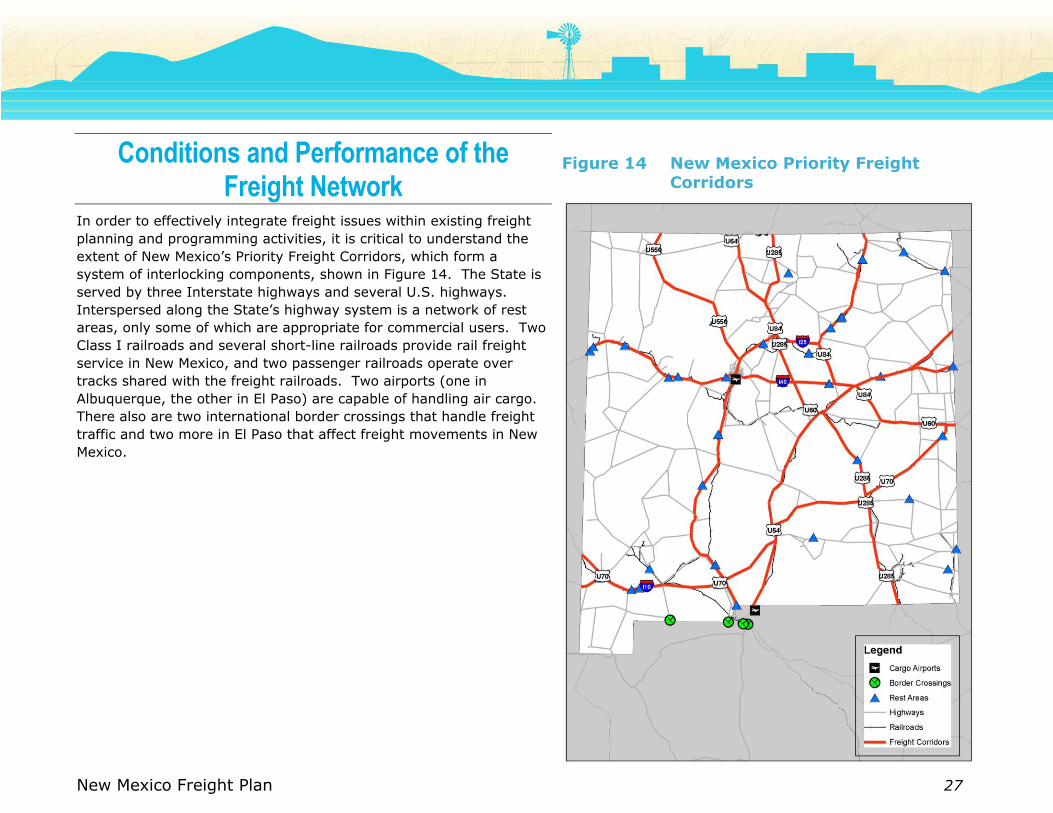
In order to effectively integrate freight issues within existing freight
planning and programming activities, it is critical to understand the
extent of New Mexico’s Priority Freight Corridors, which form a
system of interlocking components, shown in Figure 14. The State is
served by three Interstate highways and several U.S. highways.
Interspersed along the State’s highway system is a network of rest
areas, only some of which are appropriate for commercial users. Two
Class I railroads and several short-line railroads provide rail freight
service in New Mexico, and two passenger railroads operate over
tracks shared with the freight railroads. Two airports (one in
Albuquerque, the other in El Paso) are capable of handling air cargo.
There also are two international border crossings that handle freight
traffic and two more in El Paso that affect freight movements in New
Mexico.
Figure 14 New Mexico Priority Freight Corridors
New Mexico Freight Plan 28
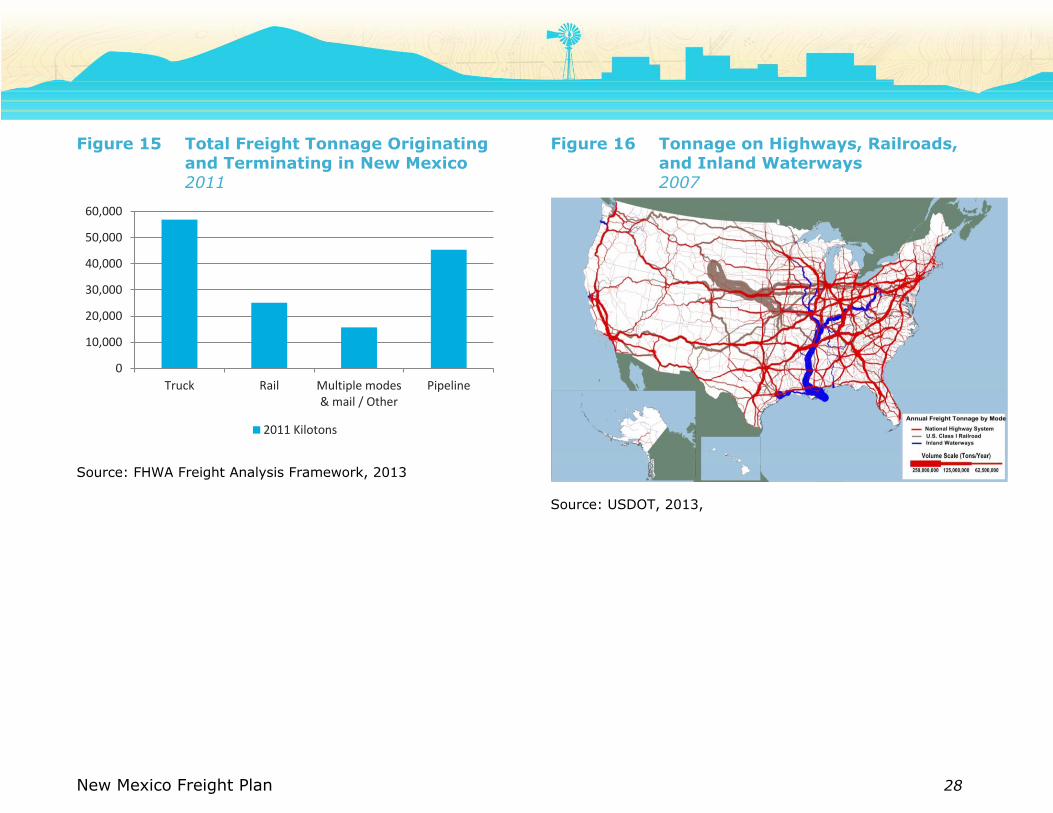
Figure 15 Total Freight Tonnage Originating and Terminating in New Mexico 2011
Source: FHWA Freight Analysis Framework, 2013
Figure 16 Tonnage on Highways, Railroads, and Inland Waterways 2007
Source: USDOT, 2013,
http://ops.fhwa.dot.gov/freight/freight_analysis/
nat_freight_stats/tonhwyrrww2007.htm
0
10,000
20,000
30,000
40,000
50,000
60,000
Truck Rail Multiple modes& mail / Other
Pipeline
2011 Kilotons
New Mexico Freight Plan 29
Highways New Mexico’s highway freight system consists of several primary freight corridors, shown in Figure 17. Interstates 10 and 40 are the
major east-west freight corridors in New Mexico. Interstate 25 provides north-south access from the Texas border to Colorado. In
addition to the Interstates, there are several U.S. highways that connect industries and population centers in other parts of the State
to these mainline facilities.
Clearly, the Interstates are the dominant corridor for truck traffic, both for movements originating or terminating in the State as well
as those simply passing through. Truck traffic is heavily concentrated in the Albuquerque area, and to a lesser extent in Las Cruces
(which is situated at the junction of I-10 and I-25), Farmington (which is a population center for the Four Corners region), and Santa
Fe. However, there are a number of emerging routes that serve key industries, such as U.S. 550, 285, and 70. These highways are
especially important to increasing NAFTA-related trade as well as the oil and gas industry. Other key industries such as mining,
agriculture, and manufacturing are also generating more loads on these corridors. In many cases these roads are not capable of
absorbing large increases in truck traffic.
Highway Movements
In 2002, between 15,000 and 25,000 trucks per day used Interstates 10 and 40. By 2035, these two routes are expected to carry
between 25,000 and 46,000 trucks per day. Although it does not carry as much truck traffic as Interstates 10 and 40, Interstate 25
also is expected to experience significant truck volume growth in the future, particularly between Albuquerque and Santa Fe. Other
major freight corridors will experience large increases in truck traffic by 2035 even though they will still carry comparatively modest
traffic compared to the Interstates. This growth in truck traffic will add additional stress to the transportation system at a time when
the State already is having a difficult time keeping up with maintenance on its primary freight corridors (especially I-10 and I-40).
There are heavy concentrations of truck traffic in New Mexico’s urbanized areas, especially Albuquerque, which is home to
approximately 42 percent of the State’s population.27 Truck traffic also is concentrated around Las Cruces (the second largest metro
area in the State), Farmington, and Santa Fe.
Growth in freight demand (both within and outside of New Mexico) will add more trucks to these corridors. Figure 18 compares 2002
truck volumes on these key highways to anticipated (2035) volumes. The blue lines represent 2002 volumes, while the red lines
correspond to forecast truck traffic; the wider the lines, the greater the number of trucks using the road. As can be seen in
27 As of 2007; based on U.S. Census population estimates for the Albuquerque Metropolitan Statistical Area and the State of New Mexico.
New Mexico Freight Plan 30
Figure 18, I-40 is expected to take the lion’s share of this growth, although there are regional “pockets” of growing truck volumes
along U.S. 285, U.S. 84, U.S. 550, U.S. 60, U.S. 70, and U.S. 54.
It also is important to analyze the types of truck trips being made in New Mexico and their anticipated future growth. As a “bridge
state,” New Mexico is particularly impacted by trucks that are simply passing through the State. Interstates 10 and 40 handled
4,600 and 5,500 through trucks per day.28 The increase in total truck trips in New Mexico implies significant growth in through traffic
in the State and will have an impact on the State’s freight transportation system.
28 New Mexico Through Truck Movements, Memorandum dated January 28, 2007.

New Mexico Freight Plan 31
Figure 18 Current and Projected Truck Traffic 2002-2035
Figure 17 New Mexico Highway System
New Mexico Freight Plan 32
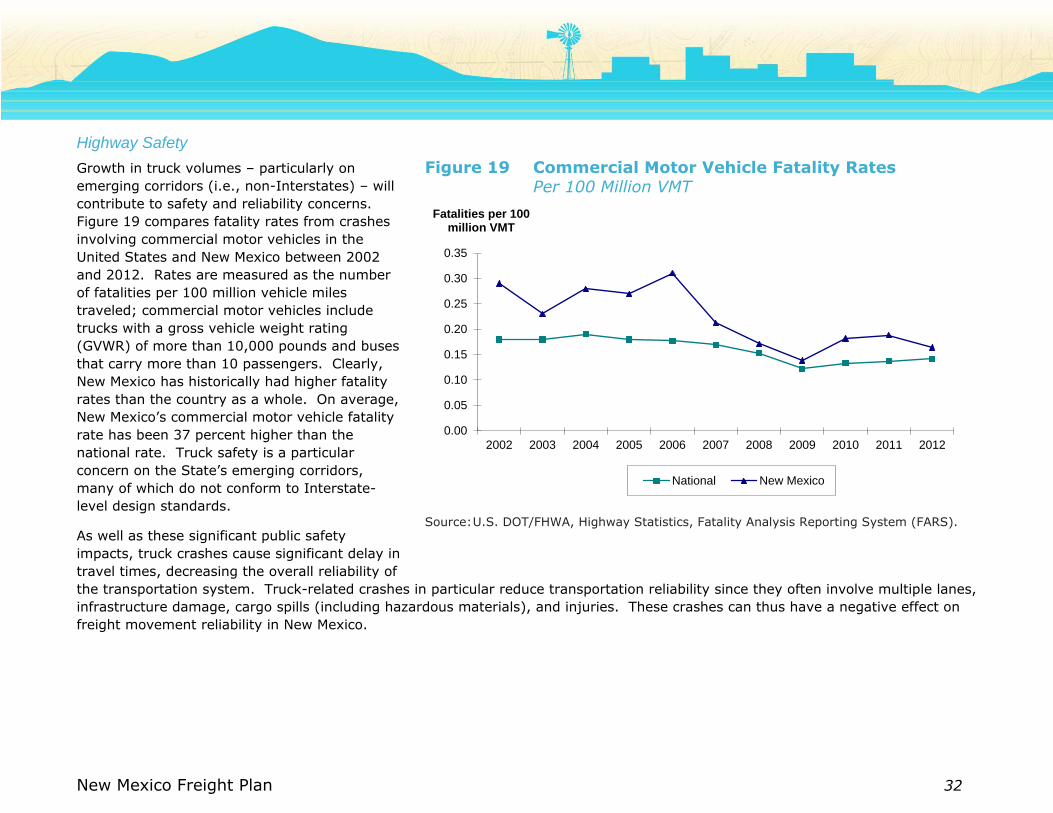
Highway Safety
Growth in truck volumes – particularly on
emerging corridors (i.e., non-Interstates) – will
contribute to safety and reliability concerns.
Figure 19 compares fatality rates from crashes
involving commercial motor vehicles in the
United States and New Mexico between 2002
and 2012. Rates are measured as the number
of fatalities per 100 million vehicle miles
traveled; commercial motor vehicles include
trucks with a gross vehicle weight rating
(GVWR) of more than 10,000 pounds and buses
that carry more than 10 passengers. Clearly,
New Mexico has historically had higher fatality
rates than the country as a whole. On average,
New Mexico’s commercial motor vehicle fatality
rate has been 37 percent higher than the
national rate. Truck safety is a particular
concern on the State’s emerging corridors,
many of which do not conform to Interstate-
level design standards.
As well as these significant public safety
impacts, truck crashes cause significant delay in
travel times, decreasing the overall reliability of
the transportation system. Truck-related crashes in particular reduce transportation reliability since they often involve multiple lanes,
infrastructure damage, cargo spills (including hazardous materials), and injuries. These crashes can thus have a negative effect on
freight movement reliability in New Mexico.
Figure 19 Commercial Motor Vehicle Fatality Rates Per 100 Million VMT
Source: U.S. DOT/FHWA, Highway Statistics, Fatality Analysis Reporting System (FARS).
0.00
0.05
0.10
0.15
0.20
0.25
0.30
0.35
2002 2003 2004 2005 2006 2007 2008 2009 2010 2011 2012
Fatalities per 100 million VMT
National New Mexico
New Mexico Freight Plan 33
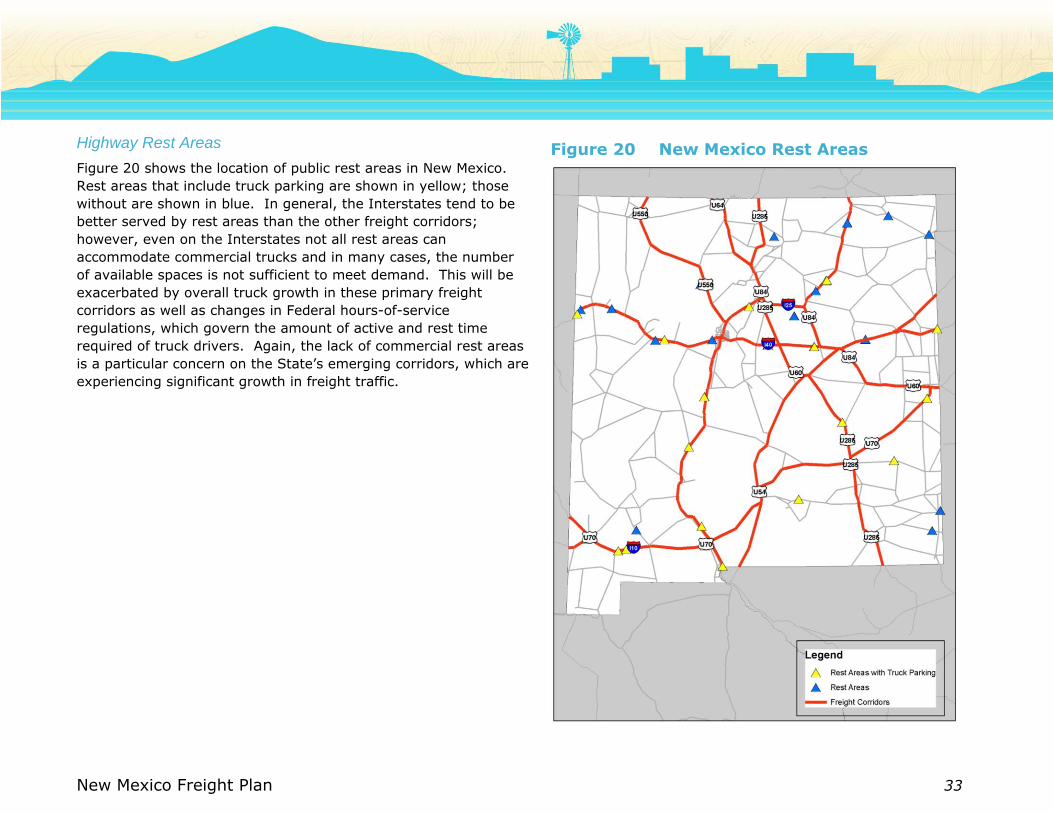
Highway Rest Areas
Figure 20 shows the location of public rest areas in New Mexico.
Rest areas that include truck parking are shown in yellow; those
without are shown in blue. In general, the Interstates tend to be
better served by rest areas than the other freight corridors;
however, even on the Interstates not all rest areas can
accommodate commercial trucks and in many cases, the number
of available spaces is not sufficient to meet demand. This will be
exacerbated by overall truck growth in these primary freight
corridors as well as changes in Federal hours-of-service
regulations, which govern the amount of active and rest time
required of truck drivers. Again, the lack of commercial rest areas
is a particular concern on the State’s emerging corridors, which are
experiencing significant growth in freight traffic.
Figure 20 New Mexico Rest Areas

New Mexico Freight Plan 34
Bridges and Culverts
There are currently 3,932 bridges and culverts on the New Mexico Highway System. The majority of these are 40 years old or older
(Figure 21). NMDOT currently maintains inspection reports for 3,001 bridges. Ninety-five percent (95 percent) of the structures on
the National Highway System (NHS) and 88 percent on non-NHS routes are in fair or better condition.29
Figure 21 Distribution of Bridges by Age
29 New Mexico Department of Transportation, 2013 Annual Report.
279319
421
703
840
541
230
511
77
7 40
100
200
300
400
500
600
700
800
900
0-9 10-19 20-29 30-39 40-49 50-59 60-69 70-79 80-89 90-99 100-109
No
. of
Stru
ctu
res
Age of Structure
New Mexico Freight Plan 35
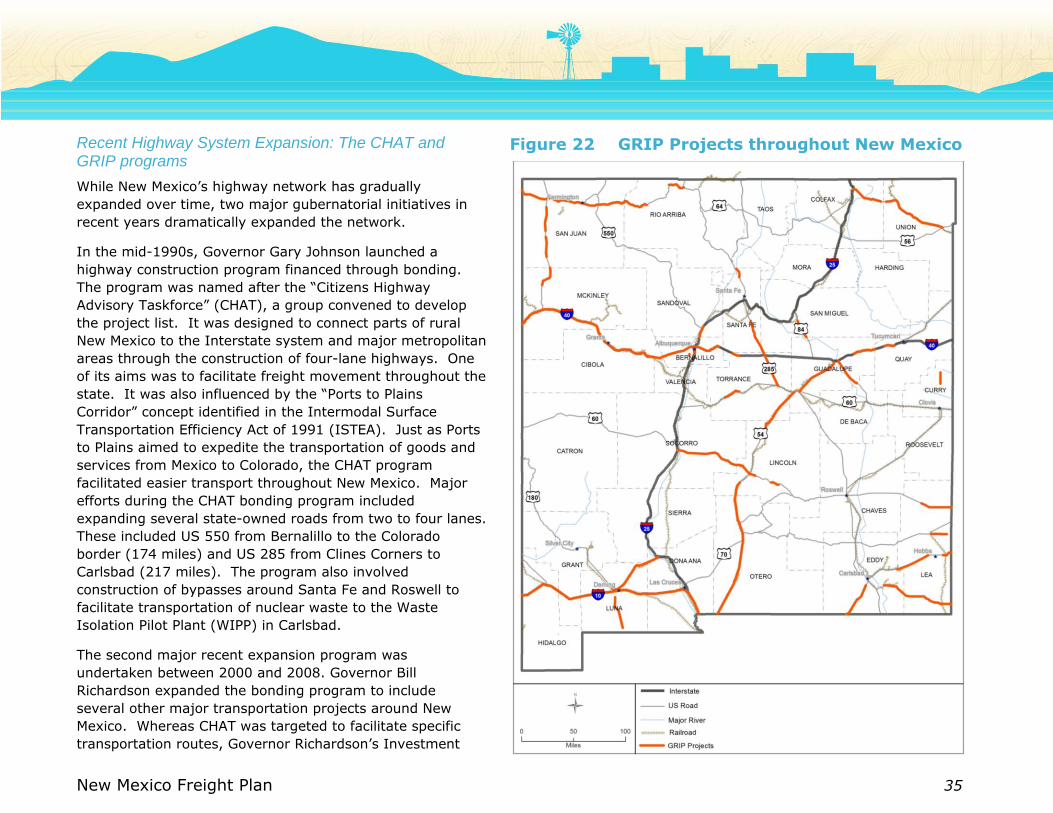
Recent Highway System Expansion: The CHAT and GRIP programs
While New Mexico’s highway network has gradually
expanded over time, two major gubernatorial initiatives in
recent years dramatically expanded the network.
In the mid-1990s, Governor Gary Johnson launched a
highway construction program financed through bonding.
The program was named after the “Citizens Highway
Advisory Taskforce” (CHAT), a group convened to develop
the project list. It was designed to connect parts of rural
New Mexico to the Interstate system and major metropolitan
areas through the construction of four-lane highways. One
of its aims was to facilitate freight movement throughout the
state. It was also influenced by the “Ports to Plains
Corridor” concept identified in the Intermodal Surface
Transportation Efficiency Act of 1991 (ISTEA). Just as Ports
to Plains aimed to expedite the transportation of goods and
services from Mexico to Colorado, the CHAT program
facilitated easier transport throughout New Mexico. Major
efforts during the CHAT bonding program included
expanding several state-owned roads from two to four lanes.
These included US 550 from Bernalillo to the Colorado
border (174 miles) and US 285 from Clines Corners to
Carlsbad (217 miles). The program also involved
construction of bypasses around Santa Fe and Roswell to
facilitate transportation of nuclear waste to the Waste
Isolation Pilot Plant (WIPP) in Carlsbad.
The second major recent expansion program was
undertaken between 2000 and 2008. Governor Bill
Richardson expanded the bonding program to include
several other major transportation projects around New
Mexico. Whereas CHAT was targeted to facilitate specific
transportation routes, Governor Richardson’s Investment
Figure 22 GRIP Projects throughout New Mexico
New Mexico Freight Plan 36
Partnership (GRIP) was designed to spur economic development statewide. Major GRIP projects included the I-40/Coors Interchange
in Albuquerque, expanding 68 miles of US 491 on the Navajo Nation to four lanes, and developing the Rail Runner commuter train
service from Belen to Santa Fe (Figure 22).
The combined cost of the CHAT and GRIP bonding programs totaled $1.6 billion. All of the bonds for these projects are anticipated to
be retired by 2027. The current debt service level ranges from $136 million to $177 million per year, paid through a combination of
State Road Revenues (primarily the gasoline excise tax, special fuel excise tax, weight distance tax, and Motor vehicle registration
fees) and Federal funds from the Federal-Aid Highway Program.30
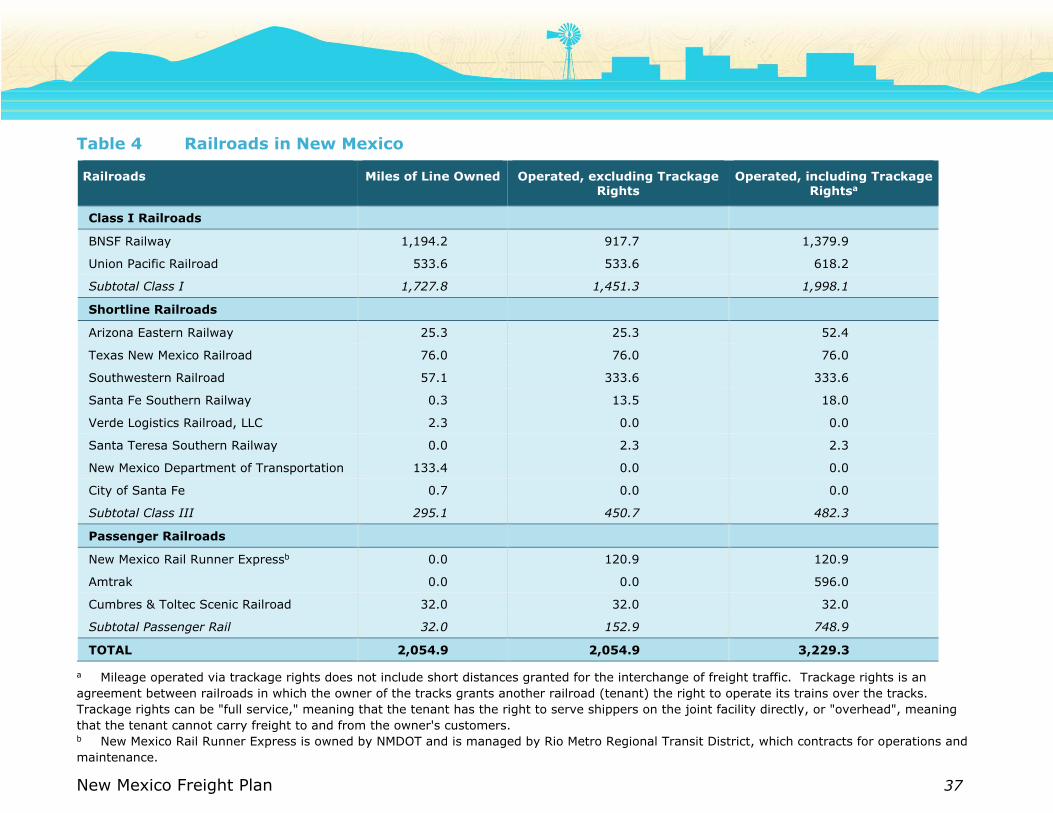
Freight Rail System The New Mexico rail system includes 2,055 miles of railroad right-of-way, listed in Table 4 and shown in Figure 23. Two Class I
railroads, BNSF Railway (BNSF) and Union Pacific (UP), own 84 percent of the State’s railroad right-of-way and operate two major
transcontinental rail corridors critical for the movement of goods on the national freight network. Five Class III railroads (generally
referred to as shortline railroads) own 8 percent of the state’s rail network and provide rail connectivity to support local industries.
The system also includes two long-distance Amtrak routes (the Southwest Chief and the Sunset Limited), a commuter railroad (the
New Mexico Rail Runner Express) serving the cities of Belen, Los Lunas, Albuquerque, and Santa Fe, and the narrow gauge Cumbres
and Toltec Scenic Railroad, a tourist excursion steam train that operates along the New Mexico-Colorado state border. There are also
two private freight railroads that transport coal mined in the northwest part of the state.
30 New Mexico Finance Authority, 2013
New Mexico Freight Plan 37
Table 4 Railroads in New Mexico
Railroads Miles of Line Owned Operated, excluding Trackage Rights
Operated, including Trackage Rightsa
Class I Railroads
BNSF Railway 1,194.2 917.7 1,379.9
Union Pacific Railroad 533.6 533.6 618.2
Subtotal Class I 1,727.8 1,451.3 1,998.1
Shortline Railroads
Arizona Eastern Railway 25.3 25.3 52.4
Texas New Mexico Railroad 76.0 76.0 76.0
Southwestern Railroad 57.1 333.6 333.6
Santa Fe Southern Railway 0.3 13.5 18.0
Verde Logistics Railroad, LLC 2.3 0.0 0.0
Santa Teresa Southern Railway 0.0 2.3 2.3
New Mexico Department of Transportation 133.4 0.0 0.0
City of Santa Fe 0.7 0.0 0.0
Subtotal Class III 295.1 450.7 482.3
Passenger Railroads
New Mexico Rail Runner Expressb 0.0 120.9 120.9
Amtrak 0.0 0.0 596.0
Cumbres & Toltec Scenic Railroad 32.0 32.0 32.0
Subtotal Passenger Rail 32.0 152.9 748.9
TOTAL 2,054.9 2,054.9 3,229.3
a Mileage operated via trackage rights does not include short distances granted for the interchange of freight traffic. Trackage rights is an
agreement between railroads in which the owner of the tracks grants another railroad (tenant) the right to operate its trains over the tracks.
Trackage rights can be "full service," meaning that the tenant has the right to serve shippers on the joint facility directly, or "overhead", meaning
that the tenant cannot carry freight to and from the owner's customers. b New Mexico Rail Runner Express is owned by NMDOT and is managed by Rio Metro Regional Transit District, which contracts for operations and
maintenance.
New Mexico Freight Plan 38
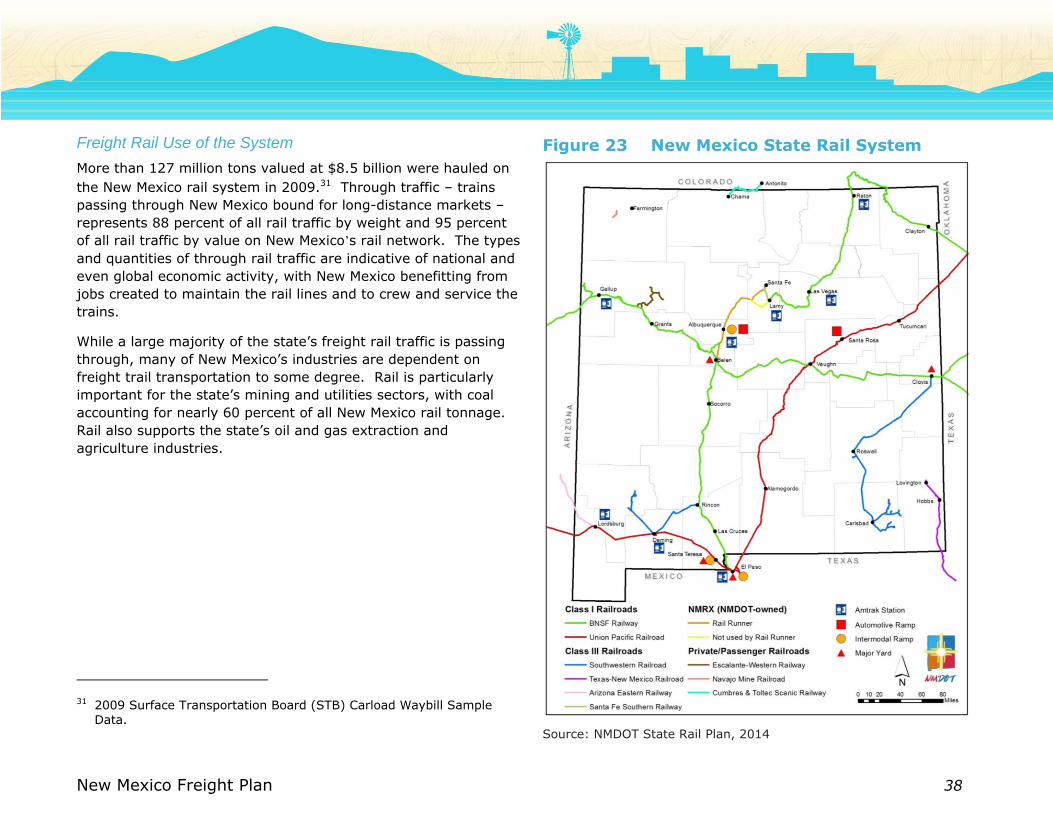
Freight Rail Use of the System
More than 127 million tons valued at $8.5 billion were hauled on
the New Mexico rail system in 2009.31 Through traffic – trains
passing through New Mexico bound for long-distance markets –
represents 88 percent of all rail traffic by weight and 95 percent
of all rail traffic by value on New Mexico’s rail network. The types
and quantities of through rail traffic are indicative of national and
even global economic activity, with New Mexico benefitting from
jobs created to maintain the rail lines and to crew and service the
trains.
While a large majority of the state’s freight rail traffic is passing
through, many of New Mexico’s industries are dependent on
freight trail transportation to some degree. Rail is particularly
important for the state’s mining and utilities sectors, with coal
accounting for nearly 60 percent of all New Mexico rail tonnage.
Rail also supports the state’s oil and gas extraction and
agriculture industries.
31 2009 Surface Transportation Board (STB) Carload Waybill Sample
Data.
Figure 23 New Mexico State Rail System
Source: NMDOT State Rail Plan, 2014

New Mexico Freight Plan 39
Figure 24 New Mexico Freight Rail System Number of Tracks, 2011
Source: NM Railroads and Oak Ridge National Laboratory Rail Network
Analysis.
Rail Capacity and Operations Analysis
The New Mexico freight rail system is comprised of two Class I
railroads and four shortline railroads, providing connectivity to
the national rail system and the State’s rail-dependent industries.
Freight rail capacity and operational level of service are
dependent on three major factors:
Number of Tracks –There are 2,053 miles of rail operated in
New Mexico which comprise approximately 1.4 percent of the
rail network nationwide.32 Illustrated in Figure 24, about
81 percent of the New Mexico rail system is single-tracked with
sidings for trains to pass each other. With the exception of
9.3 miles west of Vaughn and 2.3 miles west of Fort Sumner,
the heavily-used BNSF Chicago-Los Angeles Transcon mainline
is double-tracked in New Mexico. The UP Sunset Route is
double-tracked in the State as well.
Control System – The three common types of traffic control
and signal technology that are in use in New Mexico include
Centralized Traffic Control (CTC), Automatic Block Signaling
(ABS), and manual (including Block Register Territory and Track
Warrant Control). The split between the three operations for
New Mexico rail is 54 percent, 10 percent, and 36 percent,
respectively. Figure 25 identifies the control type for each line.
The lines carrying the highest rail volumes, BNSF’s Transcon
and UP’s Sunset Route, use CTC. Volumes on the State’s
shortline railroads currently do not warrant advancement from a
manual control system.
32 Table 1-14: Miles of Freight Railroad Operated by Class of Railroad:
2008, BTS State Transportation Statistics 2009.

New Mexico Freight Plan 40
Figure 25 New Mexico Freight Rail System Control Type, 2011
Source: NM Railroads and Oak Ridge National Laboratory Rail Network
Analysis.
Figure 26 New Mexico Freight Rail System Flow Density, 2011
Source: NM Railroads and Oak Ridge National Laboratory Rail Network
Analysis.

New Mexico Freight Plan 41
Train Type/Mix – Approximately 88 percent
of the rail tonnage and 95 percent of the rail
shipment value that use the State’s network
are through traffic.33 Similarly, there are
limited intermodal operations in the State,
with one facility in Albuquerque and a second
facility just beyond the State border in El Paso,
Texas.34 Although the train type or mix
information was unavailable for individual
segments, Figure 26 depicts the density of rail
flows across the network. The volumes over
the BNSF Transcon corridor are significantly
higher than any other corridor.
A 2007 study of national rail freight
infrastructure capacity estimated the volume to
capacity ratio for all major freight corridors in
the United States, with rail capacities in the New
Mexico area shown in Figure 27.35 The two
locations in New Mexico with levels of service
(LOS) essentially at capacity correspond to the
two remaining single track locations on the BNSF
Transcon.
33 2009 STB Carload Waybill Sample Data.
34 This facility will be replaced by an intermodal facility near Santa Teresa in 2014.
35 Association of American Railroads, National Rail Freight Infrastructure Capacity and Investment Study, 2007.
Figure 27 New Mexico Freight Rail System Level of Service 2007
Source: National Rail Freight Infrastructure Capacity and Investment Study prepared
for the Association of American Railroads, 2007.
New Mexico Freight Plan 42
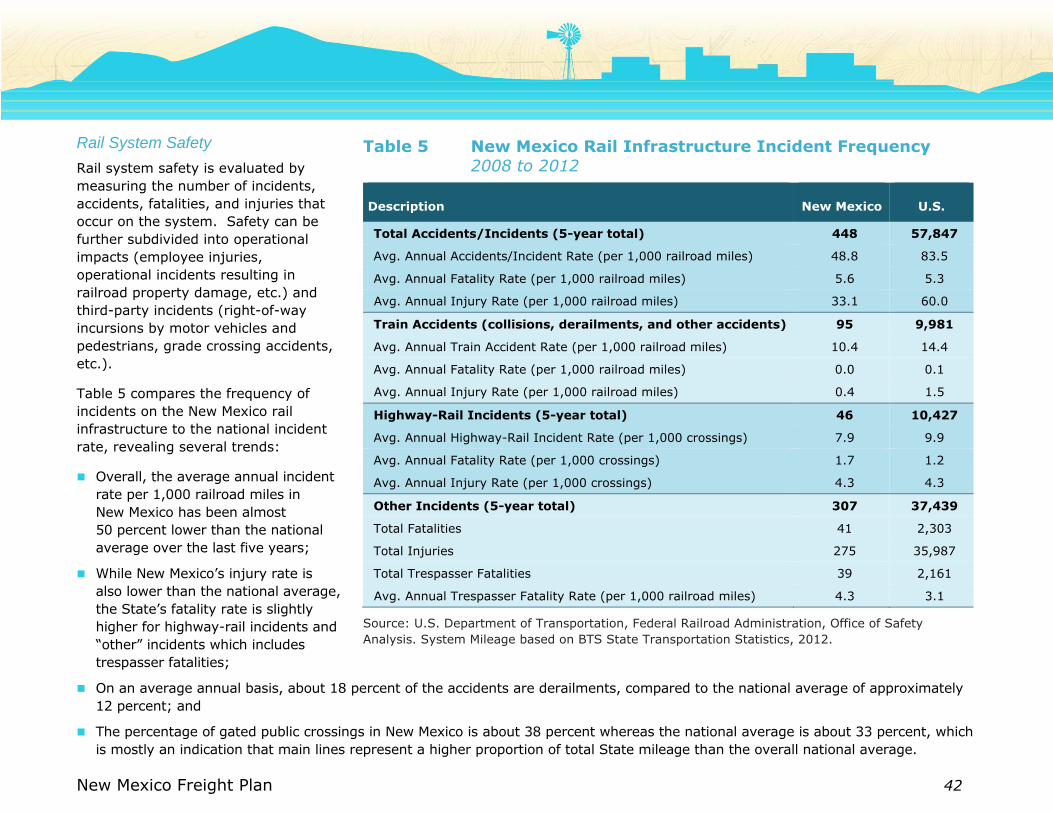
Rail System Safety
Rail system safety is evaluated by
measuring the number of incidents,
accidents, fatalities, and injuries that
occur on the system. Safety can be
further subdivided into operational
impacts (employee injuries,
operational incidents resulting in
railroad property damage, etc.) and
third-party incidents (right-of-way
incursions by motor vehicles and
pedestrians, grade crossing accidents,
etc.).
Table 5 compares the frequency of
incidents on the New Mexico rail
infrastructure to the national incident
rate, revealing several trends:
Overall, the average annual incident
rate per 1,000 railroad miles in
New Mexico has been almost
50 percent lower than the national
average over the last five years;
While New Mexico’s injury rate is
also lower than the national average,
the State’s fatality rate is slightly
higher for highway-rail incidents and
“other” incidents which includes
trespasser fatalities;
On an average annual basis, about 18 percent of the accidents are derailments, compared to the national average of approximately
12 percent; and
The percentage of gated public crossings in New Mexico is about 38 percent whereas the national average is about 33 percent, which
is mostly an indication that main lines represent a higher proportion of total State mileage than the overall national average.
Table 5 New Mexico Rail Infrastructure Incident Frequency 2008 to 2012
Description New Mexico U.S.
Total Accidents/Incidents (5-year total) 448 57,847
Avg. Annual Accidents/Incident Rate (per 1,000 railroad miles) 48.8 83.5
Avg. Annual Fatality Rate (per 1,000 railroad miles) 5.6 5.3
Avg. Annual Injury Rate (per 1,000 railroad miles) 33.1 60.0
Train Accidents (collisions, derailments, and other accidents) 95 9,981
Avg. Annual Train Accident Rate (per 1,000 railroad miles) 10.4 14.4
Avg. Annual Fatality Rate (per 1,000 railroad miles) 0.0 0.1
Avg. Annual Injury Rate (per 1,000 railroad miles) 0.4 1.5
Highway-Rail Incidents (5-year total) 46 10,427
Avg. Annual Highway-Rail Incident Rate (per 1,000 crossings) 7.9 9.9
Avg. Annual Fatality Rate (per 1,000 crossings) 1.7 1.2
Avg. Annual Injury Rate (per 1,000 crossings) 4.3 4.3
Other Incidents (5-year total) 307 37,439
Total Fatalities 41 2,303
Total Injuries 275 35,987
Total Trespasser Fatalities 39 2,161
Avg. Annual Trespasser Fatality Rate (per 1,000 railroad miles) 4.3 3.1
Source: U.S. Department of Transportation, Federal Railroad Administration, Office of Safety
Analysis. System Mileage based on BTS State Transportation Statistics, 2012.
New Mexico Freight Plan 43
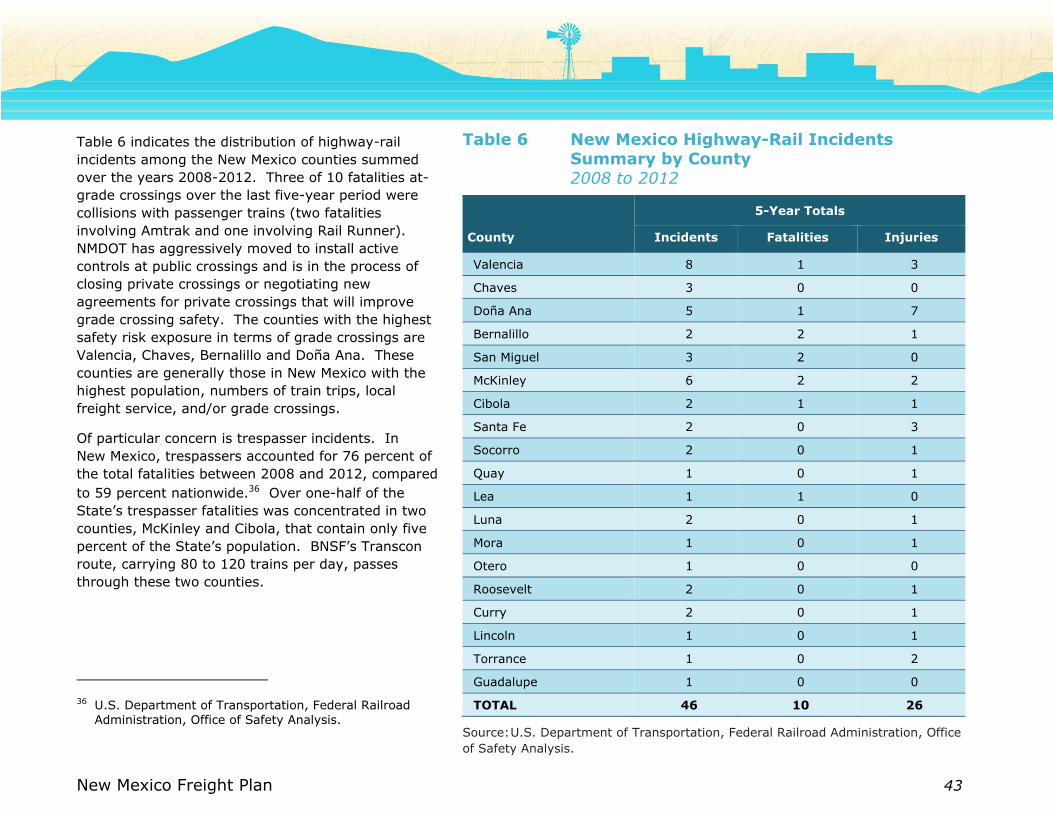
Table 6 indicates the distribution of highway-rail
incidents among the New Mexico counties summed
over the years 2008-2012. Three of 10 fatalities at-
grade crossings over the last five-year period were
collisions with passenger trains (two fatalities
involving Amtrak and one involving Rail Runner).
NMDOT has aggressively moved to install active
controls at public crossings and is in the process of
closing private crossings or negotiating new
agreements for private crossings that will improve
grade crossing safety. The counties with the highest
safety risk exposure in terms of grade crossings are
Valencia, Chaves, Bernalillo and Doña Ana. These
counties are generally those in New Mexico with the
highest population, numbers of train trips, local
freight service, and/or grade crossings.
Of particular concern is trespasser incidents. In
New Mexico, trespassers accounted for 76 percent of
the total fatalities between 2008 and 2012, compared
to 59 percent nationwide.36 Over one-half of the
State’s trespasser fatalities was concentrated in two
counties, McKinley and Cibola, that contain only five
percent of the State’s population. BNSF’s Transcon
route, carrying 80 to 120 trains per day, passes
through these two counties.
36 U.S. Department of Transportation, Federal Railroad
Administration, Office of Safety Analysis.
Table 6 New Mexico Highway-Rail Incidents Summary by County 2008 to 2012
County
5-Year Totals
Incidents Fatalities Injuries
Valencia 8 1 3
Chaves 3 0 0
Doña Ana 5 1 7
Bernalillo 2 2 1
San Miguel 3 2 0
McKinley 6 2 2
Cibola 2 1 1
Santa Fe 2 0 3
Socorro 2 0 1
Quay 1 0 1
Lea 1 1 0
Luna 2 0 1
Mora 1 0 1
Otero 1 0 0
Roosevelt 2 0 1
Curry 2 0 1
Lincoln 1 0 1
Torrance 1 0 2
Guadalupe 1 0 0
TOTAL 46 10 26
Source: U.S. Department of Transportation, Federal Railroad Administration, Office
of Safety Analysis.
New Mexico Freight Plan 44
Rail Institutional Relationships
The Rail Bureau within NMDOT’s Transit and Rail Division is tasked with overseeing New Mexico’s rail assets and managing all other
rail-related responsibilities, including managing the 133 miles of NMDOT-owned right-of-way (e.g., overseeing regulatory, safety, and
capital planning activities); administering the Federally-funded Section 130 program that funds safety improvements at highway-rail
grade crossings; assisting cities, towns, and counties that request technical assistance with rail issues; and leading the State’s rail
planning activities, among other duties. The Rio Metro Regional Transit District (Rio Metro) is the managing agency for Rail Runner
under a Memorandum of Agreement with NMDOT. Other entities involved in making rail decisions in the State include the Public
Regulation Commission responsible for enforcing railroad safety; all of the private railroads in the State making investment decisions
related to their business; and all of the Federal, State, and tribal land owners with whom the State must negotiate agreements in
order to add any new rail lines or facilities.
The NMDOT State Rail Plan, completed in 2014, established a vision for the State’s rail network:
…a fully integrated and safe multimodal passenger rail system that provides efficient passenger services to, from, and within
the State; provides a competitive option for New Mexico shippers; is a vital component of the national transportation network;
and supports sustainable, inclusive economic development statewide.
To help the NMDOT realize its rail vision, the State Rail Plan defines goals and objectives for rail in New Mexico, identifies potential
rail improvement projects, and prioritizes future investments as part of a long-range service investment program. Several key
factors affect the prioritization of potential rail projects in the State, including:
The need to maintain the State’s existing railroad infrastructure in a state of good repair;
The need to comply with Federal safety mandates (i.e., implementation of Positive Train Control on the Rail Runner)
Limited overall available public funding from Federal, state, and local sources;
Restrictions on the types of projects on which Federal funding can be used; and
The restrictions imposed by New Mexico’s Anti-Donation Clause against state and local spending on private railroads.

New Mexico Freight Plan 45
Cargo Airports New Mexico is served by two major airports: Albuquerque International Sunport and El Paso International. Although air freight is a
small component of New Mexico’s overall freight movements (estimated to be less than 0.005 percent of total freight volumes in
201237), increased emphasis on service-based and information industries both nationally and within the State could lead to an
increased demand for air cargo services. In addition, air cargo, which consists of high-value, low weight commodities, makes up a
larger portion of freight value in New Mexico (estimated at 1 percent in 2012); as commodities shipped by air tend to be low weight
but very high in value. Air cargo movements can have significant local impacts, as all air shipments are transported to and from local
airports by truck.
Albuquerque International primarily provides domestic passenger and air freight services. Approximately 4.9 million passengers
traveled through the airport in 2014, and over the last decade the airport has seen passenger decline of 3 percent per year.38
Freight service is provided by DHL Express, Empire, Federal Express, Southwest Aero Service, and UPS. The airport handles a
relatively small amount of freight because it competes with far larger air cargo hubs (such as Phoenix, Dallas, and Houston),
particularly for shipments to and from Mexico. The volume of freight handled at Albuquerque International Sunport declined by
25 percent between 2004 and 2014 to approximately 60,000 tons.39
37 FHWA’s Freight Analysis Framework version 3.5
38 http://www.abqsunport.com/about-us/facts-and-figures/
39 Ibid.

New Mexico Freight Plan 46
El Paso International Airport, though located in Texas, is the
primary airport for passenger and freight movements in southern
New Mexico (including Las Cruces). Approximately 2.8 million
passengers traveled through El Paso International in 2014, along
with 86,465 tons of cargo.40 The airport has been implementing an
aggressive strategy to exploit its location on the United States-
Mexico border by investing $60 million in two 144,000-square-foot
air cargo buildings, 34 acres of aircraft parking, and 6.4 miles of
roadways. The goal is to become an intermodal air cargo hub to
serve growing NAFTA-driven trade. The City of El Paso also
operates a 3,000-acre Foreign Trade Zone, of which the airport is a
key component. Air freight service to El Paso International
currently is provided by DHL, FedEx, UPS, BAX Global, Integrated
Airline Services, and Aircraft Service International Group. Any
growth in air freight in El Paso could lead to additional freight
movements to, from, and through New Mexico as trucks transport
goods to and from the airport in El Paso.
Border Crossings New Mexico has three international border crossings along its
southern border with the Mexican State of Chihuahua: Santa
Teresa, Columbus, and Antelope Wells. Of these, only Santa Teresa
and Columbus handle commercial traffic. Santa Teresa connects to
I-10 via the Pete Domenici Highway, while Columbus is located 30
miles south of Deming via State Highway 11. Although not located
within New Mexico, the El Paso and Fabens ports of entry in Texas
also handle freight traffic and have a significant impact on freight
flows in New Mexico due to their geographical proximity. Figure 28
is a map showing border crossings in the region.
40 http://www.elpasointernationalairport.com/operating-statistics.php
Figure 28 New Mexico’s International Ports of Entry
Source: New Mexico Border Authority
New Mexico Freight Plan 47
In 2013, over 93,000 commercial trucks and 750,000 private vehicles entered New Mexico via the three Ports of Entry (POE). During
the same period, almost 443,000 pedestrians and 1,400 buses used the ports.41 Santa Teresa is New Mexico’s most important POE
for truck and private vehicle crossings, with over 87 percent of all trucks and 57 percent of private vehicles using that border
crossing. The majority of the remaining private vehicles cross at the Columbus POE (42.5 percent), which has the highest rate of
pedestrian crossings (68 percent). There is a six-mile radius around the Columbus and Santa Teresa POEs in which commercial
vehicles can carry up to 96,000 lbs.42 Livestock crossing is also important to those two POEs; almost one-third of all cattle the U.S.
imports from Mexico are processed in these ports, valuing over $250 million. Over 85 percent of all buses use the Antelope Wells
POE, but fewer than 1 percent of private vehicles and no pedestrians or commercial trucks use the Antelope Wells crossing.43 There
are also five border crossings in and around El Paso, Texas. By way of these POEs, in 2013, there were over 6 million pedestrian
crossings, 10.8 million private vehicles, 21,500 buses, and 746,000 commercial vehicles.44
For New Mexico’s largest border crossing, Santa Teresa, there has been a recent trend of increased truck crossings; however, a
significant percentage of these are empty trucks (Figure 29). The Columbus border crossing has seen modest growth but has not
shown a similar discrepancy between total and loaded trucks.
41 NMDOT – New Mexico border crossing data – 2013 Monthly
42 New Mexico Economic Development Department.
http://www.gonm.biz/Borderplex.aspx.
43 NMDOT – New Mexico border crossing data – 2013 Monthly
44 NMDOT – Texas border crossing data – 2013 Monthly

New Mexico Freight Plan 48
Figure 29 New Mexico Truck Crossings and Loaded Truck Containers 2006 to 2012
Source: BTS Border Crossing Data
When comparing the pattern of truck crossings at New Mexico border POEs to personal vehicle crossings, far more variability is seen
in the personal vehicles than for trucks. Since the recession in 2009, personal vehicle crossings have shown a decline while truck
crossings have shown steady growth (Figure 30).
0
10,000
20,000
30,000
40,000
50,000
60,000
70,000
80,000
90,000
2006 2007 2008 2009 2010 2011 2012
Columbus Trucks Columbus Loaded Truck Containers
Santa Teresa Trucks Santa Teresa Loaded Truck Containers
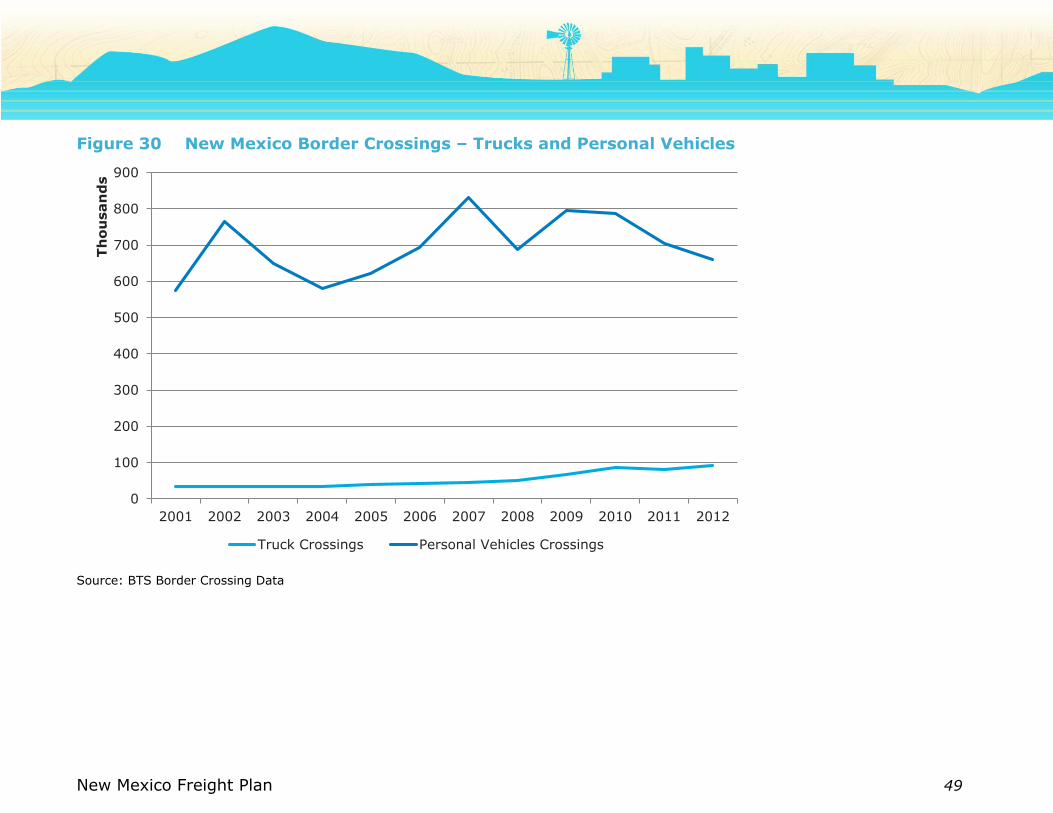
New Mexico Freight Plan 49
Figure 30 New Mexico Border Crossings – Trucks and Personal Vehicles
Source: BTS Border Crossing Data
0
100
200
300
400
500
600
700
800
900
2001 2002 2003 2004 2005 2006 2007 2008 2009 2010 2011 2012
Th
ou
san
ds
Truck Crossings Personal Vehicles Crossings
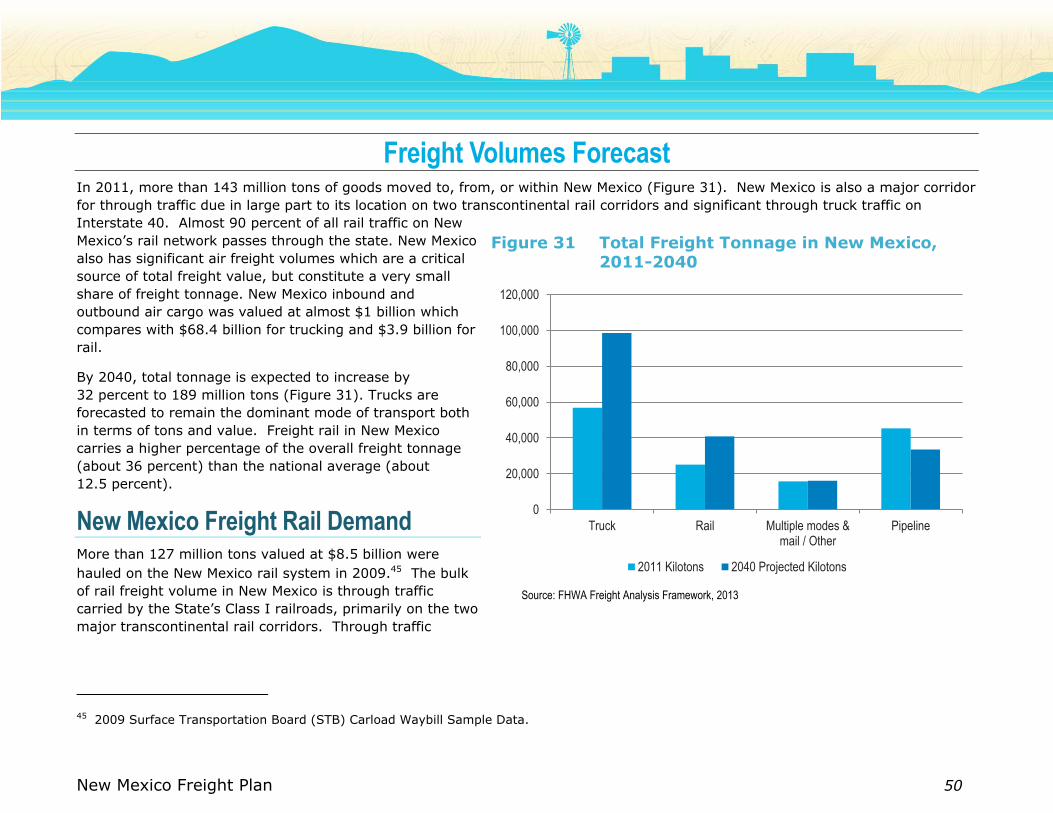
New Mexico Freight Plan 50
Freight Volumes Forecast In 2011, more than 143 million tons of goods moved to, from, or within New Mexico (Figure 31). New Mexico is also a major corridor
for through traffic due in large part to its location on two transcontinental rail corridors and significant through truck traffic on
Interstate 40. Almost 90 percent of all rail traffic on New
Mexico’s rail network passes through the state. New Mexico
also has significant air freight volumes which are a critical
source of total freight value, but constitute a very small
share of freight tonnage. New Mexico inbound and
outbound air cargo was valued at almost $1 billion which
compares with $68.4 billion for trucking and $3.9 billion for
rail.
By 2040, total tonnage is expected to increase by
32 percent to 189 million tons (Figure 31). Trucks are
forecasted to remain the dominant mode of transport both
in terms of tons and value. Freight rail in New Mexico
carries a higher percentage of the overall freight tonnage
(about 36 percent) than the national average (about
12.5 percent).
New Mexico Freight Rail Demand More than 127 million tons valued at $8.5 billion were
hauled on the New Mexico rail system in 2009.45 The bulk
of rail freight volume in New Mexico is through traffic
carried by the State’s Class I railroads, primarily on the two
major transcontinental rail corridors. Through traffic
45 2009 Surface Transportation Board (STB) Carload Waybill Sample Data.
0
20,000
40,000
60,000
80,000
100,000
120,000
Truck Rail Multiple modes &mail / Other
Pipeline
2011 Kilotons 2040 Projected Kilotons
Source: FHWA Freight Analysis Framework, 2013
Figure 31 Total Freight Tonnage in New Mexico, 2011-2040

New Mexico Freight Plan 51
represents 88 percent of all rail traffic by weight and 95
percent of all rail traffic by value on New Mexico’s rail
network.46 The types and quantities of through rail freight
traffic are indicative of national and even global economic
activity, with New Mexico benefitting from jobs created to
maintain the rail lines and to crew and service the trains.
Growth in New Mexico rail movements by weight is
forecasted to outpace the growth in truck tonnage between
2007 and 2020 (although trucks are still expected to carry
the majority of the State’s freight, as measured by weight).
However, both average rail value per ton and percentage rail
share by value are quite low compared to the national level
and other modes. This indicates the predominance of raw
materials and/or goods on the lower end of the commodity
value spectrum.
The top commodities for New Mexico’s rail flows by weight
and value in 2007 and the corresponding compounded
annualized growth rates between 2007 and 2020 are shown
in Figures 32 and 33. The composition of rail traffic that
either originates and/or terminates in New Mexico is highly
skewed towards coal, which is the single most dominant
commodity by weight (91 percent), a trend that FAF3
projects to continue with an annual growth rate of 3.2
percent, the highest among the major commodities. Gravel
is the second highest in terms of forecasted growth rate. The tonnage of fertilizer transported by rail is forecasted to decline by
2020.
Coal is the highest contributor to the value of goods transported by rail (40 percent). Following coal, motorized vehicles (13 percent)
and metallic ores (13 percent) are the other major slices of the rail market. Motorized vehicles and wood products are on a decline.
Commodities that are primarily inbound are animal feed and gravel (on a weight basis), and motorized vehicles, basic chemicals, and
46 2009 Surface Transportation Board (STB) Carload Waybill Sample Data.
Figure 32 Compounded Annual Growth Rates of Top
New Mexico Rail Commodities by Weight 2007 to 2020
Source: FAF3.
Note: Coal-n.e.c includes selected coal products and products of petroleum refining,
excluding gasoline, aviation fuel, and fuel oil.
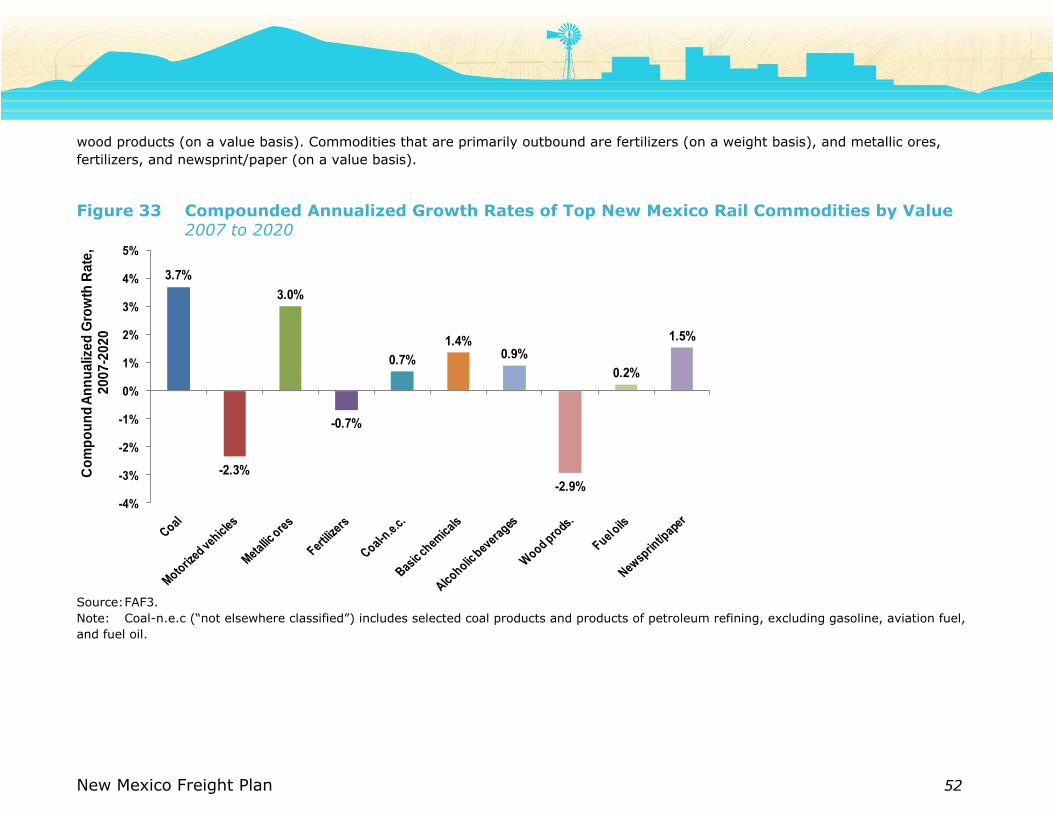
New Mexico Freight Plan 52
wood products (on a value basis). Commodities that are primarily outbound are fertilizers (on a weight basis), and metallic ores,
fertilizers, and newsprint/paper (on a value basis).
Figure 33 Compounded Annualized Growth Rates of Top New Mexico Rail Commodities by Value
2007 to 2020
Source: FAF3.
Note: Coal-n.e.c (“not elsewhere classified”) includes selected coal products and products of petroleum refining, excluding gasoline, aviation fuel,
and fuel oil.
3.7%
-2.3%
3.0%
-0.7%
0.7%
1.4%0.9%
-2.9%
0.2%
1.5%
-4%
-3%
-2%
-1%
0%
1%
2%
3%
4%
5%
Co
mp
ou
nd
An
nu
aliz
ed
Gro
wth
Ra
te,
20
07
-20
20
Cumulative Annualized Growth Rates of Top Rail Commodities by Value, 2007
New Mexico Freight Plan 53
Greenhouse Gas Emissions Analysis This section inventories current and future greenhouse gas (GHG) emissions from freight in New Mexico, including both truck and rail
transport. Table 7 presents estimated GHG emissions attributed to highway freight in New Mexico for 2007 and 2020. As the table
shows, growth in truck vehicle miles traveled (VMT) outweigh improvements in freight vehicle fuel efficiency, causing overall carbon
dioxide (CO2) emissions to increase. Total highway freight CO2 emissions rise by about 24 percent in the forecast, from 5.4 million
metric tons to 6.7 million metric tons. Since New Mexico is a “bridge state”(an estimated 85 percent of the truck traffic on I-10 and
I-40 is simply passing through the State47), through traffic is a significant contributor to truck GHG emissions and will likely remain
so between now and 2030. The diversion of some of this traffic to rail would help mitigate this GHG impact, as rail movements are
more fuel efficient than trucks (156-512 ton miles/gallon for rail versus 68-133 ton-miles/gallon for truck, depending on movement
type).48
Estimated GHG emissions from freight rail movements in New Mexico are provided in Table 8. Freight rail GHG emissions are far
lower than those for trucks, due to the lower volume of freight moved by rail as well as the lower rolling resistance of steel wheels on
steel rails. Overall, rail GHG emissions are estimated at about 50,000 metric tons in 2009, rising to nearly 70,000 metric tons by
2020. However, the vast majority of freight rail GHG emissions in New Mexico are associated with through traffic. Most of this is
port-driven intermodal traffic moving between West Coast ports (primarily Los Angeles and Long Beach) and inland points such as
Chicago and Texas. Less than four percent of freight rail carbon emissions in New Mexico are associated with shipments that begin
or end within the State.
The estimates of rail and truck GHG emissions highlight a few key points for New Mexico. First, the data clearly reinforce the notion
that New Mexico is a “bridge state.” Most freight in New Mexico is unrelated to economic activity in the State, but it contributes
significantly to pollution and GHG emissions, as well as infrastructure wear and tear. Secondly, to the extent that New Mexico can
successfully shift freight away from trucks and to the rail mode, it may be able to reduce the overall carbon footprint of goods
movement. This would help further the State’s overall environmental policy goals.
47 New Mexico Department of Transportation, New Mexico 2030 Statewide Multimodal Transportation Plan, December 2009.
48 Federal Railroad Administration, Comparative Evaluation of Rail and Truck Fuel Efficiency on Competitive Corridors, December 2009.

New Mexico Freight Plan 54
Table 7 New Mexico GHG Emissions for Highway Freight, 2007 and 2020
Conventional Medium Trucks (Gasoline)
Conventional Medium Trucks (Diesel)
Conventional Heavy Duty Trucks (Diesel) Inventory Total
Average mpg, 2007 8.93 9.44 6.77
Average mpg, 2020 9.80 10.14 7.94
2007 Truck VMT (in thousands) 882,822 882,822 2,377,681 4,143,325
2007 CO2 emissions (in metric tons) 870,959 949,221 3,564,765 5,384,945
2020 Truck VMT (in thousands) 1,187,909 1,187,909 3,438,765 5,814,583
2020 CO2 emissions (in metric tons) 1,067,906 1,189,081 4,395,902 6,652,888
Source: Cambridge Systematics analysis based on average miles per gallon values obtained from the EPA VISION model and truck VMT for New
Mexico from FAF3.
Note: Carbon content of fuel was assumed to be 8.81 kg CO2/gallon of gasoline and 10.15 kg CO2/gallon of diesel fuel, based on EPA data.
Table 8 New Mexico GHG Emissions for Freight Rail, 2009 and 2020
NM Traffic Through Traffic Total
2009 2020 2009 2020 2009 2020
Ton-mi/1000 BTU 3.14 3.17 3.14 3.17 – –
Total ton-mi (millions) 8,67272 10,260 209,489 289,982 218,162 300,242
BTU (millions) 27,194 32,495 658,096 918,415 685,290 950,911
Metric tons CO2 1,989 2,377 48,140 67,182 50,129 69,559
Source: Cambridge Systematics analysis based on efficiency data published by the Energy Information Administration, ton-miles reported in the STB
Carload Waybill Sample, and 2020 forecasts from FAF3.
Note: A rail CO2 emissions factor of 73.15 kg/million BTU was used based on the Energy Information Administration’s Voluntary Reporting of
Greenhouse Gases Program.

New Mexico Freight Plan 55
Significant Freight System Trends, Needs, Issues, Strengths, and Problems
Freight Needs and Issues The key issues raised by stakeholders and data analysis during the development of the New Mexico 2040 Plan and this freight plan
include:
Trucking: NMDOT should designate freight corridors and should design and build the highways along them with sufficient capacity
and geometric clearances to handle heavy truck traffic. There is a need to alleviate existing safety and maintenance impacts of
trucks on both state and local roads. Existing roads need repair and cannot handle heavy use. In rural areas, heavy trucks often
use dirt roads and their speeds are a safety concern. Truck use impinges on local access due to congestion during certain times of
the day. Seasonal shipping of agricultural products compounds this problem.
There is a shortage of truck drivers in the region: The shortage of skilled truck drivers with commercial driver’s licenses (CDLs) is a
limiting factor for regional development. This issue could be addressed, in part, by developing the rail line.
A large percentage of truck movements involve “empty back hauls”: Due to the nature of industrial and extractive activity in the
region, many trucks run empty after delivering their loads. Most freight traffic is one-way (e.g., delivery of fracking sand to well
sites), not bi-directional. Rail would have the same issue, though the impact on the roadway system would be less and shipping costs
reduced.
The lack of a railroad to the San Juan Region limits economic activity: The current lack of rail service raises transportation costs,
makes the region less competitive, and limits the types of activities that may be feasible in the region.
Four Corners Economic Development District has surveyed businesses in the region and found that there is a sufficient volume
of rail-compatible freight traffic to support the operation of a rail line.
Coal is one of the possible sources of rail traffic, especially coal mined for export (e.g., to China).
Addressing right-of-way issues is a significant concern. Obtaining a right-of-way through the “checkerboard” of lands owned by
different entities –federal, state, county, tribal, and private– would require extensive collaboration across jurisdictional
boundaries. There is some potential to use portions of existing roadway rights-of-way for the rail line.
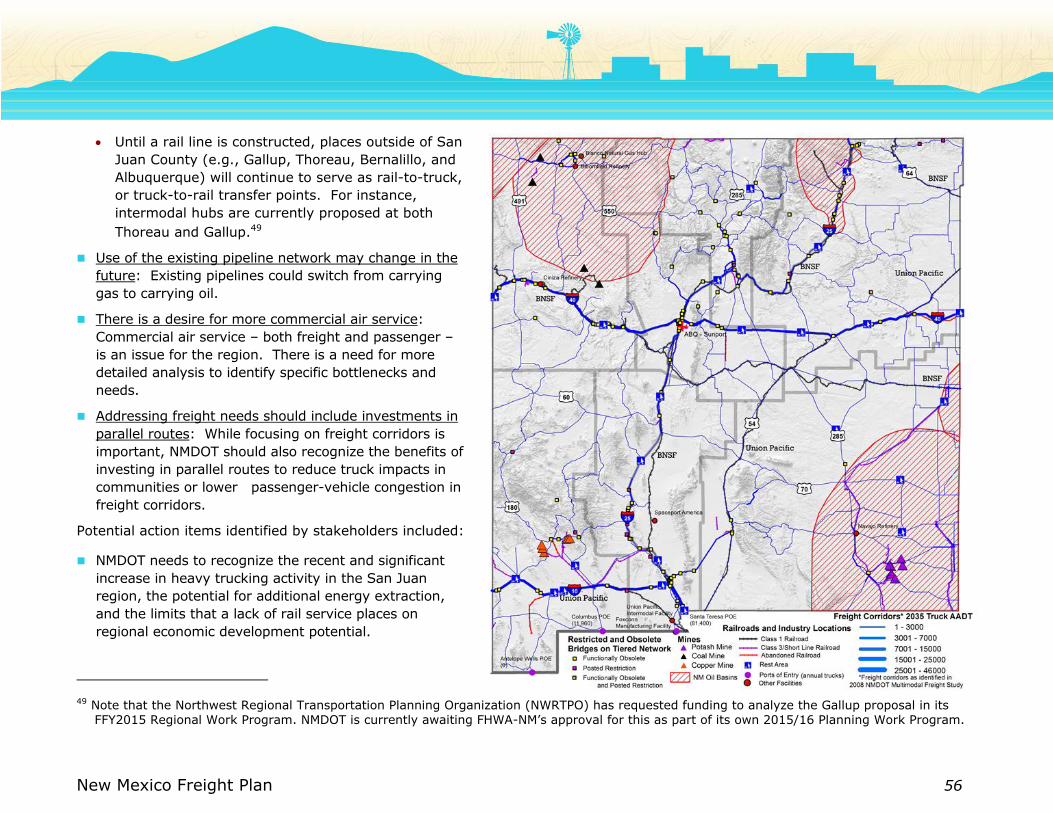
New Mexico Freight Plan 56
Until a rail line is constructed, places outside of San
Juan County (e.g., Gallup, Thoreau, Bernalillo, and
Albuquerque) will continue to serve as rail-to-truck,
or truck-to-rail transfer points. For instance,
intermodal hubs are currently proposed at both
Thoreau and Gallup.49
Use of the existing pipeline network may change in the
future: Existing pipelines could switch from carrying
gas to carrying oil.
There is a desire for more commercial air service:
Commercial air service – both freight and passenger –
is an issue for the region. There is a need for more
detailed analysis to identify specific bottlenecks and
needs.
Addressing freight needs should include investments in
parallel routes: While focusing on freight corridors is
important, NMDOT should also recognize the benefits of
investing in parallel routes to reduce truck impacts in
communities or lower passenger-vehicle congestion in
freight corridors.
Potential action items identified by stakeholders included:
NMDOT needs to recognize the recent and significant
increase in heavy trucking activity in the San Juan
region, the potential for additional energy extraction,
and the limits that a lack of rail service places on
regional economic development potential.
49 Note that the Northwest Regional Transportation Planning Organization (NWRTPO) has requested funding to analyze the Gallup proposal in its
FFY2015 Regional Work Program. NMDOT is currently awaiting FHWA-NM’s approval for this as part of its own 2015/16 Planning Work Program.
New Mexico Freight Plan 57
NMDOT should support development of a rail line to the San Juan Region to facilitate multimodal and inter-modal freight movement
and to provide an opportunity to expand public transportation service.
NMDOT should designate, improve and maintain truck corridors while protecting small communities and local roads from the impacts
of heavy truck traffic.
Make railroad crossings safer: The 2040 Plan can provide a framework to help the Transit and Rail Bureau to prioritize the
expenditure of safety funds.
Identify bottlenecks and capacity issues along priority truck routes and gateways: The 2040 Plan identifies the NMDOT’s priority truck
routes and gateways in order to optimize the locations of potential intermodal facilities, improve truck parking facilities, upgrade
bridges where needed, address oversize/overweight needs, and add shoulders or additional lanes to reduce congestion and improve
safety for all highway users.
Support regional economic development efforts by identifying potential intermodal facilities along existing rail lines: The 2040 Plan
can support regional economic development efforts through data analysis and reporting, mapping freight routes, and highlighting
potential multi- or inter-modal facilities and gateways.
Rail Issues and Opportunities This section summarizes the key issues and opportunities identified in the State Rail Plan related to funding limitations, access and
connectivity, geographic constraints and physical chokepoints, operational challenges, and policy and institutional relationships in
New Mexico.
Funding Limitations
There is continued uncertainty in the future of both the Federal and State transportation funding streams that could be used to
support rail. On the Federal side, the current surface transportation program (Moving Ahead for Progress in the 21st Century [MAP-
21]), which includes a number of program elements that can be used to fund rail projects, has been extended but is due for
reauthorization. The future timing and content of subsequent reauthorization is uncertain. NMDOT receives between $1 million and
$2 million annually from the Section 130 program, which is not enough to meet existing needs. Rio Metro will receive $7.8 million
from Section 5307 Urbanized Area Formula grants in FY 2013 and became eligible for Section 5337 State of Good Repair grants in FY
2014.
Other Federal funding may continue to be available through the passenger rail investment programs created by PRIIA (Intercity
Passenger Rail Service Corridor Capital Assistance, Congestion Grants, and High Speed Rail Corridor Program). However, the process

New Mexico Freight Plan 58
for obtaining this funding is highly competitive and no funding has been included since the FY 2010 budget for intercity passenger
rail. PRIIA expired on September 30, 2013 and has yet to be extended by act of Congress. Additionally, no existing Federal
programs provide funds to implement Federally-mandated PTC systems on passenger rail corridors; the cost to the State of New
Mexico for implementing PTC on the Rail Runner corridor is expected to be at least $30 million. Current congressional discussions
regarding future Federal funding for all areas, including transportation, are focused on reductions in appropriations to reduce Federal
budget deficits.
New Mexico used statewide discretionary Federal Congestion Mitigation Air Quality (CMAQ) funds between 2006 and 2011 to pay for
Rail Runner operating costs. New Mexico received authorization to continue using CMAQ funding to support Rail Runner operating
costs indefinitely in the FY 2009 appropriations bill, although the Federal Highway Administration (FHWA) has issued guidance under
MAP-21 indicating it intends to allow such use to continue for only five additional years. No CMAQ funds have been used to support
Rail Runner operating costs since December 2011, and Rio Metro has implemented schedule modifications, service cutbacks, fare
increases, and the use of FTA Section 5307 funds to balance Rail Runner’s operating budget without the use of CMAQ funds.
At the State level, there are no dedicated funding sources for rail projects or programs, including Rail Runner capital or operating
expenses or for capital maintenance on the NMRX rail network. As a result, funding for NMRX and Rail Runner is subject to annual
approval in the State budget approved by the Legislature, or in project-specific capital outlays. Without a dedicated funding stream,
the State’s rail program must compete with a broad array of annual State priorities, further limiting the ability of NMDOT to develop
effective long-term capital maintenance plans for its rail assets.
NMDOT is also responsible for the bonds issued to finance Rail Runner. These bonds, issued through the GRIP program that was
authorized in 2003, are variable rate bonds that mature between FY 2025 and FY 2027. Remaining payments on these bonds are
estimated to total nearly $540 million, with annual payments averaging $27.5 million between FY 2014 and FY 2024 followed by
balloon payments exceeding $235 million from FY 2025 through FY 2027. Bond payments are being made from the State Road Fund,
the primary State source of funding for NMDOT, reducing the amount available to NMDOT for all other transportation programs in the
State.
Additionally, New Mexico has experienced significant revenue declines over the past few years as a result of the economic downturn
and is not expecting revenues to rebound to pre-recession levels for several more years. Gross receipts taxes from two regional
transit districts (Rio Metro and North Central), which are the primary sources of Rail Runner operational funding, have been lower
than expected.

New Mexico Freight Plan 59
Access and Connectivity
Local Freight Service
Recognizing that most of the rail freight moving in New Mexico is through freight originating and terminating outside the State, many
stakeholders in the State Rail Plan cited a need for local rail freight service as a high priority. Examples include rail service to the
Farmington area, reactivation of inactive spurs in McKinley and Cibola counties, an east-west rail connection for aggregate mined in
eastern New Mexico, and reliable local service to serve southeast New Mexico’s growing dairy industry. However, providing new local
rail freight service on New Mexico’s long-haul freight corridors is not a straightforward task. Class I railroads require new or
reactivated mainline connections on major corridors to be designed with enough siding distance to enable high-speed entry and exit
from the mainline and also require the switches to tie in with existing signal systems as well as PTC systems that Class I railroads are
developing under a Federal mandate.
The costs of these improvements can be quite expensive, and the Class I railroads require that the local communities and/or
businesses that will be served pay for these improvements. Local communities are generally unable to finance these improvements
even where conflicts with the State’s Anti-Donation Clause are not an issue without some real assurance that businesses will locate
on these sidings. Businesses looking to relocate to sites with rail access generally look for sites that already have rail access or for
which rail access can be provided at lower costs, a factor that favors locating in areas already well-served by local rail freight service
(e.g., Albuquerque and Las Cruces).
Geographic Constraints and Physical Chokepoints
The terrain of New Mexico exercised considerable influence on where railroads were built and also limits where potential new lines
may be constructed. Mountain ranges and steep-walled valleys are formidable barriers to railroad construction, which requires more
gradual grades than are acceptable for highways. Steeper grades, in addition to adding to construction costs, require trains to
operate at lower speeds and may also require the addition of locomotives to freight trains. Thus, connecting cities by rail that are
close and that are connected by highway may not be practical due to the grades that would need to be negotiated. For example, the
BNSF rail line from Lamy to the Colorado state line is no longer used by BNSF for freight service due to the slow speeds necessitated
by the track grade and curvature.
The physical chokepoints identified on the State’s rail system that affect both passenger and freight rail service are:
Sidings – The limited number and length of sidings on the NMRX Albuquerque subdivision causes meet delays and prevents
significant expansion of Rail Runner service. With the existing sidings, it is impossible to adjust the schedule of any of Rail Runner
trains without affecting all of the scheduled trains and if any one train gets behind schedule, it has a ripple effect on all the other

New Mexico Freight Plan 60
trains. UP has also expressed the need for additional sidings on its network in New Mexico as a way to increase capacity and reduce
travel time.
Bridges – NMDOT has identified a significant number of bridges along the Albuquerque subdivision that are deemed structurally
inadequate to carry 286,000-pound railcars. NMDOT uses a prioritization process to select bridges for repairs and replacements.
Since FY 2009, NMDOT was able to replace 11 bridges with culverts, but funding for future bridge repairs or replacements needs to
be identified and programmed.
Track capacity – With the completion of BNSF’s double-tracking project through Abo Canyon, only 38 miles remain for the
Transcon’s primary route between Los Angeles and Chicago to be completely double tracked.50 Two remaining segments are located
in New Mexico: a 9.3-mile segment west of Vaughn which includes a bridge over UP’s Tucumcari line, and a 2.3-mile segment west
of Fort Sumner which includes a bridge over the Pecos River and an underpass beneath U.S. 60.
Track control – Signal modifications and the installation of power switch machines in Lamy would improve safety and reduce meet
delays for Amtrak.
Operational Challenges
Operational challenges related to maintenance, speed and reliability, safety, and the environment are described below.
Shared Use Corridors
Operational challenges related to service reliability are often attributed to freight/passenger rail interactions in shared-use corridors.
Although performance has improved since PRIIA, Amtrak is not as punctual as customers would like and the most frequent cause of
delays is freight train interference. On any given day, there may be a number of conflicts on the Southwest Chief between Amtrak
and BNSF freight trains.
Conflicts between the Southwest Chief and Rail Runner sharing a single track mainline also cause delays. Generally, Rail Runner
service incurs more of the delay because Amtrak has priority over Rail Runner under most situations described in the NMDOT-Amtrak
joint use agreement. While there have been dispatching conflicts on the NMRX Albuquerque subdivision, the delays are relatively
insignificant compared to those caused by freight activities along the Southwest Chief’s entire route.
50 http://www/corridorsofcommerce.com.
New Mexico Freight Plan 61
Safety and Security
The Federally-funded Section 130 Railway-Highway Grade Crossing Safety Improvement Program is administered and implemented
by the NMDOT Rail Bureau. This program requires NMDOT to prioritize and select crossings for inclusion in the Section 130 Program.
The FRA maintains a database of all train, vehicle, and crash data associated with railroad crossings. In order to receive funding,
NMDOT uses a priority index related to accident prediction to list crossings. Section 130 funds can help to address issues related to
closure of redundant crossings and improvement protection at remaining crossings.
Another operational challenge relates to the numerous safety mandates in RSIA and their costs to both freight and passenger
railroads. As mentioned previously, the RSIA requires railroads to install PTC implementation on all lines that carry passengers
and/or hazardous materials by 2015. The primary goal of implementing this technology is to enhance safety, primarily through the
prevention of train-to-train collisions, derailments, incursions into work zone limits, and movement of trains through improperly-
positioned switches. However, the effects this investment will have on capital investment and maintenance is of particular concern to
NMDOT and the Class I railroads.
Environmental Issues
The environmental impact of railroads is a significant consideration when deciding where to locate freight and passenger rail service.
While a modal shift from truck to rail can improve air quality, noise pollution via the use of train horns throughout residential
communities has led to support for quiet zones. Gallup, Clayton, and Isleta Pueblo are among the communities working for the
establishment of a quiet zone in their respective communities. In addition to noise concerns, several stakeholders identified rail beds
as an impedance to natural drainage flows and wildlife.
Furthermore, environmental justice concerns often stem from communication gaps between railroads, tribes, NMDOT, operators, and
other stakeholders. Affected communities and other stakeholders ought to have significant communication from decision-makers
regarding the effects of rail on their community, the establishment of quiet zones, and the condition and location of fences and
crossings. Consistent communication can also help to assuage the concerns of railroads with respect to residential encroachment and
trespassing.
Federal and Tribal Land
Half of New Mexico land is either owned by the Federal government or by one of the State’s 23 Native American pueblos, tribes, or
nations. Federal lands, collectively about four times the area of tribal reservation lands in New Mexico, include military bases,
national forests, and national parks, in addition to lands administered by the Bureau of Indian Affairs. The State of New Mexico does
not have sovereignty over Federal or tribal lands and must negotiate agreements with the land owners in order to add any new rail
lines or rail facilities.
New Mexico Freight Plan 62
Staffing for Program Oversight
In addition to being the owner of railroad right-of-way and a commuter rail system, NMDOT’s other rail-related responsibilities
include administering the Section 130 program, interacting with railroads on highway construction projects, and acting as the State’s
rail planning agent. All of these activities are undertaken by the Rail Bureau within NMDOT’s Transit and Rail Division, which has an
authorized staff of seven but has averaged two vacancies over the past four years. Even if the Rail Bureau were to be fully staffed
over time, the responsibilities of this staff are quite extensive for only seven individuals to keep pace with. As a result, staff must
prioritize projects in a manner that focuses on immediate concerns of the NMDOT-owned railroad.
Rail Ownership Issues
The rail lines that NMDOT purchased from BNSF and SFS were originally constructed by ATSF, with much of this rail built more than
130 years ago. Documentation of ownership of spurs and of private crossing agreements was lacking in many cases, creating
confusion as to which rail segments were transferred to NMDOT ownership and what agreements were in place between the former
owners and adjacent landowners and businesses. Ownership of some rail spurs in the Albuquerque area has not been resolved.
There are no records of agreements for many of the private crossings of the rail lines, and it is suspected that in many cases there
were never any written agreements.

New Mexico Freight Plan 63
Freight Road Map The New Mexico Department of Transportation (NMDOT) determined that incorporating the State Freight Plan into the 2040 Plan
would best serve New Mexico’s transportation planning interests. It is important that the State Freight Plan be consistent with the
approach taken within the overall 2040 Plan, enabling it to serve as both a standalone work product and as a part of the 2040 Plan.
Table 9 shows the meetings conducted to support the State Freight Plan.
Table 9 Freight Meeting Schedule
Meeting Topic/Goal Meeting Date
Freight Meeting 1 Identify key corridors and regions November 2013
Freight Meeting 2 Discuss high-level criteria to identify freight projects. Review Data Needs and
Data Sources February 2014
Freight Meeting 3 Overview, review the FWG focus areas/topics and feedback. Discuss
relationship to long range plan effort. Discuss stakeholder outreach process,
interviews and key issues. Begin to populate SLRP Action Plan for Freight Working Group/ Advisory Committee
April 2014
Survey and Interviews Launch online survey, conduct interviews with a limited number of select freight stakeholders
March-May 2014
Regional freight meetings
Identify specific local freight issues and concerns. Southeast – February 2014
South Central – July 2014
Northwest and North Central –
September 2014
Northeast and Eastern Plains – September 2014
Mid-Region – September 2014
Freight Meeting 4 As part of a plenary statewide working group meeting, the freight working group met to review alternatives as part of the 2040 Plan.
October 2014
Note: The original intention for the 2040 Plan was to include both a freight working group and a freight coordinating committee. On
the advice of freight stakeholders, these were consolidated into a single advisory group. Additional targeted meetings were held
throughout the state as identified in this table.

New Mexico Freight Plan 64
Project Prioritization Process The 2040 Plan defines a framework for a new project prioritization process that is intended to use a rigorous process to consider both
the consistency of new investments with the goals of the 2040 Plan and attempt to consider both the benefits of new investments
and their costs. Please see the Implementation section of the 2040 Plan for more information on this process. This section describes
relevant linkages to the Freight plan.
Project Prioritization Process for Rail Projects
To evaluate proposed rail projects, NMDOT developed a transparent methodology to prioritize projects for inclusion in the long-range
service and investment program. To develop a qualitative prioritization matrix, NMDOT identified nine evaluation categories that
address a full range of public and private benefits from potential investment in future freight and passenger rail projects. These
evaluation categories are summarized in Table 10. Using a qualitative assessment or objective analysis of a project’s expected
performance, each project was assigned a rating of High (10 points), Medium (7 points), Low (4 points), or None/Not applicable (0
points) for each category. Each evaluation category was then assigned a weight reflecting its relative importance as a contribution to
a proposed project’s overall “qualitative score.” Stakeholder feedback collected during the development of the State Rail Plan was an
important consideration when assigning weights to each category.
Table 10 Prioritization Matrix Evaluation Categories
Evaluation
Category
Example Benefits/Evaluation Criteria Assigned
Weight Rationale
Statewide Benefits Job creation
Tax revenues
Economic growth
Expanded system capacity
20 Statewide and community benefits are weighted equally to show a balance and reflect
that State tax-funded rail investments should have some kind of statewide benefit.
Community Benefits
Reduced roadway congestion
Noise/vibration mitigation
Enhances local aesthetics, business access
Effects on environmental justice (EJ) communities
Effects on emergency response access
20 Equivalent to statewide benefits to show a balance, while reflecting the importance of community to neighborhoods and tribes.
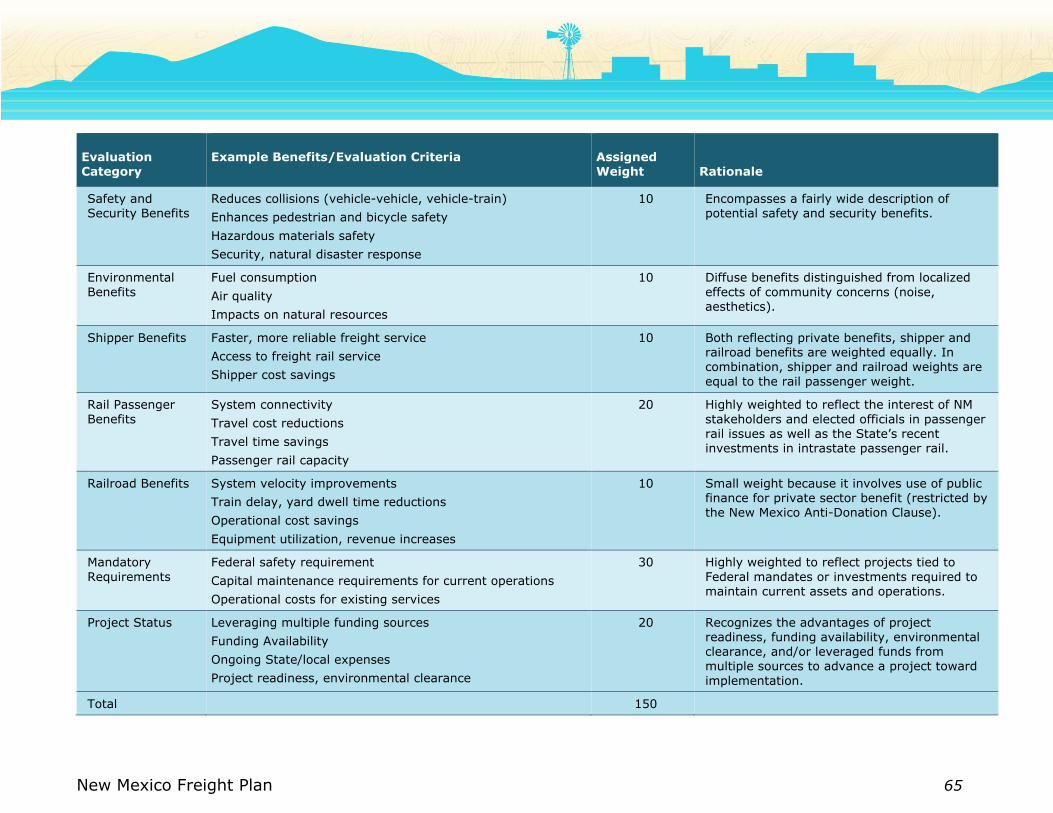
New Mexico Freight Plan 65
Evaluation Category
Example Benefits/Evaluation Criteria Assigned Weight Rationale
Safety and Security Benefits
Reduces collisions (vehicle-vehicle, vehicle-train)
Enhances pedestrian and bicycle safety
Hazardous materials safety
Security, natural disaster response
10 Encompasses a fairly wide description of potential safety and security benefits.
Environmental
Benefits
Fuel consumption
Air quality
Impacts on natural resources
10 Diffuse benefits distinguished from localized
effects of community concerns (noise, aesthetics).
Shipper Benefits Faster, more reliable freight service
Access to freight rail service
Shipper cost savings
10 Both reflecting private benefits, shipper and railroad benefits are weighted equally. In combination, shipper and railroad weights are
equal to the rail passenger weight.
Rail Passenger
Benefits
System connectivity
Travel cost reductions
Travel time savings
Passenger rail capacity
20 Highly weighted to reflect the interest of NM
stakeholders and elected officials in passenger
rail issues as well as the State’s recent investments in intrastate passenger rail.
Railroad Benefits System velocity improvements
Train delay, yard dwell time reductions
Operational cost savings
Equipment utilization, revenue increases
10 Small weight because it involves use of public finance for private sector benefit (restricted by the New Mexico Anti-Donation Clause).
Mandatory
Requirements
Federal safety requirement
Capital maintenance requirements for current operations
Operational costs for existing services
30 Highly weighted to reflect projects tied to
Federal mandates or investments required to maintain current assets and operations.
Project Status Leveraging multiple funding sources
Funding Availability
Ongoing State/local expenses
Project readiness, environmental clearance
20 Recognizes the advantages of project readiness, funding availability, environmental clearance, and/or leveraged funds from multiple sources to advance a project toward
implementation.
Total 150

New Mexico Freight Plan 66
Proposed Freight Rail Improvements
It is important to understand planned freight rail improvements in New Mexico to gain perspective on the future role of rail freight in
the State’s economy. Table 11 describes proposed freight rail improvements in New Mexico. These projects represent new capacity
which could help grow the amount of freight shipped by rail in the State and may carry other economic benefits. Other projects,
such as PTC implementation, address safety per Federal mandate.
In addition to these proposed freight rail improvement projects, UP is proceeding with implementing a new intermodal and fueling
facility at the Strauss Yard near Santa Teresa. This project will relocate UP’s El Paso hub to southern New Mexico, along with 285
permanent jobs. It is also expected to create 60 new permanent jobs due to UP traffic growth, along with nearly 3,000 temporary
construction jobs. UP is investing over $400 million into the project, which is scheduled to become operational in May 2014.
Table 11 Potential Freight Rail Improvement Projects Identified by Stakeholders
Project Description Cost Estimate
Capacity Improvements
BNSF Fort Sumner double tracking
Double track 2.3 miles west of Fort Sumner that includes bridge over Pecos River and underpass beneath U.S. 60 to eliminate one of two remaining single track segments of Transcon in New Mexico.
$17.4 million
BNSF Vaughn double tracking
Double track 9.3 miles west of Vaughn that includes bridge over the UP Tucumcari Line to eliminate one of two remaining single track segments of Transcon in New Mexico.
$31.3 million
Chloe Siding Reconstruct Chloe siding in Valencia County midway between Belen and Los Lunas Rail Runner
stations as 1-mile siding to allow for freight train meets and storage for BNSF trains entering Belen yard. Freight trains waiting for clearance to enter Belen yard frequently cause delays to Rail Runner trains south of Albuquerque.
$6 million
Facilities and Operations
Peru Mill rail
improvements
The City of Deming is redeveloping the Peru Mill Industrial Park on the northwest side of the city. A
potential tenant for the site has proposed improving rail access to permit unit trains to access the site by extending Deming siding on the UP Sunset Route and constructing a new rail line adjacent to SWRR from Deming yards to Peru Mill Industrial Park.
$5.5 million
Santa Teresa border crossing
A new international rail border crossing would be developed at Santa Teresa to improve cross-border capacity in the Ciudad Juarez-El Paso area and relieve rail traffic congestion in Ciudad Juarez. The
proposed crossing would connect with UP Sunset Route near Strauss, a new rail line could also cross
the Sunset Route via bridge and connect with the BNSF El Paso subdivision near Vado, and new rail lines would be constructed in Mexico to connect the border crossing with the Mexican rail network.
$150 million
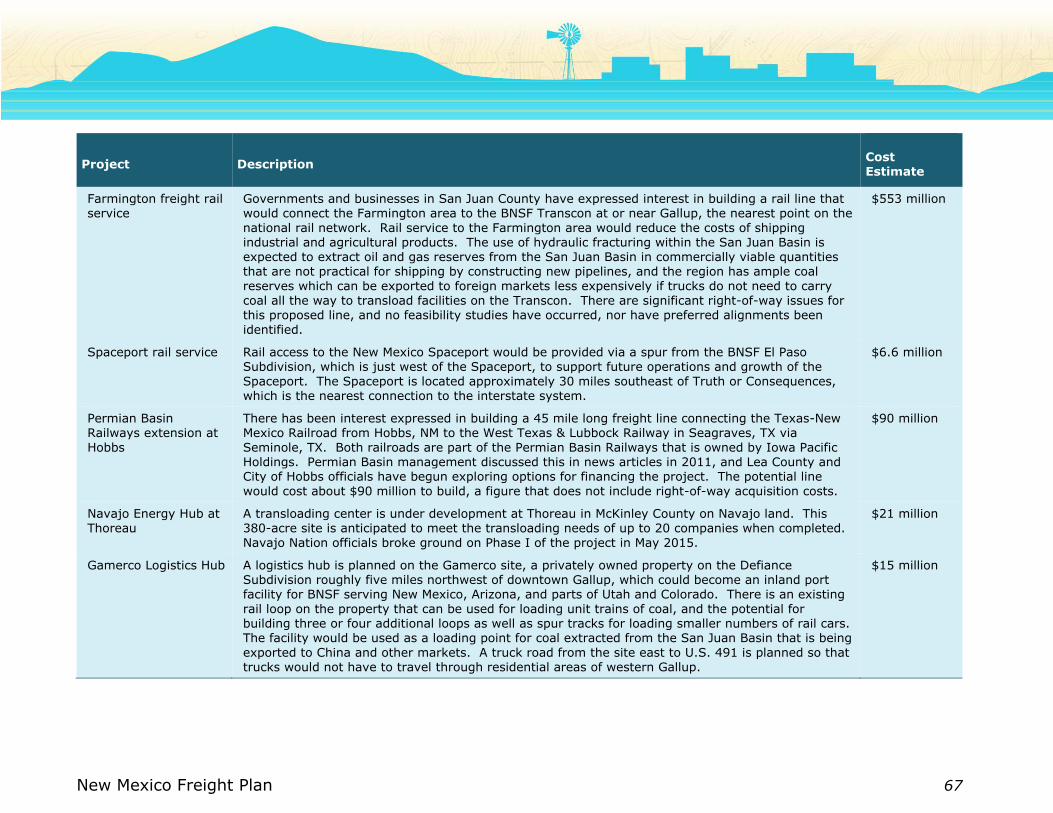
New Mexico Freight Plan 67
Project Description Cost Estimate
Farmington freight rail service
Governments and businesses in San Juan County have expressed interest in building a rail line that would connect the Farmington area to the BNSF Transcon at or near Gallup, the nearest point on the
national rail network. Rail service to the Farmington area would reduce the costs of shipping industrial and agricultural products. The use of hydraulic fracturing within the San Juan Basin is expected to extract oil and gas reserves from the San Juan Basin in commercially viable quantities that are not practical for shipping by constructing new pipelines, and the region has ample coal
reserves which can be exported to foreign markets less expensively if trucks do not need to carry coal all the way to transload facilities on the Transcon. There are significant right-of-way issues for this proposed line, and no feasibility studies have occurred, nor have preferred alignments been
identified.
$553 million
Spaceport rail service Rail access to the New Mexico Spaceport would be provided via a spur from the BNSF El Paso Subdivision, which is just west of the Spaceport, to support future operations and growth of the
Spaceport. The Spaceport is located approximately 30 miles southeast of Truth or Consequences, which is the nearest connection to the interstate system.
$6.6 million
Permian Basin
Railways extension at
Hobbs
There has been interest expressed in building a 45 mile long freight line connecting the Texas-New
Mexico Railroad from Hobbs, NM to the West Texas & Lubbock Railway in Seagraves, TX via
Seminole, TX. Both railroads are part of the Permian Basin Railways that is owned by Iowa Pacific Holdings. Permian Basin management discussed this in news articles in 2011, and Lea County and City of Hobbs officials have begun exploring options for financing the project. The potential line
would cost about $90 million to build, a figure that does not include right-of-way acquisition costs.
$90 million
Navajo Energy Hub at Thoreau
A transloading center is under development at Thoreau in McKinley County on Navajo land. This 380-acre site is anticipated to meet the transloading needs of up to 20 companies when completed.
Navajo Nation officials broke ground on Phase I of the project in May 2015.
$21 million
Gamerco Logistics Hub A logistics hub is planned on the Gamerco site, a privately owned property on the Defiance Subdivision roughly five miles northwest of downtown Gallup, which could become an inland port facility for BNSF serving New Mexico, Arizona, and parts of Utah and Colorado. There is an existing
rail loop on the property that can be used for loading unit trains of coal, and the potential for building three or four additional loops as well as spur tracks for loading smaller numbers of rail cars. The facility would be used as a loading point for coal extracted from the San Juan Basin that is being
exported to China and other markets. A truck road from the site east to U.S. 491 is planned so that trucks would not have to travel through residential areas of western Gallup.
$15 million
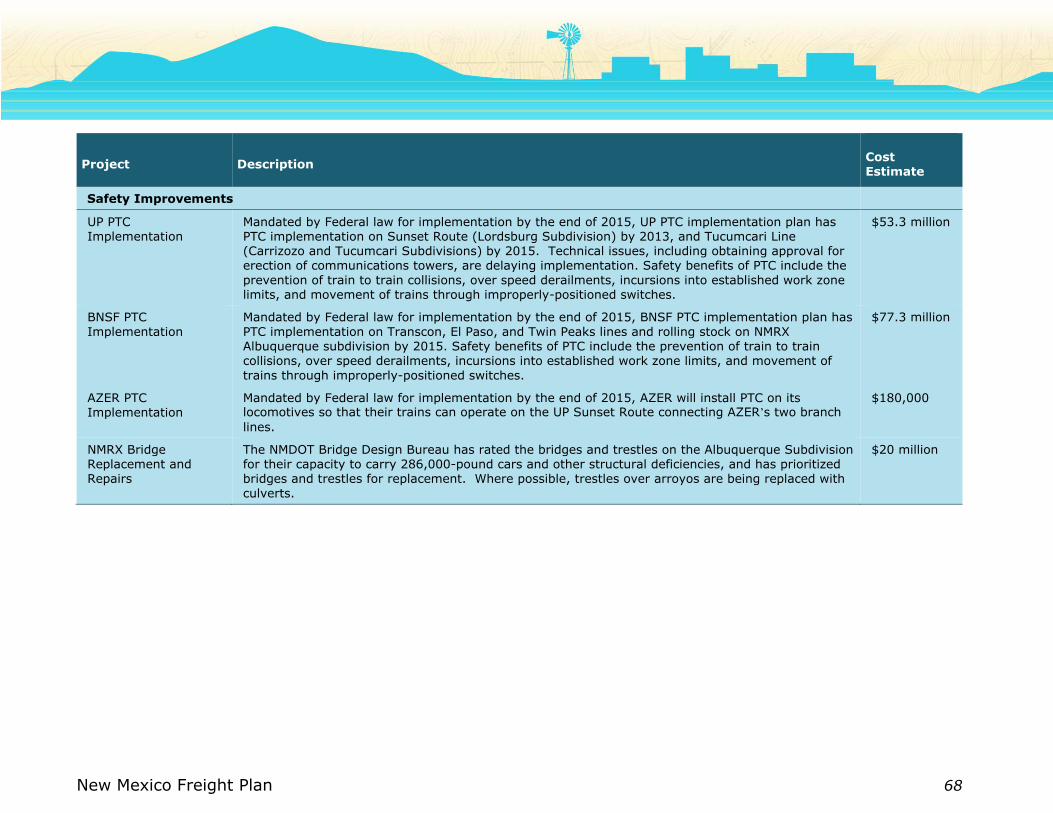
New Mexico Freight Plan 68
Project Description Cost Estimate
Safety Improvements
UP PTC Implementation
Mandated by Federal law for implementation by the end of 2015, UP PTC implementation plan has PTC implementation on Sunset Route (Lordsburg Subdivision) by 2013, and Tucumcari Line (Carrizozo and Tucumcari Subdivisions) by 2015. Technical issues, including obtaining approval for erection of communications towers, are delaying implementation. Safety benefits of PTC include the
prevention of train to train collisions, over speed derailments, incursions into established work zone limits, and movement of trains through improperly-positioned switches.
$53.3 million
BNSF PTC
Implementation
Mandated by Federal law for implementation by the end of 2015, BNSF PTC implementation plan has
PTC implementation on Transcon, El Paso, and Twin Peaks lines and rolling stock on NMRX Albuquerque subdivision by 2015. Safety benefits of PTC include the prevention of train to train collisions, over speed derailments, incursions into established work zone limits, and movement of
trains through improperly-positioned switches.
$77.3 million
AZER PTC Implementation
Mandated by Federal law for implementation by the end of 2015, AZER will install PTC on its locomotives so that their trains can operate on the UP Sunset Route connecting AZER’s two branch
lines.
$180,000
NMRX Bridge Replacement and Repairs
The NMDOT Bridge Design Bureau has rated the bridges and trestles on the Albuquerque Subdivision for their capacity to carry 286,000-pound cars and other structural deficiencies, and has prioritized bridges and trestles for replacement. Where possible, trestles over arroyos are being replaced with
culverts.
$20 million
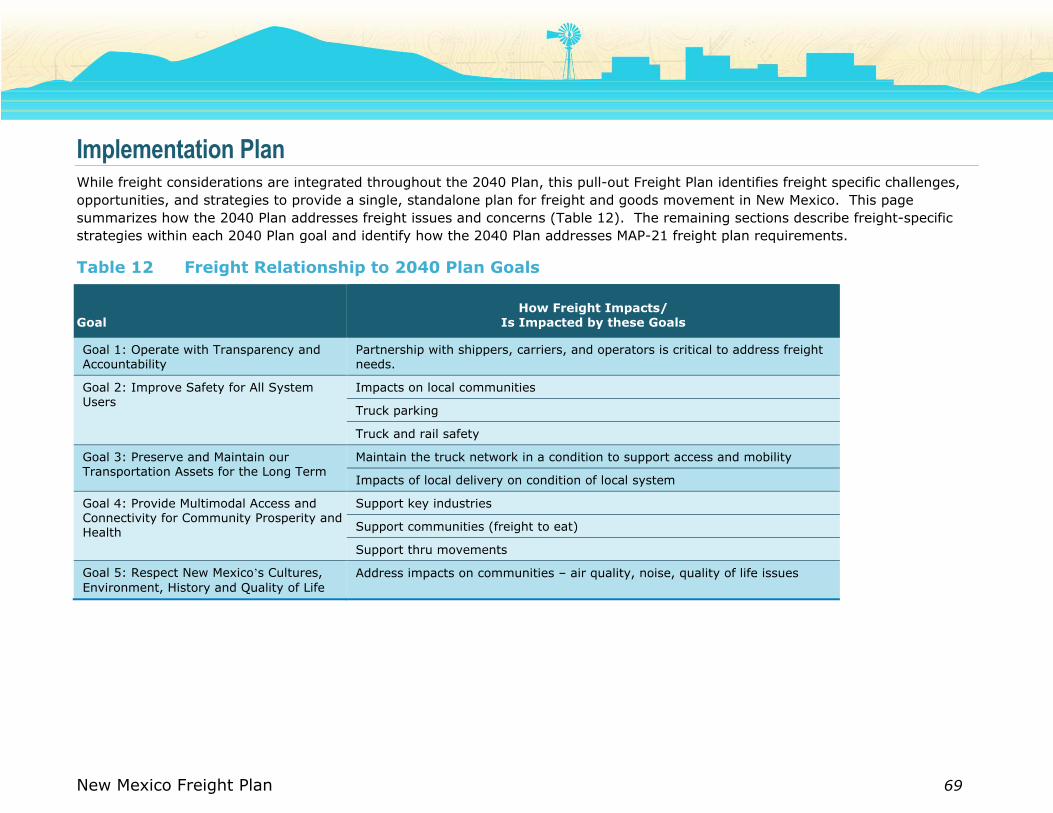
New Mexico Freight Plan 69
Implementation Plan While freight considerations are integrated throughout the 2040 Plan, this pull-out Freight Plan identifies freight specific challenges,
opportunities, and strategies to provide a single, standalone plan for freight and goods movement in New Mexico. This page
summarizes how the 2040 Plan addresses freight issues and concerns (Table 12). The remaining sections describe freight-specific
strategies within each 2040 Plan goal and identify how the 2040 Plan addresses MAP-21 freight plan requirements.
Table 12 Freight Relationship to 2040 Plan Goals
Goal How Freight Impacts/
Is Impacted by these Goals
Goal 1: Operate with Transparency and Accountability
Partnership with shippers, carriers, and operators is critical to address freight needs.
Goal 2: Improve Safety for All System Users
Impacts on local communities
Truck parking
Truck and rail safety
Goal 3: Preserve and Maintain our Transportation Assets for the Long Term
Maintain the truck network in a condition to support access and mobility
Impacts of local delivery on condition of local system
Goal 4: Provide Multimodal Access and Connectivity for Community Prosperity and Health
Support key industries
Support communities (freight to eat)
Support thru movements
Goal 5: Respect New Mexico’s Cultures,
Environment, History and Quality of Life
Address impacts on communities – air quality, noise, quality of life issues
New Mexico Freight Plan 70
Goal 1. Operate with Transparency and
Accountability
Each of the 2040 Plan strategies related to the goal of
improving overall NMDOT transparency and accountability -
employee excellence and customer service, partnerships and
coordination, and access to high-quality data and information –
is directly relevant to improving transparency and
accountability within the freight industry as well. In addition,
the freight plan identifies three freight-specific strategies to
ensure transparency and accountability related to goods
movement:
Examine opportunities to ease administrative burden
of oversize/overweight permitting and weight-
distance tax payment. NMDOT can help increase freight
efficiency by implementing measures to streamline
permitting and payment processing. NMDOT is currently
participating in the I-10 Western Connected Freight Corridor,
which will focus on permit coordination, as well as connected
vehicles and issues related to multistate freight movements.
In addition, the NMDOT is coordinating with the New Mexico
Department of Public Safety to expedite oversize/overweight
permitting and routing.
Continue coordination and cooperation with freight
stakeholders and communities. Coordination with the
freight industry and community stakeholders is important in
all stages of freight planning. Coordination includes early
collaboration, engagement, consultation, and information
exchange. To assist in coordination efforts, NMDOT should
conduct regular partnering meetings with the 2040 Plan
Freight Working Group and regularly include freight
stakeholders in project development and planning efforts
that are likely to impact the freight community. NMDOT
should also attend freight industry events and establish
ongoing stakeholder outreach in order to maintain good
communications with the private sector freight community.
Regular coordination with freight stakeholders will help
demonstrate a commitment to freight planning within
NMDOT, as well as allow it to build and sustain relationships
with key members of the private sector freight community.
It will also help NMDOT participate in and guide future
regional and statewide freight planning activities, such as
border-related development.
Provide freight-specific traveler information through
multiple sources. Access to real-time weather and road
conditions can improve transportation system safety and
performance. Tailoring the information to freight system
users and focusing on freight-intensive corridors would
improve freight efficiency, safety, and user experience.
NMDOT should identify opportunities to partner with other
state agencies and private organizations to create mutually
beneficial arrangements to share traffic, weather, safety,
and other data and to disseminate time-sensitive
information to stakeholders. Leveraging both public and
private sector data sources where available would allow the
creation of a freight-focused data packet for trucking
company drivers, dispatchers, and operations managers.
NMDOT Actions
o Conduct regular partnering meetings with the 2040 Plan
freight working group.
o Include freight stakeholders in project development and planning efforts that are likely to impact the freight
community.
o Attend freight industry events and establish ongoing stakeholder outreach in order to maintain good communications with the private sector freight community.
New Mexico Freight Plan 71
Goal 2. Improve Safety for All Users
Strategies identified in the 2040 Plan for improving safety and
public health have direct freight applicability as well:
Data collection: NMDOT will work with private industry
stakeholders and the State Police to improve data collection
and sharing practices. Information about collision locations,
dangerous grade-crossings, and incident duration and
response times is valuable for freight safety planning.
Risk Management: NMDOT can apply risk management
strategies for freight corridors to prioritize safety
improvements based on risk of potential future crashes.
Further analysis of collision data will help NMDOT address
hotspots, such as locations with high freight volumes and
difficult merging conditions, and systemic issues, such as
poor road quality or inadequate lane widths.
Health: Heavy trucking has a significant impact on air
quality in concentrated locations. NMDOT can support the
private industry in the adoption of clean vehicle technology
to minimize harmful emissions.
Additional freight strategies related to the goal of improving
safety and public health include:
Evaluate the location, availability, and utilization of
rest areas and truck stops. Adequate truck parking is an
important element to enhance public safety for truck drivers
and other system users. Issues related to truck parking
include lack of security, poor design of access and egress,
and lack of information about location and availability of
space. Limitations on truck parking and the demands placed
on truck drivers can impact route selection and result in
illegal parking, which can be dangerous to the personal
safety of drivers and to other vehicles as trucks return and
accelerate onto shared roadways.
Develop criteria to evaluate appropriateness of a
bypass based on roadway tier, truck volumes, and
community information. Truck bypasses can improve
public safety and increase system efficiency by removing
potential conflicts between freight vehicles and other modes
and freeing up roadway space for other users. However,
creating bypasses may not be recommended in all situations
due to potential impact on the community’s economic
vitality. It is important for NMDOT to develop criteria and
systematic approach for evaluating new truck bypasses.
Potential criteria could include the volume of truck traffic as
a percent of total traffic and the availability of non-sensitive
land for roadway development.
Evaluate future of truck fuels and potential long-term
infrastructure needs. To meet future air quality and
emissions standards, heavy trucking must move away from
carbon intensive fuels to cleaner burning options. NMDOT
should evaluate future truck fuels, including natural gas,
electric, hydrogen, and biofuels, in order to anticipate
potential long-term infrastructure needs.
NMDOT Actions
o Inventory truck parking facilities to determine if facilities are adequately spaced on common freight corridors and if overcrowding is problematic.
o Refine NMDOT access control guidance for existing and new facilities, especially bypasses, to ensure that state roads can serve their appropriate function.
New Mexico Freight Plan 72
Goal 3. Preserve and Maintain our
Transportation Assets for the Long Term
Ongoing preservation and maintenance of the state system is a
core NMDOT responsibility. The 2040 Plan strategies propose
developing a “preservation-first” asset management strategy;
addressing legacy challenges by right sizing the state-owned
network with enough capacity to support statewide connectivity
standards; and prioritizing investment of funds by modal “tier”
to achieve minimum standards for design, maintenance, and
efficient operations. Building on these strategies, additional
freight-related strategies include:
Focus state of good repair strategies on top tier roads,
identified in Figure 14, New Mexico’s Priority Freight
Corridors. Focusing investments on the most critical
elements of the freight system, particularly addressing
bottlenecks and detours, will help maximize statewide and
regional benefits. A critical first step, which will be
completed in house, is to supplement Figure 14 with
additional information, including existing and proposed
intermodal and transloading facilities, Land Ports of Entry,
and other key elements. Criteria and thresholds for
establishing tiers across freight modes should be
quantifiable, such as freight tonnage or value carried, as well
as flexible to allow the inclusion of network segments that
may not be crucial to the entire system but are vitally
important to a specific region or industry.
Develop a freight performance measures program.
The development and application of freight performance
measures was emphasized in MAP-21 and in FHWA’s interim
guidance on state freight plans and freight advisory
committees. NMDOT should consider applying performance
measures to the freight system for the purposes of linking
actions to goals, prioritizing projects, managing
performance, communicating results, and strengthening
accountability. Performance measures should be supported
by data that are easy to collect, update, and analyze and
should be statewide or regionally significant. When
establishing performance targets, NMDOT should coordinate
with the private freight community to ensure the targets are
appropriate and reasonable.
Address bridge restrictions on strategic freight
network. New Mexico has a number of bridges on its road
network that cannot handle regular loads either due to
weight restrictions or bridges that do not function as
originally intended. Through the identification of New
Mexico’s strategic freight network, truck volume data, and
location of restricted and functionally obsolete bridges,
NMDOT should prioritize bridge rehabilitation for facilities
with the greatest need.
NMDOT Actions
o Continue to analyze and update information regarding New
Mexico’s Priority Freight Corridors.
o Develop freight performance measures and integrate performance criteria into project prioritization.
o Align bridge rehabilitation program to be consistent with tiered investment priorities.
New Mexico Freight Plan 73
Goal 4. Provide Multimodal Access &
Connectivity
New Mexico faces several challenges to address freight access
and connectivity. The state’s transportation system faces
significant local demand and associated impacts due to
extraction industries, and for some industries, connections to
intermodal facilities is especially challenging and important. At
the same time, much of the freight traffic on New Mexico’s
highways and railroads originates in other places (e.g., West
Coast and Texas ports) and is not destined for New Mexico.
Freight strategies to address multimodal access and
connectivity include:
Strategic Investment in Key Freight Corridors. Figure
14 identifies New Mexico’s Priority [Truck] Freight Corridors.
The NMDOT will continue to develop and refine the network
in-house by including intermodal connections, existing and
proposed transloading facilities and Land Ports of Entry that
are statewide or regionally significant. This network will
allow for strategic investment of limited resources. NMDOT
will develop prioritization approaches that consider the
importance of freight and goods movement, accounting for
intermodal connections and border crossings.
Make public investments in new capacity and
intermodal connections where appropriate. Public
investment in private infrastructure should ensure that
costs, benefits, and risks are appropriately shared across
stakeholder groups. Investment decisions should balance
fairness and equity in terms of who pays, who benefits, and
who shoulders any unwanted burdens. To expand funding
opportunities for freight infrastructure, NMDOT could explore
innovative financing strategies, including public-private
partnerships, tax-expenditure financing programs that allow
for tax-free borrowing, and direct user fees such as tolls or
congestion pricing.
Support adoption of new technology and Intelligent
Transportation Systems. New technology, including
Intelligent Transportation Systems (ITS), will help improve
freight efficiency and safety. NMDOT should encourage
adoption of advanced technologies by the private freight
industry. ITS improvements include, but are not limited to:
traffic control and monitoring systems, Weigh-In-Motion
(WIM) systems, route-planning systems, freight status and
location monitoring systems, driving behavior monitoring
and crash prevention systems, rail crossing safety and rail
management systems.
NMDOT Actions
o Explore opportunities to implement innovative financing
strategies and make public investments in new capacity within the bounds of the New Mexico Anti-Donation Clause.
o Initiate development of freight ITS program.
o Participate in I-10 Western Connected Freight Corridor Coalition to address permitting and connected vehicle applications.
o Identify opportunities to implement freight travel demand management strategies as part of the NMDOT TDM Strategic Plan
New Mexico Freight Plan 74
Actions
o Develop criteria and checklists for freight projects to ensure successful implementation of CSS principles.
o Establish a community engagement policy to reach key freight, community, and environmental stakeholders.
Goal 5. Respect New Mexico’s Cultures,
Environment, and Quality of Life
Collaboration is vitally important to ensure that New Mexico
receives the economic benefits of freight movement without
negative impacts to the state’s cultures, environment, or
quality of life. NMDOT should build trust and strengthen
partnerships and coordination between communities, NMDOT,
and private freight industry by engaging all stakeholder groups
early and often throughout planning processes. Within the
context of freight planning, key strategies include:
Evaluate context sensitive design standards for
freight and community compatibility. Context Sensitive
Solutions (CSS) help find a “best fit” transportation solution
tailored for the situation that meets the expectations of both
NMDOT and community stakeholders. For instance, when
freight corridors enter small communities, NMDOT should
ensure that speed restrictions and roadway design features
are compatible with freight operations and community
livability goals.
Enforce truck routes to minimize impact of heavy
truck traffic on communities. In locations where truck
routes exist, it is imperative that commercial freight vehicles
utilize these corridors. NMDOT should keep truck route maps
and signage up-to-date and visible. NMDOT should work
with local law enforcement to ensure heavy trucks are
utilizing these routes and avoiding surrounding
neighborhood streets.
New Mexico Freight Plan 75
Appendix A: Freight Survey Results Several surveys were conducted as part of the development of the 2040 Plan, including:
A statistically valid public survey designed to capture general opinions about transportation in New Mexico;
A tribal survey that used the same questions of the public survey, but provided focused outreached to tribal nations;
Surveys of the members of regional working groups from across the state; and
A survey of freight shippers, carriers, and other stakeholders with an interest in freight.
The freight survey was sent to a list of freight contacts identified by NMDOT and the consultant team. It was also distributed to a
number of public agencies to share with their contacts. Some of the key questions from the survey included:
Freight Modes - “In the past year, how frequently has your business used the following freight transportation facilities in New
Mexico?”
Freight Priorities – “What aspects of freight service are important to you?”
System Performance - “How well do you rate each of these freight attributes within New Mexico right now?” and “How would
you rate the current performance of different components of the New Mexico freight system?”
Future Needs - “When you think about future freight transportation investments, what should be the New Mexico’s DOT’s focus
areas?”
This appendix provides a summary of some of the key findings of this survey.
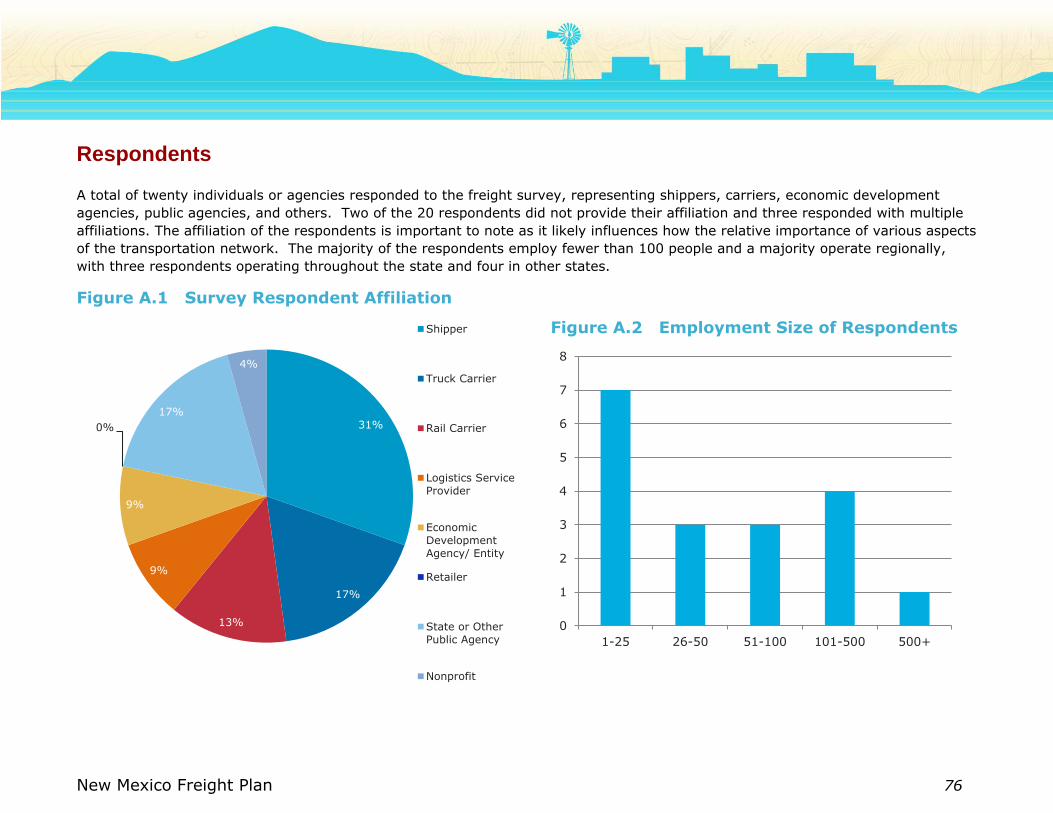
New Mexico Freight Plan 76
Respondents
A total of twenty individuals or agencies responded to the freight survey, representing shippers, carriers, economic development
agencies, public agencies, and others. Two of the 20 respondents did not provide their affiliation and three responded with multiple
affiliations. The affiliation of the respondents is important to note as it likely influences how the relative importance of various aspects
of the transportation network. The majority of the respondents employ fewer than 100 people and a majority operate regionally,
with three respondents operating throughout the state and four in other states.
Figure A.1 Survey Respondent Affiliation
Figure A.2 Employment Size of Respondents
31%
17%
13%
9%
9%
0%
17%
4%
Shipper
Truck Carrier
Rail Carrier
Logistics Service
Provider
Economic
Development
Agency/ Entity
Retailer
State or Other
Public Agency
Nonprofit
0
1
2
3
4
5
6
7
8
1-25 26-50 51-100 101-500 500+
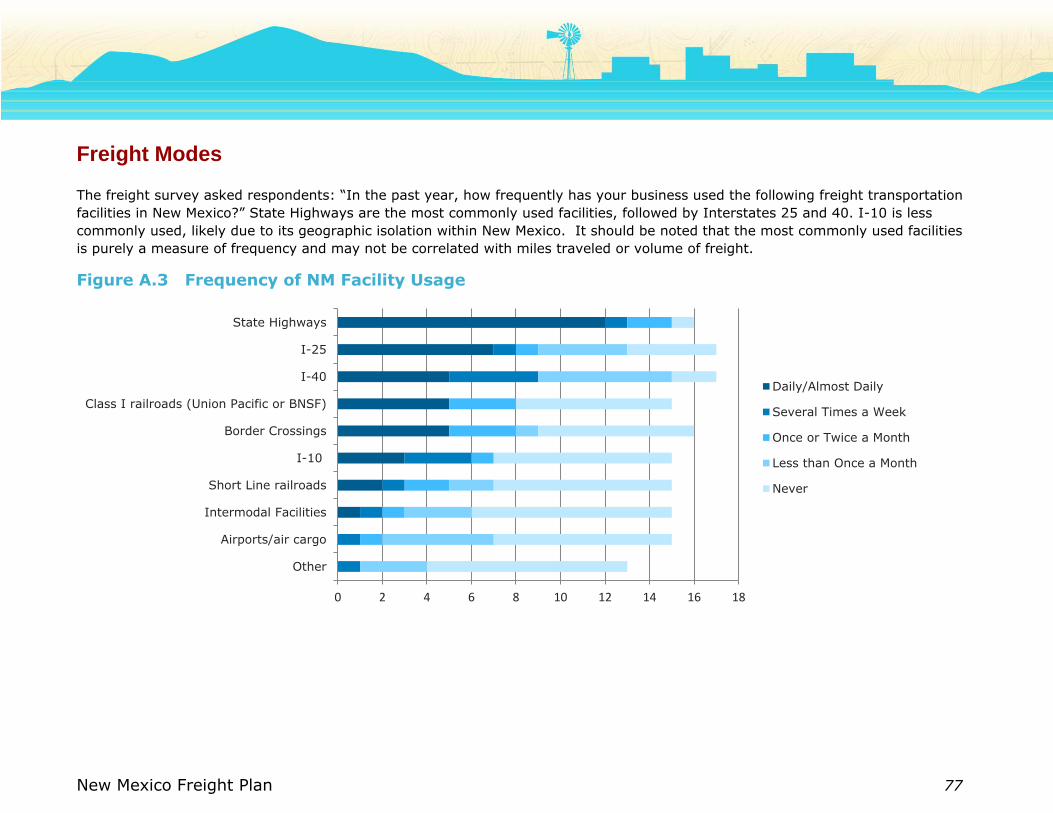
New Mexico Freight Plan 77
Freight Modes
The freight survey asked respondents: “In the past year, how frequently has your business used the following freight transportation
facilities in New Mexico?” State Highways are the most commonly used facilities, followed by Interstates 25 and 40. I-10 is less
commonly used, likely due to its geographic isolation within New Mexico. It should be noted that the most commonly used facilities
is purely a measure of frequency and may not be correlated with miles traveled or volume of freight.
Figure A.3 Frequency of NM Facility Usage
0 2 4 6 8 10 12 14 16 18
Other
Airports/air cargo
Intermodal Facilities
Short Line railroads
I-10
Border Crossings
Class I railroads (Union Pacific or BNSF)
I-40
I-25
State Highways
Daily/Almost Daily
Several Times a Week
Once or Twice a Month
Less than Once a Month
Never

New Mexico Freight Plan 78
Freight Priorities
Respondents were asked: “What aspects of freight service are important to you?” to elicit their priorities. Quality of roadways
received the highest number of “extremely important” votes; however, time in transit scored the highest when combining “extremely
important” and “very important”. Access to in-state customers, cargo security, and predictability of delivery times were also indicated
to be extremely important or very important by over 80 percent of the respondents.
Figure A.4 Importance of Freight Services
0% 10% 20% 30% 40% 50% 60% 70% 80% 90% 100%
Other
Choice between modes
Access to in-state suppliers
Access to out of state suppliers
Average cost of Shipments
Variability in cost of Shipments
In-transit information
Access to intermodal facilities
Predictability of Delivery Times
Access to out of state customers
Time in transit
Cargo security
Access to in-state customers
Quality of roadways
Extremely Important Very Important Somewhat Important Not Important

New Mexico Freight Plan 79
System Performance
The freight survey asked a couple of questions in order to measure the respondents’ impression of the current freight transportation
system, including “How well do you rate each of these freight attributes within New Mexico right now?” (see Figure A.5). and “How
would you rate the current performance of different components of the New Mexico freight system?” (see figure A.6). While the
majority of the transportation system was indicated to be in acceptable condition, almost 30 percent of respondents indicated that
pavement quality was “poor”. Furthermore, railroad crossing safety and state highway capacity were most often reported as in need
of improvement. Multiple respondents identified bottleneck issues surrounding the following issues/facilities: Regulations, Urban
areas, namely Santa Fe and Albuquerque, Santa Teresa Port of Entry, and Incident Clearing Time.
Figure A.5 Rating of Current Freight Attributes
0% 10% 20% 30% 40% 50% 60% 70% 80% 90% 100%
Pavement quality
Other
Choice between modes
Time in transit
Access to out of state suppliers
Traveler information
Access to intermodal facilities
Average cost of Shipments
Variability in cost of Shipments
Access to in-state suppliers
Access to in-state customers
Access to out of state customers
Reliability of shipments
Cargo security
Extremely Well Well Acceptable Poor

New Mexico Freight Plan 80
Figure A.6 Rating of Current Freight Component Performance
0% 10% 20% 30% 40% 50% 60% 70% 80% 90% 100%
Rail grade crossing safety
State Highway Capacity
Road conditions
Other
Rail reliability
Rail transit speed
Access to terminals, facilities
State Highway Operations
Highway Safety
Interstate Capacity
Major interchanges
Availability of truck parking and amenities
Inclement weather operations
Intermodal connection conditions
Interstate Operations
Outstanding Good Acceptable Uneven Needs Improvement
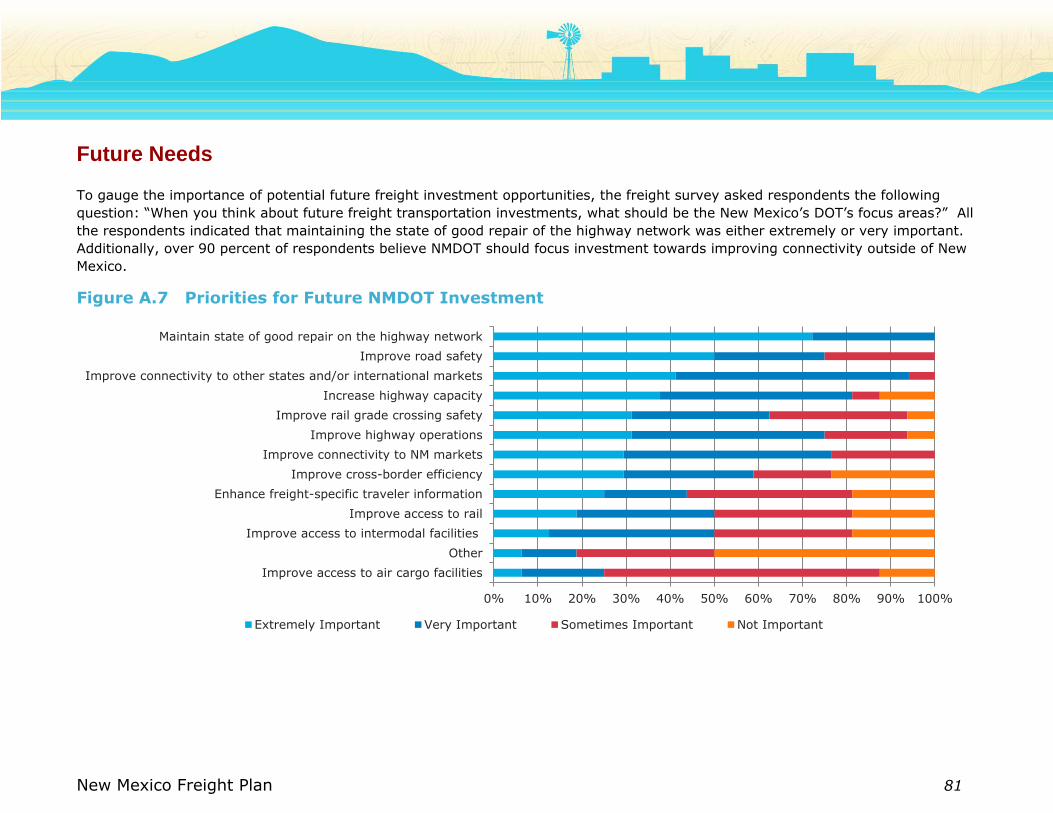
New Mexico Freight Plan 81
Future Needs
To gauge the importance of potential future freight investment opportunities, the freight survey asked respondents the following
question: “When you think about future freight transportation investments, what should be the New Mexico’s DOT’s focus areas?” All
the respondents indicated that maintaining the state of good repair of the highway network was either extremely or very important.
Additionally, over 90 percent of respondents believe NMDOT should focus investment towards improving connectivity outside of New
Mexico.
Figure A.7 Priorities for Future NMDOT Investment
0% 10% 20% 30% 40% 50% 60% 70% 80% 90% 100%
Improve access to air cargo facilities
Other
Improve access to intermodal facilities
Improve access to rail
Enhance freight-specific traveler information
Improve cross-border efficiency
Improve connectivity to NM markets
Improve highway operations
Improve rail grade crossing safety
Increase highway capacity
Improve connectivity to other states and/or international markets
Improve road safety
Maintain state of good repair on the highway network
Extremely Important Very Important Sometimes Important Not Important