Embed Size (px)
Citation preview

20
08
–20
09
CLA
IN
STIT
UTI
ON
AL
REPO
RT
New Mexico Highlands University

Contents and Navigation
The Report introduces readers to
the CLA and its methodology,
presents your results and offers
guidance on interpretation and
next steps.
Introduction to the CLA (1)
Methods (2)
Your Results (3-6)
Diagnostic Guidance (7)
Moving Forward (8)
Appendices offer more detail on
CLA tasks, scoring and scaling, the
overall institutional sample and
results, regression equations, and
the Student Data File.
1 Task Overview (9-12)
2 Task Development (13)
3 Scoring Criteria (14-16)
4 Scoring Process (17-18)
5 Scaling Procedures (19-20)
6 Institutional Sample (21-25)
7 Institutional Results (26)
8 Regression Equations (27)
9 Student Data File (28)
10 CAE Board of Trustees and
Officers (29)
Your Student Data File may
be used to link with other data
sources, and generate hypotheses
for additional research.
Student Data File
Report Appendices Attachments
This Institutional Report
presents Collegiate Learning
Assessment (CLA) results for
colleges and universities that
assessed their students in fall
2008 and/or spring 2009.
Orange text signals sections
specific to your institution.
2008–2009 CLA Institutional Report 1
Introduction to the CLA
The Collegiate Learning Assessment
(CLA) offers an authentic approach
to assessment and improvement
of teaching and learning in higher
education. Over 400 institutions and
180,000 students have participated
to date. Growing commitment on
the part of higher education to assess
student learning makes this a good
time to review the distinguishing
features of the CLA and how it
connects to improving teaching and
learning on your campus.
The CLA is intended primarily to
assist faculty, department chairs,
school administrators and others
interested in programmatic change
to improve teaching and learning,
particularly with respect to
strengthening higher order skills.
The CLA helps campuses follow a
continuous improvement model that
positions faculty as central actors.
CLA Education (described on
page 8) does just that by focusing
on curriculum and pedagogy and
the link between assessment and
teaching and learning.
The continuous improvement model
also requires multiple assessment
indicators beyond the CLA because
no single test to benchmark student
learning in higher education is
feasible or desirable.
This, however, does not mean certain
skills judged to be important by most
faculty and administrators across
virtually all institutions cannot be
measured; indeed, the higher order
skills the CLA focuses on fall into
this measurable category.
The CLA presents realistic problems
that require students to analyze
complex materials. Several different
types of materials are used that vary
in relevance to the task, credibility,
and other characteristics. Students’
written responses to the task are
graded to assess their abilities to
think critically, reason analytically,
solve problems, and communicate
clearly and cogently.
The institution—not the student—is
the initial primary unit of analysis.
The CLA is designed to measure
an institution’s contribution, or
value added, to the development of
these competencies, including the
effects of changes to curriculum and
pedagogy.
The CLA uses detailed scoring
guides to precisely and reliably
evaluate student responses. It
also encourages institutions to
compare their student learning
results on the CLA with learning
at other institutions and on other
assessments.
The signaling quality of the CLA
is important because institutions
need to benchmark (have a frame
of reference for) where they stand
and how much progress their
students have made relative to the
progress of students at other colleges.
Otherwise, how do they know how
well they are doing?
Yet, the CLA is not about ranking
institutions. Rather, it is about
highlighting differences between
them that can lead to improvements
in teaching and learning.
While the CLA is indeed an
assessment instrument, it is
deliberately designed to contribute
directly to the improvement of
teaching and learning. In this respect
it is in a league of its own.

2008–2009 CLA Institutional Report2
Unadjusted
Methods
The CLA provides an authentic,
stable platform for samples of
your students to demonstrate
performance in key higher order
skills:
Critical thinking �
Analytic reasoning �
Problem solving �
Written communication �
We calculate both unadjusted and
adjusted scores to give two important
perspectives on institutional
performance and comparisons.
Unadjusted scores report absolute
performance and enable absolute
comparisons across schools.
Although absolute measures, such
as graduation or retention rates,
are traditionally relied upon in
post-secondary outcomes and
comparisons, there is a strong case to
adjust scores to control for entering
academic ability.
Adjusted scores level the playing
field for schools with different
admissions standards or imperfectly
representative samples.
To adjust scores, we compute an
expected CLA score for your student
sample.
Expected scores are based on two
factors: (a) the academic ability of
your students prior to matriculation
and (b) the estimated linear
relationship between CLA scores
and entering academic ability of
student samples at all schools.
Differences between observed and
expected scores are reported in
standard error units for uniform
comparisons across CLA tasks. We
label them Deviation Scores and
present them in Table 1 on page 4.
For this report, Mean CLA Scores
quantify unadjusted performance
and permit absolute comparisons
while Deviation Scores quantify
adjusted performance and enable
controlled comparisons.
The next page summarizes both
unadjusted and adjusted results for
your student samples. It shows Mean
CLA Scores, Percentile Ranks (two
sets) and Performance Levels.
Unadjusted Percentile Ranks (on the
left of the next page) are based on the
range of Mean CLA Scores observed
across all schools.
Adjusted Percentile Ranks (on the
right) are based on the range of
Deviation Scores and are used to
assign Performance Levels defined
on page 4.
We compare the Deviation Scores
of your fall 2008 and spring 2009
student samples to estimate value
added. We label these estimates
Difference Scores.
Moving forward, we will continue
to provide both unadjusted and
adjusted scores. More importantly,
we will employ methodological
enhancements to maximize the
precision of our value-added
estimates, allow schools to select
multiple peer comparison groups,
and elevate the diagnostic value of
CLA results for the improvement of
teaching and learning.
2008–2009 CLA Institutional Report 3
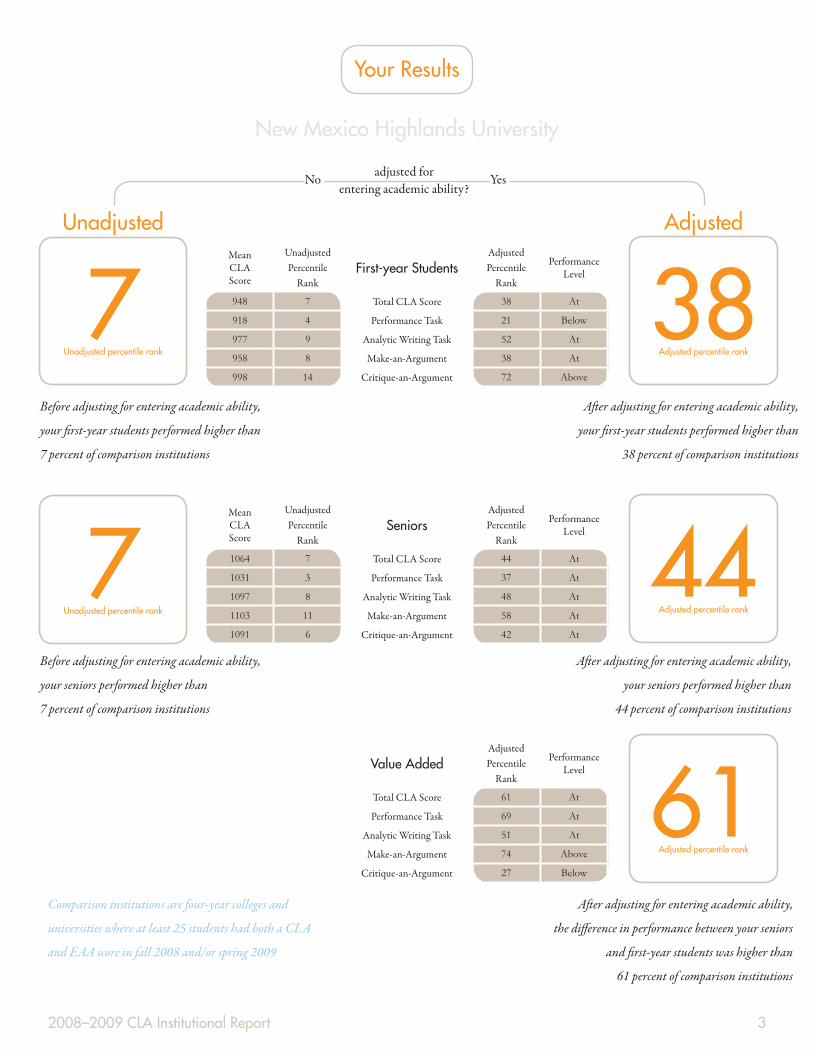
New Mexico Highlands University
Your Results
Unadjusted Adjusted
adjusted for entering academic ability?
No Yes
7Unadjusted percentile rank
38Adjusted percentile rank
7Unadjusted percentile rank
44Adjusted percentile rank
61Adjusted percentile rank
Mean CLA Score
Unadjusted Percentile
RankFirst-year Students
Adjusted Percentile
Rank
Performance Level
948 7 Total CLA Score 38 At
918 4 Performance Task 21 Below
977 9 Analytic Writing Task 52 At
958 8 Make-an-Argument 38 At
998 14 Critique-an-Argument 72 Above
Mean CLA Score
Unadjusted Percentile
RankSeniors
Adjusted Percentile
Rank
Performance Level
1064 7 Total CLA Score 44 At
1031 3 Performance Task 37 At
1097 8 Analytic Writing Task 48 At
1103 11 Make-an-Argument 58 At
1091 6 Critique-an-Argument 42 At
Value AddedAdjusted Percentile
Rank
Performance Level
Total CLA Score 61 At
Performance Task 69 At
Analytic Writing Task 51 At
Make-an-Argument 74 Above
Critique-an-Argument 27 Below
After adjusting for entering academic ability,
the difference in performance between your seniors
and first-year students was higher than
61 percent of comparison institutions
Before adjusting for entering academic ability,
your first-year students performed higher than
7 percent of comparison institutions
Before adjusting for entering academic ability,
your seniors performed higher than
7 percent of comparison institutions
After adjusting for entering academic ability,
your first-year students performed higher than
38 percent of comparison institutions
After adjusting for entering academic ability,
your seniors performed higher than
44 percent of comparison institutions
Comparison institutions are four-year colleges and
universities where at least 25 students had both a CLA
and EAA score in fall 2008 and/or spring 2009

2008–2009 CLA Institutional Report4
Your Results
Moving from right to left, Table 1 above
shows how many students completed
the CLA and their mean Entering
Academic Ability (EAA) scores,* as well
as their expected and observed mean
CLA scores.**
Unadjusted percentile ranks show how
your school’s mean CLA scores compare
to those at other schools BEFORE
adjusting for ability.
Adjusted percentile ranks are based on
deviation scores and are used to assign
performance levels.***
Deviation scores control for ability
and quantify the difference between
observed and expected mean CLA
scores in standard error units.
Difference scores represent estimates
of value added. They are calculated by
subtracting first-year deviation scores
from senior deviation scores.
SAT Math + Verbal, ACT Composite
or Scholastic Level Exam (SLE) scores
on the SAT scale. Hereinafter referred to
as Entering Academic Ability (EAA).
An “N/A” indicates that there were not
enough students with both CLA and
EAA scores to compute a result.
90-99th Well Above Expected70-89th Above Expected30-69th At Expected10-29th Below Expected0-9th Well Below Expected
* ** ***
1First-Year Students Performance
LevelAdjusted
Percentile RankDeviation
ScoreUnadjusted
Percentile RankObserved Mean
CLA ScoreExpected Mean
CLA ScoreMean EAA
ScoreStudent Count
Total CLA Score At 38 -0.3 7 948 964 874 103
Performance Task Below 21 -0.8 4 918 951 879 51
Analytic Writing Task At 52 0.0 9 977 975 869 52
Make-an-Argument At 38 -0.3 8 958 974 869 52
Critique-an-Argument Above 72 0.5 14 998 975 870 53
Seniors Performance Level
Adjusted Percentile Rank
Deviation Score
Unadjusted Percentile Rank
Observed Mean CLA Score
Expected Mean CLA Score
Mean EAA Score
Student Count
Total CLA Score At 44 -0.2 7 1064 1072 882 51
Performance Task At 37 -0.4 3 1031 1047 882 26
Analytic Writing Task At 48 0.0 8 1097 1095 882 25
Make-an-Argument At 58 0.3 11 1103 1085 882 25
Critique-an-Argument At 42 -0.2 6 1091 1103 882 25
Value-Added Estimates Performance Level
Adjusted Percentile Rank
Difference Score
Total CLA Score At 61 0.1
Performance Task At 69 0.4
Analytic Writing Task At 51 0.0
Make-an-Argument Above 74 0.6
Critique-an-Argument Below 27 -0.7

2008–2009 CLA Institutional Report 5
The counts, means,
percentiles, and standard
deviations in Table 2
represent students with and
without EAA scores.
As such, these data may
differ from those in Table 1.
Your Results
First-Year Students Student Count
25th Percentile Mean 75th
PercentileStandard Deviation
Performance Task 55 845 927 1035 129
Analytic Writing Task 54 887 977 1061 127
Make-an-Argument 54 827 957 1054 164
Critique-an-Argument 55 896 999 1107 149
Seniors Student Count
25th Percentile Mean 75th
PercentileStandard Deviation
Performance Task 29 908 1018 1074 147
Analytic Writing Task 27 932 1080 1240 192
Make-an-Argument 28 940 1078 1217 220
Critique-an-Argument 27 931 1080 1254 196
2

2008–2009 CLA Institutional Report6
Your Results
Figure 3 above shows data for schools
where at least 25 students had both a
CLA and EAA score in fall 2008 and/
or spring 2009.
The solid blue square (freshmen) and
solid red square (seniors) represent the
samples of students you tested.
Outlined blue and red and squares
represent other schools.
The diagonal lines (blue for freshmen
and, above that, red for seniors) show
the estimated linear relationship
between an institution’s mean EAA
score and its mean CLA score for its
students.
Schools above the relevant lines scored
higher than expected, whereas those
below the lines did not.
Appendix 8 summarizes the equations
used to estimate expected mean CLA
scores on the basis of mean EAA scores
across schools.
3
700 800 900 1000 1100 1200 1300 1400 1500700
800
900
1000
1100
1200
1300
1400
1500
Relationship Between CLA Performance and Entering Academic Ability (EAA)
Mean EAA Score
Mea
n To
tal C
LA S
core
Your Seniors
Seniorsat OtherSchools
Freshmenat OtherSchools
YourFreshmen

2008–2009 CLA Institutional Report 7
Diagnostic Guidance
Synthesizing information from multiple
sources; recognizing conflicting
evidence, weighing the credibility of
different sources of evidence; identifying
logical fallacies, interpreting data,
tables, and figures correctly; drawing
reasonable and logical inferences from
the available information; developing
sound conclusions based on all available
evidence; and utilizing the most relevant
and credible evidence available to justify
their conclusion.
Establishing a thesis or a position on an
issue; maintaining the thesis throughout
the essay; supporting the thesis with
relevant and persuasive examples (e.g.,
from personal experience, history,
art, literature, pop culture, or current
events); anticipating and countering
opposing arguments to the position,
fully developing ideas, examples, and
arguments; crafting an overall response
that generates interest, provokes thought,
and persuades the reader; organizing the
structure of the essay (e.g., paragraphing,
ordering of ideas and sentences within
paragraphs); employing transitions and
varied sentence structure to maintain
the flow of the argument; and utilizing
sophisticated grammar and vocabulary.
Identifying a variety of logical flaws or
fallacies in a specific argument; explaining
how or why the logical flaws affect
the conclusions in that argument; and
presenting their critique in a written
response that is a grammatically correct,
organized, well-developed, logically
sound, and neutral in tone.
Performance Task Make-an-Argument Critique-an-Argument
Analyzing complex, realistic scenarios
Writing a persuasive, analytic essay
Critiquing written arguments
CLA results operate as a signaling tool of overall institutional performance on tasks that measure
higher order skills holistically. However, the three types of CLA tasks—Performance, Make-an-
Argument and Critique-an-Argument—differ slightly in the combination of skills necessary to
perform well.
Indeed, some schools score significantly lower on one type than on another. Examining
performance across CLA task types can serve as an initial diagnostic exercise. Specifically, cases
of performance Well Below Expected or Below Expected on a particular task type indicate that
students are not demonstrating the expected level of skill (given their EAA scores) at analyzing
complex, realistic scenarios; writing a persuasive, analytic essay to support a position on an issue;
and/or critiquing written arguments.

2008–2009 CLA Institutional Report8
Moving Forward
We encourage institutions to examine
performance across CLA tasks and
communicate results across campus,
link student-level CLA results with
other data sources, pursue in-depth
sampling, stay informed through the
CLA Spotlight, and participate in CLA
Education offerings.
Student-level CLA results are provided
for you to link with other data sources
(e.g., course-taking patterns, grades,
portfolios, student satisfaction and
engagement, major-specific tests, etc.).
These internal analyses can help you
generate hypotheses for additional
research, which you can pursue through
CLA in-depth sampling in experimental
areas (e.g., programs or colleges within
your campus) in subsequent years or
simultaneously.
We welcome and encourage your
participation in the CLA Spotlight—a
series of free informational web
conferences. Each CLA Spotlight
features campuses doing promising work
using the CLA, guest-speakers from the
larger world of assessment, and/or CLA
staff members who provide updates or
insights to CLA-related programs and
projects.
CLA Education focuses on curriculum
and pedagogy, and embraces the crucial
role that faculty play in the process of
assessment.
The flagship program of CLA
Education is the Performance Task
Academy, which shifts the focus from
general assessment to the course-level
work of faculty. The Performance Task
Academy provides an opportunity for
faculty members to learn to diagnose
their individual students’ work and to
receive guidance in creating their own
performance tasks, which are designed
to supplement the educational reform
movement toward a case and problem
approach in learning and teaching.
A CLA Education web site also has
been formed as a clearing house for
performance tasks developed by
faculty. For more information, visit
www.claintheclassroom.org, or contact
Director of CLA Education, Dr. Marc
Chun at [email protected].
Through the steps noted above we
encourage institutions to move toward
a continuous system of improvement in
teaching and learning stimulated by the
CLA. Without your contributions, the
CLA would not be on the exciting path
that it is today. We look forward to your
continued involvement!

2008–2009 CLA Institutional Report 9
1 Task Overview
Introduction
The CLA is comprised of three types of prompts
within two types of task: the Performance Task
and the Analytic Writing Task. Most students
take one task or the other. The Analytic Writing
Task includes a pair of prompts called Make-an-
Argument and Critique-an-Argument.
The CLA uses direct measures of skills in which
students perform cognitively demanding tasks
from which quality of response is scored. All CLA
measures are administered online and contain
open-ended prompts that require constructed
responses. There are no multiple-choice questions.
The CLA tasks require that students integrate
critical thinking, analytic reasoning, problem
solving, and written communication skills. The
holistic integration of these skills on the CLA tasks
mirrors the requirements of serious thinking and
writing tasks faced in life outside of the classroom.

2008–2009 CLA Institutional Report10
1 Task Overview
Performance Task
Each Performance Task requires
students to use an integrated set of
critical thinking, analytic reasoning,
problem solving, and written
communication skills to answer
several open-ended questions about a
hypothetical but realistic situation. In
addition to directions and questions,
each Performance Task also has its
own document library that includes a
range of information sources, such as
letters, memos, summaries of research
reports, newspaper articles, maps,
photographs, diagrams, tables, charts,
and interview notes or transcripts.
Students are instructed to use these
materials in preparing their answers to
the Performance Task’s questions within
the allotted 90 minutes.
The first portion of each Performance
Task contains general instructions and
introductory material. The student is
then presented with a split screen. On
the right side of the screen is a list of the
materials in the Document Library. The
student selects a particular document
to view by using a pull-down menu. On
the left side of the screen are a question
and a response box. There is no limit
on how much a student can type. Upon
completing a question, students then
select the next question in the queue.
No two Performance Tasks assess
the exact same combination of skills.
Some ask students to identify and then
compare and contrast the strengths and
limitations of alternative hypotheses,
points of view, courses of action, etc. To
perform these and other tasks, students
may have to weigh different types of
evidence, evaluate the credibility of
various documents, spot possible bias,
and identify questionable or critical
assumptions.
Performance Tasks also may ask
students to suggest or select a course
of action to resolve conflicting or
competing strategies and then provide
a rationale for that decision, including
why it is likely to be better than one or
more other approaches. For example,
students may be asked to anticipate
potential difficulties or hazards that are
associated with different ways of dealing
with a problem, including the likely
short- and long-term consequences and
implications of these strategies. Students
may then be asked to suggest and
defend one or more of these approaches.
Alternatively, students may be asked
to review a collection of materials or
a set of options, analyze and organize
them on multiple dimensions, and then
defend that organization.
Performance Tasks often require
students to marshal evidence from
different sources; distinguish rational
from emotional arguments and fact
from opinion; understand data in tables
and figures; deal with inadequate,
ambiguous, and/or conflicting
information; spot deception and holes
in the arguments made by others;
recognize information that is and is not
relevant to the task at hand; identify
additional information that would help
to resolve issues; and weigh, organize,
and synthesize information from several
sources.

2008–2009 CLA Institutional Report 11
1 Task Overview
Analytic Writing Task
Students write answers to two types of
essay prompts, namely: a “Make-an-
Argument” question that asks them to
support or reject a position on some
issue; and a “Critique-an-Argument”
question that asks them to evaluate
the validity of an argument made
by someone else. Both of these tasks
measure a student’s skill in articulating
complex ideas, examining claims and
evidence, supporting ideas with relevant
reasons and examples, sustaining a
coherent discussion, and using standard
written English.
Make-an-Argument
A “Make-an-Argument” prompt
typically presents an opinion on some
issue and asks students to write, in 45
minutes, a persuasive, analytic essay to
support a position on the issue. Key
elements include: establishing a thesis
or a position on an issue; maintaining
the thesis throughout the essay;
supporting the thesis with relevant and
persuasive examples (e.g., from personal
experience, history, art, literature, pop
culture, or current events); anticipating
and countering opposing arguments
to the position, fully developing ideas,
examples, and arguments; crafting an
overall response that generates interest,
provokes thought, and persuades the
reader; organizing the structure of the
essay (e.g., paragraphing, ordering of
ideas and sentences within paragraphs);
employing transitions and varied
sentence structure to maintain the
flow of the argument; and utilizing
sophisticated grammar and vocabulary.
Critique-an-Argument
A “Critique-an-Argument” prompt
asks students, in 30 minutes, to critique
an argument by discussing how well
reasoned they find it to be (rather than
simply agreeing or disagreeing with the
position presented). Key elements of
the essay include: identifying a variety
of logical flaws or fallacies in a specific
argument; explaining how or why the
logical flaws affect the conclusions
in that argument; and presenting a
critique in a written response that is a
grammatically correct, organized, well-
developed, logically sound, and neutral
in tone.
2008–2009 CLA Institutional Report12
1 Task Overview
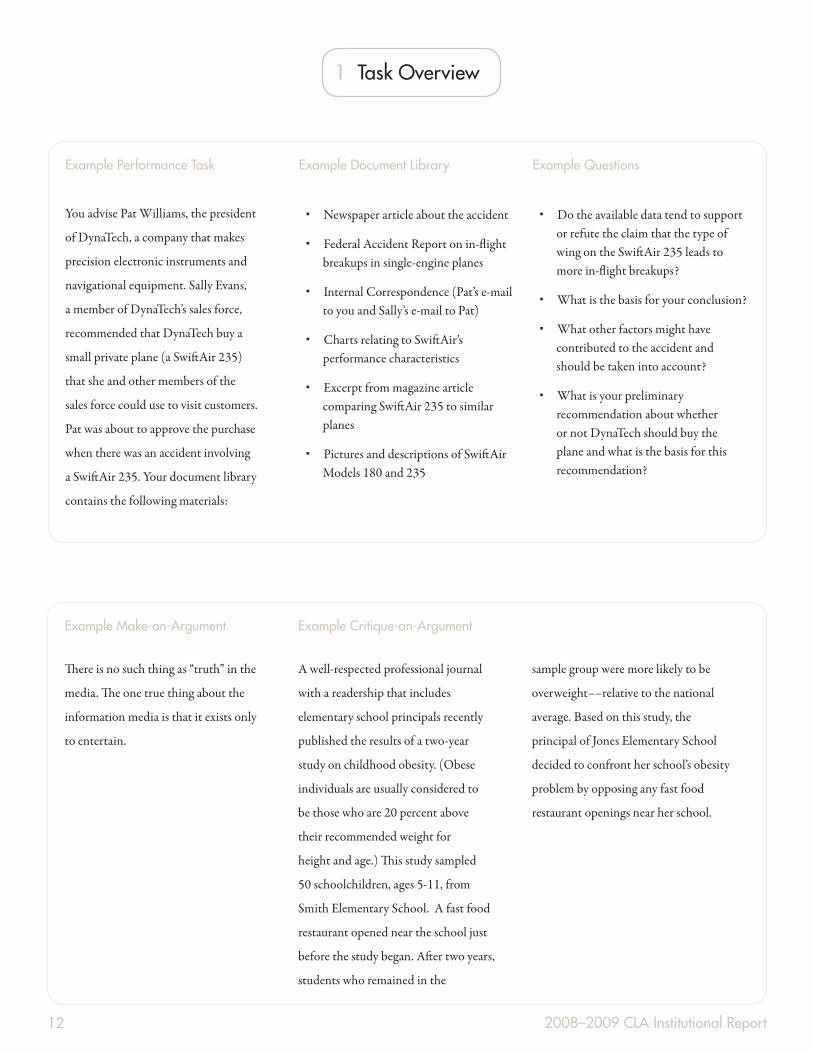
Example Performance Task
You advise Pat Williams, the president
of DynaTech, a company that makes
precision electronic instruments and
navigational equipment. Sally Evans,
a member of DynaTech’s sales force,
recommended that DynaTech buy a
small private plane (a SwiftAir 235)
that she and other members of the
sales force could use to visit customers.
Pat was about to approve the purchase
when there was an accident involving
a SwiftAir 235. Your document library
contains the following materials:
Example Document Library
Newspaper article about the accident �
Federal Accident Report on in-flight �breakups in single-engine planes
Internal Correspondence (Pat’s e-mail �to you and Sally’s e-mail to Pat)
Charts relating to SwiftAir’s �performance characteristics
Excerpt from magazine article �comparing SwiftAir 235 to similar planes
Pictures and descriptions of SwiftAir �Models 180 and 235
Example Questions
Do the available data tend to support �or refute the claim that the type of wing on the SwiftAir 235 leads to more in-flight breakups?
What is the basis for your conclusion? �
What other factors might have �contributed to the accident and should be taken into account?
What is your preliminary �recommendation about whether or not DynaTech should buy the plane and what is the basis for this recommendation?
Example Make-an-Argument
There is no such thing as “truth” in the
media. The one true thing about the
information media is that it exists only
to entertain.
Example Critique-an-Argument
A well- respected professional journal
with a readership that includes
elementary school principals recently
published the results of a two- year
study on childhood obesity. (Obese
individuals are usually considered to
be those who are 20 percent above
their recommended weight for
height and age.) This study sampled
50 schoolchildren, ages 5-11, from
Smith Elementary School. A fast food
restaurant opened near the school just
before the study began. After two years,
students who remained in the
sample group were more likely to be
overweight––relative to the national
average. Based on this study, the
principal of Jones Elementary School
decided to confront her school’s obesity
problem by opposing any fast food
restaurant openings near her school.

2008–2009 CLA Institutional Report 13
2 Task Development
Iterative Development Process
A team of researchers and writers
generate ideas for Make-an-Argument
and Critique-an-Argument prompts,
and Performance Task storylines, and
then contribute to the development
and revision of the prompts and
Performance Task documents.
For Analytic Writing Tasks, multiple
prompts are generated, revised and
pre-piloted, and those prompts that
elicit good critical thinking and writing
responses during pre-piloting are further
revised and submitted to more extensive
piloting.
During the development of
Performance Tasks, care is taken to
ensure that sufficient information is
provided to permit multiple reasonable
solutions to the issues present in
the Performance Task. Documents
are crafted such that information is
presented in multiple formats (e.g.,
tables, figures, news articles, editorials,
letters, etc.).
While developing a Performance Task,
a list of the intended content from each
document is established and revised.
This list is used to ensure that each piece
of information is clearly reflected in the
document and/or across documents,
and to ensure that no additional pieces
of information are embedded in the
document that were not intended. This
list serves as a draft starting point for
the analytic scoring items used in the
Performance Task scoring rubrics.
During revision, information is either
added to documents or removed from
documents to ensure that students could
arrive at approximately three or four
different conclusions based on a variety
of evidence to back up each conclusion.
Typically, some conclusions are designed
to be supported better than others.
Questions for the Performance Task
are also drafted and revised during the
development of the documents. The
questions are designed such that the
initial questions prompt the student
to read and attend to multiple sources
of information in the documents, and
later questions require the student to
evaluate the documents and then use
their analysis to draw conclusions and
justify those conclusions.
After several rounds of revision, the
most promising of the Performance
Tasks and the Make-an-Argument
and Critique-an-Argument prompts
are selected for pre-piloting. Student
responses from the pilot test are
examined to identify what pieces
of information are unintentionally
ambiguous, what pieces of information
in the documents should be removed,
etc. After revision and additional pre-
piloting, the best functioning tasks (i.e.,
those that elicit the intended types and
ranges of student responses) are selected
for full piloting.
During piloting, students complete
both an operational task and one of the
new tasks. At this point, draft scoring
rubrics are revised and tested in grading
the pilot responses, and final revisions
are made to the tasks to ensure that the
task is eliciting the types of responses
intended.

2008–2009 CLA Institutional Report14
3 Scoring Criteria
Introduction
This section summarizes the
types of questions addressed by
CLA scoring of all task types.
Because each CLA task and
their scoring rubrics differ, not
every item listed is applicable
to every task. The tasks cover
different aspects of critical
thinking, analytic reasoning,
problem solving, and writing
and in doing so can, in
combination, better assess the
entire domain of performance.
Assessing Writing
Analytic writing skills invariably
depend on clarity of thought.
Therefore, analytic writing
and critical thinking, analytic
reasoning, and problem
solving are related skills sets.
The CLA measures critical
thinking performance by asking
students to explain in writing
their rationale for various
conclusions. In doing so, their
performance is dependent
on both writing and critical
thinking as integrated rather
than separate skills. We evaluate
writing performance using
holistic scores that consider
several aspects of writing
depending on the task. The
following are illustrations of the
types of questions we address in
scoring writing on the various
tasks.
See page 16 for detail.
Assessing Critical Thinking, Analytic Reasoning and Problem Solving
Applied in combination, critical
thinking, analytic reasoning
and problem solving skills are
required to perform well on
CLA tasks. We define these
skills as how well students can
evaluate and analyze source
information, and subsequently
to draw conclusions and
present an argument based
upon that analysis. In scoring,
we specifically consider the
following items to be important
aspects of these skills.
See page 15 for detail.
2008–2009 CLA Institutional Report 15
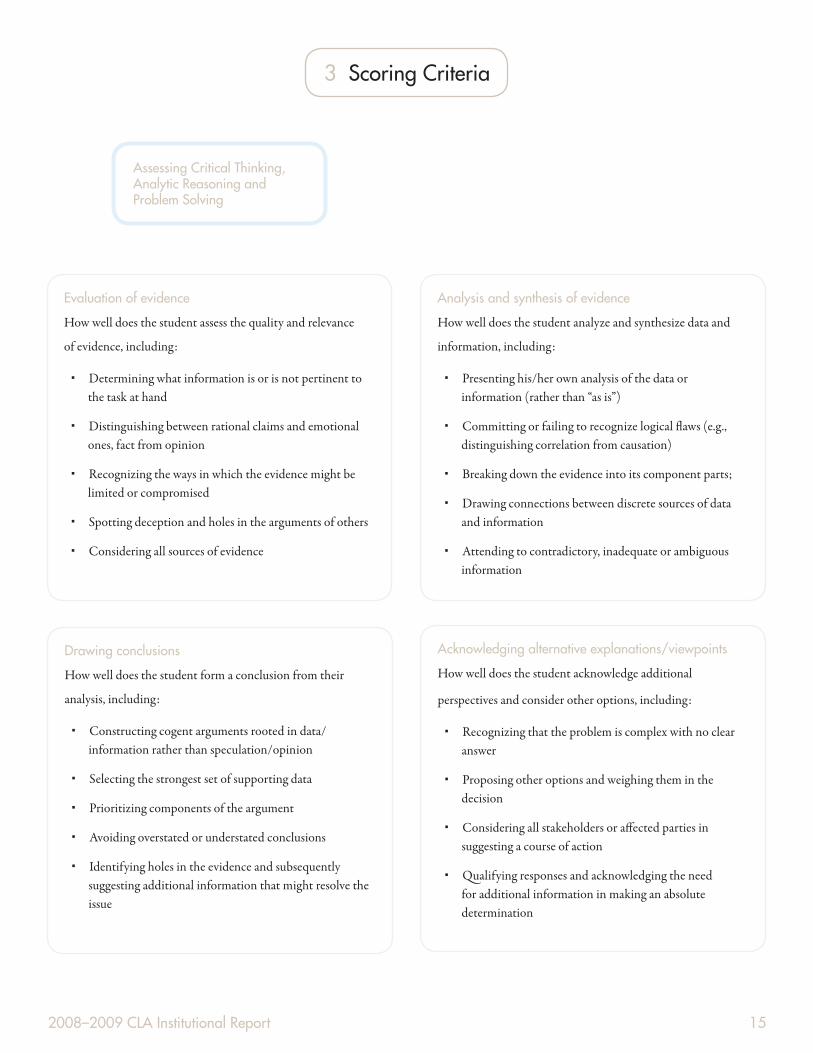
3 Scoring Criteria
Assessing Critical Thinking, Analytic Reasoning and Problem Solving
Evaluation of evidence
How well does the student assess the quality and relevance
of evidence, including:
Determining what information is or is not pertinent to �the task at hand
Distinguishing between rational claims and emotional �ones, fact from opinion
Recognizing the ways in which the evidence might be �limited or compromised
Spotting deception and holes in the arguments of others �
Considering all sources of evidence �
Analysis and synthesis of evidence
How well does the student analyze and synthesize data and
information, including:
Presenting his/her own analysis of the data or �information (rather than “as is”)
Committing or failing to recognize logical flaws (e.g., �distinguishing correlation from causation)
Breaking down the evidence into its component parts; �
Drawing connections between discrete sources of data �and information
Attending to contradictory, inadequate or ambiguous �information
Drawing conclusions
How well does the student form a conclusion from their
analysis, including:
Constructing cogent arguments rooted in data/ �information rather than speculation/opinion
Selecting the strongest set of supporting data �
Prioritizing components of the argument �
Avoiding overstated or understated conclusions �
Identifying holes in the evidence and subsequently �suggesting additional information that might resolve the issue
Acknowledging alternative explanations/viewpoints
How well does the student acknowledge additional
perspectives and consider other options, including:
Recognizing that the problem is complex with no clear �answer
Proposing other options and weighing them in the �decision
Considering all stakeholders or affected parties in �suggesting a course of action
Qualifying responses and acknowledging the need �for additional information in making an absolute determination

2008–2009 CLA Institutional Report16
3 Scoring Criteria
Assessing Writing
Presentation
How clear and concise is the argument? Does the student…
Clearly articulate the argument and the context for that �argument
Correctly and precisely use evidence to defend the �argument
Comprehensibly and coherently present evidence �
Development
How effective is the structure? Does the student…
Logically and cohesively organize the argument �
Avoid extraneous elements in the argument’s �development
Present evidence in an order that contributes to a �persuasive and coherent argument
Persuasiveness
How well does the student defend the argument? Does the
student…
Effectively present evidence in support of the argument �
Draw thoroughly and extensively from the available �
range of evidence
Analyze the evidence in addition to simply presenting it �
Consider counterarguments and address weaknesses in �
his/her own argument
Mechanics
What is the quality of the student’s writing?
Is vocabulary and punctuation used correctly �
Is the student’s understanding of grammar strong �
Is the sentence structure basic, or more complex and �
creative
Does the student use proper transitions �
Are the paragraphs structured logically and effectively �
Interest
How well does the student maintain the reader’s interest?
Does the...
Student use creative and engaging examples or �descriptions
Structure, syntax and organization add to the interest of �their writing
Student use colorful but relevant metaphors, similes, etc. �
Writing engage the reader �
Writing leave the reader thinking �

2008–2009 CLA Institutional Report 17
4 Scoring Process
Score Sheet
There are two types of items that appear
on a CLA score sheet: analytic and
holistic. Analytic scoring items are
particular to each prompt and holistic
items refer to general dimensions, such
as evaluation of evidence, drawing
conclusions, acknowledging alternative
explanations and viewpoints, and overall
writing. We compute raw scores for each
task by adding up all points on all items
(i.e., calculating a unit-weighted sum).
Performance Task scoring is tailored
to each specific prompt and includes
a combination of both holistic and
analytic scoring items. Though there
are many types of analytic items on the
Performance Task score sheets, the most
common represent a list of the possible
pieces of information a student could
or should raise in their response. These
cover the information presented in the
Performance Task documents as well
as information that can be deduced
from comparing information across
documents. The analytic items are
generally given a score of 0 if the student
did not use the information in their
response, or 1 if they did. The number
of analytic items varies by prompt.
Performance Task holistic items are
scored on four or seven-point scales
(i.e., 1-4 or 1-7). There are multiple
holistic items per Performance Task that
require graders to provide an evaluation
of different aspects of critical thinking
and reasoning in the student responses.
These holistic items include areas
such as the student’s use of the most
relevant information in the Performance
Task, their recognition of strengths
and weaknesses of various pieces of
information, overall critical thinking,
and overall writing.
Critique-an-Argument score sheets also
include a combination of analytic and
holistic scores. Critique-an-Argument
analytic items are a list of possible
critiques of the argument presented in
the prompt. In addition, a few holistic
items are used to rate the overall quality,
critical thinking and writing over the
entire response.
Make-an-Argument score sheets contain
only holistic items scored on four or
seven-point scales (i.e., 1-4 or 1-7). The
holistic items include ratings for various
aspects of writing (e.g., organization,
mechanics, etc.) and critical thinking
(e.g., reasoning and logic, sophistication
and depth of treatment of the issues
raised in the prompt) as well as two
overall assessments of writing and
critical thinking.
For all task types, blank responses or
responses that are entirely unrelated to
the task (e.g., writing about what they
had for breakfast) are assigned a 0 and
are flagged for removal from the school-
level results.
2008–2009 CLA Institutional Report18
4 Scoring Process
Scoring Procedure
All scorer candidates undergo rigorous training in
order to become certified CLA scorers. Training
includes an orientation to the prompt and score sheet,
instruction on how to evaluate the scoring items,
repeated practice grading a wide range of student
responses, and extensive feedback and discussion after
scoring each response.
After participating in training, scorers complete a
reliability check where they score the same set of
student responses. Scorers with low agreement or
reliability (determined by comparisons of raw score
means, standard deviations and correlations among the
scorers) are either further coached or removed from
scoring.
In fall 2008 and spring 2009, a combination of
machine and human scoring was used for the Analytic
Writing Task.
The CLA utilizes Pearson Knowledge Technology’s
Intelligent Essay Assessor program for evaluating
responses to the Make-an-Argument and Critique-an-
Argument prompts.
The machine scoring engine was developed and tested
using scores from a broad range of responses that were
previously scored by humans (often double scored).
In some cases the automated scoring engine is unable
to score off-topic or abnormally short/long responses.
These student responses are scored by humans.

2008–2009 CLA Institutional Report 19
ACT to SAT
36 160035 158034 152033 147032 142031 138030 134029 130028 126027 122026 118025 114024 111023 107022 103021 99020 95019 91018 87017 83016 78015 74014 68013 62012 56011 500
5 Scaling Procedures
To facilitate reporting results across
schools, ACT scores were converted
(using the ACT-SAT crosswalk to the
right) to the scale of measurement used
to report SAT scores.
For institutions where a majority of
students did not have ACT or SAT
scores (e.g., two-year institutions and
open admission schools), we make
available the Scholastic Level Exam
(SLE), a short-form cognitive ability
measure, as part of the CLA. The SLE is
produced by Wonderlic, Inc. SLE scores
were converted to SAT scores using data
from 1,148 students participating in
spring 2006 that had both SAT and SLE
scores. These converted scores (both
ACT to SAT and SLE to SAT) are
referred to simply as entering academic
ability (EAA) scores.
Students receive a single score on a
CLA task because each task assesses
an integrated set of critical thinking,
analytic reasoning, problem solving, and
written communication skills.
Standard ACT to SAT Conversion Table
Sources:
“Concordance Between ACT Assessment
and Recentered SAT I Sum Scores” by
N.J. Dorans, C.F. Lyu, M. Pommerich,
and W.M. Houston (1997), College and
University, 73, 24-31; “Concordance
between SAT I and ACT Scores for
Individual Students” by D. Schneider and
N.J. Dorans, Research Notes (RN-07),
College Entrance Examination Board:
1999; “Correspondences between ACT
and SAT I Scores” by N.J. Dorans, College
Board Research Report 99-1, College
Entrance Examination Board: 1999; ETS
Research Report 99-2, Educational Testing
Service: 1999.

2008–2009 CLA Institutional Report20
Each Performance Task and Analytic
Writing Task has a unique scoring
rubric, and the maximum number of
reader assigned raw score points differs
across tasks. Consequently, a given
reader-assigned raw score, such as 15
points, may be a relatively high score on
one task but a low score on another task.
To adjust for such differences, reader-
assigned raw scores on the different
tasks are converted to a common scale
of measurement. This process results
in scale scores that reflect comparable
levels of proficiency across tasks. For
example, a given CLA scale score
indicates approximately the same
percentile rank regardless of the task
on which it was earned. This feature of
the CLA scale scores allows combining
scores from different tasks to compute
a school’s mean scale score for each task
type as well as a total average scale score
across types.
A linear scale transformation is used
to convert reader-assigned raw scores
to scale scores. This process results
in a scale score distribution with the
same mean and standard deviation as
the Entering Academic Ability (EAA)
scores of the freshmen who took that
measure. This type of scaling preserves
the shape of the raw score distribution
and maintains the relative standing of
students. For example, the student with
the highest raw score on a task will also
have the highest scale score on that task,
the student with the next highest raw
score will be assigned the next highest
scale score, and so on.
This type of scaling generally results in
the highest raw score earned on a task
receiving a scale score of approximately
the same value as the maximum EAA
score of any freshman who took that
task. Similarly, the lowest raw score
earned on a task would be assigned a
scale score value that is approximately
the same as the lowest EAA score of any
freshman who took that task. On very
rare occasions, a student may achieve an
exceptionally high or low raw score (i.e.,
well above or below the other students
taking that task). When this occurs,
it results in assigning a student a scale
score that is outside of the normal EAA
range. Prior to the spring of 2007, scores
were capped at 1600. Capping was
discontinued starting in fall 2007.
In the past, CAE revised its scaling
equations each fall. However, many
institutions would like to make year-
to-year comparisons (i.e., as opposed
to just fall to spring). To facilitate this
activity, in fall 2007 CAE began using
the same scaling equations it developed
for the fall 2006 administration and
has done so for new tasks introduced
since then. As a result of this policy, a
given raw score on a task will receive the
same scale score regardless of when the
student took the task.
5 Scaling Procedures

2008–2009 CLA Institutional Report 21
Nation CLACarnegie Classification Number Percentage Number Percentage
Doctorate-granting Universities 282 16% 33 17%Master’s Colleges and Universities 664 39% 88 47%Baccalaureate Colleges 767 45% 68 36%
1,713 189
Source: Carnegie Foundation for the Advancement of Teaching, Carnegie Classifications Data File, June 11, 2008.
6 Institutional Sample
4
In the fall 2008 - spring 2009 testing cycle, 191
institutions tested enough students to provide
sufficiently reliable data for the school level analyses
and results presented in this report.
Table 4 shows CLA schools grouped by Basic
Carnegie Classification. The spread of schools
corresponds fairly well with that of the 1,713 four-year
institutions across the nation. Table 4 counts exclude
some institutions that do not fall into these categories,
such as Special Focus Institutions and institutions
based outside of the United States.

2008–2009 CLA Institutional Report22
School Characteristic Nation CLA
Percentage public 37% 50%
Percentage Historically Black College or University (HBCU) 5% 4%
Mean percentage of undergraduates receiving Pell grants 34% 31%
Mean four-year graduation rate 36% 36%
Mean six-year graduation rate 52% 53%
Mean first-year retention rate 73% 76%
Mean Barron’s selectivity rating 3.4 3.3
Mean estimated median SAT score 1067 1060
Mean number of FTE undergraduate students (rounded) 4,320 6,020
Mean student-related expenditures per FTE student (rounded) $12,365 $11,070
Source: College Results Online dataset, managed by and obtained with permission from the Education Trust, covers
most 4-year Title IV-eligible higher-education institutions in the United States. Data were constructed from IPEDS
and other sources. Because all schools did not report on every measure in the table, the averages and percentages
may be based on slightly different denominators.
6 Institutional Sample
Table 5 provides comparative statistics on some
important characteristics of colleges and universities
across the nation with those of the CLA schools,
and suggests that these CLA schools are fairly
representative of institutions nationally. Percentage
public is one exception.
5
2008–2009 CLA Institutional Report 23
6 Institutional Sample
CLA-participating students appeared to be generally
representative of their classmates with respect to
entering ability levels as measured by Entering
Academic Ability (EAA) scores.
Specifically, across institutions, the average EAA score
of CLA freshmen (as verified by the registrar) was only
9 points higher than that of the entire freshman class*:
1059 versus 1050 (n=175). The average EAA score of
CLA seniors (as verified by the registrar) was 16 points
higher than that of the entire senior class**: 1087
versus 1071 (n=161).
The correlation between the average EAA score of
CLA freshmen and their classmates was extremely
high (r=.94) (n=175). The correlation between the
average EAA score of CLA seniors and their classmates
was also high (r=.92) (n=161).
These data suggest that as a group, CLA participants
were similar to all students at participating schools.
This correspondence increases confidence in the
inferences that can be made from the results with the
samples of students that were tested at a school to all
the students at that institution.
* As reported by 175 school registrars in response to a
fall 2008 request for information.
** As reported by 161 school registrars in response to a
spring 2009 request for information.

2008–2009 CLA Institutional Report24
6 Institutional Sample
The institutions listed here in alphabetical order agreed to be
identified as participating schools and may or may not have tested
enough students to be included in comparative analyses.
Alaska Pacific UniversityAllegheny CollegeAlma CollegeArizona State UniversityAuburn UniversityAuburn University MontgomeryAugustana CollegeAurora UniversityAverett UniversityBarton CollegeBethel UniversityBluefield State CollegeCabrini CollegeCalifornia Baptist UniversityCalifornia Maritime AcademyCalifornia State Polytechnic University, San
Luis ObispoCalifornia State University - San MarcosCalifornia State University, BakersfieldCalifornia State University, Channel IslandsCalifornia State University, ChicoCalifornia State University, Dominguez
HillsCalifornia State University, East BayCalifornia State University, FresnoCalifornia State University, FullertonCalifornia State University, Long BeachCalifornia State University, Los AngelesCalifornia State University, Monterey BayCalifornia State University, SacramentoCalifornia State University, San BernardinoCalifornia State University, StanislausCarlow UniversityCarthage CollegeCedar Crest CollegeCentral CollegeCentral Connecticut State University
Central Washington UniversityCharleston Southern UniversityClaremont McKenna CollegeCollege of Notre Dame of MarylandCollege of Saint Benedict/Saint John’s
UniversityCollege of the Marshall IslandsColorado State UniversityConcord UniversityDelaware State UniversityDominican UniversityDominican University of CaliforniaDouglas CollegeDrake UniversityEarlham CollegeEastern Connecticut State UniversityEckerd CollegeEmory & Henry CollegeEmporia State UniversityEureka CollegeFairmont State UniversityFayetteville State UniversityFlagler CollegeFlorida International UniversityFlorida State UniversityFort Hays State UniversityFranklin Pierce UniversityFranklin UniversityGeorgetown CollegeGlenville State CollegeGustavus Adolphus CollegeHannibal-LaGrange CollegeHastings CollegeHilbert CollegeHope CollegeHoughton CollegeHumboldt State University
Illinois CollegeIllinois Wesleyan UniversityIndiana University of PennsylvaniaIndiana Wesleyan UniversityJackson State UniversityJamestown CollegeJuniata CollegeKalamazoo CollegeLaGrange CollegeLane CollegeLewis & Clark CollegeLouisiana Tech UniversityLoyola University New OrleansLuther CollegeLynchburg CollegeMacalester CollegeMarian UniversityMarshall UniversityMcMurry UniversityMercer UniversityMessiah CollegeMetropolitan State UniversityMillersville University of PennsylvaniaMills CollegeMinot State UniversityMisericordia UniversityMissouri Western State UniversityMorehead State UniversityMorningside CollegeMount Saint Mary CollegeNebraska Wesleyan UniversityNew Mexico Highlands UniversityNicholls State UniversityNorth Park UniversityPacific UniversityPeabody College at Vanderbilt UniversityPeace College

2008–2009 CLA Institutional Report 25
6 Institutional Sample
Pittsburg State UniversityPlymouth State UniversityPrairie View A&M UniversityPresbyterian CollegeRamapo College of New JerseyRandolph-Macon CollegeRhode Island CollegeRice UniversityRichard Stockton College of New JerseyRockford CollegeSaginaw Valley State UniversitySan Diego State UniversitySan Francisco State UniversitySan Jose State UniversitySeton Hill UniversityShawnee State UniversityShepherd UniversitySlippery Rock UniversitySonoma State UniversitySouthern Oregon UniversitySouthern Virginia UniversitySouthwestern UniversitySpringfield CollegeSt. Cloud State UniversityStephens CollegeStetson UniversityStonehill CollegeSUNY College at BuffaloSUNY College at OneontaTarleton State UniversityTexas Lutheran UniversityTexas State University San MarcosTexas Tech UniversityThe College of IdahoThe College of St. ScholasticaThe University of KansasTrinity Christian College
Truman State UniversityTufts UniversityUniversity of AlabamaUniversity of CharlestonUniversity of Colorado at Colorado SpringsUniversity of EvansvilleUniversity of FindlayUniversity of GeorgiaUniversity of Great FallsUniversity of Missouri - St. LouisUniversity of New HampshireUniversity of Northern ColoradoUniversity of PittsburghUniversity of Southern CaliforniaUniversity of Texas - Pan AmericanUniversity of Texas at ArlingtonUniversity of Texas at AustinUniversity of Texas at DallasUniversity of Texas at El PasoUniversity of Texas at San AntonioUniversity of Texas at TylerUniversity of Texas of the Permian BasinUniversity of Wisconsin OshkoshUpper Iowa UniversityUrsinus CollegeUrsuline CollegeWagner CollegeWeber State UniversityWesley CollegeWest Liberty UniversityWest Virginia State UniversityWest Virginia UniversityWest Virginia University Institute of
TechnologyWest Virginia Wesleyan CollegeWestern Michigan UniversityWestminster College (MO)
Westminster College (UT)Westmont CollegeWichita State UniversityWillamette UniversityWilliam Woods UniversityWinston Salem State UniversityWittenberg UniversityWofford CollegeWright State University
The institutions listed here in alphabetical order agreed to be
identified as participating schools and may or may not have tested
enough students to be included in comparative analyses.

2008–2009 CLA Institutional Report26
Fall 2008 Sample (student level)
Student Count
25th Percentile Mean 75th
PercentileStandard Deviation
Performance Task 13857 934 1068 1191 176
Analytic Writing Task 13586 983 1110 1231 173
Make-an-Argument 13746 970 1113 1263 203
Critique-an-Argument 13703 967 1104 1234 193
Spring 2009 Sample (student level)
Student Count
25th Percentile Mean 75th
PercentileStandard Deviation
Performance Task 8835 1035 1166 1291 186
Analytic Writing Task 8726 1101 1226 1360 179
Make-an-Argument 8772 1079 1211 1358 206
Critique-an-Argument 8764 1087 1239 1388 205
7 Institutional Results
Tables 6 and 7 (below) present summary statistics
including counts, means, 25th and 75th percentiles,
and standard deviations. Units of analysis are
students for Table 6 and schools for Table 7. These
data represent students with and without Entering
Academic Ability (EAA) scores.
Fall 2008 Sample (school level)
School Count
25th Percentile Mean 75th
PercentileStandard Deviation
Performance Task 183 1000 1067 1121 90
Analytic Writing Task 183 1033 1110 1184 106
Make-an-Argument 183 1033 1113 1189 114
Critique-an-Argument 183 1032 1105 1180 102
Spring 2009 Sample (school level)
School Count
25th Percentile Mean 75th
PercentileStandard Deviation
Performance Task 191 1114 1170 1219 83
Analytic Writing Task 191 1160 1230 1298 95
Make-an-Argument 191 1139 1215 1274 96
Critique-an-Argument 191 1172 1243 1322 98
7
6

2008–2009 CLA Institutional Report 27
Fall 2008 Intercept Slope Standard Error R-square
Total CLA Score 349 0.70 44.9 0.79
Performance Task 364 0.67 41.1 0.80
Analytic Writing Task 332 0.74 53.5 0.75
Make-an-Argument 312 0.76 63.8 0.69
Critique-an-Argument 349 0.72 49.3 0.77
8 Regression Equations
8
Some schools may be interested in predicting mean
CLA scores for other mean Entering Academic Ability
(EAA) scores.
Table 8 below provides the necessary parameters from
the regression equations that will allow you to carry
out your own calculations on different samples within
your Student Data File.
Specifically, identify a sample of students with both
CLA and EAA scores. Take the mean EAA score,
multiply it by the appropriate slope below, add the
intercept, and you are left with a predicted mean CLA
score.
Take the difference between the predicted and
observed mean CLA scores and divide that by the
appropriate standard error to calculate your own
deviation score.
Spring 2009 Intercept Slope Standard Error R-square
Total CLA Score 499 0.65 48.6 0.68
Performance Task 496 0.62 44.2 0.72
Analytic Writing Task 488 0.69 52.1 0.71
Make-an-Argument 495 0.67 55.5 0.67
Critique-an-Argument 475 0.71 55.1 0.70

2008–2009 CLA Institutional Report28
9 Student Data File
In tandem with this report, we provide a
CLA Student Data File, which includes
over 60 variables across three categories:
self-reported information from students
in their CLA on-line profile; CLA
scores and identifiers; and information
provided/verified by the registrar.
We provide student-level information
for linking with other data you collect
(e.g., from NSSE, CIRP, portfolios,
local assessments, course-taking
patterns, participation in specialized
programs, etc.) to help you hypothesize
about campus-specific factors related to
overall institutional performance.
Student-level scores are not designed to
be diagnostic at the individual level and
should be considered as only one piece of
evidence about a student’s skills.
Self-Reported Data
Age �
Gender �
Race/Ethnicity �
Primary and Secondary �Academic Major (34 categories)
Field of Study (6 categories; �based on primary academic major)
English as primary language �
Total years at school �
Attended school as Freshman, �Sophomore, Junior, Senior
Registrar Data
Class Standing �
Transfer Student Status �
Program ID and Name (for �classification of students into different colleges, schools, fields of study, majors, programs, etc.)
Entering Academic Ability �(EAA) Score
SAT I - Math �
SAT I - Verbal / Critical �Reading
SAT Total (Math + Verbal) �
SAT I - Writing �
SAT I - Writing (Essay sub- �score)
SAT I - Writing (Multiple- �choice subscore)
ACT - Composite �
ACT - English �
ACT - Reading �
ACT - Mathematics �
ACT - Science �
ACT - Writing �
CLA Scores and Identifiers
CLA scores for Performance Task, �Analytic Writing Task, Make-an-Argument, Critique-an-Argument, and Total CLA Score (depending on the number of tasks taken and completeness of responses):
CLA scale scores; -
Student Performance Level cat- -egories (i.e., well below expected, below expected, at expected, above expected, well above expected) if CLA scale score and entering academic ability (EAA) scores are available;
Percentile Rank in the CLA -(among students in the same class year; based on scale score); and
Percentile Rank at School -(among students in the same class year; based on scale score).
Unique CLA numeric identifiers �
Name (first, middle initial, last), �E-mail address, Student ID
Year, Administration (Fall or Spring), �Type of Test (90 or 180-minute), Date of test

2008–2009 CLA Institutional Report 29
10 CAE Board of Trustees and Officers
Roger BenjaminPresident & CEO
James HundleyExecutive Vice President & COO
Benno SchmidtChairman, CAE
Richard AtkinsonPresident Emeritus, University of California System
Doug BennettPresident, Earlham College
Michael CrowPresident, Arizona State University
Russell C. DeyoVice President & General Counsel, Johnson & Johnson
Richard FosterManaging Partner, Millbrook Management Group, LLC
Ronald GidwitzChairman, GCG Partners
Lewis B. KadenVice Chairman, Citigroup Inc.
Michael LomaxPresident, United Negro College Fund
Katharine LyallPresident Emeritus, University of Wisconsin System
Eduardo MartiPresident, Queensborough Community College, CUNY
Ronald MasonPresident, Jackson State University
Diana NatalicioPresident, University of Texas at El Paso
Charles ReedChancellor, California State University
Michael D. RichExecutive Vice President, RAND Corporation
Farris WomackExecutive Vice President and Chief Financial Officer, Emeritus
Professor, EmeritusThe University of Michigan

2008–2009 CLA Institutional Report30 30
pb