Embed Size (px)
Citation preview

New Mexico
Prescription Monitoring Program Data Report
2006-2013

1
Table of Contents Introduction .................................................................................................................................................. 2
Methods .................................................................................................................................................... 3
Results ....................................................................................................................................................... 4
Demographics ............................................................................................................................................... 5
Opioids ...................................................................................................................................................... 5
Benzodiazepines ....................................................................................................................................... 6
Stimulants ................................................................................................................................................. 7
Trends over time ........................................................................................................................................... 8
Opioids ...................................................................................................................................................... 8
Benzodiazepines ....................................................................................................................................... 9
Stimulants ............................................................................................................................................... 10
Geography ................................................................................................................................................... 11
Opioids .................................................................................................................................................... 11
Benzodiazepines ..................................................................................................................................... 13
Stimulants ............................................................................................................................................... 15
Prescribing patterns .................................................................................................................................... 17
High dose ................................................................................................................................................ 19
Opioids plus benzodiazepines ................................................................................................................. 19
Opioids, Benzodiazepines and Carisoprodol ........................................................................................... 20
Multiple practitioners ............................................................................................................................. 21
Summary ..................................................................................................................................................... 22

2
Introduction
Drug overdose death has become the leading cause of injury death in New Mexico and nationally over the past decade (New Mexico Substance Abuse Epidemiological Profile, 2013). New Mexico had the second-highest drug overdose death rate, after West Virginia, in 2010 (CDC Wonder). In the period from 2008-2012, there were an average of 483 drug overdose deaths in New Mexico each year, more than three times as many as there were in 1990-1994. Overdose deaths involving prescription drugs averaged 325 per year in 2008-2012 in New Mexico, compared to an average of 211 deaths per year involving illicit drugs (these two categories are not mutually exclusive). The number of overdose deaths involving prescription drugs exceeded the number involving illicit drugs in 2006, and now outnumber illicit drug overdose deaths by 60% (Figure 1).
In response to the increase in prescription drug overdose, the New Mexico Prescription Monitoring Program (PMP) was established in 2005. The PMP is operated by the New Mexico Board of Pharmacy
0
5
10
15
20
25
30
1990
19
91
1992
19
93
1994
19
95
1996
19
97
1998
19
99
2000
20
01
2002
20
03
2004
20
05
2006
20
07
2008
20
09
2010
20
11
2012
Deat
hs p
er 1
00,0
00 p
opul
atio
n
Figure 1: Overdose death rates involving presciption and illicit drugs, New Mexico 1990-2012
Total
Prescription
Illicit
Categories are not mutually exclusive Rates are age adjusted to the US 2000 standard population Source: Office of the Medical Investigator; UNM/GPS population estimates

3
under the board’s authority to regulate pharmacies and has been in place since July 2005. All controlled substance prescriptions filled by pharmacies are required to be reported to the PMP within seven days. The information collected by the PMP is similar to the information on a prescription label, and identify the prescriber, the patient, the pharmacy, the drug and details of the prescription such as quantity and number of days of supply.
More than 3 million prescriptions for controlled substances are reported to the NM PMP each year. Controlled substances are a special class of prescription drugs that are considered substantially more dangerous than other prescription drugs. Controlled substances were involved in 88% of the drug overdose deaths that involved prescription drugs in 2009-2013 in New Mexico.
Methods
PMP data for 2006-2013 were analyzed for this report. The data represent prescriptions filled (including refills) by patients in that period. Prescriptions written by veterinarians are excluded. Population estimates used for rates are from the Geospatial and Population Studies (GPS) program at the University of New Mexico.
There are a number of factors that should be taken into consideration when reviewing information from the PMP:
• Federal pharmacies (Military, Veterans Administration and Indian Health Service) cannot be required to report to the state system. However, some have begun reporting on a voluntary basis in the last year or two. In some counties Federal pharmacies account for a significant fraction of the prescriptions dispensed, and their addition may impact the apparent trends over time.
• Age and gender are captured by the PMP, but race/ethnicity is not. • PMP data does not contain information about the diagnosis underlying the prescription.
Prescriptions for cancer or hospice care cannot be excluded or analyzed separately. • The PMP tracks prescriptions filled, not consumed. For example, a patient may fill a 30 day
prescription for an opioid pain reliever but only use 3 days of medication.
The main classes of drugs analyzed in this report are:
• Opioids, which are powerful pain relievers. Opioids have a significant risk of causing overdose death. Examples are morphine, oxycodone and hydrocodone. Because opioids vary widely in strength, a factor is applied to each opioid prescription to compute the morphine milligram equivalent (MME) quantity of that prescription. This allows computing a measure of the total amount of opioids dispensed taking into account the different strengths of the drugs.
• Benzodiazepines, which are anti-anxiety drugs. Benzodiazepines are frequently involved in overdose deaths, but they are very rarely the only drug involved. In these data, the

4
benzodiazepine-like drugs, which are insomnia drugs like Ambien, are included in the benzodiazepine category. Like opioids, benzodiazepines vary in strength, so a factor is applied to each prescription to compute the valium milligram equivalent (VME).
• Stimulants, which are often used to treat attention deficit hyperactivity disorder (ADHD) and related conditions. Total quantities are expressed in milligrams.
Results
Opioids are by far the most commonly prescribed controlled substances. In 2013 opioids accounted for 54% of all controlled substance prescriptions filled, followed by benzodiazepines at 29% and stimulants at 8% (Figure 2). The only muscle relaxant on the controlled substance list is Carisoprodol (Soma®).
Note: These are number of prescriptions filled, not numbers of patients. Patients may receive multiple prescriptions in a year.
0 500,000 1,000,000 1,500,000 2,000,000
Opioids
Benzodiazepines
Stimulants
Barbiturates
Muscle Relaxants
Other
Number of Prescriptions filled
Figure 2: Prescriptions Reported to the NM PMP, 2013
Source: NM PMP

5
Demographics
Opioids
New Mexicans were more likely to fill opioid prescriptions as they aged (Figure 3a). Women were slightly more likely to fill opioid prescriptions than men. However, the amount of MME consumed is more likely to increase a person’s risk of drug overdose and men fill prescriptions with higher MME than women, especially between 25-74 years of age (Figure 3b). This suggests that, although women filled more prescriptions, men filled stronger prescriptions. Middle aged patients, especially ages 55-64, are more likely to be filling high MME prescriptions (Figure 3b).
0
100
200
300
400
500
0-4 5-14 15-24 25-34 35-44 45-54 55-64 65-74 75-84 85+
Patie
nts p
er 1
,000
pop
ulat
ion
Age group
Figure 3a: Patients Filling Opioid Prescritptions per 1,000 Population, NM 2013
Male
Female
Source: NM PMP; UNM/GPS population estimates
0
1,000
2,000
3,000
4,000
5,000
6,000
7,000
0-4 5-14 15-24 25-34 35-44 45-54 55-64 65-74 75-84 85+
MM
E pe
r pat
ient
Age group
Figure 3b: Opioid MME per Patient, NM 2013
Male
Female
Source: NM PMP
6
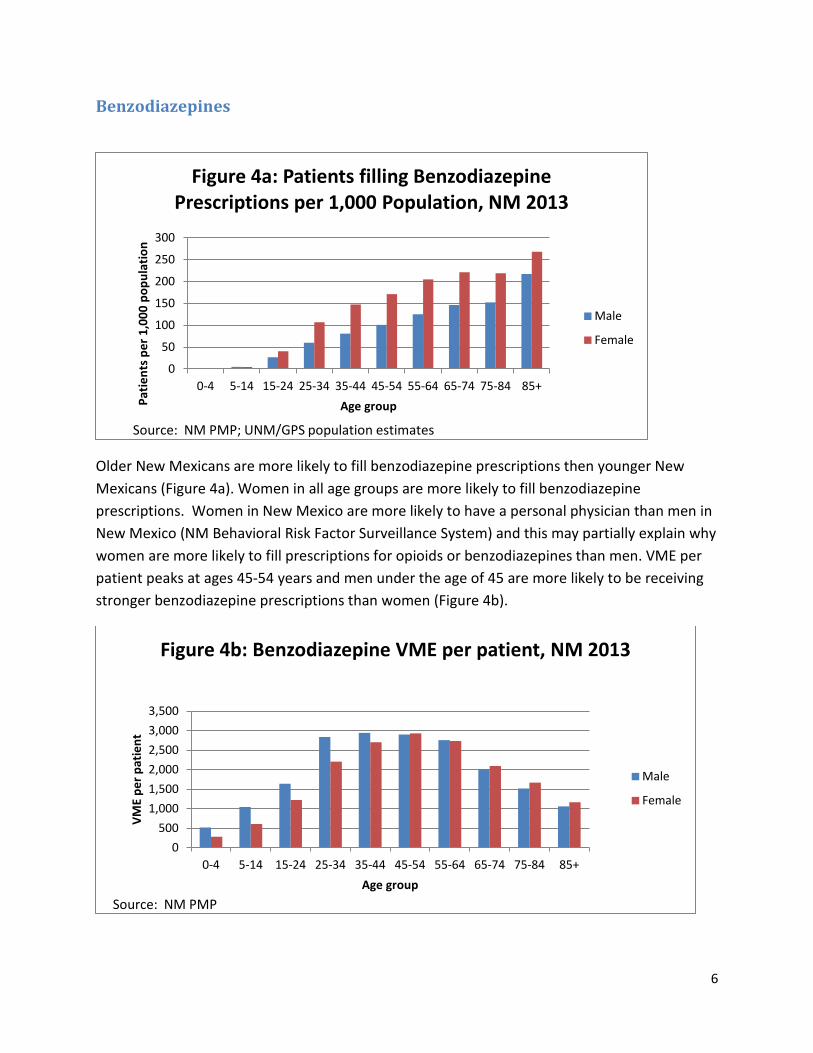
Benzodiazepines
Older New Mexicans are more likely to fill benzodiazepine prescriptions then younger New Mexicans (Figure 4a). Women in all age groups are more likely to fill benzodiazepine prescriptions. Women in New Mexico are more likely to have a personal physician than men in New Mexico (NM Behavioral Risk Factor Surveillance System) and this may partially explain why women are more likely to fill prescriptions for opioids or benzodiazepines than men. VME per patient peaks at ages 45-54 years and men under the age of 45 are more likely to be receiving stronger benzodiazepine prescriptions than women (Figure 4b).
0
50
100
150
200
250
300
0-4 5-14 15-24 25-34 35-44 45-54 55-64 65-74 75-84 85+
Patie
nts p
er 1
,000
pop
ulat
ion
Age group
Figure 4a: Patients filling Benzodiazepine Prescriptions per 1,000 Population, NM 2013
Male
Female
Source: NM PMP; UNM/GPS population estimates
0 500
1,000 1,500 2,000 2,500 3,000 3,500
0-4 5-14 15-24 25-34 35-44 45-54 55-64 65-74 75-84 85+
VME
per p
atie
nt
Age group
Figure 4b: Benzodiazepine VME per patient, NM 2013
Male
Female
Source: NM PMP

7
Stimulants
Stimulants, such as Adderall® and Ritalin®, are more likely to be prescribed to youth aged 5-14 years (Figure 5a). Among youth 5-14 and 15-24 years of age, boys and young men are more likely to fill a prescription for a stimulant, particularly among the 5-14 age group. This is not surprising as boys are more likely than girls to be diagnosed with conditions that are commonly treated with stimulants, such as attention-deficit/hyperactivity disorder (ADHD). Adults aged 55-64 years are dispensed the most milligrams per patient, although the amount of stimulant prescribed per patient is fairly similar between the ages of 5 and 84 years of age.
0 10 20 30 40 50 60 70 80
0-4 5-14 15-24 25-34 35-44 45-54 55-64 65-74 75-84 85+
Patie
nts p
er 1
,000
pop
ulat
ion
Age group
Figure 5a: Patients filling Stimulant Prescriptions per 1,000 Population, NM 2013
Male
Female
Source: NM PMP; UNM/GPS population estimates
0
1,000
2,000
3,000
4,000
5,000
6,000
0-4 5-14 15-24 25-34 35-44 45-54 55-64 65-74 75-84 85+
Mill
igra
ms
per p
atie
nt
Age group
Figure 5b: Milligrams of Stimulant per Patient, NM 2013
Male
Female
Source: NM PMP

8
Trends over time
Trends in filled prescriptions are described in this report using two methods. The first graph shows the number of patients filling prescriptions per 100,000 population in each year. The second graph for each prescription category is prescription strength per patient, measured as the total amount of prescription filled in a year, over time.
Opioids
The number of patients filling opioid prescriptions per population increased 16% in the 2006-2013 time period (Figure 6a). The annual amount of opioid per prescription increased 44% between 2006 and 2010. However, the amount of opioid per patient decreased 19% after 2010 (Figure 6b). This suggests that prescribing practices are changing over time, reducing the amount of opioids prescribed to patients.
0
50
100
150
200
250
300
2006 2007 2008 2009 2010 2011 2012 2013 Patie
nts p
er 1
,000
pop
ulat
ion
Figure 6a: Patients Filling Opioid Prescriptions per 1,000 Population, NM 2006-2013
Source: NM PMP; UNM/GPS population
0 500
1,000 1,500 2,000 2,500 3,000 3,500 4,000 4,500 5,000
2006 2007 2008 2009 2010 2011 2012 2013
MM
E pe
r pat
ient
Figure 6b: Opioid MME per patient, NM 2006-2013
Source: NM PMP; UNM/GPS population

9
Benzodiazepines
The rate of patients filling benzodiazepine prescriptions remained stable over the time period assessed, increasing by 13% (Figure 7a). Annual VME per patient increased from 2006 through 2013 (27% increase) but may have plateaued since 2010 (Figure 7b). Although benzodiazepines are commonly abused, their use alone does not pose as large of a risk for overdose death as opioids. However, in combination with opioids, benzodiazepines can be very dangerous
0
20
40
60
80
100
120
2006 2007 2008 2009 2010 2011 2012 2013
Patie
nts p
er 1
,000
pop
ulat
ion
Figure 7a: Patients Filling Benzodiazepine Prescriptions per 1,000 population, NM 2006-2013
Source: NM PMP; UNM/GPS population
0
500
1,000
1,500
2,000
2,500
3,000
2006 2007 2008 2009 2010 2011 2012 2013
VME
per p
atie
nt
Figure 7b: Benzodiazepine VME per patient, NM 2006-2013
Source: NM PMP; UNM/GPS population

10
Stimulants
Rates of stimulant use are not as stable as rates of opioids and benzodiazepines because of smaller numbers of stimulant prescriptions. Stimulant use remained steady over the time period assessed, from 17 patients per 100,000 populations to 16 patients per 100,000 population (Figure 8a). The amount of stimulant prescribed per patient increased 56% from 2006 to 2013 (Figure 8b). Unlike opioids and benzodiazepines, stimulants are not standardized. The trend in milligrams may be influenced by changes in the mix of drugs in use.
0 2 4 6 8
10 12 14 16 18 20
2006 2007 2008 2009 2010 2011 2012 2013
Patie
nts p
er 1
,000
pop
ulat
ion
Figure 8a: Patients Filling Stimulant Prescriptions per 1,000 population, NM 2006-2013
Source: NM PMP; UNM/GPS population
0 500
1,000 1,500 2,000 2,500 3,000 3,500 4,000 4,500
2006 2007 2008 2009 2010 2011 2012 2013
Mg
per p
atie
nt
Figure 8b: Milligrams (mg) of stimulant per patient, NM 2006-2013
Source: NM PMP; UNM/GPS population

11
Geography Annual prescription strength by county is presented by both in descending order as well as a map to assess geographic disparities.
Opioids
Sierra County has the highest MME per patient in the state. Rio Arriba County, which has the highest drug overdose mortality rate in the state ranks fourth after Sierra, Hidalgo, and Grant Counties (Figures 9 &10).
0 1,000 2,000 3,000 4,000 5,000 6,000 7,000
San Juan Union*
Guadalupe* McKinley
Curry Lea
Chaves Roosevelt De Baca*
Quay Cibola
Los Alamos San Miguel
Colfax Dona Ana
Mora* New Mexico
Eddy Sandoval Santa Fe
Otero Bernalillo Harding*
Lincoln Valencia Catron* Socorro
Taos Torrance
Luna Rio Arriba
Grant Hidalgo*
Sierra
Morpine milligram equivalents (MME) per patient
Figure 9: Opioid MME per Patient by County, NM 2013
* County population under 5,000 Source: NM Prescription Monitioring Program; UNM/GPS population

12
Figure 10: Opioid morphine milligram equivalents per patient by county, NM 2013
Source: NM Prescription Monitoring Program

13
Benzodiazepines
Sierra County also has the highest VME per patient in the state. McKinley County has the lowest VME per patient (Figure 11 & 12). The Southwest portion of the state shows a pattern of strong prescriptions per patient for both opioids and benzodiazepines.
0 500 1,000 1,500 2,000 2,500 3,000 3,500 4,000
McKinley Catron* Union*
Los Alamos Taos
Sandoval San Juan Santa Fe
Harding* Lea
Valencia New Mexico
Torrance Curry
Cibola Colfax
Bernalillo Chaves
Dona Ana Otero
Lincoln Roosevelt
Quay Luna
Guadalupe* Hidalgo*
Rio Arriba Eddy
Socorro Grant
San Miguel Mora*
De Baca* Sierra
Valium milligram equivalents (VME) per patient
Figure 11: Benzodiazepine VME per Patient by County, NM 2013

14
Figure 12: Benzodiazepine valium milligram equivalents per patient by county,
NM 2013
Source: NM Prescription Monitoring Program

15
Stimulants
The rates of stimulant prescriptions per population by county follow a very different pattern than opioid and benzodiazepine prescriptions. Harding County had the highest rate, followed by Los Alamos County, which is the highest income county in the state. Other than Los Alamos, counties with high rates of stimulant prescription are largely congregated in the Eastern portion of the state (Figures 13 & 14).
0 10 20 30 40 50 60 70 80 90
Catron* Cibola
Rio Arriba McKinley Hidalgo*
Union* Roosevelt Dona Ana
Otero Luna
Curry Grant
Mora* Santa Fe
Taos Lincoln
Valencia New Mexico
San Miguel Lea
Bernalillo Socorro
San Juan Torrance
Colfax Guadalupe*
Sierra Sandoval
Chaves Quay Eddy
De Baca* Los Alamos
Harding*
Patients per 1,000 population
Figure 13: Patients Filling Stimulant Prescriptions per 1,000 population age 5-24, NM 2013
Source: NM PMP; UNM/GPS population estimates

16
Figure 14: Patients age 5-24 Filling Stimulant Prescriptions per 1,000 population
by county, NM 2013
Source: NM Prescription Monitoring Program; UNM/GPS population

17
Prescribing patterns
There are several prescribing practices that have been associated with increased risk of overdose and are targeted by prevention efforts. These include chronic use of opioids, high dosage opioid prescriptions, and certain drug combinations (opioids plus benzodiazepines; and opioids, benzodiazepines and carisoprodol). Also at high risk for overdose are patients who receive prescriptions from multiple providers or fill prescription at multiple pharmacies in a small period of time (“doctor shopping”). The cut-offs for these high risk behaviors are still under development, by for the purposes of this report, chronic use of opioids is defined as over 90 day prescriptions and that prescriptions were filled in 90% or more of the months in a year (10.8 months of the year), and high dosage of opioid was defined as 120 MME/day per patient Co-prescription of opioids and benzodiazepines (percent of opioid patients receiving any benzodiazepine prescription, and percent of opioid patients receiving a benzodiazepine prescription that was over 90 days) and co-prescription of opioids, benzodiazepines and carisoprodol (called the “trio” here for brevity) were assessed. Prescription of the “trio” was assessed as percent of opioid patients who received any prescriptions for benzodiazepines and carisoprodol in the same month. “Doctor shopping” was defined as receiving prescriptions from five or more providers or filling prescriptions from five or more pharmacies.

18
The number of patients categorized as chronic controlled substance users in New Mexico increased from 42,011 in 2006 to 80,849 in 2013 (Figure 15). In the same time period, patients filling one opioid prescription, patients with short term use (> 1 prescription, but < 90 days), and episodic use (90+ days use but prescriptions filled in < 90% of the months) were fairly stable over the time period. The percent of opioid patients who have filled a high dose of prescription opioids (120 MME/day) declined from 14.1% in 2006 to 7.3% in 2013 (Figure 16).
0
100,000
200,000
300,000
400,000
500,000
600,000
700,000
2006 2007 2008 2009 2010 2011 2012 2013
num
ber o
f pat
ient
s Figure 15: Patients by consumption pattern
and year, NM 2006-2013
Chronic
Episodic
Short term
One prescription
One prescription: Only one controlled substance prescription filled in the year Short term: More than one prescription filled, but less than 90 days use Episodic: 90+ days use, but prescriptions filled in fewer than 90% of the months Chronic: 90+ days use, prescriptions filled in 90% or more of months Source: NM PMP

19
High dose
There has been a slight increase in the percent of opioid patients filling benzodiazepine prescriptions (Figure 17). In 2006, 12.7% of opioid patients filled any benzodiazepine prescription, whereas 14.6% did in 2013. The percent of opioid patients receiving over 90 days of benzodiazepines remained fairly steady over the time period, increasing from 3.0% to 3.9%.
Opioids plus benzodiazepines
0% 2% 4% 6% 8%
10% 12% 14% 16%
2006 2007 2008 2009 2010 2011 2012 2013
perc
ent o
f opi
oid
patie
nts
Figure 16: Percent of opioid patients with any prescription over 120 MME/day, NM 2006-2013
Source: NM PMP
0% 2% 4% 6% 8%
10% 12% 14% 16% 18%
2006 2007 2008 2009 2010 2011 2012 2013
Perc
ent o
f opi
oid
patie
nts
Figure 17: Percent of opioid patients also prescribed benzodiazepines, NM 2006-2013
Any
Over 90 days
Source: NM PMP
20
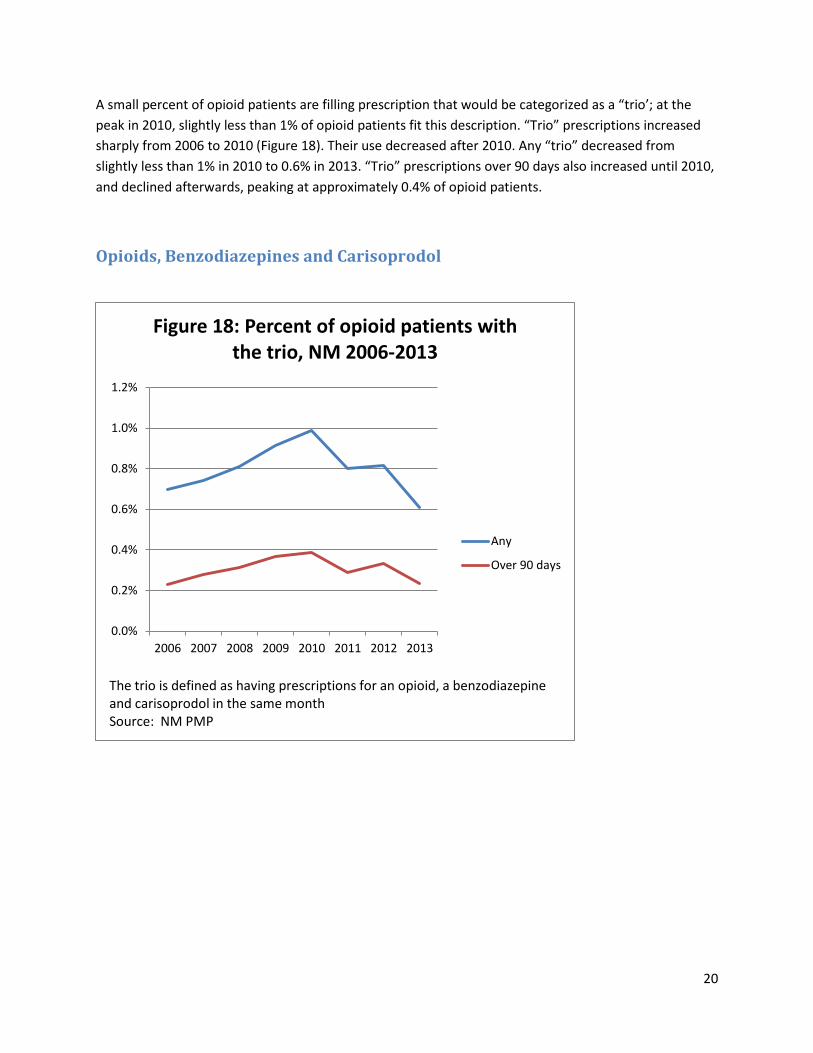
A small percent of opioid patients are filling prescription that would be categorized as a “trio’; at the peak in 2010, slightly less than 1% of opioid patients fit this description. “Trio” prescriptions increased sharply from 2006 to 2010 (Figure 18). Their use decreased after 2010. Any “trio” decreased from slightly less than 1% in 2010 to 0.6% in 2013. “Trio” prescriptions over 90 days also increased until 2010, and declined afterwards, peaking at approximately 0.4% of opioid patients.
Opioids, Benzodiazepines and Carisoprodol
0.0%
0.2%
0.4%
0.6%
0.8%
1.0%
1.2%
2006 2007 2008 2009 2010 2011 2012 2013
Figure 18: Percent of opioid patients with the trio, NM 2006-2013
Any
Over 90 days
The trio is defined as having prescriptions for an opioid, a benzodiazepine and carisoprodol in the same month Source: NM PMP

21
Multiple practitioners
The number of patients using five or more prescribers or five or more pharmacies for controlled substances rose in recent years, but overall was relatively stable between 4% and 4.5% of all patients since 2008. This practice (sometimes called “doctor shopping”) is more common among patients who are using prescription drugs non-medically.
0
5,000
10,000
15,000
20,000
25,000
30,000
2006 2007 2008 2009 2010 2011 2012 2013
Num
ber o
f pat
ient
s
Number of patients using multiple practitioners, NM 2006-2013
Patients using multiple practitioners are those who received prescriptions from five or more prescribers or filled prescriptions at five or more pharmacies in a year Source: NM PMP
0.0% 0.5% 1.0% 1.5% 2.0% 2.5% 3.0% 3.5% 4.0% 4.5% 5.0%
2006 2007 2008 2009 2010 2011 2012 2013
% o
f pat
ient
s
Percent of patients using multiple practitioners, NM 2006-2013
Patients using multiple practitioners are those who received prescriptions from five or more prescribers or filled prescriptions at five or more pharmacies in a year Source: NM PMP

22
Summary
• Drug overdose is the leading cause of injury death in New Mexico. The increase in overdose death over the past decade has been driven by an increase in prescription drug overdose death.
• Opioids are the most common class of controlled substances filled in New Mexico. Opioids and benzodiazepines account for 83% of controlled substance fills.
• The prevalence of opioid prescriptions rises with age, and women fill more opioid prescriptions than men. The highest doses are in ages 45-64, and men have higher doses than women.
• The rate of benzodiazepine prescriptions also rises with age and women are also more likely to fill benzodiazepine prescriptions.
• Stimulants are most commonly used among those age 5-24, and particularly 5-14. Males under 25 are more likely to use stimulants than females, a pattern which reverses over age 25.
• The number of patients filling opioid prescriptions increased by 16% between 2006 and 2013. The total amount of opioids per patient decreased by 19% from 2010 to 2013.
• The rate of patients filling benzodiazepine prescriptions and the quantity of benzodiazepines per patient have been relatively stable over the period, but the number of benzodiazepine patients per 1,000 population decreased slightly since 2010.
• While not as stable as the rates for opioid prescriptions because of smaller numbers, stimulant prescriptions and doses have remained fairly stable over the period.
• The southwestern quarter of New Mexico plus Taos and Rio Arriba counties have the highest rates of opioid morphine milligram equivalents per patient. Eastern and northwestern New Mexico tend to have the lowest rates.
• The geographic pattern for Benzodiazepines is less concentrated than that for opioids, but some of the same counties in the southwest and north have high rates of both opioid and benzodiazepine prescriptions.
• Stimulant prescriptions among those age 5-24 have a very different geographic pattern than opioids or benzodiazepines. Los Alamos County has one of the highest rates, as do counties in Eastern New Mexico.
• The number of patients using controlled substances grew by approximately 20% between 2006 and 2013. The fraction of all patients who are longer term (90 days or more) increased over the period.
• The fraction of users who have filled high-dose opioid prescriptions in a year declined by almost half from 2006 through 2013.
• The fraction of opioid patients who were also prescribed benzodiazepines in the same month peaked in 2010 and declined slightly through 2013.
• The fraction of opioid patients who also were prescribed benzodiazepines and carisoprodol in the same month also peaked in 2010 and declined sharply to 2013.
• The fraction of all patients who received prescriptions from five or more prescribers or filled prescriptions and five or more pharmacies in one year ranged between 4.0 and 4.5 percent of all patients from 2008 through 2013.