Embed Size (px)
Citation preview
NEW MEXICO STATE UNIVERSITY LAS CRUCES, NEW MEXICO 88001 AREA 505 646-261 4
Observatory
PHO
H . Gordon Solberg, Jr .
Elmer J . Reese
The Observatory*
New Mexico State University
Las Cruces, New Mexico 88001
Supported i n part by NASA Gran 003-001 and NGR 32-003-027
https://ntrs.nasa.gov/search.jsp?R=19690016166 2020-05-01T22:15:17+00:00Z
PHOTOGRAPHIC MEASUREMENTS OF JOVIAN FEATURES,
1960- 1967
H. Gordon Solberg, Jr. and Elmer J. Reese
ABSTRACT
Longitude measurements of Jovian fea tures , pr imari ly those i n
the southern hemisphere,from photographic p l a t e s taken between 1964
and 1967 are reported. During the appari t ion of 1965-66, severa l
rap id ly moving spots were observed on the south component of t he South
Equatorial Belt and the north edge of t he South Temperate Belt, moving
a t the proper rate t o suggest t h a t they belonged t o the well-known
c i r cu la t ing current . In 1966-67, a dark spot on the north edge of the
South Temperate Belt was observed whose d r i f t i n longitude, when taken
as a function of time, was parabolic. The SEBs was very act ive: well
over 100 spots were observed on t h i s b e l t during the appari t ion. The
SEBZ afso,,was qu i t e ac t ive .
A summary of photographic measurements of b e l t l a t i t u d e s between
1960 and 1967 i s included.
INTRODUCTION
This paper presents previously unpublished photographic measurements
of Jovian fea tures made a t the New Mexico S t a t e University Observatory.
Only t h e more i n t e r e s t i n g markings and currents w i l l be discussed i n
the t e x t ; the ro t a t ion periods of other fea tures w i l l be presented i n
Tables I, 111, and I V a t the conclusion of t h i s paper.
used i n t h i s paper i s bas i ca l ly the same as t h a t used by Peek (1958).
The terminology
Exceptions include the use of STrZ f o r the South Tropical Zone and SEBZ
f o r t he zone dividing the two components of the South Equatorial Belt.
Also, w e use n/ and ’/ t o denote the north and south edges of an object .
In te res ted readers should refer t o the following sources f o r more
de t a i l ed discussions of se lec ted Jovian fea tures observed during t h e
appari t ions of 1965-66 and 1966-67:
Object
Red Spot,
Apparition Source
65-66; 66-67 Solberg 1968a; 1968b
Bright Spots, N. edge NEB 65-66 Solberg, 1968c
Vor t ic i ty of Red Spot 65-66,66-67 Reese E Smith, 1968
APPARITION OF 1965 - 66
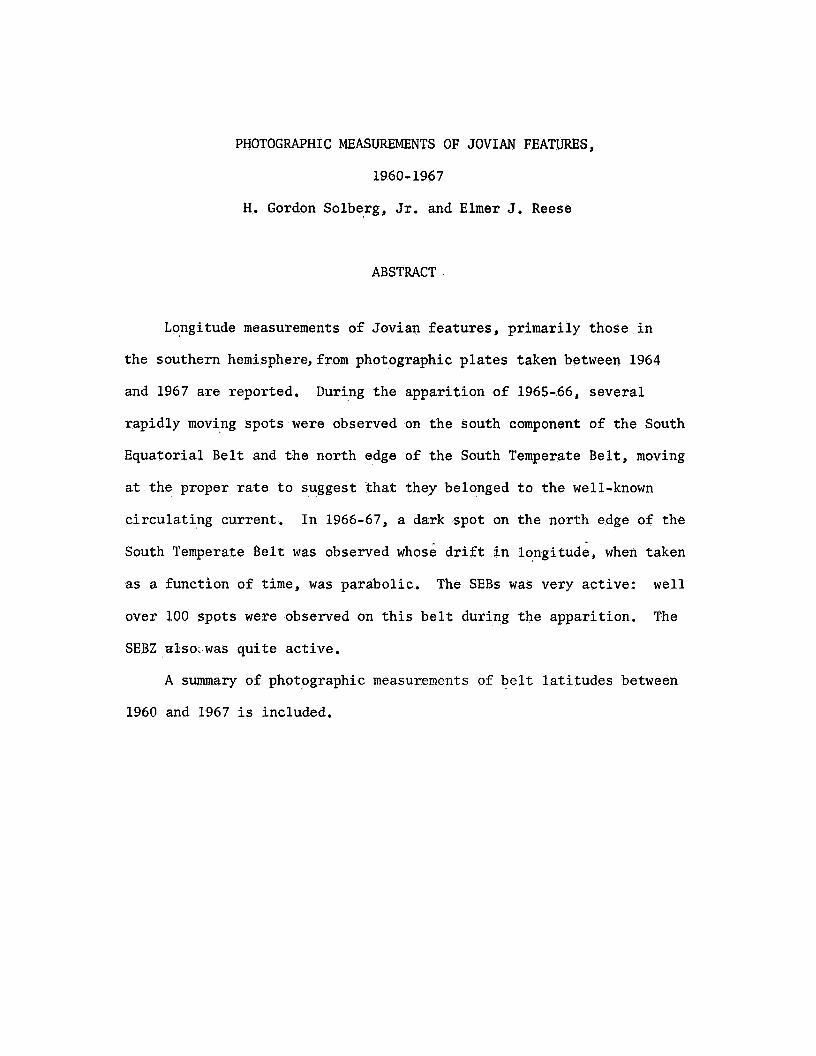
South Temperate Belt. Several dark condensations on t h e north edge
of the STB were observed t o move with the ve loc i ty of t he southern
branch of t he c i r cu la t ing current (Peek, 1958). Four of these objec ts
pe r s i s t ed for a t least a month (Fig.1); one of them, spot A, t rave led
completely around the Red Spot and has beendiscussed i n d e t a i l by
Reese and Smith (1968).
South Equatorial Belt. Dark markings on the southern edge of t h e
SEBs moved with the ve loc i ty of t he northern branch of t he c i r cu la t ing
current . The first spot t o be observed (Fig. 1) had a ro t a t ion period
somewhat sho r t e r than the o ther spots . About 12 December 1965, t h i s spot
suddenly moved southward t o the middle of t h e STrZ (Table 111) and ac tua l ly
reversed i ts longi tudinal motion. A s seen i n Fig. 1, the spot reached
a maximum longitude of 323', which we s h a l l call t he llvertex.ll
the d is tance of t he spot from the l lvertexll equal rs we f i n d t h a t t he ac-
ce le ra t ion of the spot var ied approximately as 1/r between longitudes 230'
and 320'.
deg/day
t i o n # as the spot neared the vertex.
Let t ing
The maximum acce lera t ion of t he spot was approximately +0.1
( + 1 . 6 ~ 1 0 - ~ m/sec ) r e fe r r ed t o the d i r ec t ion of J u p i t e r s s ro ta - 2 2
Spot B, on the o ther hand, showed no acce lera t ion whatever as it
neared the vertex. On January 24, 1966, when spot B reached conjunction
with spot 1, spot 1 was apparently annihi la ted, while spot B became much
darker.
a,
The behavior of t he SEBs spots near t he Red Spot i s discussed by
Reese and Smith (1968).
APPARITION OF 1966 - 67
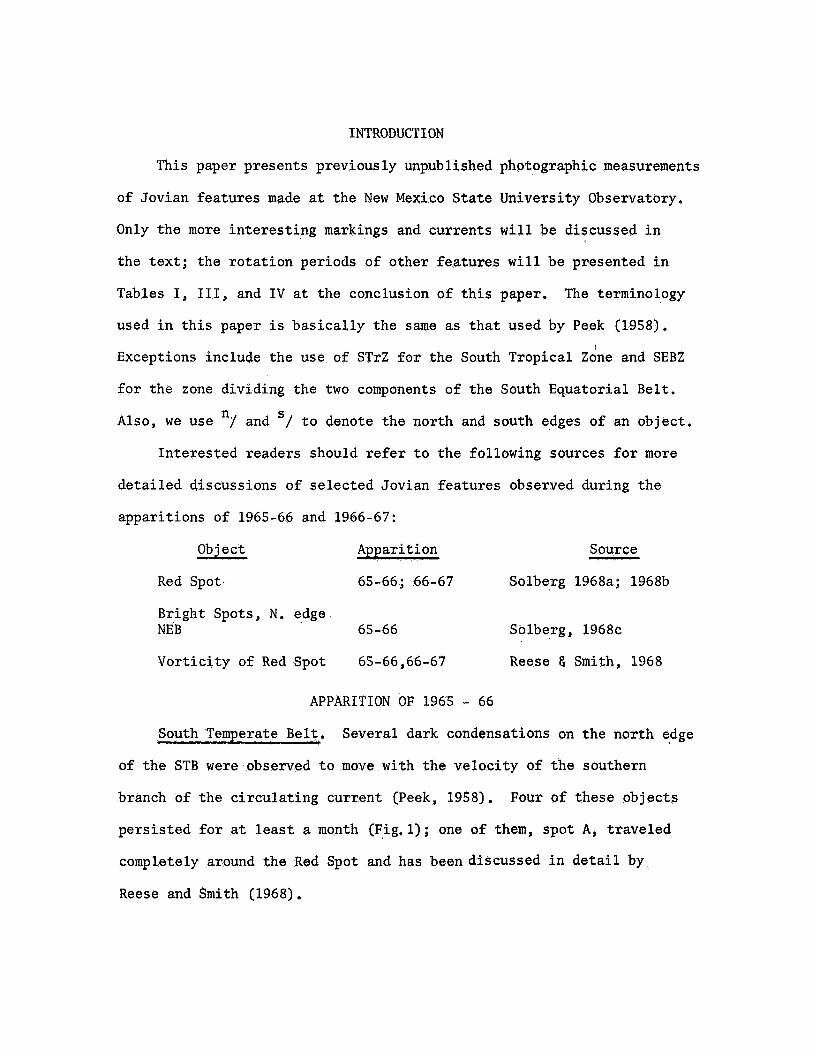
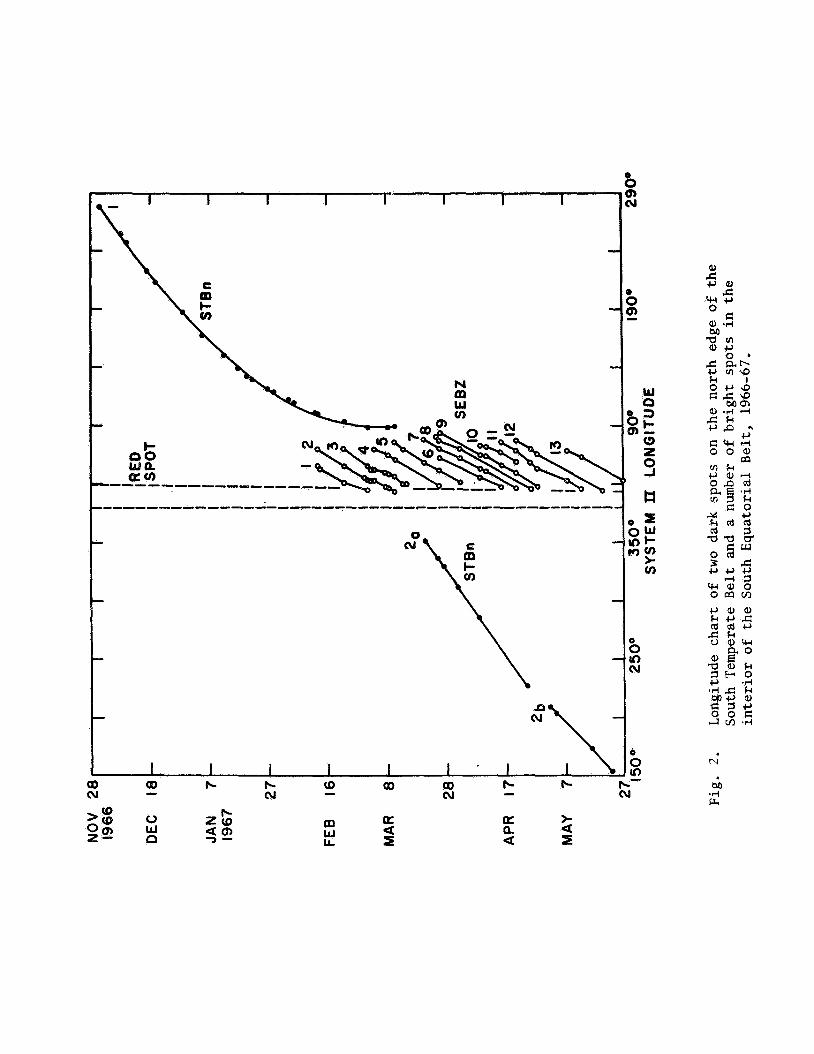
South Temperate Belt. During the appari t ion, two dark spots were
observed on the north edge of t he STB.
very unusual manner:
of time, i s a parabola, within the uncertainty of the observations (Fig. 2).
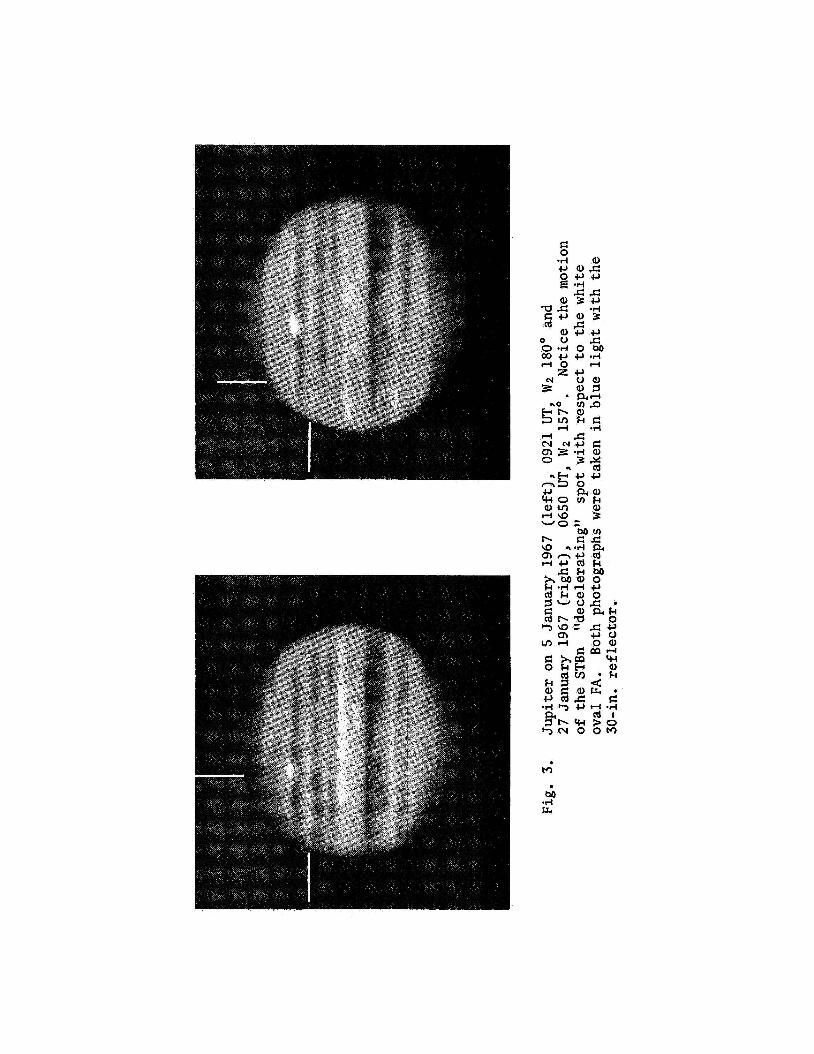
The motion of t h i s spot is well shown i n , F i g . 3.
with s o constant a decelerat ion ever being observed i n J u p i t e r ' s atmosphere.
One of these spots moved i n a
i ts d r i f t i n longitude, when p lo t t ed as a funct ion
We know of no o ther d r i f t
Here w e def ine decelerat ion t o be an accelerat ion i n the d i r ec t ion opposite
J u p i t e r ' s ro ta t ion .
A general least squares so lu t ion ind ica tes t h a t t he parabola was
normal t o System I1 with i t s ver tex a t longitude 88f6 on 8 March 1967.
The equation of the parabola is:
A 2 = 88:64 + 0:02047T
where T = J u l i a n Date - 2439557.57.
The decelerat ion of the spot was constant with a value of 6 , 6 ~ 1 0 - ~ 2 m/sec , ind ica t ing t h a t t he spot was subjec t t o a constant force i n the
d i r ec t ion opposing i t s motion.
th ree months and extending almost ZOOo i n longitude i s remarkable, espec ia l ly
when one considers t h e amount of turbulence which seems t o e x i s t i n t h e
2
A constant force l a s t i n g forlmore than
Jovian atmosphere.
Near the ver tex, t h e STBn spot moved northward across t he STrZ (Table V ) ,
much as the SEBs spot #1 of the previous appari t ion moved i n t o the STrZ
a t i t s "vertex." I t i s in t e re s t ing t h a t the vertex of the STBn spot was
very near the locat ion of the proposed SEB source "Atf (Chapman and Reese,
1968).
The o ther STB spot had a l inear d r i f t , with a d iscont inui ty occurring
a t the end of April.
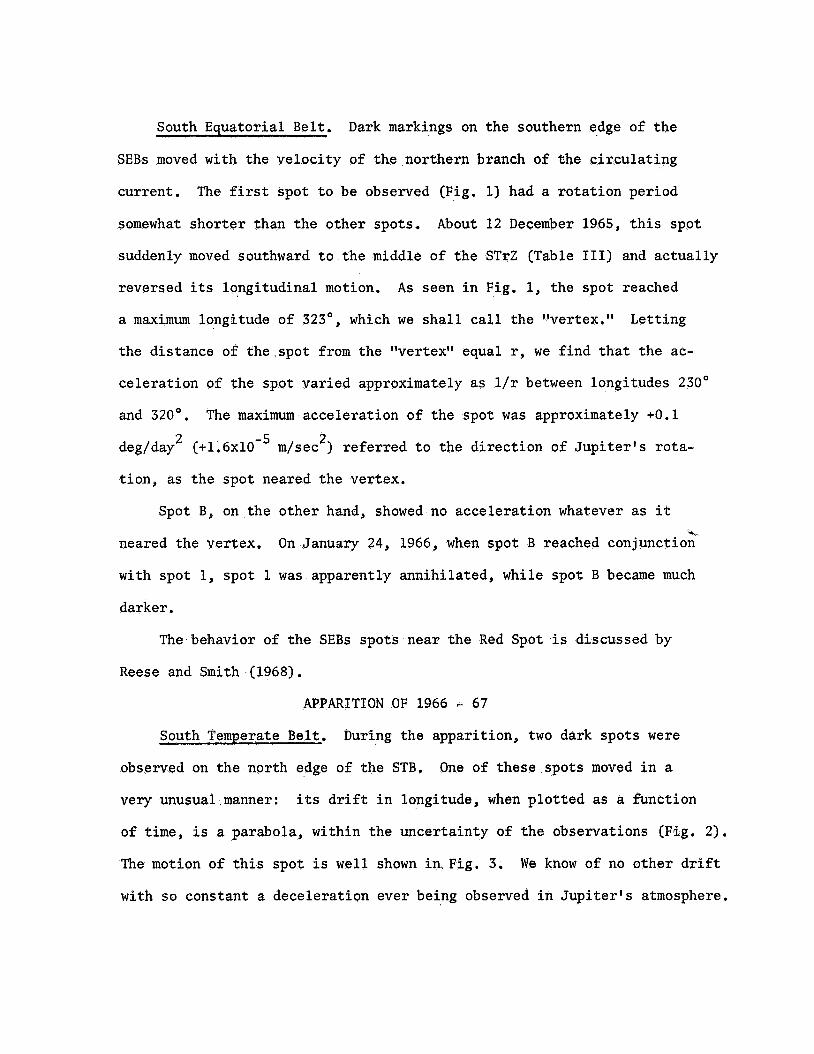
South Equatorial Belt. The SEBs was very ac t ive during 1966-67; more
than 100 individual markings were observed on t h e south edge of the b e l t ,
and ro t a t ion periods were derived for 69 of t he more long-enduring
spots , (Fig. 4).
The behavior of t he spots was unremarkable between approximately 100'
and 350' -- t h e i r v e l o c i t i e s were near ly constant and they were of ten observed
t o t r a v e l through 250° of longitude o r more.
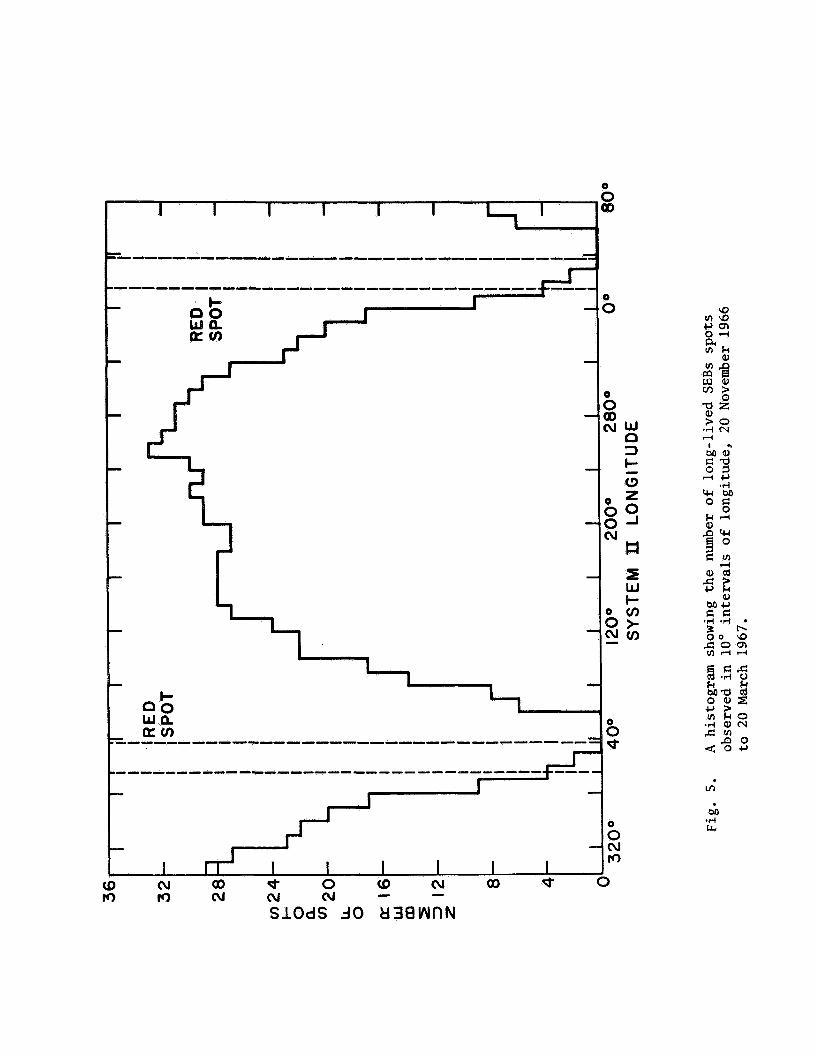
of long enduring spots decreased d r a s t i c a l l y (Fig. 5), although many
t r ans i en t spots were observed i n t h e v i c i n i t y of t he Red Spot.
Near t h e Red Spot, t he number
The behavior of these t r ans i en t spots , which were usual ly d i f f i c u l t
t o measure, is shown i n a time-lapse motion p i c tu re prepared by T.C. Bruce,
R.L. F r i t z , and R.B. Minton. This motion p i c tu re , consis t ing of 26
photographs obtained during an i n t e r v a l of 33 days, shows the v i c i n i t y
of the Red Spot between 4 January and 5 February 1967. As expected, t he
spots t rave led down the SEBs and along the northern edge of the Red Spot
Hollow.
absorbed by a large, dark marking near ly s t a t iona ry a t longitude 45'.
few of the spots continued along the SEBs following the Red Spot, but
gradually faded i n t o t h e b e l t .
A t t he following end of t he Hollow, the spots were apparently
A
We do not know what became of these spots after they entered t h e Red
Spot Hollow.
of the Red Spot, causing a darkening of t h e Hollow.
Some of them were possibly disrupted near the following end
The mater ia l t h a t was
apparently absorbed by the s t a t iona ry dark marking mentioned above may
have continued along the SEBs, o r it may have been obscured by b r igh t
clouds i n t h e STrZ.
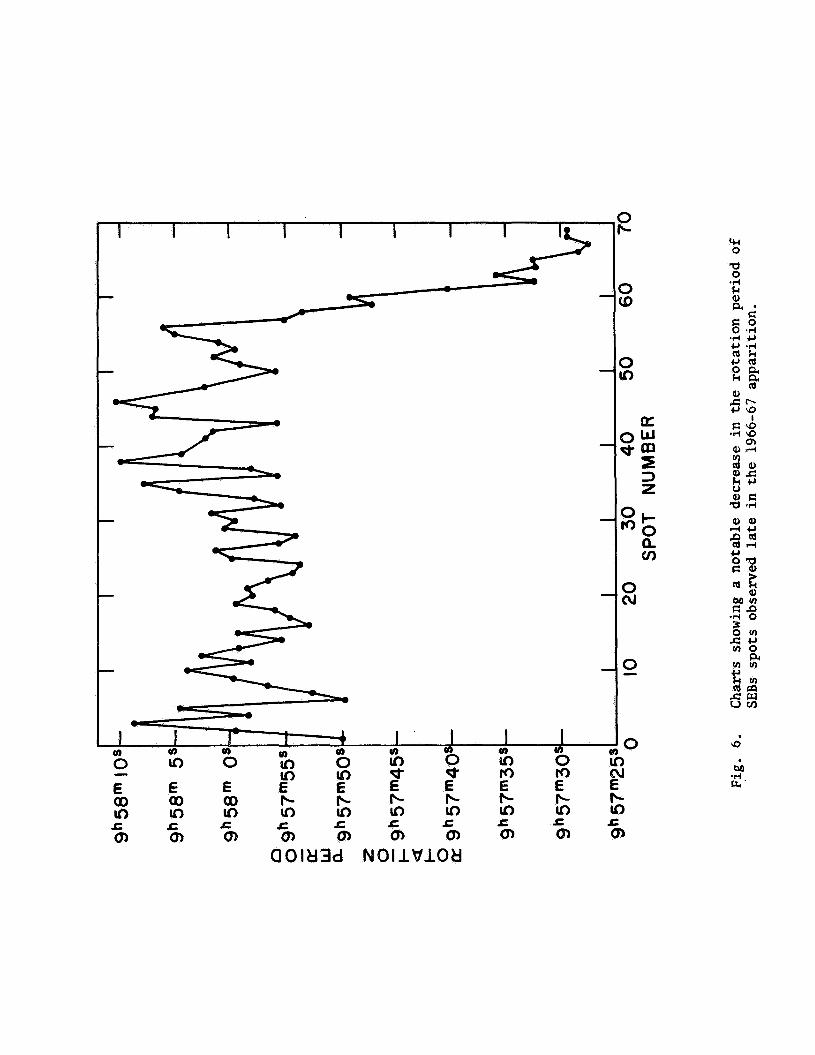
An i n t e r e s t i n g va r i a t ion i n the ro t a t ion rates of the spots i s shown
h m s i n Fig. 6.
57-69 had a mean per iod of 9 57 37.8.
South Equatorial Belt Zone.
Spots 1-56 had a mean ro t a t ion period of 9 57 59.3, while spots
h m s
During t h e last h a l f of the appari t ion, a
They formed number of b r igh t spots formed i n the SEBZ near 85" (Fig. 2).
qu i t e suddenly, as shown i n Fig. 7. As they moved toward the Red Spot, t h e i r
lengths increased from a mean of 5:6 between 60" and 90" t o a mean of 10:s
between 30" and 40°.
Spot.
Spot, t he SEBZ spots faded t o i n v i s i b i l i t y - (Fig. 8).
The spots a l s o became b r i g h t e r as they neared the Red
However, as they approached t h e longitude of the center of t h e Red
SUMMARY
J u p i t e r ' s southern hemisphere was very ac t ive throughout these two
apparations, as the d r i f t cha r t s ind ica te . A poss ib le co r re l a t ion of
a c t i v i t y near 85" is t o be noted: a t t h i s longitude, t h e STBn spot had
i ts ver tex, t h e SEBZ spots formed, and t h e number of SEBs spots began t o
increase grea t ly .
behavior of these spots near 85' during 1966-67.
There would seem t o be some s igni f icance i n the unusual
ACKNOWLEDGMENTS
We thank observers J. D. Hartsell, A. S. Murre11 and T. P. Pope f o r
the photographs used i n t h i s study; R. L. F r i t z , R. B. Minton and C. C. Mozer
f o r the i l l u s t r a t i o n s ; and the New Mexico S t a t e University Computer Center
f o r t i m e on the Control Data 3300.
The work reported here was supported by the National Aeronautics and
Space Administration under Grants NGL 32-003-001 and NGR 32-003;027.
REFERENCES
Chapman, C. R. and Reese, E. J. (1968). A test of the uniformly-rotating
source hypothesis for the South Equatgrial Belt disturbances on Jupiter.
Icarus 9 326-335. -’ Peek, B. M. (1958). T h e Planet Jupiter.I1 Macmillan, New York, Chapter 18.
Reese, E. J. and Smith, B. A. (1968). Evidence of vorticity in the Great
Red Spot of Jupiter. Icarus ( in Press ) . - Solberg, H. G. (1968a). Jupiter’s Red Spot in 1965-66. Icarus 8, 82-89. - Sblberg, H. G. (1968b). Jupiter’s Red Spot in 1966-67. Icarus 9 212-216. - -’ Solberg, H. G. (1968~). Jovian North Equatorial Belt Spots in 1966-67.
Planet.Spaee Sci. 16 1061-1067. -’
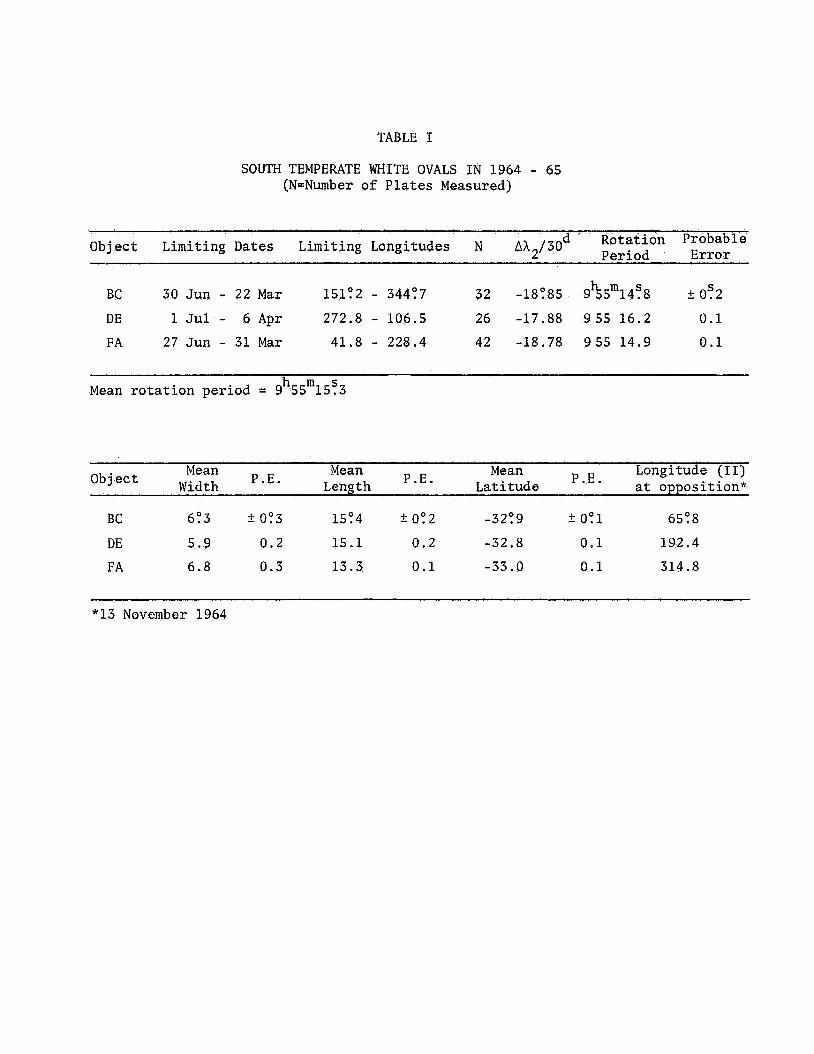
TABLE I
SOUTH TEMPERATE WHITE OVALS IN 1964 - 65 (N=Number of Plates Measured)
Object Limiting Dates Limiting Longitudes N AA2/30d Rotation Period Error
s BC 30 Jun - 22 Mar 15102 - 344:7 32 -18085 9SSm14?8 k 0.2 DE 1 Jul - 6 Apr 272.8 - 106.5 26 -17.88 955 16.2 0.1 FA 27 Jun - 31 Mar 41.8 - 228.4 42 -18.78 955 14.9 0.1
h m s Mean rotation period = 9 55 15.3
Mean Mean Mean Longitude (11) Latitude at opposition* P.E. Object Width P.E. Length P.E.
BC 6P3 k OP3 1504 ?I 002 -32?9 2 001 6508 DE 5.9 0.2 15.1 0.2 -32.8 0-1 192.4 FA 6.8 0.3 13.3 0.1 -33.0 0.1 314.8
*13 November 1964
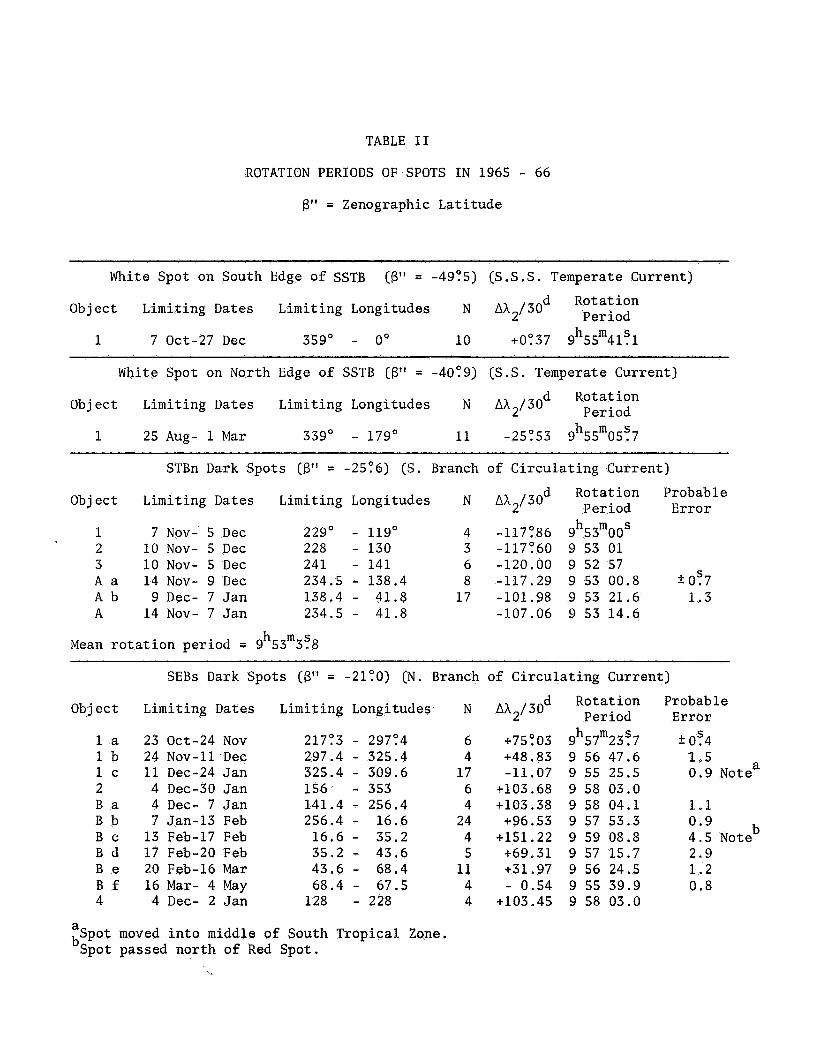
TABLE I1
ROTATION PERIODS OF SPOTS I N 1965 - 66
B" = Zenographic Lat i tude
White Spot on South Edge of SSTB (8" = -4905) (S.S.S. Temperate Current)
Ob j ect Limiting Dates Limiting Longitudes N AX2/30 d Rotat ion Period
1 7 Oct-27 Dec 359' - 0" 10 +0'137 9 h m s 55 41.1
White Spot on North Edge of SSTB (8" = -4009) (S.S. Temperate Current) d Rotation Object Limiting Dates Limiting Longitudes N Ah2/30 Period
h m s 1 25 Aug- 1 Mar 339' - 179' 11 -25053 9 55 05.7
STBn Dark Spots (,If = -2506) (S. Branch of Ci rcu la t ing Current)
Rotat ion Probable E r r o r Object Limiting Dates Limiting Longitudes N Ah2/30d Period
h m s 1 7 Nov- 5 Dec 229' - 119' 4 -117:86 9 53 00 2 10 Nov- 5 Dec 228 - 130 3 -117'160 9 53 01 3 10 Nov- 5 Dec 241 - 141 6 -120.00 9 52 57 A a 14 Nov- 9 Dec 234.5 - 138.4 8 -117.29 9 53 00.8 t Os7 A b 9 Dec- 7 Jan 138.4 - 41.8 17 -101.98 9 53 21.6 1 .3 A 14 Nov- 7 Jan 234.5 - 41.8 -107.06 9 53 14.6
h m s Mean r o t a t i o n period = 9 53 3.8
SEBs Dark Spots (B" = -21:O) (N. Branch of Ci rcu la t ing Current)
d Rotation Probable Period Error Object Limiting Dates Limiting Longitudes N AX2/30
1 a 23 Oct-24 Nov 1 b 24 Nov-11 Dec 1 c 11 Dec-24 Jan 2 4 Dec-30 Jan B a 4 Dee- 7 Jan B b 7 Jan-13 Feb B c 13 Feb-17 Feb B d 17 Feb-20 Feb B e 20 Feb-16 Mar B f 16 Mar- 4 May 4 4 Dec- 2 Jan
21703 - 297'14 297.4 - 325.4 325.4 - 309.6 156 - 353 141.4 - 256.4 256.4 - 16.6
16.6 - 35.2 35.2 - 43.6 43.6 - 68.4 68.4 - 67.5
128 - 228
6 4
17 6 4
24 4 5
11 4 4
Os4 h m s +75'103 9 57 23 .7 +48.83 9 56 47.6 I .5 -11.07 9 55 25.5 0.9 Note"
9103.68 9 58 03.0 +103.38 9 58 04.1 1.1 +96.53 9 57 53.3 0.9
+151.22 9 59 08.8 4.5 Note +69.31 9 57 15.7 2.9
1 . 2 +31.97 9 56 24.5 - 0.54 9 55 39.9 0.8
+103.45 9 58 03.0
a
bSpot passed nor th of Red Spot. Spot moved i n t o middle of South Tropical Zone.
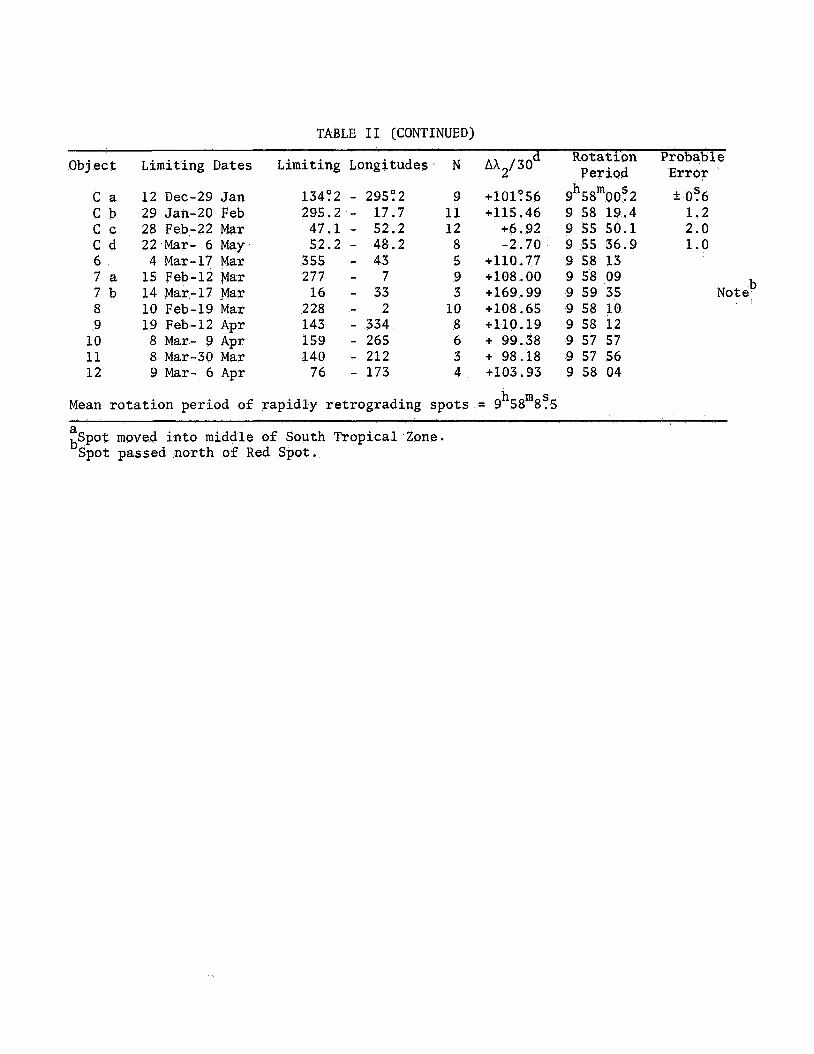
TABLE I I (CONTINUED) Rotat ion Probable
Period Error Object Limiting Dates Limiting Longitudes N AA2/30d
C a 1 2 Dec-29 Jan C b 29 Jan-20 Feb C c 28 Feb-22 Mar C d 22 Mar- 6 May 6 4 Mar-17 Mar 7 a 15 Feb-12 war 7 b 14 Mar-17 Mar 8 10 Feb-19 Mar 9 19 Feb-12 Apr
10 8 Mar- 9 Apr 11 8 Mar-30 Mar 1 2 9 Mar- 6 Apr
134'i2 - 295Y2 295.2 - 17.7 47.1 - 52.2 52.2 - 48.2
355 - 43 277 - 7
16 - 33 228 - 2 143 - 334 159 - 265 140 - 212
76 - 173
9 11 1 2 8 5 9 3
10 8 6 3 4
+101PS6 +115.46
+6.92
+110.77 +108.00 e169.99 +108.65 +110.19 + 99.38 + 98.18 +103.93
-2.70
h m s Mean r o t a t i o n period of rap id ly retrograding spots = 9 58 8.5
9 h m s 58 00.2 2 Os6 9 58 19.4 1 . 2 9 55 50.1 2.0 9 55 36.9 1 .o 9 58 13 9 58 09 9 59 35 Note 9 58 10 9 58 1 2 9 57 57 9 57 56 9 58 04
b
a bSpot passed north of Red Spot.
Spot moved i n t o middle of South Tropical Zone.
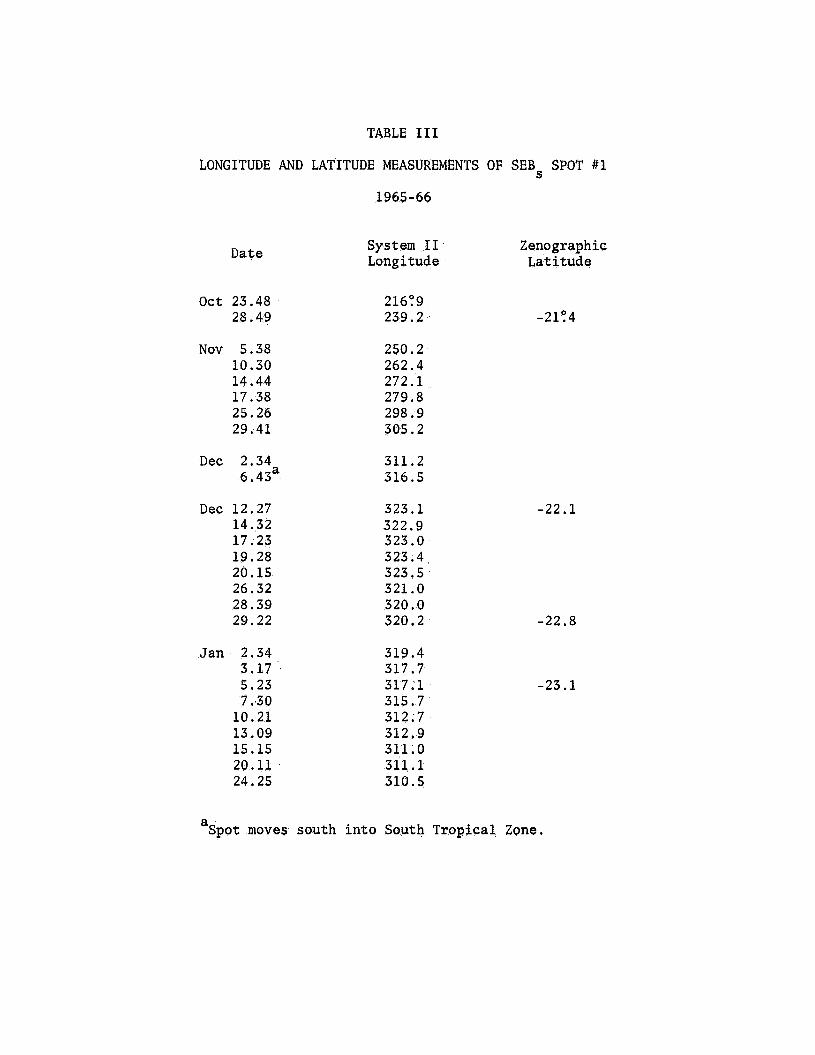
TABLE I11
LONGITUDE AND LATITUDE MEASUREMENTS OF SEBs SPOT #1
1965 -66
Date
Oct 23.48 28.49
Nov 5.38 10.30 14.44 17.38 25.26 29.41
Dec 2.34, 6.43
Dec 12.27 14.32 17.23 19.28 20.15 26.32 28.39 29.22
Jan 2.34 3.17 '
5.23 7 ..30
10.21 13.09 15.15 20.11 24.25
System I1 Zenographie Longitude Latitude
21629 239.2
250.2 262.4 272.1 279.8 298.9 305.2
311.2 316.5
323.1 322.9 323.0 323.4 323.5 321 .O 320.0 320 2
319.4 317.7 317.1 315.7 312.7 312.9 311.0 314.1 310.5
-2194
-22.1
-22.8
-23.1
Spot moves south into South Tropical Zone. a
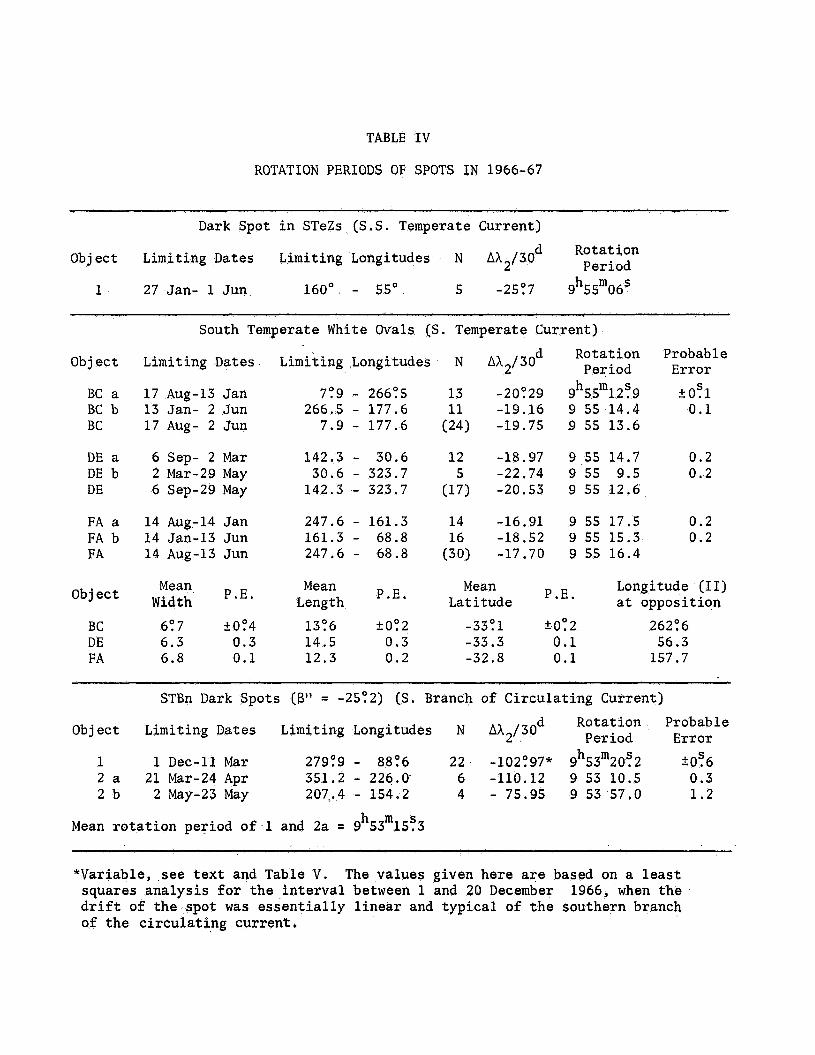
TABLE IV
ROTATION PERIODS OF SPOTS IN 1966-67
Object
Dark Spot in STeZs (S.S. Temperate Current)
Limiting Dates Limiting Longitudes N d AA2/30 Rotat ion Period h m s 1 27 Jan- 1 Jun 160' - 55' 5 -25?7 9 55 06
Ob j ect
BC a BC b BC
DE a DE b DE
FA a FA b FA
Object
BC DE FA
South Temperate White Ovals (S. Temperate Current) d Rotation Probable
Period Error Limiting Dates Limiting Longitudes N AA2/30 S ro.l 17 Aug-13 Jan 7'19 - 266:s 13 -20'129 9 55 12.9
13 Jan- 2 Jun 266.5 - 177.6 11 -19.16 9 55 14.4 0.1 17 Aug- 2 Jun 7.9 - 177.6 (24) -19.7'5 9 55 13.6
h m s
6 Sep- 2 Mar 142.3 - 30.6 12 -18.97 9 55 14.7 0.2 2 Mar-29 May 30.6 - 323.7 5 -22.74 9 55 9.5 0.2 6 Sep-29 May 142.3 - 323.7 (17) -20.53 9 55 12.6
14 Aug-14 Jan 247.6 - 161.3 14 -16.91 9 55 17.5 0.2 14 Jan-13 Jun 161.3 - 68.8 16 -18.52 9 55 15.3 0.2 14 Aug-13 Jun 247.6 - 68.8 (30) -17.70 9 55 16.4
Mean Longitude (11) Latitude at opposition P.E. Mean P.E. Mean
Width 6'1 7 rOP4 13'16 r0'12 -33'11 *0:2 262'16 6.3 0.3 14.5 0.3 -33.3 0.1 56.3 6.8 0.1 12.3 0.2 -32.8 0.1 157.7
Length P.E.
STBn Dark Spots (B" = -25'12) (S. Branch of Circulating Current) d Rotation Probable
Period Error Object Limiting Dates Limiting Longitudes N AX2/30
*Of6 2 a 21 Mar-24 Apr 351.2 - 226.0 6 -110.12 9 53 10.5 0.3
h m s 1 1 Dec-11 Mar 279?9 - 88'16 22 -102:97* 9 53 20.2
2 b 2 May-23 May 207,.4 - 154.2 4 - 75.95 9 53 57.0 1.2 h m s Mean rotation period of 1 and 2a = 9 53 15.3
*Variable, see text and Table V. The values given here are based on a least squares analysis f o r the interval between 1 and 20 December 1966, when the drift of the spot was essentially linear and typical of the southern branch of the circulating current.
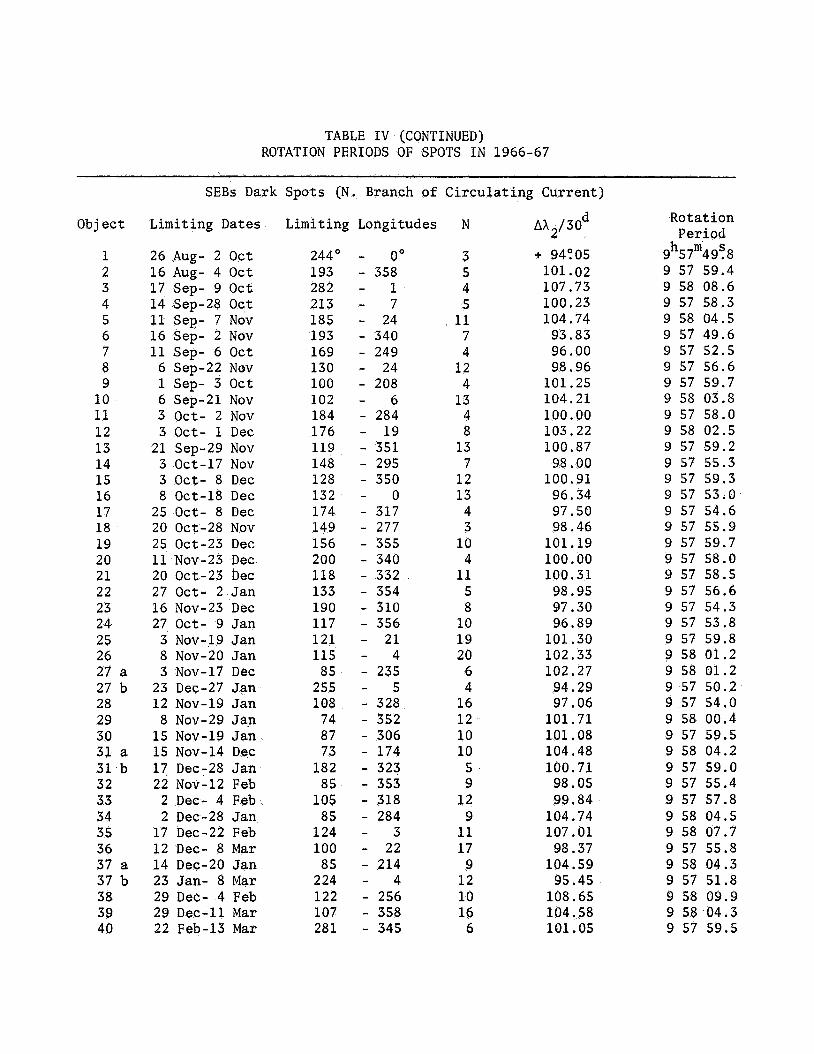
TABLE IV (CONTINUED) ROTATION PERIODS OF SPOTS IN 1966-67
SEBs Dark Spots (N. Branch of Circulating Current) -~ ~
Object
1 2 3 4 5 6 7 8 9 10 11 12 13 14 15 16 17 18 19 20 21 22 23 24 25 26 27 a 27 b 28 29 30 31 a 31 b 32 33 34 35 36 37 a 37 b 38 39 40
Limiting Dates
26 AUg- 2 Oct 16 AUg- 4 Oct 17 Sep- 9 Oct 14 Sep-28 Oct 11 Sep- 7 Nov 16 Sep- 2 Nov 11 Sep- 6 Oct 6 Sep-22 Nov 1 Sep- 3 Oct 6 Sep-21 Nov
3 Oct- 1 Dec 21 Sep-29 Nov
3 Oct- 8 Dec 8 Oct-18 Dec 25 Oct- 8 Dec
25 Oct-23 Des 11 Nov-23 Dec 20 Oct-23 Dec 27 Oct- 2 Jan 16 Nov-23 Dec 27 Oct- 9 Jan 3 Nov-19 Jan 8 Nov-20 Jan 3 Nov-17 Dec 23 Dec-27 Jan 12 Nov-19 Jan 8 Nov-29 Jan 15 Nov-19 Jan 15 Nov-14 Dec 17 Dec-28 Jan 22 Nov-12 Feb 2 Dec- 4 Feb 2 Dec-28 Jan 17 Dec-22 Feb 12 Dec- 8 Mar 14 Dec-20 Jan 23 Jan- 8 Mar 29 Dec- 4 Feb, 29 Dec-11 Mar 22 Feb-13 Mar
3 Oct- 2 NOV
3 Oct-17 NOV
20 Oct-28 NOV
Limiting Longitudes
244' - 0' 193 - 358 282 - 1 213 - 7 185 - 24 193 - 340 169 - 249 130 - 24 100 - 208 102 - 6 184 - 284 176 - 19 119 - 351 148 - 295 128 - 350 132 - 0 174 - 317 149 - 277 156 - 355 200 - 340 118 - 332 133 - 354 190 - 310 117 - 356 121 - 21 115 - 4 85 - 235 255 - 5 108 - 328 74 - 352 87 - 306 73 - 174 182 - 323 85 - 353 105 - 318 85 - 284 124 - 3 100 - 22 85 - 214 224 - 4 122 - 256 107 - 358 281 - 345
N
3 5 4 5 11 7 4 12 4 13 4 8 13 7 12 13 4 3 10 4 11 5 8 10 19 20 6 4 16 12 10 10 5 9 12 9 11 17 9 12 10 16 6
AA2/30 d
+ 94:05 101.02 107.73 100.23 104.74 93.83 96.00 98.96 101.25 104.21 100.00 103.22 100.87 98 .OO 100.91 96.34 97.50 98.46 101 19 100.00 100.31 98.95 97.30 96.89 101.30 102.33 102.27 94.29 97.06 101.71 101.08 104.48 100.71 98.05 99.84 104.74 107.01 98.37 104.59 95.45 108.65 104.58 101.05
Rotat ion Period h m s 9 57 49.8 9 57 59.4 9 58 08.6 9 57 58.3 9 58 04.5 9 57 49.6 9 57 52.5 9 57 56.6 9 57 59.7 9 58 03.8 9 57 58.0 9 58 02.5 9 57 59.2 9 57 55.3 9 57 59.3 9 57 53.0 9 57 54.6 9 57 55.9 9 57 59.7 9 57 58.0 9 57 58.5 9 57 56.6 9 57 54.3 9 57 53.8 9 57 59.8 9 58 01.2 9 58 01.2 9 57 50.2 9 57 54.0 9 58 00.4 9 57 59.5 9 58 04.2 9 57 59.0 9 57 55.4 9 57 57.8 9 58 04.5 9 58 07.7 9 57 55.8 9 58 04.3 9 57 51.8 9 58 09.9 9 58 04.3 9 57 59.5
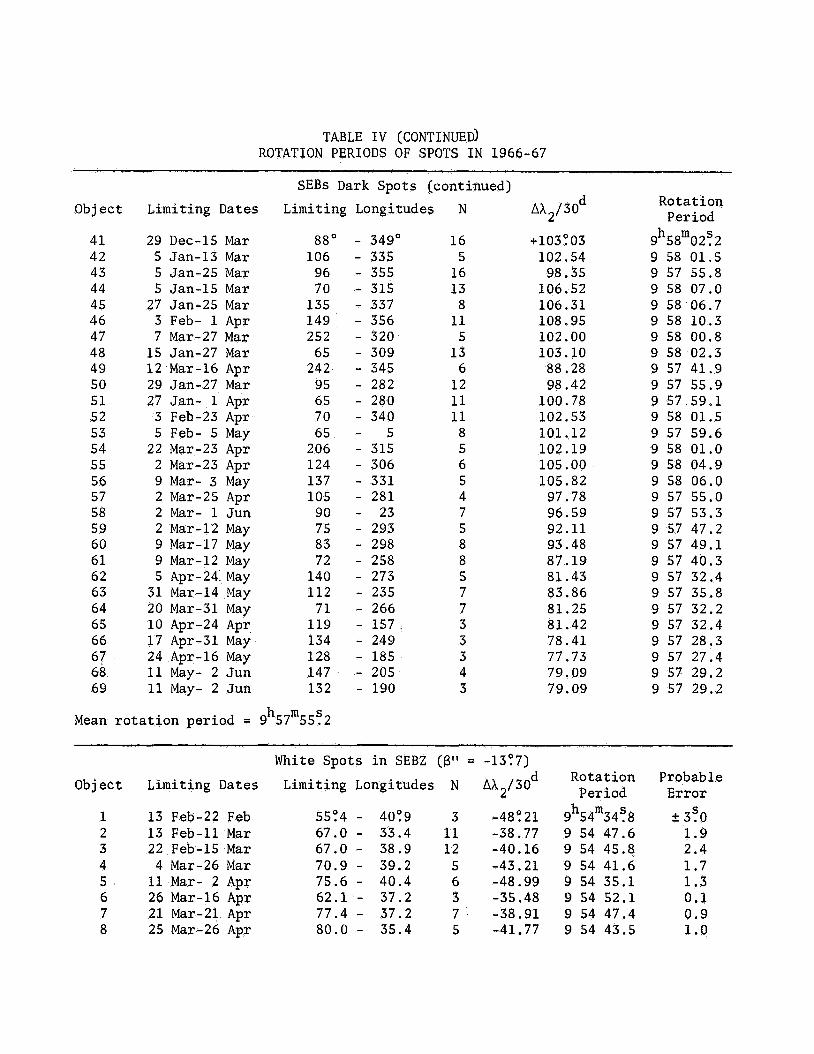
TABLE IV (CONTINUED) ROTATION PERIODS OF SPOTS IN 1966-67
Ob j ect
41 42 43 44 45 46 47 48 49 50 51 52 53 54 55 56 57 58 59 60 61 62 63 64 65 66 67 68 69
Limiting Dates
29 Dec-15 Mar 5 Jan-13 Mar 5 Jan-25 Mar 5 Jan-15 Mar 27 Jan-25 Mar 3 Feb- 1 Apr 7 Mar-27 Mar 15 Jan-27 Mar 12 Mar-16 Apr 29 Jan-27 Mar 27 Jan- 1 Apr 3 Feb-23 Apr 5 Feb- 5 May 22 Mar-23 Apr 2 Mar-23 Apr 9 Mar- 3 May 2 Mar-25 Apr 2 Mar- 1 Jun 2 Mar-12 May 9 Mar-17 May 9 Mar-12 May 5 Apr-24.May 31 Mar-14 May 20 Mar-31 May 10 Apr-24 Apr 17 Apr-31 May 24 Apr-16 May 11 May- 2 Jun 11 May- 2 Jun
SEBs Dark Spots (continued) Limiting Longitudes N
88' - 349' 106 - 335 96 - 355 70 - 315 135 - 337 149 - 356 252 - 320 65 - 309 242 - 345 95 - 282 65 - 280 70 - 340 65 - 5 206 - 315 124 - 306 137 - 331 105 - 281 90 - 23 75 - 293 83 - 298 72 - 258 140 - 273 112 - 235 71 - 266 119 - 157 134 - 249 128 - 185 147 - 205 132 - 190
h m s Mean rotation period = 9 57 55.2
16 5 16 13 8 11 5 13 6 12 11 11 8 5 6 5 4 7 5 8 8 5 7 7 3 3 3 4 3
AA2/30 d
+103'1 03 102.54 98.35 106.52 106.31 108.95 102.00 103.10 88.28 98.42 100.78 102.53 101.12 102.19 105.00 105.82 97.78 96.59 92.11 93.48 87.19 81.43 83.86 81.25 81.42 78.41 77.73 79.09 79.09
Rot at ion Period
h m s 9 58 02.2 9 58 01.5 9 57 55.8 9 58 07.0 9 58 06.7 9 58 10.3 9 58 00.8 9 58 02.3 9 57 41.9 9 57 55.9 9 57 59.1 9 58 01.5 9 57 59.6 9 58 01.0 9 58 04.9 9 58 06.0 9 57 55.0 9 57 53.3 9 57 47.2 9 57 49.1 9 57 40.3 9 57 32.4 9 57 35.8 9 57 32.2 9 57 32.4 9 57 28.3 9 57 27.4 9 57 29.2 9 57 29.2
Object
1 2 3 4 5 6 7 8
Limiting Dates
13 Feb-22 Feb 13 Feb-11 Mar 22 Feb-15 Mar 4 Mar-26 Mar 11 Mar- 2 Apr 26 Mar-16 Apr 21 Mar-21 Apr 25 Mar-26 Apr
White Spots in SEBZ ((3" = -13'17) Limiting Longitudes N AA2/30 d
55'14 - 40'19 3 -48'121 67.0 - 33.4 11 -38.77 67.0 - 38.9 12 -40.16 70.9 - 39.2 5 -43.21 75.6 - 40.4 6 -48.99 62.1 - 37.2 3 -35.48 77.4 - 37.2 7 -38.91 80.0 - 35.4 5 -41 77
Rotat ion Period h m s 9 54 34.8 9 54 47.6 9 54 45.8 9 54 41.6 9 54 35.1 9 54 52.1 9 54 47.4 9 54 43.5
Probable Error -+ 3.0 1.9 2.4 1.7 1.3 0.1 0.9 1 .o
S
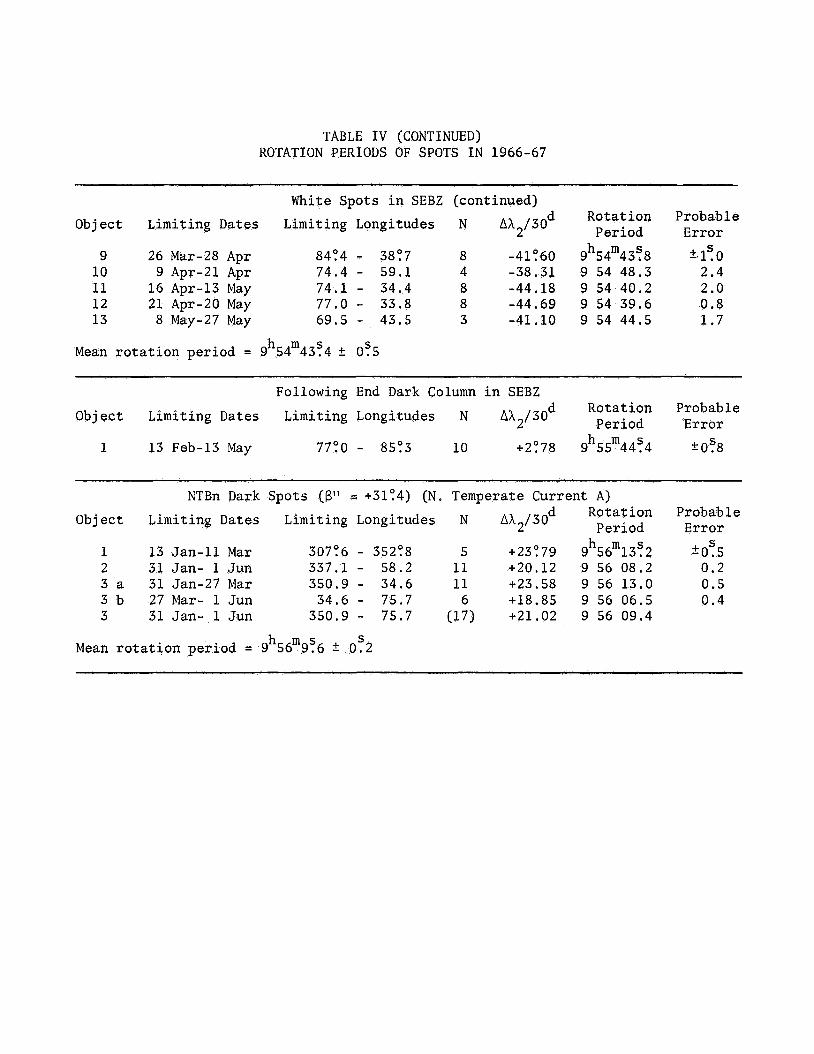
TABLE I V (CONTINUED) ROTATION PERIODS OF SPOTS IN 1966-67
White Spots in SEBZ (continued) d Rotation
9 26 Mar-28 Apr 8404 - 38?7 8 -41?60 9 h m s 54 43.8 Period Object Limiting Dates Limiting Longitudes N Ah2/30
10 9 Apr-21 Apr 74.4 - 59.1 4 -38.31 9 54 48.3 11 16 Apr-13 May 74.1 - 34.4 8 -44.18 9 54 40.2 12 21 Apr-20 May 77.0 - 33.8 8 -44.69 9 54 39.6 13 8 May-27 May 69.5 - 43.5 3 -41.10 9 54 44.5
h m s Mean rotation period = 9 54 43.4 5 Os5
Probable Error 5.1 .o 2.4 2.0 0.8 1.7
S
Following End Dark Column in SEBZ d Rotation Probable
Period Error Object Limiting Dates Limiting Longitudes N Ah2/30
k Os8 h m s 1 13 Feb-13 May 7700 - 8503 10 +2'178 9 55 44.4
NTBn Dark Object Limiting Dates
1 13 Jan-11 Mar 2 31 Jan- 1 Jun 3 a 31 Jan-27 Mar 3 b 27 Mar- 1 Jun 3 31 Jan- 1 Jun
Spots (B" = +3104) (N. Temperate Current A) d Rotation Probable
Error Limiting Longitudes N Ah2/30 Period s
k0.5 30706 - 35208 5 +23079 9 56 13.2 337.1 - 58.2 11 +20.12 9 56 08.2 0.2 350.9 - 34.6 11 +23.58 9 56 13.0 0.5 34.6 - 75.7 6 +18.85 9 56 06.5 0.4
h m s
350.9 - 75.7 (17) +21.02 9 56 09.4 h m s S
Mean rotation period = 9 56 9.6 2 0.2
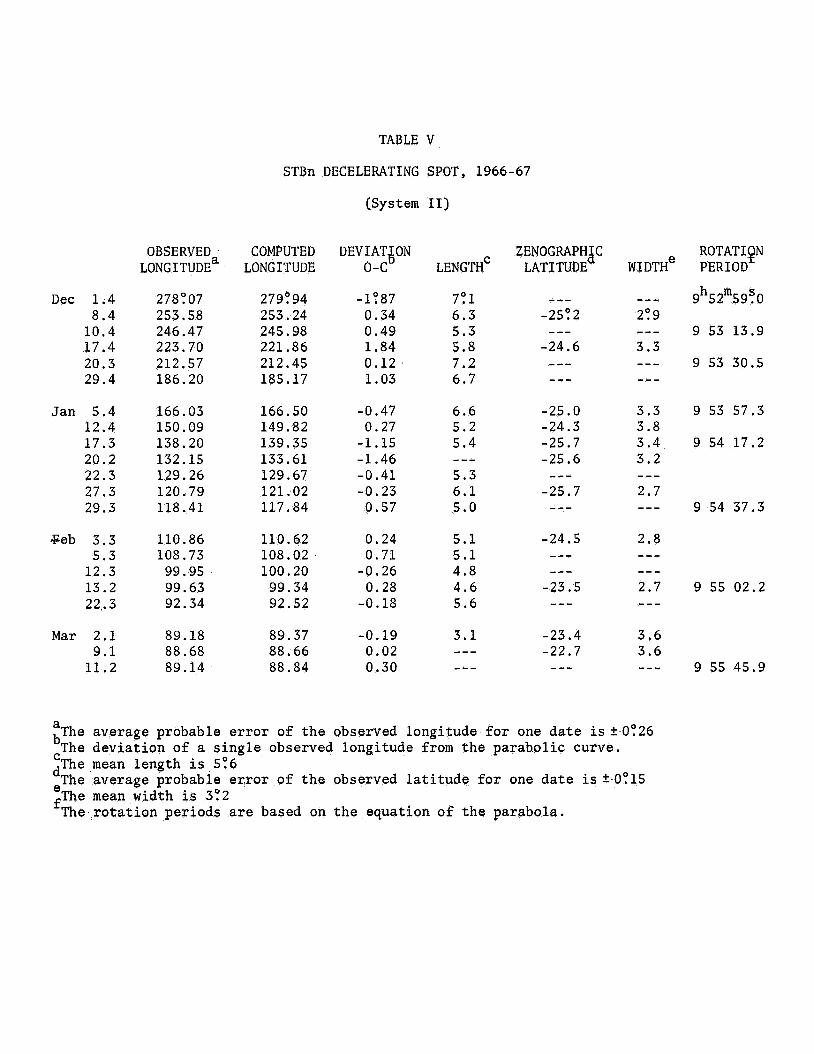
TABLE V
STBn DECELERATING SPOT, 1966-67
Dec 1.4 8 .4
10.4 17.4 20.3 29.4
Jan 5.4 12.4 17.3 20.2 22.3 27.3 29.3
Beb 3.3 5.3
1 2 . 3 13 .2 22,. 3
Mar 2 . 1 9.1
1 1 . 2
OBSERVEDa LONGITUDE
278'107 253.58 246.47 223.70 212.57 186.20
166.03 150.09 138.20 132.15 129.26 120.79 118.41
110.86 108.73 99.95 99.63 92.34
89.18 88.68 89.14
COMPUTED LONGITUDE
279'194 253.24 245.98 221.86 212.45 185.17
166.50 149.82 139.35 133.61 129.67 121.02 117.84
110.62 108.02 100.20
99.34 92.52
89.37 88.66 88.84
(System 11)
DEVIATBON 0-c
-1'187 0.34 0.49 1.84 0.12 1.03
-0.47 0.27
-1.15 -1.46 -0.41 -0.23 0.57
0.24 0.71
0.28 -0.26
-0.18
-0.19 0.02 0.30
LENGTH'
79 1 6 . 3 5 .3 5.8 7 . 2 6.7
6 .6 5.2 5.4
5.3 6.1 5.0
5.1 5 .1 4.8 4.6 5.6
3.1
---
--- c--
ZENOGRAPHAC LATITUDE
--- -25!2 ---
-24.6 --- ---
-25.0 -24.3 -25.7 -25.6 c--
-25.7 r--
-24.5 --r
--- -23.5 ---
-23.4 -22.7 ---
The average probable error of t h e observed longitude for one d a t e i s 2 0926
The mean length is 5'16
The mean width is 392
a bThe deviat ion of a s i n g l e observed longitude from t h e parabol ic curve.
dThe average probable e r r o r of t h e observed l a t i t u d e f o r one d a t e is +-O:lS e
fThe r o t a t i o n per iods are based on t h e equation of t h e parabola.
C
ROTATIPN PERIOD
9 h m s 52 59.0
9 53 13.9
9 53 30.5
9 53 57.3
9 54 17.2
9 54 37.3
9 55 02.2
9 55 45.9
Object
SSSTB SSTBa
ZTeZB / STB / STB n
/sms S n . /SEBn
EB /NEB /NEB
S
n
'/NTB /NTB n
NNTB NNNTB
/Red Spot
/Red Spot
S
genter Red Spot
senteg WOS / wos
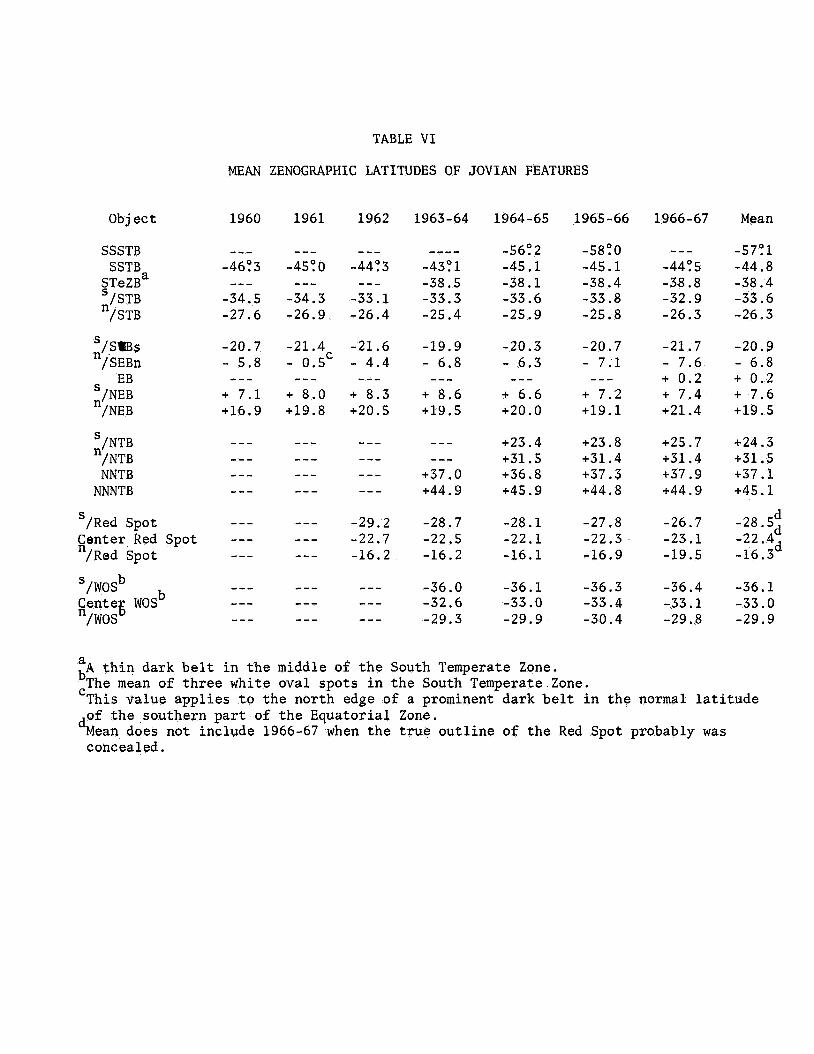
TABLE V I
MEAN ZENOGRAPHIC LATITUDES OF JOVIAN FEATURES
1963-64
---e
-43:l -38.5 -33.3 -25.4
-19.9 - 6.8 ---
+ 8.6 +19.5
--- ---
+37.0 +44.9
-28.7 -22.5 -16.2
-36.0 -32.6 -29.3
1964-65
-56'12 -45.1 -38.1 -33.6 -25.9
-20.3 - 6.3 ---
+ 6.6 +20.0
+23.4 +31.5 +36.8 +45.9
-28.1 -22.1 -16.1
-36.1 -33.0 -29.9
1965-66
-58'10 -45.1 -38.4 -33.8 -25.8
-20.7 - 7.1
+ 7.2 +19.1
+23.8 +31.4 +37.3 +44.8
---
-27.8 -22.3 -16.9
-36.3 -33.4 -30.4
1966-67
--- -44: 5 -38.8 -32.9 -26.3
-21.7 - 7.6 + 0.2 + 7.4 +21.4
+25.7 +31.4 +37.9 +44.9
-26.7 -23.1 -19.5
-36.4 -33.1 -29.8
Mean
-57'11 -44.8 -38.4 -33.6 -26.3
-20.9 - 6.8 + 0.2 + 7.6 +19.5
+24.3 +31.5 +37.1 +45.1
d -28. 5d
-16.3 -22. 4d
-36.1 -33.0 -29.9
A t h i n dark b e l t i n t h e middle of t h e South Temperate Zone.
This value appl ies t o t h e north edge of a prominent dark bel t i n t h e normal l a t i t u d e of t h e southern p a r t of t h e Equatorial Zone.
concealed.
a bThe mean of t h r e e white oval spots i n t h e South Temperate Zone.
dMean does not include 1966-67 when t h e t rue o u t l i n e of t h e Red Spot probably was
C

a a U a 5 a
rn W LL
4 cd L)
I I i I I I I e
OD - OD (u
a0 OD w IC - IC
Y
m w LL
a a a.
a 9
0 0 to k-l
o( 3
I-l N cn 0
9%
h
a, c c, a, L) 4 c, 0 z
0 b v) 4
rv 3
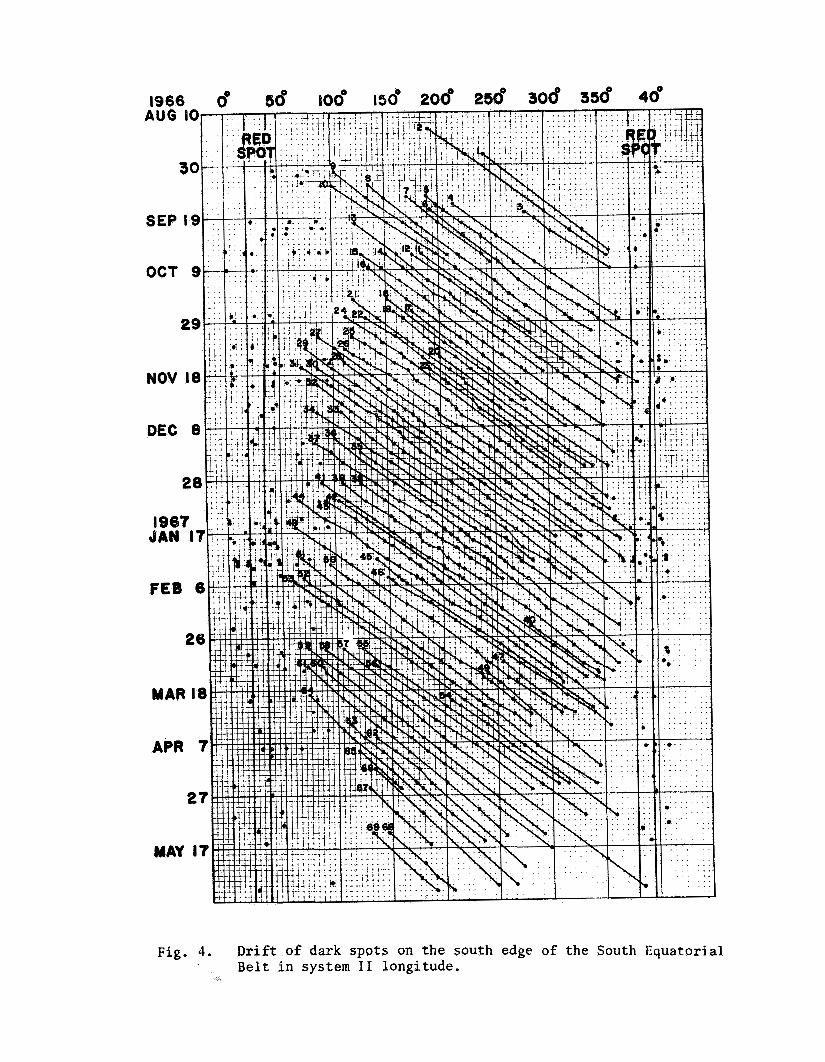
Fig. 4. Drift of dark spots on the south edge of the South Equatorial Belt in system I1 longitude.
I I I I I I I
I I I I I I 1 (D (u 00 tt 0 cu 00 d-
_. (D - tc) tc) (v (u (u
SlOdS A 0 U38VUflN
i 1 I I I I
-
L
I
1.
rcl 0
a 0
001t13d N O l l W l O t 1
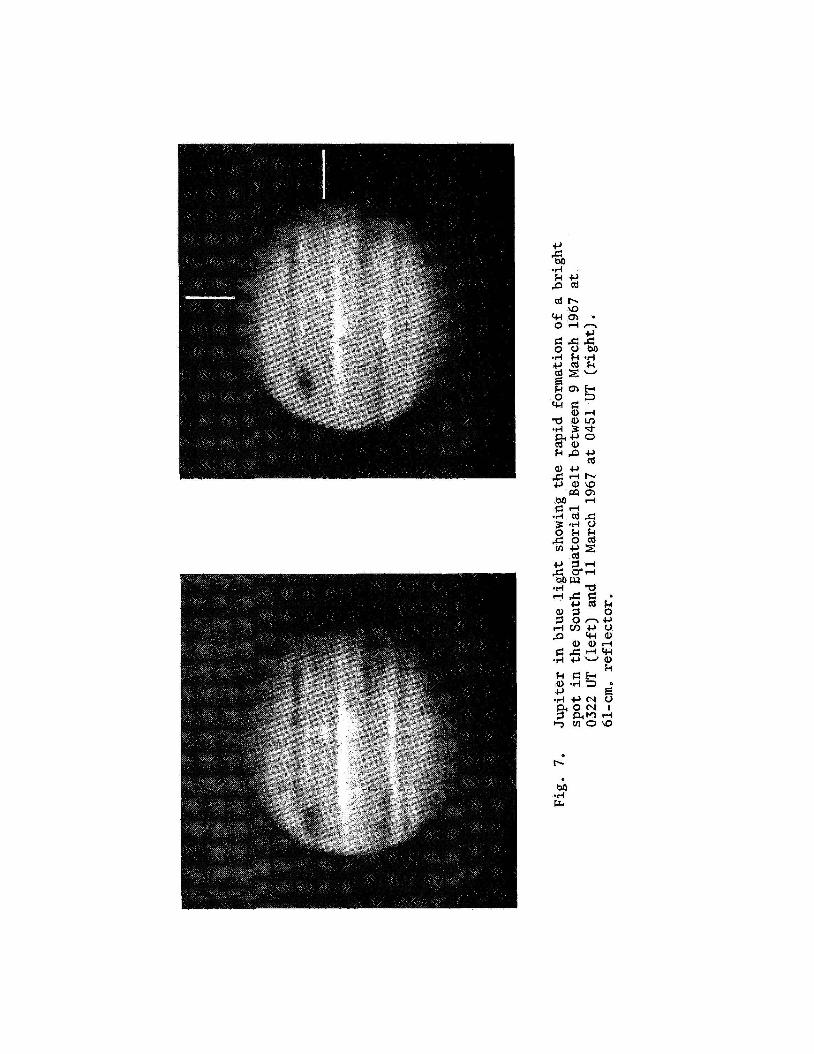
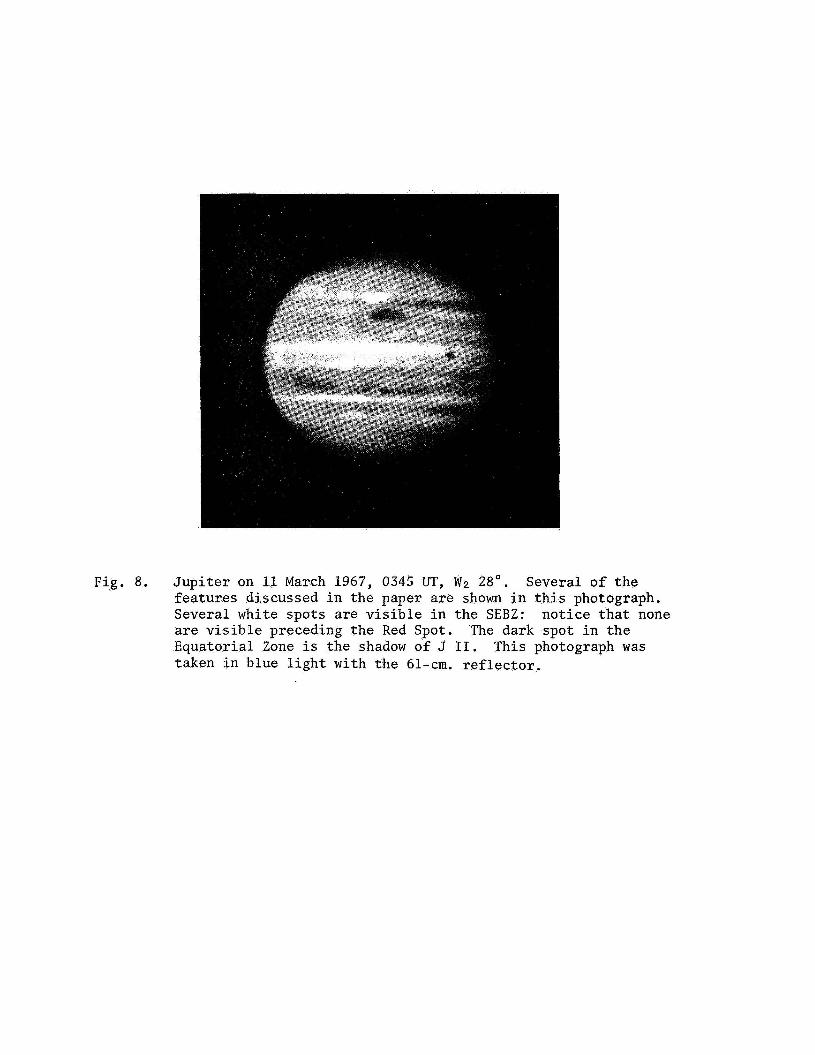
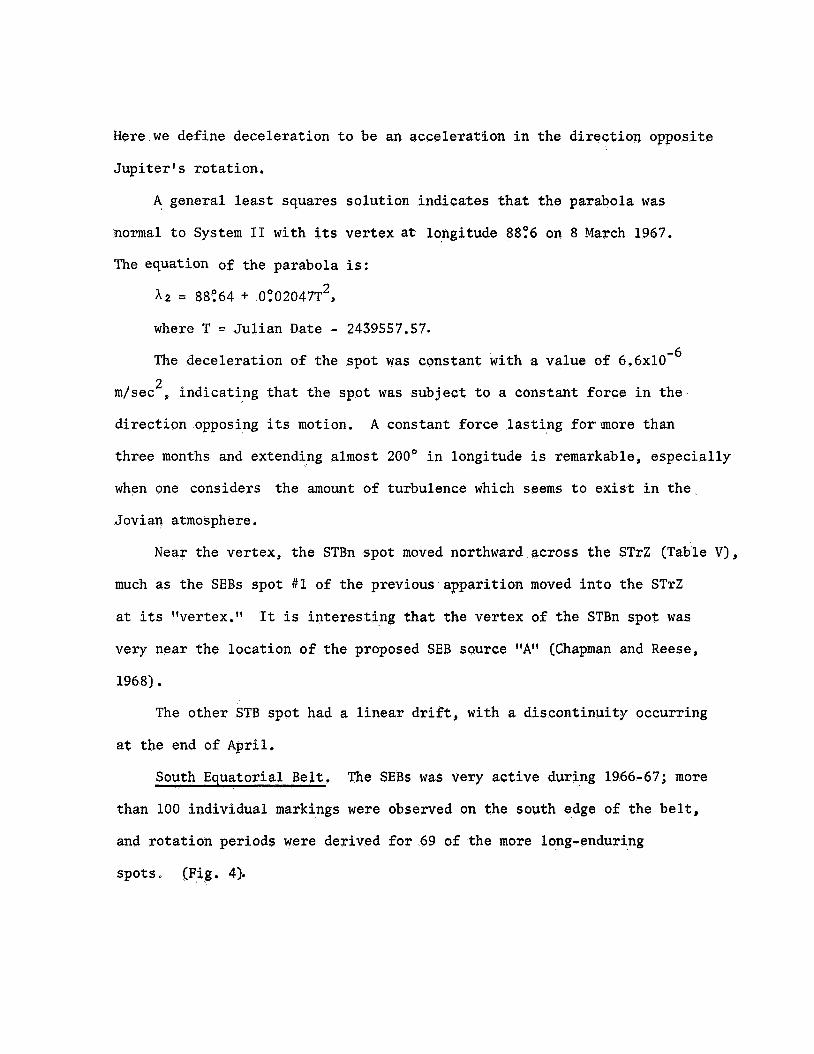
Fig. 8. J u p i t e r on 11 March 1967, 0345 UT, W P 28". Several of t h e fea tures discussed i n t h e paper are shown i n t h i s photograph. Several white spots are v i s i b l e i n t h e SEBZ: a r e v i s i b l e preceding t h e Red Spot. Equatorial Zone i s the shadow of J 11. taken i n blue l i g h t with t h e 61-cm. r e f l e c t o r .
no t i ce t h a t none The dark spot i n t h e
This photograph was