Embed Size (px)
Citation preview
IGPP Proposal Number 349R
Investigation of Rifting Processes in the Rio Grande Rift Using Data from Unusually Large Earthquake Swarms
Allan Sanford Robert Balch
Geophysical Research Center and Geoscience Department New Mexico Institute of Mining and Technology, Socorro, NM
Leigh House Hans Hartse
EES-4, Los Alamos National Laboratory, Los Alamos, NM Grant Period: 10/1/93 - 9/30/94
Reporting Period: 10/1/93 - 8/31/94 Amount Awarded: $25,000
I. Introduction San Acacia Swarm in the Rio Grande Rift. Because the Rio Grande rift
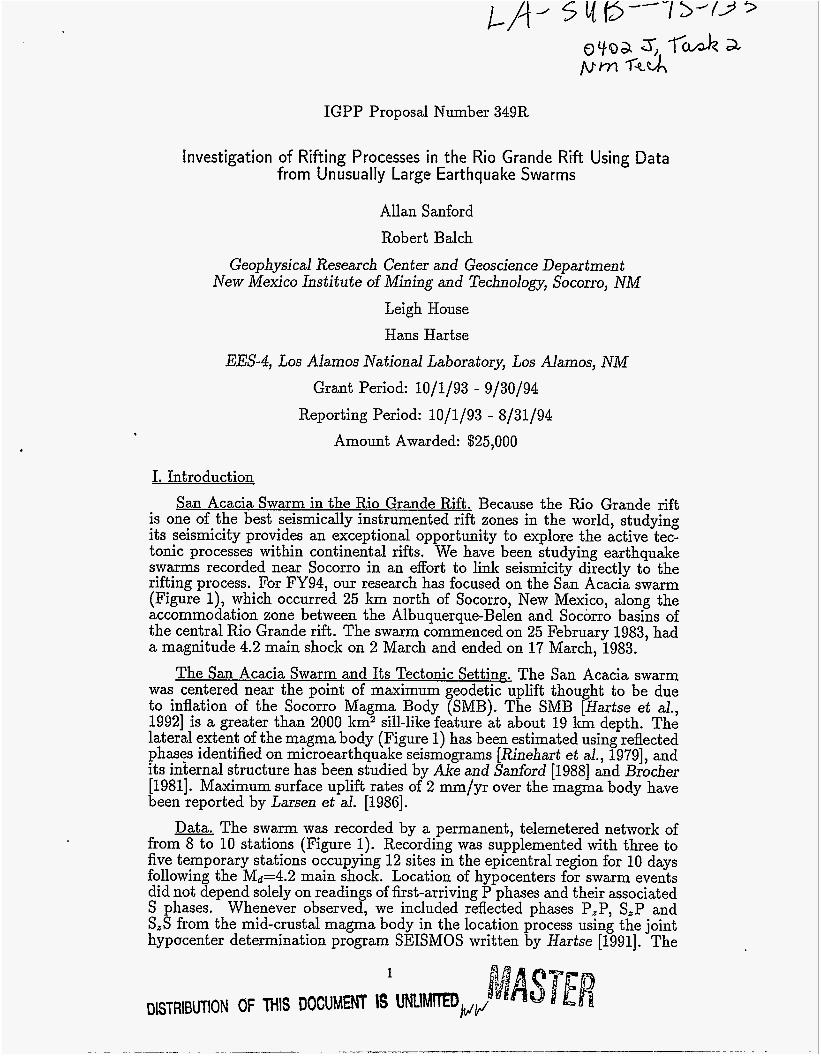
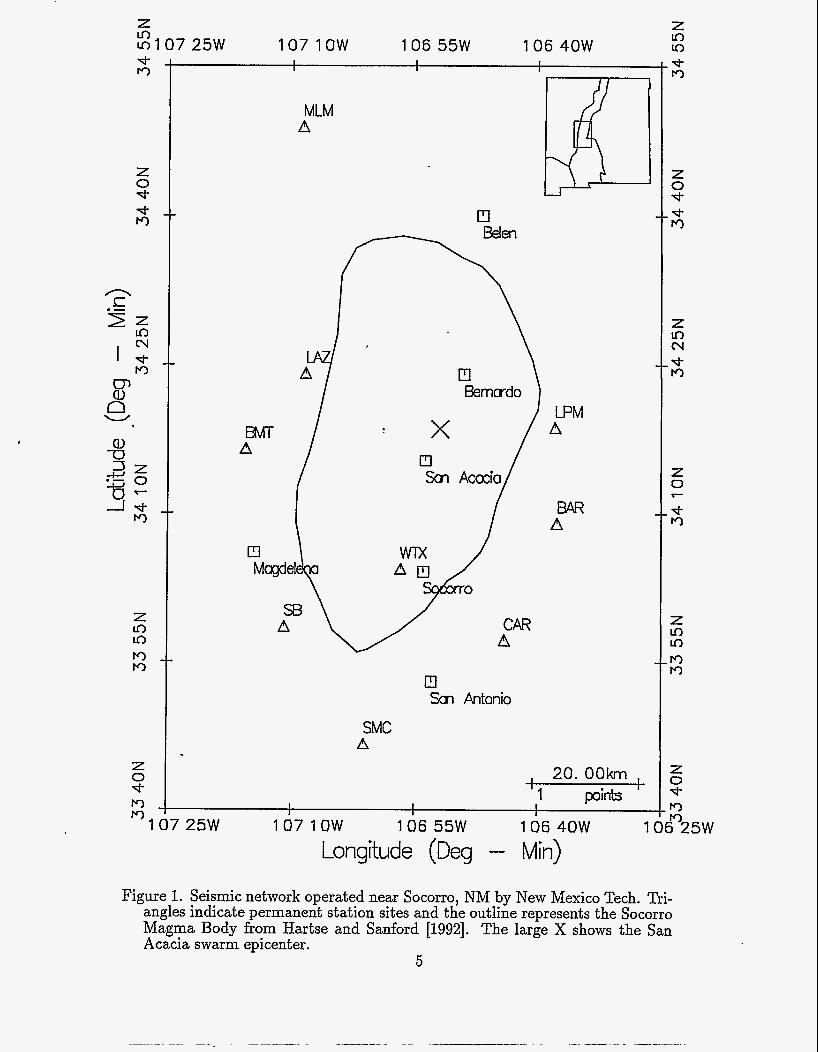
is one of the best seismically instrumented rift zones in the world, studying its seismicity provides an exceptional opportunity to explore the active tec- tonic processes within continental rifts. We have been studying earthquake swarms recorded near Socorro in an effort to link seismicity directly to the rifting process. For FY94, our research has focused on the San Acacia swarm (Figure l), which occurred 25 km north of Socorro, New Mexico, along the accommodation zone between the Albuquerque-Belen and Socorro basins of the central Rio Grande rift. The swarm commenced on 25 February 1983, had a magnitude 4.2 main shock on 2 March and ended on 17 March, 1983.
The San Acacia Swarm and Its Tectonic Setting. The San Acacia swarm was centered near the point of maximum geodetic uplift thought to be due to inflation of the Socorro Magma Body (SMB). The SMB [Hartse et al., 19921 is a greater than 2000 km2 sill-like feature at about 19 k.m depth. The lateral extent of the magma body (Figure 1) has been estimated using reflected phases identified on microearthquake seismograms [Rinehart et al., 19791, and its internal structure has been studied by f i e and Sanford [1988] and Brocher [1981]. Maximum surface uplift rates of 2 mm/yr over the magma body have been reported by Larsen et al. [1986].
Data. The swarm was recorded by a permanent, telemetered network of from 8 to 10 stations (Figure 1). Recording was supplemented with three to five temporary stations occupying 12 sites in the epicentral region for 10 days following the Md=4.2 main shock. Location of hypocenters for swarm events did not depend solely on readings of first-arriving P phases and their associated S phases. Whenever observed, we included reflected phases P,P, S,P and S,S from the mid-crustal magma body in the location process using the joint hypucenter determination program SEISMOS written by Hartse [1991]. The
use of reflected phases has been shown to reduce focal depth errors of Socorro area earthquakes by a factor of three over the use of direct phases only [Hartse, 19911. 11. Progress During the Reporting Period A. Maior Findinns
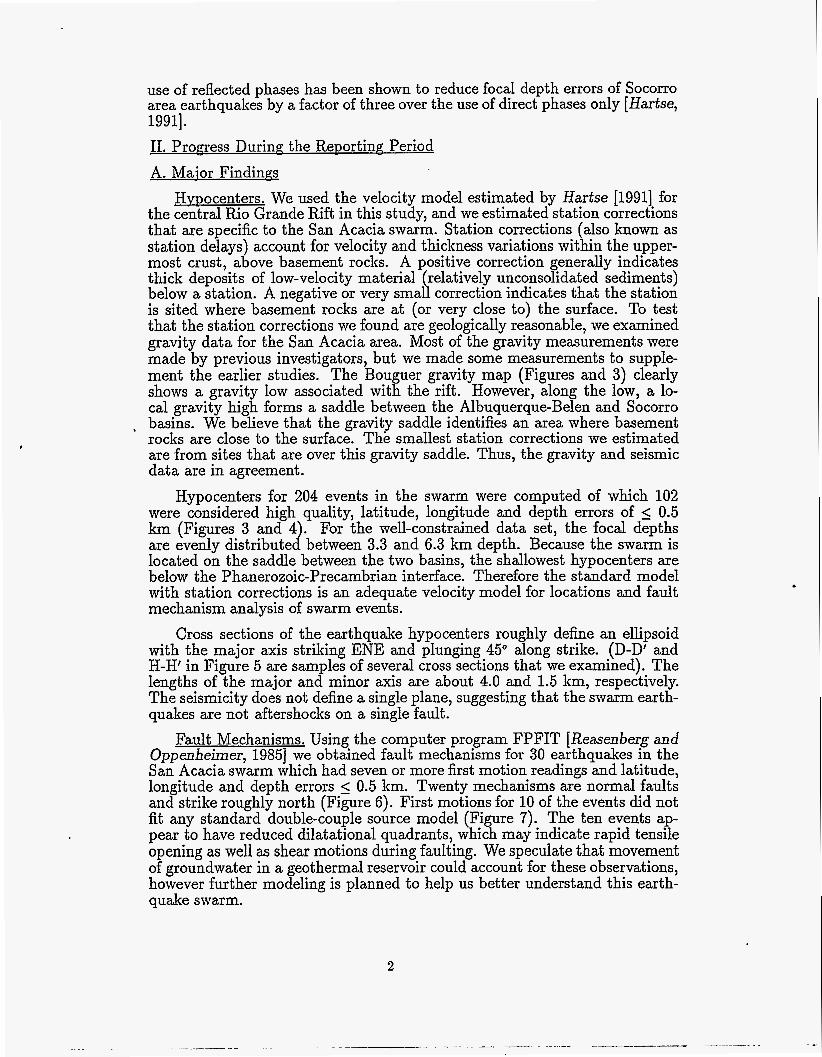
Hypocenters. We used the velocity model estimated by Hartse [1991] for the central Rio Grande Rift in this study, and we estimated station corrections that are specific to the San Acacia swarm. Station corrections also known as station delays account for velocity and thickness variations wit 6 in the upper- most crust, a r3 ove basement rocks. A positive correction generally indicates thick deposits of low-velocity material relatively unconsolidated sediments)
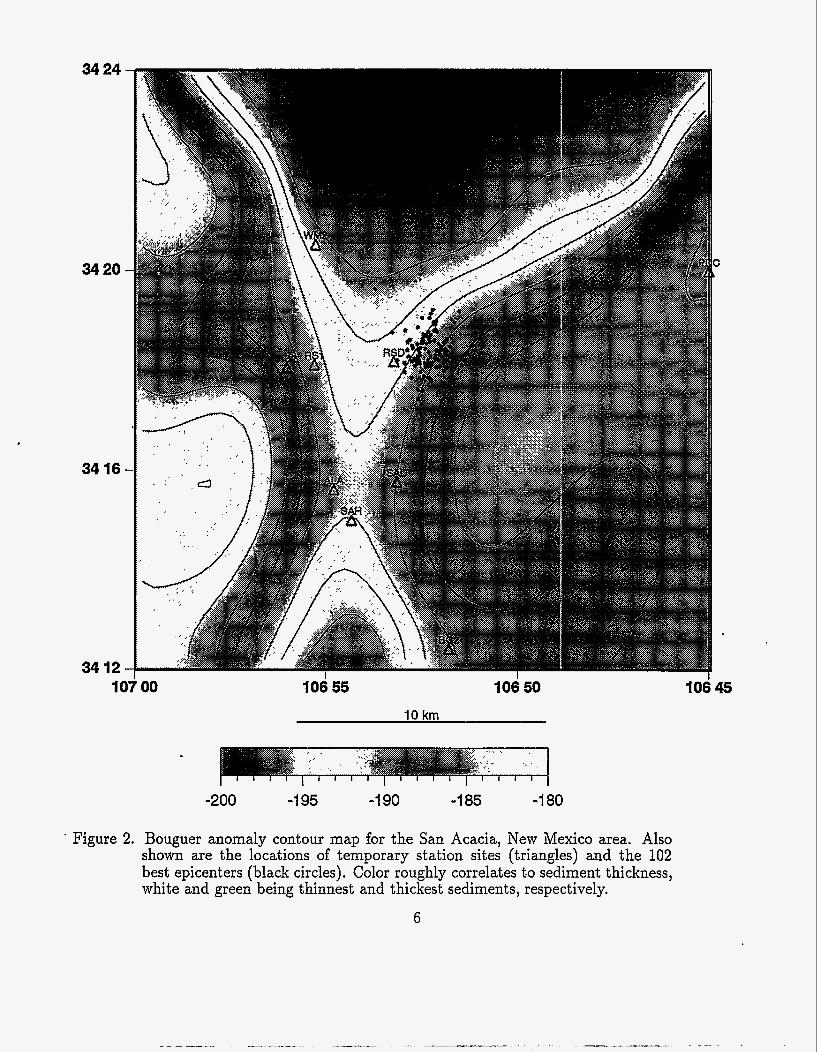
is sited where basement rocks are at (or very close to) the surface. To test that the station corrections we found are geologically reasonable, we examined gravity data for the San Acacia area. Most of the gravity measurements were made by previous investigators, but we made some measurements to supple- ment the earlier studies. The Bouguer gravity map (Figures and 3) clearly shows a gravity low associated with the rift. However, along the low, a lo- cal gravity high forms a saddle between the Albuquerque-Belen and Socorro
, basins. We believe that the gravity saddle identifies an area where basement rocks are close to the surface. The smallest station corrections we estimated are from sites that are over this gravity saddle. Thus, the gravity and seismic data are in agreement.
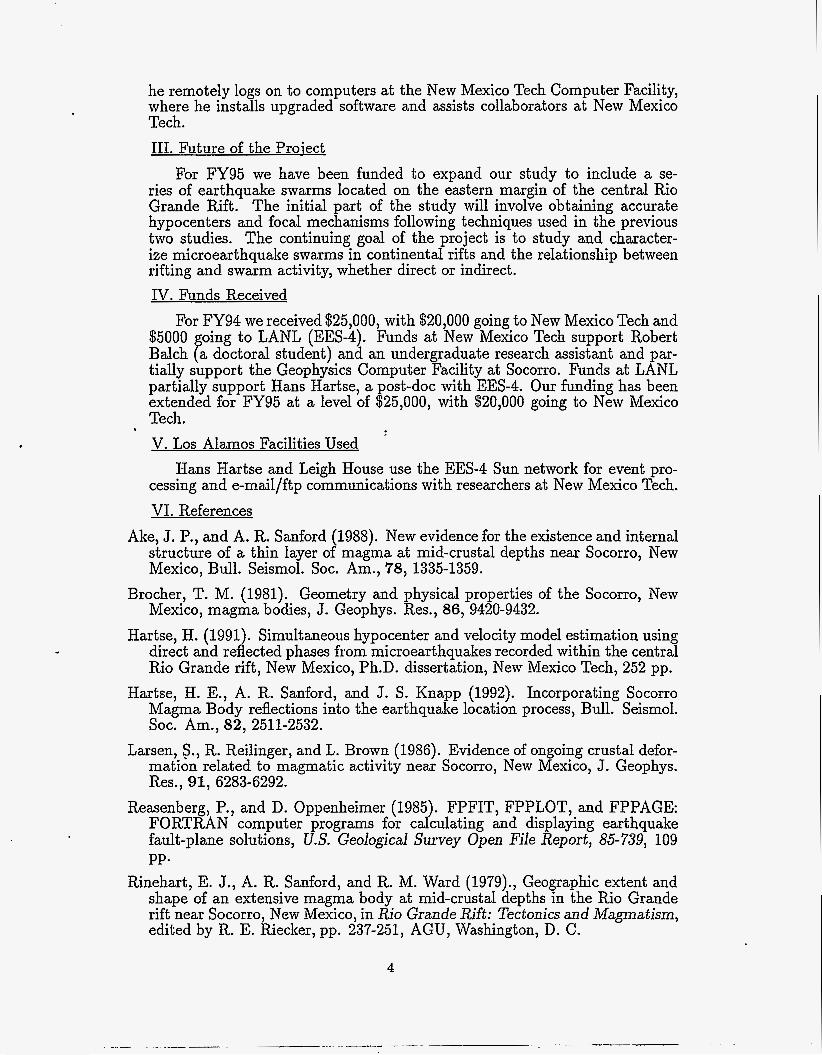
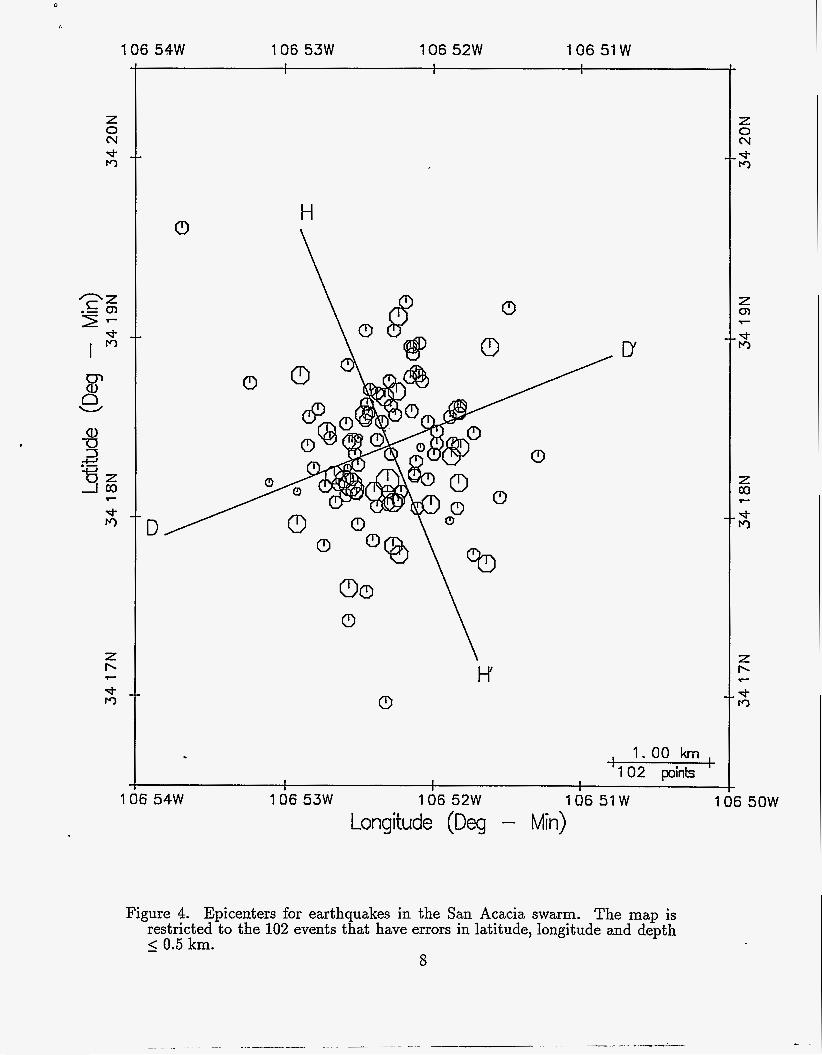
Hypocenters for 204 events in the swarm were computed of which 102 were considered high quality, latitude, longitude and depth errors of 5 0.5 km (Figures 3 and 4 . For the well-constrained data set, the focal depths are evenly distribute d between 3.3 and 6.3 km depth. Because the swarm is located on the saddle between the two basins, the shallowest hypocenters are below the Phanerozoic-Precambrian interface. Therefore the standard model with station corrections is an adequate velocity model for locations and fault mechanism analysis of swarm events.
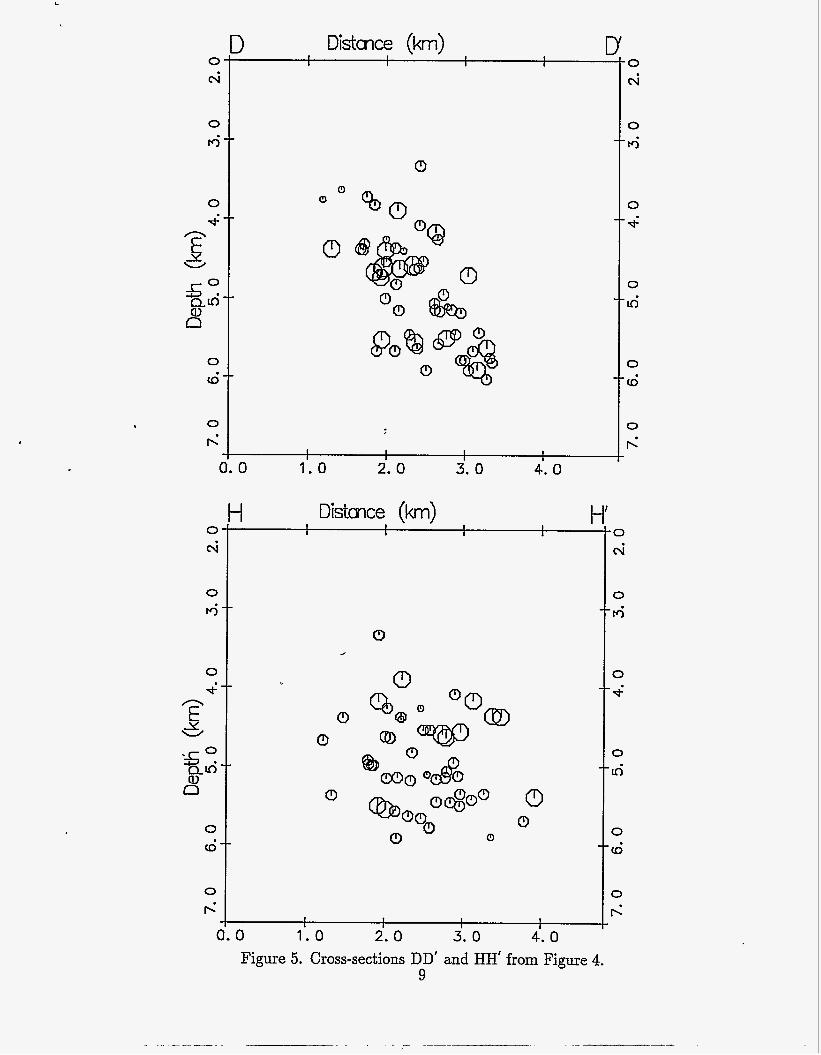
Cross sections of the earthquake hypocenters roughly define an ellipsoid with the major axis striking ENE and plunging 45" along strike. (D-DI and H-HI in Figure 5 are samples of several cross sections that we examined). The lengths of the major and minor axis are about 4.0 and 1.5 km, respectively. The seismicity does not define a single plane, suggesting that the swarm earth- quakes are not aftershocks on a single fault.
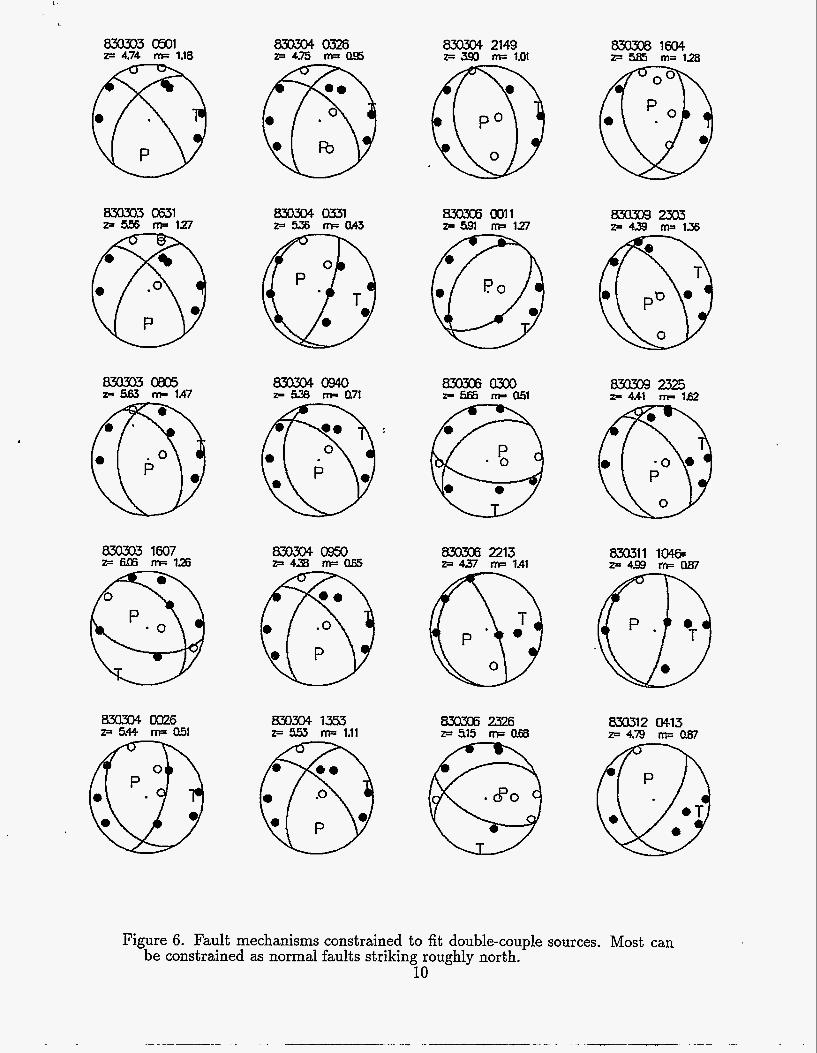
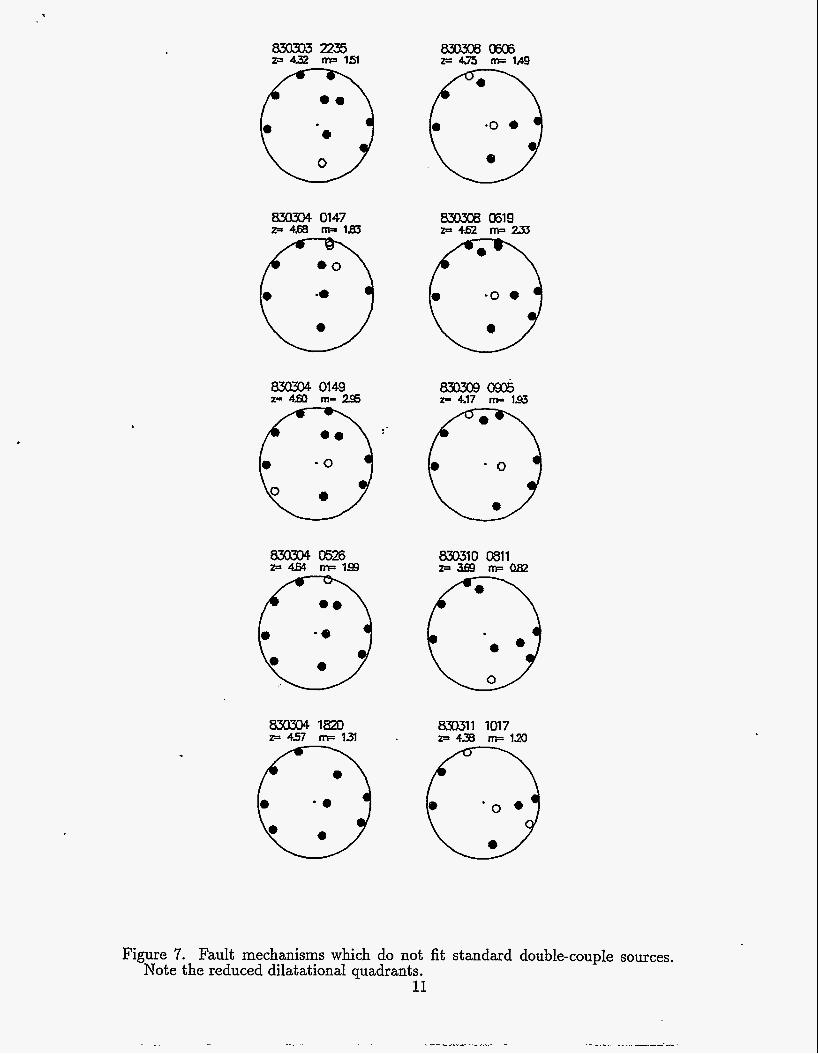
Fault Mechanisms. Using the computer program FPFIT [Reasenberg and Oppmheimer, 19851 we obtained fault mechanisms for 30 earthquakes in the San Acacia swarm which had seven or more first motion readings and latitude, longitude and depth errors 5 0.5 km. Twenty mechanisms are normal faults and strike roughly north (Figure 6). First motions for 10 of the events did not fit any standard double-couple source model (Figure 7). The ten events ap- pear to have reduced dilatational quadrants, which may indicate rapid tensile opening as well as shear motions during faulting. We speculate that movement of groundwater in a geothermal reservoir could account for these observations, however further modeling is planned to help us better understand this earth- quake swarm.
below a station. A negative or very smal (l correction indicates that the station
2
B. Summarv and Conclusions Important characteristics of the San Acacia swarm that have been revealed
by this research are listed below: 1. The hypocenters occupy an ellipsoidal volume with major axis striking
ENE and plunging 45" along strike. 2. The standard model with station corrections is an adequate
velocity model for locations and fault mechanism analysis of swarm events, since the shallowest earthquakes are below the Phanerozoic- Precambrian interface.
strike north. The other 10 events have first motions which do not appear to fit any standard double-couple.
3. Focal mechanisms for 20 of 30 events analyzed are normal and
We have not completed any source modeling at the time of this report, however, it is possible that groundwater circulating in heated rocks could allow the disparate focal mechanisms. Regardless, some additional component to the standard double-couple without moment source mechanism is necessary to explain the reduction in the dilatational quadrants of one-third of the well- constrained focal mechanisms. C. Equipment Obtained and Faciiities Used
'
No new equipment has been obtained for this project. Data analysis was completed at the New Mexico Tech Geophysics Computer Facility. D. Tangible Results Papers in Preparation
Sanford, A., R. Balch, J. Lakings, H. Hartse, and L. House. A link between listric faulting and recent seismicity in the central Rio Grande rift of New Mexico, in preparation for submission to Bulletin of the Seismological Society of America. Balch, R., A. Sanford, L. Jaksha, H. Hartse, and L. House. Non-Double Couple Focal Mechanisms Observed in the Central Rio Grande Rift of New Mexico, in preparation for submission to Bulletin of the Seismological Society of America. Abstracts and Presentations Sanford, A., R. Balch, J. Lakings, H. Hartse, and L. House, A link between listric faulting and recent seismicity in the central Rio Grande rift of New Mexico, abstract presented at Fall, 1993 AGU Meeting. Balch, R., A. Sanford, L. Jaksha, H. Hartse, and L. House. Non-Double Couple Focal Mechanisms Observed in the Central Rio Grande Rift of New Mexico, abstract submitted to Fall, 1994 AGU Meeting. E. Intangible Results ,
The administration of this project has encouraged collaboration between earth scientists at New Mexico Tech and LANL. Communication through e- mail has been routine. In addition, Hans Hartse has a computer account on the New Mexico Tech Geophysics Sun network. From his office in Los Alamos
3
he remotely logs on to computers at the New Mexico Tech Computer Facility, where he installs upgraded software and assists collaborators at New Mexico Tech. 111. Future of the Project
For FY95 we have been funded to expand our study to include a se- ries of earthquake swarms located on the eastern margin of the central Rio Grande Rift. The initial part of the study will involve obtaining accurate hypocenters and focal mechanisms following techniques used in the previous two studies. The continuing goal of the project is to study and character- ize microearthquake swarms in continental rifts and the relationship between rifting and swarm activity, whether direct or indirect. IV. Funds Received
For FY94 we received $25,000, with $20,000 going to New Mexico Tech and oing to LANL (EES-4). Funds at New Mexico Tech support Robert
Balch $5000 r a doctoral student) and an undergraduate research assistant and par- tially support the Geophysics Computer Facility at Socorro. Funds at LANL partially support Hans Hartse, a post-doc with EES-4. Our funding has been extended for FY95 at a level of $25,000, with $20,000 going to New Mexico Tech. V. Los Alamos Facilities Used
Hans Hartse and Leigh House use the EES-4 Sun network for event pro- cessing and e-mail/ftp communications with researchers at New Mexico Tech. VI. References
Ake, J. P., and A. R. Sanford (1988). New evidence for the existence and internal structure of a thin layer of magma at mid-crustal depths near Socorro, New Mexico, Bull. Seismol. SOC. Am., 78, 1335-1359.
Brocher, T. M. (1981). Geometry and physical properties of the Socorro, New Mexico, magma bodies, J. Geophys. Res., 86, 9420-9432.
Hartse, H. (1991 . Simultaneous hypocenter and velocity model estimation using direct and re fl ected phases from microearthquakes recorded within the central Rio Grande rift, New Mexico, Ph.D. dissertation, New Mexico Tech, 252 pp.
Hartse, H. E., A. R. Sanford, and J. S. Knapp (1992). Incorporating Socorro Magma Body reflections into the earthquake location process, Bull. Seismol. SOC. Am., 82, 2511-2532.
Larsen, S . , R. Reilinger, and L. Brown (1986). Evidence of ongoing crustal defor- mation related to magmatic activity near Socorro, New Mexico, J. Geophys. Res., 91, 6283-6292.
Reasenberg, P., and D. Oppenheimer (1985). FPFIT, FPPLOT, and FPPAGE: FORTRAN computer programs for calculating and displaying earthquake fault-plane solutions, U.S. Geological Survey Open File Report, 85-739, 109 PP.
Rinehart, E. J., A. R. Sanford, and R. M. Ward (1979)., Geographic extent and shape of an extensive magma body at mid-crustal depths in the Rio Grande rift near Socorro, New Mexico, in Rio Grande Rift: Tectonics and Magmatism, edited by R. E. Riecker, pp. 237-251, AGU, Washington, D. C.
4
Z
-4- M
1
Z 0 4- d- r3
06m25W r3
Z 0 In M M
z 0 d- m
107 1 O W 106 55W 106 40W
BMT A
MLM A
CAR A
[fl sa7 Antonio
SMC A
B LPM
A
BAR A
20.0Okm. '1 pints
I I 1 1 m
10710W 106 55W 106 4 0 W
Z 0 d- d- m
z Cl N d- M
Z 0
z Lo Lo M M
Longitude (Deg - Min)
Figure 1. Seismic network operated near Socorro, NM by New Mexico Tech. Tri- angles indicate permanent station sites and the outline represents the Socorro Magma Body from Hartse and Sanford [1992]. The large X shows the San Acacia swarm epicenter.
5
34 24
34 20
34 16
34 12 107 00
I
106 55
-200 -1 95 -1 90 -1 85 -1 80
' Figure 2. Bouguer anomaly contour map for the San Acacia, New Mexico area. Also shown are the locations of temporary station sites (triangles) and the 102 best epicenters (black circles). Color roughly correlates to sediment thickness, white and green being thinnest and thickest sediments, respectively.
6
106 45
-1 07.00 -1 06.90
-1 06.80 Longitude
-200.0 -1 95.0 -1 90.0 -1 85.0 -1 80.0
Anomaly (mgal)
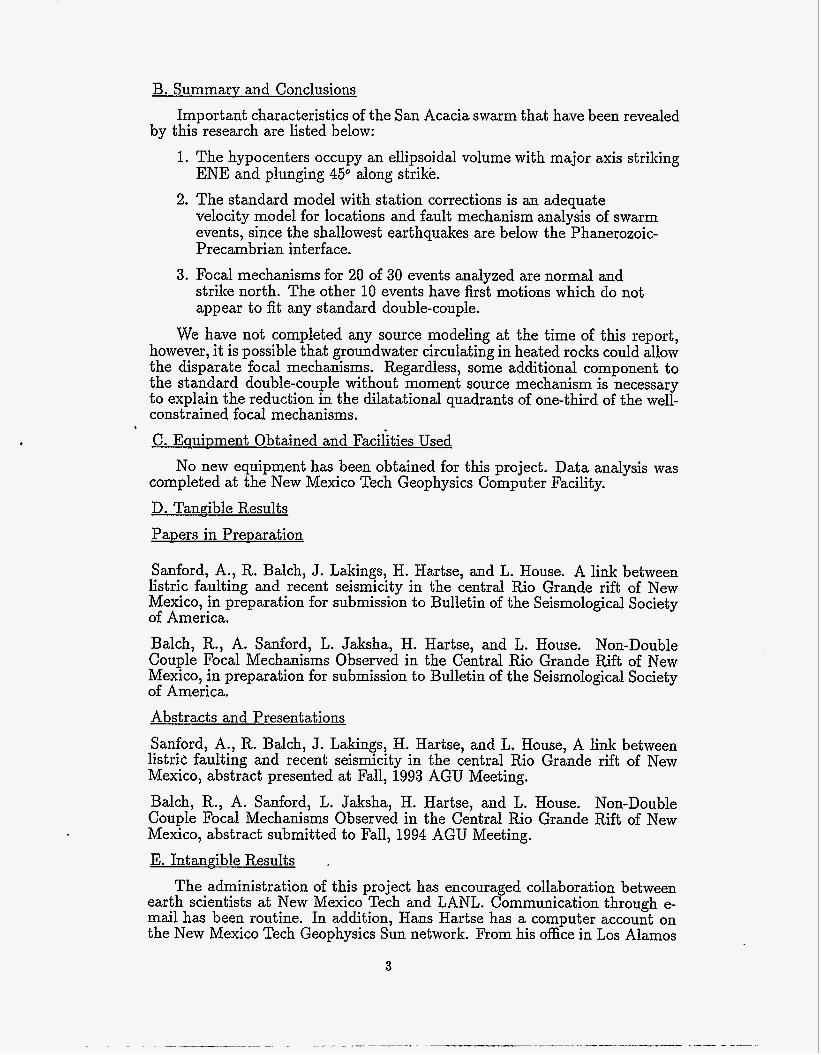
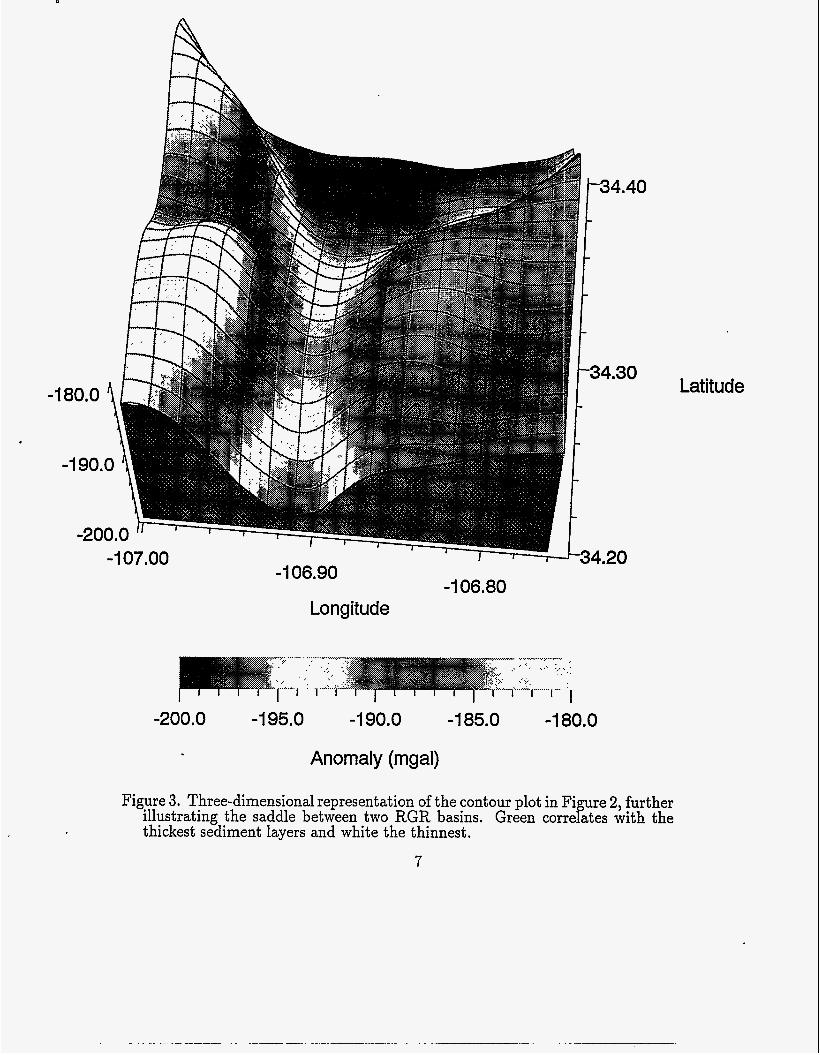
Figure 3. Three-dimensional representation of the contour plot in Fi ure 2, further illustrating the saddle between two RGR basins. Green cone B ates with the thickest sediment layers and white the thinnest.
7
Latitude
a
Z 0 hl d- r)
d-
I M
106 54W 106 53W 106 52W 10651W
Z b - cf M
1
D
0 H
0
0
0
00 0 \
w
1.00 km I
'102 points ' I 1 1
1
i 54w 106 53W 106 5 2 W 106 5 1 W 1 Longitude (Deg - Min)
Figure 4. Epicenters for earthquakes in the San Acacia swarm. The map is restricted to the 102 events that have errors in latitude, longitude and depth - < 0.5 km.
8
Z 0 hl d- rs)
z cn
z m P
d- pc)
z b
-I- n P
i 5 0 W
0 0
0
0 0
Figure 5. Cross-sections DD' and HH' from Figure 4. 9
8xJ933 0501 b 4.74 m= 1.18
mm 0326 iF 4.75 m=J 0.95
83QX>30805 z- !Si m 1A7
830304094Q F 538 m Q71
8xuo92325 z- 4.41 m IM
8xlx>Q 0026 F54+ m 0.51
8 E C 6 2213 - 437 m= 1Al
830304 1353 z= 553 RP 1.11
830306 2326 t 515 m= 0.68
8x1311 1046 - 4 s m=m
8xls12 04-13 z= 4.79 m= 0.87
Figure 6. Fault mechanisms constrained to fit double-couple sources. Most can be constrained as normal faults striking roughly north.
10
830304 0147 830308 (319 P4.60 lll=183 -4.62 m233
830311 1017 -4.39 m=1m
830304 1820 F 457 In= 1 3
Figure 7. Fault mechanisms which do not fit standard double-couple sources. Note the reduced dilatational quadrants.
11
DISCLAIMER
This report was prepared as an account of work sponsored by an agency of the United States Government Neither the United States Government nor any agency thereof, nor any of their employees, makes any warranty, express or implied, or assumes any legal liability or responsibility for the accuracy, completeness, or use- fulness of any information, apparatus, product, or process disclosed, or represents that its use would not infringe privately owned rights. Reference herein to any spe- cific commercial product, process, or service by trade name, trademark, manufac- turer, or otherwise does not necessarily constitute or imply its endorsement, recom- mendstion, or favoring by the United States Government or any agency thereof. The views and opinions of authors expressed herein do not necessarily state or reflect those of the United States Government or any agency thereof.
,


![Efficient System-Enforced Deterministic Parallelism · put. Determinism is the foundation of replay debug-ging [37,39,46,56], fault tolerance [15,18,50], and ac-countability mechanisms](https://img.pdfslide.net/doc/110x75/5f7ca3e5683afb0c6c28a462/eficient-system-enforced-deterministic-parallelism-put-determinism-is-the-foundation.jpg)

![Mechanisms of normal fault development at mid-ocean ridges › science › GG › people › jlin › papers › ... · 1. Introduction [2] The structure of oceanic crust formed at](https://img.pdfslide.net/doc/110x75/5f11c2173f046871bf168083/mechanisms-of-normal-fault-development-at-mid-ocean-ridges-a-science-a-gg-a.jpg)