Embed Size (px)
Citation preview

plan for the 21st century: new orleans 2030, aDopteD auGust 2010 | 2.1
2chapter NEW ORLEANS YESTERDAY AND TODAY: POPULATION AND LAND USE TRENDS
Three years after the worst disaster to befall any U.S. city in American history—necessitating the almost total evacuation of the population—the City of New Orleans has exceeded expectations in population recovery. As of June, 2009, the city was home to more than three-quarters of the number of pre-Hurricane Katrina households.1 Some neighborhoods that escaped major flooding
during the Hurricane Katrina catastrophe have higher populations than before the storm, and all parts of the city have seen resettlement. Despite the complex recovery challenges that remain, the city’s population rebound shows both the fierce attachment of New Orleanians to their city and the potential for the city’s urban character and unique cultural identity to attract a generation of new New Orleanians.
This chapter describes the post-World War II demographic and land use trends that shaped the New Orleans of today. This period in New Orleans’ history is part of a larger story of urban decline which lasted through the 1990s and affected all American cities—and the beginning of an urban renaissance that gathered steam in the early 2000s and continues today. New Orleans was part of this story, including the beginnings of urban renaissance, in its own way and based on its own history. Despite the Hurricane Katrina catastrophe and the uncertain economic climate that predominates while this document is being written, New Orleans still can show the character and conditions that were making New Orleans attractive again to people who wanted to live in cities.
1 BrookingsInstitution/GreaterNewOrleansCommunityDataCenter.“NewOrleansIndex.”August,2009.www.gnocdc.org.
Volume 3

Volume 3 | chapter 2 | new orleans yesterDay anD toDay: population anD lanD use trenDs
2.2 | plan for the 21st century: new orleans 2030, aDopteD auGust 2010
2
2 “DisabilitystatusisdefinedbytheU.S.Censusasalong-lastingsensory,physical,mental,oremotionalcondition.”
WWW.NOLAMASTERPLAN.ORG
Population:
• July,2009(estimate*):351,568
• CensusApril2000:484,674
Age and Gender Composition
(2007)
MedianAge:
• 19%under18yearsold
• 13%aged65orolder
• 47%male
• 53%female
Households
• June,2009estimate*:151,423
• 55%ofhouseholdsin2007werefamilyhouseholds(personsrelatedbybloodormarriage)
• 31%ofhouseholdsin2007weremarriedcouples
• 9%ofhouseholdsin2007weremarriedcoupleswithchildrenunder18
• 38%ofhouseholdsin2007wereone-personhouseholds
Racial/Ethnic Composition (2007)
• 31%White,non-Hispanic
• 60%African-American,non-Hispanic
• 3%Asian
• 5%Hispanic/Latino,allraces
• 2%,other,non-Hispanic
• PublicSchool(RSD,BESE,OPSB)enrollment,February2009
> 90%African-American
> 5%White
> 2%Asian
> 2%Hispanic
Language Spoken at Home (2007)
• 91%ofthepopulation5yearsandolderspokeEnglishonlyathome
• 5%spokeSpanishathome
• 2%spokeanAsianlanguageathome
Disability (2007)
• 7%ofpersonsaged5to15hadadisability
• 15%ofpersonsaged16to64hadadisability
• 48%ofpersonsaged65andolderhadadisability
Educational Attainment (2007)
• 29%ofthepopulationhadabachelor’sdegreeorhigher
• 18%ofthepopulationdidnothaveahighschooldiploma
Income (2007)
• MedianHouseholdIncome:$38,614
• MedianFamilyIncome:$45,902
• 46%ofhouseholdshadincomeslessthan$35,000
• 14%ofhouseholdshadincomesof$100,000ormore
• 15%offamilieshadincomesbelowthepovertylevel
• 21%ofindividualshadincomesbelowthepovertylevel
POPULATION
WHAT DOES IT MEAN?
• TheNewOrleansMetropolitanAreaexperiencedalossofprominenceandslowergrowththanmanyothersouthernmetropolitanregionsinthelatterhalfofthe20thcentury.
• By2005,NewOrleanshadlargelystabilizedafterdecadesofpopulationlossandsocioeconomicdecline.
• NewOrleanshasrecoveredpopulationatafargreaterratethaninitiallypredictedafterHurricaneKatrina.
• WhiletheracialcompositionofthecityhasshiftedsinceKatrina,thepopulationofNewOrleansremainedabout60%AfricanAmericanasof2007.
• Mosthouseholdsarefamilyhouseholds.• In2007,lessthan10%ofhouseholdsare“traditional”,composedofmarriedcoupleswithchildren.
• Morethanathirdofallhouseholdsin2007weresinglepersonhouseholds.
• FollowingHurricaneKatrina,therewasaninfluxofHispanicpopulation.
• In2007,about1in5individualNewOrleanianslivedbelowthepovertyline.
Sources: 2007 American Community Survey; Brookings Institution/Greater New Orleans Community Data Center “New Orleans Index,” August, 2009; *City of New Orleans/Greater New Orleans Community Data Center Challenge and Greater New Orleans Community Data Center “Demographic Profiles of New Orleans and the Metro Area.” All data is for Orleans Parish.

Volume 3 | chapter 2 | new orleans yesterDay anD toDay: population anD lanD use trenDs
plan for the 21st century: new orleans 2030, aDopteD auGust 2010 | 2.3
F i n d i n g s : P o P u l at i o n a n d d e m o g r a P h i c t r e n d s
New Orleans’ demographic profile in the second half of the 20th century and the early years of the 21st century was consistent with population changes in many older American cities—until the catastrophe of Hurricane Katrina. Since Hurricane Katrina, the city has regained population at a faster rate than initially predicted. Key demographic characteristics and trends include:
• As of July 1, 2009, the population of New Orleans was estimated at 351,568—approximately 77 percent of New Orleans’ pre-Hurricane Katrina population—based on a variety of sources including postal and utility account data.
• Overall, population recovery has exceeded initial expectations after Hurricane Katrina, though recovery varies significantly from neighborhood to neighborhood.
• The City of New Orleans’ population fell 21 percent in the thirty years between the peak population of 627,625 in 1960 and 1990, when it was 496,938.
• During the 1990s, New Orleans’ population was stabilizing, with a small decline in population resulting from smaller household size and a slight increase in the number of households.
• While the city grew wealthier in absolute terms 1960–1990, it grew wealthier at a much slower rate than its neighboring suburban parishes. The median family income in New Orleans was 96 percent of the metropolitan median in 1960, but by 1990 it had declined to 76 percent of the metropolitan area median.
• Since Hurricane Katrina, New Orleans’ population has shifted demographically, resulting in a city that is somewhat more White, older, more educated, and richer.
> New Orleans has a moderately smaller percentage of African American residents than it had prior to the Hurricane.
> In spite of the challenges faced by elderly residents, there is little evidence that the city has experienced a disproportionate decline in its elderly population.
> The city has a smaller percentage of children than it did prior to Hurricane Katrina.
> The recovery of the public school population has lagged behind the recovery of the population overall. The income, racial and ethnic characteristics of public school students remain similar to the pre-storm profile.
> Surveys indicate that about 10 percent (over 30,000 people) of the estimated 2008 post-Hurricane Katrina population came to New Orleans after the storm.
> Anecdotal and limited statistical evidence suggests a post-storm influx of Hispanic residents and young professionals.
> Households have a higher median income and a smaller percentage of the population lives below the poverty line, than before the storm.
> The city continues to have a bifurcated educational profile with a higher percentage than the national average of adults lacking a high school diploma and of adults with a college degree or graduate degree. Since Hurricane Katrina, a greater percentage of the adult population of New Orleans has a high school diploma.
Volume 3 | chapter 2 | new orleans yesterDay anD toDay: population anD lanD use trenDs
2.4 | plan for the 21st century: new orleans 2030, aDopteD auGust 2010
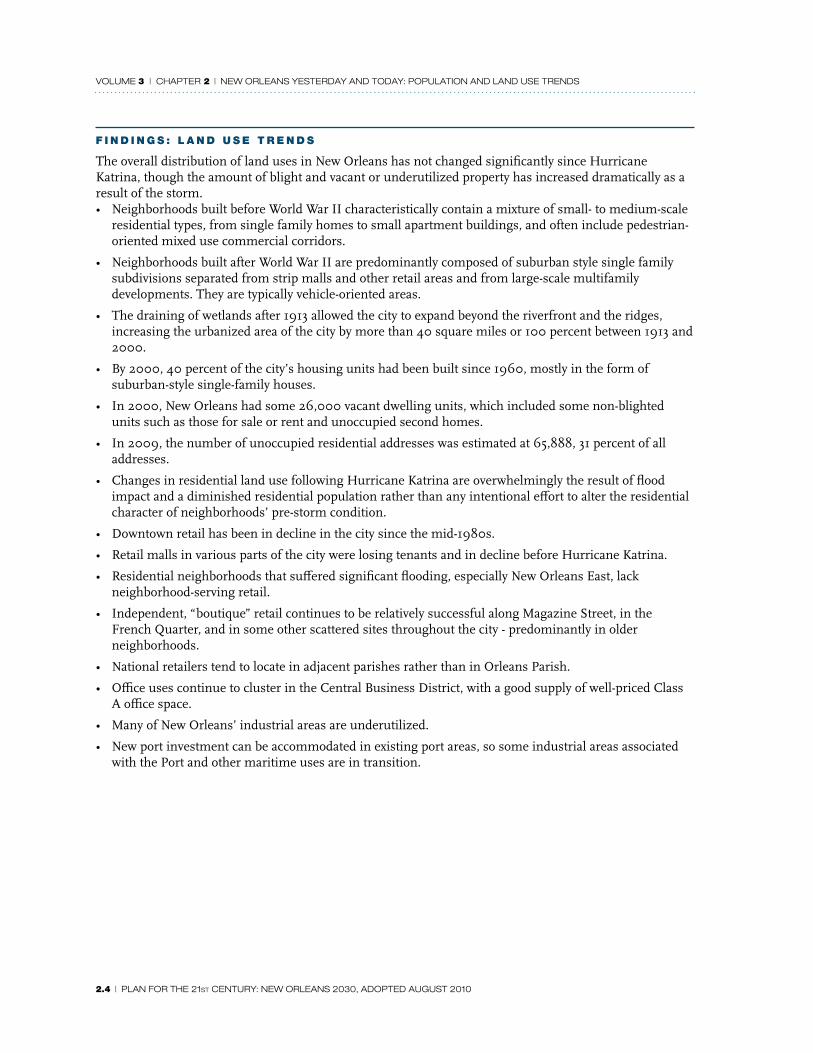
F i n d i n g s : l a n d u s e t r e n d s
The overall distribution of land uses in New Orleans has not changed significantly since Hurricane Katrina, though the amount of blight and vacant or underutilized property has increased dramatically as a result of the storm.• Neighborhoods built before World War II characteristically contain a mixture of small- to medium-scale
residential types, from single family homes to small apartment buildings, and often include pedestrian-oriented mixed use commercial corridors.
• Neighborhoods built after World War II are predominantly composed of suburban style single family subdivisions separated from strip malls and other retail areas and from large-scale multifamily developments. They are typically vehicle-oriented areas.
• The draining of wetlands after 1913 allowed the city to expand beyond the riverfront and the ridges, increasing the urbanized area of the city by more than 40 square miles or 100 percent between 1913 and 2000.
• By 2000, 40 percent of the city’s housing units had been built since 1960, mostly in the form of suburban-style single-family houses.
• In 2000, New Orleans had some 26,000 vacant dwelling units, which included some non-blighted units such as those for sale or rent and unoccupied second homes.
• In 2009, the number of unoccupied residential addresses was estimated at 65,888, 31 percent of all addresses.
• Changes in residential land use following Hurricane Katrina are overwhelmingly the result of flood impact and a diminished residential population rather than any intentional effort to alter the residential character of neighborhoods’ pre-storm condition.
• Downtown retail has been in decline in the city since the mid-1980s.
• Retail malls in various parts of the city were losing tenants and in decline before Hurricane Katrina.
• Residential neighborhoods that suffered significant flooding, especially New Orleans East, lack neighborhood-serving retail.
• Independent, “boutique” retail continues to be relatively successful along Magazine Street, in the French Quarter, and in some other scattered sites throughout the city - predominantly in older neighborhoods.
• National retailers tend to locate in adjacent parishes rather than in Orleans Parish.
• Office uses continue to cluster in the Central Business District, with a good supply of well-priced Class A office space.
• Many of New Orleans’ industrial areas are underutilized.
• New port investment can be accommodated in existing port areas, so some industrial areas associated with the Port and other maritime uses are in transition.

Volume 3 | chapter 2 | new orleans yesterDay anD toDay: population anD lanD use trenDs
plan for the 21st century: new orleans 2030, aDopteD auGust 2010 | 2.5
a Demographic Characteristics and Trends in New Orleans, 1940–2008
In 1940, the City of New Orleans was the largest city in the southern United States; a major American port, trade hub, and center of commerce; and a growing metropolis of half a million people. During the second half of the twentieth century, New Orleans suffered the same fate as most established urban centers in the United States: population decline, migration of wealthier residents from the older city center to outlying neighborhoods and suburbs, economic dislocation and disinvestment, and, towards the end of the century, signs of stabilization. In the decades following World War II, the city comprised a decreasing portion of the metropolitan area’s population and shrank in prominence and economic importance relative to other, faster growing American cities.
Unlike many older cities, however, New Orleans was able to capture some of the demand for suburban living because it had created a significant amount of developable land by draining low-lying and wet areas. Neighborhoods such as Lakeview, Gentilly, New Orleans East, and parts of Algiers emerged in the decades after 1960, expanding New Orleans’ urban footprint with suburban-style subdivisions and garden apartments.
the discussion of demographic trends in this report is
based upon several sources of data, including historical
Census data, the 2000 Census, and the Census Bureau’s
American Community Survey (ACS) for the years 2005, 2006, and
2007. The American Community Survey is a set of estimates based
on sample data. Multiple data sets have been utilized because each
has discrete strengths and weaknesses. While the 2000 decennial
census is the most comprehensive and complete data source with
information at more detailed geographic levels, it does not reflect
the actual conditions in the community today.
us census Bureau:
• Total population estimates: In January 2009, the Census
Bureau revised upward its 2007 estimate of New Orleans
population in response to the City’s challenge. The City’s
challenge was based on demographic analysis by the
Greater New Orleans Community Data Center.
• Population composition: Census Bureau ACS estimates remain
the best source of information on the current demographic
composition of New Orleans’ population (that is, the distribution
of gender, age, households and other characteristics in
the population), as the data come from a wide sample of
households and group quarters residents.
locally generated data:
• GCR & Associates, utility account data, population estimates
and projections of future population use.
• Greater New Orleans Community Data Center (GNOCDC)
estimates, based on postal addresses, building permits, utility
accounts and utility usage.
national data sources:
• ESRI and Claritas—widely-cited proprietary data sources
• The New Orleans Index—quarterly report produced
by GNOCDC and the Brookings Institution that provides
supplemental data collected to measure quality of life, such
as health and education indicators and that tracks a number
of recovery measures
• Kaiser Family Foundation surveys.
In an effort to put the characteristics of New Orleans in context,
this document will also routinely compare data describing local
conditions to a consistent selection of other American cities—
thereby highlighting important regional, historical, economic and
demographic similarities and distinctions. Data for these cities
have been collected from a variety of sources, including their
respective state departments of education and a host of U.S.
Census Bureau data products.
land use data:
• Land use patterns pre-Hurricane Katrina are based
on analysis of existing land use in the City Planning
Commission’s 1999 Land Use Plan.
a note on data sources

Volume 3 | chapter 2 | new orleans yesterDay anD toDay: population anD lanD use trenDs
2.6 | plan for the 21st century: new orleans 2030, aDopteD auGust 2010
Population trends New Orleans, like other American cities, lost population in the second half of the twentieth century, but was showing signs of population stabilization by 2000. Unlike other cities, of course, New Orleans was devastated by the catastrophe of Hurricane Katrina in August 2005. Four years later, with an estimated population of 351,568, the city had already recovered approximately 77 percent of its estimated 2005 population.3
World War ii to 1990: the suBurBan halF-centuryBetween World War II and the last decade of the twentieth century, New Orleans, like most urban centers in the United States, suffered a long-term decline in population, falling 21 percent from a peak of 627,525 in 1960 to 496,938 by 1990.4 While many cities began their decline almost immediately after World War II, the population of New Orleans increased during the 1940s and 1950s, gaining almost 133,000 people between 1940 and 1960.5 Because the city’s economy was based on trade, energy and tourism, and it had a relatively small industrial sector, it was not as affected by declines in
manufacturing as other American cities. While the 1960s marked the beginning of a period of population decline, continued investment in the post-war period ensured that the population losses suffered by New Orleans were far less severe than those experienced by other cities over the same period, such as Cleveland, Pittsburgh, and St. Louis.
Population and economic decline were particularly acute in the latter half of the 1980s because of the oil bust of the mid 1980s. The faltering economy in the 1980s affected not only the city of New Orleans but also the metropolitan area at large. Neighboring Jefferson Parish, for example, saw practically no growth between 1980 and 1990, while regional competitors such as metropolitan Charlotte, Nashville, and Houston continued to see growth in both their central cities and their suburbs at much higher rates.6
3 Ibid.4 U.S.CensusBureau5 Ibid.6 Ibid.
taBle 2.1: city oF neW orleans PoPulation By decade
Year PoPulation % Change
1950 570,445
1960 627,525 10.0%
1970 593,471 -5.4%
1980 557,515 -6.1%
1990 496,938 -10.9%
2000 484,674 -2.5%Source: u.S. cenSuS Bureau
Figure 2.1: city oF neW orleans PoPulation as a Percentage oF metroPolitan area PoPulation , 1950–2005
Source: u.S. cenSuS Bureau

Volume 3 | chapter 2 | new orleans yesterDay anD toDay: population anD lanD use trenDs
plan for the 21st century: new orleans 2030, aDopteD auGust 2010 | 2.7
1990–2005: smaller households and urBan staBilization BeFore the hurricane Katrina catastroPheCensus data indicate population was stabilizing during the 1990s and there is reason to believe that this trend was continuing before Hurricane Katrina. New Orleans lost 12,164 residents between 1990 and 2000, but this decline was entirely due to smaller household size rather than outmigration. The number of households actually inched up from 1990 to 2000, from 188,235 to 188,251.7
After the precipitous decline in the oil and gas economy during the 1980s, New Orleans’ economy began to stabilize in the mid-1990s, largely due to the continued rise of the convention and tourism industry, and at the same time, violent crime declined significantly. Moreover, in relation to the entire metropolitan area, New Orleans’ median family income increased slightly from 1990 to 2000, from 75.7 percent of the metropolitan median to 75.9 percent of the metropolitan median.8 Another statistic that confirms New Orleans’ newfound stability in the 1990s is the fact that the city did not experience a decline in its median family income relative to the entire metro area. From 1990 to 2000, New Orleans grew wealthier at a faster rate than adjacent suburban parishes.9
7 Ibid.8 Ibid.9 Ibid.
maP 2.1: Percentage change in PoPulation By BlocK grouP, 1990–2000
0 0.75 1.5 2.25 3Miles
LEGEND
Planning Districts 10 & 11
Percent Change in Population between 1990 and 2000 by Census Block GroupLoss of over -25%
Loss between -10% and -25%
Loss up to -10%
Gain up to 10%
Gain between 10% and 25%
Gain between 25% and 50%
Gain of over 50%
Sources: City of New Orleans, U.S. Census Bureau
¯
Mississippi River
Lake Pontchartrain
leGenDPercent Change in Population between 1990 and 2000 by Census Block group
Loss of over -25%Loss between -10% and -25%Loss up to -10%Gain up to 10%Gain between 10% and 25%Gain between 25% and 50%Gain of over 50%

Volume 3 | chapter 2 | new orleans yesterDay anD toDay: population anD lanD use trenDs
2.8 | plan for the 21st century: new orleans 2030, aDopteD auGust 2010
While population estimates from the Census Bureau indicated that New Orleans had experienced a significant loss in population from 2000 to 2005, there is compelling evidence to suggest that its population was in fact holding steady during the first half of the decade.10
On the district and neighborhood level, few meaningful conclusions can be made about the pattern of population loss and gain between 1990 and 2000. Losses were seen in some block groups, particularly those that contained public housing projects closed during the period, but modest growth was also experienced in parts of neighborhoods all across the city.
2005–2008: hurricane Katrina to today—recovering PoPulationIn August 2005, Hurricane Katrina and the failure of levees caused a level of destruction and dislocation that the United States had not witnessed since the San Francisco earthquake of 1906. Of the city’s 188,251 occupied housing units, fully 134,334—or 71 percent—were flooded. According to FEMA estimates, over 55 percent of the city’s housing stock was classified in the “major” or “severe” damage categories.11 Nearly 100 percent of the population left the city because of the lingering floodwaters. Despite this level of devastation, accompanying population loss and severe economic disruption, New Orleans has rebounded much more quickly than many demographers initially projected.12 The RAND Corporation initially estimated that by September 1, 2008 the city would have a population of 272,000, but estimated population at that time was 328,758, more than 20 percent greater. Though still well below the Census Bureau’s pre-Hurricane
10 TheCityofNewOrleans,usinganalysisprovidedbytheGreaterNewOrleansCommunityDataCenter(GNOCDC),submittedachallengetotheCensusPopulationEstimateforOrleansParishforJuly,2007.Inresearchingthiscase,GNOCDCscrutinizedevidence,includingbuildingpermits,utilityaccountdata,andUSPScountsofactiveaddresses,allofwhichsuggestedasignificantundercountofthepre-HurricaneKatrinapopula-tionofNewOrleansintheCensusBureau’spopulationestimateforJuly1,2005.
11 FEMAofficialdamageestimates12 RANDCorporationreport,“TheRepopulationofNewOrleansAfterHurricaneKatrina”publishedMarch2006
maP 2.2: Percentage oF June 2005 residences active in sePtemBer 2008, By Planning district
Source: Gno community Data center analySiS of ValaSSiS reSiDential anD BuSineSS DataBaSe

Volume 3 | chapter 2 | new orleans yesterDay anD toDay: population anD lanD use trenDs
plan for the 21st century: new orleans 2030, aDopteD auGust 2010 | 2.9
Katrina population estimate of 453,726, New Orleans’ 2009, estimated population now places the city back in the cohort of major central cities such as Cincinnati, Pittsburgh, Tampa, and St. Louis.
By September 2008, all New Orleans planning districts except for District 8 (which includes the Lower Ninth Ward) had reached 55 percent or more of the number of June 2005 households.13 As might be expected, districts with no or minimal flooding recovered more quickly than those that suffered extensive flooding. As of late 2009, many neighborhoods remain in an intermediate stage of recovery.
Population characteristicsracial and ethnic comPositionWhile New Orleans had a majority African-American population for a period early in the 19th century, by 1950 the city’s population had long been over 50 percent White.14 Five decades later, New Orleans was 67 percent Black, 28 percent White, 2 percent Asian, and 2 percent other race. The city experienced the out-migration of a significant number of wealthy residents—largely (though not exclusively) White—that was typical of the suburban exodus from American cities, and an influx of rural African-Americans seeking opportunity. School desegregation, and housing and tax policy all played a role in these changes. At the same time, research on the net migration of African-Americans shows that New Orleans was the only major Southern city that continued to experience a net loss of African-Americans in the late 1990s, when other Southern cities were attracting Black migrants, particularly college graduates. (Louisiana was second only to New York—a much larger state—in outmigration of African-American college graduates during 1995–2000.)15 New Orleans was traditionally less residentially segregated than most American cities. In 2000, the average Black New Orleanian lived in a neighborhood that was 82 percent African-American.
13 BrookingsInstitutionandGreaterNewOrleansCommunityDataCenter, The New Orleans Index,January2009,p.18.14 U.S.CensusBureau15 WilliamH.Frey,“TheNewGreatMigration:BlackAmericans’ReturntotheSouth,1965-2000”,(Washington,DC:TheBrookingsInstitution,May
2004).
taBle 2.2: u.s. cities With PoPulations BetWeen 275,000 and 400,000, 2009
new orleans 351,568
MinneaPolis 377,392
raleigh 375,571
honolulu 375,571
st. louis 350,759
taMPa 336,823
CinCinnati 332,458
PittsBurgh 311,218
Source: uS cenSuS Bureau anD Gcr
Figure 2.4: racial comPosition oF the PoPulation oF neW orleans, 1960–2007
white alone Black alone asian alone other hispanic
Source: Gno community Data center analySiS of ValaSSiS reSiDential anD BuSineSS DataBaSe
* in 1960, the Census documented only “white” and “non-white” segments of the population. it was not until the 1990 Census that “asian” and other racial categories were included.

Volume 3 | chapter 2 | new orleans yesterDay anD toDay: population anD lanD use trenDs
2.10 | plan for the 21st century: new orleans 2030, aDopteD auGust 2010
Because Hispanics can be of any race, they are counted as an ethnic category rather than a racial category. According to the 2000 Census, 3.1 percent of New Orleans population was Hispanic or Latino. While the percentages have historically been small, New Orleans has long been home to tight knit, widely recognized communities of Asians (particularly Vietnamese) and Hispanics (particularly Central Americans). Hispanic migrant workers came to New Orleans after the storm to work in the construction industry, but because many are transient and undocumented, they are likely underrepresented in the Census Bureau surveys. Informal estimates by groups such as the Gulf Coast Latin American Association, which delivers social services to Latinos, suggested that there had been an influx of as many as 30,000 Latino workers to the metropolitan area immediately following Hurricane Katrina in 2005.16 Estimates from sample surveys conducted by the Louisiana Public Health Institute indicate that the proportion of Hispanics in the city’s population may have been as high as 9.6 percent in the summer of 2006.17
In the aftermath of Hurricane Katrina, population estimates indicate a moderate decline in the African-American percentage of the population. The Census Bureau estimated the city’s pre-Hurricane Katrina population as 68 percent African-American and 28 percent White. ESRI, a national demographics firm, estimated New Orleans in 2008 to be 64 percent African-American, 30 percent White and 5.5 percent other races.
age comPosition In the aftermath of Hurricane Katrina, there was much discussion about the potential loss of the city’s elderly population, due to the burden of evacuating, the loss of housing, and the damage to the region’s healthcare infrastructure. However, the elderly population appears to have grown slightly in proportion to the population as a whole. In 2005, the percentage of the city’s population estimated to be 65 years or older was 11 percent; it was estimated to be 13 percent in 2007.18 In fact, in comparison to some of its Southern and Midwestern counterparts, New Orleans is an “older” city with one of the highest percentages of citizens aged 65 and over, and one of the smallest percentages of residents aged 21 and under (24.6 percent).19
In contrast, a primary indicator of the school-age child population, public and private school enrollment, has not kept pace with the return of the general population. In October 2008, school enrollment was almost 25 percent below pre-Hurricane Katrina numbers.
16 “TheChangingFaceoftheGulfCoast:ImmigrationtoLouisiana,Mississippi,andAlabama”.MigrationPolicyInstitute,KatharineDonatoandShirinHakimzadeh.January2006.
17 “The2006LouisianaHealthandPopulationSurvey”.LouisianaPublicHealthInstitute.popest.org/popestla2006/18 Ibid.19 Ibid.
Figure 2.3: Percent oF Pre-hurricane Katrina households actively receiving mail and PuBlic & Private school enrollment For the 7-Parish msa, august, 2006–decemBer, 2008
Source: the new orleanS inDex, January 2009, p.9

Volume 3 | chapter 2 | new orleans yesterDay anD toDay: population anD lanD use trenDs
plan for the 21st century: new orleans 2030, aDopteD auGust 2010 | 2.11
Anecdotal reports suggest that New Orleans has experienced significant influx of new residents, particularly young professionals around the ages of 18–34. The Kaiser Family Foundation’s 2008 survey of New Orleans residents found that 10 percent of its respondents had come to New Orleans since Hurricane Katrina, which would account for over 30,000 persons. This means that most people who have returned to the city were living there before Hurricane Katrina, but a substantial number of people have made the choice to live in post-Hurricane Katrina New Orleans. While it should be noted that “young professionals” only comprise a subset of that particular age demographic, this age group has in fact grown slightly as a share of the city’s total population, from 26.5 percent in 2005 to 27.7 percent in 2007.20
household comPosition Nationally, since 1960 the number of households with children has been declining and the number of single-person households has been increasing. While 48 percent of U.S. households in 1960 included children under 18 and only 13 percent were single-person households, by 2000, only one-third of households included children and the percentage of single-person households had doubled to 26 percent.21 These trends are even more visible in cities, and New Orleans’ household composition is consistent with these trends. According to 2007 Census estimates, 55 percent of households in New Orleans were family households (made up of people related by blood or marriage), compared to 60 percent in 2000. Similarly, the percentage of all households in New Orleans with at least one child under 18 declined from 35 percent in 2000 to an estimated 24 percent in 2007. Nearly 38 percent of New Orleans households were single-person households in 2007, compared to 33 percent in 2000. The percentage of households headed by single women with their own children declined from 14 percent of all households in 2000 to an estimated 10 percent of all households in 2007.
school enrollmentPublic school enrollment in New Orleans peaked at approximately 110,000 students in 1970 and had declined by almost half, to approximately 60,000, by 2005, before Hurricane Katrina.22 In the year before Hurricane Katrina, with an overall population that was 67 percent African American, the city’s public schools were over 93 percent African American.23 By contrast, private school students in Orleans Parish were 45 percent African American in the same year. As of February, 2009, public school enrollment in New Orleans was 35,976 students. Ninety percent of public school students were African American, 5 percent White, 2 percent Hispanic, and 2 percent Asian. By contrast, private school enrollment for the 2008-2009 school year was 18,493 students, 58 percent of whom were White, 37 percent African American, 3 percent Hispanic, and 3 percent Asian.24
Since Hurricane Katrina, the landscape of education in New Orleans has changed dramatically. New Orleans public schools are currently administered by two school districts, the State-run Recovery School District (RSD) and the Orleans Parish School Board (OPSB)—the pre-Hurricane Katrina manager of most public schools. As of 2009, nearly half of the public schools in Orleans Parish were charter schools, some under the direction of the RSD and others overseen by the OPSB. Since the beginning of the first full, post-Hurricane Katrina school year beginning in the fall of 2006, the system has gained an additional 7,236 students; yet enrollment still stands at only 50 percent of the pre-storm figure of 66,372.25 Private school enrollment since Hurricane Katrina has regained pre-Hurricane Katrina levels of enrollment somewhat faster than that of public schools. 26,008 students were enrolled in private schools in the 2004-2005 school year, as compared to 18,493 (or 71 percent) in 2008-2009.26
20 U.S.CensusBureau21 U.S.CensusBureau22 A Blueprint: Building 21st Century Schools in New Orleans,SchoolFacilitiesMasterPlanforNewOrleans,August2008,p.23.23 U.S.CensusBureauandLouisianaDepartmentofEducation24 LouisianaDepartmentofEducation,asreportedintheNewOrleansIndex.BrookingsInstitutionandtheGreaterNewOrleansCommunityData
Center,August,2009.25 Ibid.26 LouisianaDepartmentofEducationandTrinityEpiscopalSchool,asreportedinTheNewOrleansIndex,August,2009.

Volume 3 | chapter 2 | new orleans yesterDay anD toDay: population anD lanD use trenDs
2.12 | plan for the 21st century: new orleans 2030, aDopteD auGust 2010
The socioeconomic composition of public school systems is measured primarily by the percentage of students eligible for the federal free and reduced price lunch program. In February 2009, 88 percent of the total public school student population in New Orleans.27 Comparable data for private school students is not available.
income ProFile Before Hurricane Katrina, median incomes in New Orleans had stabilized in comparison to the metropolitan area after having fallen for decades. According to 2007 Census Bureau estimates, at $45,902, the median family income in the City of New Orleans was 79 percent of the median family income of the New Orleans metropolitan area as a whole ($58,125). While median family income in New Orleans is substantially lower than the metropolitan median family income, this disparity has narrowed somewhat since 2005.
individuals and households in PovertyOf all 50 U.S. states, Louisiana in 2007 had the second highest percentage of persons living below the poverty line, a rank the state also held in 2000.28 An analysis of 2000 Census data also found that New Orleans ranked second among large U.S. cities in the rate of concentrated poverty—the percentage of all poor people in the city who lived in extreme-poverty neighborhoods (where more than 40 percent of residents live below the poverty line).29 Map 2.3 below shows the census tracts in New Orleans characterized by moderate to severe poverty in 2000. The 2000 Census found that 35 percent of African American residents in New Orleans had incomes below the poverty line while just over 11 percent of White residents in New Orleans were living in poverty.30 More recent estimates of the racial composition of the population in poverty are not available. Poverty rates across the board, including among the White population, are still very high relative to national standards.
Since Hurricane Katrina, rates of family poverty have declined in New Orleans, while poverty among individuals has increased. New Orleans has a higher family poverty rate than both the metropolitan area and Louisiana as a whole. However, the percentage of families in poverty has declined since Hurricane Katrina (from 21.8 percent in 2005 to 15.3 percent in 2007 compared to 10.5 percent of families in the metropolitan area and 14.6 percent of families in Louisiana as a whole,31 according to Census Bureau estimates).
27 www.gnocdc.org.NOLAIndexDataTables.xls,August2009.28 Ibid.29 AlanBerubeandBruceKatz,“HurricaneKatrina’sWindow:ConfrontingConcentratedPovertyAcrossAmerica,”(Washington,DC:TheBrookings
Institution,October2005),3.30 Ibid.31 Ibid.
taBle 2.3: household incomes By Percentage oF total PoPulation, 1999–2007
CitY of new orleans new orleans MetroPolitan area
1999 2005 2007 1999 2005 2007
$0 to $24,999 46.4% 43.3% 35.40% 36.1% 33.7% 25.70%
$25,000 to $49,999 27.5% 25.5% 25.00% 29.2% 26.1% 25.60%
$50,000 to $74,999 12.6% 12.4% 16.30% 17.0% 15.7% 18.10%
$75,000 to $99,000 5.7% 6.3% 9.20% 8.4% 10.0% 12.60%
$100,000 to $149,999 4.2% 7.0% 7.00% 5.8% 9.2% 10.80%
over $150,000 3.6% 5.5% 7.20% 3.5% 5.2% 7.20%
Source: u.S. cenSuS Bureau; 2005 anD 2007 eStimateS

Volume 3 | chapter 2 | new orleans yesterDay anD toDay: population anD lanD use trenDs
plan for the 21st century: new orleans 2030, aDopteD auGust 2010 | 2.13
Since Hurricane Katrina, there have been many changes in the composition of the impoverished population. In 2007, 31.8 percent of New Orleanians living in poverty were under 18 years old, down from 38 percent in 2005.32 The percentage of families in poverty that have children under 18 has also dropped from 32.8 percent in 2005 to 24.2 percent in 2007. The percentage of families in poverty that have very young children (defined as under the age of 5) has also declined from 29.5 percent in 2005 down to 13.4 percent in 2007.33 The city has also witnessed a significant decline in poverty among its senior population. The elderly—defined as those over the age of 65—represent 11.4 percent of individuals in poverty, down from 16.5 percent in 2005.34
In light of these changes in the profile of the impoverished population from 2005 to 2007, there has been an increase in the percentage of adult individuals in the city’s impoverished population. In 2007, non-related individuals over 15 years of age accounted for 30 percent of the impoverished population, up from 25 percent in 2005.35 Anecdotal evidence suggests this increase is in part attributable to the arrival of migrant workers who came to New Orleans in search of rebuilding and construction work. The fact that many of these migrant workers may be undocumented residents implies that the number of poor adults may be even higher. Whether from the region or some other part of the world, this population has become increasingly visible to the population at large in the increasing homeless population. According to UNITY of New Orleans, a social service provider for the homeless, the homeless population in March of 2008 was estimated to be 12,000, or almost 1 in every 25 residents of the city.36
32 U.S.CensusBureau33 Ibid.34 Ibid.35 Ibid.36 “NewOrleans’HomelessRateSwellsto1in25”;Jervis,Rick,USA Today,March17,2008
maP 2.3: rate oF Poverty By census tract, census 2000
0 0.75 1.5 2.25 3Miles
LEGEND
Planning Districts 10 & 11
§̈¦510
§̈¦10
90
6 1 0
§̈¦610
Non-Poverty Census Tracts(<20%)
Moderate Poverty Census Tracts (20% - 30%)
High Poverty Census Tracts (30% - 40%)
Extreme Poverty Census Tracts (>40%)
§̈¦10
Sources: City of New Orleans, U.S. Census Bureau
¯
§̈¦510
§̈¦10
Mississippi River
Lake Pontchartrain
leGenDNon-Poverty Census Tracts (<20%)
Moderate Poverty Cesus Tracts (20%—30%)
High Poverty Census Tracts (30%—40%)
Extreme Poverty Census Tracts (>40%)
Volume 3 | chapter 2 | new orleans yesterDay anD toDay: population anD lanD use trenDs
2.14 | plan for the 21st century: new orleans 2030, aDopteD auGust 2010
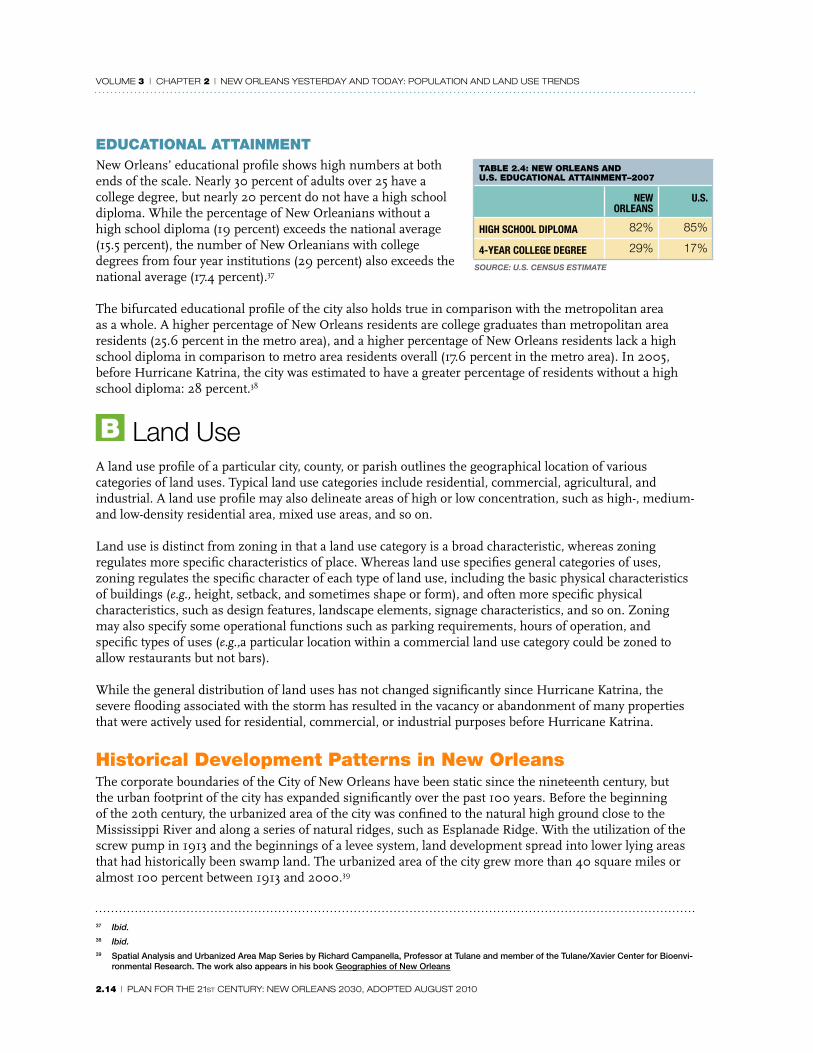
educational attainmentNew Orleans’ educational profile shows high numbers at both ends of the scale. Nearly 30 percent of adults over 25 have a college degree, but nearly 20 percent do not have a high school diploma. While the percentage of New Orleanians without a high school diploma (19 percent) exceeds the national average (15.5 percent), the number of New Orleanians with college degrees from four year institutions (29 percent) also exceeds the national average (17.4 percent).37 The bifurcated educational profile of the city also holds true in comparison with the metropolitan area as a whole. A higher percentage of New Orleans residents are college graduates than metropolitan area residents (25.6 percent in the metro area), and a higher percentage of New Orleans residents lack a high school diploma in comparison to metro area residents overall (17.6 percent in the metro area). In 2005, before Hurricane Katrina, the city was estimated to have a greater percentage of residents without a high school diploma: 28 percent.38
B Land UseA land use profile of a particular city, county, or parish outlines the geographical location of various categories of land uses. Typical land use categories include residential, commercial, agricultural, and industrial. A land use profile may also delineate areas of high or low concentration, such as high-, medium- and low-density residential area, mixed use areas, and so on.
Land use is distinct from zoning in that a land use category is a broad characteristic, whereas zoning regulates more specific characteristics of place. Whereas land use specifies general categories of uses, zoning regulates the specific character of each type of land use, including the basic physical characteristics of buildings (e.g., height, setback, and sometimes shape or form), and often more specific physical characteristics, such as design features, landscape elements, signage characteristics, and so on. Zoning may also specify some operational functions such as parking requirements, hours of operation, and specific types of uses (e.g.,a particular location within a commercial land use category could be zoned to allow restaurants but not bars).
While the general distribution of land uses has not changed significantly since Hurricane Katrina, the severe flooding associated with the storm has resulted in the vacancy or abandonment of many properties that were actively used for residential, commercial, or industrial purposes before Hurricane Katrina.
historical development Patterns in new orleansThe corporate boundaries of the City of New Orleans have been static since the nineteenth century, but the urban footprint of the city has expanded significantly over the past 100 years. Before the beginning of the 20th century, the urbanized area of the city was confined to the natural high ground close to the Mississippi River and along a series of natural ridges, such as Esplanade Ridge. With the utilization of the screw pump in 1913 and the beginnings of a levee system, land development spread into lower lying areas that had historically been swamp land. The urbanized area of the city grew more than 40 square miles or almost 100 percent between 1913 and 2000.39
37 Ibid.38 Ibid.39 SpatialAnalysisandUrbanizedAreaMapSeriesbyRichardCampanella,ProfessoratTulaneandmemberoftheTulane/XavierCenterforBioenvi-
ronmentalResearch.TheworkalsoappearsinhisbookGeographiesofNewOrleans
taBle 2.4: neW orleans and u.s. educational attainment–2007
new orleans
u.s.
high sChool diPloMa 82% 85%
4-Year College degree 29% 17%
Source: u.S. cenSuS eStimate
Volume 3 | chapter 2 | new orleans yesterDay anD toDay: population anD lanD use trenDs
plan for the 21st century: new orleans 2030, aDopteD auGust 2010 | 2.15
Rapid expansion into wetland areas was underway in New Orleans well before the 1940s. Pre-war neighborhoods such as Broadmoor and Mid-City were made possible by the draining of low lying areas. The pattern of developing previously undevelopable wetlands continued unabated for several decades after World War II, as neighborhoods like Gentilly and Lakeview supplied homes to baby boomer families. Unlike many older, established cities with fixed boundaries, New Orleans had ample new land for post-war development. In fact, the large amount of previously undevelopable land permitted suburban expansion well beyond the immediate post-war period. New Orleans East and much of the west bank Algiers area were developed in the 1960s, 1970s, and even well into the 1980s. From 1939 to 1990, the city’s urbanized footprint grew from approximately 42 square miles to approximately 71.25 square miles, a 70 percent increase.40 As a result, New Orleans has numerous neighborhoods whose density, architectural profile, and overall aesthetic would not be out of place in many suburban locations. At the same time that newer neighborhoods were gaining wealth, population, and new investment, many of the city’s older neighborhoods were experiencing disinvestment. The new, “suburb within a city” phenomenon that New Orleans experienced helped to stave off the kind of especially severe erosion of its population and economic base that plagued other cities during the same period.
The geographical extent of urbanized land in New Orleans has been relatively constant since the mid-1980s, with notable exceptions such as the English Turn subdivision in the Lower Coast of Algiers and the Eastover and McKendall Estates subdivisions in New Orleans East. The pace of new, “greenfield” development—development on previously undeveloped land—slowed considerably because of the relative paucity of large tracts of developable land left within the city limits, the downturn in the regional economy as a result of the oil bust of the mid-1980s, and continued concerns about quality of life issues such as crime and public education.
While New Orleans witnessed very little new, suburban-style development within its boundaries in the 1990s, the city began to see the kind of urban-focused new investment found in cities throughout the country: small scale reinvestment within the city’s established neighborhoods and larger “infill” projects within and around the Central Business District (CBD). Changes in the city’s land use profile in the years leading up to Hurricane Katrina were relatively minor. The urban core—particularly in the Warehouse District and Central Business District—witnessed a continued, steady trend of adaptive re-use and limited infill development. The only other major change in the intervening years was the continued demolition and redevelopment of New Orleans’ public housing developments, a process that began in the early 1990s.
Since Hurricane Katrina, because of the degree of flooding and the myriad impediments to recovery, many structures remain vacant; many others have been demolished and replaced by vacant lots. Not coincidentally, the neighborhoods that are grappling with the blight wrought by Hurricane Katrina are for the most part those whose development was made possible by the wetland drainage and the levee protection system. When the levees and floodwalls failed in August 2005, these lower lying areas bore the brunt of the flooding. Within these severely impacted neighborhoods, therefore, the major change in their land use profile has been the exponential increase in the amount of vacant and underutilized property.
40 SpatialAnalysisandUrbanizedAreaMapSeriesbyRichardCampanella,ProfessoratTulaneandmemberoftheTulane/XavierCenterforBioenvi-ronmentalResearch.TheworkalsoappearsinhisbookGeographiesofNewOrleans

Volume 3 | chapter 2 | new orleans yesterDay anD toDay: population anD lanD use trenDs
2.16 | plan for the 21st century: new orleans 2030, aDopteD auGust 2010
Figure 2.4: neW orleans, 1700–2000: morPhology oF urBan groWth
uSeD By permiSSion.
Yellow indicates general extent of urbanized area, according to historical maps from selected years. interpretation and graphic by r. Campanella.
Volume 3 | chapter 2 | new orleans yesterDay anD toDay: population anD lanD use trenDs
plan for the 21st century: new orleans 2030, aDopteD auGust 2010 | 2.17
residential uses residential uses and characterResidential uses account for approximately 25 percent of the total land area of the city.41 Of 215,091 housing units counted in the 2000 Census, 57 percent were single family homes, 23 percent were in two to four unit structures, and 29 percent were in structures of five units or more.42 Both the vintage and the typology of the city’s housing stock are extremely diverse, largely as a result of the fact that New Orleans witnessed a steady pace of development from the 18th century through the 1980s. Thirty percent of housing units were built before 1940, but fully 40 percent of the residential units were built after 1960.43
The residential character of neighborhoods built before 1940 is distinct from the post-World War II suburban-style development. The predominant residential character of the city’s pre-World War II historic neighborhoods is a mixture of low-rise single family, two-family, and small multifamily (generally no more than 5 unit) structures. In contrast, the single family house, often (but not always) a one-story-slab on grade-home, predominates in post-war neighborhoods such as Lakeview, Gentilly, New Orleans East, and much of Algiers. In the city’s postwar neighborhoods, there is little of the intermediate density, interspersing of residential types, and residential uses on upper floors with commercial use on the ground floor, found in the historic core. Instead, residential density in Algiers, New Orleans East, and, to a lesser extent, Gentilly, tends to be either single family detached or large-scale multifamily development. In the neighborhoods where they are found, these two building types also are usually physically separated, whether by fencing, a major roadway, or some other impediment such as a drainage canal.
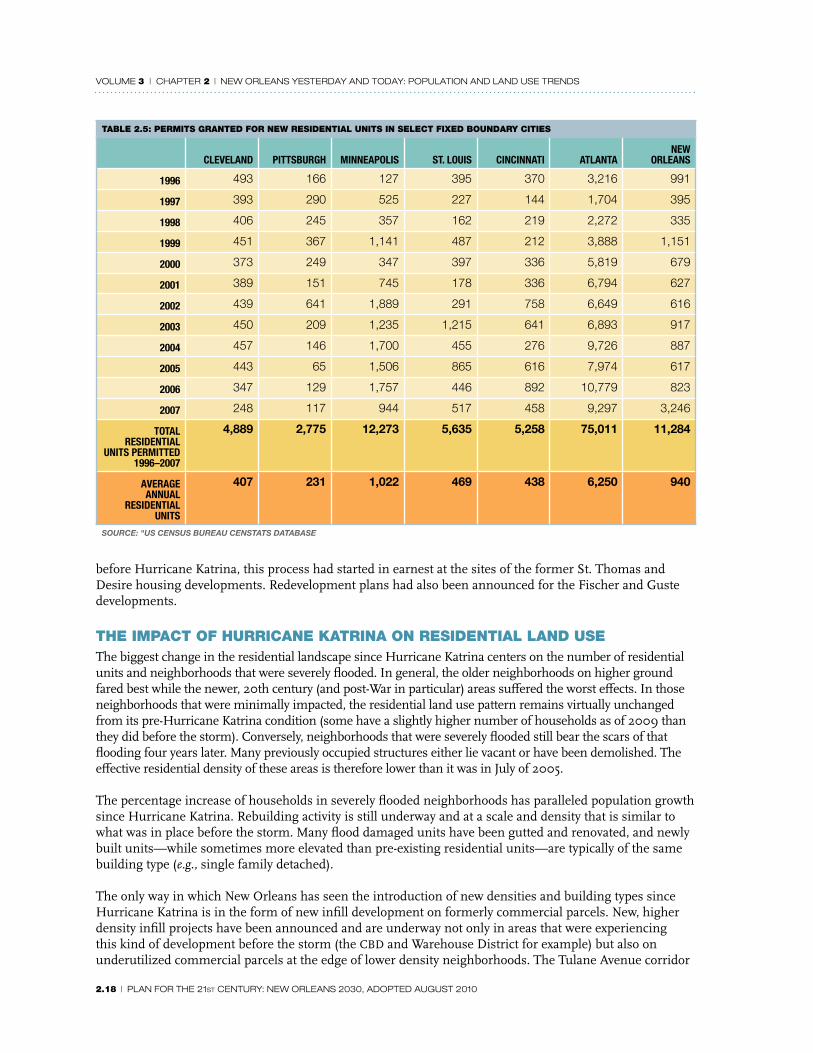
residential develoPment 1990–2005In 2004, the last full year before the Hurricane, the city issued permits for the construction of 887 new residential units. This total was somewhat higher than what the city had witnessed in the preceding 10 years when New Orleans averaged 598 permitted new units annually.44 New building activity in New Orleans was substantially below the level of construction seen in booming urban residential markets such as Miami, Atlanta, and Seattle, though it was somewhat stronger than the totals seen in slower growth cities. Table 3.6 provides building permit totals over several years for New Orleans and other cities that, like New Orleans, have fixed boundaries and a limited amount of developable land.
During this period, a few new greenfield subdivisions (subdivisions on previously undeveloped or agricultural land) were built at the city’s urban edge, such as English Turn in Algiers and the newer phases of the Eastover development in New Orleans East. There was also the steady march of small scale home renovations and infill construction in many of New Orleans’ historic neighborhoods, such as Old Algiers and the Irish Channel. Finally, there was also an increasing number of new infill and adaptive re-use projects at a larger, multiunit scale, particularly in the Warehouse District neighborhood.
The single biggest change in residential land use that New Orleans witnessed prior to Hurricane Katrina was the redevelopment of its major public housing complexes. As of 1997, before large scale, coordinated demolition and redevelopment had begun, the Housing Authority of New Orleans (HANO) managed a total of 12,935 public housing units, approximately 6 percent of the city’s total housing stock. From the standpoint of total units and residents, HANO was the 10th largest urban public housing authority in the country, despite the fact that New Orleans was only the 31st largest city in the country.45 Following the precedent set by other public housing agencies around the country, HANO’s goal was to create less dense developments that provided housing options at a range of income levels. In the two to three years
41 NewOrleansCityPlanningCommission42 U.S.CensusBureau43 Ibid.44 U.S.CensusBureau,Censtatsdatabase45 U.S.DepartmentofHousingandUrbanDevelopment(HUD)“1997PictureofSubsidizedHouseholds”
www.huduser.org.PopulationandhousingunitdatafromU.S.CensusBureau,2000Census.
Volume 3 | chapter 2 | new orleans yesterDay anD toDay: population anD lanD use trenDs
2.18 | plan for the 21st century: new orleans 2030, aDopteD auGust 2010
before Hurricane Katrina, this process had started in earnest at the sites of the former St. Thomas and Desire housing developments. Redevelopment plans had also been announced for the Fischer and Guste developments.
the imPact oF hurricane Katrina on residential land useThe biggest change in the residential landscape since Hurricane Katrina centers on the number of residential units and neighborhoods that were severely flooded. In general, the older neighborhoods on higher ground fared best while the newer, 20th century (and post-War in particular) areas suffered the worst effects. In those neighborhoods that were minimally impacted, the residential land use pattern remains virtually unchanged from its pre-Hurricane Katrina condition (some have a slightly higher number of households as of 2009 than they did before the storm). Conversely, neighborhoods that were severely flooded still bear the scars of that flooding four years later. Many previously occupied structures either lie vacant or have been demolished. The effective residential density of these areas is therefore lower than it was in July of 2005.
The percentage increase of households in severely flooded neighborhoods has paralleled population growth since Hurricane Katrina. Rebuilding activity is still underway and at a scale and density that is similar to what was in place before the storm. Many flood damaged units have been gutted and renovated, and newly built units—while sometimes more elevated than pre-existing residential units—are typically of the same building type (e.g., single family detached).
The only way in which New Orleans has seen the introduction of new densities and building types since Hurricane Katrina is in the form of new infill development on formerly commercial parcels. New, higher density infill projects have been announced and are underway not only in areas that were experiencing this kind of development before the storm (the CBD and Warehouse District for example) but also on underutilized commercial parcels at the edge of lower density neighborhoods. The Tulane Avenue corridor
taBle 2.5: Permits granted For neW residential units in select Fixed Boundary cities
Cleveland PittsBurgh MinneaPolis st. louis CinCinnati atlanta
new orleans
1996 493 166 127 395 370 3,216 991
1997 393 290 525 227 144 1,704 395
1998 406 245 357 162 219 2,272 335
1999 451 367 1,141 487 212 3,888 1,151
2000 373 249 347 397 336 5,819 679
2001 389 151 745 178 336 6,794 627
2002 439 641 1,889 291 758 6,649 616
2003 450 209 1,235 1,215 641 6,893 917
2004 457 146 1,700 455 276 9,726 887
2005 443 65 1,506 865 616 7,974 617
2006 347 129 1,757 446 892 10,779 823
2007 248 117 944 517 458 9,297 3,246
total residential
units PerMitted 1996–2007
4,889 2,775 12,273 5,635 5,258 75,011 11,284
average annual
residential units
407 231 1,022 469 438 6,250 940
Source: "uS cenSuS Bureau cenStatS DataBaSe
Volume 3 | chapter 2 | new orleans yesterDay anD toDay: population anD lanD use trenDs
plan for the 21st century: new orleans 2030, aDopteD auGust 2010 | 2.19
in Mid-City in particular has seen a flurry of multifamily development. A number of multifamily infill projects have also been announced in formerly commercial areas of the Bywater neighborhood. Virtually none of these infill projects is on land that was previously lower density residential in use.
commercial usesretail Since before Hurricane Katrina, the key issue with respect to retail land use in New Orleans has not been the location or amount of land designated for retail use, but whether active retail uses occupy the land. While approximately 4 percent of the city’s land area was in commercial use prior to Hurricane Katrina,46 a number of vacant or partially vacant malls, strip shopping centers, and neighborhood-oriented commercial corridors were included in that tally. Since Hurricane Katrina, the acreage in active retail use is even lower. As of late 2009, the city is home to only four movie screens, a single department store, and only about half of the grocery stores that it had before Hurricane Katrina.47 New Orleans also lacks the variety of major clothing, electronics, appliance, sporting goods, toy, and book stores that can be found in suburban parishes. In fall 2007, suburban Jefferson Parish had an estimated 10.5 million square feet of retail space for its 446,686 residents, while New Orleans had only 2.0 million square feet of retail—a quarter of the per capita retail space of Jefferson.48 This lack of retail uses presents not only an inconvenience to residents but a loss of potential tax revenue for the City.
Reflecting the diversity of its neighborhoods, retail land use in New Orleans has traditionally taken a variety of forms, ranging from small-scale, neighborhood oriented commercial uses to newer big box development. Since the sudden decline of the region’s oil and gas sector in the late 1980s, New Orleans has experienced a considerable overall loss of retail activity, especially national chain retail.
• Canal Street: Still viable in the mid-1980s with five major department stores (locally owned), specialty retail and national chains, most mid-priced and high-end retail has been replaced by tourist-oriented and value (low-priced) retail.
• Shopping Malls: New Orleans Centre, near the Superdome; Lake Forest Plaza in New Orleans East; Uptown Square near Audubon Park—all had high vacancy rates before Hurricane Katrina in 2005. Malls doing well were Canal Place, Riverwalk Mall (tourist-oriented) and neighborhood strip malls in the lake neighborhoods, Gentilly, and Uptown. Retail in New Orleans East and Algiers was viable with notable losses of supermarkets, electronics and furniture stores.
• “Big box” stores: Before Hurricane Katrina, “big box” stores included three Wal-Marts—in New Orleans East along I-10, in a supercenter that was built as part of the redevelopment of the former St. Thomas public housing development, and in a supercenter built on a greenfield site along Behrman Highway in Algiers. There was also a Lowe’s in Gentilly and, in New Orleans East, a Sam’s, Home Depot, Sears, and Campo stores.
• Neighborhood and boutique retail: Historic districts with mixed-use streets, such as Magazine Street, have small scale, neighborhood-oriented and boutique retail, service and entertainment businesses.
46 NewOrleansCityPlanningCommission.47 InventoryconductedbyGCR&Associates48 “2008MetropolitanNewOrleansRealEstateMarketAnalysis”publishedbytheUNOInstituteforEconomicDevelopment&RealEstateResearch.
FiguresareestimatedforFall2007.JeffersonpopulationestimatefromESRI.

Volume 3 | chapter 2 | new orleans yesterDay anD toDay: population anD lanD use trenDs
2.20 | plan for the 21st century: new orleans 2030, aDopteD auGust 2010
the imPact oF hurricane Katrina on retail land usesAs with residential land use patterns, the impact of Hurricane Katrina upon the retail landscape has been mixed, reflecting both pre-existing conditions and the extent of flooding. The Magazine Street corridor continues to be vibrant. Two of the three Wal-Mart superstores (in the Lower Garden District and Algiers) have reopened. Canal Place shopping mall enjoys high occupancy rates. Stores in the French Quarter are doing reasonably well. At the same time, New Orleans has seen a major loss of neighborhood-serving retail in areas particularly affected by the storm, especially in the Gentilly and New Orleans East areas. The problem is especially acute in New Orleans East where a single grocery store serves an estimated population (as of July 2008) of over 58,000 residents within a roughly 3-mile radius.49
While neighborhood serving retail is particularly scarce in New Orleans East, the loss of full service grocery stores since the storm has affected many more neighborhoods. A number of heavily flooded and even non-flooded neighborhoods, such as the Upper 9th Ward, Central City, and Bywater, remain isolated from full service groceries. A number of major retail proposals have been announced since Hurricane Katrina including a mixed-use “Renaissance Town Center” at the former Lake Forest Plaza in New Orleans East, with a Lowe’s center the only completed element so far. Proposals for Mid-City and Carrollton have been encountered neighborhood concerns and a difficult economic climate.
oFFice usesBecause office uses in New Orleans have continued to cluster in the downtown area, which experienced little flooding, the recovery of office space has been rapid, aiding the economic recovery of the city. The best inventory of local office space comes from the UNO Real Estate Market Data Center, which estimates that the city in 2008 had 7.8 million square feet of Class A office space or 90.2 percent of its pre-Hurricane Katrina total.50 This compares very favorably with downtown’s pre-Hurricane Katrina (2005) occupancy rate of 85.9 percent.51 The volume of relatively affordable Class A office space in downtown New Orleans, much of it built during the 1970s and 1980s, is a principal reason why the CBD remains an attractive place for companies to locate.
Two major structures, the Dominion Tower at 1450 Poydras (adjacent to the Superdome) and 225 Baronne Street remain closed as a result of storm damage. Dominion Tower, owned by the owner of the New Orleans Saints, will be rented by the State for use as office space, according to an August, 2009 arrangement to keep the Saints team in Louisiana. 225 Barrone Street may be converted into residential apartments. In addition, Chevron Corporation relocated its regional headquarters to a suburban office park location in St. Tammany Parish leaving their recently vacated, 378,895 square foot office building downtown without a successor tenant.
No real estate project announced since Hurricane Katrina has included a major office component in spite of consistently high occupancy rates in existing office space. Meanwhile, much of the older Class B and C office space in downtown New Orleans has been adapted to non-office uses over the past fifteen years. Many of these buildings have been converted into hotels, and some have been converted to multifamily residential uses. Both before and since Hurricane Katrina, few major nodes of office activity in the city exist outside of the CBD:
• The Canal Street corridor from Claiborne Avenue to City Park Avenue has traditionally been home to a mixture of older (1950s and 1960s) mid-rise office buildings as well as low rise residential buildings that have been converted to office use. Despite moderate to substantial flooding along the corridor and a number of vacancies, many of these office spaces have been reoccupied.
• The UNO Research and Technology Park, adjacent to the UNO campus, is home to approximately
49 PopulationestimatefromGCR&Associates50 “2008MetropolitanNewOrleansRealEstateMarketAnalysis”publishedbytheUNOInstituteforEconomicDevelopment&RealEstateResearch.
FiguresareestimatedforFall2007.51 “2008MetropolitanNewOrleansRealEstateMarketAnalysis”publishedbytheUNOInstituteforEconomicDevelopment&RealEstateResearch.
FiguresareestimatedforFall2007.

Volume 3 | chapter 2 | new orleans yesterDay anD toDay: population anD lanD use trenDs
plan for the 21st century: new orleans 2030, aDopteD auGust 2010 | 2.21
600,000 square feet of Class A offices that house a combination of government, university, and private employers.52 While occupancy was temporarily disrupted after Hurricane Katrina, as of late 2009 the office park was in full use.
• The General de Gaulle corridor in Algiers includes a number of office buildings in office park settings. One of these office parks, Westpark, was occupied prior to Hurricane Gustav in September of 2008 but sustained wind damage as a result of Gustav and has not yet been restored. Another office park at General de Gaulle and West Bend Parkway contains offices that have recovered as well as two entire buildings that have not been reoccupied since Hurricane Katrina.
• In New Orleans East, some of the limited amount of office space that existed before Hurricane Katrina has been reoccupied. New Orleans East’s pre-Hurricane Katrina office inventory included the Executive Plaza building at 10001 Lake Forest Boulevard and the Deer Park Business Park, also on Lake Forest Boulevard. The former building remains closed while Deer Park is partially occupied.
• Throughout the remainder of the city, office uses generally take the form of low rise, small scale structures. The recovery of these buildings generally parallels the recovery status of the neighborhoods in which they are located.
A final noteworthy development in the local office market is the loss of medical offices since Hurricane Katrina. The post-storm status of private medical office buildings generally tracks the recovery status of adjacent anchor medical facilities. A limited number of private medical offices have reopened in the medical office building at 5640 Read Boulevard adjacent to the shuttered Methodist Hospital in New Orleans East, but the majority of medical office space in the vicinity of Methodist remains closed. Virtually all of the private medical offices within and adjacent to the shuttered Lindy Boggs Hospital in Mid-City and the Lakeland Medical Pavilion in New Orleans East also remain closed. One medical facility that did suffer severe flooding but has been restored is the Ochsner Baptist Hospital (formerly Tenet) in the Broadmoor neighborhood. As core hospital facilities and functions are slowly being brought back on line, private medical offices within and around the Ochsner complex have been restored.
mixed use developmentThe term “mixed use” is used to describe structures that contain more than one land use type (sometimes called “vertical” mixed use) and districts where a variety of land uses coexist side by side (“horizontal” mixed use). The 1999 Land Use map did not show a category for mixed-use areas, but field observation indicates that much of the land located in the pre-1940 city that is classified as “commercial” is in fact mixed use, with ground floor retail, office, or entertainment uses and upper floor residential use. The Magazine Street corridor, the French Quarter, Faubourg Marigny, Bywater, Old Algiers, and other historic neighborhoods are notable for the combination of residential and commercial uses within many of their historic buildings. Because mixed use areas are primarily located within older neighborhoods on higher ground, the mixed use inventory in the city was not substantially affected by Hurricane Katrina’s floodwaters.
Many recent residential infill projects in New Orleans (mostly located in the Warehouse District), have included a ground floor commercial component. However, residential and daytime populations remain too limited to support robust retail or service uses. In addition, many ground floors are devoted to parking instead of commercial uses because of the perceived demand for on-site parking, and the infeasibility of building underground parking in New Orleans.
52 CorrespondencewithNormaGrace,Vice-ChancellorofTechnologyandEconomicDevelopment,UniversityofNewOrleans

Volume 3 | chapter 2 | new orleans yesterDay anD toDay: population anD lanD use trenDs
2.22 | plan for the 21st century: new orleans 2030, aDopteD auGust 2010
industrial uses Despite its history as a major urban center during the era of urban manufacturing, New Orleans never had the large industrial footprint of other established American cities. Approximately 8 percent of the city’s land area was active or vacant industrial land use category.53 In the years and even decades before Hurricane Katrina, there was very little growth in industrial uses within the city.
The major nodes for industrial land use are in a select few locations:
• The Earhart Boulevard corridor is currently home to a number of small manufacturers and warehouses, such as Universal Furniture and Comeaux Furniture, as well as the headquarters and printing press of the New Orleans Times Picayune newspaper. The Earhart corridor has seen the closure of a number of key industrial facilities including the relocation of the regional Coca-Cola bottling plant to Jefferson Parish in 1996 and the closure of the Blue Plate Mayonnaise factory shortly thereafter.
• The Tchoupitoulas Street corridor still includes some storage and ancillary industrial functions, though most of this land area is devoted to the Port of New Orleans. There are few, if any, “value added” industrial uses adjacent to the Port, such as manufacturing facilities or major distribution centers. Much of the underutilized Port property along the River between Jackson Avenue and the Industrial Canal is slated to be transformed into a network of riverfront parks, as outlined in the 2005 Riverfront plan and the 2007 “Reinventing the Crescent” plan.
• The Industrial Canal, separating the historic core of the city from New Orleans East and the Lower 9th Ward, has been a traditional locus for maritime-oriented industrial activity. The planned closure of the Mississippi River Gulf Outlet (MRGO), the longstanding bottleneck at the narrow lock connecting the Canal to the River, and significant damage to port facilities as a result of Hurricane Katrina have clouded the future of the Industrial Canal corridor. Despite damage from Hurricane Katrina and the aforementioned concerns, a number of industrial activities continue to operate along the Canal, including Trinity Yachts, the Bunny Bread bakery, a major UPS distribution facility, and the Luzianne coffee and tea plant.
• The New Orleans Regional Business Park (NORBP), located between Chef Menteur Highway and the Intracoastal Waterway in New Orleans East, is home to two of the region’s largest industrial facilities: NASA’s Michoud assembly plant and the Folgers Coffee Roasting plant. Both facilities, which together employ an estimated 4,400 people,54 escaped relatively unscathed from Hurricane Katrina. The two facilities are also two of the only major tenants within the approximately 7,000 acres that are zoned for industrial use within NORBP.55 NORBP has never fully realized its potential in spite of ample industrial land and convenient access to water, rail, and truck transportation infrastructure.
• The Press Street corridor, which extends from the riverfront, separating the Marigny and Bywater neighborhoods, north to Almonaster Avenue, is an industrial corridor surrounding freight rail lines. Some historic industrial structures along the southern portion of this corridor (towards the river) have been rehabilitated and converted into non-industrial uses—including arts and educational facilities—in recent years.
• In addition to these major industrial nodes, a number of other industrial facilities are interspersed throughout non-industrial neighborhoods. Two of the more notable industrial uses are the Brown’s Velvet Dairy, which was largely unaffected by Hurricane Katrina, and the Dixie Brewery, which was badly flooded and looted and has been shuttered indefinitely.
53 NewOrleansCityPlanningCommission.54 NewOrleansTimes-Picayune,February2,2008;“P&GplanstospinoffFolgerscoffee;440employedinN.O.operation”byJenDeGregorio&and
TheAdvocate,January10,2008;“JonestorunMichoudfacility”byJoeGyan.55 NewOrleansRegionalBusinessParkwebsitewww.norbp.net.

Volume 3 | chapter 2 | new orleans yesterDay anD toDay: population anD lanD use trenDs
plan for the 21st century: new orleans 2030, aDopteD auGust 2010 | 2.23
undeveloped land, recreation areas and WetlandsBefore Hurricane Katrina, approximately 60 percent of the City’s land area was in the categories of “Parkland/Recreation/Open Space” and “Non-urban/Wetland/Undeveloped” areas.56 Much of this land lies in New Orleans East, east of Interstate 510, and in the Lower Coast of Algiers. Approximately 23,000 acres lie within the Bayou Sauvage National Wildlife Refuge, a federal nature preserve that was established in 1990. Between 1999 and 2005, several new residential subdivisions were developed in New Orleans East to the east of Bullard Avenue and south of Lake Forest Boulevard; new automobile dealerships were constructed along the Interstate 10 Service Road immediately to the west of I-510; and the Six Flags amusement park was built just east of I-510. All of these areas flooded during Hurricane Katrina. In August, 2009, plans were announced to redevelop the Six Flags site as a theme park scheduled to open in 2010. Permitting in wetland areas, market demand, and the risk of storm surge flooding (as underscored by Hurricane Katrina) are obstacles to the development of many of these parcels. The undeveloped land in both Algiers and the Lower Coast of Algiers is somewhat qualitatively different from that in New Orleans East. Nevertheless, much of it is low lying; and according to surge models, much of it would be inundated if a major storm with a more westerly track than Hurricane Katrina’s were to strike the city.
institutional, Public, and semi-public uses An estimated 3 percent of the city’s physical area is classified as “Institutional, Public and Semi-Public” use.57 This classification consists of a wide variety of uses including public and private schools, municipal facilities such as court buildings and administrative complexes, hospitals, military installations, cemeteries, religious facilities, and colleges and universities.
There was very little change in the quality and quantity of land in this category between the most recent analysis of land use conducted by the CPC in 1999 and the immediate, pre-storm period in the summer of 2005. Immediately before Hurricane Katrina the federal Defense Base Closure and Realignment Commission (BRAC) announced that the two major military facilities in New Orleans—the Naval Support Activity (NSA) base in Bywater and the Naval Support Activity base in Algiers—would be decommissioned. As a result of an ambitious, forward thinking plan and aggressive advocacy, BRAC subsequently modified their position and endorsed the concept of a consolidated “Federal City” at the NSA Algiers site. BRAC maintained their position that the Bywater NSA facility should be closed but supported the idea that numerous military and affiliated civilian activities could be combined at the present NSA site between General Meyer Avenue and the Mississippi River on the West Bank. When Federal City is completed, it will be home to thousands of military and non-military jobs and substantial supporting retail and residential development. While portions of the site will be accessible only with security clearance, much of the site as envisioned will interface with the surrounding residential neighborhoods.
The Justice Facilities Master Plan proposed redevelopment of the Criminal Justice complex located at Tulane Avenue and Broad Street into a campus divided into three zones: Police, Courts and Sheriff. The plan includes 12 prison facilities and several administrative buildings, and recommends use of existing facilities as well as new facilities to consolidate compatible uses. Funding for many of these projects is still unsure. A proposal for a new judicial center which would consolidate criminal, civil and municipal courts on a site adjacent to the existing district court building at Tulane and Broad has encountered resistance by the legal community and other downtown interests, who favor keeping all court activities downtown. A new law enforcement center, which will also house the city’s fire department and emergency preparedness agency, is planned to replace the New Orleans Police Department headquarters.
The only other major announcement prior to Hurricane Katrina relative to institutional land use was Tulane University’s plan to develop a satellite campus at the site of the former Uptown Square Mall. While the initial proposal was met with substantial community opposition, a compromise site plan was eventually
56 NewOrleansCityPlanningCommission.57 NewOrleansCityPlanningCommission.

Volume 3 | chapter 2 | new orleans yesterDay anD toDay: population anD lanD use trenDs
2.24 | plan for the 21st century: new orleans 2030, aDopteD auGust 2010
developed and subsequently approved. However, that proposal has been put on hold indefinitely since Hurricane Katrina.
A number of other major changes to the city’s inventory of institutional land have occurred since the storm. The School Facilities Master Plan has identified school board property for adaptive reuse or decommissioning. Five major hospital facilities remain closed: • Medical Center of Louisiana New Orleans (MCLNO or “Charity Hospital”)
• Veterans Administration (VA) Hospital
• Lindy Boggs Medical Center
• The two campuses of Methodist Hospital in New Orleans East
As this Master Plan is being completed, the mayor has raised the issue of the need to renovate the current City Hall or find a replacement facility. Whether City Hall is ultimately renovated or moved, planning for an updated City Hall will offer New Orleans the opportunity to create a new civic center, and make an important contribution to downtown’s vitality.
vacant land: challenges and opportunitiesSince Hurricane Katrina, there has been no comprehensive field survey of vacant lots and unoccupied structures in the city. An analysis of HUD-aggregated USPS data conducted by the Greater New Orleans Community Data Center in 2009 estimated that the city had approximately 59,000 vacant residential addresses on vacant or blighted lots. Before Hurricane Katrina, New Orleans already had a substantial number of blighted properties. According to the 2000 Census, 26,000 (12.6 percent) of the city’s housing units were vacant, including vacation rentals, units for sale or rent, and other non-blighted units. Nationwide, the housing vacancy rate was only 11.6 percent while the vacancy rate for the metro area as a whole stood at 9.1 percent. Map 2.4 illustrates the concentration of residential vacancy by Census block in 2000.
Another way of looking at the current inventory of vacant and blighted property is to examine the location of unoccupied parcels through an even sharper lens. By comparing those utility accounts that were active in July of 2005 with currently active utility accounts, one can isolate the addresses and parcels that are currently unoccupied. (See Map 2.5.) The volume and the dispersed geographical location of these vacant properties present a number of pressing land use challenges.

Volume 3 | chapter 2 | new orleans yesterDay anD toDay: population anD lanD use trenDs
plan for the 21st century: new orleans 2030, aDopteD auGust 2010 | 2.25
Source: u.S. cenSuS 2000
residential lots that became vacant or that contain vacant units between July, 2005 and august, 2008, based on utility account data.
maP 2.4: Percentage oF housing units vacant, 2000
maP 2.5: vacant residential units, c. august, 2008
0 0.75 1.5 2.25 3Miles
LEGEND
Planning Districts 10 & 11
§̈¦510
§̈¦10
90
6 1 0
§̈¦610
Percent of Housing Units Vacant by Block, 2000No Data
0.1% - 5%
5.1% - 10%
10.1% - 25%
25.1% - 100%
§̈¦10
Sources: City of New Orleans
¯
§̈¦510
§̈¦10
Mississippi River
Lake Pontchartrain

Volume 3 | chapter 2 | new orleans yesterDay anD toDay: population anD lanD use trenDs
2.26 | plan for the 21st century: new orleans 2030, aDopteD auGust 2010
development Patterns and densityReflecting its diversity of neighborhoods and more than 200-year-old building stock, residential densities across New Orleans vary substantially. The highest density neighborhoods—the Seventh Ward and Central City for example—have gross densities of 20 to 23 dwelling units per acre. Meanwhile, the lowest density neighborhoods, such as the fishing camps in Venetian Isles and the more rural, exurban residences in English Turn, have gross densities of less than 1.15 units per acre.58 As mentioned previously, there have been very few developments at New Orleans’ fringe in recent years. Much of the discussion about density in New Orleans therefore revolves around two topics. The first concerns returning the city’s most heavily damaged neighborhoods to their pre-Hurricane Katrina density and overall level of activity. The second conversation—which has been less prominent—is about the city’s potential to accommodate significantly greater densities within its urban core. Aerial photographs or a simple walk around the city’s core neighborhoods, such as the CBD, Warehouse District, and (to a lesser extent) the French Quarter, reveal that there is ample land that is underutilized and available for redevelopment. Surface parking lots, empty lots, abandoned gas stations, and vacant historic buildings all provide substantial opportunities for redevelopment. Figure 3.10 illustrates the location and area of unbuilt parcels in the core of the city. This inventory understates the total land vacant or underutilized structures that could be adaptively reused.
If the vacant parcels identified in Figure 2.6 were all developed at a typical Warehouse District density of 38.71 units per acre, the French Quarter, CBD, and Warehouse District could accommodate another 3,859 dwelling units.59 At the average household size in District 1 of 1.52 persons per household,60 these units could accommodate an additional 5,866 residents. This capacity analysis is fundamentally conservative as well. The potential capacity for additional units could even be higher than this for two reasons: the aforementioned opportunities for the adaptive re-use of vacant structures (this analysis only examined vacant lots) and the fact that densities substantially greater than 39 units per acre would be appropriate and could easily be accommodated along major streets in this area such as Poydras Street and Loyola Avenue.
58 CalculationcompletedbyGCR&Associatesbasedonacreageanddatafrom2000Census.59 ThedensitycalculationscitedwereperformedbyGCR&Associates,usingthedensityofTheCottonMillapartmentandcondobuildingat920
PoeyfarreStasanexampleofthepredominantWarehouseDistricttypology.Thebuilding,whichfullyoccupiesitsfootprintof7.415acres,con-tains287unitsinitsfivefloors.
60 U.S.CensusBureauandgeospatialanalysisconductedbyGCR&Associates
Figure 2.6: underutilized Parcels in Planning district 1
Volume 3 | chapter 2 | new orleans yesterDay anD toDay: population anD lanD use trenDs
plan for the 21st century: new orleans 2030, aDopteD auGust 2010 | 2.27
development and redevelopment ProposalsSpurred by financial incentives such as expanded federal New Markets Tax Credits and Historic Rehabilitation Tax Credits, numerous infill projects have been announced by developers since Hurricane Katrina.61 Within Planning District One alone (the area that comprises the Warehouse District, CBD, and French Quarter), new projects announced since Hurricane Katrina could result in the construction of over 5,000 residential units. If current population per household figures within the planning district are held constant, as many as 7,600 new residents could call Planning District One home, which would more than double the area’s population as of the 2000 Census.62 While the vast majority of the proposed mixed use and residential projects are in the downtown area, a considerable number are interspersed throughout the city. Excluding downtown and excluding the redevelopment of public housing, over 11,000 proposed new units totaling as many as 27,000 residents63 may be built within the city’s neighborhoods.
However, even in ordinary market conditions, many real estate development projects that are announced never even get to the ground breaking stage. In New Orleans, the number of new residential units that have been completed or are under construction is dwarfed by the number of announced units for which construction has not yet begun.64 Concerns about local market demand, the post-Hurricane Katrina costs of insurance and construction, and the turmoil in the national credit markets have clouded the future of some of these proposed projects. Nevertheless, the potential capacity for new development is substantial; and if the local and national conditions for real estate development stabilize, New Orleans could witness a substantial increase in density and overall activity in its urban core.
c The Future Population of New OrleansDemographers emphasize that population “projections” are not “predictions.” Even under the most routine of conditions, the reliability of projections more than ten years in the future declines with each succeeding year. Typically, population projections are made based on judgments about the likelihood of existing trends continuing. Population change is made up of net natural increase (births minus deaths) and net migration (inmigration minus outmigration), both of which can take unpredictable turns—especially migration. Population projections for New Orleans are thus exceptionally problematic in the aftermath of Hurricane Katrina.
The most important demographic numbers for cities is the number of households, not the number of people as a whole. Everyone in New Orleans seems to know that the city’s population was 627,000 in 1960, declining significantly since, especially in the 1980s. As noted earlier, urban population decline is a phenomenon common to all American cities in the second half of the twentieth century, but because the average number of people in a household has been decline—for example many more people live alone—it is the number of households that is the key figure for urban development. This means that, even if New Orleans’ population in the next 20 years remains below historic highs, the number of households may grow significantly, filling both existing and new housing units.
Since Hurricane Katrina, the population of New Orleans has been in a state of constant flux, with substantial changes seen on a month-to-month basis. However, repopulation has outstripped the pessimistic estimates of the early months after the storm and the city continues to gain new residents: through the first eight months of 2008, the city gained an average of approximately 2,450 new residents per month, based on utility account activity. The continued population growth that the city is experiencing
61 ExpandedfederaltaxcreditswereapprovedaspartofthefederalGOZONElegislationfollowingHurricaneKatrina.62 AnalysiscompletedbyGCR&Associates,basedoninventoryofresidentialdevelopmentprojectsand2000Censusdata.63 Thiscalculationassumes2.48residentsperhousehold,theresidentperhouseholdfigureforOrleansParishfromthe2000Census.Thegrossunit
countisalsofromGCR’sinventoryofresidentialdevelopmentprojects.64 SourceisGCR’sinventoryofresidentialdevelopmentprojects.

Volume 3 | chapter 2 | new orleans yesterDay anD toDay: population anD lanD use trenDs
2.28 | plan for the 21st century: new orleans 2030, aDopteD auGust 2010
is occurring primarily in the areas that have had the most room to grow, namely the most heavily flooded areas.
In addition to Hurricane Katrina-related issues, the future trajectory of the city in terms of improving quality of life and economic performance will affect future population figures. The city has many of the ingredients that make cities successful in retaining and attracting residents, but it also has weaknesses that need attention. If the city can overcome these weaknesses, growth will accelerate as its success becomes well-known. The three population and household scenarios shown
here should be understood in the context of New Orleans exceedingly dynamic situation. They were prepared using the following assumptions:
• In the post-Hurricane Katrina situation, the historical trend data (base population, natural increase and net migration) typically used to prepare projections are not valid. Post-Hurricane Katrina evidence indicates somewhat different age composition, racial composition, socioeconomic makeup, and migration than pre-Hurricane Katrina. Traditional methods of measuring internal migration—IRS and Medicare data—have proven inaccurate. This is why the Census Bureau accepted the City’s challenge to the 2007 census estimates of population and why the state estimates prepared before the Census Bureau’s decision are not accurate.
• The Census Bureau accepts analysis of housing units as an alternative methodology for estimating population. There is trend line data 2006–2007 for assuming the number of housing units that will be brought on line through small scale renovations, and reasonable estimates for the number of units in the pipeline from other sources.
• The projections are based on housing production with assumptions for rate of production of new units (based on financing, economic conditions), absorption rates (based on economic conditions/demand), and household size (based on local and national trends in changes in household size).
• Base population growth. Small-scale recovery and investment continues at a slower rate of return. The three scenarios (high, low, moderate) differ based on the rate of deceleration.
taBle 2.6 PoPulation ProJection scenarios, 2009-2030
2009 2015 2030
low 332,502 361,846 364,818
Moderate 335,607 399,764 409,296
high 345,629 461,233 502,651
Source: Gcr
Figure 2.5: city oF neW orleans PoPulation scenarios 2009–2030
low scenario moderate scenario high sce-Source: Gcr

Volume 3 | chapter 2 | new orleans yesterDay anD toDay: population anD lanD use trenDs
plan for the 21st century: new orleans 2030, aDopteD auGust 2010 | 2.29
• nora properties. NORA’s stockpile of properties consists of blighted, adjudicated, and Louisiana Land Trust (i.e., Road Home) properties, some of which will be rehabilitated and redeveloped. A discount factor was applied for the Lot Next Door program (which will not produce any housing units) and assumptions about capacity and overall market demand were factored into an estimated rate of production.
• small rental program. The small rental program has about 4,500 eligible property owners enrolled in New Orleans, totaling about 7,000 units. The LRA is overhauling the program to make it more usable by small landlords. Assumptions about how many people would ultimately qualify rates of production, and rates of absorption are applied to each of the three scenarios.
• orleans Parish Prison. The jail is expected to grow by 1,000 net new beds. The three scenarios make assumptions as to when those beds will be brought on-line.
• hano housing developments. Each of the three scenarios assume that all planned units will be built eventually, but they make different assumptions about the rate at which they will be completed.
• low income housing tax credit units. There are thousands of tax credit units that are nominally in the pipeline as a result of the GOZONE legislation. Cost of construction, insurance and market uncertainty affect financing and the current credit crisis adds to normal uncertainly. The three scenarios make assumptions about how many of these units will actually come on-line based on their current status (financing closed, financing still uncertain, under construction, etc.) and the rate at which the units will be produced.
• market rate infill development. The three scenarios make assumptions about what percentage will actually be built and how quickly they will be occupied. Many of these projects are subsidized through New Markets Tax Credits, GO Zone bonds, historic rehab credits, but financing may be problematic in the short term.
• Project based section 8 units. Once again, different assumptions for different scenarios, relative to rate of recovery/production of damaged units.
• household size. The high scenario assumes no further change in household size. The low and moderate scenario, however, assume a continuation of decreasing household size based on varying rates of decline. The low scenario assumes the steepest decline in average household size. For new infill construction, a much smaller household size was assumed, in line with Warehouse District households, compared to the citywide average. Thus, all categories were not treated equally when population was ascribed to different kinds of housing units.
In summary, population and land use trends suggest that although New Orleans continues to be challenged by blight and vacancy (which was a significant problem in many neighborhoods even before Hurricane Katrina), population recovery since Hurricane Katrina has exceeded initial expectations and is likely to continue at a moderate pace. Moreover, the trend toward smaller households means that the population is likely to consume more housing units per total population than in the city’s past, expediting the recovery of New Orleans’ diverse range of neighborhoods. Meanwhile, underutilized and underdeveloped commercial and industrial land presents significant opportunity for new infill development, including commercial and office uses, institutions, new housing types, and parks and open space.