Embed Size (px)
Citation preview

1
NEW PREDICTION EQUATIONS OF ARIAS INTENSITY AND CUMULATIVE ABSOLUTE VELOCITY FOR JAPANESE
EARTHQUAKES
Roxane FOULSER-PIGGOTT1 and Katsuichiro GODA2
ABSTRACT
This paper presents new ground motion models for Arias Intensity (AI) and Cumulative Absolute Velocity (CAV) using an extended database of strong motion records from Japan, including the 2011 Tohoku event. The dataset is well-suited to develop spatial correlation models of AI and CAV, because it includes many well-recorded seismic events. A nonlinear random-effects regression analysis is carried out to determine final sets of model coefficients for both median and logarithmic standard deviation, and spatial correlation models for AI and CAV are evaluated empirically by constructing semi-variograms of regression residuals. The applicability of the final functional form is examined carefully using the observed data. This paper is important as it develops models which take account of ground motion data from the 2011 Tohoku earthquake whilst incorporating other important features (e.g. depth and event type). Additionally, the dataset allows spatial correlation modelling to be conducted based on a ground motion dataset with dense station-to-station spacing.
INTRODUCTION
Duration-based ground motion parameters, such as Arias Intensity (AI, Arias, 1970) and Cumulative Absolute Velocity (CAV, EPRI, 1988), can capture the cumulative damage potential due to ground shaking and liquefaction (Kramer and Mitchell, 2006; Campbell and Bozorgnia, 2012b). These parameters correlate well with observed building damage, particularly for structures that are susceptible to long-duration ground motion. AI and CAV have also been found to correlate with seismic intensity measures, such as Modified Mercalli Intensity (Campbell and Bozorgnia, 2012a). Modern predictive equations for AI and CAV adopt complex functional forms for median and logarithmic standard deviation based on the state-of-the-art seismological findings (Campbell and Bozorgnia, 2010; Foulser-Piggott and Stafford, 2012). Moreover, they can be used to estimate AI and CAV values simultaneously at multiple sites for a given earthquake scenario (Foulser-Piggott and Stafford, 2012; Du and Wang, 2013a). The latter extension is important to assess earthquake hazard and risk of spatially distributed infrastructure systems (Du and Wang, 2013b).
Japan is situated in a highly active seismic region, influenced by complex interaction of tectonic plates, and hosts numerous major earthquakes in different seismotectonic regimes (e.g. shallow crustal, mega-thrust interface, and deep inslab events). The 11 March 2011 Mw9 Great East Japan (Tohoku) earthquake was one of the largest recorded events around the world since 1900, and was extremely well-recorded at national/regional strong motion observation network stations, e.g. K-NET and KiK-net (http://www.kyoshin.bosai.go.jp/) and SK-net (http://www.sknet.eri.u-tokyo.ac.jp/). The new data from the 2011 Tohoku event provides opportunities to investigate source-path-site 1 Postdoctoral Researcher, University of Cambridge, United Kingdom, [email protected] 2 Senior Lecturer, University of Bristol, Bristol, United Kingdom, [email protected]
2
characteristics for Mw9-class subduction earthquakes and how these compare with those for smaller earthquakes. For instance, an investigation by Goda et al. (2013) indicated that the magnitude scaling effects of ground motion parameters are different for peak-based parameters (e.g. peak ground acceleration [PGA] and spectral acceleration) and for duration-based parameters (e.g. AI and CAV). The amplitudes for the former tend to saturate as the earthquake magnitude increases (between Mw8 and Mw9), whereas amplitudes for the latter continue to increase due to long-duration features of the ground motions. Currently, there is a critical gap in conducting probabilistic seismic hazard assessment in Japan using duration-based intensity measures. There are no modern ground motion prediction equations (GMPE) for AI and CAV that are applicable to Japanese earthquakes. The situations differ from other standard intensity measures, such as PGA and spectral acceleration, for which models based on rich strong motion datasets in Japan (and worldwide) are available (e.g. Kanno et al., 2006; Zhao et al., 2006) and a new generation of the models that incorporates key findings from the 2011 Tohoku earthquake has been developed (Morikawa and Fujiwara, 2013). Therefore, new development of predictive equations for AI and CAV, which are based on an extended ground-motion database (including the 2011 Tohoku records), is warranted.
This study develops new ground motion models for AI and CAV. For this purpose, an extended ground-motion database is compiled using high-quality digital recordings from the K-NET and KiK-net in Japan. The dataset is the updated version of Goda and Atkinson (2010), and includes recordings up to the end of 2012. From a ground motion modelling standpoint, the database contains unique and valuable information in two aspects. Firstly, because the networks provide comprehensive spatial coverage of Japan, events are exceptionally well-recorded. Secondly, the high rate of seismic activity in Japan and the surrounding area results in a dataset populated with a large number of well-recorded events in the past 16 years, with a range of magnitude-distance characteristics. The dataset is suited to develop spatial correlation models of AI and CAV, because it includes many well-recorded seismic events having more than 100 recordings (i.e. spatial correlation analysis can be performed for individual events, rather than combining heterogeneous events). We adopt a simplified version of the functional form based on Foulser-Piggott and Stafford (2012), which takes into account a wider magnitude range (up to Mw9) and different earthquake types (i.e. crustal versus interface versus inslab events). Subsequently, a nonlinear random-effects regression analysis is carried out to determine final sets of model coefficients for both median and logarithmic standard deviation. Furthermore, spatial correlation models for AI and CAV are evaluated empirically by constructing semi-variograms of regression residuals. This work is novel and important for two main reasons. Firstly, the developed models take into account ground motion data from the 2011 Tohoku earthquake (having a very long duration), by modifying the magnitude scaling term. The models also incorporate other important features (e.g. depth and event type). Secondly, spatial correlation modelling is conducted based on the extensive ground motion dataset that has dense station-to-station spacing.
STRONG MOTION DATA FOR JAPANESE EARTHQUAKES
A new ground motion database 2012KKiKSK is compiled for the purpose of ground motion prediction studies. It combines recordings from three national/regional ground motion networks in Japan, K-NET/KiK-net and SK-net, up to the end of 2012. Records from different networks are first integrated by matching event information (occurrence time, location, earthquake size, etc.). Metadata, such as moment magnitude, fault mechanism (normal/reverse/strike-slip), earthquake type (crustal/inslab/interface/off-shore), and finite-fault plane information, are assigned to major seismic events (MJMA≥5.5) individually. Using available finite-fault plane models, rupture distance is calculated. Site information for the K-NET and KiK-net is obtained from the National Research Institute for Earth Science and Disaster Prevention (NIED) websites, whereas for the SK-net sites, an approach adopted by Goda and Atkinson (2010) is implemented. By applying broad record selection criteria, the database contains 555,750 records from 6261 earthquakes. Subsequently, individual components in the record set are processed uniformly (i.e. tapering, zero-padding, and band-pass filtering), and various elastic ground motion parameters, including AI and CAV, are computed using the processed record components.
R. Foulser-Piggott and K. Goda 3
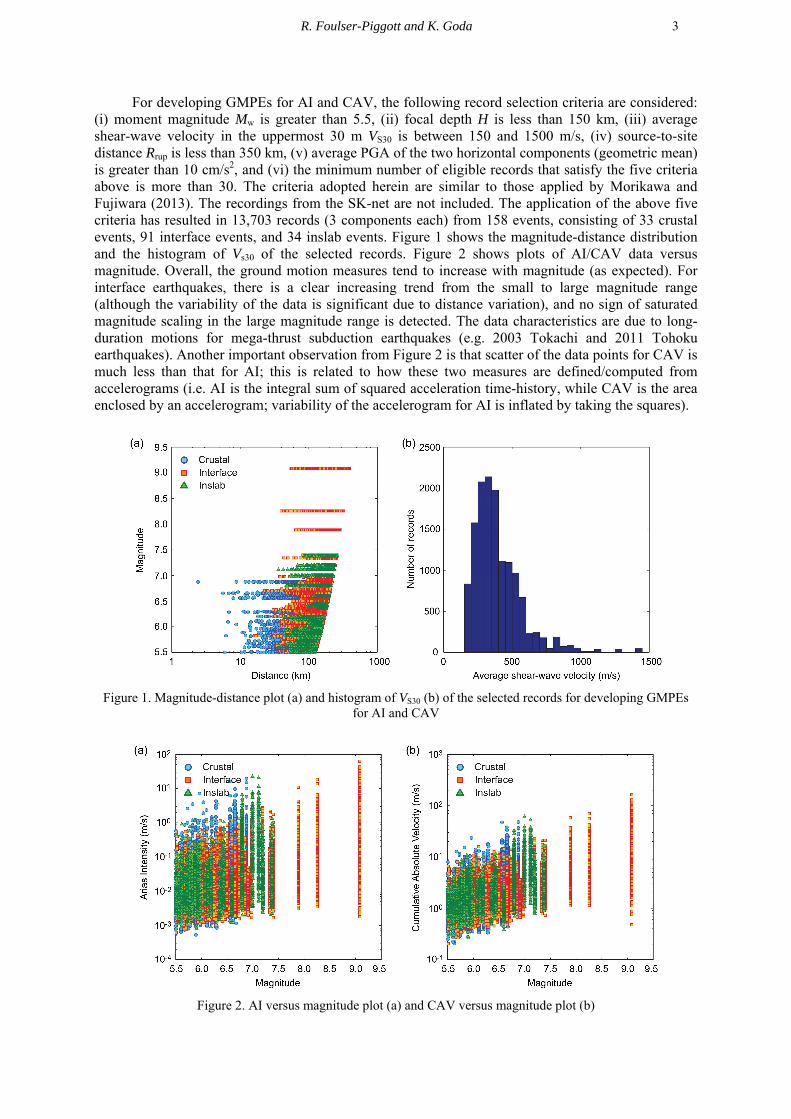
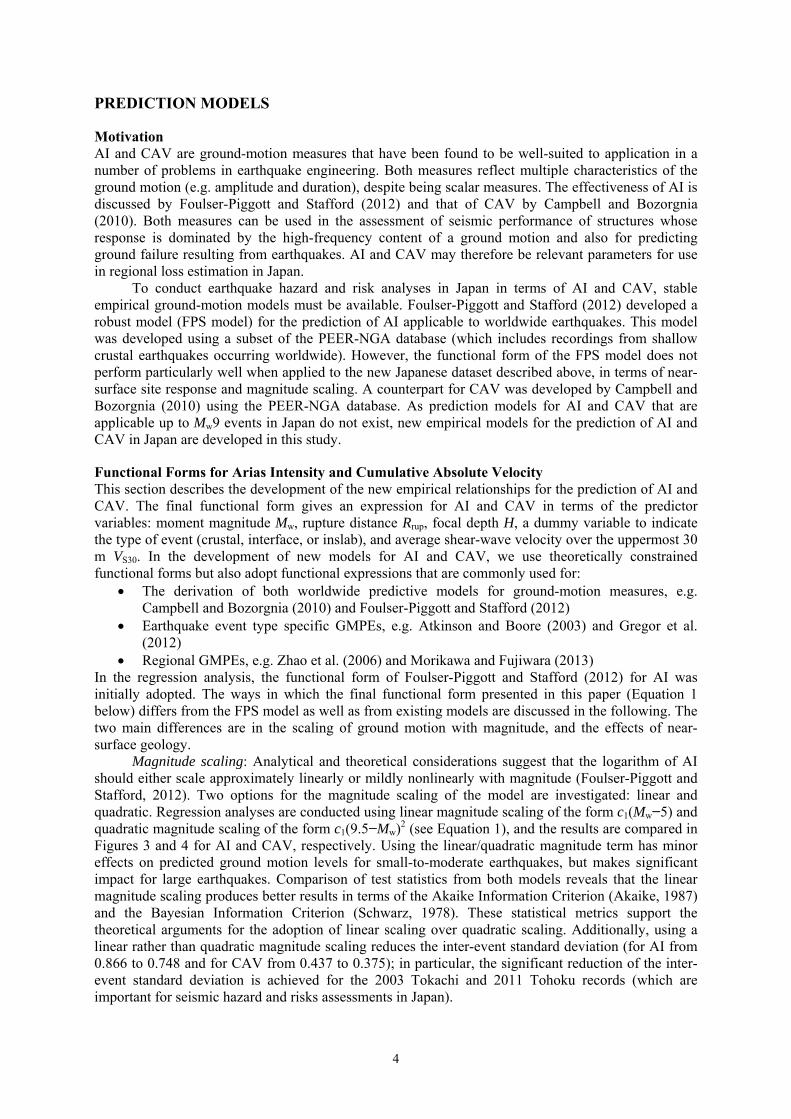
For developing GMPEs for AI and CAV, the following record selection criteria are considered: (i) moment magnitude Mw is greater than 5.5, (ii) focal depth H is less than 150 km, (iii) average shear-wave velocity in the uppermost 30 m VS30 is between 150 and 1500 m/s, (iv) source-to-site distance Rrup is less than 350 km, (v) average PGA of the two horizontal components (geometric mean) is greater than 10 cm/s2, and (vi) the minimum number of eligible records that satisfy the five criteria above is more than 30. The criteria adopted herein are similar to those applied by Morikawa and Fujiwara (2013). The recordings from the SK-net are not included. The application of the above five criteria has resulted in 13,703 records (3 components each) from 158 events, consisting of 33 crustal events, 91 interface events, and 34 inslab events. Figure 1 shows the magnitude-distance distribution and the histogram of Vs30 of the selected records. Figure 2 shows plots of AI/CAV data versus magnitude. Overall, the ground motion measures tend to increase with magnitude (as expected). For interface earthquakes, there is a clear increasing trend from the small to large magnitude range (although the variability of the data is significant due to distance variation), and no sign of saturated magnitude scaling in the large magnitude range is detected. The data characteristics are due to long-duration motions for mega-thrust subduction earthquakes (e.g. 2003 Tokachi and 2011 Tohoku earthquakes). Another important observation from Figure 2 is that scatter of the data points for CAV is much less than that for AI; this is related to how these two measures are defined/computed from accelerograms (i.e. AI is the integral sum of squared acceleration time-history, while CAV is the area enclosed by an accelerogram; variability of the accelerogram for AI is inflated by taking the squares).
Figure 1. Magnitude-distance plot (a) and histogram of VS30 (b) of the selected records for developing GMPEs for AI and CAV
Figure 2. AI versus magnitude plot (a) and CAV versus magnitude plot (b)
4
PREDICTION MODELS
Motivation AI and CAV are ground-motion measures that have been found to be well-suited to application in a number of problems in earthquake engineering. Both measures reflect multiple characteristics of the ground motion (e.g. amplitude and duration), despite being scalar measures. The effectiveness of AI is discussed by Foulser-Piggott and Stafford (2012) and that of CAV by Campbell and Bozorgnia (2010). Both measures can be used in the assessment of seismic performance of structures whose response is dominated by the high-frequency content of a ground motion and also for predicting ground failure resulting from earthquakes. AI and CAV may therefore be relevant parameters for use in regional loss estimation in Japan.
To conduct earthquake hazard and risk analyses in Japan in terms of AI and CAV, stable empirical ground-motion models must be available. Foulser-Piggott and Stafford (2012) developed a robust model (FPS model) for the prediction of AI applicable to worldwide earthquakes. This model was developed using a subset of the PEER-NGA database (which includes recordings from shallow crustal earthquakes occurring worldwide). However, the functional form of the FPS model does not perform particularly well when applied to the new Japanese dataset described above, in terms of near-surface site response and magnitude scaling. A counterpart for CAV was developed by Campbell and Bozorgnia (2010) using the PEER-NGA database. As prediction models for AI and CAV that are applicable up to Mw9 events in Japan do not exist, new empirical models for the prediction of AI and CAV in Japan are developed in this study.
Functional Forms for Arias Intensity and Cumulative Absolute Velocity This section describes the development of the new empirical relationships for the prediction of AI and CAV. The final functional form gives an expression for AI and CAV in terms of the predictor variables: moment magnitude Mw, rupture distance Rrup, focal depth H, a dummy variable to indicate the type of event (crustal, interface, or inslab), and average shear-wave velocity over the uppermost 30 m VS30. In the development of new models for AI and CAV, we use theoretically constrained functional forms but also adopt functional expressions that are commonly used for:
The derivation of both worldwide predictive models for ground-motion measures, e.g. Campbell and Bozorgnia (2010) and Foulser-Piggott and Stafford (2012)
Earthquake event type specific GMPEs, e.g. Atkinson and Boore (2003) and Gregor et al. (2012)
Regional GMPEs, e.g. Zhao et al. (2006) and Morikawa and Fujiwara (2013) In the regression analysis, the functional form of Foulser-Piggott and Stafford (2012) for AI was initially adopted. The ways in which the final functional form presented in this paper (Equation 1 below) differs from the FPS model as well as from existing models are discussed in the following. The two main differences are in the scaling of ground motion with magnitude, and the effects of near-surface geology.
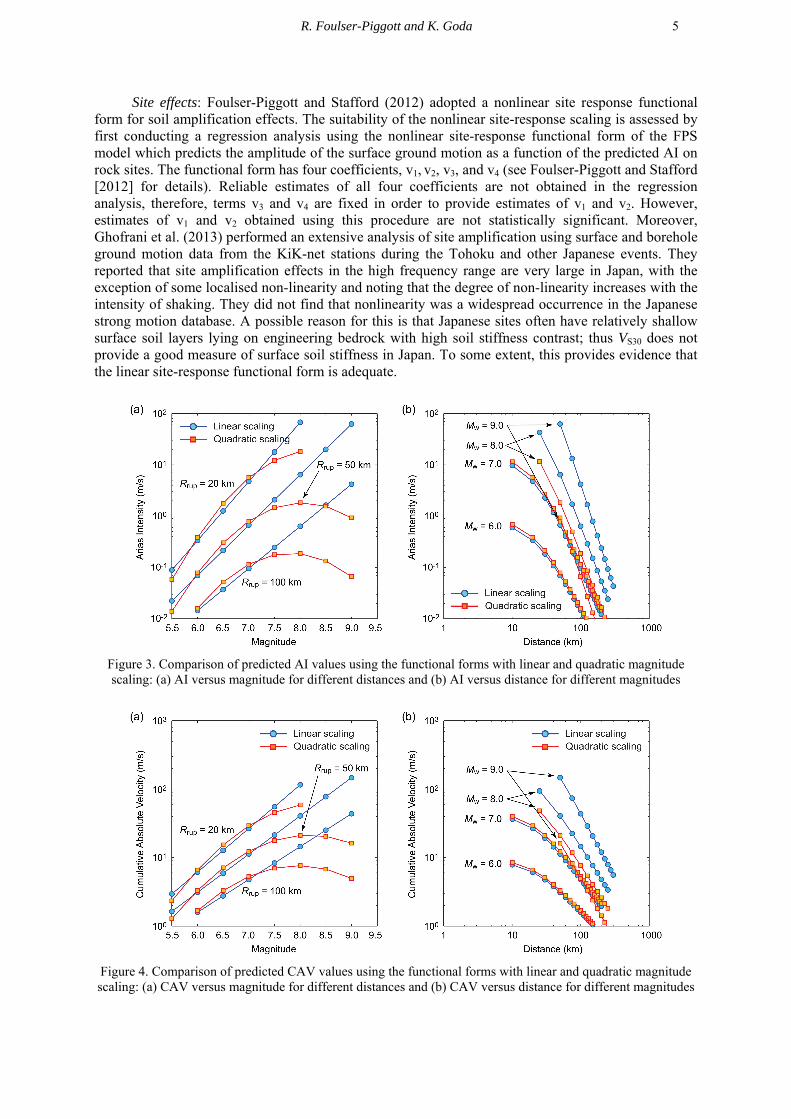
Magnitude scaling: Analytical and theoretical considerations suggest that the logarithm of AI should either scale approximately linearly or mildly nonlinearly with magnitude (Foulser-Piggott and Stafford, 2012). Two options for the magnitude scaling of the model are investigated: linear and quadratic. Regression analyses are conducted using linear magnitude scaling of the form c1(Mw−5) and quadratic magnitude scaling of the form c1(9.5−Mw)2 (see Equation 1), and the results are compared in Figures 3 and 4 for AI and CAV, respectively. Using the linear/quadratic magnitude term has minor effects on predicted ground motion levels for small-to-moderate earthquakes, but makes significant impact for large earthquakes. Comparison of test statistics from both models reveals that the linear magnitude scaling produces better results in terms of the Akaike Information Criterion (Akaike, 1987) and the Bayesian Information Criterion (Schwarz, 1978). These statistical metrics support the theoretical arguments for the adoption of linear scaling over quadratic scaling. Additionally, using a linear rather than quadratic magnitude scaling reduces the inter-event standard deviation (for AI from 0.866 to 0.748 and for CAV from 0.437 to 0.375); in particular, the significant reduction of the inter-event standard deviation is achieved for the 2003 Tokachi and 2011 Tohoku records (which are important for seismic hazard and risks assessments in Japan).
R. Foulser-Piggott and K. Goda 5
Site effects: Foulser-Piggott and Stafford (2012) adopted a nonlinear site response functional form for soil amplification effects. The suitability of the nonlinear site-response scaling is assessed by first conducting a regression analysis using the nonlinear site-response functional form of the FPS model which predicts the amplitude of the surface ground motion as a function of the predicted AI on rock sites. The functional form has four coefficients, v1, v2, v3, and v4 (see Foulser-Piggott and Stafford [2012] for details). Reliable estimates of all four coefficients are not obtained in the regression analysis, therefore, terms v3 and v4 are fixed in order to provide estimates of v1 and v2. However, estimates of v1 and v2 obtained using this procedure are not statistically significant. Moreover, Ghofrani et al. (2013) performed an extensive analysis of site amplification using surface and borehole ground motion data from the KiK-net stations during the Tohoku and other Japanese events. They reported that site amplification effects in the high frequency range are very large in Japan, with the exception of some localised non-linearity and noting that the degree of non-linearity increases with the intensity of shaking. They did not find that nonlinearity was a widespread occurrence in the Japanese strong motion database. A possible reason for this is that Japanese sites often have relatively shallow surface soil layers lying on engineering bedrock with high soil stiffness contrast; thus VS30 does not provide a good measure of surface soil stiffness in Japan. To some extent, this provides evidence that the linear site-response functional form is adequate.
Figure 3. Comparison of predicted AI values using the functional forms with linear and quadratic magnitude scaling: (a) AI versus magnitude for different distances and (b) AI versus distance for different magnitudes
Figure 4. Comparison of predicted CAV values using the functional forms with linear and quadratic magnitude scaling: (a) CAV versus magnitude for different distances and (b) CAV versus distance for different magnitudes
6
Final Equations for Arias Intensity and Cumulative Absolute Velocity The regression analysis consists of initially trying various functional forms that are basic variations of the theoretically governed forms. The two most significant parts of the functional form that are the focus of the model development are the site-response and magnitude terms as discussed in the previous section.
The main differences between the functional form of the FPS model and the final functional form shown in Equation 1 are as follows. A linear rather than quadratic magnitude scaling The use of a linear site response term No term to describe effects due to style of faulting, (the reverse faulting term in the FPS model
is removed in the early stages of the regression analysis as the coefficient obtained is not statistically significant)
The addition of a dummy variable term to indicate the event type under consideration, this is 1 for inslab events and 0 for other events; the inclusion of this term is based on the finding by Zhao et al. (2006) that although PGA for different earthquake event types (crustal, interface, inslab) scales similarly with distance, the PGAs from inslab events are larger than those from crustal or interface events by a factor of 1.66 At each stage of the development of the final functional form, the trial models are evaluated
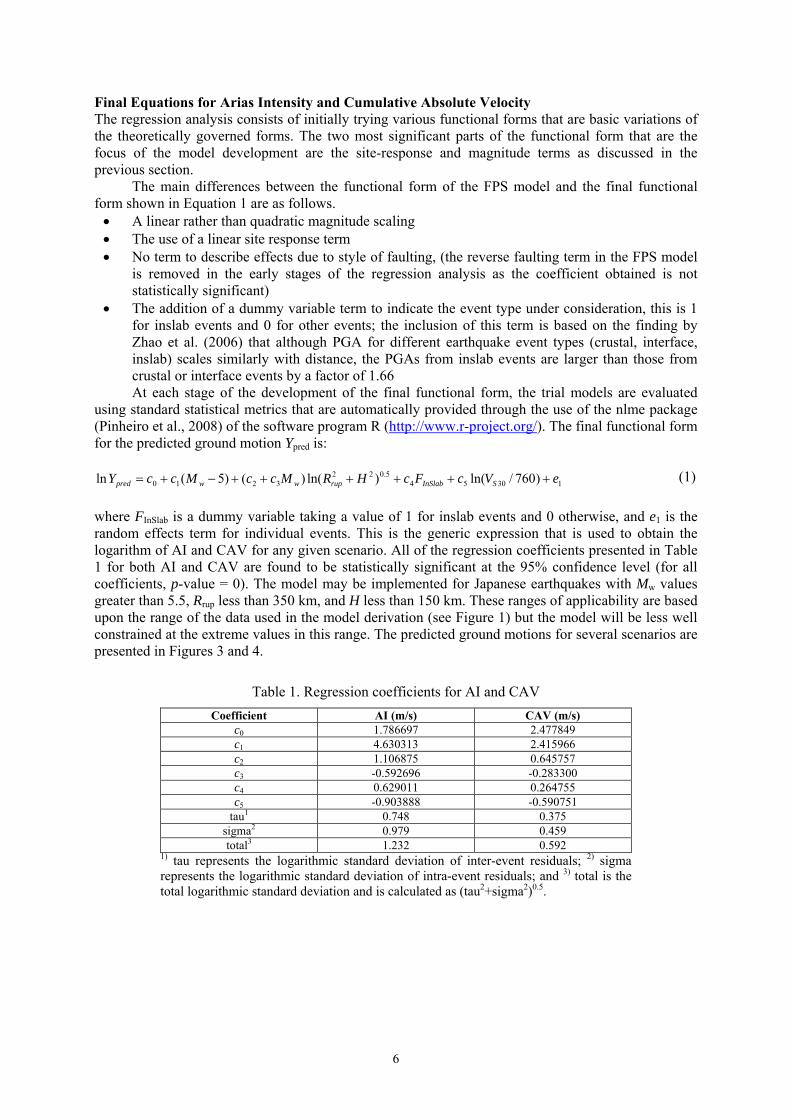
using standard statistical metrics that are automatically provided through the use of the nlme package (Pinheiro et al., 2008) of the software program R (http://www.r-project.org/). The final functional form for the predicted ground motion Ypred is:
130545.022
3210 )760/ln()ln()()5(ln eVcFcHRMccMccY SInSlabrupwwpred (1)
where FInSlab is a dummy variable taking a value of 1 for inslab events and 0 otherwise, and e1 is the random effects term for individual events. This is the generic expression that is used to obtain the logarithm of AI and CAV for any given scenario. All of the regression coefficients presented in Table 1 for both AI and CAV are found to be statistically significant at the 95% confidence level (for all coefficients, p-value = 0). The model may be implemented for Japanese earthquakes with Mw values greater than 5.5, Rrup less than 350 km, and H less than 150 km. These ranges of applicability are based upon the range of the data used in the model derivation (see Figure 1) but the model will be less well constrained at the extreme values in this range. The predicted ground motions for several scenarios are presented in Figures 3 and 4.
Table 1. Regression coefficients for AI and CAV
Coefficient AI (m/s) CAV (m/s)
c0 1.786697 2.477849 c1 4.630313 2.415966 c2 1.106875 0.645757 c3 -0.592696 -0.283300 c4 0.629011 0.264755 c5 -0.903888 -0.590751
tau1 0.748 0.375 sigma2 0.979 0.459 total3 1.232 0.592
1) tau represents the logarithmic standard deviation of inter-event residuals; 2) sigma represents the logarithmic standard deviation of intra-event residuals; and 3) total is the total logarithmic standard deviation and is calculated as (tau2+sigma2)0.5.
R. Foulser-Piggott and K. Goda 7
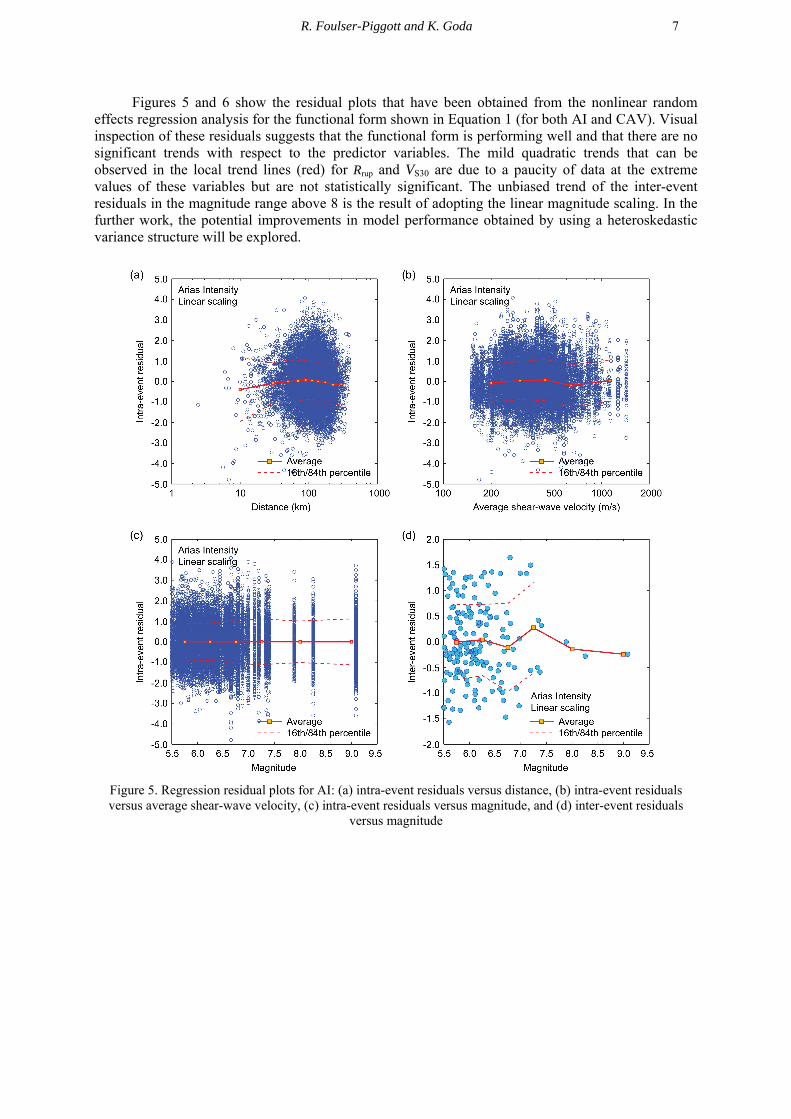
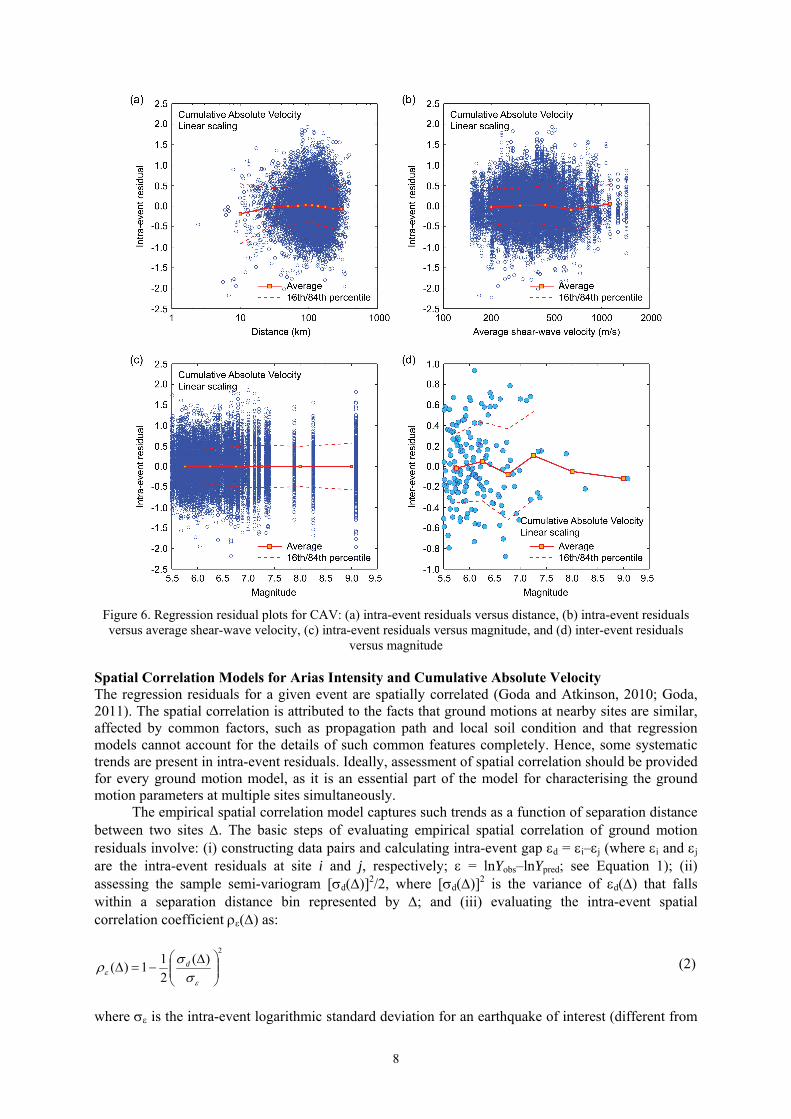
Figures 5 and 6 show the residual plots that have been obtained from the nonlinear random effects regression analysis for the functional form shown in Equation 1 (for both AI and CAV). Visual inspection of these residuals suggests that the functional form is performing well and that there are no significant trends with respect to the predictor variables. The mild quadratic trends that can be observed in the local trend lines (red) for Rrup and VS30 are due to a paucity of data at the extreme values of these variables but are not statistically significant. The unbiased trend of the inter-event residuals in the magnitude range above 8 is the result of adopting the linear magnitude scaling. In the further work, the potential improvements in model performance obtained by using a heteroskedastic variance structure will be explored.
Figure 5. Regression residual plots for AI: (a) intra-event residuals versus distance, (b) intra-event residuals versus average shear-wave velocity, (c) intra-event residuals versus magnitude, and (d) inter-event residuals
versus magnitude
8
Figure 6. Regression residual plots for CAV: (a) intra-event residuals versus distance, (b) intra-event residuals versus average shear-wave velocity, (c) intra-event residuals versus magnitude, and (d) inter-event residuals
versus magnitude
Spatial Correlation Models for Arias Intensity and Cumulative Absolute Velocity The regression residuals for a given event are spatially correlated (Goda and Atkinson, 2010; Goda, 2011). The spatial correlation is attributed to the facts that ground motions at nearby sites are similar, affected by common factors, such as propagation path and local soil condition and that regression models cannot account for the details of such common features completely. Hence, some systematic trends are present in intra-event residuals. Ideally, assessment of spatial correlation should be provided for every ground motion model, as it is an essential part of the model for characterising the ground motion parameters at multiple sites simultaneously.
The empirical spatial correlation model captures such trends as a function of separation distance between two sites . The basic steps of evaluating empirical spatial correlation of ground motion residuals involve: (i) constructing data pairs and calculating intra-event gap d = i–j (where i and j are the intra-event residuals at site i and j, respectively; = lnYobs–lnYpred; see Equation 1); (ii) assessing the sample semi-variogram [d()]2/2, where [d()]2 is the variance of d() that falls within a separation distance bin represented by ; and (iii) evaluating the intra-event spatial correlation coefficient () as:
2)(
2
11)(
d (2)
where is the intra-event logarithmic standard deviation for an earthquake of interest (different from
R. Foulser-Piggott and K. Goda 9
those listed in Table 1). There are several ways to compute a value of for a given dataset (Goda and Atkinson, 2010). In this study, is estimated by calculating the standard deviation of intra-event residuals for an event of interest. Ideally, the intra-event spatial correlation should be evaluated for individual seismic events. The individual assessment of empirical spatial correlation models is useful, as it provides an estimate of inter-event variability of the spatial correlation models (Goda, 2011). However, this may be difficult when the available ground motion dataset does not include well-recorded events (e.g. more than 100 records per event). Another common approach is to pool intra-event residuals from all earthquakes in the dataset for regression analysis and to develop a combined spatial correlation model. For this method, prior to combining the data from multiple earthquakes, d data should be normalised by for individual events. The advantage of the latter approach is that the estimates of spatial correlation at shorter separation distances can be obtained in comparison with results based on individual events alone (because the number of data pairs per bin is increased and thus the estimates of [d()]2 can be computed). As this study employs an extensive ground motion dataset containing many well-recorded earthquakes, both individual and combined approaches are pursued.
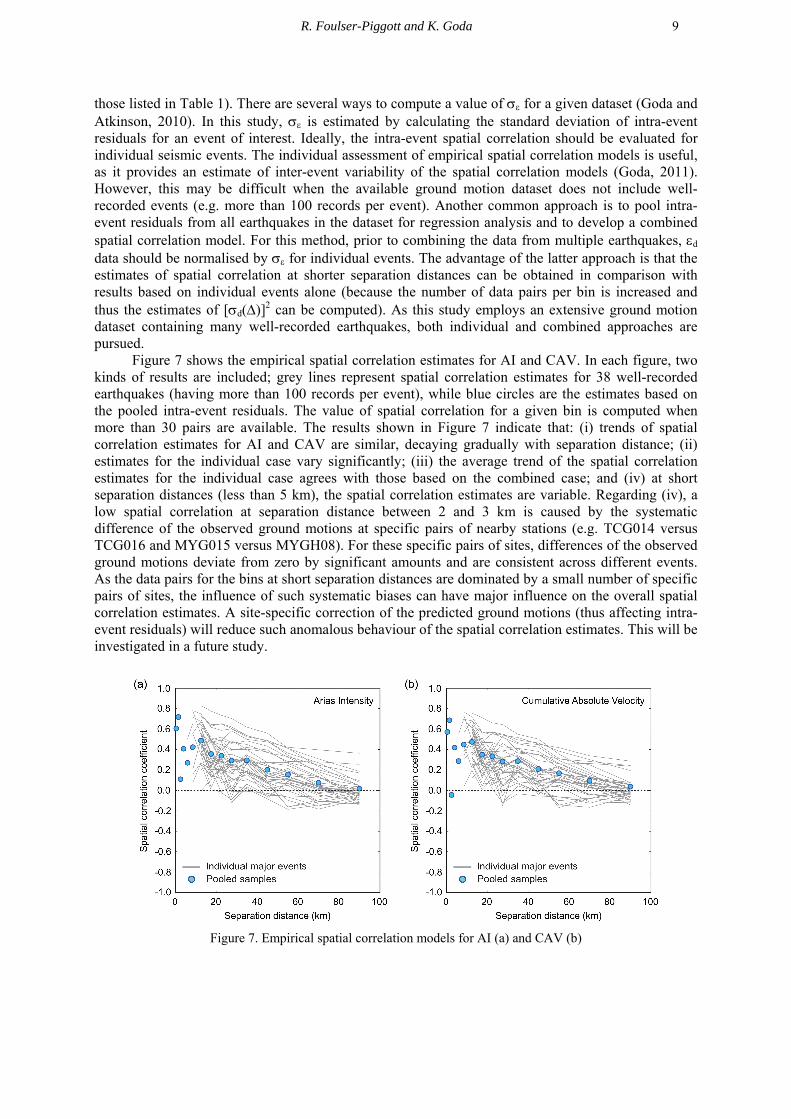
Figure 7 shows the empirical spatial correlation estimates for AI and CAV. In each figure, two kinds of results are included; grey lines represent spatial correlation estimates for 38 well-recorded earthquakes (having more than 100 records per event), while blue circles are the estimates based on the pooled intra-event residuals. The value of spatial correlation for a given bin is computed when more than 30 pairs are available. The results shown in Figure 7 indicate that: (i) trends of spatial correlation estimates for AI and CAV are similar, decaying gradually with separation distance; (ii) estimates for the individual case vary significantly; (iii) the average trend of the spatial correlation estimates for the individual case agrees with those based on the combined case; and (iv) at short separation distances (less than 5 km), the spatial correlation estimates are variable. Regarding (iv), a low spatial correlation at separation distance between 2 and 3 km is caused by the systematic difference of the observed ground motions at specific pairs of nearby stations (e.g. TCG014 versus TCG016 and MYG015 versus MYGH08). For these specific pairs of sites, differences of the observed ground motions deviate from zero by significant amounts and are consistent across different events. As the data pairs for the bins at short separation distances are dominated by a small number of specific pairs of sites, the influence of such systematic biases can have major influence on the overall spatial correlation estimates. A site-specific correction of the predicted ground motions (thus affecting intra-event residuals) will reduce such anomalous behaviour of the spatial correlation estimates. This will be investigated in a future study.
Figure 7. Empirical spatial correlation models for AI (a) and CAV (b)
10
SUMMARY AND CONCLUSIONS
New ground motion models for AI and CAV were developed using extensive strong ground motion databases from Japan. The dataset that was used for developing the new GMPEs includes the 2011 Tohoku earthquake records, and thus the developed models can be used for future Mw9-class mega-thrust subduction earthquakes. The functional form of the developed GMPEs is relatively simple, yet capturing key features of the available strong motion data. It takes account of linear magnitude scaling, linear site amplification, and earthquake event type. In particular, the linear magnitude scaling up to Mw9, rather than saturation of magnitude scaling, is considered as adequate through various regression statistics. This is related to how AI and CAV are defined to reflect multiple characteristics of the ground motion (e.g. amplitude and duration). The final models were developed via nonlinear mixed effects regression; intra-event and inter-event residuals calculated from the final models do not show significant trends with respect to key explanatory variables. Furthermore, empirical estimates of intra-event spatial correlation were obtained using two approaches, one for major well-recorded earthquakes and the other for the combined dataset.
ACKNOWLEDGEMENTS
Strong motion data used in this study were obtained from the K-NET and KiK-net (http://www.kyoshin.bosai.go.jp/). This work is conducted as part of the Alexander von Humboldt Fellowship for Experienced Researchers, awarded to the second author.
REFERENCES
Akaike H (1987) “Factor analysis and AIC,” Psychometrika, 52(3):317-332. Arias A (1970) “A measure of earthquake intensity,” In: Seismic Design for Nuclear Power Plants (R J Hansen,
ed.), The MIT Press, Cambridge, MA, 438-483. Atkinson G M and Boore D M (2003) “Empirical ground-motion relations for subduction zone earthquakes and
their application to Cascadia and other regions,” Bulletin of the Seismological Society of America, 93:1703-1729.
Campbell K W and Bozorgnia Y (2010) “A ground motion prediction equation for the horizontal component of cumulative absolute velocity (CAV) using the PEER-NGA database,” Earthquake Spectra, 26(3):635-650.
Campbell K W and Bozorgnia Y (2012a) “Cumulative absolute velocity (CAV) and seismic intensity based on the PEER-NGA database,” Earthquake Spectra, 28(2):457-485.
Campbell K W and Bozorgnia Y (2012b) “A comparison of ground motion prediction equations for Arias Intensity and cumulative absolute velocity developed using a consistent database and functional form,” Earthquake Spectra, 28(3):931-941.
Du W and Wang G (2013a) “Intra-event spatial correlations for cumulative absolute velocity, Arias Intensity, and spectral accelerations based on regional site conditions,” Bulletin of the Seismological Society of America, 103(2A):1117-1129.
Du W and Wang G (2013b) “Fully probabilistic seismic displacement analysis of spatially distributed slopes using spatially correlated vector intensity measures,” Earthquake Engineering and Structural Dynamics, 43(5):661-679.
Electrical Power Research Institute (EPRI) (1988) “A criterion for determining exceedance of the operating basis earthquake,” Report No EPRI NP-5930, Palo Alto, CA.
Foulser-Piggott R and Stafford P J (2012) “A predictive model for Arias Intensity at multiple sites and consideration of spatial correlations,” Earthquake Engineering and Structural Dynamics, 41(3):431-451.
Ghofrani H, Atkinson G M and Goda K (2013) “Implications of the 2011 M9.0 Tohoku Japan earthquake for the treatment of site effects in large earthquakes,” Bulletin of Earthquake Engineering, 11(1):171-203.
Goda K and Atkinson G M (2010) “Intraevent spatial correlation of ground-motion parameters using SK-net data,” Bulletin of the Seismological Society of America, 100(6):3055-3067.
Goda K (2011) “Interevent variability of spatial correlation of peak ground motions and response spectra,” Bulletin of the Seismological Society of America, 101(5):2522-2531.
R. Foulser-Piggott and K. Goda 11
Goda K, Pomonis A, Chian S C, Offord M, Saito K, Sammonds P, Fraser S, Raby A and Macabuag J (2013) “Ground motion characteristics and shaking damage of the 11th March 2011 Mw9.0 Great East Japan earthquake,” Bulletin of Earthquake Engineering, 11(1):141-170.
Gregor N J, Addo K O, Abrahamson N A and Youngs R R (2012) “Comparison of BC Hydro subduction GMPE to data from recent large megathrust earthquakes,” In: Proceedings of the 15th World Conference on Earthquake Engineering, Lisbon, Potugal, Paper 4613.
Kramer S L and Michell R A (2006) “Ground motion intensity measures for liquefaction hazard evaluation,” Earthquake Spectra, 22(2):413-438.
Morikawa N and Fujiwara H (2013) “A new ground motion prediction equation for Japan applicable up to M9 mega-earthquake,” Journal of Disaster Research, 8(5):878-888.
Pinheiro J, Bates D, DebRoy S, Sarkar D and the R Core team (2008) “nlme: linear and nonlinear mixed effects models,” R package version 3.1-89.
Schwarz G (1978) “Estimating the dimension of a model,” The Annals of Statistics, 6(2):461-464. Zhao J X, Zhang J, Asano A, Ohno Y, Oouchi T, Takahashi T, Ogawa H, Irikura K, Thio H K, Somerville P G,
Fukushima Y and Fukushima Y (2006) “Attenuation relations of strong ground motion in Japan using site classification based on predominant period,” Bulletin of the Seismological Society of America, 96(3):898-913.