Embed Size (px)
Citation preview

New results in semileptonic beauty decays with LHCbLHCP 2016
June 16th 2016 Laurent Dufour, on behalf of the LHCb collaboration
Laurent Dufour 2
K/π/p seperation Muon identification
Δp/p = 0.4 - 0.8% (5-100 GeV/c)
The LHCb detector
Laurent Dufour
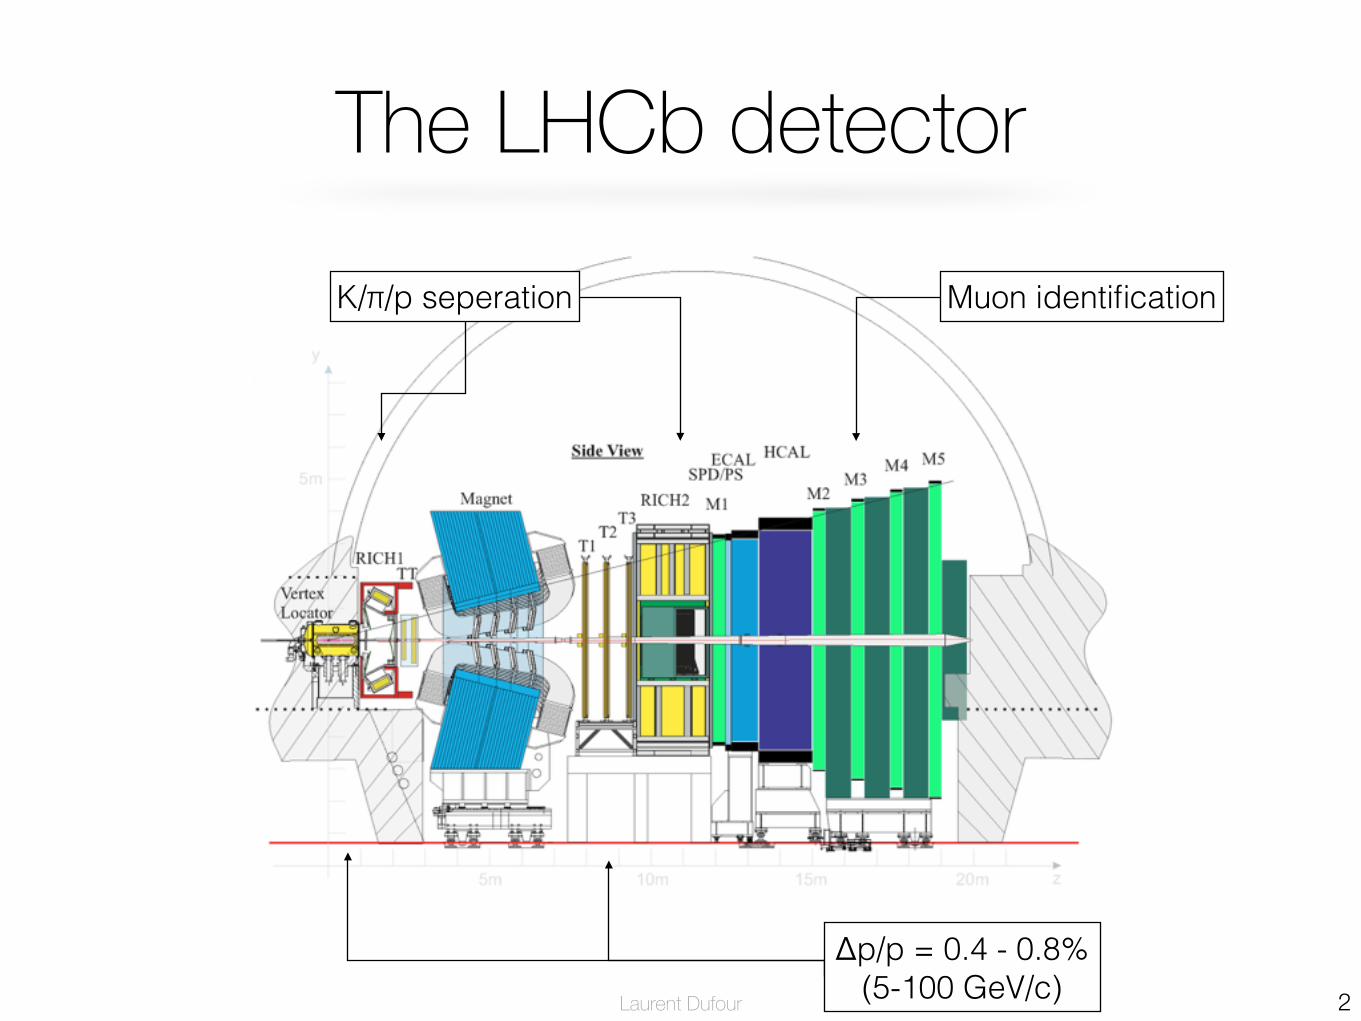
Semileptonic b-decays
What
3
b decays with a missing daughter (e.g. neutrino)
✔ Large statistics: high precision measurements❌ Technical: always partially reconstructed decays
Laurent Dufour
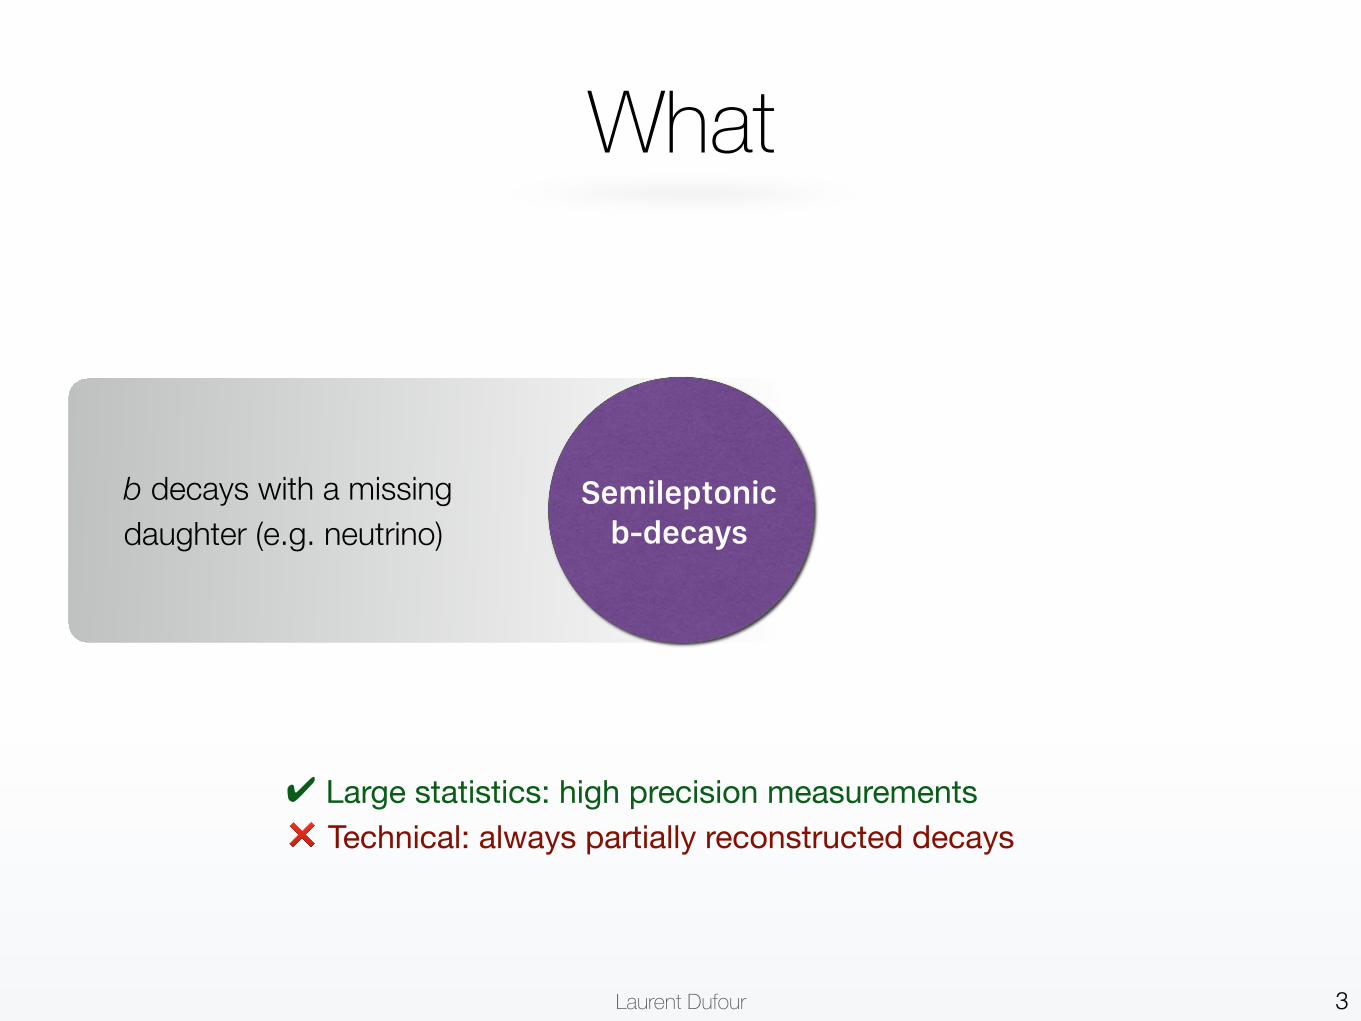
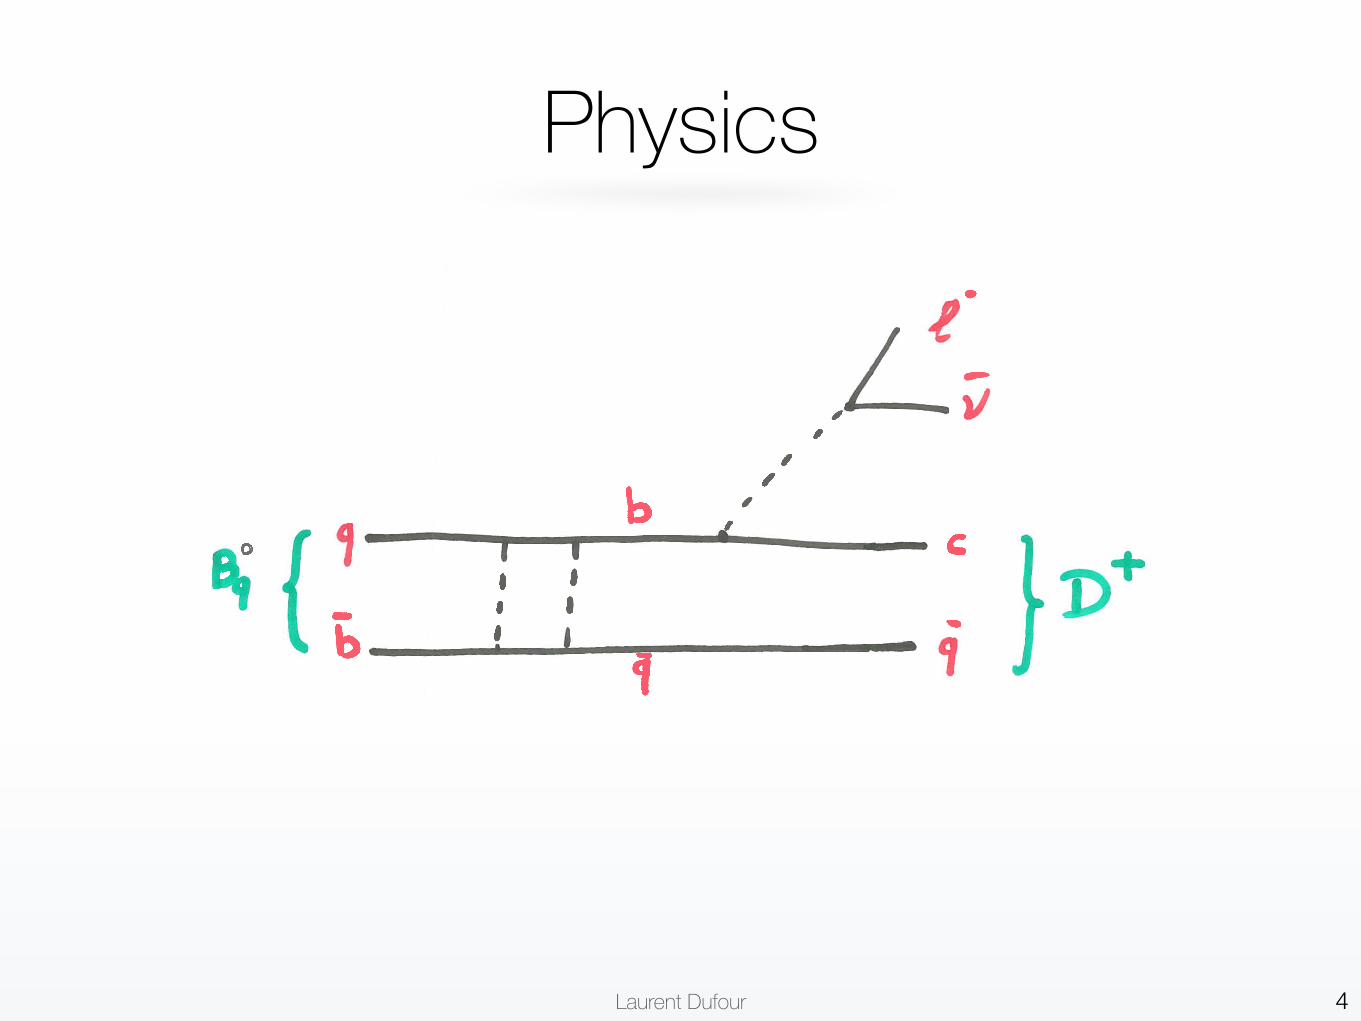
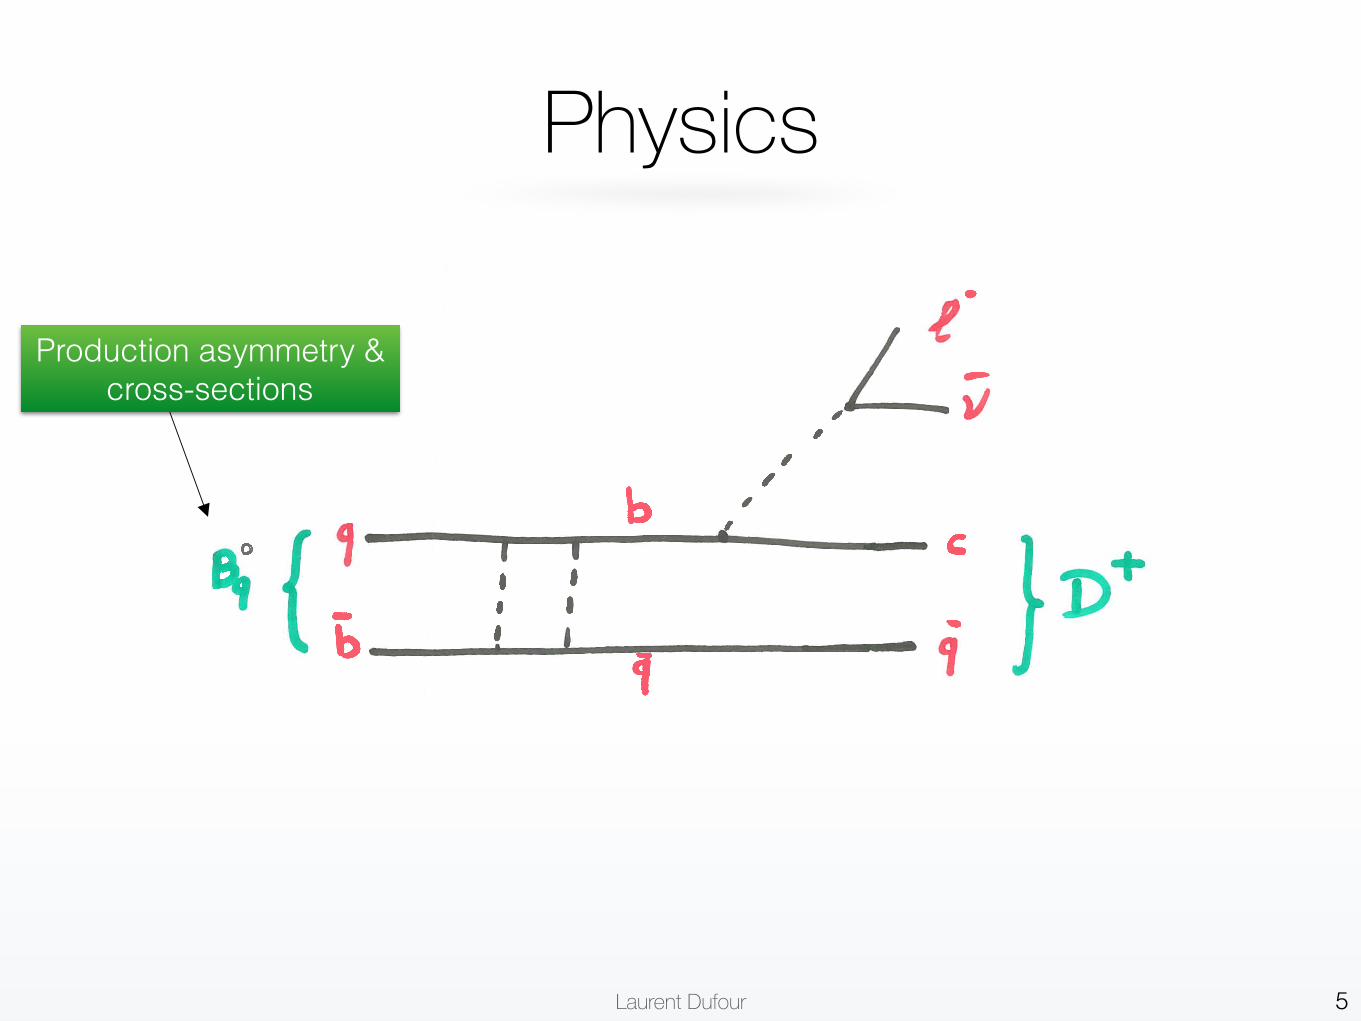
Physics
4
Laurent Dufour 5
Physics
Production asymmetry & cross-sections
Laurent Dufour 6
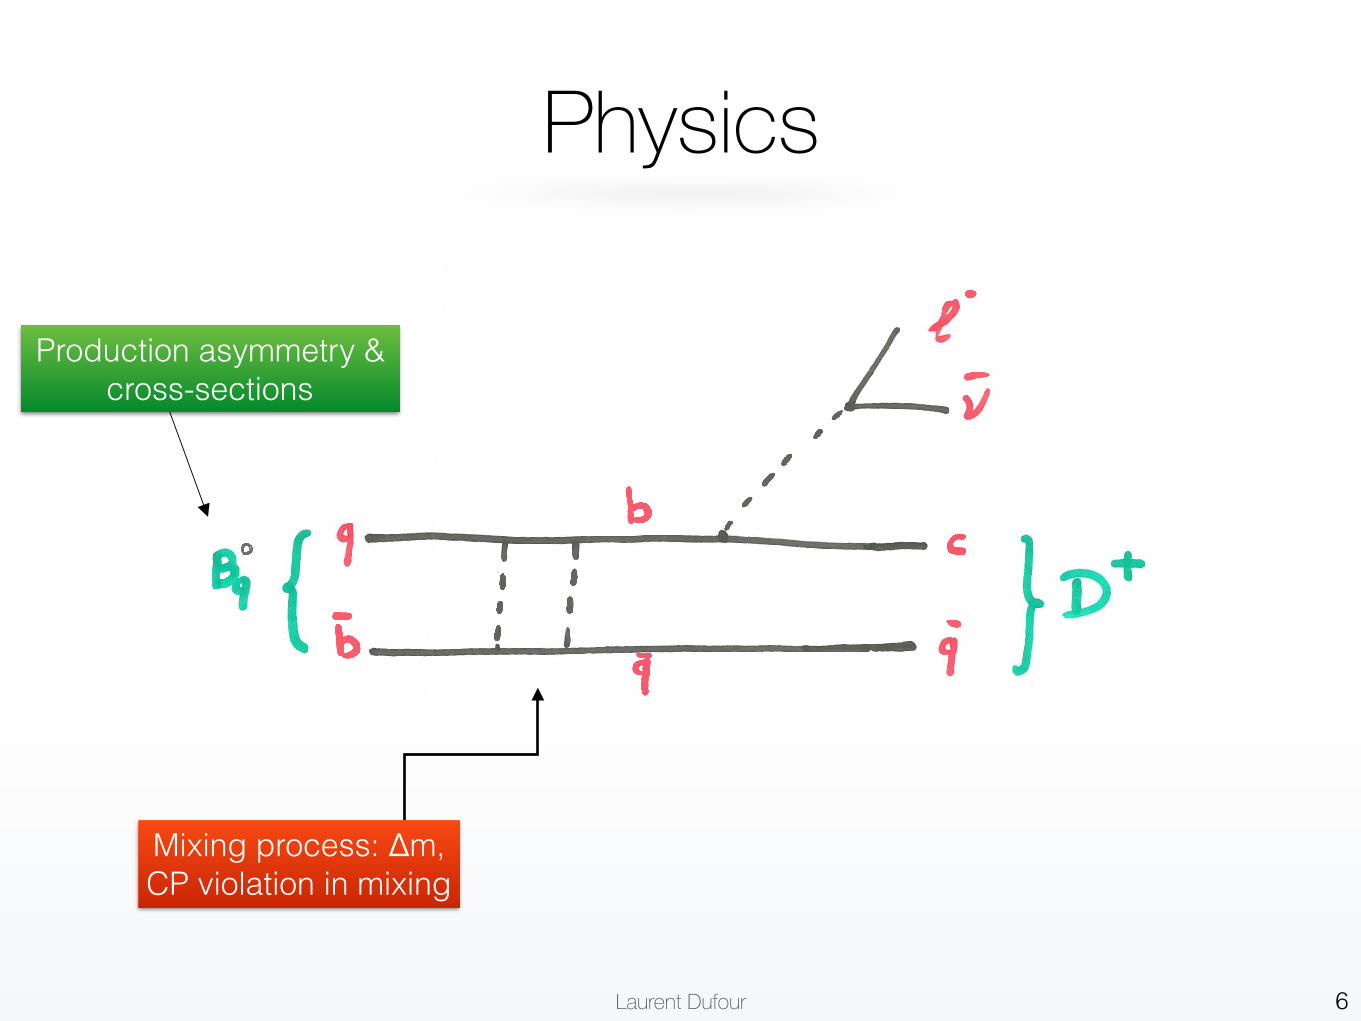
Physics
Production asymmetry & cross-sections
Mixing process: Δm, CP violation in mixing
Laurent Dufour 7
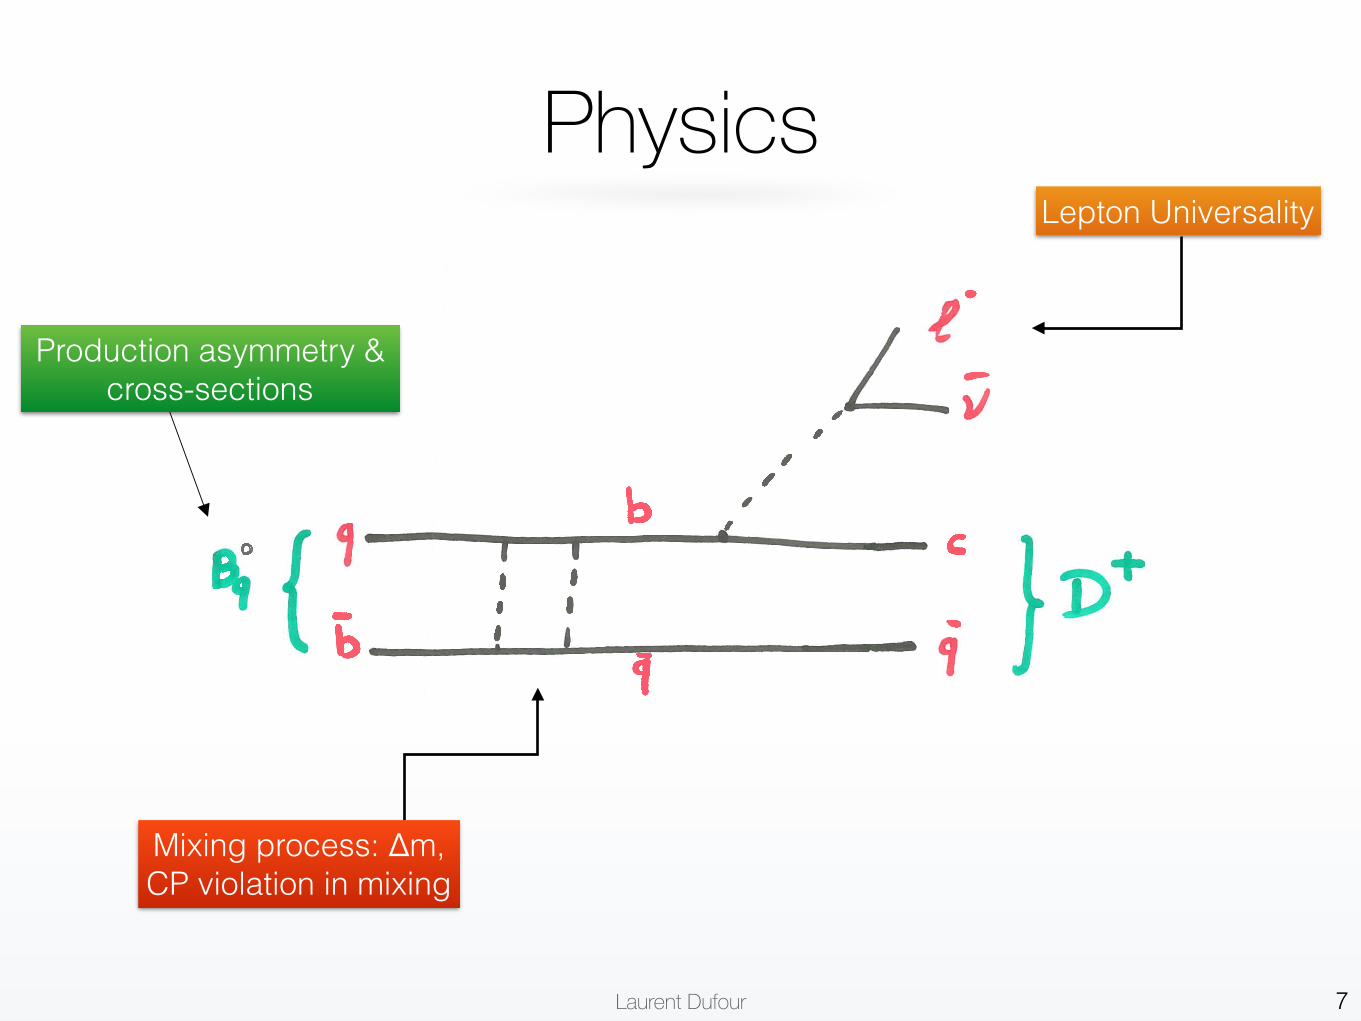
PhysicsLepton Universality
Production asymmetry & cross-sections
Mixing process: Δm, CP violation in mixing
Laurent Dufour 8
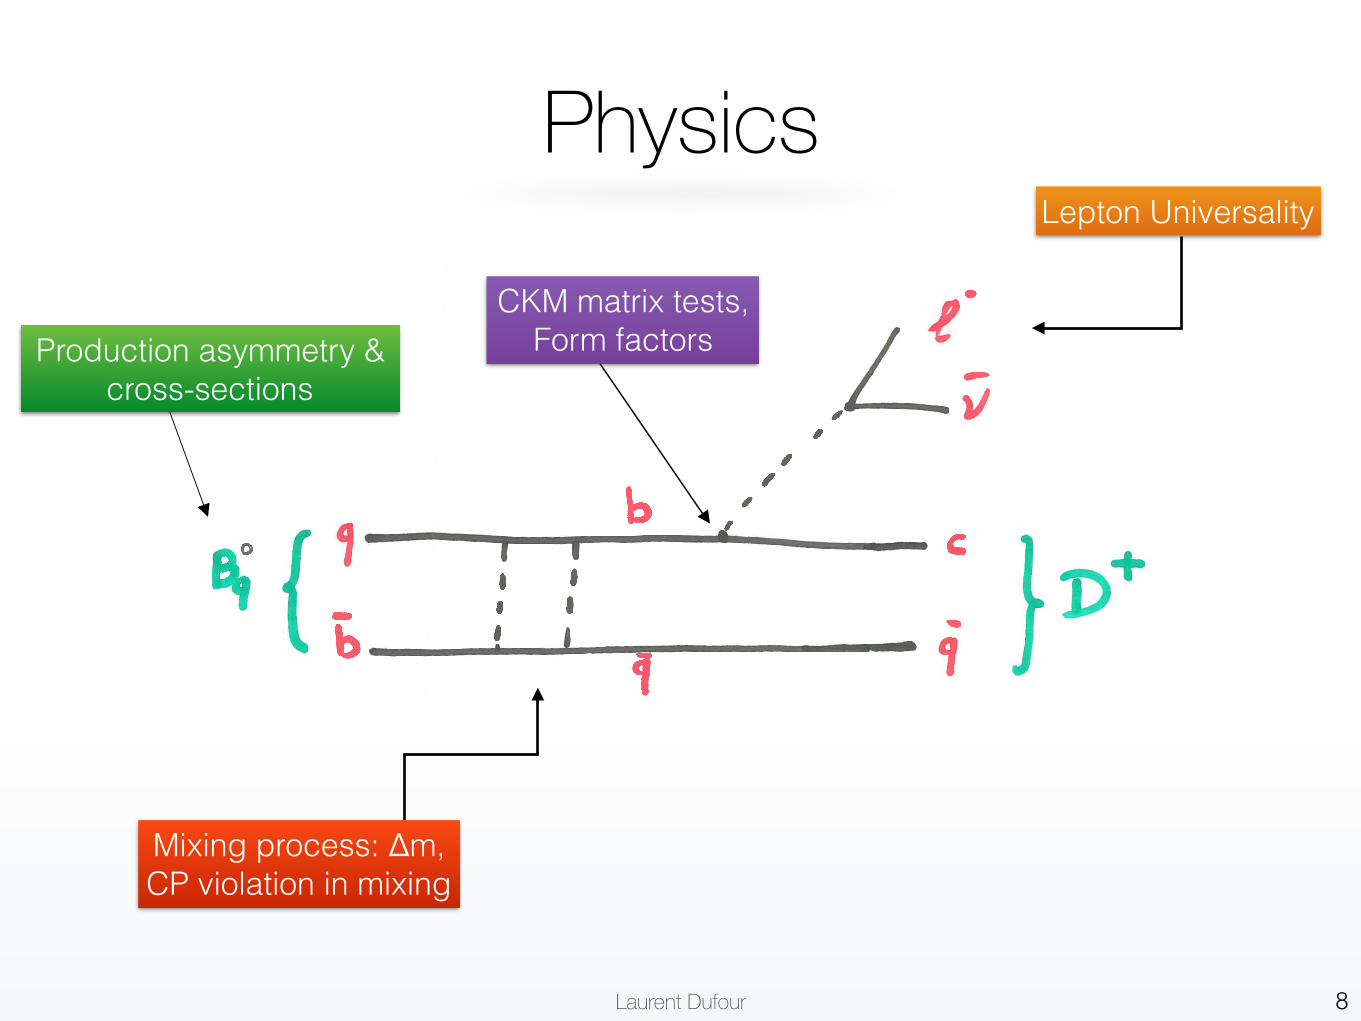
Mixing process: Δm, CP violation in mixing
Lepton Universality
CKM matrix tests, Form factors
Physics
Production asymmetry & cross-sections
Laurent Dufour 9
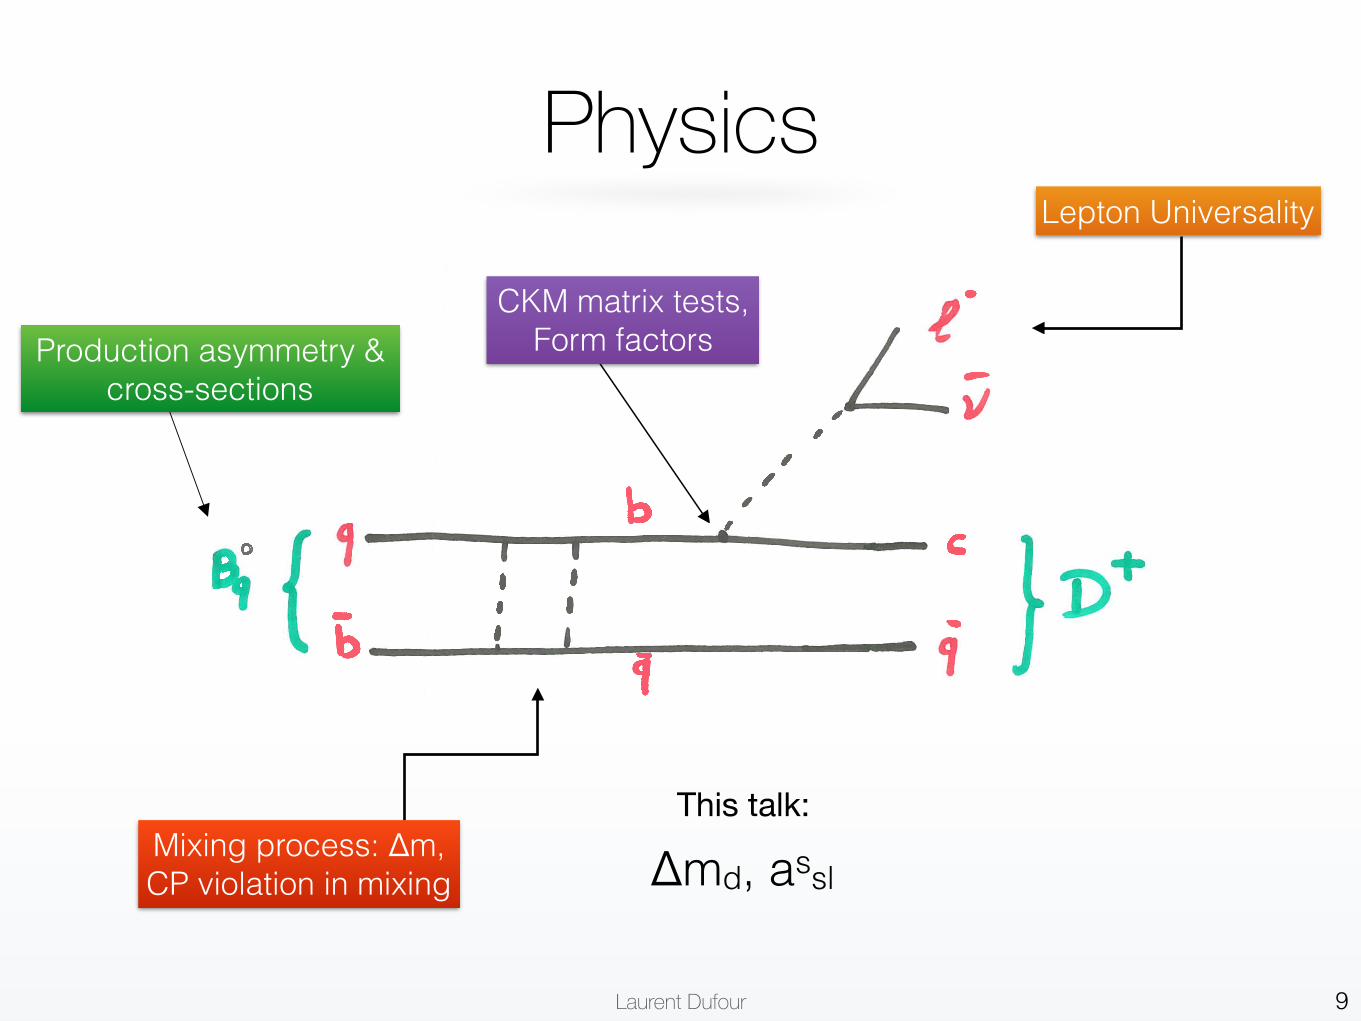
Mixing process: Δm, CP violation in mixing
Lepton Universality
CKM matrix tests, Form factors
Physics
Production asymmetry & cross-sections
This talk:
Δmd, assl
Laurent Dufour
Zooming in
10
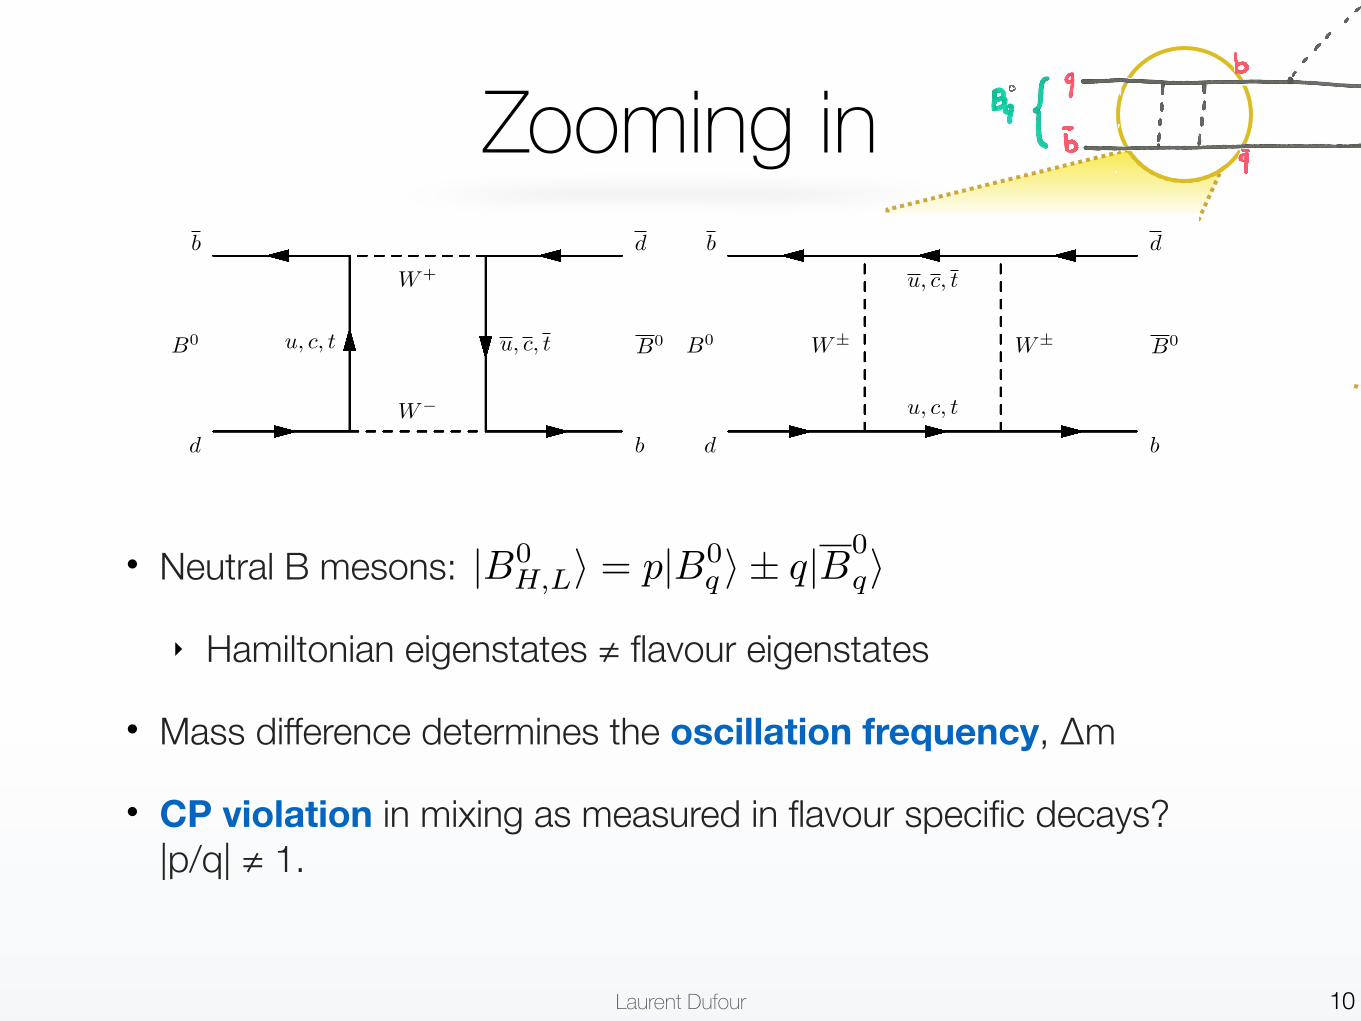
• Neutral B mesons:
‣ Hamiltonian eigenstates ≠ flavour eigenstates
• Mass difference determines the oscillation frequency, Δm
• CP violation in mixing as measured in flavour specific decays? |p/q| ≠ 1.
M. Kelsey HQL 2016
CPV in mixing
• Neutral B mesons:
⟶mass eigenstates ≠ flavor eigenstates
• ΔΓ and Δm⟶mixing
• CP violation in mixing:
⟶
3
|B0H,Li = p|B0
q i± q|B0qi
P (B ! B) 6= P (B ! B)P (B ! B) 6= P (B ! B)
|q/p| 6= 1
Theory
• Flavour oscillation(mixing) through electroweak interaction in neutral B mesons
B0 B0
W�
u, c, t
W+
u, c, t
d b
b d
B0 B0
u, c, t
W± W±
u, c, t
d b
b d
• Physics states |BH,LÍ = p|B0Í û q|B0Í (p2 + q
2 = 1)
• Mass di�erence between the two physics states: �m
d
= mH ≠ mL
• Flavour at production is the flavour of the state at t = 0
• Flavour at decay the flavour of the state at decay time t
B. Khanji, LHCb (Milano-Bicocca, INFN, CERN) �m
d
at LHCb 22-March-2016 11 / 40
Laurent Dufour 11
CERN-EP-2016-084
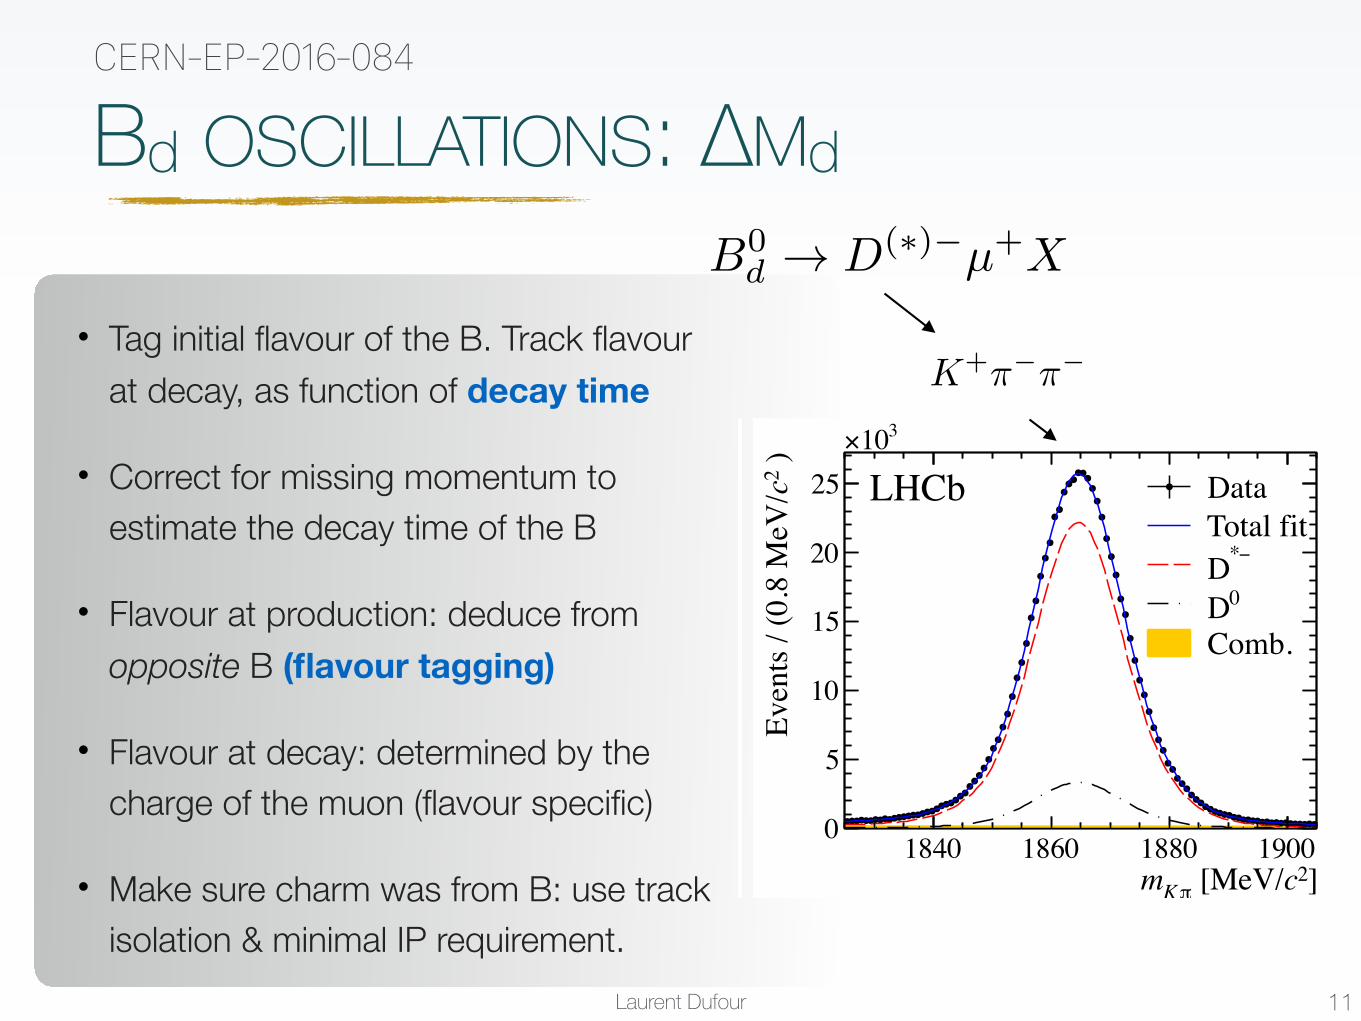
• Tag initial flavour of the B. Track flavour at decay, as function of decay time
• Correct for missing momentum to estimate the decay time of the B
• Flavour at production: deduce from opposite B (flavour tagging)
• Flavour at decay: determined by the charge of the muon (flavour specific)
• Make sure charm was from B: use track isolation & minimal IP requirement.
]2c [MeV/πKm1840 1860 1880 1900
)2 cEv
ents
/ (0
.8 M
eV/
0
2
4
6
8
10
310×
LHCb Data Total fit
−* D0 D
Comb.
]2c [MeV/πKm1840 1860 1880 1900
)2 cEv
ents
/ (0
.8 M
eV/
0
5
10
15
20
25
310×
LHCb Data Total fit
−* D0 D
Comb.
]2c [MeV/mδ140 145 150 155
)2 cEv
ents
/ ( 0
.125
MeV
/
0
5
10
15
20
310×
LHCb Data Total fit
−* D0 D
Comb.
]2c [MeV/mδ140 145 150 155
)2 cEv
ents
/ ( 0
.125
MeV
/
10
20
30
40
310×
LHCb Data Total fit
−* D0 D
Comb.
Figure 2: Distributions of (top) mK⇡
and (bottom) �m for B0! D⇤�µ+⌫µ
X candidates in (left)2011 and (right) 2012 data. Projections of the fit function are superimposed for (blue continuousline) the full PDF and its components: (red dashed line) signal D⇤� from B0 or B+ decays,(black dashed-dotted line) D0 from B and (filled yellow area) combinatorial backgrounds.
of 0.5% and 0.4% on the B+ fractions for B0! D�µ+⌫µ
X and B0! D⇤�µ+⌫µ
X. In thedecay time fit, the B+ fractions are kept fixed. The statistical and systematic uncertaintieson ↵
B
+ lead to a systematic uncertainty on �md
, which is reported in Sec. 5.The oscillation frequency �m
d
is determined from a binned maximum likelihood fitto the distribution of the B0 decay time t of candidates classified as mixed (q = �1) orunmixed (q = 1) according to the flavour of the B0 meson at production and decay time.
The total PDF for the fit is given by
P(t, q) = S(t, q) + ↵B+B+(t, q) , (3)
6
B0d ! D(⇤)�µ+X
K+⇡�⇡�
Bd OSCILLATIONS: ΔMd
Laurent Dufour 12
CERN-EP-2016-084
1 Introduction
Flavour oscillation, or mixing, of neutral meson systems gives mass eigenstates that aredi↵erent from flavour eigenstates. In the B0–B0 system, the mass di↵erence between masseigenstates, �m
d
, is directly related to the square of the product of the CKM matrixelements V
tb
and V ⇤td
, and is therefore sensitive to fundamental parameters of the StandardModel [1]. Measurements of B0 mixing were published for the first time by UA1 [2] andARGUS [3]. Several measurements of �m
d
have been performed by experiments at LEP,SLC and the Tevatron [4–6], the B Factories [7, 8] and, most recently, at LHCb [9–11],resulting in a world average value �m
d
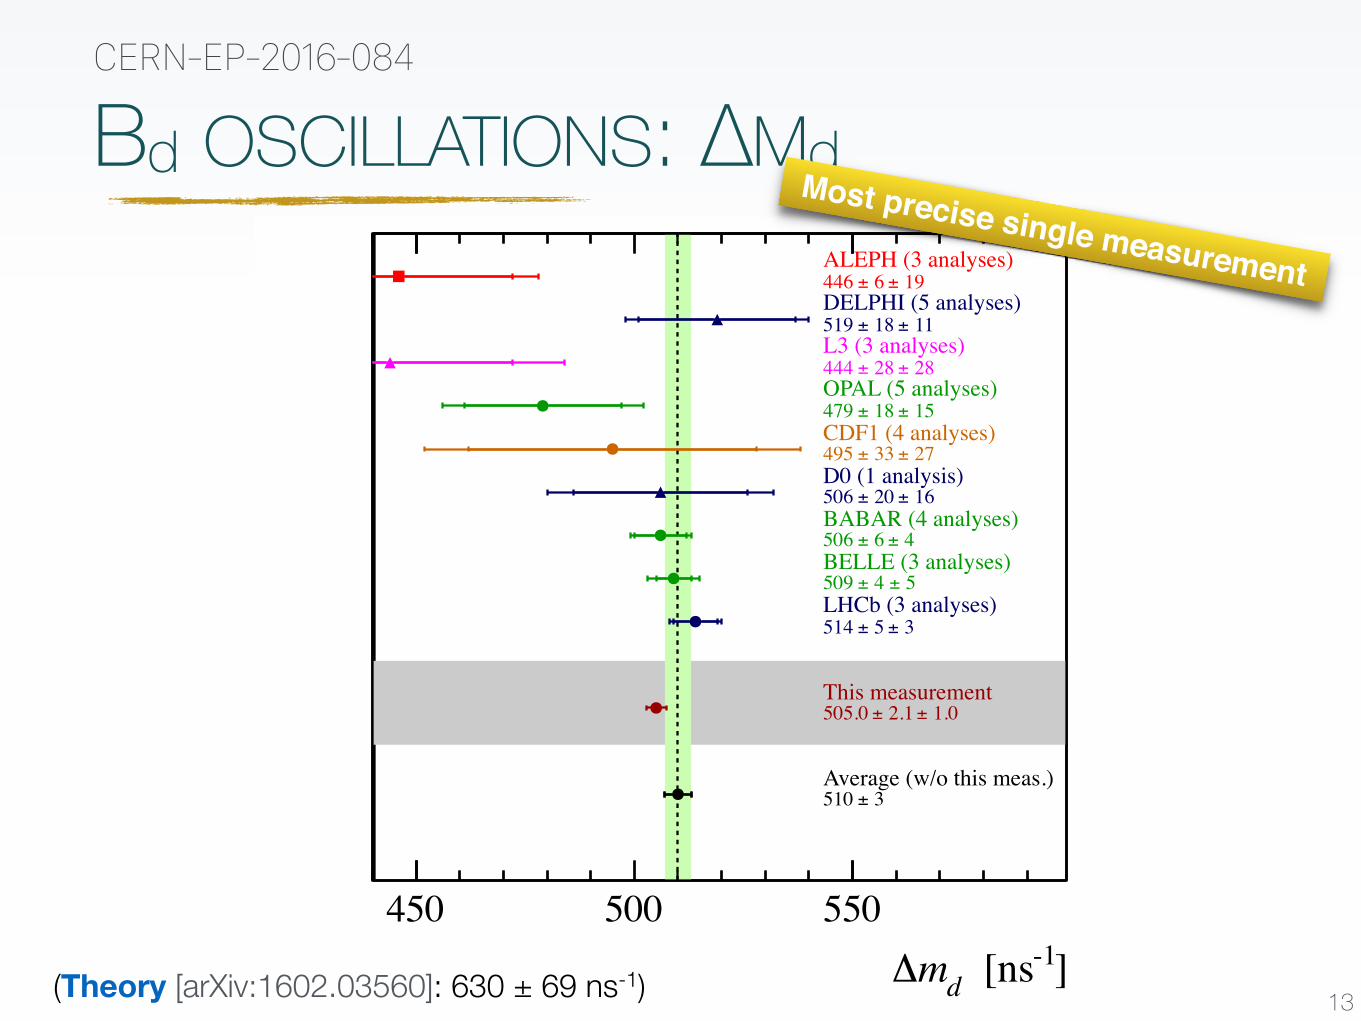
= (510± 3) ns�1, which has a relative precisionof 0.6% [12]. This paper reports a measurement of �m
d
based on B0 ! D�µ+⌫µ
Xand B0! D⇤�µ+⌫
µ
X decays,1 where X indicates any additional particles that are notreconstructed. The data sample used for this measurement was collected at LHCb duringLHC Run 1 at
ps =7 (8)TeV in 2011 (2012), corresponding to integrated luminosities of
1.0 (2.0) fb�1.The relatively high branching fraction for semileptonic decays of B0 mesons, along
with the highly e�cient lepton identification and flavour tagging capabilities at LHCb,results in abundant samples of B0 ! D(⇤)�µ+⌫
µ
X decays, where the flavour of the B0
meson at the time of production and decay can be inferred. In addition, the decay time tof B0 mesons can be determined with adequate resolution, even though the decay is notfully reconstructed because of undetected particles. It is therefore possible to preciselymeasure the oscillation frequency �m
d
from a time-dependent analysis of the decay ratesof unmixed and mixed events,
Nunmix(t) ⌘ N(B0! D(⇤)�µ+⌫µ
X)(t) / e��dt[1 + cos(�md
t)] ,
Nmix(t) ⌘ N(B0 ! B0! D(⇤)+µ�⌫µ
X)(t) / e��dt[1� cos(�md
t)] , (1)
where the state assignment is based on the flavours of the B0 meson at production anddecay, which may be the same (unmixed) or opposite (mixed). In Eq. 1, �
d
= 1/⌧B
0 is thedecay width of the B0 meson, ⌧
B
0 being its lifetime. The di↵erence in the decay widths ofthe mass eigenstates, ��
d
, is assumed to be zero, and CP violation in mixing is neglected.The flavour asymmetry between unmixed and mixed events is
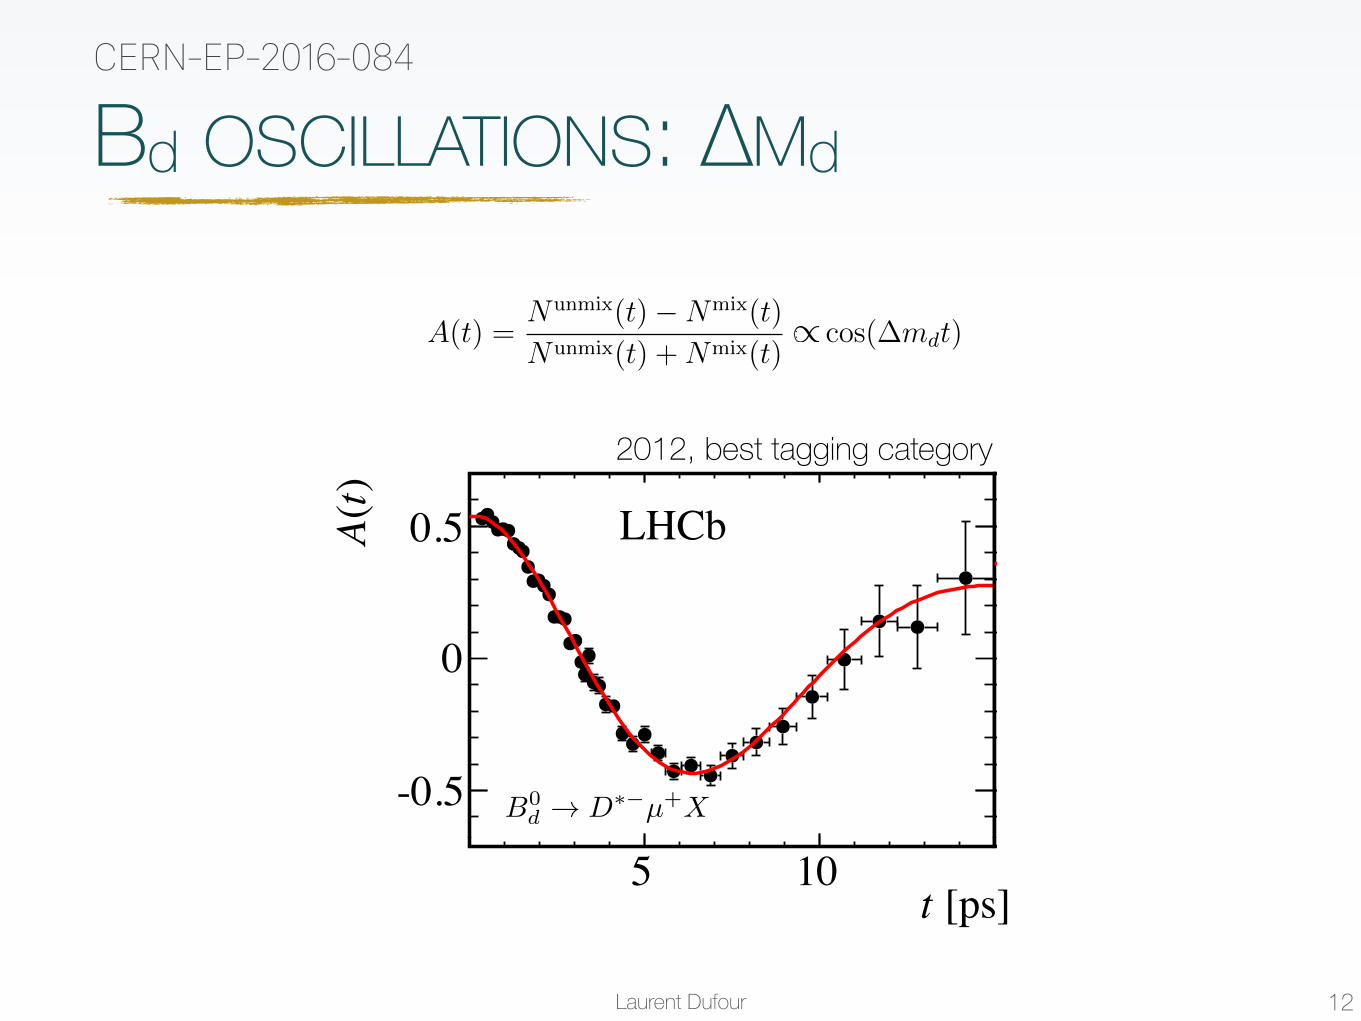
A(t) =Nunmix(t)�Nmix(t)
Nunmix(t) +Nmix(t)= cos(�m
d
t) . (2)
A description of the LHCb detector and the datasets used in this measurement is givenin Sec. 2. Section 3 presents the selection criteria, the flavour tagging algorithms, andthe method chosen to reconstruct the B0 decay time. The fitting strategy and results aredescribed in Sec. 4. A summary of the systematic uncertainties is given in Sec. 5, andconclusions are reported in Sec. 6.
1The inclusion of charge-conjugate processes is implied throughout.
1
5 10
-0.5
0
0.5 LHCb
(a)
5 10
-0.5
0
0.5
(c)
5 10
-0.5
0
0.5
(b)
5 10
-0.5
0
0.5
(d)
)t(A [ps]t
5 10
-0.5
0
0.5 LHCb
(e)
5 10
-0.5
0
0.5
(g)
5 10
-0.5
0
0.5
(f)
5 10
-0.5
0
0.5
(h)
)t(A
[ps]t
Figure 6: Mixing asymmetry projections in the four tagging categories for (top plots) B0 !D�µ+⌫
µ
X and (bottom plots) B0! D⇤�µ+⌫µ
X for 2012 data. The average mistag per categoryincreases when going from (a) to (d), and from (e) to (h).
11
5 10
-0.5
0
0.5 LHCb
(a)
5 10
-0.5
0
0.5
(c)
5 10
-0.5
0
0.5
(b)
5 10
-0.5
0
0.5
(d)
)t(A
[ps]t
5 10
-0.5
0
0.5 LHCb
(e)
5 10
-0.5
0
0.5
(g)
5 10
-0.5
0
0.5
(f)
5 10
-0.5
0
0.5
(h)
)t(A
[ps]t
Figure 6: Mixing asymmetry projections in the four tagging categories for (top plots) B0 !D�µ+⌫
µ
X and (bottom plots) B0! D⇤�µ+⌫µ
X for 2012 data. The average mistag per categoryincreases when going from (a) to (d), and from (e) to (h).
11
5 10
-0.5
0
0.5 LHCb
(a)
5 10
-0.5
0
0.5
(c)
5 10
-0.5
0
0.5
(b)
5 10
-0.5
0
0.5
(d))t(A
[ps]t
5 10
-0.5
0
0.5 LHCb
(e)
5 10
-0.5
0
0.5
(g)
5 10
-0.5
0
0.5
(f)
5 10
-0.5
0
0.5
(h)
)t(A
[ps]t
Figure 6: Mixing asymmetry projections in the four tagging categories for (top plots) B0 !D�µ+⌫
µ
X and (bottom plots) B0! D⇤�µ+⌫µ
X for 2012 data. The average mistag per categoryincreases when going from (a) to (d), and from (e) to (h).
11
B0d ! D⇤�µ+X
2012, best tagging category
/
Bd OSCILLATIONS: ΔMd
Laurent Dufour]-1 [nsdm∆
450 500 550
ALEPH (3 analyses) 19± 6 ±446
DELPHI (5 analyses) 11± 18 ±519
L3 (3 analyses) 28± 28 ±444
OPAL (5 analyses) 15± 18 ±479
CDF1 (4 analyses) 27± 33 ±495
D0 (1 analysis) 16± 20 ±506
BABAR (4 analyses) 4± 6 ±506
BELLE (3 analyses) 5± 4 ±509
LHCb (3 analyses) 3± 5 ±514
<0.66) +BABAR (P 0.25 + 0.26 - 0.25±4.15
This measurement 1.0± 2.1 ±505.0
BABAR (p*>1.3GeV) 0.27 + 0.19 - 0.21±4.32
Average (w/o this meas.) 3±510
HFAGSummer 2014
Bosch, Lange, Neubert and Paz (BLNP)Phys.Rev.D72:073006,2005/dof = 9.2/11 (CL = 61.00 %)2χ
Bd OSCILLATIONS: ΔMd
13
CERN-EP-2016-084
Most precise single measurement
(Theory [arXiv:1602.03560]: 630 ± 69 ns-1)
Laurent Dufour
CP VIOLATION IN B-B MIXING
14
CERN-EP-2016-133 & CERN-PH-EP-2014-237
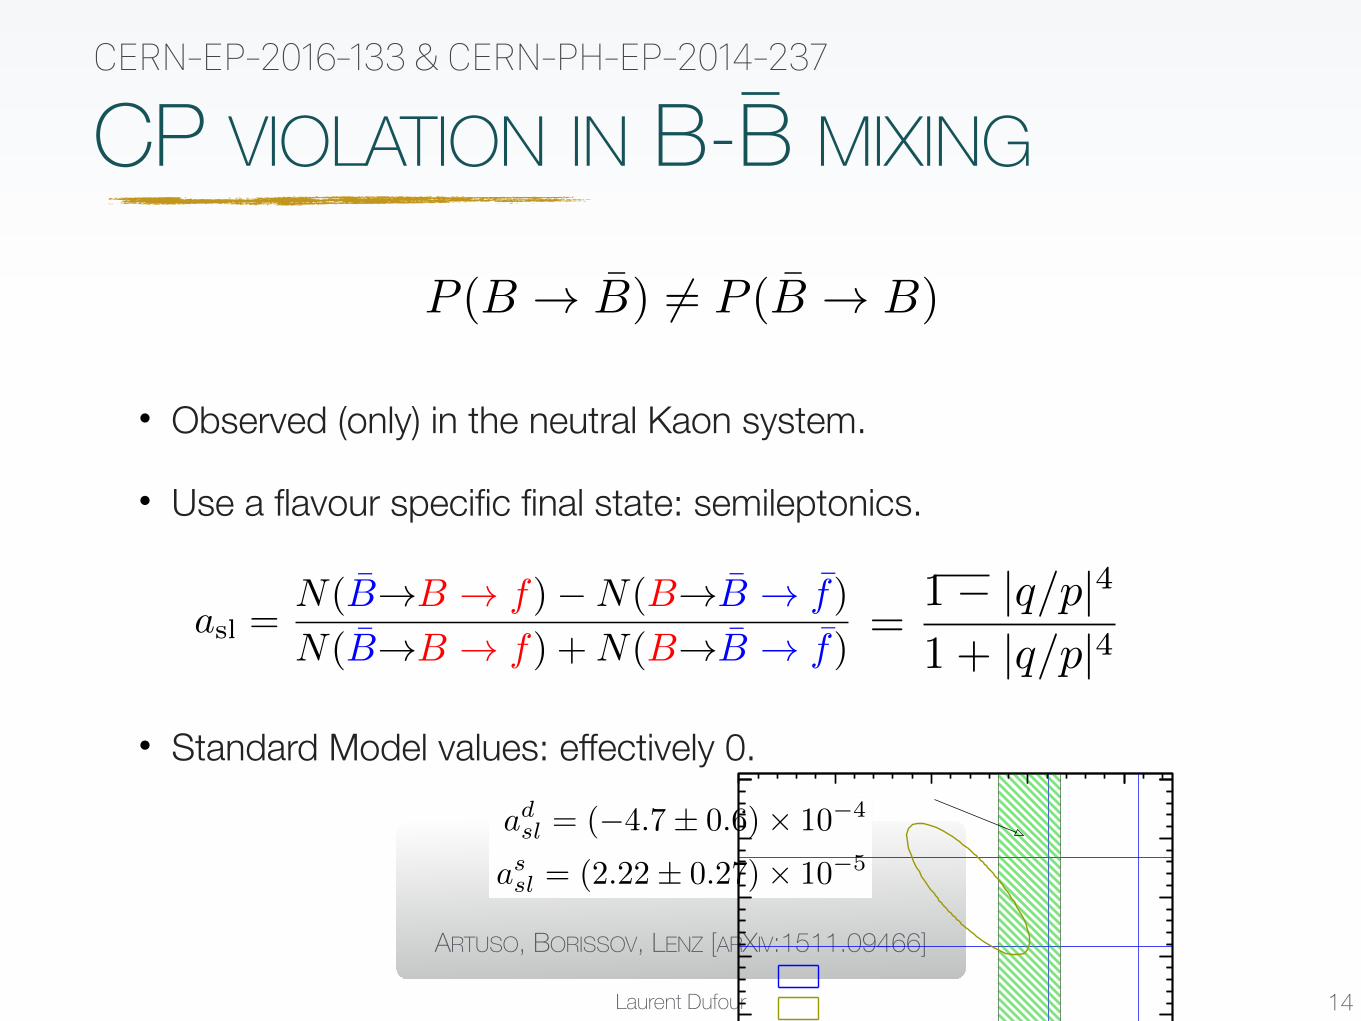
• Observed (only) in the neutral Kaon system.
• Use a flavour specific final state: semileptonics.
• Standard Model values: effectively 0.
P (B ! B̄) 6= P (B̄ ! B)
M. Kelsey HQL 2016
The semileptonic CP asymmetry
• CP asymmetry in mixing:
• Inclusive semileptonic final state (flavor-specific)
• Two neutral B mesons ⟶ ⟶
• From SM:
4
adsl = (�4.7± 0.6)⇥ 10�4
assl = (2.22± 0.27)⇥ 10�5
Artuso, Borissov, Lenz [arXiv:1511.09466]
aqsl =�(B(t) ! f)� �(B(t) ! f)
�(B(t) ! f) + �(B(t) ! f)=
1� (q/p)4
1 + (q/p)4⇡ ��q
�mqtan(�q
12)
P (B ! B) 6= P (B ! B)
(q=d,s)
Tiny! Possible enhancement
from NP
B0s : assl
B0 : adsl
ARTUSO, BORISSOV, LENZ [ARXIV:1511.09466]
[%]dsla
-3 -2 -1 0 1
[%]
s sla
-4
-3
-2
-1
0
1
D0D0 dimuon
factoriesB
Standard Model
Semileptonic CP asymmetries
• Using semileptonic flavor specific B meson decays:
TINY!!!
• SM predictions:
assl = (1.9± 0.3)� 10�5
adsl = (�4.1± 0.6)⇥ 10�4
asl =N(B̄!B ! f)�N(B!B̄ ! f̄)
N(B̄!B ! f) +N(B!B̄ ! f̄)
• Experimental landscape without LHCb
B0
B0
ff
B0
New asymmetries (and ⇥�d ) measurements needed arXiv:1409.6963
12
=1� |q/p|4
1 + |q/p|4
Laurent Dufour
S.L. MIXING ASYMMETRY: aSL
15
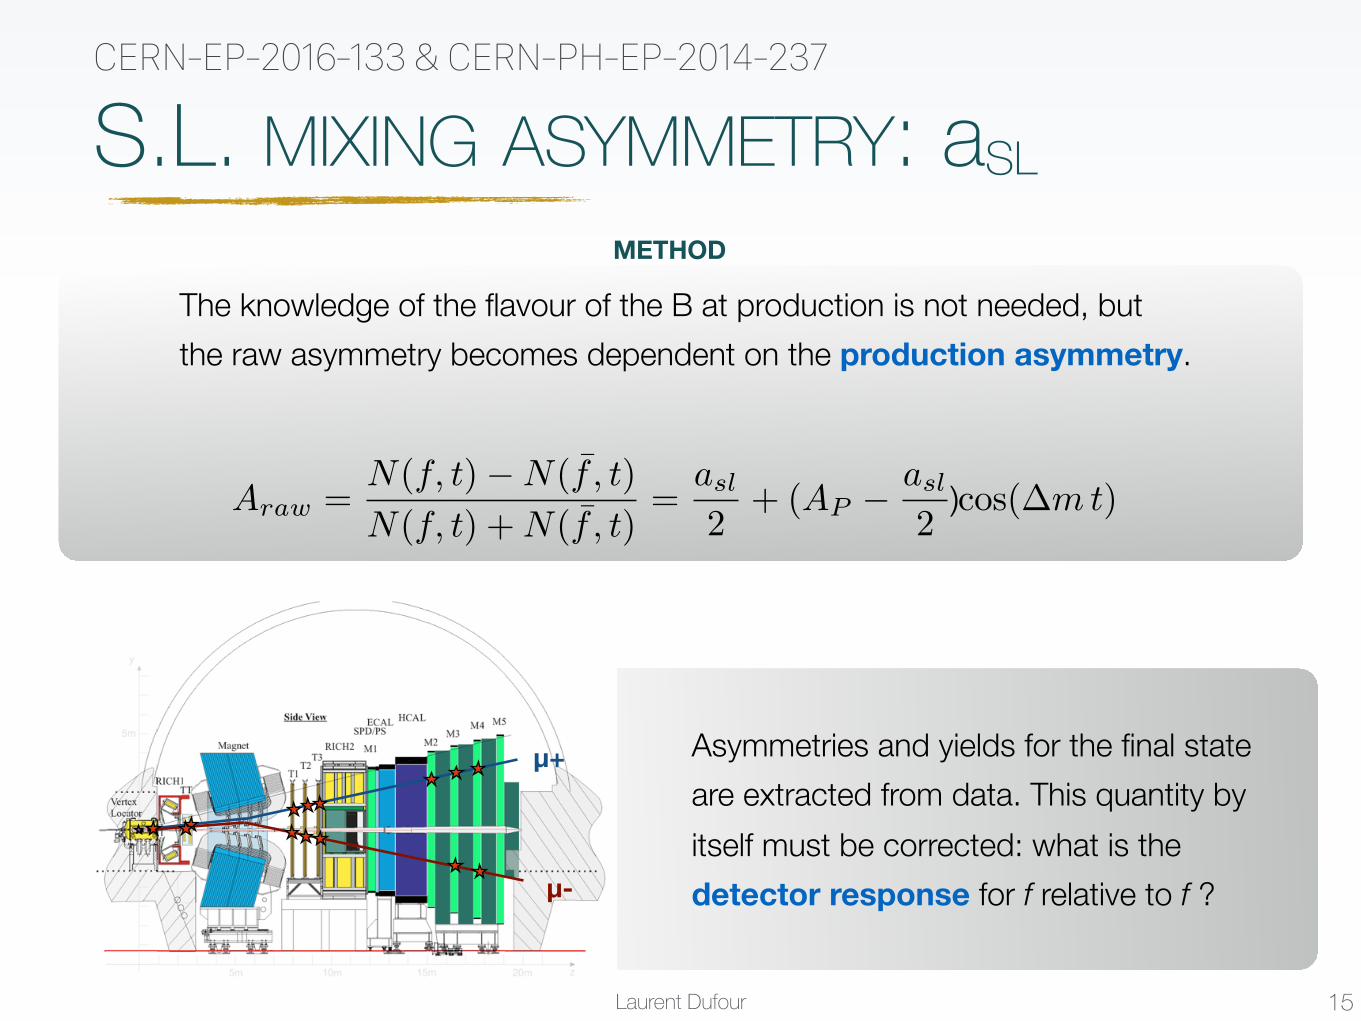
Asymmetries and yields for the final state are extracted from data. This quantity by itself must be corrected: what is the detector response for f relative to f ?
METHOD
The knowledge of the flavour of the B at production is not needed, but the raw asymmetry becomes dependent on the production asymmetry.
µ+
µ-
CERN-EP-2016-133 & CERN-PH-EP-2014-237
Araw =
N(f, t)�N(
¯f, t)
N(f, t) +N(
¯f, t)=
asl2
+ (AP � asl2
cos(�mt)))
Laurent Dufour 16
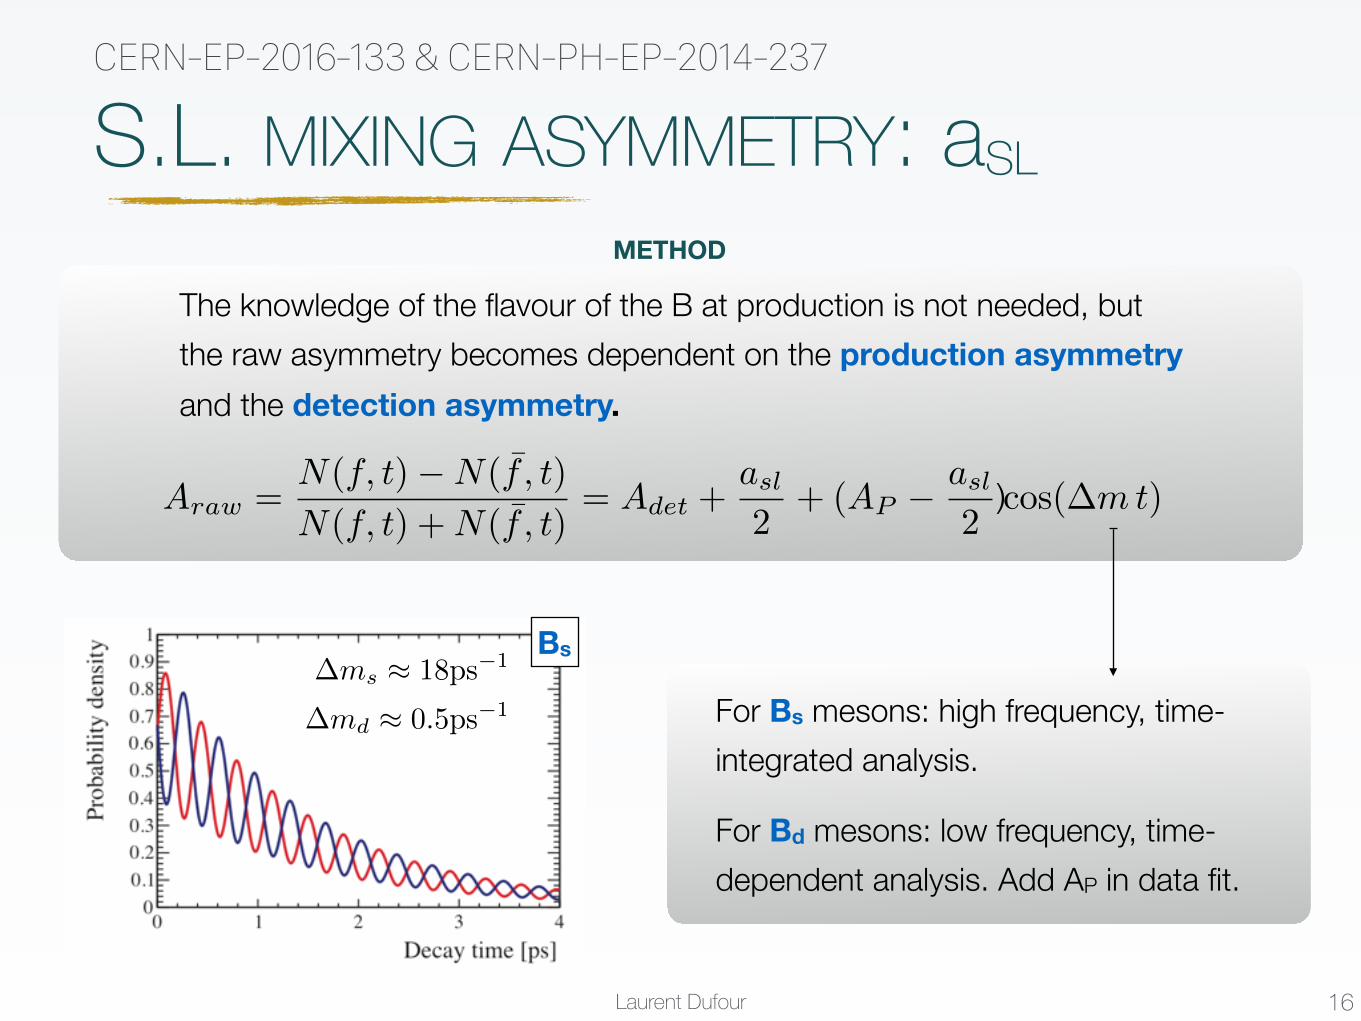
METHOD
The knowledge of the flavour of the B at production is not needed, but the raw asymmetry becomes dependent on the production asymmetry and the detection asymmetry.
For Bs mesons: high frequency, time-integrated analysis.
For Bd mesons: low frequency, time-dependent analysis. Add AP in data fit.
Bs
CERN-EP-2016-133 & CERN-PH-EP-2014-237
Araw =
N(f, t)�N(
¯f, t)
N(f, t) +N(
¯f, t)= Adet +
asl2
+ (AP � asl2
cos(�mt))
S.L. MIXING ASYMMETRY: aSL
�ms ⇡ 18ps�1
�md ⇡ 0.5ps�1
)
Laurent Dufour
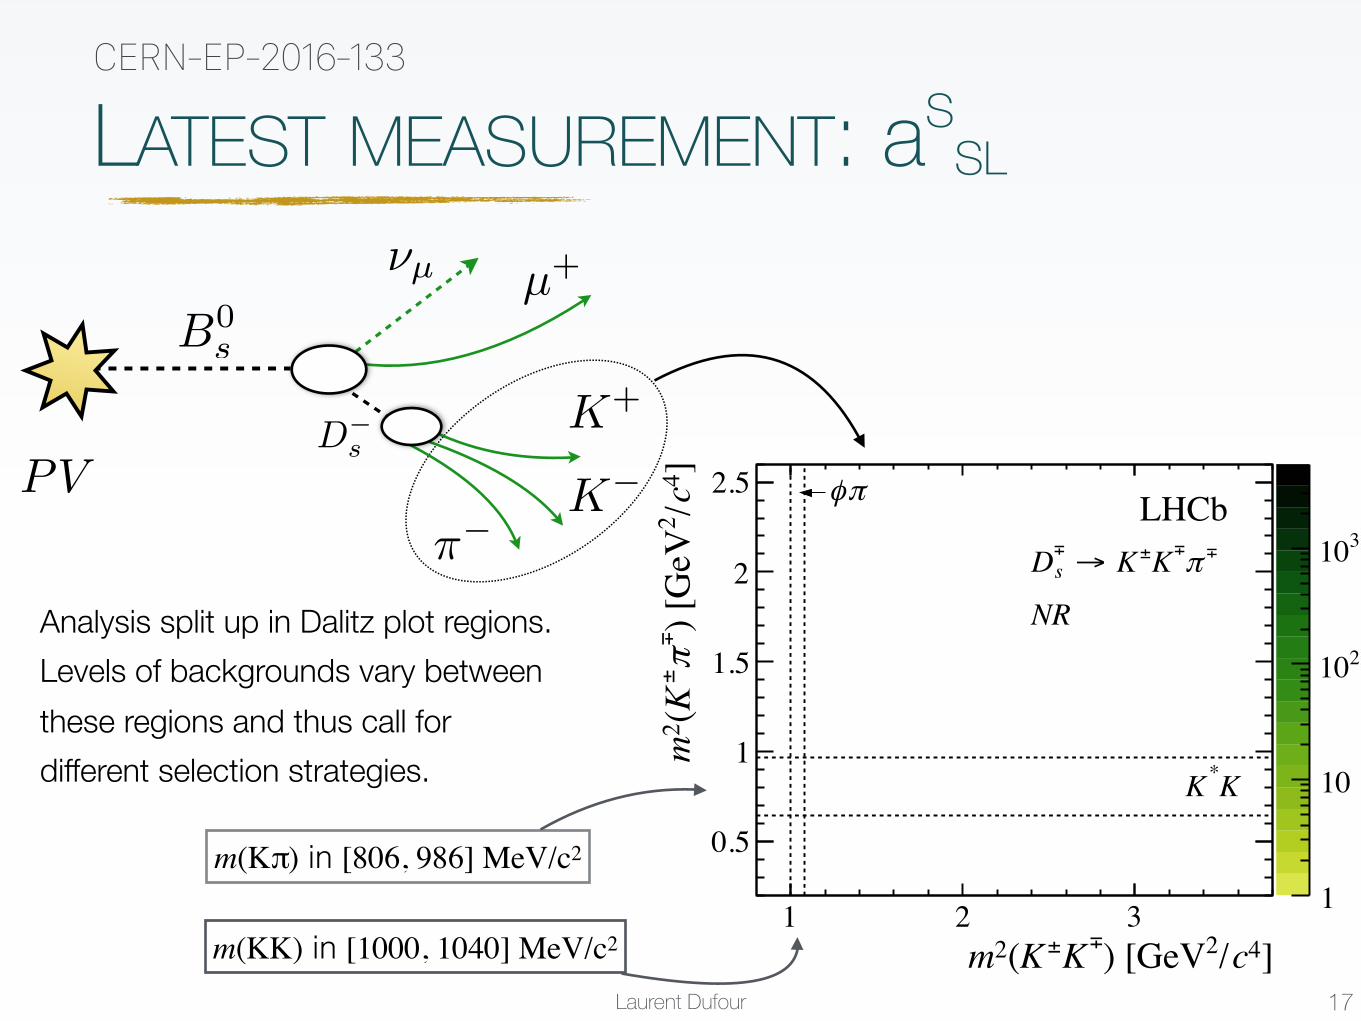
LATEST MEASUREMENT: aSSL
17
CERN-EP-2016-133
Analysis split up in Dalitz plot regions. Levels of backgrounds vary between these regions and thus call for different selection strategies.
m(Kπ) in [806, 986] MeV/c2
m(KK) in [1000, 1040] MeV/c2 ]4c/2) [GeV
±
K±K(2m1 2 3
]4 c/2) [
GeV
±π±
K(2m
0.5
1
1.5
2
2.5
1
10
210
310
πφ
K*K
NR
±
π
±
K±K →
±
sDLHCb
PV
B0s
D�s
K+
µ+⌫µ
K�
⇡�
Laurent Dufour
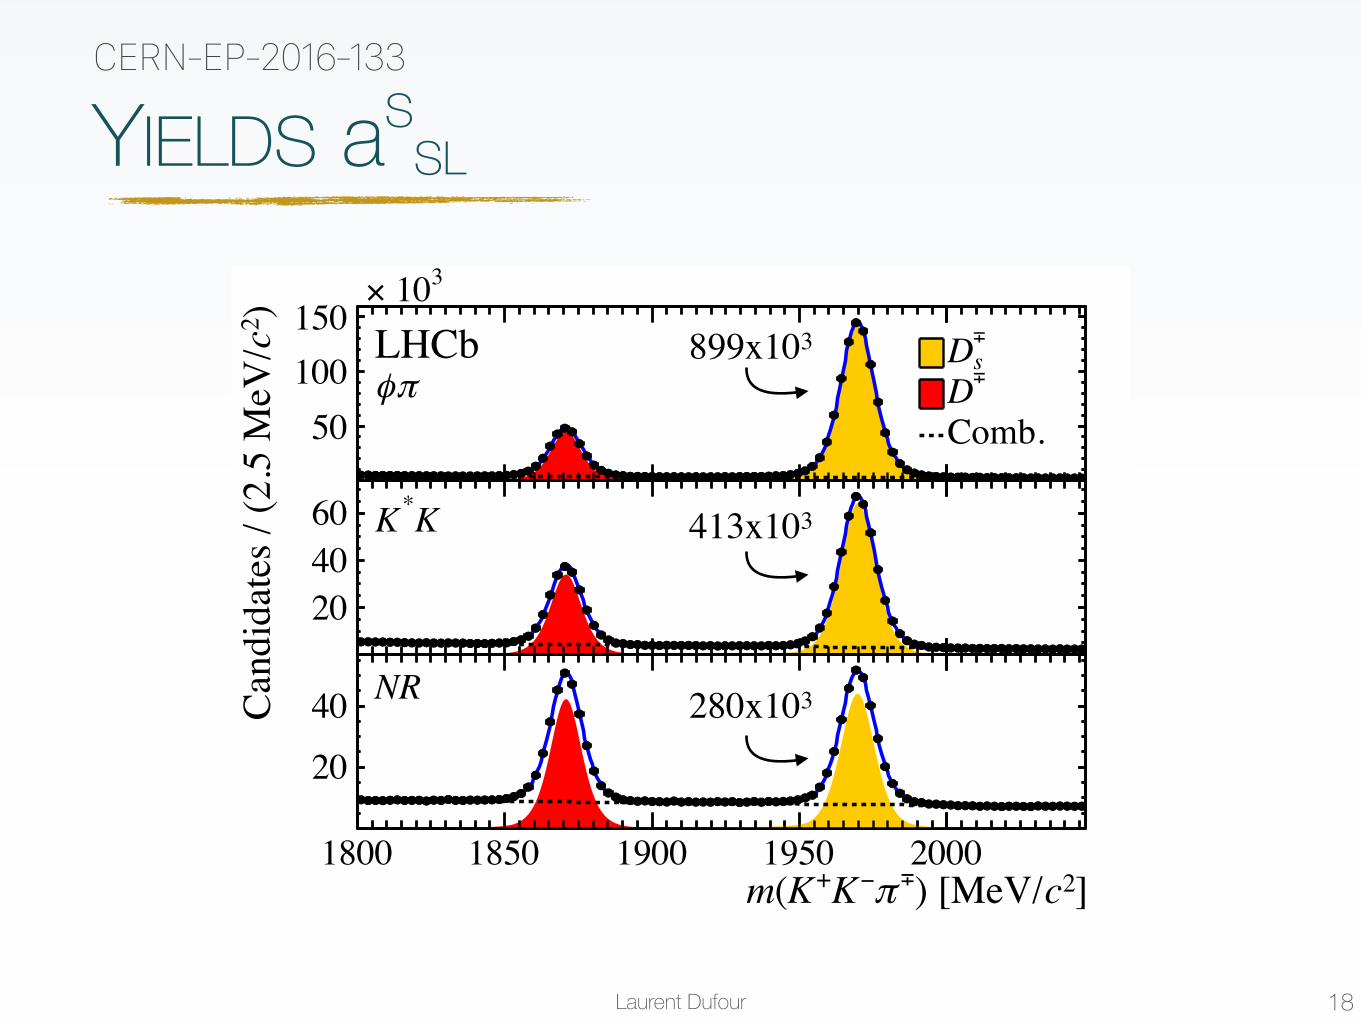
YIELDS aSSL
18
CERN-EP-2016-133
)_PhiPi (MeV)+π+K-(KinvM1800 1850 1900 1950 2000
)2 cC
andi
date
s / (2
.5 M
eV/
50100150
)_KStarK (MeV)+π+K-(KinvM1800 1850 1900 1950 2000
204060
]2c) [MeV/
±
π−K+K(m1800 1850 1900 1950 2000
20
40±
sD ±
DComb.
LHCb
3 10×
πφ
K*K
NR
899x103
413x103
280x103
Laurent Dufour
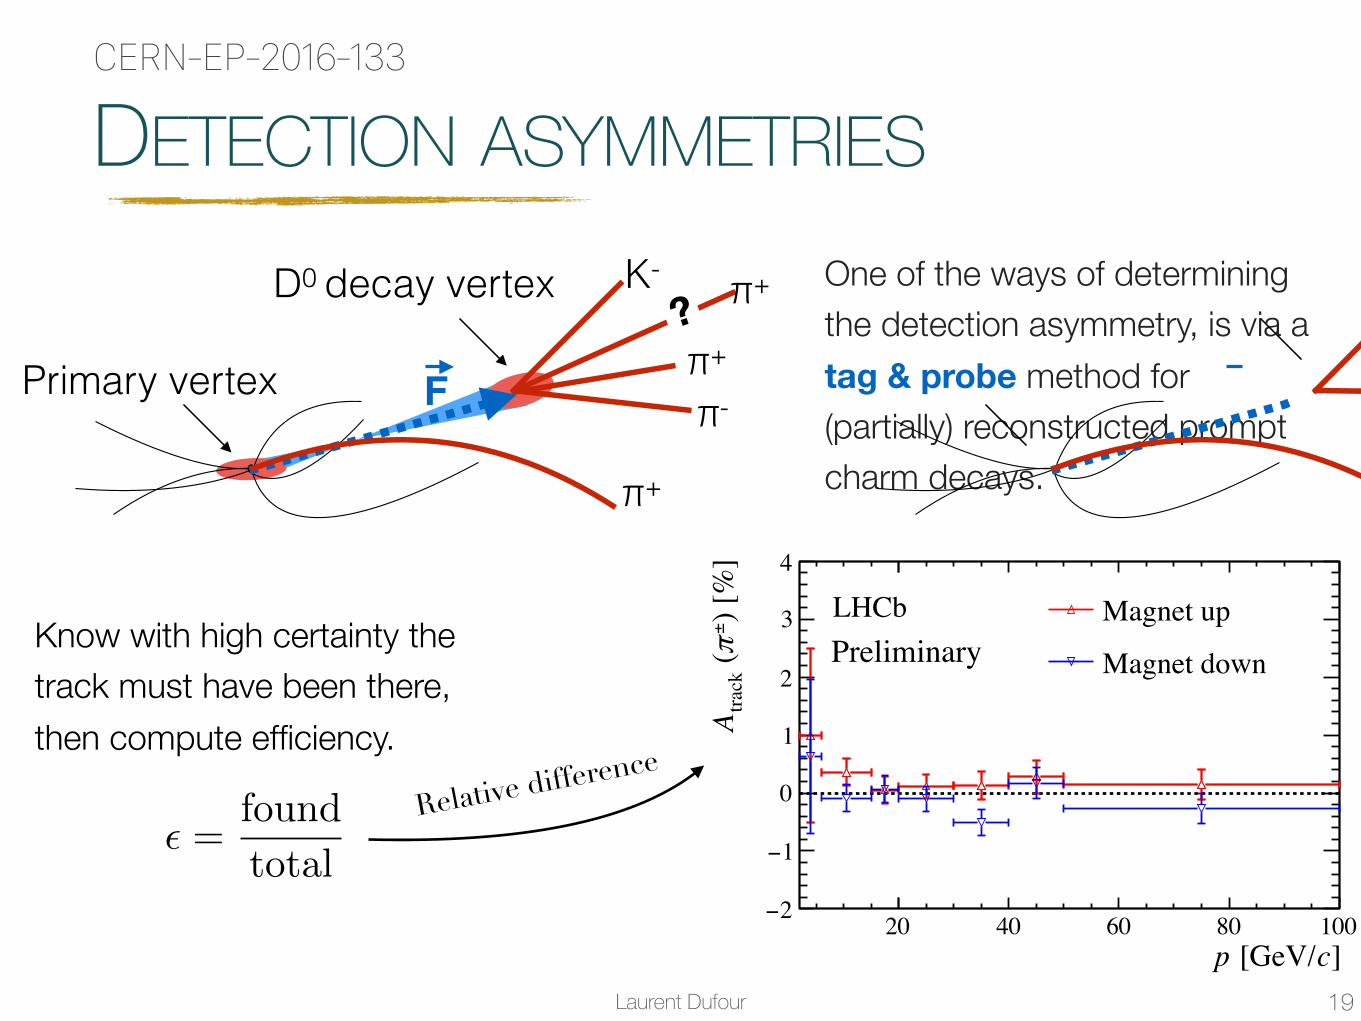
DETECTION ASYMMETRIES
19
CERN-EP-2016-133
One of the ways of determining the detection asymmetry, is via a tag & probe method for (partially) reconstructed prompt charm decays.
1 Introduction
One of the main physics objectives of LHCb is the search for new physics through anomalousCP -asymmetries. In many channels, our sensitivity is determined by our understanding ofdetector induced asymmetries. There are two root causes of detection asymmetries. Thefirst is detector mis-alignments and inhomogeneities. The second is nuclear interactions.Charged kaons are well known to exhibit a nuclear interaction asymmetry of around 10�2
in LHCb due to the di↵erent cross sections of positively and negatively charged kaons [1].A few data driven methods have been developed to measure the combined K
±⇡
⌥ detectionasymmetry [2, 3]. With the method proposed in [2], the K
±⇡
⌥ asymmetry is still thedominant source of uncertainty on the measurement of a
dsl [4].
In this note, we present a complementary method to measure the single kaon andpion detection e�ciencies and the corresponding charge asymmetries using partiallyreconstructed promptly produced D
⇤+ ! D
0⇡
+ decays. The partial reconstructionmethod has already been used at LHCb to measure the single pion asymmetry [5] withD
0 ! K
�⇡
+⇡
+⇡
�. An attempt to apply the same idea to measure the kaon asymmetrybut using D
⇤+ with a muon tag in order to control the level of background is describedin Ref. [6]. This method is limited by the relatively poor momentum resolution on theprobe particle and poor separation of signal and background. In this note we explorethe possibility to require that the probe particle is reconstructed as a VELO track assuggested in [6], thus restricting the problem to the downstream part of the tracking. Withthe direction of the probe particle fixed, the problem is well constrained, thus allowingessentially perfect momentum resolution and the possibility to reconstruct a narrow signalmass peak. This also allows us to use the D
0 ! K
�⇡
+ signal channel to increase statistics,though this will only be possible with a dedicated Hlt2 line in Run-II.
In Sect. 2, we study the expected level of nuclear interaction asymmetry in the VELOdetector that would not be measured with this method and would need to be estimatedfrom simulation. Sect. 3 describes the selection of D
⇤ candidates and the projected signalyields.
Figure 1: The two proposed signal decays with D⇤+ ! D0⇡+ and (left) D0 ! K�⇡+⇡+⇡� and(right) D0 ! K�⇡+.
K-
F
π+
π-π+
π+
Primary vertex
D0 decay vertex K-
F π+
π+
Primary vertex
D0 decay vertex
1
?
Know with high certainty the track must have been there, then compute efficiency.
✏ =found
total
Relative difference
]c [GeV/p20 40 60 80 100
) [%
]±
π (tra
ckA
2−
1−
0
1
2
3
4
LHCb Magnet up
Magnet downPreliminary
Laurent Dufour
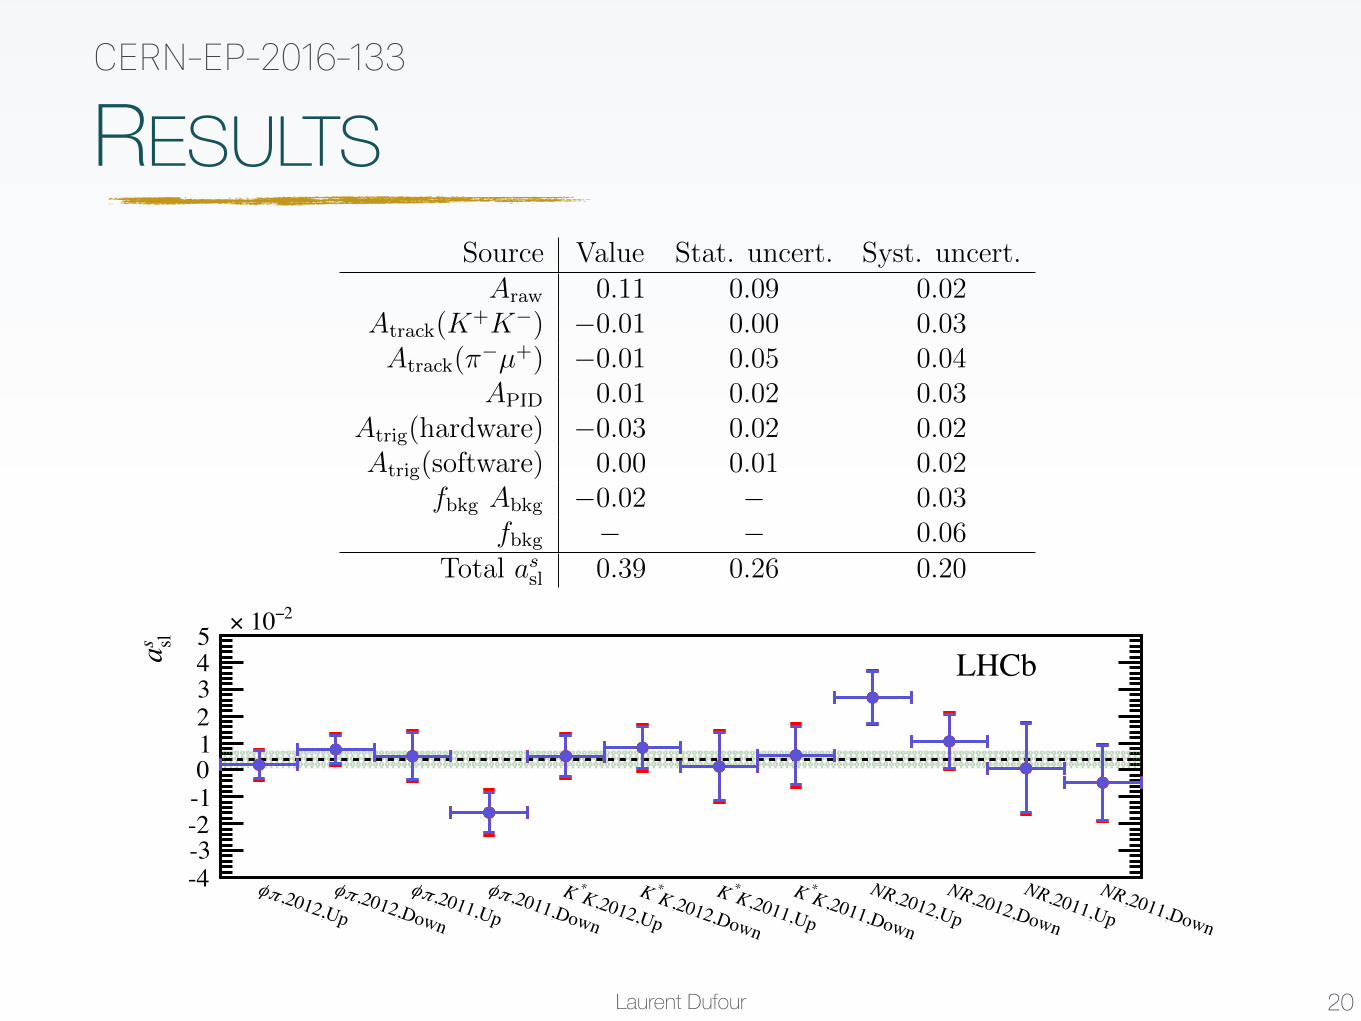
RESULTS
20
CERN-EP-2016-133Table 1: Overview of contributions in the determination of assl
, averaged over Dalitz plot regions,magnet polarities and data taking periods, with their statistical and systematic uncertainties.All numbers are in percent. The central value of as
sl
is calculated according to Eq. 3. Theuncertainties are added in quadrature and multiplied by 2/(1� f
bkg
) = 2.45, which is the samefor all twelve subsamples, to obtain the uncertainties on as
sl
.
Source Value Stat. uncert. Syst. uncert.A
raw
0.11 0.09 0.02A
track
(K+K�) �0.01 0.00 0.03A
track
(⇡�µ+) �0.01 0.05 0.04A
PID
0.01 0.02 0.03A
trig
(hardware) �0.03 0.02 0.02A
trig
(software) 0.00 0.01 0.02fbkg
Abkg
�0.02 � 0.03fbkg
� � 0.06Total as
sl
0.39 0.26 0.20
value of Atrack
(⇡�µ+) is obtained as the weighted average from the two methods. Thesystematic uncertainty on this number includes a small e↵ect from di↵erences in thedetector acceptance for positive and negative particles.
The asymmetry induced by the PID requirements, APID
, is determined using largesamples of D⇤+ ! D0(K�⇡+)⇡+ and J/ ! µ+µ� decays. The D⇤+ charge identifies thekaon and the pion of the D0 decay without the use of PID requirements, which is thenused to determine the PID e�ciencies and corresponding charge asymmetries.
The asymmetry induced by the trigger, Atrig
, is split into contributions from the muonhardware trigger and from the software trigger. The first, A
trig
(hardware), is assessedusing samples of J/ ! µ+µ� decays in data. The second, A
trig
(software), is mainlycaused by the trigger requirements on the muon or one of the hadrons from the D�
s
decay.The asymmetry from the muon software trigger is determined in a similar fashion to thatfrom the hardware trigger. The asymmetry due to the trigger requirement on the hadronsis determined using samples of prompt D�
s
! K+K�⇡� decays that have been triggeredby other particles in the event. The combined asymmetry takes into account the overlapbetween the two triggers.
The measured values of all detection asymmetries with their statistical and systematicuncertainties are shown in Table 1. The overall corrections are small and compatible withzero. In contrast, corrections for separate magnet polarities are more significant (at most1.1% in 2011 and 0.3% in 2012), as expected for most of the detector-induced chargeasymmetries. The corrections for the detection asymmetries are almost fully correlatedbetween the Dalitz regions.
The previous analysis, based on 1.0 fb�1, used only candidates in the �⇡ region of theDalitz plot, with di↵erent selection criteria, and used a di↵erent fit method to determinethe signal yields [7]. A more stringent selection resulted in a cleaner signal sample, butwith roughly 30% fewer signal candidates in the �⇡ region. As a cross check, the approach
6
,2012,Upπφ ,2012,Down
πφ ,2011,Upπφ ,2011,Down
πφ ,2012,UpK*K ,2012,Down
K*K ,2011,UpK*K ,2011,Down
K*K ,2012,UpNR ,2012,Down
NR ,2011,UpNR ,2011,Down
NR
s sla
-4-3-2-1012345
LHCb
2− 10×
Laurent Dufour
THE BIG PICTURE
21
CERN-EP-2016-133
[%]dsla
3− 2− 1− 0 1
[%]
s sla
4−
3−
2−
1−
0
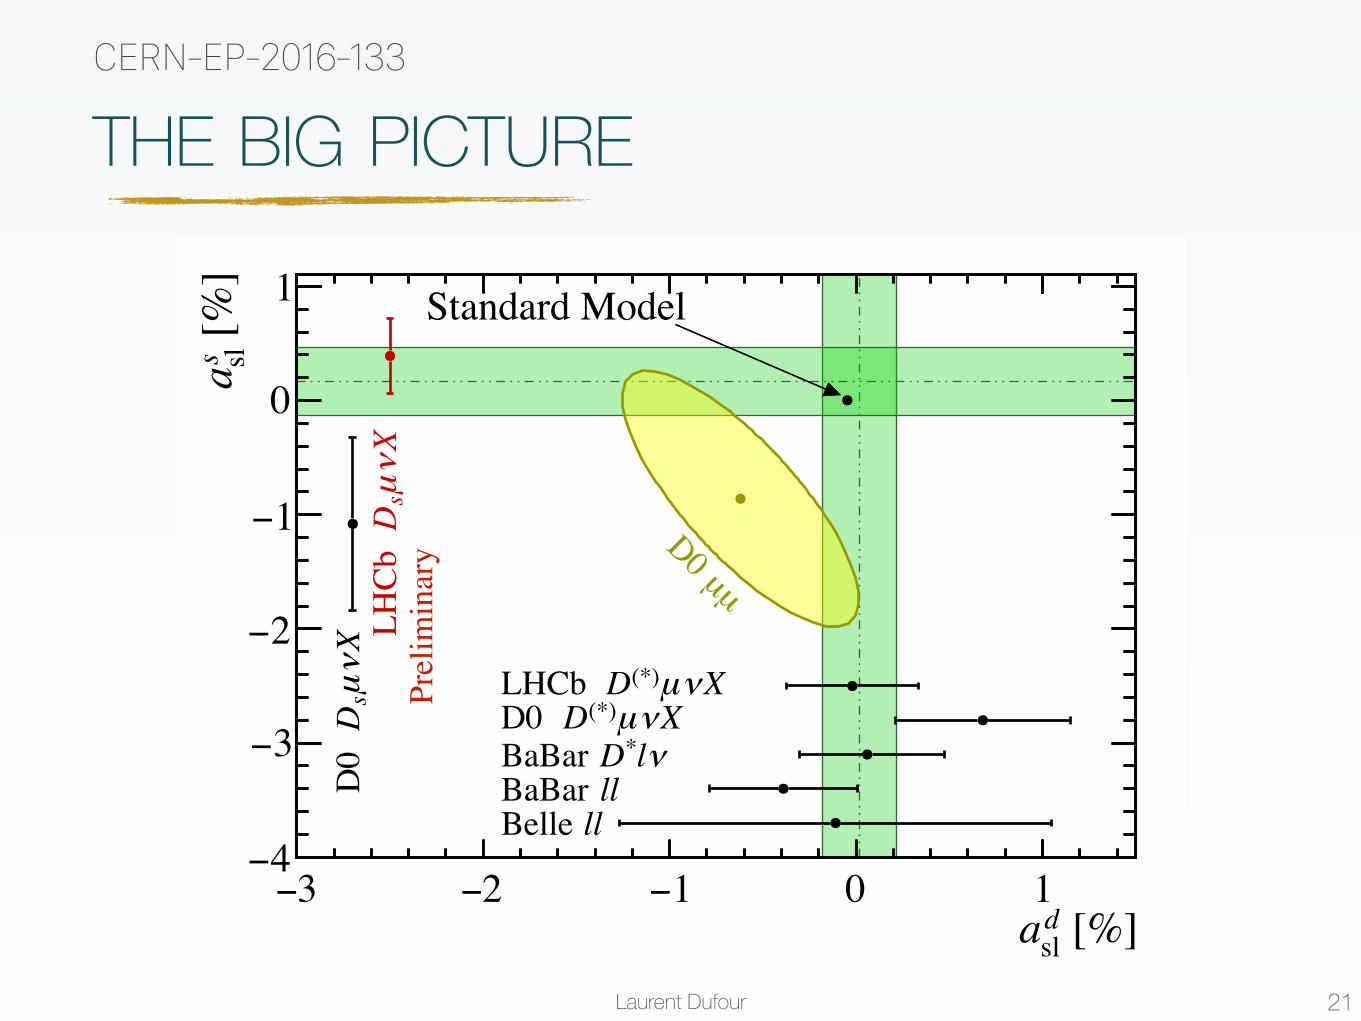
1 Standard Model
Xνµ(*)DLHCb Xνµ(*)DD0 νl*DBaBar
llBaBar llBelle
µµD0
Xν
µ sD
D0
X
νµ s
DLH
Cb
Pr
elim
inar
y
Laurent Dufour
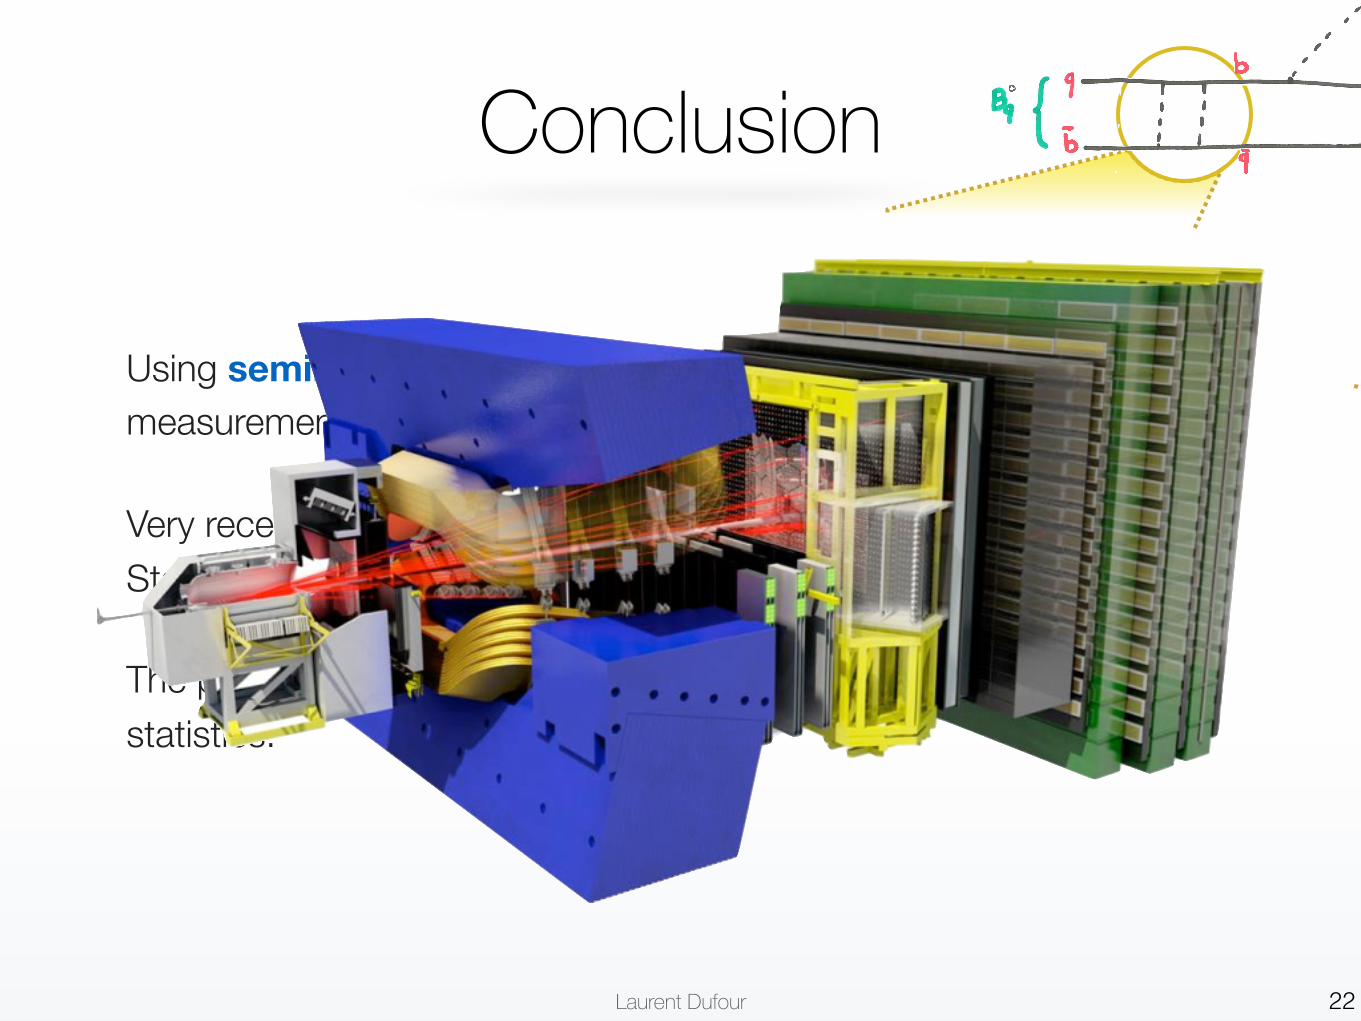
Conclusion
22
Using semileptonic decays, LHCb has provided the most precise measurements of the mixing parameters for Bs & Bd mesons.
Very recent result of CP Violation in mixing compatible with the Standard Model. Long standing discrepancy reduced.
The prospects for Run-II are promising, as the results are limited by statistics.

New results in semileptonic beauty decays with LHCbLHCP 2016
June 16th 2016 Laurent Dufour, on behalf of the LHCb collaboration
Laurent Dufour
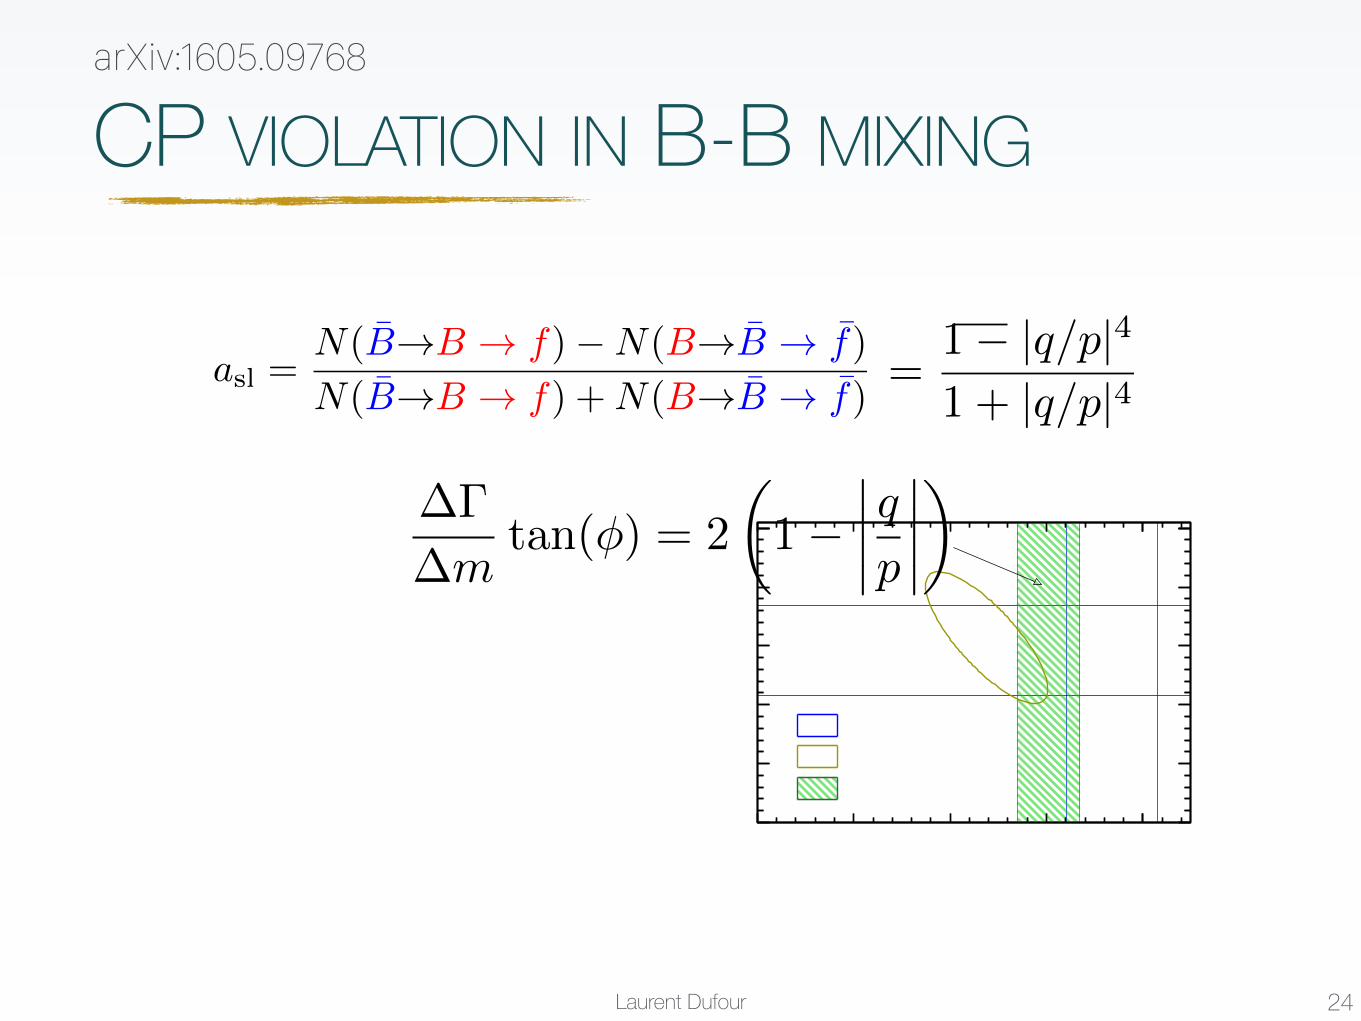
CP VIOLATION IN B-B MIXING
24
arXiv:1605.09768
[%]dsla
-3 -2 -1 0 1
[%]
s sla
-4
-3
-2
-1
0
1
D0D0 dimuon
factoriesB
Standard Model
Semileptonic CP asymmetries
• Using semileptonic flavor specific B meson decays:
TINY!!!
• SM predictions:
assl = (1.9± 0.3)� 10�5
adsl = (�4.1± 0.6)⇥ 10�4
asl =N(B̄!B ! f)�N(B!B̄ ! f̄)
N(B̄!B ! f) +N(B!B̄ ! f̄)
• Experimental landscape without LHCb
B0
B0
ff
B0
New asymmetries (and ⇥�d ) measurements needed arXiv:1409.6963
12
=1� |q/p|4
1 + |q/p|4
��
�mtan(�) = 2
✓1�
����q
p
����
◆
Laurent Dufour 25
CERN-EP-2016-084
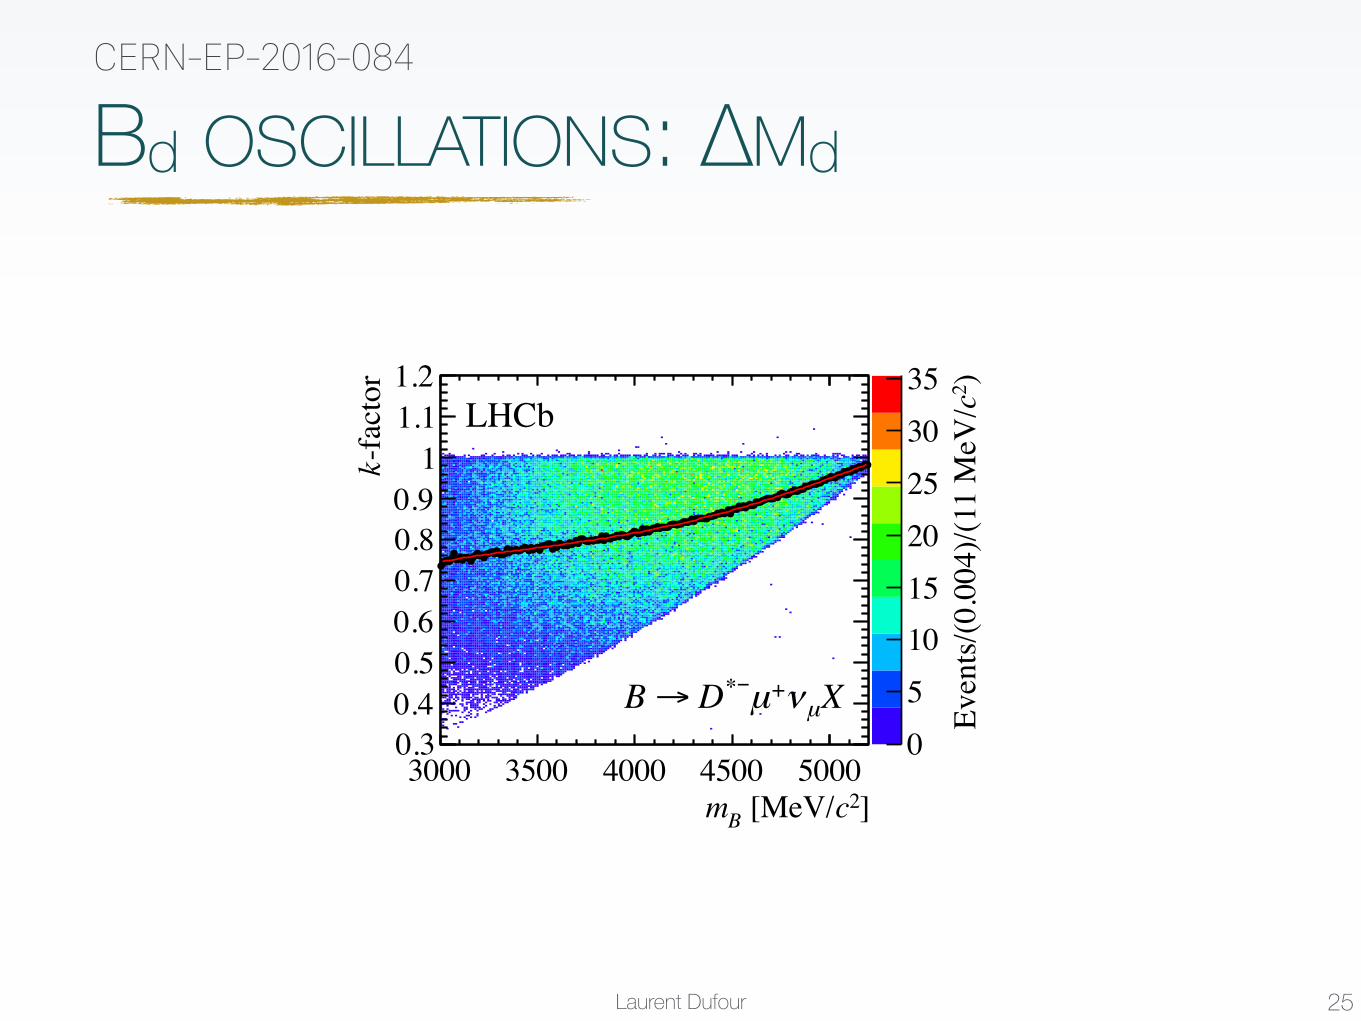
Bd OSCILLATIONS: ΔMd
]2c [MeV/Bm3000 3500 4000 4500 5000
-fac
tor
k
0.30.40.50.60.70.80.9
11.11.2 )2 c
Even
ts/(0
.004
)/(11
MeV
/
02468101214161820
Xµν+µ−D → B
LHCb
]2c [MeV/Bm3000 3500 4000 4500 5000
-fac
tor
k
0.30.40.50.60.70.80.9
11.11.2 )2 c
Even
ts/(0
.004
)/(11
MeV
/
05101520253035
Xµν+µ∗−D → B
LHCb
Figure 7: The k-factor distribution and the average k-factor (black points) as a function of thevisible mass of the B candidate, in samples of simulated (top) B0! D�µ+⌫
µ
X and (bottom)B0! D⇤�µ+⌫
µ
X decays. Polynomial fits to the average k-factor are also shown as a solid (red)line.
17