Embed Size (px)
Citation preview

RIGHT:
URL:
CITATION:
AUTHOR(S):
ISSUE DATE:
TITLE:
NEW ROLE OF COOPERATIVES INETHIOPIA: THE CASE OF ETHIOPIANCOFFEE FARMERS COOPERATIVES
KODAMA, Yuka
KODAMA, Yuka. NEW ROLE OF COOPERATIVES IN ETHIOPIA: THE CASE OF ETHIOPIANCOFFEE FARMERS COOPERATIVES. African study monographs. Supplementary issue 2007,35: 87-108
2007-03-05
https://doi.org/10.14989/68489
ASM Supplementary Issue No.35 87-108 Errata list
Page 89, line 3 from bottom Change No.148/1998 to No.147/1998. Page 93, line 13 Change 135% and 79% to 22% and 6%. Page 93, line 13-14 Change “the international average price in 2004 and 2005, respectively (ICO: Online b)” to “unit prices of total national export results in 2004 and 2004, respectively, based on the data from National Bank of Ethiopia (2007)”. Page 94, 6th column in Table 4 Change 1.089 to 1.085. Page 94, Note *2 in Table 4 Change 8.6197 to 8.6518. Page 94, Note *2 in Table 4 Add (National Bank of Ethiopia, 2007) at the last part of the sentence. Page 95, 11th column, 6th line in Table 5 Change 4,364 to 4,354 Page 97, line 14 Change 5,422,072 to 5,422,252. Page 100, 4th column, 3rd line in Table 6 Change 2.83 to 2.50. Page 100, 5th column, first line in Table 6 Change 1,149 to 1,163. Page 100, 5th column, 3rd line in Table 6 Change 1,502 to 3,168. Page 100, Note *3 in Table 6 Change 5,000kg to 15,600kg. Page 100 Source in Table 7 Add “2003a”, after “Commission,”. Page 104, Note (14) Change No.148/1998 to No.147/1998. Page 107, line 11 from bottom Add a reference: National Bank of Ethiopia 2007. Quarterly bulletin, Fiscal Year Series, 22(1) First Quarter 2006/07, National Bank of Ethiopia, Addis Ababa.
87African Study Monographs, Suppl.35: 87-108, March 2007
NEW ROLE OF COOPERATIVES IN ETHIOPIA: THE CASE OF ETHIOPIAN COFFEE FARMERS COOPERATIVES
Yuka KODAMAInstitute of Developing Economies, JETRO
ABSTRACT Since 1991, policies of economic liberalization in Ethiopia have been effective in releasing the economy from rigid state control. At the same time, they have also exposed Ethiopian people to domestic and international free market competition. In African countries, the retreat of governments from rural development due to economic liberalization policies has led to the re-evaluation of the role of cooperatives. Since 1999, in Ethiopia, several coffee farmers cooperative unions have been established to support peasants who are handicapped by their lack of negotiating power in the global economy. Coffee cooperatives have become more market-oriented and are now relatively democratic compared to the former Marxist coopera-tives of the previous regime. Thus far, these coffee cooperatives have provided higher profits to coffee farmers than have private traders. The actual volume of purchase, however, is limited due to financial constraints. Because of this, the majority of cooperatives continues to rely on conventional marketing channels rather than on unions. Considering their weak financial condition, it is too early to judge the sustainability of the cooperatives because international prices have been high recently, and it is not yet clear how they would survive a downward international price trend.
Key Words: Coffee; Cooperative; Ethiopia; Fairtrade; Yirgacheffe.
INTRODUCTION
Evaluations of Africa’s rural cooperative activities, particularly those under socialist systems, have, in general, been negative (Braverman et al., 1991; Eicher & Baker, 1982; Tsujimura, 1999). The main causes of problems were attributed to excessive governmental intervention, as well as too much dependence on com-munal traditions of cooperation (Tsujimura, 1999: 81). Despite past failures, the role of cooperatives has been reevaluated due to the retreat of governments from programs of rural development under economic liberalization policies (Braverman et al., 1991; Dorsey & Tesfaye, 2005; Kherallas et al., 2002: 166). This certainly describes the situation in Ethiopia. Since the late 1990s, cooperative activities have been encouraged again, despite bitter experiences during the socialist regime.
To provide some background, in Ethiopia, economic liberalization policies were first implemented in 1991 when the Ethiopian Peoples’ Revolutionary Democratic Front (EPRDF) came to power(1). These policies have been effective in releasing the economy from rigid state control, but also mean that Ethiopian people have become exposed to the hazards of both domestic and international free market competition.
Coffee farmers were particularly exposed to the international economy, in com-
88 Y. KODAMA
parison with domestic staple food farmers. They suffer from export price fluc-tuations determined by the New York Stock Exchange which is out of their control. Coffee, which accounts for half of the value of Ethiopian exports(2), is a typical global commodity because it is usually produced in developing countries and consumed in developed countries. Therefore, marketing channels extend beyond borders, and the price of coffee is basically determined at international exchange markets in New York and London(3). Ethiopian coffee, accounting for only 4% of the world’s export amount, has almost no influence over international prices
(ICO: Online c). After the retreat of the state from the control of marketing cof-fee, Ethiopian farmers have been confronted by the uncontrollable international price fluctuations. Although state control had depressed the farm gate price of coffee to exploit profits for the national income, it had nonetheless maintained low and stable farm gate prices (Befekadu & Tesfaye, 1990).
Cooperative activities could play an effective role in supporting coffee farmers by supplying the price information, capital, and transportation that small-scale farmers often lack. In addition, a cooperative as a representative of coffee farm-ers can be a stronger negotiator than an individual farmer in the international market. In 1999, the first coffee cooperative union, the Oromiya Coffee Farmers Cooperative Union (OCFCU), was established, uniting primary cooperatives in the Oromiya Region. The Yirgacheffe Coffee Farmers Cooperative Unions (YCFCU), examined here, is the third coffee union and was established in 2002. As a unique feature of these coffee cooperatives, the cooperatives participate in the Fairtrade system, offering premium prices to producers, through farmers’ orga-nizations, that is, cooperatives in Ethiopia, not via private traders(4).
Here, this paper analyzes the effects of the activities of cooperatives and unions on Ethiopian coffee farmers and consists of three sections. In the first section, the background of the study was explained, including the history of cooperatives in Ethiopia and the Fairtrade system. In the second section, the activities of the Yirgacheffe Coffee Farmers Cooperative Union and its primary cooperatives were examined. In the third section, the effects of the YCFCU on coffee farmers in the Gedeo Zone of the Southern Nations, Nationalities and Peoples’ Region (SNNPR) are analyzed. Data are from interviews conducted in July 2006.
BACKGROUND: COOPERATIVE ACTIVITIES AND COFFEE IN ETHIOPIA
I. History
The first cooperative organizations were established in Ethiopia in the 1950s (Couture et al., 2002: 41). The cooperatives were active during the Derg Regime from 1974 to 1991(5) (Dorsey & Tesfaye, 2005: 7). The activities of cooperatives during the Derg regime were completely different from those of Western-type cooperatives because they were based on Marxist principles. The government claimed that the objective of cooperatives was “to bring an end to capitalist exploitation, and to prevent the re-emergence of capitalism in agriculture” (Des-salegn, 1990: 102).
89New Role of Cooperatives in Ethiopia
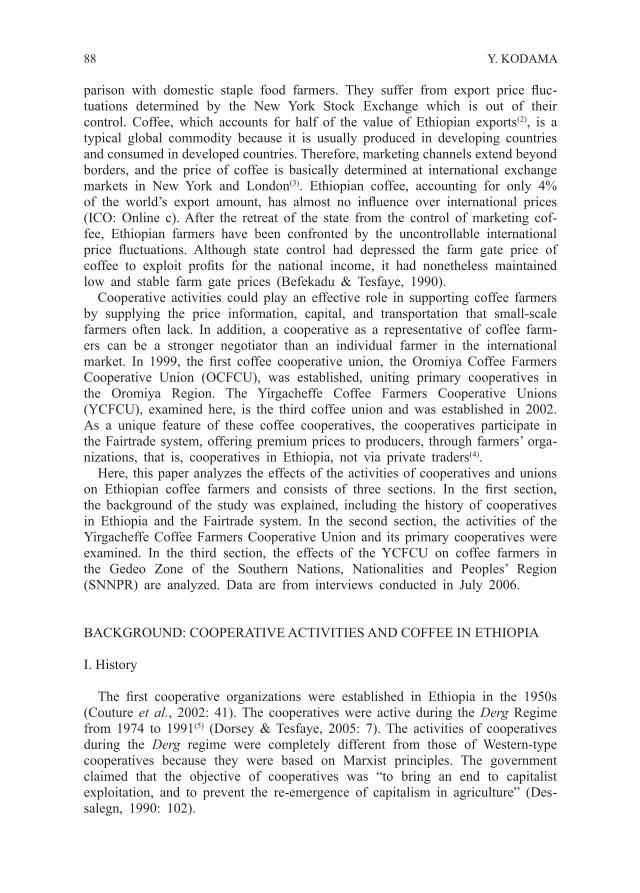
There were two types of cooperatives in rural areas: producers’ cooperatives (PCs) and service cooperatives (SCs). Whereas the membership rate of PCs was low, hovering around 20% from 1988 to 1989, that of SCs was high, at 80%, based on figures from peasant associations (PAs; Table 1). PAs were the lowest administrative structure, and membership was obligatory for farmers (Dessalegn, 1994a: 248–249). Although PCs benefited members by providing preferential treat-ment, which had been largely unavailable to smallholders, the productivity of PCs was one-third lower than that of private farmers (Dessalegn, 1994b: 289). SCs were marketing and purchasing cooperatives that handled modern inputs, credit, milling services, selling of consumer goods, and purchasing of peasants’ produce. Whereas peasants welcomed the services provided by SCs, most of these organizations suffered from budgetary deficits and poor financial management (Dessalegn, 1994a: 252–254; Fantu, 1990: 70).
Cooperative activities under the Derg regime were halted in 1990. When the new mixed economic policy permitted peasants to choose whether they would work for cooperatives or individually, most peasants decided to reallocate coop-erative lands to individual holdings (Dessalegn 1994a: 262; Gezachew, 1994: 220–221; Tessema, 1994: 211). After the collapse of the Derg regime in 1991, during the confusion of the transitional period, some SCs were looted and van-dalized by local people for their assets (Dessalegn, 1994a), whereas others scaled down their activities due to severe competition with private traders after trade liberalization (Kodama, 2003)(6).
In 1998, the activities of farmers’ cooperatives were formally revitalized by the Cooperative Societies Proclamation No. 147/1998(7). The Proclamation defines cooperatives as organizations “formed by individuals on voluntary basis,” and states that they “participate in the free market economic system.” This indicates the different nature of the new cooperatives from the system of the previous regime.
Proclamation No. 147/1998 outlines the layered organizational structure of the cooperatives(8), which was not permitted by the previous regime. An organization can have four layers, i.e., primary cooperatives, unions, federations, and cooper-ative leagues, although only primary and union levels have been formed to date (Dorsey & Tesfaye, 2005: 9, 20). Another unique feature of the proclamation is that it defines the ratio of dividends between a cooperative organization and its members. Article 33 of No. 148/1998 regulates that the cooperative “society shall deduct 30% of the net profit” and “the remaining net profit shall be divided among members.” Therefore, the unions provide 70% of their net profit to the
Table 1. Ethiopia: Rural Organization in the Derg Regime (1988/89).
Organization No. Household Members (Million) # of PAs Covered
Peasant Associations 20,455 5.7 —Producers’ Cooperatives 3,732 0.3 —Service Cooperatives 4,052 4.5 17,785Source: Various Ministry of Agriculture publications 1987–89, quoted by Dessalegn, 1994a: 248.
90 Y. KODAMA
primary cooperatives and the primary cooperatives in turn provide 70% of their net profit, including the dividends from the union, to cooperative members (Dorsey & Tesfaye, 2005: 29–30).
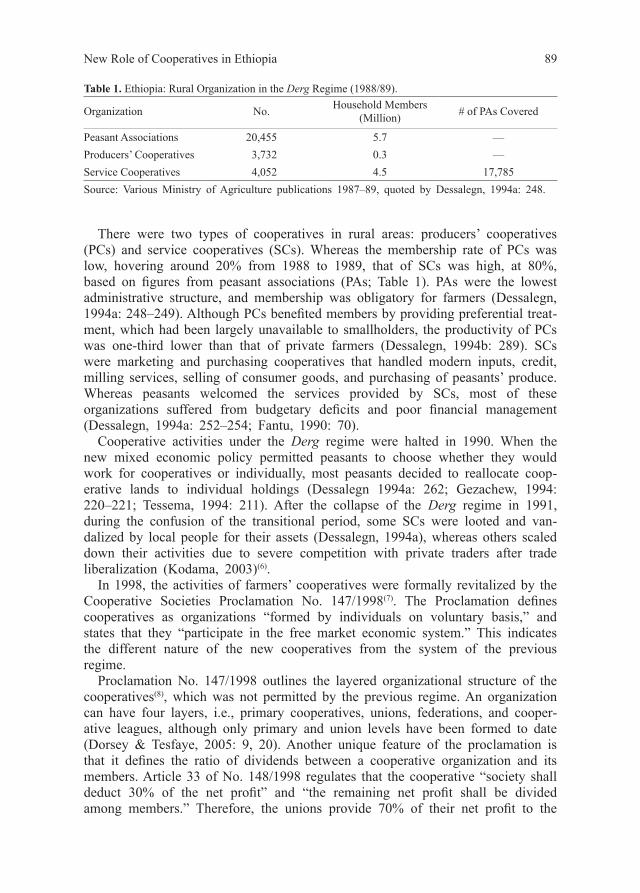
II. Farmers Coffee Cooperative Unions
Six coffee farmers cooperative unions were established following the issue of Proclamation No. 147/1998 (Table 2)(9). Unions were new institutions that organized the primary cooperatives. As background to their establishment, after 1998, the decline of international coffee prices caused a great deal of business trouble between traders and cooperatives. Exporters who offered higher prices at coffee auction centers swindled coffee out of cooperatives without paying(10). The Ethio-pian government took the initiative to establish Coffee Farmers Cooperative Unions to manage coffee export business on behalf of primary coffee cooperatives that lacked human resources and logistical capacity(11).
At the first stage of establishing coffee unions, the Ethiopian government recruited ex-government officials who were experienced in cooperative activities and the coffee business and supported their salaries in the first two years after their establishment. The strong involvement of the state was criticized from the viewpoint of Western concepts of cooperatives and civil society (Dessalegn, 2002), but considering the lack of human resources, there appeared to be no choice other than state-made cooperatives.
Table 2. Ethiopia Coffee Farmers Cooperative Unions.
NameEstablished
Year
# of the Primary Coops
# of Membership
AreaFair Trade Certificate (FLO*1
)
Organic Certificate(BCS*2
)
Oromiya Coffee Farmers Cooperative Union (OCFCU)
1999 101 11 35 74,725Oromiya Region
Sidama Coffee Farmers Cooperative Union (SCFCU)
2001 42 8 25 86,675Sidama Zone,
SNNPRYirgacheffe Coffee Farmers Cooperative Union (YCFCU)
2002 22 5 12 43,794Gedeo Zone,
SNNPRKafa Forest Coffee Farmers Cooperative Union (KFCFCU)
2004 26 NA NA 6,632Kaffa Zone,
SNNPRTepi Coffee Farmers Cooperative Union
NA*3 NA NA NA NATepi Zone,
SNNPRBench Maji Forest Coffee Producers Farmers’ Cooperative Union
NA*3 NA NA NA NABenchi-Maji
Zone, SNNPR
Source: OCFCU: “Profile of Oromia Coffee Farmers Cooperative Union/OCFCU LTD”, unpublished. YCFCU: Based on the YCFCU’s leaflet. SCFCU: Based on the SCFCU’s leaflet. KFCFCU: Based on the KFCFCU’s leaflet. The other Unions’ information was based on the author’s interview with Federal Cooperative
Commission and VOCA-Ethiopia.Note: *1 Fair Trade Organization. *2 BCS ÖKO-GARANTIE GMBH. *3 The exact data are not available.

91New Role of Cooperatives in Ethiopia
Coffee unions are privileged to skip coffee auctions in which private traders are obliged to participate (see Photo 4-5 & 4-6). The typical marketing channel of the coffee cooperatives and unions is very simple (Fig. 1). The payment system of coffee cooperatives and unions is as follows:1. A cooperative purchases coffee from farmers at the market price. The price is
determined based on competition between cooperatives and private traders. The payment by the cooperative is made immediately or around one week after the farmers deliver the coffee. The timing of the payment depends on the financial status of the cooperative.
2. The coffee purchased by the cooperative is delivered to a union. The union purchases coffee from cooperatives at a price equivalent to the domestic auc-tion price at that time. The payment is usually made immediately or after a couple of weeks following coffee delivery; the exact payment time depends on the financial status of the union. In some cases, the union might suggest that cooperatives sell their coffee to auctions instead of to unions due to reasons described below(12).
3. Unions export coffee through a Fairtrade route or conventional route.4. After completing the audit of unions’ finances, the amount of the dividends to
Fig. 1. Ethiopia Coffee Marketing Route.Source: Field survey by the author.

92 Y. KODAMA
be paid out to the cooperatives is decided. The dividends are calculated after deducting 30% of the net profit for the unions.
5. Whereas 30% of the net profit, including the dividends from the union, is reserved for the primary cooperatives, the remaining 70% is distributed as div-idends to farmers after auditing procedures are complete. The mode of dividend distribution is based on the volume of coffee and the size of the share purchased by farmers(13). The exact mode of distribution (e.g., the ratio between volume contribution and share amount) is left to the general assembly of the coopera-tive to decide (Proclamation No. 402/2004)(14).In reality, unions often advise cooperatives to sell their coffee through auctions,
rather than to the unions. The reasons for this are: (1) the coffee volume has exceeded the amount the unions are able to sell; (2) the quality of the coffee does not meet the unions’ standards; and (3) the auction price is higher than the unions’ price(15).
The financial constraints of primary cooperatives also limit the amount they purchase. As the next section shows, although farmers tend to be satisfied with the price offered by the cooperatives and are willing to sell more to them, coop-eratives cannot buy all the volume farmers produce. Farmers sell the remaining volume to private traders.
III. Cooperatives and Fairtrade
1. Fairtrade and the new global labeling trendThe motivation behind Fairtrade is to build “a system of trade in which the
partners seek deliberately to establish a more direct relationship between groups of producers and consumers in the two worlds and a greater understanding among consumers of the need of the producers for support for their independent devel-opment” (Barratt Brown, 1993: 156). Fairtrade is often called “alternative trade” because it aims to establish an alternate trade network to the commercial mar-ket.
Fairtrade in the world’s marketplace still has a small share compared to the conventional market. For example, Fairtrade coffee in Europe and the US accounts for only 1–2% of sales, with the notable exceptions of 20% in the United King-dom and 6% in Switzerland in 2004 (Krier, 2005: 80; Transfair USA: Online).
The worldwide Fairtrade sales volume, however, continues to increase. For example, the volume increased by 40% in 2005 over the volume in 2004 (FLO: Online b). The rapid expansion can be partly attributed to the introduction of the labeling system in 1988(16). The idea has been widely accepted; in 1997, Fairtrade labeling organizations in several countries formed an umbrella organization called the Fairtrade Labeling Organization International (FLO)(17). The labeling system aims to increase Fairtrade sales by expanding the market to mainstream retailers such as supermarkets. It is effective in the standardization and systematization of Fairtrade certification.
For standardization through labeling, the FLO has several conditions(18). Of these, two affect small-scale coffee farmers. First, producers have to establish a democratic organization aiming at social, economic, and environmental develop-
93New Role of Cooperatives in Ethiopia
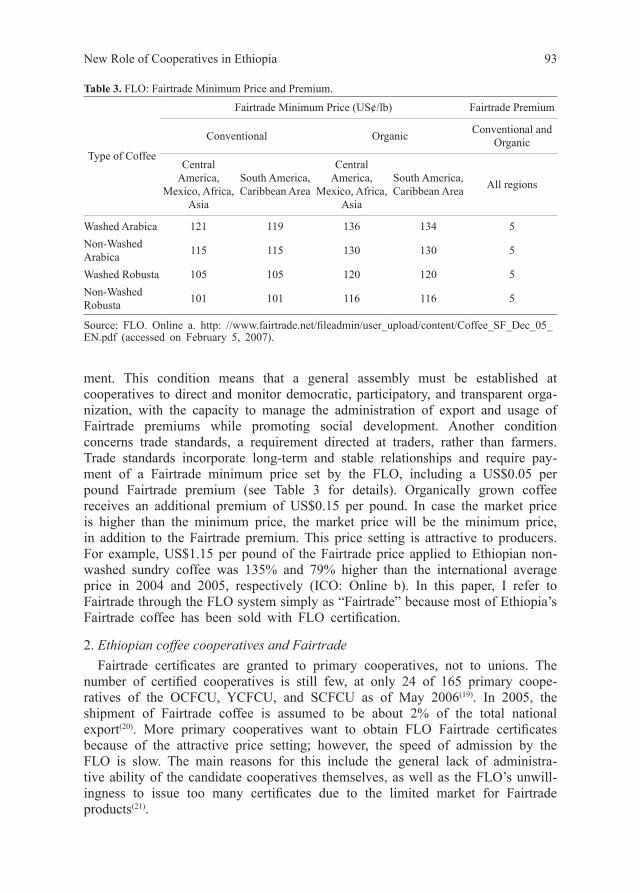
ment. This condition means that a general assembly must be established at cooperatives to direct and monitor democratic, participatory, and transparent orga-nization, with the capacity to manage the administration of export and usage of Fairtrade premiums while promoting social development. Another condition concerns trade standards, a requirement directed at traders, rather than farmers. Trade standards incorporate long-term and stable relationships and require pay-ment of a Fairtrade minimum price set by the FLO, including a US$0.05 per pound Fairtrade premium (see Table 3 for details). Organically grown coffee receives an additional premium of US$0.15 per pound. In case the market price is higher than the minimum price, the market price will be the minimum price, in addition to the Fairtrade premium. This price setting is attractive to producers. For example, US$1.15 per pound of the Fairtrade price applied to Ethiopian non-washed sundry coffee was 135% and 79% higher than the international average price in 2004 and 2005, respectively (ICO: Online b). In this paper, I refer to Fairtrade through the FLO system simply as “Fairtrade” because most of Ethiopia’s Fairtrade coffee has been sold with FLO certification.
2. Ethiopian coffee cooperatives and FairtradeFairtrade certificates are granted to primary cooperatives, not to unions. The
number of certified cooperatives is still few, at only 24 of 165 primary coope-ratives of the OCFCU, YCFCU, and SCFCU as of May 2006(19). In 2005, the shipment of Fairtrade coffee is assumed to be about 2% of the total national export(20). More primary cooperatives want to obtain FLO Fairtrade certificates because of the attractive price setting; however, the speed of admission by the FLO is slow. The main reasons for this include the general lack of administra-tive ability of the candidate cooperatives themselves, as well as the FLO’s unwill-ingness to issue too many certificates due to the limited market for Fairtrade products(21).
Table 3. FLO: Fairtrade Minimum Price and Premium.
Type of Coffee
Fairtrade Minimum Price (US¢/lb) Fairtrade Premium
Conventional Organic Conventional and Organic
Central America,
Mexico, Africa, Asia
South America, Caribbean Area
Central America,
Mexico, Africa, Asia
South America, Caribbean Area All regions
Washed Arabica 121 119 136 134 5Non-Washed Arabica 115 115 130 130 5
Washed Robusta 105 105 120 120 5Non-Washed Robusta 101 101 116 116 5
Source: FLO. Online a. http: //www.fairtrade.net/fileadmin/user_upload/content/Coffee_SF_Dec_05_EN.pdf (accessed on February 5, 2007).
94 Y. KODAMA
IV. Organic Coffee: Another Premium Type of Coffee
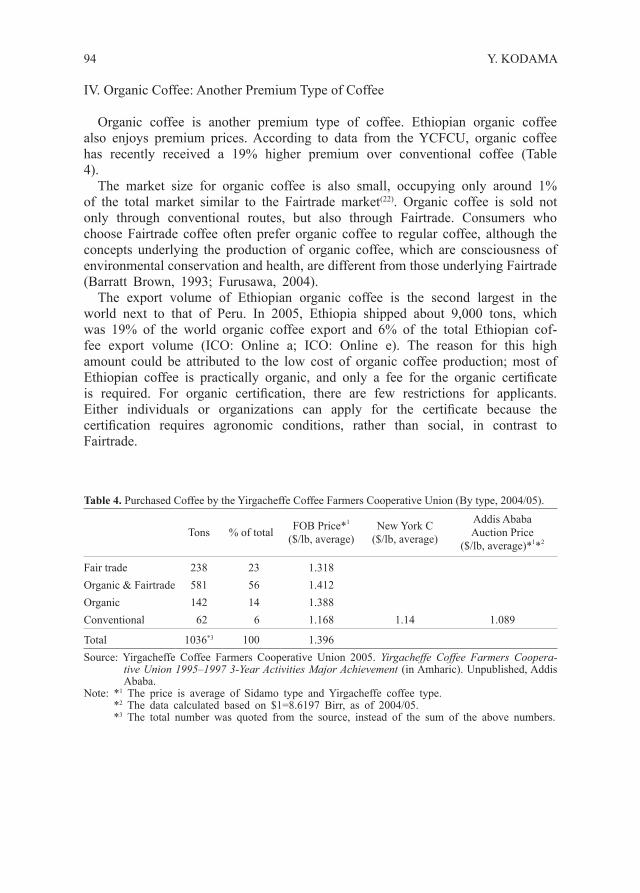
Organic coffee is another premium type of coffee. Ethiopian organic coffee also enjoys premium prices. According to data from the YCFCU, organic coffee has recently received a 19% higher premium over conventional coffee (Table 4).
The market size for organic coffee is also small, occupying only around 1% of the total market similar to the Fairtrade market(22). Organic coffee is sold not only through conventional routes, but also through Fairtrade. Consumers who choose Fairtrade coffee often prefer organic coffee to regular coffee, although the concepts underlying the production of organic coffee, which are consciousness of environmental conservation and health, are different from those underlying Fairtrade (Barratt Brown, 1993; Furusawa, 2004).
The export volume of Ethiopian organic coffee is the second largest in the world next to that of Peru. In 2005, Ethiopia shipped about 9,000 tons, which was 19% of the world organic coffee export and 6% of the total Ethiopian cof-fee export volume (ICO: Online a; ICO: Online e). The reason for this high amount could be attributed to the low cost of organic coffee production; most of Ethiopian coffee is practically organic, and only a fee for the organic certificate is required. For organic certification, there are few restrictions for applicants. Either individuals or organizations can apply for the certificate because the certification requires agronomic conditions, rather than social, in contrast to Fairtrade.
Table 4. Purchased Coffee by the Yirgacheffe Coffee Farmers Cooperative Union (By type, 2004/05).
Tons % of total FOB Price*1 ($/lb, average)
New York C ($/lb, average)
Addis Ababa Auction Price
($/lb, average)*1*2
Fair trade 238 23 1.318Organic & Fairtrade 581 56 1.412Organic 142 14 1.388Conventional 62 6 1.168 1.14 1.089
Total 1036*3 100 1.396Source: Yirgacheffe Coffee Farmers Cooperative Union 2005. Yirgacheffe Coffee Farmers Coopera-
tive Union 1995–1997 3-Year Activities Major Achievement (in Amharic). Unpublished, Addis Ababa.
Note: *1 The price is average of Sidamo type and Yirgacheffe coffee type.*2 The data calculated based on $1=8.6197 Birr, as of 2004/05.*3 The total number was quoted from the source, instead of the sum of the above numbers.
95New Role of Cooperatives in Ethiopia
Table 5. The Data by Prim
ary Cooperatives of the Y
irgcheffe Coffee Farm
ers Cooperative U
nions.
Woreda
Cooperative
Organic
FairtradeM
emberships
(2005)B
eneficiaries (2005)
% of
mem
berships
Purchased volum
e by coop from
farm
ers (2004, tons)
% of
production*1
Dividend(B
irr)-profit from 2004
TotalM
ax.M
in.Ave.
Yirga C
heffeH
afursa○
○1,086
57153
61885
111,1792,841
0.70195
Yirga C
heffeK
onga○
○2,220
1,17453
82679
240,0002,496
3.30204
Kochore
Ham
a○
○1,564
50632
57441
71,0123,946
2.10140
Wonago
Finchewa
○1,259
37230
45218
56,0533,749
0.30151
Wonago
Hase H
aro○
1,851 531
29444
2463,654
1,8291.80
120W
onagoB
elekara○
983N
AN
A363
1931,625
4,3641.70
NA
Wonago
Kello
○1,402
NA
NA
21711
13,7171,056
1.30N
AW
onagoA
ddis Ketem
a○
1,808N
AN
A249
16N
AN
AN
AN
AY
irga Cheffe
Qoqe
○1,548
68844
51140
71,538 907
0.90104
Yirga C
heffeEdido
○2,298
NA
NA
36626
NA
NA
NA
NA
Yirga C
heffeH
aru○
1,635 243
15220
1415,425
1,0191.70
63K
ochoreSigiga
○3,627
NA
NA
22010
NA
NA
NA
NA
Kochore
Beloya
○2,083
29814
31025
61,1583,529
1.65205
Bule
Adado*
2○
2,426N
AN
AN
AN
AN
AN
AN
AN
AW
onagoR
esa2,860
61522
41115
36,7021,353
0.80 60
Wonago
Tumitcha
1,780 316
18421
2725,552
8720.35
81W
onagoM
ichle2,188
41119
28117
27,1222,386
0.70 66
Wonago
Dam
a2,499
61024
28524
42,3677,251
1.05 69
Wonago
Chichu
2,675 172
6303
2628,541
7,2780.90
166Y
irga Cheffe
Aram
o3,325
55317
36639
40,1503,116
0.15 73
Yirga C
heffeD
umerso
1,849 319
17306
2311,200
4110.15
35Special W
oredaA
maro K
ele*2
NA
NA
NA
NA
NA
NA
NA
NA
NA
Total42,966
7,37917
7,74423
946,9947,278
0.15128
Source: Gedeo Zone C
ooperative Promotion B
ureau unpublished data, YC
FCU
’s leaflet.N
ote: *1 It w
as calculated based on the actual shipment in G
edeo Zone in 2004/05 from M
inistry of Agriculture (no w
oreda level), and potential pro-duction by w
oreda from the Y
CFC
U’s leaflet.
*
2 Recent entry. The A
mraro K
ele is categorized as the special woreda and does not belong to any zone.

96 Y. KODAMA
ACTIVITIES OF THE YIRGACHEFFE COOPERATIVE UNION AND ITS PRI-MARY COOPERATIVES
I. Basic Facts Concerning the Yirgacheffe Farmers Cooperative Union (YCFCU) and its Primary Cooperatives
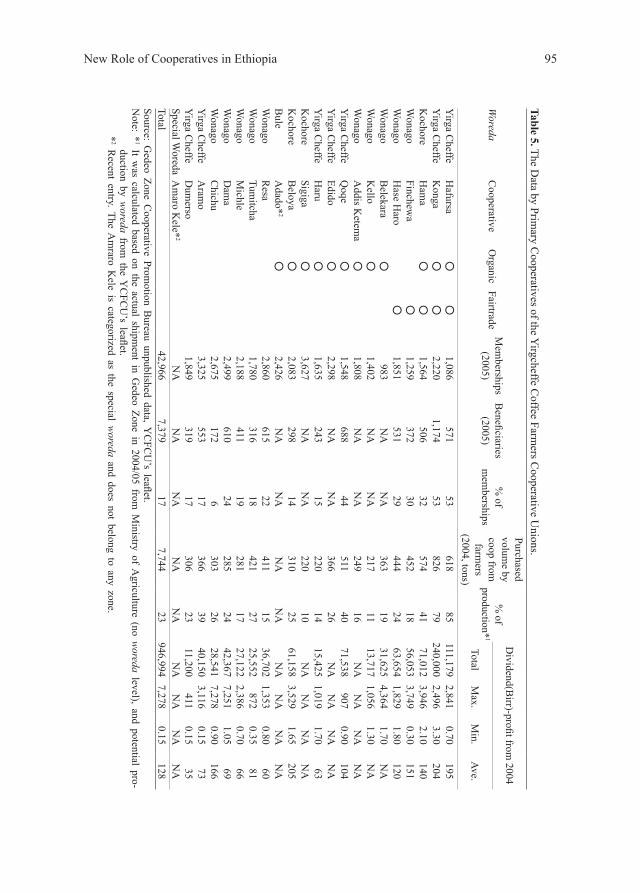
The Yirgacheffe Coffee Farmers Cooperative Union (YCFCU) was established in June 2002 and was the third coffee union to appear after the Oromiya Coffee Farmers Cooperative Union (OCFCU) and Sidama Coffee Farmers Cooperative Union (SCFCU). Its office is located in Addis Ababa, the capital of Ethiopia. The YCFCU consists of 22 primary cooperatives with a membership of 43,794 coffee producers in the Gedeo Zone, SNNPR. Out of the 22 primary cooperatives, five have been Fairtrade certified, including two cooperatives that are also organic certified; and nine have been certified as organic coffee producers, but lack Fairtrade certification. The rate of membership of coffee producers in primary cooperatives is estimated at around 40%(23). Female members account for only 6.5% of the total membership, which is disproportionately low compared to the number of female landholders, who make up 20%(24) of all farmers in the Gedeo Zone (Central Agricultural Census Commission, 2003a: 68).
The number of active members is, however, much fewer than the official num-ber of members. This is apparent because there have only been 7,379 beneficia-ries of dividends, which accounts for only 17% of the total membership of the YCFCU (see Table 5 for details)(25). The dividends to farmers are decided based on their volume sold to cooperatives. In 2005, the beneficiaries received an ave-rage of 128 Birr as dividends, ranging from 0.15 Birr to 7,278 Birr (US$1=8.70 Birr as of October 2006). The double-certified cooperatives enjoyed a high pro-portion of beneficiaries (i.e., active members), at 32–53% of cooperative members, whereas single-certified Fairtrade cooperatives were at 30%.
II. The Realities of the Coffee Cooperative Marketing Channel
Although the basic rule is that primary cooperatives sell coffee to unions, the majority of volume purchased from primary cooperatives did not go to unions because of the reasons explained in the previous section. The YCFCU purchased 1,036 tons, comprising 13% of the coffee purchased by primary cooperatives (7,744 tons)(26) in the fiscal year 2004/05. This means that 87% of coffee pur-chased by primary cooperatives was sold through the auction route instead of the union route. The union mainly purchases coffee from Fairtrade and organic coop-eratives. In the fiscal year 2004/05, 93% of coffee purchased by the union was Fairtrade or organic; however, even Fairtrade and organic certified cooperatives could not sell all of their coffee to the union. Only 18% of the volume gathered by these certified cooperatives was exported by the union during that fiscal year (see Tables 4 and 5 for details).
Although the amounts of Fairtrade and organic coffee are not large compared to the total production volume in the Gedeo Zone, the union obtains the premium

97New Role of Cooperatives in Ethiopia
price of Fairtrade and organic coffee for 16% to 24% higher than New York price (Table 4). The premium is higher for double-certified coffee (Fairtrade and organic) than it is for single-certified coffee. The union also keeps the price of conven-tional coffee equivalent to the price established at the New York Stock Exchange. With these premium prices, the union has benefited the certified primary coop-eratives. The average dividends per member tend to be higher for certified coop-eratives than they are for other cooperatives, with an exception(27) (Table 5).
The other primary cooperatives generally manage to sell their coffee by them-selves through the conventional route. The relative independence of primary coop-eratives from the unions is evident from data on profits. Even cooperatives without certification have secured profits. Based on data from the Gedeo Zone Coopera-tive Promotion Bureau, all of the cooperatives except one made a profit in the fiscal year of 2004/05(28). Whereas the unions made a profit of 1,259,783 Birr, the total profit of primary cooperatives was 5,422,072 Birr in 2004/05(29). Only 16% of the primary cooperatives’ profits came from the union in case the union provided 70% of the net profit of the union.
III. Limitations of the Union and Cooperatives
The biggest problem of the unions and cooperatives is the shortage of funds with which to purchase coffee. They finance their transactions using credit from banks(30). In cases in which they are unable to repay the credit, they are not granted new credit. Some past purchase records of cooperatives show some years without any purchases because of their failure to repay the banks. Financial con-straints limit the amount of coffee purchased. For example, until recently, primary cooperatives purchased only fresh cherry for washed coffee, not sundry cherry for non-washed coffee.
The difficulty of market acquisition in the limited size of Fairtrade market is another constraint to the expansion of cooperative activities. As described above, the YCFCU does not sell the whole amount produced by Fairtrade and organic cooperatives. This is contrary to the other unions because they claimed that they needed more Fairtrade certification for its primary cooperatives to meet the demands for Fairtrade(31). This implies that there has already been some competition among the unions for the Fairtrade market; the YCFCU might have been struggling to get its share.
In the next section, actual conditions affecting coffee farmers in the Gedeo Zone are examined. The main questions are: (1) who benefits from cooperatives; (2) what kinds of benefits are received; and (3) how do cooperative activities affect rural society.
98 Y. KODAMA
EFFECTS OF COOPERATIVE ACTIVITIES ON COFFEE FARMERS IN GEDEO ZONE
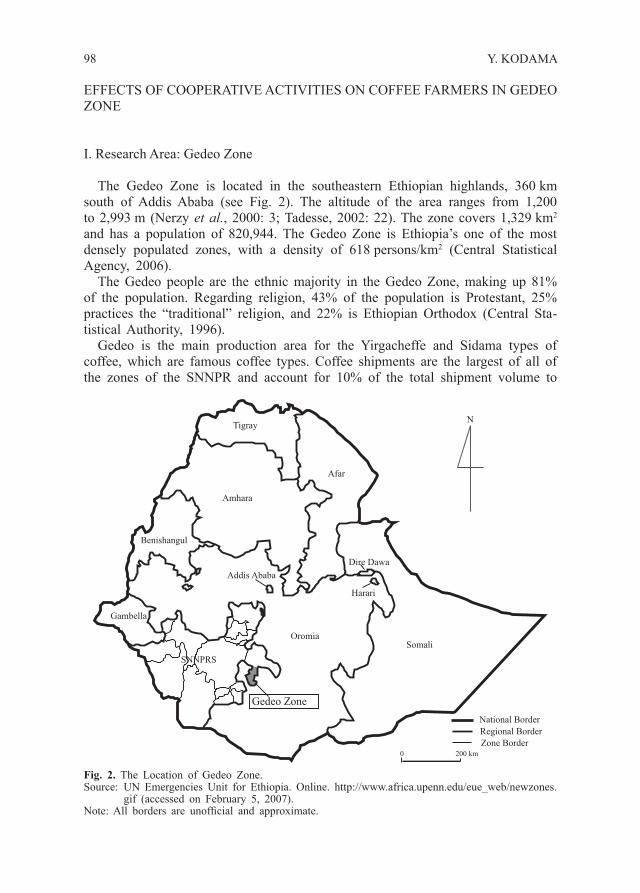
I. Research Area: Gedeo Zone
The Gedeo Zone is located in the southeastern Ethiopian highlands, 360 km south of Addis Ababa (see Fig. 2). The altitude of the area ranges from 1,200 to 2,993 m (Nerzy et al., 2000: 3; Tadesse, 2002: 22). The zone covers 1,329 km2 and has a population of 820,944. The Gedeo Zone is Ethiopia’s one of the most densely populated zones, with a density of 618 persons/km2 (Central Statistical Agency, 2006).
The Gedeo people are the ethnic majority in the Gedeo Zone, making up 81% of the population. Regarding religion, 43% of the population is Protestant, 25% practices the “traditional” religion, and 22% is Ethiopian Orthodox (Central Sta-tistical Authority, 1996).
Gedeo is the main production area for the Yirgacheffe and Sidama types of coffee, which are famous coffee types. Coffee shipments are the largest of all of the zones of the SNNPR and account for 10% of the total shipment volume to
Fig. 2. The Location of Gedeo Zone.Source: UN Emergencies Unit for Ethiopia. Online. http://www.africa.upenn.edu/eue_web/newzones.
gif (accessed on February 5, 2007).Note: All borders are unofficial and approximate.
99New Role of Cooperatives in Ethiopia
the inspection center at Addis Ababa(32).The average cultivated area of a landholder is small, on average occupying
only 0.3 ha. Coffee takes the biggest proportion of the cultivated areas, at 34%, followed by enset, at 31%, which is the main staple food of the Gedeo people(33) (Central Agricultural Census Commission, 2003a: 148). The exact areas under cultivation by crop, however, were hard to measure because of the mixed farm-ing system of intercropping products such as enset, maize, and avocado in this area (see Photo 4-1 to 4-3).
II. Interviews with Farmers
1. Basic factsThe research was conducted in July 2006, when the 2005/06 coffee year (October
to September) was almost complete. 24 farmers to be interviewed were randomly selected. Only 1 of the 24 farmers was female, making the ratio of women among the interview subjects, at 4%, relatively lower than the actual ratio of female members of YCFCU at 6.5%.
2. MembersInterviews revealed that most of the cooperative members were the members
of the previous service cooperatives because they were allowed to re-enter cur-rent cooperatives without making any additional payments. Members who joined the cooperative at the time of its establishment paid a lower entry fee than did latecomers.
Of the 24 interviewees, 9 were not members of cooperatives. The characteris-tics of the nonmembers can be classified according to three types: children of members; those with no access to cooperatives; and those who could not renew membership after the decease of the household’s cooperative member, especially in households headed by females.
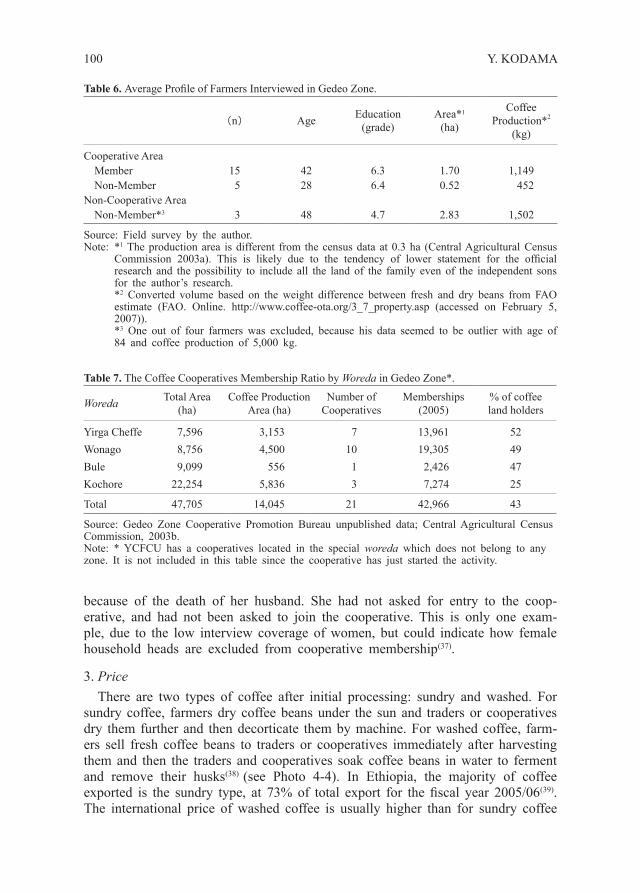
The children of members claimed that they did not need to become indepen-dent members by paying the entry fee because they ship their coffee to cooper-atives along with their fathers’ coffee. The average age of nonmembers in areas where cooperatives are active was much younger, at 28 years old, than the aver-age age of members, at 42 (Table 6). Resulting from the generational difference between members and nonmembers, the size of the landholdings(34) of nonmem-bers was smaller, and thus the amount of coffee production was also less than that of members.
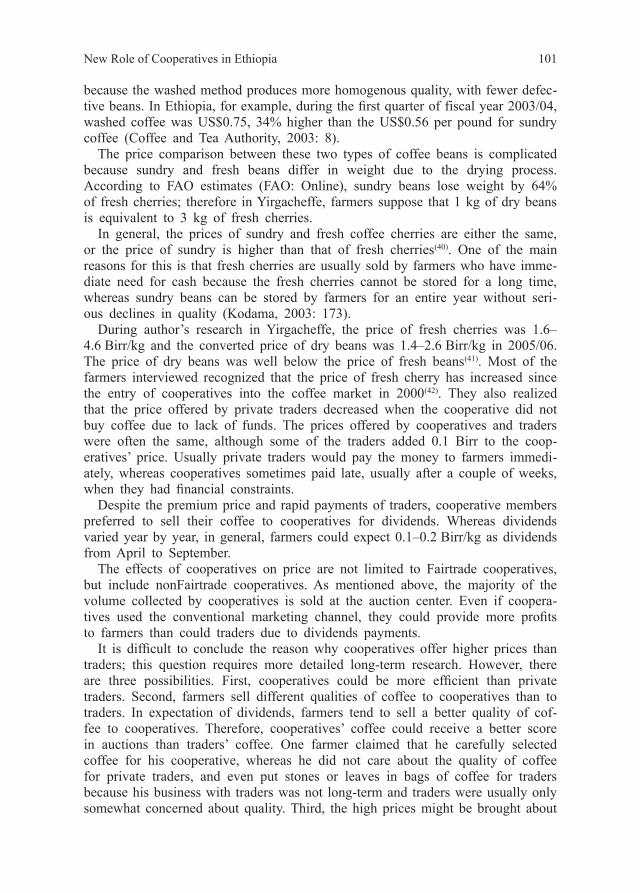
Farmers who have no access to cooperatives use private traders. They choose private traders who are located close to their production places, rather than distant cooperatives. Nonmembers, however, are satisfied with the prices offered by pri-vate traders because private traders offer prices equivalent to those offered by cooperatives. Thus, access to cooperatives seems to be affected by geographical location. The cooperative membership rate of Kochole woreda(35) is low, at 25%, because the woreda covers a wide area with a relatively small proportion of cof-fee producing area, at only 26% of the total land(36) (Table 7).
The female coffee producer interviewed had lost her household’s membership
100 Y. KODAMA
because of the death of her husband. She had not asked for entry to the coop-erative, and had not been asked to join the cooperative. This is only one exam-ple, due to the low interview coverage of women, but could indicate how female household heads are excluded from cooperative membership(37).
3. PriceThere are two types of coffee after initial processing: sundry and washed. For
sundry coffee, farmers dry coffee beans under the sun and traders or cooperatives dry them further and then decorticate them by machine. For washed coffee, farm-ers sell fresh coffee beans to traders or cooperatives immediately after harvesting them and then the traders and cooperatives soak coffee beans in water to ferment and remove their husks(38) (see Photo 4-4). In Ethiopia, the majority of coffee exported is the sundry type, at 73% of total export for the fiscal year 2005/06(39). The international price of washed coffee is usually higher than for sundry coffee
Table 7. The Coffee Cooperatives Membership Ratio by Woreda in Gedeo Zone*.
Woreda Total Area (ha)
Coffee Production Area (ha)
Number of Cooperatives
Memberships (2005)
% of coffee land holders
Yirga Cheffe 7,596 3,153 7 13,961 52Wonago 8,756 4,500 10 19,305 49Bule 9,099 556 1 2,426 47Kochore 22,254 5,836 3 7,274 25
Total 47,705 14,045 21 42,966 43
Source: Gedeo Zone Cooperative Promotion Bureau unpublished data; Central Agricultural Census Commission, 2003b.Note: * YCFCU has a cooperatives located in the special woreda which does not belong to any zone. It is not included in this table since the cooperative has just started the activity.
Table 6. Average Profile of Farmers Interviewed in Gedeo Zone.
(n) Age Education(grade)
Area*1
(ha)
Coffee Production*2
(kg)
Cooperative AreaMember 15 42 6.3 1.70 1,149Non-Member 5 28 6.4 0.52 452
Non-Cooperative AreaNon-Member*3 3 48 4.7 2.83 1,502
Source: Field survey by the author.Note: *1 The production area is different from the census data at 0.3 ha (Central Agricultural Census
Commission 2003a). This is likely due to the tendency of lower statement for the official research and the possibility to include all the land of the family even of the independent sons for the author’s research.
*2 Converted volume based on the weight difference between fresh and dry beans from FAO estimate (FAO. Online. http://www.coffee-ota.org/3_7_property.asp (accessed on February 5, 2007)).
*3 One out of four farmers was excluded, because his data seemed to be outlier with age of 84 and coffee production of 5,000 kg.
101New Role of Cooperatives in Ethiopia
because the washed method produces more homogenous quality, with fewer defec-tive beans. In Ethiopia, for example, during the first quarter of fiscal year 2003/04, washed coffee was US$0.75, 34% higher than the US$0.56 per pound for sundry coffee (Coffee and Tea Authority, 2003: 8).
The price comparison between these two types of coffee beans is complicated because sundry and fresh beans differ in weight due to the drying process. According to FAO estimates (FAO: Online), sundry beans lose weight by 64% of fresh cherries; therefore in Yirgacheffe, farmers suppose that 1 kg of dry beans is equivalent to 3 kg of fresh cherries.
In general, the prices of sundry and fresh coffee cherries are either the same, or the price of sundry is higher than that of fresh cherries(40). One of the main reasons for this is that fresh cherries are usually sold by farmers who have imme-diate need for cash because the fresh cherries cannot be stored for a long time, whereas sundry beans can be stored by farmers for an entire year without seri-ous declines in quality (Kodama, 2003: 173).
During author’s research in Yirgacheffe, the price of fresh cherries was 1.6–4.6 Birr/kg and the converted price of dry beans was 1.4–2.6 Birr/kg in 2005/06. The price of dry beans was well below the price of fresh beans(41). Most of the farmers interviewed recognized that the price of fresh cherry has increased since the entry of cooperatives into the coffee market in 2000(42). They also realized that the price offered by private traders decreased when the cooperative did not buy coffee due to lack of funds. The prices offered by cooperatives and traders were often the same, although some of the traders added 0.1 Birr to the coop-eratives’ price. Usually private traders would pay the money to farmers immedi-ately, whereas cooperatives sometimes paid late, usually after a couple of weeks, when they had financial constraints.
Despite the premium price and rapid payments of traders, cooperative members preferred to sell their coffee to cooperatives for dividends. Whereas dividends varied year by year, in general, farmers could expect 0.1–0.2 Birr/kg as dividends from April to September.
The effects of cooperatives on price are not limited to Fairtrade cooperatives, but include nonFairtrade cooperatives. As mentioned above, the majority of the volume collected by cooperatives is sold at the auction center. Even if coopera-tives used the conventional marketing channel, they could provide more profits to farmers than could traders due to dividends payments.
It is difficult to conclude the reason why cooperatives offer higher prices than traders; this question requires more detailed long-term research. However, there are three possibilities. First, cooperatives could be more efficient than private traders. Second, farmers sell different qualities of coffee to cooperatives than to traders. In expectation of dividends, farmers tend to sell a better quality of cof-fee to cooperatives. Therefore, cooperatives’ coffee could receive a better score in auctions than traders’ coffee. One farmer claimed that he carefully selected coffee for his cooperative, whereas he did not care about the quality of coffee for private traders, and even put stones or leaves in bags of coffee for traders because his business with traders was not long-term and traders were usually only somewhat concerned about quality. Third, the high prices might be brought about

102 Y. KODAMA
simply by the upward international price trend. Their sustainability needs more examination over the long term because it is not known how cooperatives would manage in the case of a downturn of the international price of coffee.
Of the 24 farmers interviewed, 22 sell more dry beans than fresh beans, despite the higher price of the latter. Cooperatives do not yet handle the sale of dry cher-ries due to the limits of funds and transportation. Other reasons of the higher ratio of dry beans might include income leveling and some speculation in the international coffee price. To secure a constant income throughout the year, farm-ers do not sell all of their coffee at one time. The Ministry of Agriculture also advises farmers to maintain a stock of coffee and not to spend all of their income from coffee at once(43).
4. Cooperatives and farmersThe basic procedures of the selection of management members of the coop-
eratives appear democratic. Members interviewed did not claim any unfairness and understood that the working members of the cooperatives are farmers or the children of farmers. They attended meetings and raised their hands indicating approval for the executive members. It is apparent, however, that the coopera-tives are not actually operated by the farmers themselves. Most of the interviewees regarded the cooperatives in the same way that they viewed the service cooper-atives of the previous regime. They often compared them in terms of service activities and coffee price. Interviews revealed that the cooperative is in fact a customer of coffee farmers, rather than “their” organization.
CONCLUSION
Coffee cooperatives have brought benefits to coffee farmers by providing a new marketing channel. The dividends are appreciated by farmers and have encour-aged farmers to improve the quality of their coffee. Although the actual volume purchased by cooperatives is limited due to financial constraints, the existence of cooperatives in the coffee market has improved the purchasing price offered by private traders because of competition with the cooperatives.
The Fairtrade option has made cooperative activities more attractive to farmers in terms of pricing. However, the market is limited and the FLO qualification is too strict for all of the primary cooperatives in Ethiopia to satisfy all of the con-ditions. With the successful progress of the first three coffee unions, more coop-eratives and more unions have been established. The first three unions received various types of support from the government and international aid agencies such as USAID. Latecomers may not enjoy such support. Considering their under-developed management skills, the expansion of cooperative activities may not proceed as well as of the first three unions. Competition among unions has begun, in addition to competition with private traders.
It is too early to evaluate the activities of coffee cooperatives because they began only in 1999, but at this point, the effects of the cooperatives appear posi-tive for farmers, especially in terms of price. Improving the management capabilities
103New Role of Cooperatives in Ethiopia
and accounting skills of cooperatives is critical for the development and sustain-ability of cooperative activities.
ACKNOWLEDGEMENTS I express sincere gratitude to all those in Ethiopia who con-tributed to this study. Special thanks go to Ato Birhanu Deyasso of YCFCU, Ato Zenebe Worku of SNNPR Cooperative Bureau, and Ato Endarekachew of Gedeo Zone Coopera-tive Bureau. Thanks also to Ato Dessalegn and Ato Tilahun of OCFCU, Ato Ashanafi of SCFCU, Ato Asafa, Mr. Geoffrey Wetherell of Ambassa Enterprises, Dr. Chala of the FLO, Ato Hine of VOCA-Ethiopia, and Dr. Haile, Ato Abraham, and Ms. Tsega of the Federal Cooperative Commission. I am also grateful to Dr. Surendra Kotecha for helpful support. This study was supported by Grants-in-Aid for Scientific Research from the Min-istry of Education, Culture, Sports, Science and Technology ((A)(1)16252005 project leader Associate Prof. Jun Ikeno, Kyoto University and (A)(1)15251010, project leader: Prof. Shun Sato, Tsukuba University).
NOTES
( 1 ) The policy of economic liberalization was instituted in 1990 by the previous Derg re-gime as “the 1990 Economic Reform Program.” However, the regime collapsed in 1991 before the policy had significant effects.
( 2 ) The averages of the export values for fiscal years 1995/96 and 2004/05 are based on figures from the National Bank of Ethiopia (2005). The Ethiopian fiscal year runs from 8 July to 7 July.
( 3 ) The official name of the exchange market is The Coffee, Sugar and Cocoa Exchange (CSCE). The CSCE handles the Arabica type of coffee. Robusta coffee is handled by the London International Financial Futures and Options Exchange (LIFFE) in London.
( 4 ) Strictly speaking, private traders can participate in the Fairtrade business as long as they satisfy certain conditions. See the following section for details of Fairtrade.
( 5 ) I use the name “Derg” for the previous government from 1974 to 1991 because although the government professed its aim to build a socialist state, it actually remained a military state during the entire regime. Derg was the Amharic name (originally meaning “com-mittee” or “Council”) of the Coordinating Committee of the Armed Force, Police and Territorial Army (Marcus, 1994: 187; Ofcansky & Berry, 1993: 53).
( 6 ) Kodama (2003) mentioned the decline of the Ethiopia Coffee Purchase and Sales Enter-prise (ECPSE), and not specifically the service cooperatives (SCs). Considering the role of service cooperatives during the previous regime, however, the SCs can be identified as agents of the state marketing corporations in important aspects (Samia, 1989).
( 7 ) Prior to No. 147/1998, Proclamation No. 85/1994 was issued in 1994 with the title of “Agricultural Cooperative Societies Proclamation” under the transitional government of Ethiopia, which was the predecessor of the Federal Democratic Republic of Ethiopia. It was replaced by No. 147/1998, issued by the Federal government.
( 8 ) This was also permitted by No. 85/1994.( 9 ) The available information concerning unions is from the Oromiya, Yirgacheffe and
Sidama Coffee Farmers Cooperative Unions. It does not include the remaining three because they were newly established and I did not have access to their information.
(10) This kind of swindle was also reported in cases between exporters and private traders

104 Y. KODAMA
(Kodama, 2003).(11) Based on interviews with the Southern Cooperative Promotion Bureau on July 19 and
VOCA-Ethiopia on July 24, 2006.(12) According to an interview with the Federal Cooperative Commission on July 24, 2006,
the decision is made by unions, not by cooperatives.(13) The share will be used for “the capital which enables the society to expand its work ac-
tivities” (No. 147/1998).(14) Proclamation No. 402/2004 (“Cooperative Societies [Amendment] Proclamation”) is the
amendment of No. 148/1998.(15) Based on the author’s interviews with YCFCU on July 18 and OCFCU, VOCA-Ethiopia,
and the Federal Cooperative Commission on July 24, 2006.(16) The Fairtrade labeling system was introduced in the Netherlands in 1988.(17) There are criticisms to the labeling approach in terms of the original concept of Fairtrade
because the standardized method enables multinational enterprises to be certified as Fairtrade organizations. This situation is against the original concept of Fairtrade, which was to bring alternative trading channels to the conventional marketplace (Hotta, 2006; Tsujimura, 2006).
(18) For the detailed conditions, see FLO: Online c.(19) Data are from the OCFCU, YCFCU, and SCFCU. According to the FLO, only these
three unions had received the FLO certificate as of May 2006 (FLO: Online d.).(20) Based on unpublished data from the Oromiya, and Yirgacheffe Coffee Farmers Coopera-
tive Unions, and the Ministry of Agriculture. The data of the Sidama Farmers Coopera-tive Unions was not available.
(21) Based on the author’s interview with the SCFCU on 18 July and VOCA-Ethiopia on July, 24 2006.
(22) The export volume share of organic coffee was 0.9% in 2005, calculated by author based on total export volume data and organic coffee of the member countries of the Interna-tional Coffee Organization (ICO: Online a; ICO: Online e). Baffes et al. (2004: 307) estimated that organic coffee had a consumption share of 0.6% in 2002/2003, with 1.2–2.8% in some European countries, 1.1% in the U.S., and 0.5% in Japan.
(23) Based on the comparison between the number of memberships of the YCFCU and the coffee land holders by woreda from the Central Agricultural Census Commission (2003b).
(24) This includes all landholders of coffee and noncoffee production.(25) According to the interview with YCFCU on July 18, 2006, the YCFCU currently focuses
on the dividends to the coffee volume contributors, rather than the shareholders, because they want to encourage coffee farmers to sell coffee to cooperatives.
(26) The 7,744 tons of coffee purchased by the primary cooperatives in 2004/05 was assumed to comprise 23% of the total shipment out of the Gedeo Zone, based on unpublished data from the Ministry of Agriculture.
(27) One cooperative (Chichu) without any certificates enjoyed high dividends. However, it must be considered that its membership ratio was much lower, at 6% than average ratio at 17%. The cooperative might buy coffee more selectively.
(28) The reason of the loss for the cooperative is not clear.(29) Based on the mimeo of the Gedeo Zone Cooperative Promotion Bureau. The data shows
the different figures between the sum of net profits of primary cooperatives and the net profits of primary cooperative total. This paper used the former.
(30) According to the interview with VOCA-Ethiopia and a USAID press release (USAID Ethiopia. Online), the financial problem has been mitigated since the USAID Develop-ment Credit Authority (DCA) started the Long Guarantee Scheme for coffee in 2000.
105New Role of Cooperatives in Ethiopia
The scheme aims to finance the purchasing fund of banks without the need for collateral. The DCA guarantees 50% of loans to leverage their funds up to 25 times. For details, see Dorsey and Tesfaye (2005).
(31) Based on the author’s interviews with SCFCU on July 18, 2006 and OCFCU on July 24, 2006.
(32) Based on data from fiscal years 2004/05 and 2005/06 from the Ministry of Agriculture. The data does not include the shipment volume to the inspection center at Dire Dawa.
(33) For enset, see Tsedeke et al. (1996).(34) The land is usually divided for inheritance among sons (Ayalew et al., 1996). Therefore
the land of the son’s generation is typically much smaller than that of the father’s gen-eration.
(35) The administrative divisions have four levels, namely region, zone, woreda, and qebele, in order of decreasing size.
(36) Another geographical reason might be the difficulty of gathering members in Kochole woreda because the coffee production areas are separated by noncoffee production areas (USAID & DPPA/B: Online).
(37) There is a possibility for female-headed households to use the son’s membership.(38) In Ethiopia, coffee farmers do not process coffee by themselves except to dry it under the
sun. This is likely because farmers lack the capital to do so, and supposedly because of a directive from the Ministry of Agriculture to maintain export quality.
(39) Based on unpublished data from the Ministry of Agriculture.(40) Based on the author’s survey in the Oromiya Region in 2002. The research by Ayalew et
al. (1996: 7) also mentioned the price of fresh and dry beans in the Gedeo Zone before the union was established. The converted price of the dry beans (2.9 Birr/kg) was higher than the price of fresh beans (2 Birr/kg) in their research area, Adado, in Gedeo Zone.
(41) The sales season for fresh beans is from October to December and the season for dry beans is after January. The trend in the international coffee price for Natural Arabicas, which includes Ethiopian coffee, was upward from $0.94 US/lb in October 2005 to $1.09 US/lb in February 2006), an increase of 16% (ICO: Online d). Therefore, the higher price of fresh beans did not result from the international price decrease during the dry bean season.
(42) Considering the downward trend in the international price of coffee in 1998–2001 and the upward trend after 2002, it is difficult to conclude that the price increase was brought about solely by the cooperatives in the long term.
(43) Based on an interview with a farmer on July 21, 2006.
REFERENCES
* Ethiopian names are written in order of the author’s name and father’s name.
Ayalew Gebre, Abeje Berhanu & Amaha Kenenie 1996. Ethiopian Village Studies; Adado, Gedeo. Online. http://www.csae.ox.ac.uk/evstudies/main.html (accessed on February 5, 2007).
Baffes, J., R. Lewin & P. Varangis 2004. Coffee: Market setting and policies. In (M.A. Aksoy & J.C. Beghin, eds.) Global Agricultural Trade and Developing Countries, pp. 297-309. World Bank, Washington, D.C.
Barrat Brown, M. 1993. Fair Trade: Reform and Realities in the International Trading System. Zed Books, London.
Befekadu Degefe & Tesfaye Tafesse 1990. The marketing and pricing agricultural products in
106 Y. KODAMA
Ethiopia. In (S. Pausewang, Fantu Cheru, S. Brune & Eshetu Chole, eds.) Ethopia: Rural Development Options, pp. 111-120. Zed Books, London.
Braverman, A., J.L. Guasch, M. Huppi & L. Pohlmeier 1991. Promoting Rural Cooperatives in Developing Countries: the Case of Sub-Saharan Africa. World Bank, Washington, D.C.
Central Agricultural Census Commission 2003a. Ethiopian Agricultural Sample Enumeration, 2001/02(1994E.C.), Results for Southern Nations, Nationalities and Peoples’ Region, Statistical Report on Socio-Economic Characteristics of the Population in Agricultural Households and Land Use, Part I. Central Statistical Authority, Addis Ababa.
— 2003b. Ethiopian Agricultural Sample Enumeration, 2001/02(1994E.C.), Results for Southern Nations, Nationalities and Peoples’ Region, Statistical Report on Area and Production of Crops, Part II.B. Central Statistical Authority, Addis Ababa.
Central Statistical Agency 2006. Ethiopia: Statistical Abstract 2005. CSA, Addis Ababa.Central Statistical Authority 1996. The 1994 Population and Housing Census of Ethiopia
Results for Southern Nations, Nationalities and Peoples’ Region, Volume 1, Part I, Statis-tical Report on Population Size and Characteristics. CSA, Addis Ababa.
Coffee and Tea Authority 2003. Coffee Bulletin, 9(35). Addis Ababa.Couture, M.-F., D. Faver, M. Levin & A.-B. Nippierd 2002. Transition to Cooperative
Entrepreneurship: Case Studies from Armenia, China, Ethiopia, Ghana, Poland, Russia, Uganda and Vietnam. International Labour Office, Geneva.
Dessalegn Rahmato 1990. Cooperatives, state farms and smallholder production. In (S. Pausewang, Fantu Cheru, S. Brune & Eshetu Chole, eds.) Ethiopia: Rural Development Options, pp. 100-110. Zed Books, London.
— 1994a. The unquiet countryside: The collapse of ‘Socialism’ and rural agitation, 1990 and 1991. In (Abebe Zegeye & S. Pausewang, eds.) Ethiopia in Change: Peasantry, Nationalism and Democracy, pp. 242-279. British Academic Press, London/New York.
— 1994b. Land, peasants and the drive for collectivization in Ethiopia. In (T.J. Bassett & D.E. Crummey, eds.) Land in African Agrarian System, pp. 274-297. University of Wisconsin Press, Madison.
— 2002. Civil society organizations in Ethiopia. In (Bahru Zewde & S. Pausewang, eds.) Ethiopia: the Challenge of Democracy from Below, pp. 103-119. Nordiska Afrikain-stitutet, Uppsala and Forum for Social Studies, Addis Ababa.
Dorsey, J. & Tesfaye Assefa 2005. Final Evaluation Report of Agricultural Cooperatives in Ethiopia (ACE) Program Activities. USAID, Washington, D.C. and Online. http://pdf.usaid. gov/pdf_docs/PDACG205.pdf (accessed on February 5, 2007).
Eicher, C.K. & D.C. Baker 1982. Research on Agricultural Development in Sub-Saharan Africa: a Critical Survey. Michigan State University, Michigan.
Fantu Cheru 1990. Options for rural development in Ethiopia: the international context. In (S. Pausewang, Fantu Cheru, S. Brune & Eshetu Chole, eds.) Ethiopia: Rural Development Options, pp. 69-78. Zed Books, London.
FAO. Online. Physical Properties of Coffee, Reducing Ochratoxin A in Coffee, http://www.coffee-ota.org/3_7_property.asp (accessed on February 5, 2007).
FLO (Fairtrade Labelling Organizations International). Online a. Fairtrade Standards for Coffee for Small Farmers Organisations, http://www.fairtrade.net/fileadmin/user_upload/content/Coffee_SF_Dec_05_EN.pdf (accessed on February 5, 2007).
— Online b. Sales Volumes of Fairtrade-Certified Coffee per Country in 2004/2005(in MT),http://www.fairtrade.net/fileadmin/user_upload/content/sales_volumes_coffee.jpg (accessed on February 5, 2007).
— Online c. Standards, http://www.fairtrade.net/standards.html (accessed on February 5, 2007).
107New Role of Cooperatives in Ethiopia
— Online d. Number of Coffee Producers per Country, http://www.fairtrade.net/fileadmin/ user_upload/content/producers_coffee.jpg (accessed on February 5, 2007).
Furusawa, K. 2004. Environmental and social responsibilities of agricultural trade and busi-ness: Integration of organic and Fairtrade (in Japanese). Nogyo to Keizai, 70(4): April 2004, pp. 42-50.
Gedeo Zone Cooperative Promotion Bureau n.d. Gedeo Zone Cooperative Profit and Loss Quotation in the 1997 Harvest year (in Amharic). mimeo.
Gezachew Abegaz 1994. Tenure issues in coffee growing areas: a case study of Manna and Gomma Woredas. In (Dessalegn Rahmato, ed.) Land Tenure and Land Policy in Ethiopia After the Derg (Proceedings of the Second Workshop of the Land Tenure Project), pp. 216-227. Institute of Development Research (Addis Ababa University), Addis Ababa.
Hotta, M. 2006. The Current situation and problems of Fairtrade at the crossroads (in Japanese). at, 3: 35-38.
ICO (International Coffee Organization). Online a. Historical Data (Exports of exporting Members (calendar year), http://www.ico.org/asp/display2.asp (accessed on February 5, 2007).
— Online b. Historical Data (Prices paid to growers in exporting Member countries), http://www.ico.org/asp/display7.asp (accessed on February 5, 2007).
— Online c. Historical Data (Supply data of exporting Members (crop years)), http://www.ico.org/asp/select1.asp (accessed on August 10, 2006).
— Online d. ICO Indicator Prices: Monthly and Annual Averages, 2004 to 2007, http://www.ico.org/prices/p2.htm (accessed on February 5, 2007).
— Online e. Organic coffee export statistics - Calendar year 2005, http://www.ico.org/show_document.asp?id=1219 (accessed on February 5, 2007).
KFCFCU (Kafa Forest Coffee Farmers Cooperative Union). n.d. Kafa Forest Coffee Union, leaflet.
Kherallas, M., C. Delgado, E. Gabre-Madhin, N. Minot & M. Johnson 2002. Reforming Agricultural Markets in Africa. Johns Hopkins University Press, Baltimore.
Kodama, Y. 2003. The role of the auction system in coffee marketing in Ethiopia: an arena for competition and price formation arranged by the government (in Japanese). In (T. Takane, ed.) Agricultural Marketing in Asia and Africa, pp. 155-187. Institute of Developing Economies, Chiba.
Krier, J.-M. 2005. Fair Trade in Europe 2005: Facts and Figures on Fair Trade in 25 European Countries. Fair Trade Advocacy Office, Brussels. In FLO. Online. http://www.fairtrade.net/fileadmin/user_upload/content/FairTradeinEurope2005.pdf (accessed on February 5, 2007).
Marcus, H.G. 1994. A History of Ethiopia. University of California Press, Berkeley.National Bank of Ethiopia 2005. Quarterly Bulletin, Fiscal Year Series, 21(1) First Quarter,
2005/06. National Bank of Ethiopia, Addis Ababa. Nerzy, E., F. Yakam-Simen, Tadesse Kippie K. & P. Romeijn 2000. Gedeo Zone Mapping
Project Phase 2 Final Report. In Treemail, Heelsum. Online. http://www.treemail.nl/download/gedeoweb.pdf#search=%22Gedeo%20Zone%20Mapping%20Project%22 (accessed on February 5, 2007).
Ofcansky, T.P. & LaVerle Berry, eds. 1993, Ethiopia: a Country Study (4th Edition). Federal Research Division, Library of Congress, Washington, D.C.
OCFCU (Oromia Coffee Farmers Cooperative Union). n.d. Profile of Oromia Coffee Farmers Cooperative Union/OCFCU LTD, mimeo.
Samia Zakaria Gutu 1989. Policy Options for Ethiopia’s Coffee Exports. Center for Economic Research on Africa, School of Business, Montclair State University, New Jersey (PDF version October 2000).

108 Y. KODAMA
SCFCU (Sidama Coffee Farmers Cooperative Union). n.d. Sidama Coffee Farmers Cooperative Union, leaflet.
Tadesse Kippie 2002. Five Thousand Years of Sustainability? A Case Study on Gedeo Land Use (Southern Ethiopia). In Treemail, Heelsum. Online. http://www.treemail.nl/download/ treebook5.pdf#search=%22Five%20thousand%20of%20Sustainability%22 (accessed February 5, 2007).
Tessema Chekun Awoke 1994. Land tenure issues in high potential coffee growing areas: Overview of south western Ethiopia (Keffa, Illubabor, Wollega). In (Dessalegn Rahmato, ed.) Land Tenure and Land Policy in Ethiopia after the Derg (Proceedings of the Second Workshop of the Land Tenure Project), pp. 202-215. Institute of Development Research (Addis Ababa University), Addis Ababa.
Transfair USA. Online. 2005 Fair Trade Coffee: Facts and Figures, http:www.transfairusa.org/content/Downloads/2005Q2FactsandFigure.pdf (accessed on February 5, 2007).
Tsedeke Abate, C. Hiebsch, S.A. Brandt & Seifu Gebremariam 1996. Enset-based Sustainable Agriculture in Ethiopia. Institute of Agricultural Research, Addis Ababa.
Tsujimura, H. 1999. Rural Cooperatives in Southern Africa (in Japanese). Nihon Keizai Hyoron Sha, Tokyo.
— 2006. The nature of the coffee industry and Fairtrade in Japan (in Japanese). at, 3: 60-71.
UN Emergencies Unit for Ethiopia. Online. Administrative Regions and Zones of Ethiopia, http://www.africa.upenn.edu/eue_web/newzones.gif (accessed on February 5, 2007).
USAID Ethiopia. Online. Press Releases/Events: USAID Extends Agricultural Marketing Credit to Ethiopian Agribusinesses (posted on October 25, 2004), http://www.usaidethiopia. org/info.asp?IID=19&CMID=22 (accessed on February 5, 2007).
USAID & DPPA/B. Online. Southern Nations Nationalities and People’s Region (SNNPR) Livelihood Profiles, Regional Overview. In Disaster Prevention and Preparedness Agency. http://www.dppc.gov.et/Livelihoods/Downloadable/Regional%20Overview.pdf (accessed on February 5, 2007).
YCFCU (Yirgacheffe Coffee Farmers Cooperative Union). 2005. Yirgacheffe Coffee Farmers Cooperative Union 1995–1997 3-Year Activities Major Achievement (in Amharic). Unpublished, Addis Ababa.
— n.d. Yirgacheffe Coffee Farmers Cooperative Union, leaflet.
— Accepted February 6, 2007
Author’s Name and Address: Yuka KODAMA, Area studies Center, Institute of Developing Economies, JETRO, 3-3-2, Wakaba, Mihama-ku, Chiba-shi 261-8545, JAPAN.E-mail: [email protected]

109New Role of Cooperatives in Ethiopia
Photo 4-1: Enset and coffee are often planted together (Jul.2006).
Photo 4-2: Enset and coffee are planted around a house (Jul.2006).
Photo 4-3: Maize is another important staple food (Jul.2006).
Photo 4-4: Washed coffee station by a private trader (the grass area behind will be covered with stands for drying coffee in the harvest season) (Jul.2006).
Photo 4-5: Coffee auction at Addis Ababa. Exporters at the right side and private traders at the left side (Mar.2002).
Photo 4-6: Coffee display at the auction. All beans are graded beforehand by the inspection center (Mar.2002).