Embed Size (px)
Citation preview
UNIVERSITY OF LISBON
FACULTY OF SCIENCES
PHYSICS DEPARTMENT
NEW SCINTILLATORS FOR NUCLEAR MEDICINE
MASTER THESIS
Rui Gonçalo Azinheiro
INTEGRATED MASTER’S IN BIOMEDICAL ENGINEERING AND
BIOPHYSICS -
CLINICAL ENGINEERING AND MEDICAL INSTRUMENTATION
2013
UNIVERSITY OF LISBON
FACULTY OF SCIENCES
PHYSICS DEPARTMENT
NEW SCINTILLATORS FOR NUCLEAR MEDICINE
MASTER THESIS
Rui Gonçalo Azinheiro
INTEGRATED MASTER’S IN BIOMEDICAL ENGINEERING AND
BIOPHYSICS -
CLINICAL ENGINEERING AND MEDICAL INSTRUMENTATION
Supervisor in Philips Research: Dr. Herfried Wieczorek
Internal Supervisor: Dr. Pedro Almeida
2013

ii
“A journey is best measured in friends, not in miles.”
- Tim Cahil

iii
Rui Azinheiro
AKNOWLADGEMENTS
My first big thank you will go to Herfried Wieczorek for giving me this great
opportunity and experience, and also for his availability, advising, trust and guiding during
these 8 months and also for the help in the thesis. I also want to thank very much to the whole
team that participated in the scintillator project while I was there for helping me with
everything that I needed. Another acknowledgement goes to everybody on the department for
welcoming me there. Here a special thank you to Odette and Wilma our amazing secretaries.
I also want to thank to Pedro Almeida, my supervisor in the University for the
Availability and the help through this process and through all the help during these 6 years in
during the course. I also want to thank all the teachers that were with me during all of these
years especially to Eduardo Ducla Soares.
Going back to Philips, I also want to thank a lot, really a lot, to Pedro and Andreia for
being my Portuguese comrades of all the time in the cold Eindhoven, remembering me that
there is always a place where the sky is blue and the Sun actually “works”. This thank you is
also for all the professional help and I thank even more the help teaching me the ways of the
Dutch.
A big thank you, also, to my Portuguese friends of all time for supporting me every
time that I needed. I also want to thank them for all the support during my university years,
here a special note for my Lisbon friends: you made all of these years easy.
Now, a very very special thank you to my family! Always there for everything that I
need, always supportive, always together.
Last but not least, I want to thank and dedicate this work to my Eindhoven friends.
You were like a family during these months! You made everything special, you made
Eindhoven enjoyable and most of all unforgettable. This thank you is specially directed to
Giulia, Johan, Sahil, Ale, Maureen, Ricardo, Paki; to the best housemates: Fons, Mehdi, Yan
and Sandra. And of course, my last special thank you is to Chiara, the best gift that Eindhoven
gave me.

New scintillators for Nuclear Medicine
iv
Rui Azinheiro
RESUMO
Um equipamento de Tomografia por Emissão de Positrões (PET) é um equipamento
utilizado em imagiologia médica que recorre à introdução de radiofármacos que emitam
positrões, no interior do corpo do paciente. Os positrões são rapidamente aniquilados quado
em contacto com electrões, emitindo neste processo dois fotões com uma energia de 511 keV
(radiação-) que viajam em direcções opostas e serão detectados no anel de detectores
presente dos equipamentos de PET. O percurso realizado por cada par de fotões é denominado
linha de resposta (LoR). É a informação de múltiplas LoR que permitem a reconstrução e
obtenção da imagem em PET. Os radiofármacos utilizados apresentam características
semelhantes à glucose, permitindo assim o seu alojamento e consequente detecção em locais
onde o metabolismo é mais elevado. O elevado metabolismo está frequentemente associado a
doenças oncológicas, sendo esta a principal utilização do equipamento de PET.
Actualmente os equipamentos de PET mais modernos utilizam, em conjunto com a
LoR, a informação do tempo de voo de cada um dos fotões, originado assim os scanners de
Time of Flight (TOF) PET. A utilização do tempo de voo é realizada através da diferença de
tempo registada entre a detecção de cada fotão no anel de detectores. Essa diferença de tempo
é posteriormente utilizada para calcular a posição da aniquilação através da fórmula: x = c(t1
– t2)/2. As vantagens da utilização de TOF PET são a redução do ruído e uma maior precisão
na imagem. O uso da informação do tempo de voo permite também a redução da dose de
radionuclídeo utilizada em cada exame, já que para a reconstrução da imagem são necessárias
menos contagens. Este facto leva também a que o tempo de exame menor.
A principal diferença entre um equipamento de PET convencional e um equipamento
TOF PET encontra-se nos detectores utilizados, sendo cada um destes detectores constituído
por um cintilador e por um fotodetector. O cintilador tem a função de converter a radiação
proveniente do paciente em radiação visível que será posteriormente detectada e convertida
num sinal mensurável no fotodetector.
Os desafios da utilização de TOF PET prendem-se com a resolução temporal dos
detectores. Os detectores utilizados hoje em dia possuem uma resolução temporal de ~500ps,
o que equivale a uma resolução espacial de ~7.5cm. Esta resolução espacial está longe de
permitir que um scanner utilize exclusivamente a informação do tempo de voo num exame,
sendo portanto necessário incluir esta informação nos métodos de reconstrução
convencionais, para gera assim uma imagem melhor. Para além desta característica, os
cintiladores utilizados em PET são muito caros.
New scintillators for Nuclear Medicine
v
Rui Azinheiro
O trabalho realizado na Philips Research Eindhoven teve como objectivo encontrar
novos cintiladores que apresentassem uma eficiência tão próxima quanto possível dos
cintiladores utilizados hoje em dia em Time of Flight (TOF) PET e que apresentassem um
custo de produção mais baixo. Para termos de comparação de resultados foram utilizados os
cristais de LYSO, presentes nos sistemas da Philips e os cristais produzidos por uma empresa
concorrente, os Furukawa.
Nesta investigação foram utilizados cintiladores cerâmicos, em contraponto aos
cristais únicos utilizados hoje em dia nos sistemas de PET (LYSO, GSO e LSO). A grande
diferença entre estes dois tipos de cintiladores é a estrutura, já que um cristal único apresenta
uma estrutura cristalina única e uma cerâmica/garnet é o resultado de uma agregação de
várias estruturas microscristalinas. No entanto o princípio de acção de ambos é semelhante.
Os testes realizados incluíram dois tipos diferentes de medições, com diferentes
fotodetectores. O primeiro tipo de medições era efectuado em PMTs à temperatura ambiente.
As medições nos PMTs eram efectuadas para avaliar o tempo de decaimento de cada
cristal/disco/pó, já que foram feitas análises aos três estágios das cerâmicas para tentar avaliar
a relação existente entre eles. Para uma maior eficácia na análise dos resultados foi inserido o
cálculo do tempo de decaimento efectivo ( . Este parâmetro foi
ambém utilizado para estimar os valores de CRT de cada cristal medido. O outro tipo de
medições realizado foi realizado com arrays de 8x8 cristais em acoplados a um fotodetector
digital de silicone, sendo que os anel exterior do array era constituído por duas filas de
cristais de LYSO e no centro eram colocados os garnets que se pretendiam medir. Em ambos
os casos as medições foram realizadas em coincidência para que fossem reproduzidas as
condições encontradas num scanner real. As medições com os d-SiPMs foram realizadas
numa câmara climática a 5ºC para optimizar a eficiência do detector. Esta temperatura mais
baixa não devia afectar o desempenho do cintilador. A principal diferença entre um PMT e
um d-SiPM é a digitalização do sinal logo após a detecção que ocorre no segundo detector.
Isto permite que o sinal possa ser lido mais rápido e com um menor ruído devido à utilização
de trigger levels que permite eliminar contagens aleatórias (Dark counts) que ocorram durante
a aquisição do sinal. Um outro mecanismo utilizado para melhorar o sinal destes
fotodetectores é a realização de um dark count map, que bloqueia a aquisição das contagens
das células do detector que contenham um maior número de contagens aleatórias.
As medições com PMTs permitiram também identificar a presença em todas as
amostras de componentes lentas de decaimento/afterglow. No entanto para estimar o valor de
New scintillators for Nuclear Medicine
vi
Rui Azinheiro
CRT foi utilizada apenas a primeira componente de decaimento, já que esta é a que mais
contribui para o valor absoluto deste parâmetro.
A principal diferença entre os garnets que foram medidos era a sua composição. A
principal diferença entre as amostras deu-se ao nível da composição dos garnets. Estas
alterações incidiram essencialmente na concentração de Ga (entre 2 e 3 mol) e de Ce (entre
0.2 e 1.2% em proporção à concentração de Ga), já que as componentes de Al e Gd
desempenhavam principalmente funções estruturais e o Lu foi utilizado devido à sua elevada
absorção.
Os resultados obtidos demonstraram uma grande influência da concentração de Ga na
CRT dos cintadores, verificando-se que com o aumento da concentração de Ga, tanto o tempo
de decaimento, como o CRT diminuíam, verificando-se assim a dependência que o CR tem
em relação ao tempo de decaimento. Os valores de CRT observados variaram entre 572 e os
1502ps, sendo os melhores valores de CRT obtidos com [Ga]=3 e os piores com [Ga]=2. Esta
diminuição era também acompanhada por uma diminuição do LO, que variaram entre 500 e
os 2000 fotões ópticos. Esta diminuição veio também demonstrar a relação existente entre o
LO e dE/E. Quanto maior o LO, maior o dE/E. Em relação ao aumento da concentração de Ce
verificou-se que quanto maior esta fosse, menor seria o CRT, no entanto este efeito não é tão
evidente como o efeito da concentração de Ga.
Os principais problemas observados nos garnets correspondiam à presença de um
elevado afterglow, bem como à falta de transparência de algumas amostras, que pode ser em
parte explicada pelo método pouco industrializado utilizado na sua construção.
Simultaneamente com o estudo do efeito da composição dos garnets foi também
testada uma teoria para estimar os valores de CRT verificando-se que apesar de algumas
discrepâncias a tendência geral das medições está de acordo com a literatura.
Considerando os resultados obtidos pode considerar-se que o objectivo de encontrar
um garnet que pudesse substituir os cintiladores actualmente utilizados foi alcançado, apesar
de ainda ser necessária alguma investigação num contexto mais industrializado.
Palavras chave: Time of Flight PET, fotão, garnet, LYSO, detector
New scintillators for Nuclear Medicine
vii
Rui Azinheiro
ABSTRACT
The use TOF PET brings some challenges to the medical industry, since these
scanners require that the scintillators used have a specific set of characteristics, but most of all
they need to be fast (low coincidence resolving (CRT) and low decay time) and as less
expensive as possible. In this context lately the research had been focusing on ways to
introduce ceramics in this field. The focus of this work was the study of changing the
concentration of some components in ceramics built using Lu, Ce, Ga, Al and Gd. The
measurements were made using PMTs to measure the decay time in powders/disks/single
crystals and d-SiPMs to measure CRT, Light Output (LO) and energy resolution (dE/E) arrays
built with LYSO and garnets. In the PMTs it was observed the presence of a slow component
in the decay time in every sample. To precisely measure decay time it was introduced the
effective decay time: . The values of were between ~70 and
210ns, being the decay time lower with higher [Ga]. In d-SiPM it was verified that the higher
the amount of Ga the lower is the CRT and the lower is the LO. The values of CRT were
between 572 and 1502ps, and the LO between 500 and 2000 optical photons. The tradeoff
presents a future challenge since it compromises the dE/E of the ceramic. The change in Ce
was similar to the one verified in Ga. The other elements have mainly structural purposes.
Time of Flight PET, photon, garnet, LYSO, Detector
New scintillators for Nuclear Medicine
viii
Rui Azinheiro
CONTENTS
1. INTRODUCTION .................................................................................................................. 1
2. PHYSICAL PRINCIPLES OF NUCLEAR IMAGING ....................................................................... 3
2.1. PHYSICS OF NUCLEAR MEDICINE IMAGING ............................................................................................. 3
2.1.1. ray emission ......................................................................................................................... 3
2.1.2. decay ................................................................................................................................... 4
2.1. FROM ANGER CAMERA TO PET ........................................................................................................... 5
2.1.1. Anger camera and SPECT ........................................................................................................ 5
2.1.2. PET ............................................................................................................................................ 6
3. SCINTILLATORS FOR PET AND SPECT ................................................................................... 12
3.1. INORGANIC SCINTILLATORS IN MEDICAL IMAGING ................................................................................ 12
3.1.1. The LYSO scintillator .............................................................................................................. 18
3.2. PHOTODETECTORS♦ ......................................................................................................................... 19
3.2.1. PMT ........................................................................................................................................ 19
3.2.2. Digital Silicon Photomultipliers............................................................................................. 20
Sensor architecture and characteristics ............................................................................................... 21
4. EXPERIMENTAL METHODS ................................................................................................. 25
4.1. PMT MEASUREMENTS..................................................................................................................... 25
4.1.1. PMT measurements: Analysis............................................................................................... 27
4.2. PHILIPS PDPC TEK MEASUREMENTS ................................................................................................. 27
4.2.1. Preparation of the array for TEK measurements ................................................................ 29
5. RESULTS ........................................................................................................................... 30
5.1. PMT RESULTS ................................................................................................................................. 30
5.1.1. Results from powders:........................................................................................................... 32
Results from disks ................................................................................................................................. 32
Results from sticks ................................................................................................................................ 34
5.2. TEK RESULTS .................................................................................................................................. 35
Overview of TEK results ........................................................................................................................ 36
6. DISCUSSION ...................................................................................................................... 43
7. CONCLUSIONS AND FUTURE WORK .................................................................................... 47
8. REFERENCES ..................................................................................................................... 48
New scintillators for Nuclear Medicine
ix
Rui Azinheiro
TABLE INDEX
Table 1: Physical and Scintillation properties of some scintillators [12] ................................................................... 18
Table 2: Resume of the logic involved in the trigger levels of the Philips D-SiPM sensor, as well as the average
number of photons necessary to activate each trigger level. In the table sp1, 2, 3 or 4 stand for each sub-pixel in
the die. [22] .................................................................................................................................................................... 22
Table 3: General characteristic of the d.SiPM used in this project.[23]..................................................................... 24
Table 4: Resume of the settings used in the PMT measurements. ............................................................................ 26
Table 5: Settings used for the TEK measurements. ..................................................................................................... 28
Table 6: Overview of the relevant results achieved for the sample in which the rise time was measured............. 42
New scintillators for Nuclear Medicine
x
Rui Azinheiro
FIGURE INDEX
Figure 1: Schematic diagram of a conventional gamma camera used in SPECT. [7] ................................................. 5
Figure 2: Left Example of the SPECT scanner, Brightview that belong to Philips portfolio of nuclear medicine
imaging equipment. In this scanner it is possible to see two gamma cameras used for the acquisitions. [26]
Right: example of the image that it is possible to obtain using the Brightview scanner using Tc-99m.[27] ............ 6
Figure 3: Schematic explaining the differences in the acquisition using Time of Flight and a regular PET scanner.
[28] ................................................................................................................................................................................... 7
Figure 4: Example of the image that is possible to get in a PET scanner. On the left is the image of a common
scanner and on the right is the image of a TOF scanner. On that image it is possible to observe the lower noise
level. [29].......................................................................................................................................................................... 9
Figure 5: The four types of events that can be detected in a PET scanner. True events corresponding to the true
detection of both photons that arise from the same annihilation and don‘t suffer any kind of scattering.
Randoms which is the detection of two photons that come from different annihilations but are detected in the
same LOR. There is also the scattering coincidence which can give rise to a false line of response. The last type
of even that can be detected is the spurious coincidence which is another false coincidence originated by a
random photon from another part of the body. [30] ................................................................................................. 10
Figure 6: Example of the shape of the signal obtained in a detector. ....................................................................... 10
Figure 7: Example of a Philips Gemini, a PET CT scanner commercialized nowadays by Philips. [31] .................... 11
Figure 8: Example of a state of the arte PET detector used in the Gemini TF system. In each module LYSO crystals
are glued to a light guide and readout by a set of PMTs. The module offers a CRT time resolution of 480 ps (new
generation) up to 590 ps (second generation). [32] ................................................................................................... 12
Figure 9: Schematic of the type of scintillators available. .......................................................................................... 13
Figure 10: Schematic of the production of light in a scintillator [14] ........................................................................ 14
Figure 11: Energy band structure of an activated crystalline scintillator. [33] ......................................................... 16
Figure 12: Selection of the best elements for being the best host materials for gamma ray measurements based
on the following criteria: toxicity, Energy gap, easy growth and intrinsic radioactivity. [11] ................................. 17
Figure 13: Components of a PMT. [19] ........................................................................................................................ 20
Figure 14: Example of Philips D-SiPM [23]................................................................................................................... 21
Figure 15: Schematic of the validation method that occurs in Philips d-SiPMs. [22] ............................................... 23
Figure 16: On the left Histogram of a dark count map at different temperatures. [21] On the right: a typical
distribution of the PDE of Philips PDPC D-SiPM sensor. [23] ...................................................................................... 24
Figure 17: Schematic of the PMT measurements. ...................................................................................................... 25
Figure 18: On the left, an example of the vikuity case used to measure the sticks. On the right: an example of the
plastic disks containing the powders. .......................................................................................................................... 26
Figure 19: Schematic of the arrays used (top view). The white squares represent the LYSO crystals and the
yellowish ones represent the garnets. ......................................................................................................................... 28
New scintillators for Nuclear Medicine
xi
Rui Azinheiro
Figure 20: Comparison of the signal obtained from different scintillators: Garnet 165-3 (black), LYSO (red) and
Furukawa (Blue). ........................................................................................................................................................... 30
Figure 21: Graphic showing the effects of using different fits to get the values of the decay times. For
comparison is also shown the value of the effective decay time for the same sample............................................ 31
Figure 22: Trend of the effective decay time according to different concentration of cerium and gallium on
sticks. Settings used in the acquisition: trigger 1 and 2 = -80mV; overall acquisition time = 20s. ........................ 31
Figure 23: 2-D plot showing the effect of the Ga content in the decay time The linear fit was used only as a
figure to show the general trend.................................................................................................................................. 32
Figure 24: Graphics with the trends of decay time and effective decay time according to different concentration
of Gallium and Cerium on powders. ............................................................................................................................. 32
Figure 25: Trend of the effective decay time according to different concentration of cerium and gallium on disks.
Settings used in the acquisition: trigger 1 and 2 = -80mV; overall acquisition time = 20s. ................................... 33
Figure 26: Trend of the decay time according to different concentration of cerium and gallium on disks. Settings
used in the acquisition: trigger 1 and 2 = -80mV; overall acquisition time = 20s................................................... 33
Figure 27: Trends showed by the PMT measurements on sticks. .............................................................................. 34
Figure 28: Example of the graphics obtained with Matlab for one of the arrays measured. The two outside layers
are made with LYSO. The core is built with four different garnets, following the schematic presented before.
From left to right, top to bottom there is: The counts, the CRT, the energy resolution and the number of photons.
On top there is the schematic of the disposition of the crystals in the array. ........................................................... 35
Figure 29: Overview of the CRT values of some of the samples measured. The lowest value achieved still belongs
to LYSO, but some of the garnets were able to surpass the values of Furukawa. The four samples inside the circle
are the ones that present better CRT values than the LYSO....................................................................................... 36
Figure 30: Overview of the LO values our garnets. ..................................................................................................... 37
Figure 31: Overview of the dEE results. ....................................................................................................................... 37
Figure 32: Overview of the number of counts normalized to the number of counts of the LYSO............................ 38
Figure 33: CRT behavior in garnets according to the concentration of Ga. .............................................................. 39
Figure 34: Trend of the LO with Ce and Ga content. ................................................................................................... 39
Figure 35: Relation between effective tau and CRT. ................................................................................................... 40
Figure 36: shows an overview of CRT measurements and results of this theory. Blue upward triangles show
results for trigger level 1, purple downward triangles for trigger level 2, while the magenta triangles give the
results of our CRT theory............................................................................................................................................... 40
Figure 37: Relation between Energy resolution and the number of photons. .......................................................... 41
New Scintillators for Nuclear Medicine
1
Rui Azinheiro
1. INTRODUCTION
Nuclear Medicine Imaging has acquired a great importance in medical diagnosis in the
last decades. These techniques, that started with the Anger camera and have later lead to the
introduction of SPECT, PET/CT and PET/MR systems, assume great importance in the
detection of most of physiological disorders of the Human organism, including the detection
of Cancer, a disease that affects a significant number of people, especially in the Developed
Countries as the life span increases, nowadays.
The most advanced type of nuclear medicine scanner used nowadays is the PET
scanner. Due to its full ring of detectors that can detect coincidences in time, a much better
precision and signal to noise ratio in the detection of lesions than the other nuclear medicine
scanners, namely, SPECT, is obtained. Recently in the field of PET scanners it has been
introduced a type of scanners that use the Time of Flight (TOF) of gamma radiation to detect
the position of a lesion within a few centimeters uncertain in the Line-Of-Response (LOR).
TOF acts as “sensitivity multiplier” allowing using lower dose of the radionuclide for the
same noise, of if the same dose us used to obtain images with less noise and smaller
acquisition times than the conventional scanners. This leads to significant improvements in
the clinical patient workflow and lesion detectability. One of the main problems with the TOF
scanners used nowadays is the high cost that they represent, being the materials used in the
detectors one of the main responsible for those high costs. In this context, Philips started a
project in which I participated and based my thesis.
The aim of my internship at Philips Research that led to this thesis was to characterize
ceramic garnets with different compositions to enable optimized performance for Time of
Flight PET. These ceramic garnets should have a cost/benefit ratio compatible with the
scintillators that are used nowadays. This project was developed with a team in Philips
Research, in Eindhoven, the Netherlands in a period of almost 8 months in which were
measured several samples with different compositions in order to find the best combination in
order to get the best CRT results.
To introduce the reader to the work done, the thesis will start with a general
introduction to nuclear medicine in the first chapter. In this chapter it will be explained all the
physics involved in the nuclear medicine imaging field, as well as the evolution of the
scanners used, starting with the gamma camera and finishing with Time of Flight PET.
The second chapter will focus mostly on the parts of the detector used in PET
scanners: photodetectors and scintillators, presenting some of the principles involved in these

New Scintillators for Nuclear Medicine
2
Rui Azinheiro
parts, as well as a literature review that helps to understand the materials used in the ceramics
in this project.
The third chapter will explain the methods used to make all the measurements and
analysis of the samples studied.
Following the methods there will be presented the most relevant results achieved,
which are related with the behavior of the ceramics according to their compositions. After the
results there will be a discussion, which will include all the formulas used to calculate all the
theory results presented.
The last chapter of this thesis will include a brief resume of all the conclusions
achieved as well as some indications for future work.
New Scintillators for Nuclear Medicine
3
Rui Azinheiro
2. PHYSICAL PRINCIPLES OF NUCLEAR
IMAGING
Nuclear medicine is the field of medical sciences that uses radioactive tracers for
diagnostic and therapeutic purposes. The main difference between nuclear medicine and other
imaging techniques that use radiation, like X-rays, is that in nuclear medicine, the radioactive
source is located inside the subject of study which allows obtaining in vivo metabolic images
of the body using radio-isotopes with specific tropism. These radio-isotopes can be injected,
breathed in or swallowed. Due to their biochemical properties they will be distributed with an
increased uptake in tissues with high metabolism, e.g. tumors increasing the emission of
radiation in these regions of the body. This emission happens due to the decay of the
radionuclides, which leads to the emission of high energy photons with a high probability of
escaping the body and consequently being detected.
In nuclear medicine imaging there are various types of scanners, which include: the
gamma (Anger) camera, Single Photon Emission Computed Tomography (SPECT) and
Position Emission Tomography (PET). Both SPECT and PET systems can be combined with
anatomic imaging modalities like CT and MR. All of them had as a basis the detection of
particles emitted by radionuclides. [1][2]
2.1. Physics of nuclear medicine imaging
Radionuclides are isotopes that undergo into spontaneous nuclear transformation.
Almost all of the heavy elements in the periodic table are radioactive, and the majority of the
radioactive isotopes is man-made. All these radionuclides decay under one of the following
types of decay:
orbeing the
and the most important types of decay to nuclear
medicine imaging. The ray emission is the type of decay needed for SPECT, in other hand,
due to the need to detect coincidences, in PET it is necessary to use a radionuclide that emits
positrons, and in consequence two photons that will allow to measure coincidences. [3], [4]
2.1.1. ray emission
A ray emission is an emission characteristic from excited nuclei. The transition from
the excited state to the ground state leaves Z and A unchanged. The most common ray
emission nucleus used in nuclear medicine is , which has a half-life of 6.02h, making it
perfectly suitable for SPECT scanners. The equation that shows this decay is:
New Scintillators for Nuclear Medicine
4
Rui Azinheiro
The energy of the ray emitted is 140eV.[5]
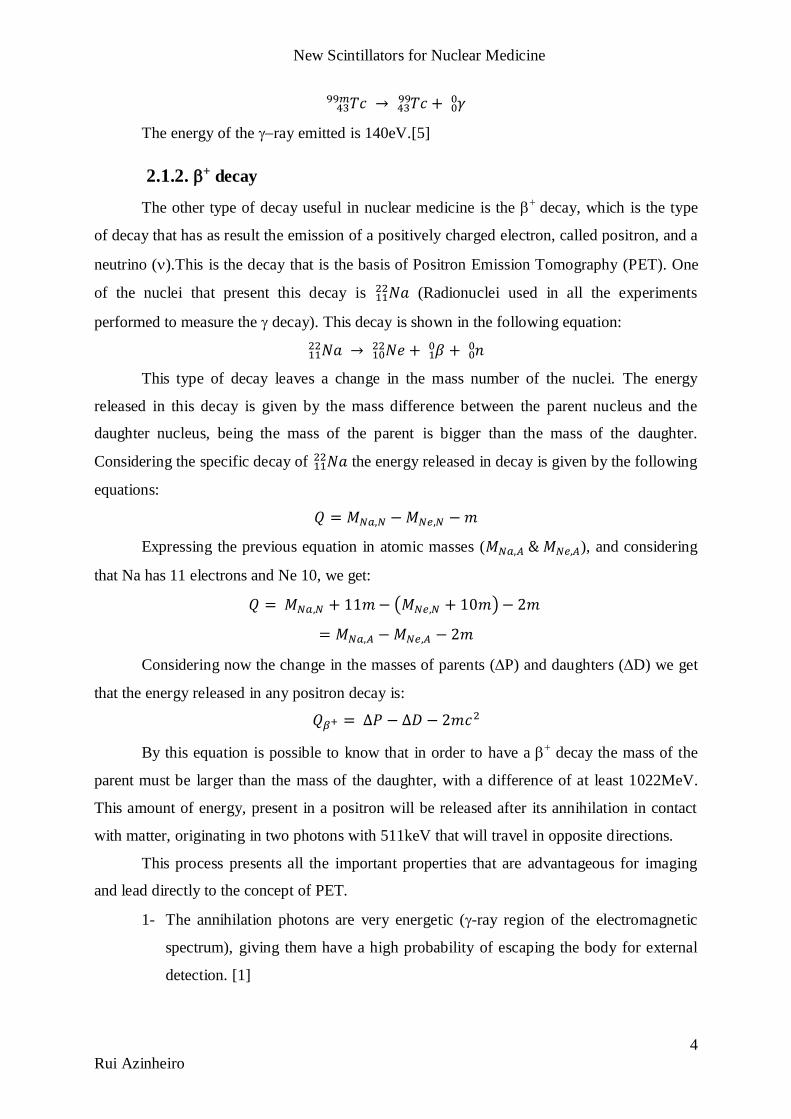
2.1.2. decay
The other type of decay useful in nuclear medicine is the decay, which is the type
of decay that has as result the emission of a positively charged electron, called positron, and a
neutrino ().This is the decay that is the basis of Positron Emission Tomography (PET). One
of the nuclei that present this decay is (Radionuclei used in all the experiments
performed to measure the decay). This decay is shown in the following equation:
This type of decay leaves a change in the mass number of the nuclei. The energy
released in this decay is given by the mass difference between the parent nucleus and the
daughter nucleus, being the mass of the parent is bigger than the mass of the daughter.
Considering the specific decay of the energy released in decay is given by the following
equations:
Expressing the previous equation in atomic masses ( ), and considering
that Na has 11 electrons and Ne 10, we get:
( )
Considering now the change in the masses of parents (P) and daughters (D) we get
that the energy released in any positron decay is:
By this equation is possible to know that in order to have a decay the mass of the
parent must be larger than the mass of the daughter, with a difference of at least 1022MeV.
This amount of energy, present in a positron will be released after its annihilation in contact
with matter, originating in two photons with 511keV that will travel in opposite directions.
This process presents all the important properties that are advantageous for imaging
and lead directly to the concept of PET.
1- The annihilation photons are very energetic (-ray region of the electromagnetic
spectrum), giving them have a high probability of escaping the body for external
detection. [1]
New Scintillators for Nuclear Medicine
5
Rui Azinheiro
2- The two photons are emitted with a precise geometric relationship. If both photons
can be detected and localized externally, the line joining the detected locations
passes directly through the point of annihilation. This line is called the line of
response – LOR (Figure 3). This was originally referred to as electronic
collimation. Because the point of annihilation is very close to the point of positron
emission, this also gives a good indication of where the radioactive atom was in
the body. [1]
The most important radionuclides for PET imaging are fluorine-18 and carbon-11.
Particularly, the 18
F labeled glucose derivative 2-deoxy-2-[18
F]fluoro-Dglucose (18
FFDG)
represents the most widely used PET radiopharmaceutical which has contributed most to the
worldwide success of clinical PET imaging. The combination of a highly efficient
radiochemistry and a high yielding 18
O(p,n)18
F nuclear reaction makes [18
F]FDG available in
large amounts and also enables shipment and distribution by commercial users.[6]
2.1. From Anger camera to PET
The first type of nuclear scanner to appear was the Anger Camera, followed by Single
Photon Emission Computed Tomography (SPECT) and later by Positron Emission
Tomography (PET).
2.1.1. Anger camera and SPECT
The Anger camera is the basic unit of detection in a SPECT scanner. This type of
scanner is used only to detect single events, unlike the PET systems that detect coincidences.
This fact makes the image reconstruction easier, even though, it also reduces the quality of the
information that we can get from one scanner and the quality of the same.
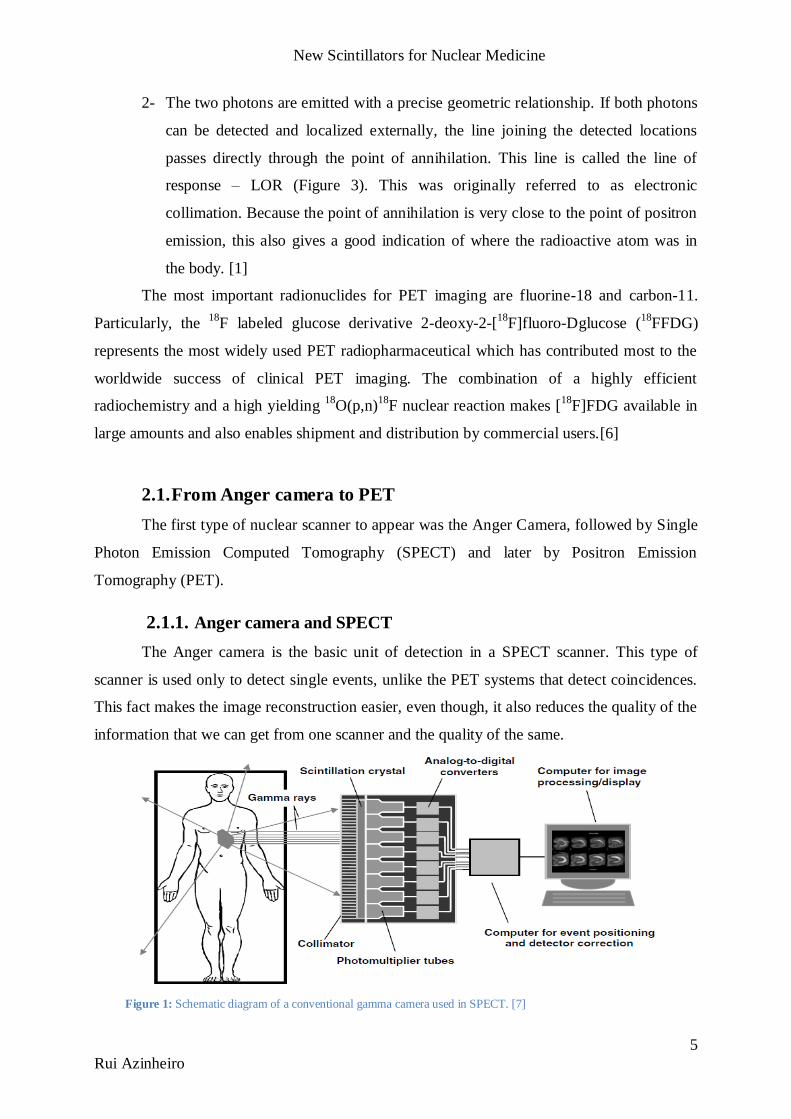
Figure 1: Schematic diagram of a conventional gamma camera used in SPECT. [7]
New Scintillators for Nuclear Medicine
6
Rui Azinheiro
The Anger camera is the simplest of the nuclear medicine imaging equipment. It
consists of: photodetectors (usually PMTs), a scintillator and a collimator.[7]
The main goal of a gamma camera is to detect only the gamma rays that successfully
traverse the collimator. As soon as this happens the gamma ray finds the first element of
detection, called a scintillator, a material responsible to produce light through the absorption
of high energy gamma photons. The light will thereby be collected in a photodetector
(photomultiplier) that will produce an electric signal, which will be converted into a digital
signal that will be reconstructed into an image. The collimator in the gamma camera has the
main function to absorb all the rays that don’t travel in a parallel direction of its septa. In
the image this will reflect in a reduction of noise and avoid the detection of photons that aren’t
originated in the region of interest.
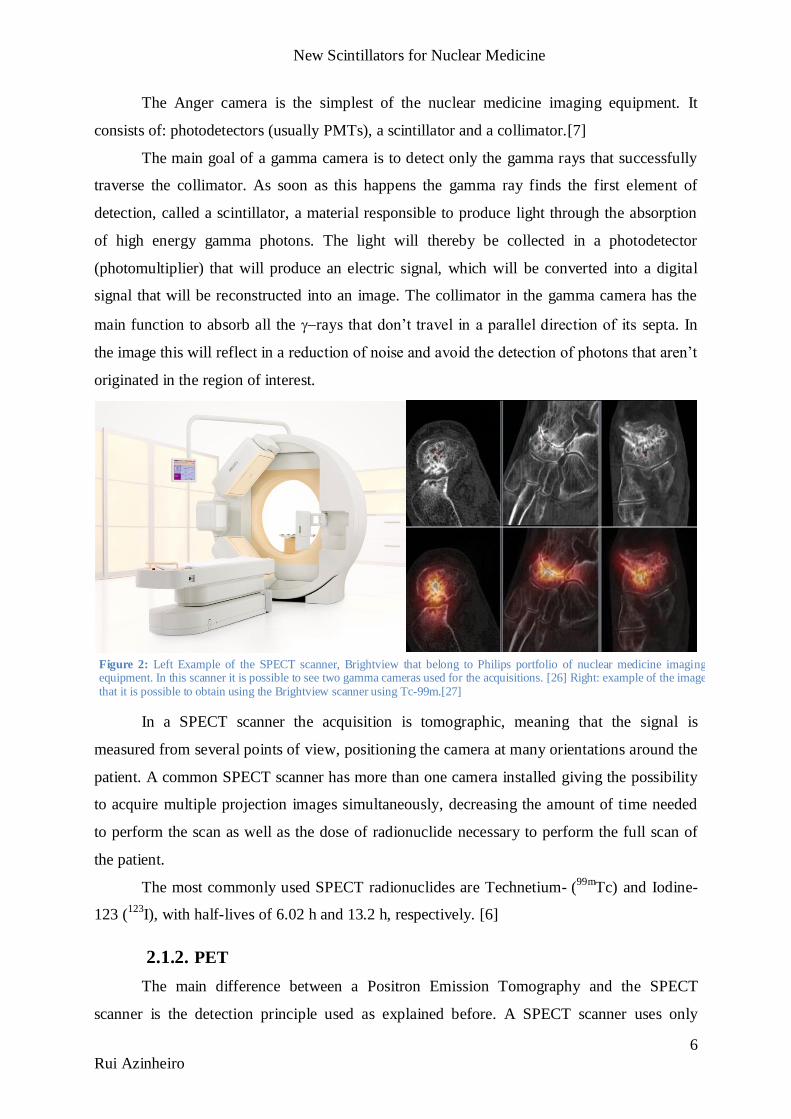
In a SPECT scanner the acquisition is tomographic, meaning that the signal is
measured from several points of view, positioning the camera at many orientations around the
patient. A common SPECT scanner has more than one camera installed giving the possibility
to acquire multiple projection images simultaneously, decreasing the amount of time needed
to perform the scan as well as the dose of radionuclide necessary to perform the full scan of
the patient.
The most commonly used SPECT radionuclides are Technetium- (99m
Tc) and Iodine-
123 (123
I), with half-lives of 6.02 h and 13.2 h, respectively. [6]
2.1.2. PET
The main difference between a Positron Emission Tomography and the SPECT
scanner is the detection principle used as explained before. A SPECT scanner uses only
Figure 2: Left Example of the SPECT scanner, Brightview that belong to Philips portfolio of nuclear medicine imaging equipment. In this scanner it is possible to see two gamma cameras used for the acquisitions. [26] Right: example of the image that it is possible to obtain using the Brightview scanner using Tc-99m.[27]
New Scintillators for Nuclear Medicine
7
Rui Azinheiro
information from single events, while the PET scanner detects coincidences that arise from
the annihilation of the
emitter explained before. This difference in the detection allowed the
PET scanners to be used without collimators due to their lack of need to collimate the
scattering photons, since these ones would not be counted as coincidences.
This difference allows the scanner to present some advantages against other types of
diagnostic imaging, like the higher sensivity (10-12
mol/L) or the quantifiability, since the
signal obtained is proportional to the accumulated dose in the part of the patient being
imaged.
Nowadays scanners have a full ring of detectors with the ability to detect these
coincident high-energy gamma rays that emerge from the body in opposite directions (Figure
3). When two photons are recorded simultaneously by a pair of detectors, the annihilation
event that gave rise to them must have occurred somewhere along the line connecting the
detectors. Of course, if one of the photons is scattered, then the line of coincidence will be
incorrect (Figure 5). After 100,000 or more annihilation events are detected, the distribution
of the positron-emitting tracer is calculated by tomographic reconstruction procedures. PET
reconstructs a two-dimensional (2D) image from the one-dimensional projections seen at
different angles. Three-dimensional (3D) reconstructions also can be done using 2D
projections from multiple angles. Nowadays all the scanners use the 3D technology. [8][9]
The main difference between TOF PET and conventional PET is in the use of the line
of response. The approach that is used almost universally involves the concept of computed
tomography. By measuring the total radioactivity along multiple LOR in different angles
through the object, mathematical algorithms are used to compute cross-sectional images that
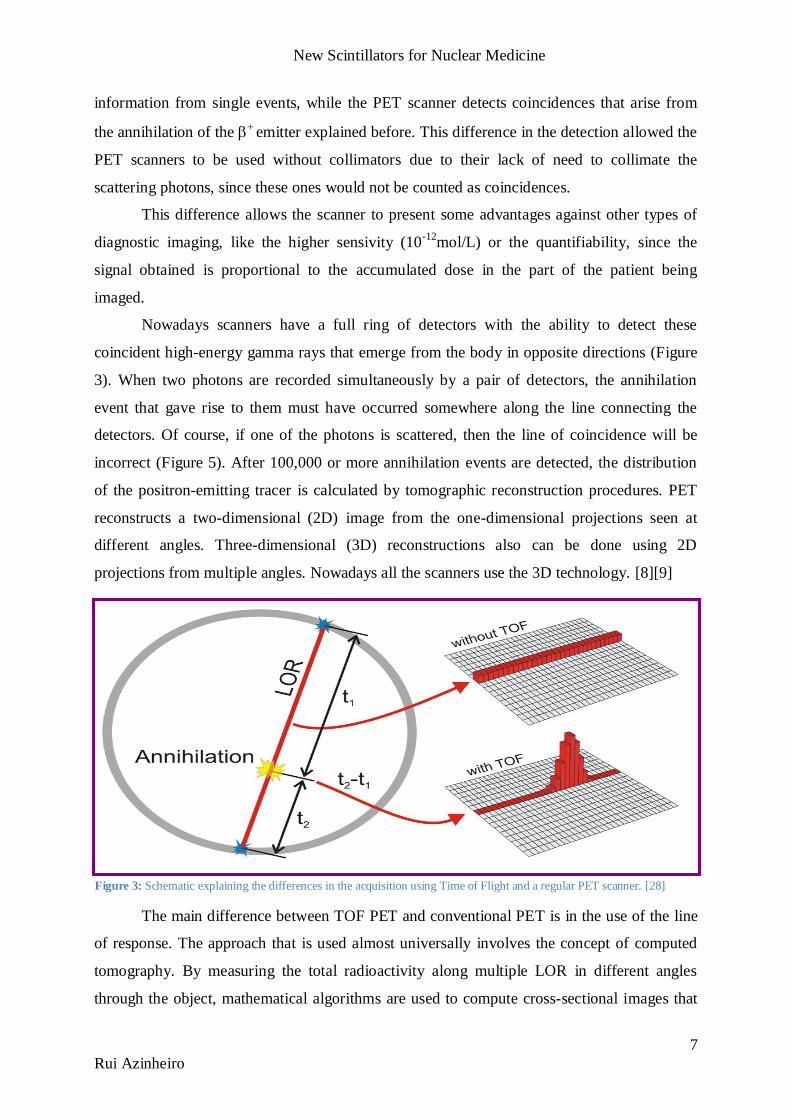
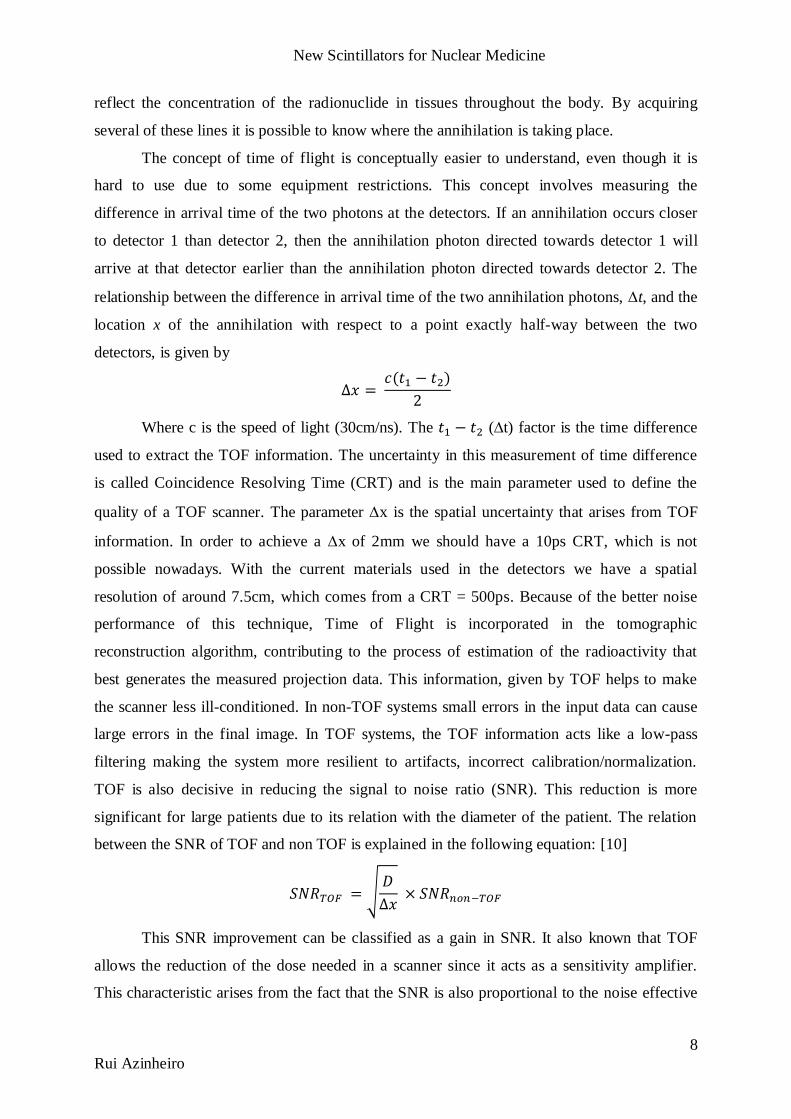
Figure 3: Schematic explaining the differences in the acquisition using Time of Flight and a regular PET scanner. [28]
New Scintillators for Nuclear Medicine
8
Rui Azinheiro
reflect the concentration of the radionuclide in tissues throughout the body. By acquiring
several of these lines it is possible to know where the annihilation is taking place.
The concept of time of flight is conceptually easier to understand, even though it is
hard to use due to some equipment restrictions. This concept involves measuring the
difference in arrival time of the two photons at the detectors. If an annihilation occurs closer
to detector 1 than detector 2, then the annihilation photon directed towards detector 1 will
arrive at that detector earlier than the annihilation photon directed towards detector 2. The
relationship between the difference in arrival time of the two annihilation photons, t, and the
location x of the annihilation with respect to a point exactly half-way between the two
detectors, is given by
Where c is the speed of light (30cm/ns). The (t) factor is the time difference
used to extract the TOF information. The uncertainty in this measurement of time difference
is called Coincidence Resolving Time (CRT) and is the main parameter used to define the
quality of a TOF scanner. The parameter x is the spatial uncertainty that arises from TOF
information. In order to achieve a x of 2mm we should have a 10ps CRT, which is not
possible nowadays. With the current materials used in the detectors we have a spatial
resolution of around 7.5cm, which comes from a CRT = 500ps. Because of the better noise
performance of this technique, Time of Flight is incorporated in the tomographic
reconstruction algorithm, contributing to the process of estimation of the radioactivity that
best generates the measured projection data. This information, given by TOF helps to make
the scanner less ill-conditioned. In non-TOF systems small errors in the input data can cause
large errors in the final image. In TOF systems, the TOF information acts like a low-pass
filtering making the system more resilient to artifacts, incorrect calibration/normalization.
TOF is also decisive in reducing the signal to noise ratio (SNR). This reduction is more
significant for large patients due to its relation with the diameter of the patient. The relation
between the SNR of TOF and non TOF is explained in the following equation: [10]
√
This SNR improvement can be classified as a gain in SNR. It also known that TOF
allows the reduction of the dose needed in a scanner since it acts as a sensitivity amplifier.
This characteristic arises from the fact that the SNR is also proportional to the noise effective
New Scintillators for Nuclear Medicine
9
Rui Azinheiro
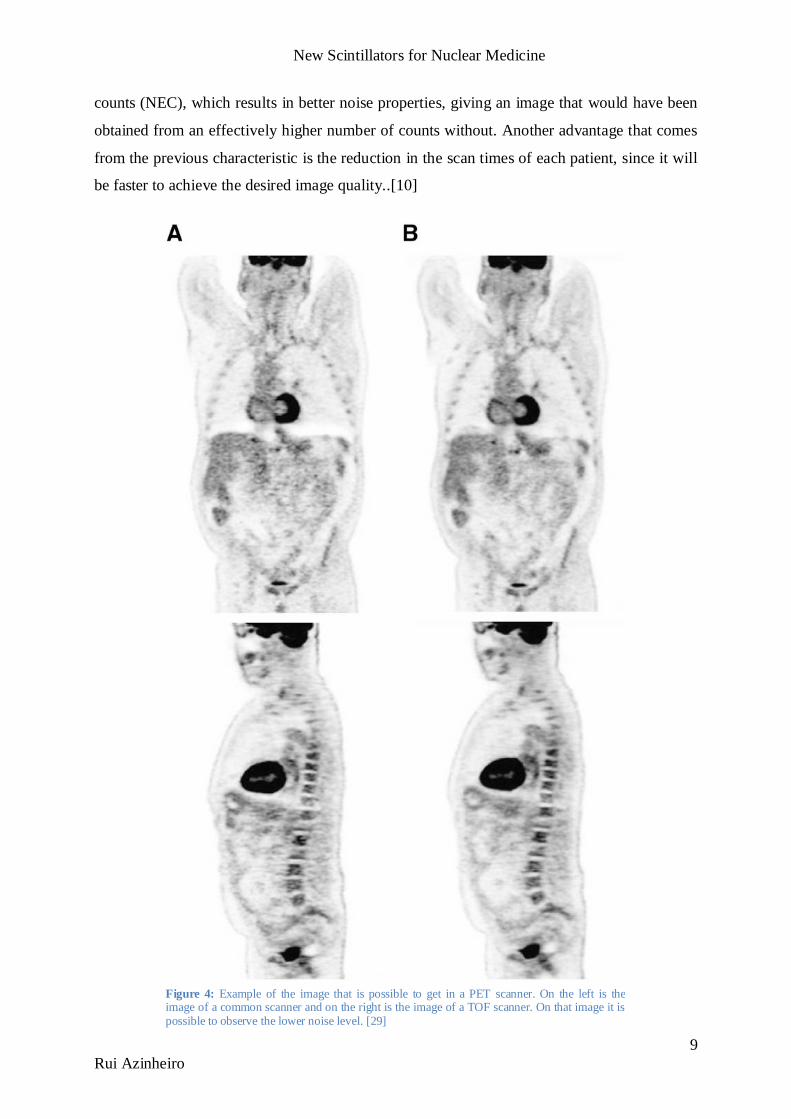
counts (NEC), which results in better noise properties, giving an image that would have been
obtained from an effectively higher number of counts without. Another advantage that comes
from the previous characteristic is the reduction in the scan times of each patient, since it will
be faster to achieve the desired image quality..[10]
Figure 4: Example of the image that is possible to get in a PET scanner. On the left is the image of a common scanner and on the right is the image of a TOF scanner. On that image it is possible to observe the lower noise level. [29]
New Scintillators for Nuclear Medicine
10
Rui Azinheiro
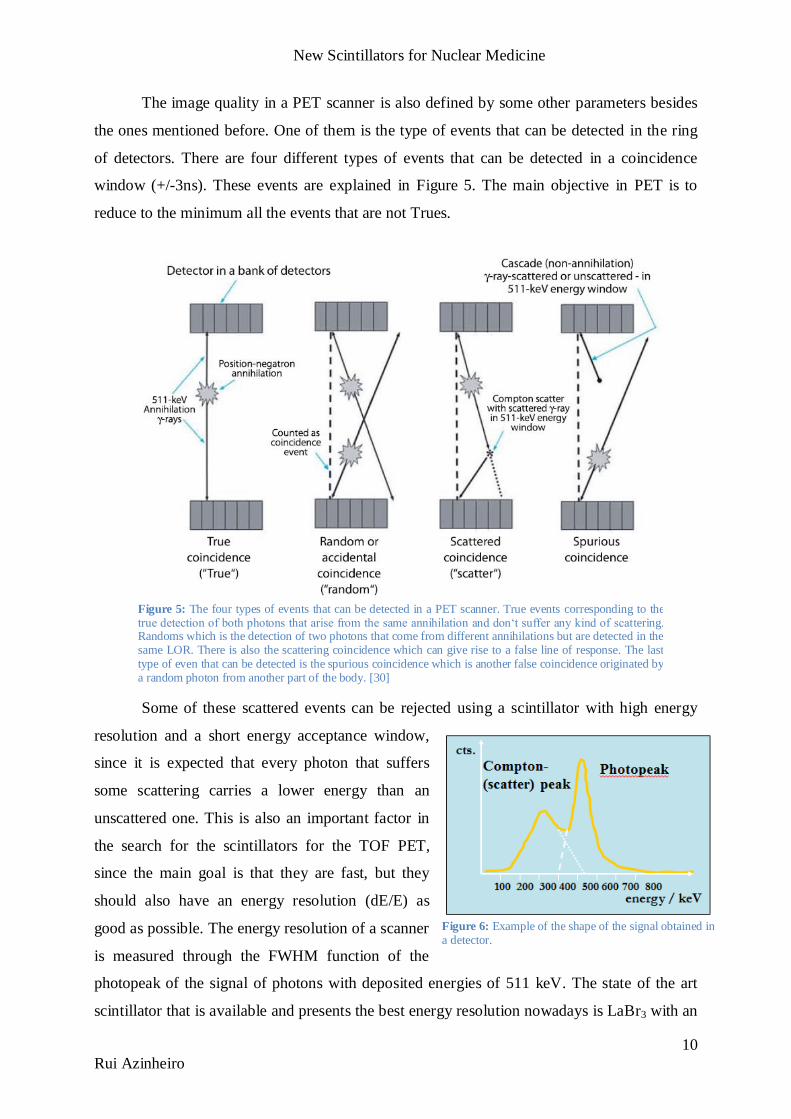
The image quality in a PET scanner is also defined by some other parameters besides
the ones mentioned before. One of them is the type of events that can be detected in the ring
of detectors. There are four different types of events that can be detected in a coincidence
window (+/-3ns). These events are explained in Figure 5. The main objective in PET is to
reduce to the minimum all the events that are not Trues.
Some of these scattered events can be rejected using a scintillator with high energy
resolution and a short energy acceptance window,
since it is expected that every photon that suffers
some scattering carries a lower energy than an
unscattered one. This is also an important factor in
the search for the scintillators for the TOF PET,
since the main goal is that they are fast, but they
should also have an energy resolution (dE/E) as
good as possible. The energy resolution of a scanner
is measured through the FWHM function of the
photopeak of the signal of photons with deposited energies of 511 keV. The state of the art
scintillator that is available and presents the best energy resolution nowadays is LaBr3 with an
Figure 5: The four types of events that can be detected in a PET scanner. True events corresponding to the true detection of both photons that arise from the same annihilation and don‘t suffer any kind of scattering. Randoms which is the detection of two photons that come from different annihilations but are detected in the same LOR. There is also the scattering coincidence which can give rise to a false line of response. The last type of even that can be detected is the spurious coincidence which is another false coincidence originated by a random photon from another part of the body. [30]
Figure 6: Example of the shape of the signal obtained in a detector.
New Scintillators for Nuclear Medicine
11
Rui Azinheiro
energy resolution of 2.6%, but it is still facing some problems to be commercially used, since
it is highly hygroscopic, shows intrinsic radioactivity (like LYSO) and the crystal growth
mass production is still challenging. This has lead that LSO:Ce and LYSO:Ce crystals, with a
better mass production characteristics (like yield), density (7.1-7.4 gcm3), high light yield
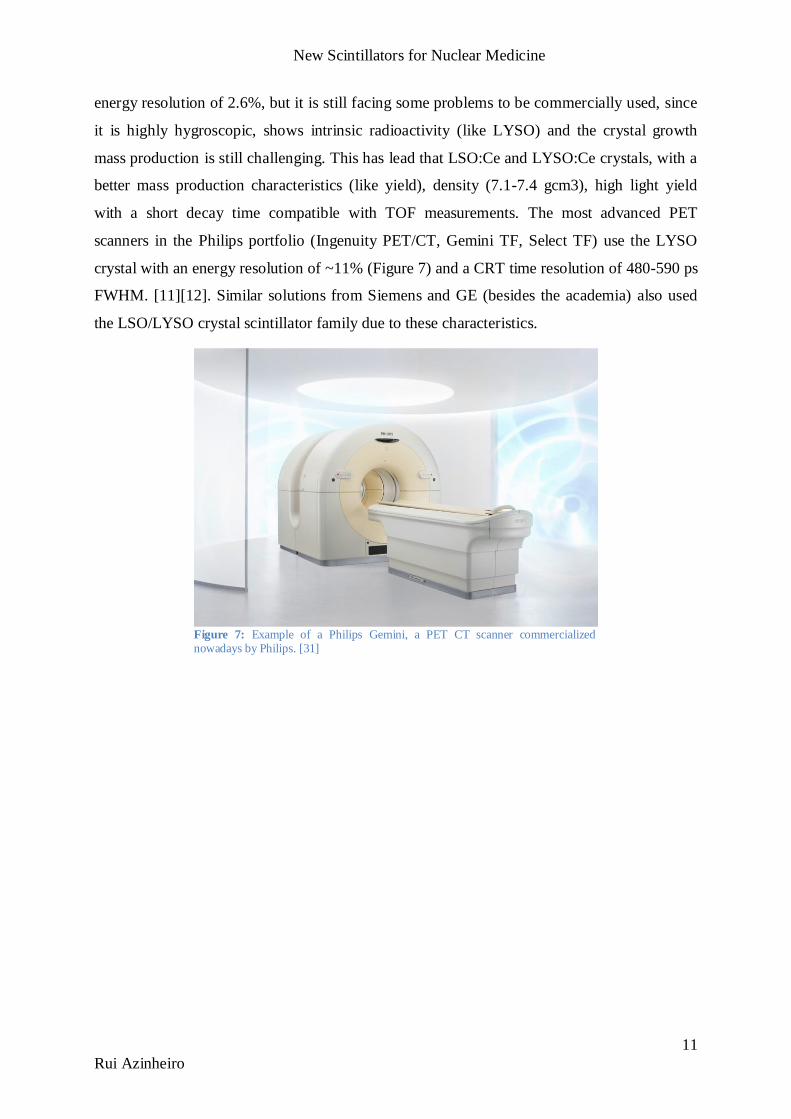
with a short decay time compatible with TOF measurements. The most advanced PET
scanners in the Philips portfolio (Ingenuity PET/CT, Gemini TF, Select TF) use the LYSO
crystal with an energy resolution of ~11% (Figure 7) and a CRT time resolution of 480-590 ps
FWHM. [11][12]. Similar solutions from Siemens and GE (besides the academia) also used
the LSO/LYSO crystal scintillator family due to these characteristics.
Figure 7: Example of a Philips Gemini, a PET CT scanner commercialized nowadays by Philips. [31]
New Scintillators for Nuclear Medicine
12
Rui Azinheiro
3. SCINTILLATORS FOR PET AND
SPECT
Light detection is a powerful tool widely used nowadays in a lot of areas, including
medicine. This is also the basic tool of Nuclear Medicine, since the scanners used convert the
radiation into light which will generate an electric signal that will, ultimately, be converted
into an image using reconstruction software. The process that includes the conversion of
radiation until the generation of the electric signal is done in the detector of the equipment in
nuclear medicine. This detector is one of the main components of the scanner as it can
determine the whole quality of it.
The detectors used in PET nowadays are made with two major components: a
photomultiplier tube (PMT) and a Scintillator crystal, which in case of Philips PET equipment
is the LYSO crystal (Lu1.8Y0.2SiO5(Ce)).
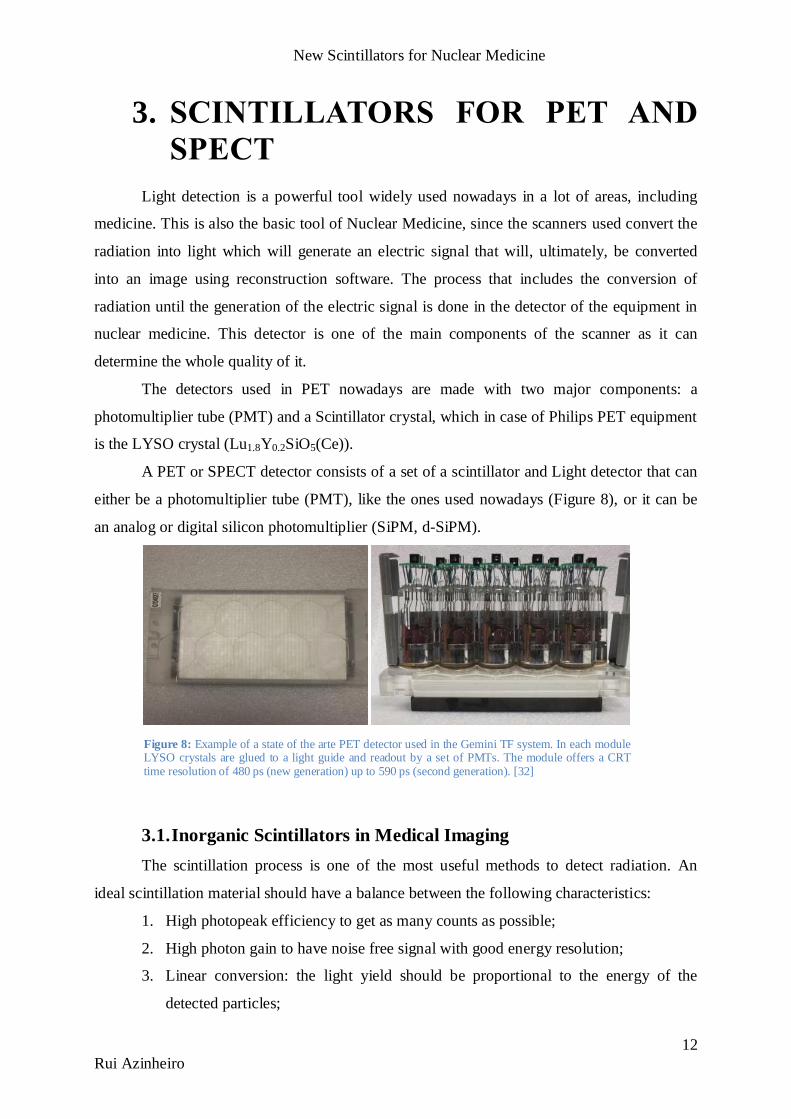
A PET or SPECT detector consists of a set of a scintillator and Light detector that can
either be a photomultiplier tube (PMT), like the ones used nowadays (Figure 8), or it can be
an analog or digital silicon photomultiplier (SiPM, d-SiPM).
3.1. Inorganic Scintillators in Medical Imaging
The scintillation process is one of the most useful methods to detect radiation. An
ideal scintillation material should have a balance between the following characteristics:
1. High photopeak efficiency to get as many counts as possible;
2. High photon gain to have noise free signal with good energy resolution;
3. Linear conversion: the light yield should be proportional to the energy of the
detected particles;
Figure 8: Example of a state of the arte PET detector used in the Gemini TF system. In each module LYSO crystals are glued to a light guide and readout by a set of PMTs. The module offers a CRT time resolution of 480 ps (new generation) up to 590 ps (second generation). [32]
New Scintillators for Nuclear Medicine
13
Rui Azinheiro
4. The material should be transparent to its own wavelength emission, giving a light
output as high as possible;
5. The decay time of the induced luminescence should be as fast as possible;
6. The material used should present a good optical quality and should be easy to
manufacture;
7. The refraction index should be as close as possible to glass, in order to allow an
efficient coupling to the light sensor.
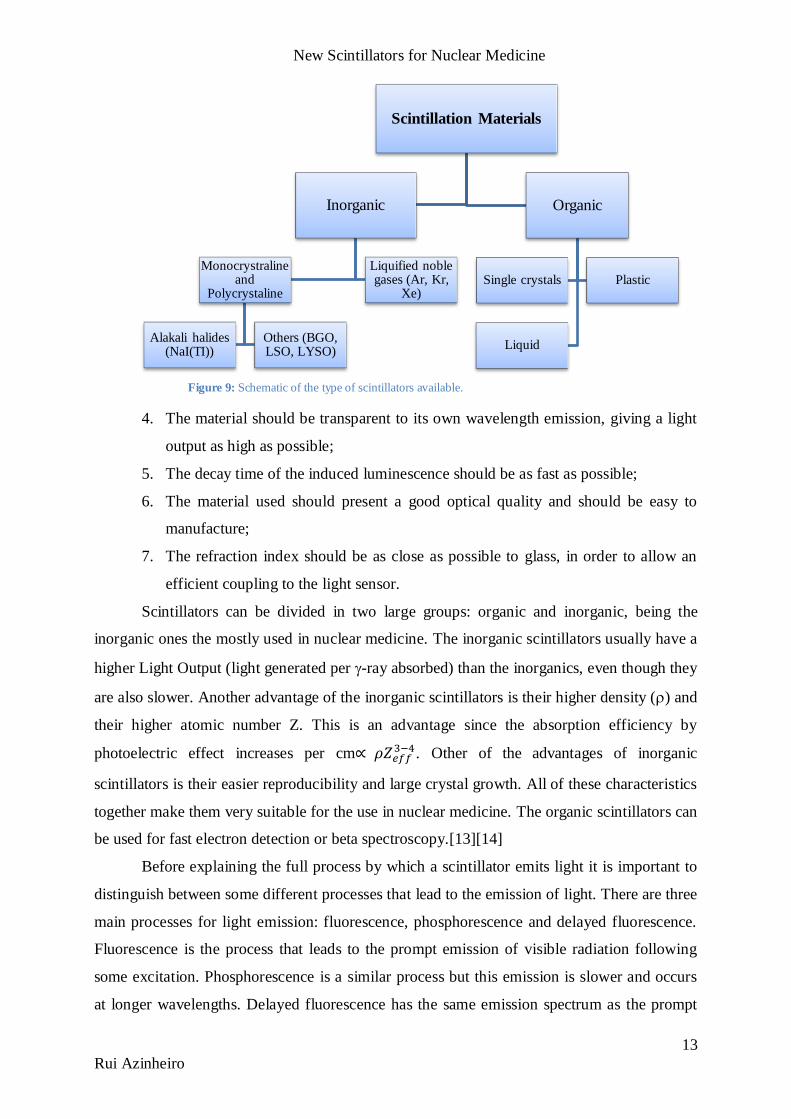
Scintillators can be divided in two large groups: organic and inorganic, being the
inorganic ones the mostly used in nuclear medicine. The inorganic scintillators usually have a
higher Light Output (light generated per -ray absorbed) than the inorganics, even though they
are also slower. Another advantage of the inorganic scintillators is their higher density () and
their higher atomic number Z. This is an advantage since the absorption efficiency by
photoelectric effect increases per cm . Other of the advantages of inorganic
scintillators is their easier reproducibility and large crystal growth. All of these characteristics
together make them very suitable for the use in nuclear medicine. The organic scintillators can
be used for fast electron detection or beta spectroscopy.[13][14]
Before explaining the full process by which a scintillator emits light it is important to
distinguish between some different processes that lead to the emission of light. There are three
main processes for light emission: fluorescence, phosphorescence and delayed fluorescence.
Fluorescence is the process that leads to the prompt emission of visible radiation following
some excitation. Phosphorescence is a similar process but this emission is slower and occurs
at longer wavelengths. Delayed fluorescence has the same emission spectrum as the prompt
Scintillation Materials
Inorganic
Monocrystraline and
Polycrystaline
Alakali halides (NaI(TI))
Others (BGO, LSO, LYSO)
Liquified noble gases (Ar, Kr,
Xe)
Organic
Single crystals Plastic
Liquid
Figure 9: Schematic of the type of scintillators available.
New Scintillators for Nuclear Medicine
14
Rui Azinheiro
fluorescence but with an emission much later than the excitation. This delayed fluorescence is
also known as afterglow. When looking for a good scintillator it is desired that most of the
radiation is emitted as prompted fluorescence minimizing as much as possible the afterglow
of the sample. [13]
The whole scintillation process can be divided in three main phases: conversion,
transport and Luminescence. The conversion phase starts with the absorption of a high-energy
photon by Compton or photoelectric effect. The latter will create an inner shell hole and an
energetic primary electron, followed by a radiative decay (secondary X-rays), nonradiative
decay (Auger processes and secondary electrons), and inelastic electron-electron scattering.
[15]
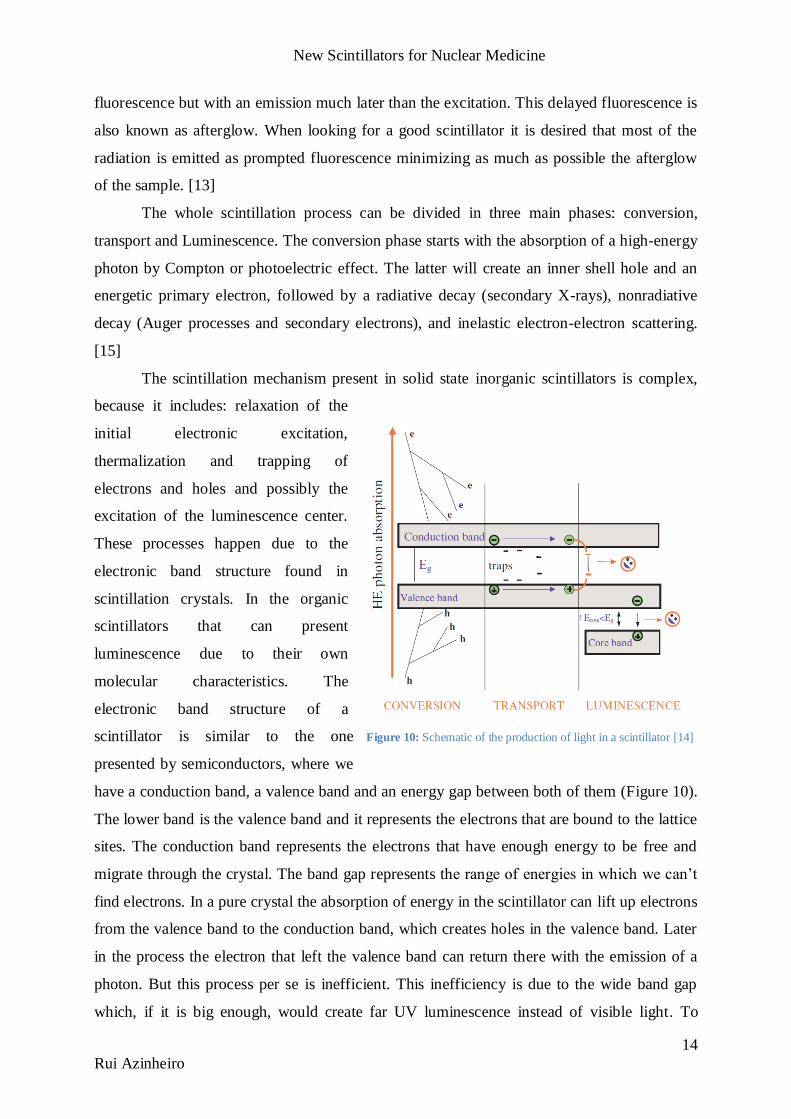
The scintillation mechanism present in solid state inorganic scintillators is complex,
because it includes: relaxation of the
initial electronic excitation,
thermalization and trapping of
electrons and holes and possibly the
excitation of the luminescence center.
These processes happen due to the
electronic band structure found in
scintillation crystals. In the organic
scintillators that can present
luminescence due to their own
molecular characteristics. The
electronic band structure of a
scintillator is similar to the one
presented by semiconductors, where we
have a conduction band, a valence band and an energy gap between both of them (Figure 10).
The lower band is the valence band and it represents the electrons that are bound to the lattice
sites. The conduction band represents the electrons that have enough energy to be free and
migrate through the crystal. The band gap represents the range of energies in which we can’t
find electrons. In a pure crystal the absorption of energy in the scintillator can lift up electrons
from the valence band to the conduction band, which creates holes in the valence band. Later
in the process the electron that left the valence band can return there with the emission of a
photon. But this process per se is inefficient. This inefficiency is due to the wide band gap
which, if it is big enough, would create far UV luminescence instead of visible light. To
Figure 10: Schematic of the production of light in a scintillator [14]

New Scintillators for Nuclear Medicine
15
Rui Azinheiro
overcome this problem there are some impurities, also known as activators or dopants, that
can be added to the crystal. The dopers create some special sites in the crystal lattice,
changing the band gap structure creating intermediate energy states through which the
electron can de-excite back to the valence band. This process will consequentially increase the
probability of generation of visible photons, easily detected, because the energy between the
sites is smaller than the band gap. The de-excitation sites are known as luminescence centers
or recombination centers. Their energy structure determines the emission spectrum of the
scintillator. [13]
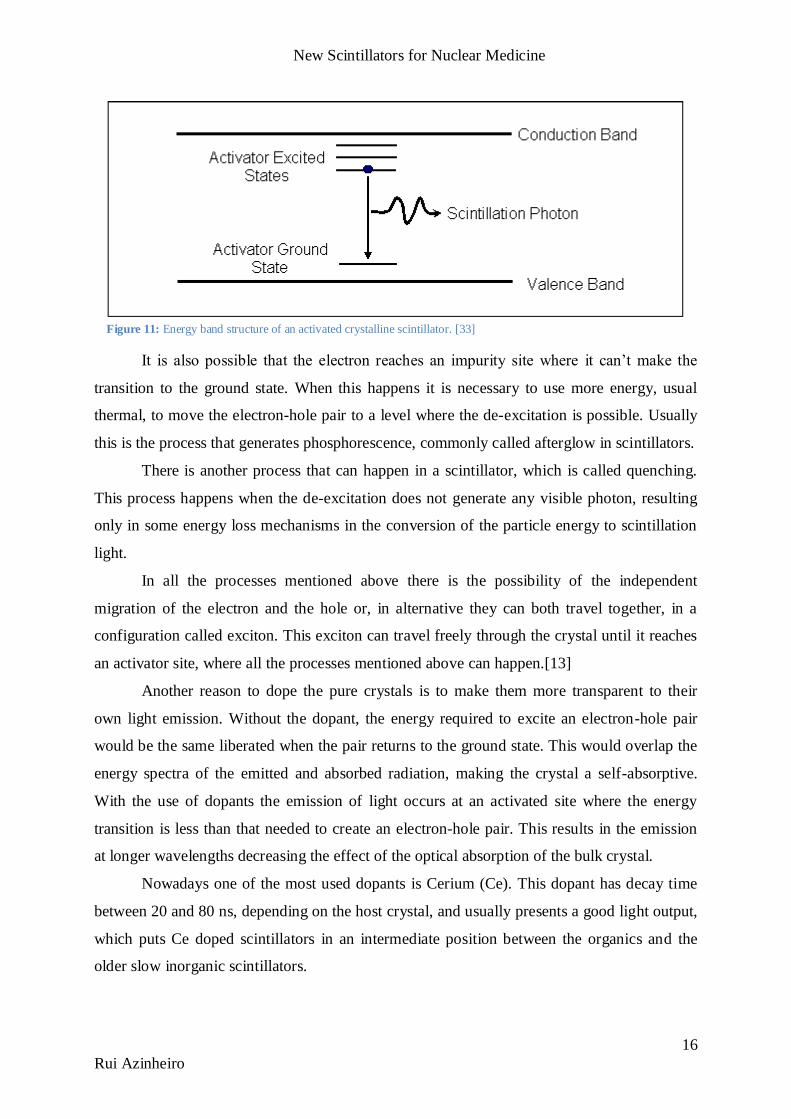
A particle passing through the scintillator will generate a great number of electron-
hole pairs by promoting the elevation of the electrons from the valence layer to the conduction
layer. The hole, which is positively charged, will migrate to the activation site and ionize it
which has lower ionization energy than the typical ionization energy of the lattice structure.
Simultaneously with this migration the electron that was promoted to the conduction band can
travel freely through the entire conduction band, and it will do it until when it finds an ionized
activator site, creating a neutral configuration with its own excited energy states (Figure 11).
If the activator state formed is in an excited configuration with an allowed transition to the
ground state, its de-excitation will occur quickly and with high probability of an emission of a
visible photon if the activator material is properly chosen. Usually the travel time for the
electron to find an excited activator site is much shorter than the half-life of the photon
emission, which implies that all the electron-hole pairs are formed immediately, and will
subsequently be de-excited. This de-excitation determines the decay time characteristic of
scintillators. Some scintillators can present only one decay time, while others, like the garnets
studied in this project can present up to three different time constants: a fast one between 40
and 150ns, an intermediate one that can reach a few hundreds of ns and a slower one with
some microseconds.
New Scintillators for Nuclear Medicine
16
Rui Azinheiro
It is also possible that the electron reaches an impurity site where it can’t make the
transition to the ground state. When this happens it is necessary to use more energy, usual
thermal, to move the electron-hole pair to a level where the de-excitation is possible. Usually
this is the process that generates phosphorescence, commonly called afterglow in scintillators.
There is another process that can happen in a scintillator, which is called quenching.
This process happens when the de-excitation does not generate any visible photon, resulting
only in some energy loss mechanisms in the conversion of the particle energy to scintillation
light.
In all the processes mentioned above there is the possibility of the independent
migration of the electron and the hole or, in alternative they can both travel together, in a
configuration called exciton. This exciton can travel freely through the crystal until it reaches
an activator site, where all the processes mentioned above can happen.[13]
Another reason to dope the pure crystals is to make them more transparent to their
own light emission. Without the dopant, the energy required to excite an electron-hole pair
would be the same liberated when the pair returns to the ground state. This would overlap the
energy spectra of the emitted and absorbed radiation, making the crystal a self-absorptive.
With the use of dopants the emission of light occurs at an activated site where the energy
transition is less than that needed to create an electron-hole pair. This results in the emission
at longer wavelengths decreasing the effect of the optical absorption of the bulk crystal.
Nowadays one of the most used dopants is Cerium (Ce). This dopant has decay time
between 20 and 80 ns, depending on the host crystal, and usually presents a good light output,
which puts Ce doped scintillators in an intermediate position between the organics and the
older slow inorganic scintillators.
Figure 11: Energy band structure of an activated crystalline scintillator. [33]
New Scintillators for Nuclear Medicine
17
Rui Azinheiro
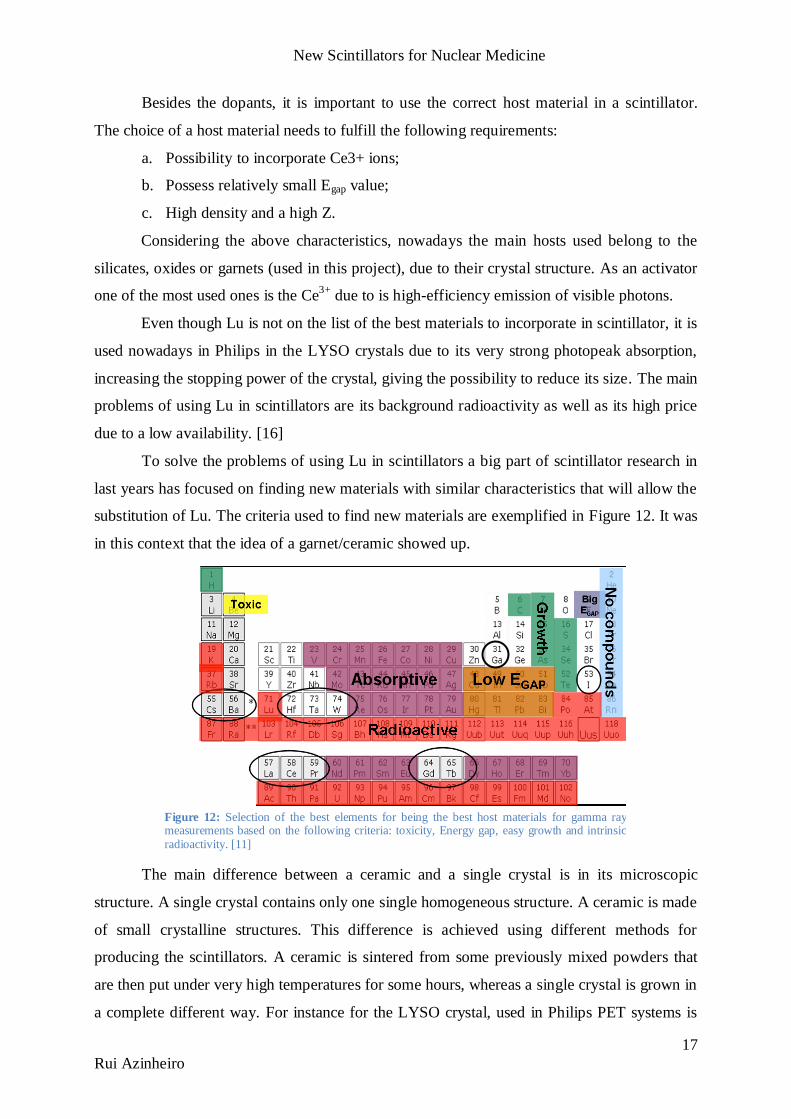
Figure 12: Selection of the best elements for being the best host materials for gamma ray measurements based on the following criteria: toxicity, Energy gap, easy growth and intrinsic radioactivity. [11]
Besides the dopants, it is important to use the correct host material in a scintillator.
The choice of a host material needs to fulfill the following requirements:
a. Possibility to incorporate Ce3+ ions;
b. Possess relatively small Egap value;
c. High density and a high Z.
Considering the above characteristics, nowadays the main hosts used belong to the
silicates, oxides or garnets (used in this project), due to their crystal structure. As an activator
one of the most used ones is the Ce3+
due to is high-efficiency emission of visible photons.
Even though Lu is not on the list of the best materials to incorporate in scintillator, it is
used nowadays in Philips in the LYSO crystals due to its very strong photopeak absorption,
increasing the stopping power of the crystal, giving the possibility to reduce its size. The main
problems of using Lu in scintillators are its background radioactivity as well as its high price
due to a low availability. [16]
To solve the problems of using Lu in scintillators a big part of scintillator research in
last years has focused on finding new materials with similar characteristics that will allow the
substitution of Lu. The criteria used to find new materials are exemplified in Figure 12. It was
in this context that the idea of a garnet/ceramic showed up.
The main difference between a ceramic and a single crystal is in its microscopic
structure. A single crystal contains only one single homogeneous structure. A ceramic is made
of small crystalline structures. This difference is achieved using different methods for
producing the scintillators. A ceramic is sintered from some previously mixed powders that
are then put under very high temperatures for some hours, whereas a single crystal is grown in
a complete different way. For instance for the LYSO crystal, used in Philips PET systems is
New Scintillators for Nuclear Medicine
18
Rui Azinheiro
produced by the Czochralski method, since this method is suitable to grow single crystals.
This method has the disadvantage of being more expensive than the ones used for growing
ceramics like the ones used in this project. [17][18]
3.1.1. The LYSO scintillator
There are some characteristics that are useful to define if a scintillator is useful to use
in PET or not, being the requirements needed for TOF PET different from the ones required
for the conventional scanners that don’t use TOF.
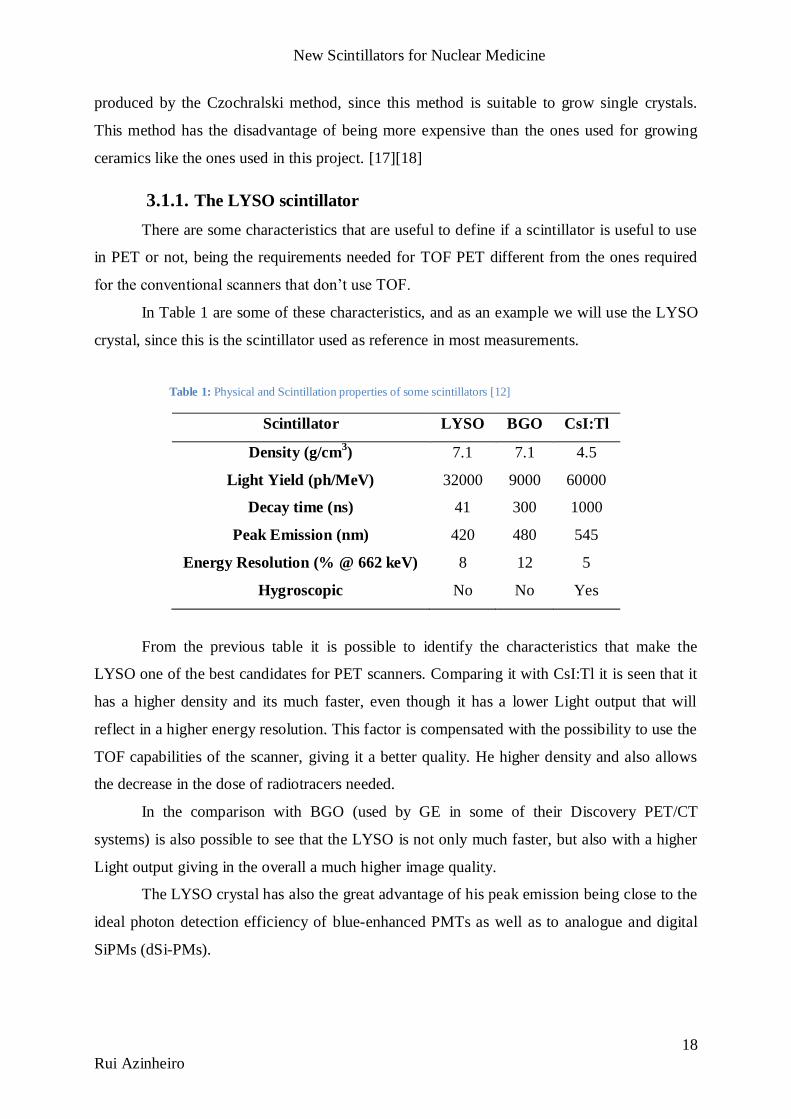
In Table 1 are some of these characteristics, and as an example we will use the LYSO
crystal, since this is the scintillator used as reference in most measurements.
Table 1: Physical and Scintillation properties of some scintillators [12]
Scintillator LYSO BGO CsI:Tl
Density (g/cm3) 7.1 7.1 4.5
Light Yield (ph/MeV) 32000 9000 60000
Decay time (ns) 41 300 1000
Peak Emission (nm) 420 480 545
Energy Resolution (% @ 662 keV) 8 12 5
Hygroscopic No No Yes
From the previous table it is possible to identify the characteristics that make the
LYSO one of the best candidates for PET scanners. Comparing it with CsI:Tl it is seen that it
has a higher density and its much faster, even though it has a lower Light output that will
reflect in a higher energy resolution. This factor is compensated with the possibility to use the
TOF capabilities of the scanner, giving it a better quality. He higher density and also allows
the decrease in the dose of radiotracers needed.
In the comparison with BGO (used by GE in some of their Discovery PET/CT
systems) is also possible to see that the LYSO is not only much faster, but also with a higher
Light output giving in the overall a much higher image quality.
The LYSO crystal has also the great advantage of his peak emission being close to the
ideal photon detection efficiency of blue-enhanced PMTs as well as to analogue and digital
SiPMs (dSi-PMs).
New Scintillators for Nuclear Medicine
19
Rui Azinheiro
3.2. Photodetectors♦
In order to measure a signal from a scintillator it is necessary to use some
photosensitive detector that is able to detect, amplify and convert the light produced by the
scintillator. The main advantage of measuring light using these systems is the possibility to
have a nondestructive analysis of a patient, the possibility to measure high-speed properties
and a very high sensibility. These are all characteristics of a PET scanner.
The light detectors can be divided into three main categories, according to their
operating principle: external photoelectric effect, internal photoelectric effect and thermal
types. The external photoelectric effect works under the principle that when light strikes a
metal or semiconductor in vacuum, electrons are emitted from this surface into the vacuum.
This is the principle used in PMTs which gives them the best response speed and sensitivity,
which is their ability to detect very low amounts of light, making them very suitable for use in
medical equipment. The photodetectors that use the internal photoelectric effect can be
divided into two types: photoconductive which uses photoconductive cells, and photovoltaic
which uses photodiodes. Both types of sensors present a high sensitivity and minimum size
compared to PMT. The last type of photodetectors, the thermal type, present a low sensitivity,
but have the advantage of having no wavelength dependence, making them suitable for
temperature sensors in fire alarms.[19]
In this chapter we will mainly focus on the PMTs and in the newly developed digital
photomultipliers.
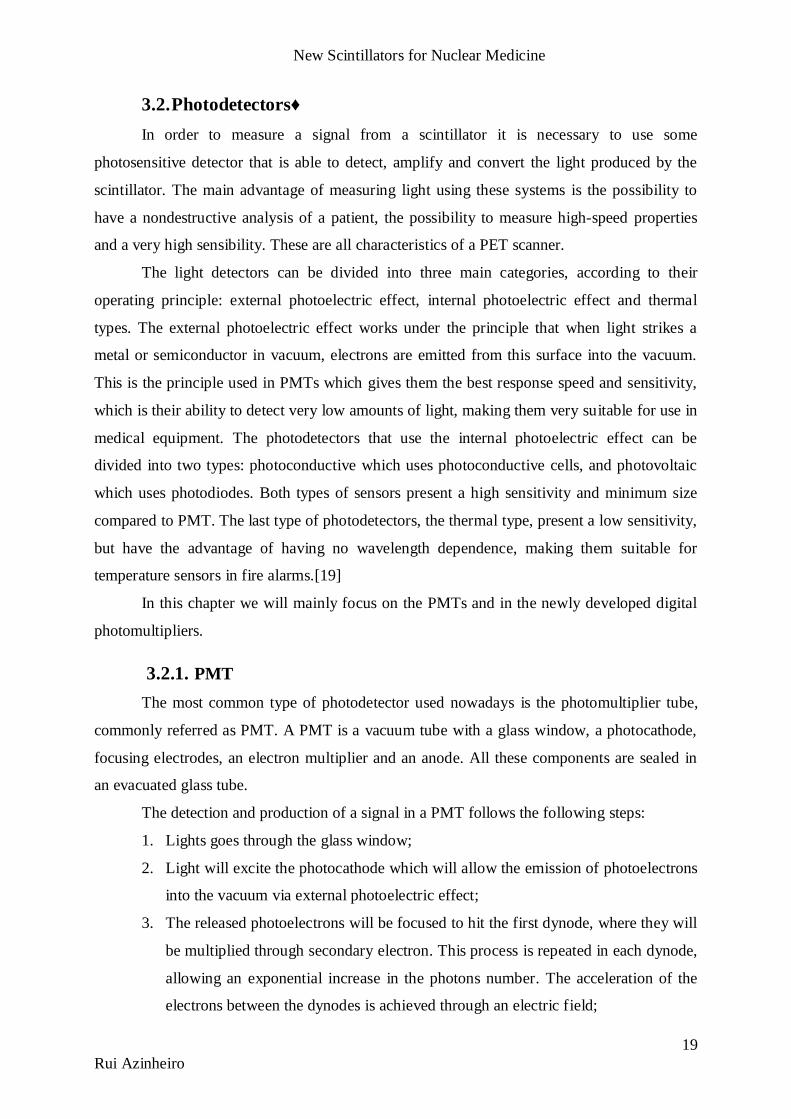
3.2.1. PMT
The most common type of photodetector used nowadays is the photomultiplier tube,
commonly referred as PMT. A PMT is a vacuum tube with a glass window, a photocathode,
focusing electrodes, an electron multiplier and an anode. All these components are sealed in
an evacuated glass tube.
The detection and production of a signal in a PMT follows the following steps:
1. Lights goes through the glass window;
2. Light will excite the photocathode which will allow the emission of photoelectrons
into the vacuum via external photoelectric effect;
3. The released photoelectrons will be focused to hit the first dynode, where they will
be multiplied through secondary electron. This process is repeated in each dynode,
allowing an exponential increase in the photons number. The acceleration of the
electrons between the dynodes is achieved through an electric field;
New Scintillators for Nuclear Medicine
20
Rui Azinheiro
4. After the last dynode the electrons are collected by the anode.
Despite all the good characteristics of a PMT, these photodetectors have been losing
some space to some more recently developed silicon photomultipliers (SiPM).
3.2.2. Digital Silicon Photomultipliers
SiPMs had recently gained interest as a replacement for PMTs due to their ruggedness,
compactness and insensitivity to magnetic fields, which allows them to be used with an MRI
in the newly developed Magnetic Molecular Resonance (MMR), which allows the
simultaneous use of PET and MRI systems. As solid state detectors other advantage in the use
of this type of scintillators is their low operating voltage, low power consumption and they are
easy to fabricate. Anyway this type of photodetectors still present some disadvantages, like
susceptibility to electronic noise, high sensitivity to temperature variations, and some
limitations when detecting very low light signals.[20]
A SiPM can be made of arrays of avalanche photodiodes operated in Geiger-mode.
This allows overcoming some of the problems in common solid state detectors, but still does
not exploit the full capability of the Geiger-mode cells due to some parasitic inductances and
capacitances that arise from the arrangement of electronics because a SiPM is made of
passively-quenched cells, connected in parallel with a long interconnect that creates some of
these problems. The resulting signal in a SiPM is therefore the analog sum of all the current in
the cells.
Another problem of SiPMs is to read each signal when having thousands of channels.
To overcome this problem a mixed-signal ASIC id needed to condition and digitize the SiPM
Figure 13: Components of a PMT. [19]
New Scintillators for Nuclear Medicine
21
Rui Azinheiro
signal, but once again the addition of electronics to the set brings some more noise to the
signal, especially because the detection of a single photon generates a signal of a few mV. To
surpass all of these problems Philips Digital Photon Counting (PDPC) has created in 2009 the
fully digital silicon Photomultiplier (D-SiPM), which converts each photon detected in a
digital signal as early as possible in each of the Geiger-mode cells. In addition to this
conversion, a complete trigger logic and a time-to-digital converter were integrated into the
sensor. [20], [21]
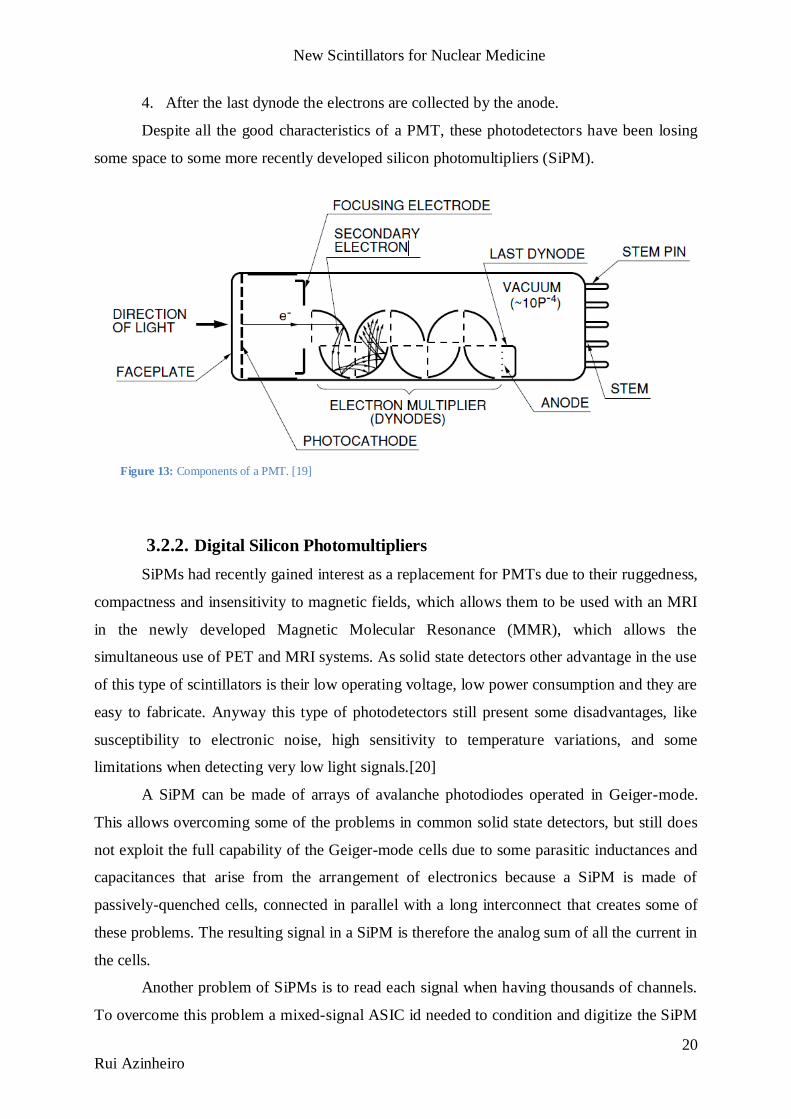
Sensor architecture and characteristics
The PDPC D-SiPM plays a significant role in
an acquisition, since it’s by controlling the sensor
that we can control some of the parameters of the
acquisition, like the trigger level and validation
thresholds. This is possible due to the ability of the
detector to count single photons, as well as the
presence of a time-to-digital converter (TDC). In all
process the Scintillators described before just plays a
passive role, giving the signal that will be read in
photodetector.
The D-SiPM chip is made with 16 dies; each
one of those will be connected to a crystal. Each die can then be divided in 4 pixels which
give the photon count values (four photon counters per die). The pixels are in turn divided in
4 sub-pixels which are used to build the different trigger schemes used. These sub-pixels are
then divided in smaller cells. Each die has 4x3200 cells.
The previous division allowed the simplification of the trigger levels. These trigger
levels are used to determine when a signal is considered valid. In these detectors a trigger
level is defined with the number of photons to consider it valid, and since these trigger levels
are implemented at sub-pixel level they are applied using simple logic. There are four trigger
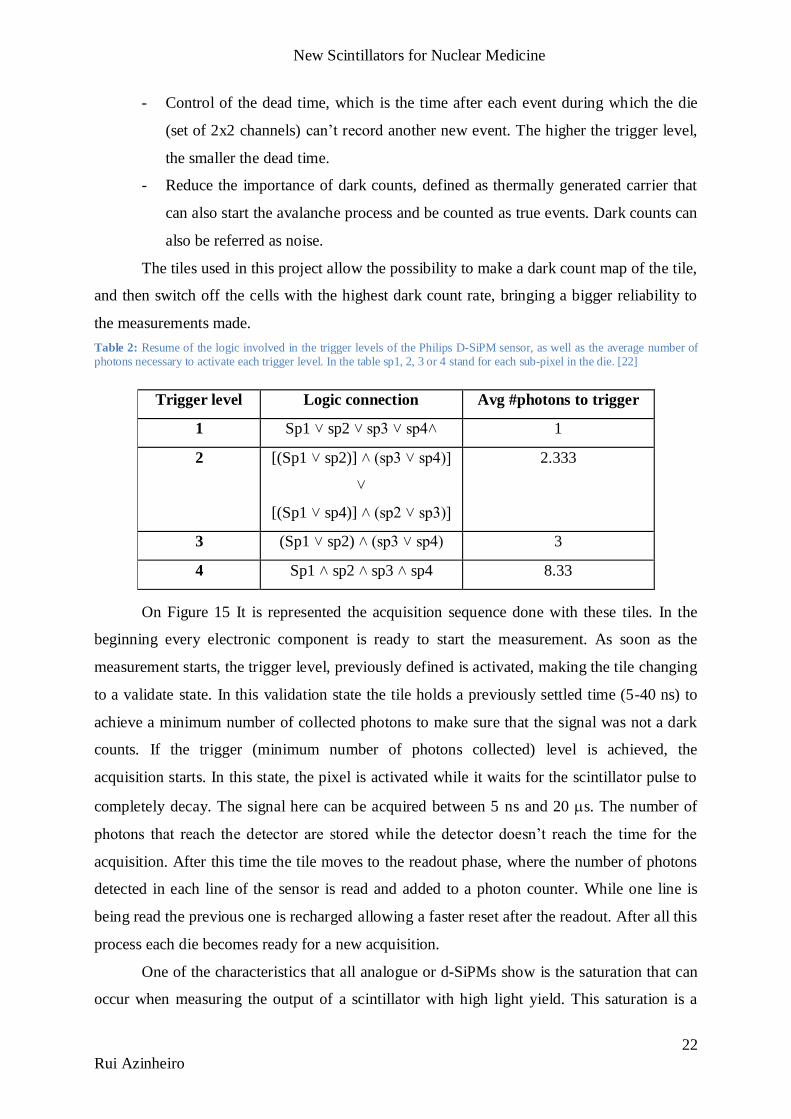
levels which are summarized in Table 2. These trigger levels are defined before any
acquisition. The importance of these trigger levels has to do with three factors:
- Time resolution: the smaller trigger threshold allows triggering on the first photon
trigger yielding the best time resolution. Other trigger settings, trigger in higher
number of detected photons. (Table 1). Since the detection process is stochastic
additional time uncertainty is introduced at the higher trigger thresholds.
Figure 14: Example of Philips D-SiPM [23]
New Scintillators for Nuclear Medicine
22
Rui Azinheiro
- Control of the dead time, which is the time after each event during which the die
(set of 2x2 channels) can’t record another new event. The higher the trigger level,
the smaller the dead time.
- Reduce the importance of dark counts, defined as thermally generated carrier that
can also start the avalanche process and be counted as true events. Dark counts can
also be referred as noise.
The tiles used in this project allow the possibility to make a dark count map of the tile,
and then switch off the cells with the highest dark count rate, bringing a bigger reliability to
the measurements made.
Table 2: Resume of the logic involved in the trigger levels of the Philips D-SiPM sensor, as well as the average number of photons necessary to activate each trigger level. In the table sp1, 2, 3 or 4 stand for each sub-pixel in the die. [22]
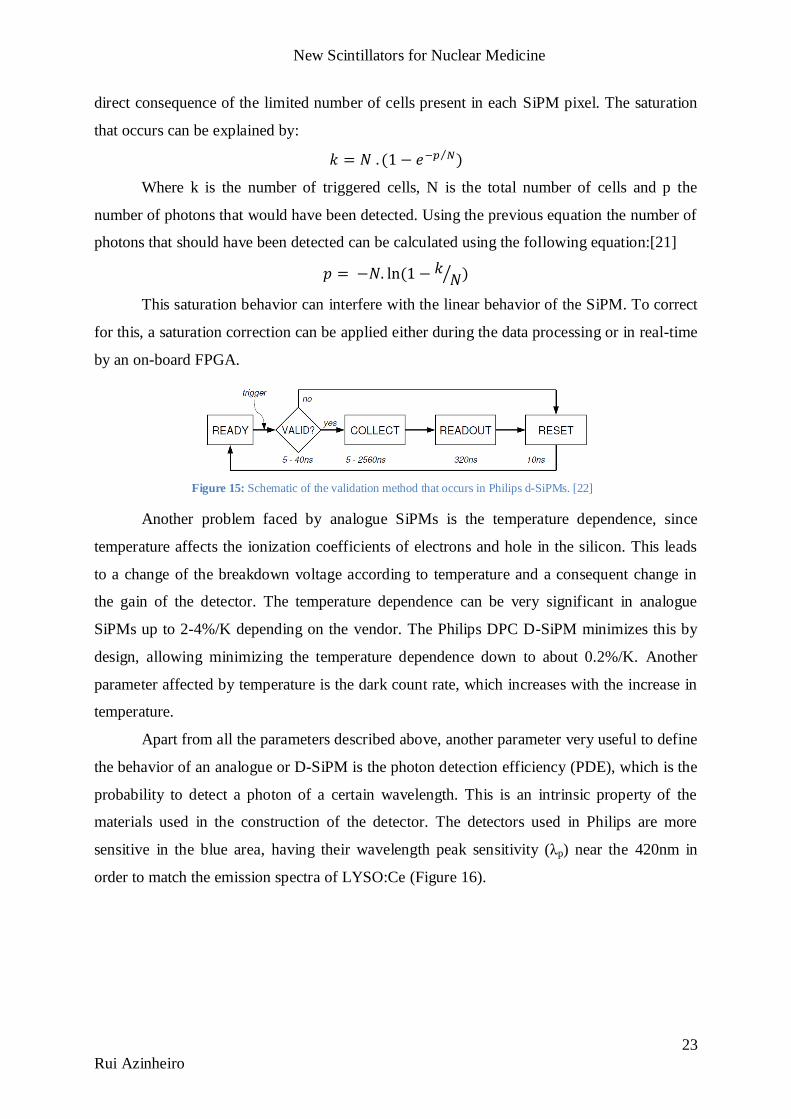
On Figure 15 It is represented the acquisition sequence done with these tiles. In the
beginning every electronic component is ready to start the measurement. As soon as the
measurement starts, the trigger level, previously defined is activated, making the tile changing
to a validate state. In this validation state the tile holds a previously settled time (5-40 ns) to
achieve a minimum number of collected photons to make sure that the signal was not a dark
counts. If the trigger (minimum number of photons collected) level is achieved, the
acquisition starts. In this state, the pixel is activated while it waits for the scintillator pulse to
completely decay. The signal here can be acquired between 5 ns and 20 s. The number of
photons that reach the detector are stored while the detector doesn’t reach the time for the
acquisition. After this time the tile moves to the readout phase, where the number of photons
detected in each line of the sensor is read and added to a photon counter. While one line is
being read the previous one is recharged allowing a faster reset after the readout. After all this
process each die becomes ready for a new acquisition.
One of the characteristics that all analogue or d-SiPMs show is the saturation that can
occur when measuring the output of a scintillator with high light yield. This saturation is a
Trigger level Logic connection Avg #photons to trigger
1 Sp1 ˅ sp2 ˅ sp3 ˅ sp4˄ 1
2 [(Sp1 ˅ sp2)] ˄ (sp3 ˅ sp4)]
˅
[(Sp1 ˅ sp4)] ˄ (sp2 ˅ sp3)]
2.333
3 (Sp1 ˅ sp2) ˄ (sp3 ˅ sp4) 3
4 Sp1 ˄ sp2 ˄ sp3 ˄ sp4 8.33
New Scintillators for Nuclear Medicine
23
Rui Azinheiro
direct consequence of the limited number of cells present in each SiPM pixel. The saturation
that occurs can be explained by:
⁄
Where k is the number of triggered cells, N is the total number of cells and p the
number of photons that would have been detected. Using the previous equation the number of
photons that should have been detected can be calculated using the following equation:[21]
⁄
This saturation behavior can interfere with the linear behavior of the SiPM. To correct
for this, a saturation correction can be applied either during the data processing or in real-time
by an on-board FPGA.
Another problem faced by analogue SiPMs is the temperature dependence, since
temperature affects the ionization coefficients of electrons and hole in the silicon. This leads
to a change of the breakdown voltage according to temperature and a consequent change in
the gain of the detector. The temperature dependence can be very significant in analogue
SiPMs up to 2-4%/K depending on the vendor. The Philips DPC D-SiPM minimizes this by
design, allowing minimizing the temperature dependence down to about 0.2%/K. Another
parameter affected by temperature is the dark count rate, which increases with the increase in
temperature.
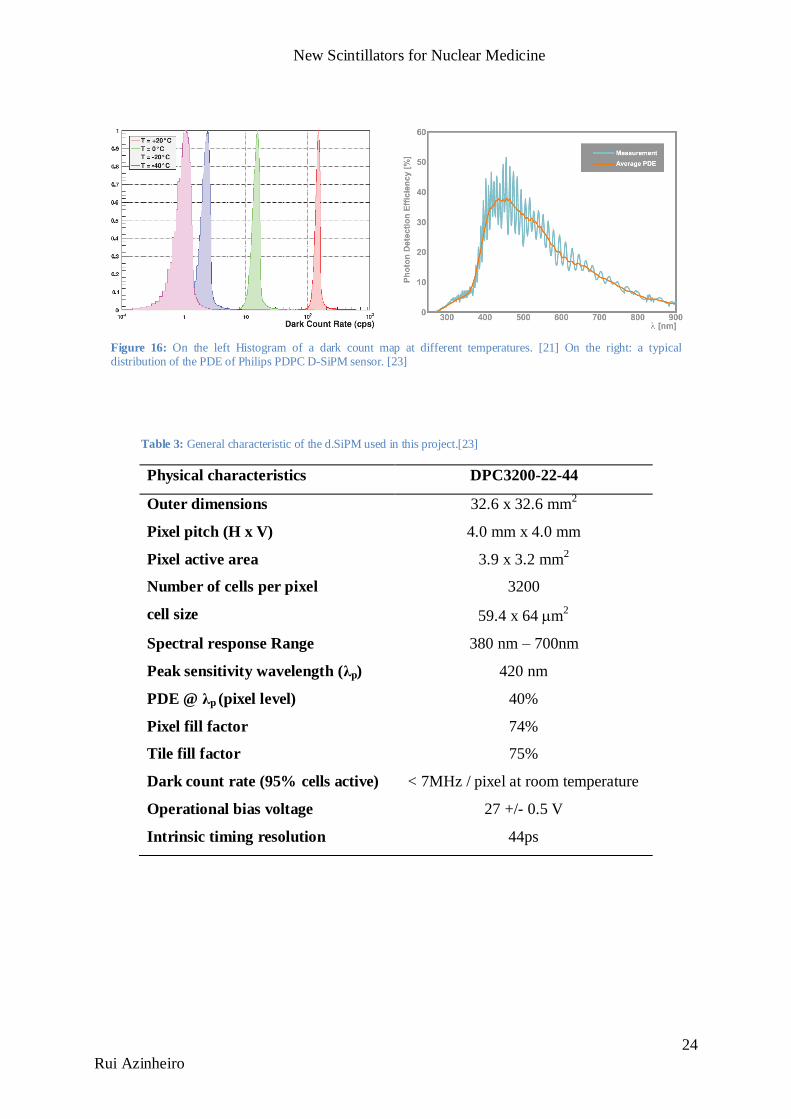
Apart from all the parameters described above, another parameter very useful to define
the behavior of an analogue or D-SiPM is the photon detection efficiency (PDE), which is the
probability to detect a photon of a certain wavelength. This is an intrinsic property of the
materials used in the construction of the detector. The detectors used in Philips are more
sensitive in the blue area, having their wavelength peak sensitivity (λp) near the 420nm in
order to match the emission spectra of LYSO:Ce (Figure 16).
Figure 15: Schematic of the validation method that occurs in Philips d-SiPMs. [22]
New Scintillators for Nuclear Medicine
24
Rui Azinheiro
Table 3: General characteristic of the d.SiPM used in this project.[23]
Physical characteristics DPC3200-22-44
Outer dimensions 32.6 x 32.6 mm2
Pixel pitch (H x V) 4.0 mm x 4.0 mm
Pixel active area 3.9 x 3.2 mm2
Number of cells per pixel
cell size
3200
59.4 x 64 m2
Spectral response Range 380 nm – 700nm
Peak sensitivity wavelength (λp) 420 nm
PDE @ λp (pixel level) 40%
Pixel fill factor 74%
Tile fill factor 75%
Dark count rate (95% cells active) < 7MHz / pixel at room temperature
Operational bias voltage 27 +/- 0.5 V
Intrinsic timing resolution 44ps
Figure 16: On the left Histogram of a dark count map at different temperatures. [21] On the right: a typical distribution of the PDE of Philips PDPC D-SiPM sensor. [23]
New Scintillators for Nuclear Medicine
25
Rui Azinheiro
4. EXPERIMENTAL METHODS
All the measurements here presented were made to test the ceramic garnet scintillators
performance under conditions similar to the PET scanner, i.e. excite with 511 keV gamma
radiation and measure in coincidence. The source of radiation used in both experiments was
a Na-22 source, because of its + decay and consequent emission of two photons of 511keV
necessary to detect coincidences.
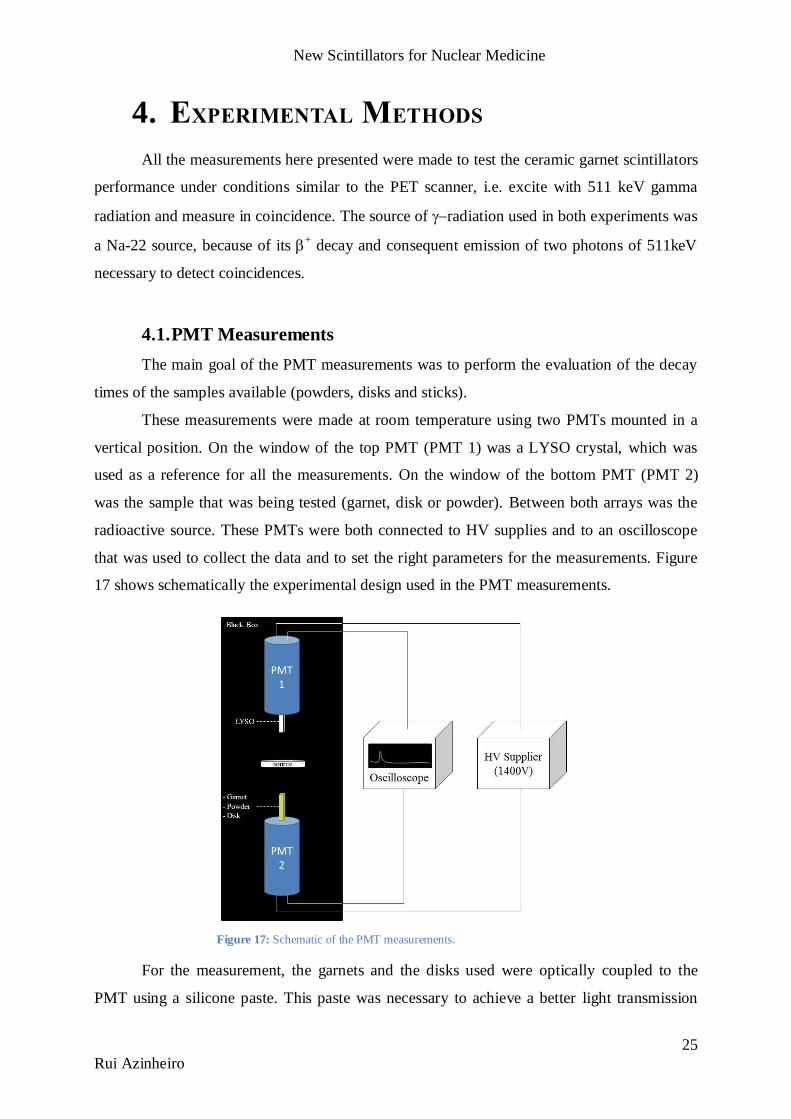
4.1. PMT Measurements
The main goal of the PMT measurements was to perform the evaluation of the decay
times of the samples available (powders, disks and sticks).
These measurements were made at room temperature using two PMTs mounted in a
vertical position. On the window of the top PMT (PMT 1) was a LYSO crystal, which was
used as a reference for all the measurements. On the window of the bottom PMT (PMT 2)
was the sample that was being tested (garnet, disk or powder). Between both arrays was the
radioactive source. These PMTs were both connected to HV supplies and to an oscilloscope
that was used to collect the data and to set the right parameters for the measurements. Figure
17 shows schematically the experimental design used in the PMT measurements.
For the measurement, the garnets and the disks used were optically coupled to the
PMT using a silicone paste. This paste was necessary to achieve a better light transmission
Figure 17: Schematic of the PMT measurements.
New Scintillators for Nuclear Medicine
26
Rui Azinheiro
bettween the PMT and the sample. In the powder measurements this paste wasn’t used. To
achieve a higher signal a reflector was used in every measurement. For the sticks we used a
case made of vikuity reflector sheets (Figure 18 left), for the powders we also used a layer of
vikuity, but covering only the top of the powder. The disks had their own white reflector case.
To measure the powders it was necessary to use small plastic containers, in the form of a disk
which allowed the powder to be pressed, presenting a homogeneous powder layer (Figure 18
right).
In order to only acquire data from coincidences and to suppress scattered radiation of
lower energy, trigger levels were set in the oscilloscope. These levels were defined in terms of
voltage. The channel from PMT1 was set to -50mV and the channel from PMT2 was set to -
80mV. The value on PMT2 had to be adjusted sometimes because of the different signal
height from different samples. For instance the trigger level used for powders was around -
20mV because of their low signal. With these trigger levels an event was considered true, and
consequently counted, if both PMTs achieved the required voltage level in a time window of
2ns. The overall signal was acquired for 10000 events (coincidences) with an integration time
of 20s. The data acquired from the oscilloscope was the data from the PMT2. A review of
the sttings used is listed on Table 4.
Table 4: Resume of the settings used in the PMT measurements.
Settings Values
High Voltage 1400V
Current Intensity 0.72mA
Trigger PMT 1 -80 mV
Trigger PMT 2 -15 to -80 mV
Number of acquisitions 10000
Coincidence window 2 ns
Figure 18: On the left, an example of the vikuity case used to measure the sticks. On the right: an example of the plastic disks containing the powders.
New Scintillators for Nuclear Medicine
27
Rui Azinheiro
In the PMT measurements, the first evaluation of decay times was made in powders.
Because of low light ouput and high levels of scattering the trigger levels had to be ajusted to
lower levels. The second evaluation was made on disks. After the evaluation in powders and
disks, the best samples were selected to the next phase that consisted in building a batch of
sticks that would be used in the TEK measurements described in section 4.2.
4.1.1. PMT measurements: Analysis
After the acquisition of the signals, an analysis was done in order to obtain the decay
values. This analysis was the same for every sample, changing only some values in the Matlab
script used.
All the measurements performed were evaluated using Matlab and Origin. The first
step in this evaluation was to convert the file acquired from the oscilloscope to a matlab file.
The second step of the process in Matlab followed three main steps:
1. The program determined the start of the signal using a single trace;
2. The sngle trace were used as a reference to rule out every of the 10000 traces that
were somehow corrupted e.g. by a second gamma photon hitting the PMT during
the readout time, or due to a low or high signal.
3. The final step was just to make the average of all the relevant traces.
The final step in the analysis was made with Origin. In Origin the objective was to
read an ASCII table that resulted from the Matlab analysis and then perform several
evaluations as: the integral within 645 ns and then the peak of the decay curve. These values
were used to calculate the effective decay times of the samples. This effective decay time is
calculated dividing the peak value by the integral over a defined period of time (the formula is
explained in Chapter 6-Discussion). In this evaluation was also used a tool from origin to
automatically calculate the decay times and the respective percentage that each decay time
represented.
4.2. Philips PDPC TEK Measurements
Measurements using a Philips PDPC TEK unit (Technology Evaluation Kit) were
made to assess the values for CRT, Energy Resolution, Count Rate and Light Output (LO)
were obtained. The main differences between this measurement and the PMT measurements
were:
- the type of detectors used: d-SPMs were used instead of a PMT;
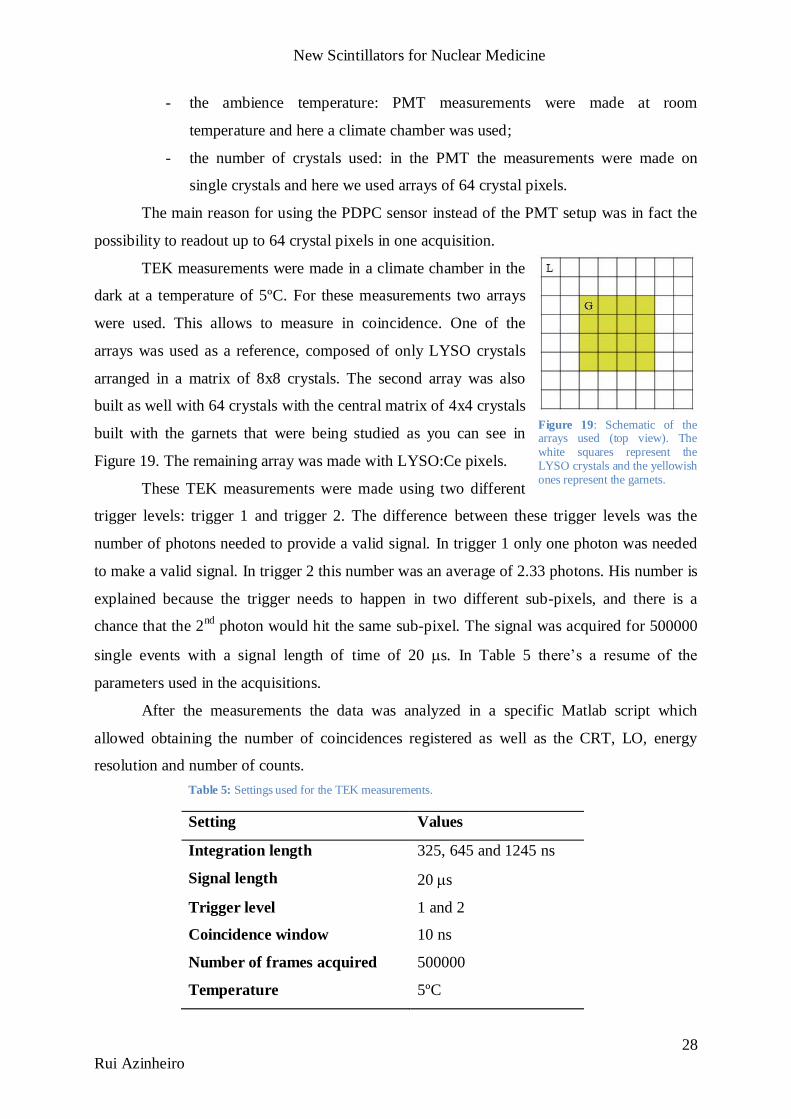
New Scintillators for Nuclear Medicine
28
Rui Azinheiro
- the ambience temperature: PMT measurements were made at room
temperature and here a climate chamber was used;
- the number of crystals used: in the PMT the measurements were made on
single crystals and here we used arrays of 64 crystal pixels.
The main reason for using the PDPC sensor instead of the PMT setup was in fact the
possibility to readout up to 64 crystal pixels in one acquisition.
TEK measurements were made in a climate chamber in the
dark at a temperature of 5ºC. For these measurements two arrays
were used. This allows to measure in coincidence. One of the
arrays was used as a reference, composed of only LYSO crystals
arranged in a matrix of 8x8 crystals. The second array was also
built as well with 64 crystals with the central matrix of 4x4 crystals
built with the garnets that were being studied as you can see in
Figure 19. The remaining array was made with LYSO:Ce pixels.
These TEK measurements were made using two different
trigger levels: trigger 1 and trigger 2. The difference between these trigger levels was the
number of photons needed to provide a valid signal. In trigger 1 only one photon was needed
to make a valid signal. In trigger 2 this number was an average of 2.33 photons. His number is
explained because the trigger needs to happen in two different sub-pixels, and there is a
chance that the 2nd
photon would hit the same sub-pixel. The signal was acquired for 500000
single events with a signal length of time of 20 s. In Table 5 there’s a resume of the
parameters used in the acquisitions.
After the measurements the data was analyzed in a specific Matlab script which
allowed obtaining the number of coincidences registered as well as the CRT, LO, energy
resolution and number of counts.
Table 5: Settings used for the TEK measurements.
Setting Values
Integration length 325, 645 and 1245 ns
Signal length 20 s
Trigger level 1 and 2
Coincidence window 10 ns
Number of frames acquired 500000
Temperature 5ºC
Figure 19: Schematic of the arrays used (top view). The white squares represent the LYSO crystals and the yellowish ones represent the garnets.
New Scintillators for Nuclear Medicine
29
Rui Azinheiro
Both measurements were made following the safety instructions from the Philips
Research Eindhoven Radiation Protection Officer, which included the use of a personal badge
as well as an online course about managing radiation sources. Concerning the powders,
because of their nature, it was necessary to use gloves and a mask for breathing.
4.2.1. Preparation of the array for TEK measurements
The preparation of new arrays involved the placement of the individual crystals in a
reflector array, with spaces for 8x8 crystals. The inner central part of 4x4 crystals was filled
with different versions of ceramic garnets, and the outer ring with LYSO:Ce crystals. The
arrays were recycled which means that only the garnets that are being tested were changed,
leaving the LYSO unchanged.
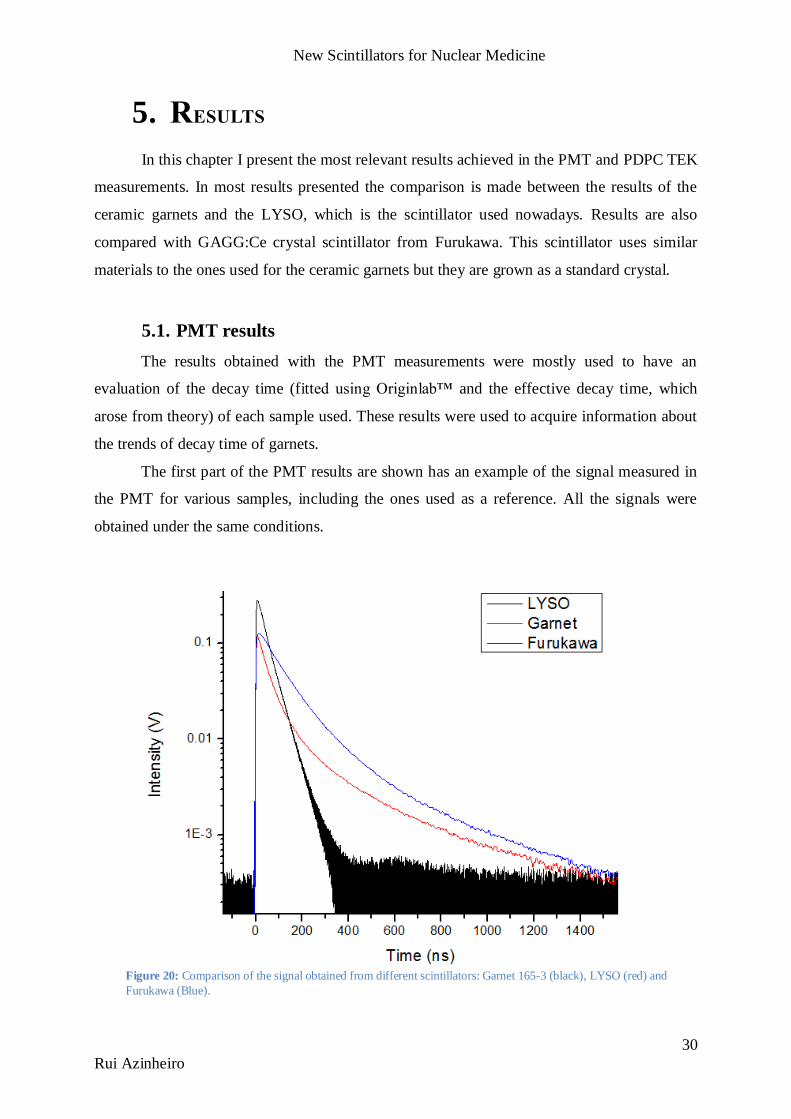
New Scintillators for Nuclear Medicine
30
Rui Azinheiro
5. RESULTS
In this chapter I present the most relevant results achieved in the PMT and PDPC TEK
measurements. In most results presented the comparison is made between the results of the
ceramic garnets and the LYSO, which is the scintillator used nowadays. Results are also
compared with GAGG:Ce crystal scintillator from Furukawa. This scintillator uses similar
materials to the ones used for the ceramic garnets but they are grown as a standard crystal.
5.1. PMT results
The results obtained with the PMT measurements were mostly used to have an
evaluation of the decay time (fitted using Originlab™ and the effective decay time, which
arose from theory) of each sample used. These results were used to acquire information about
the trends of decay time of garnets.
The first part of the PMT results are shown has an example of the signal measured in
the PMT for various samples, including the ones used as a reference. All the signals were
obtained under the same conditions.
Figure 20: Comparison of the signal obtained from different scintillators: Garnet 165-3 (black), LYSO (red) and
Furukawa (Blue).
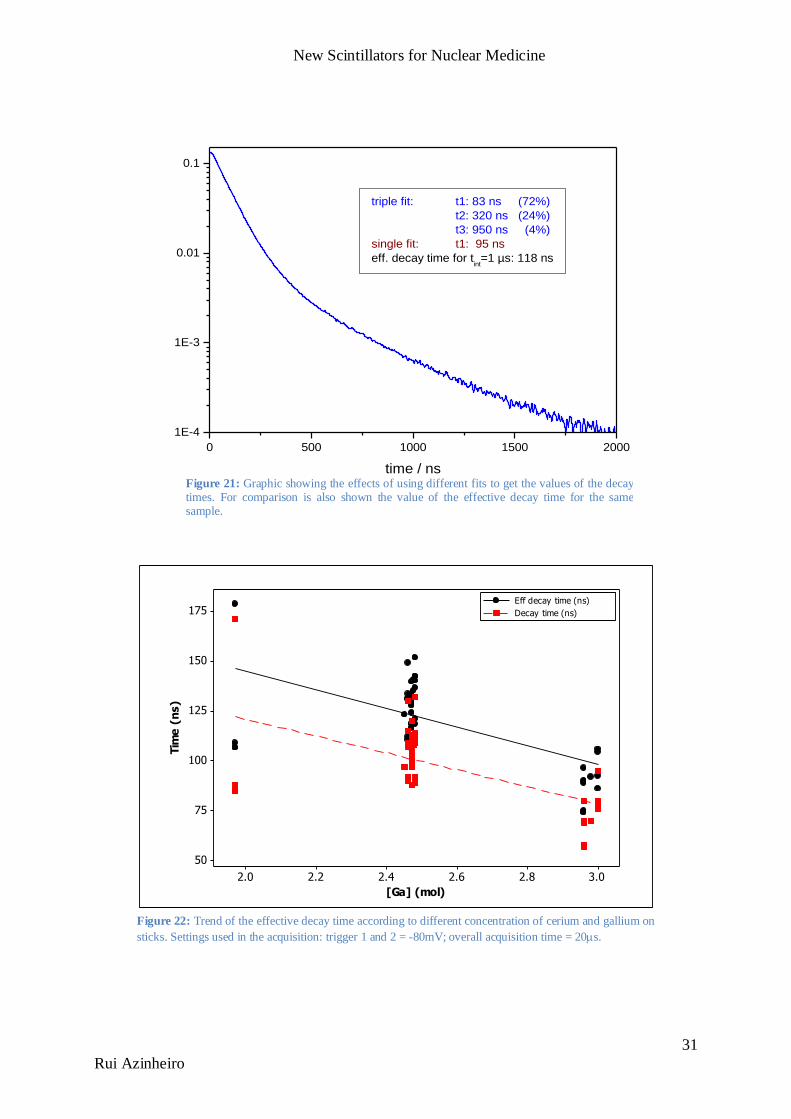
New Scintillators for Nuclear Medicine
31
Rui Azinheiro
Figure 21: Graphic showing the effects of using different fits to get the values of the decay times. For comparison is also shown the value of the effective decay time for the same sample.
0 500 1000 1500 2000
1E-4
1E-3
0.01
0.1
triple fit: t1: 83 ns (72%)
t2: 320 ns (24%)
t3: 950 ns (4%)
single fit: t1: 95 ns
eff. decay time for tint
=1 µs: 118 ns
time / ns
3.02.82.62.42.22.0
175
150
125
100
75
50
[Ga] (mol)
Tim
e (
ns)
Eff decay time (ns)
Decay time (ns)
Figure 22: Trend of the effective decay time according to different concentration of cerium and gallium on
sticks. Settings used in the acquisition: trigger 1 and 2 = -80mV; overall acquisition time = 20s.
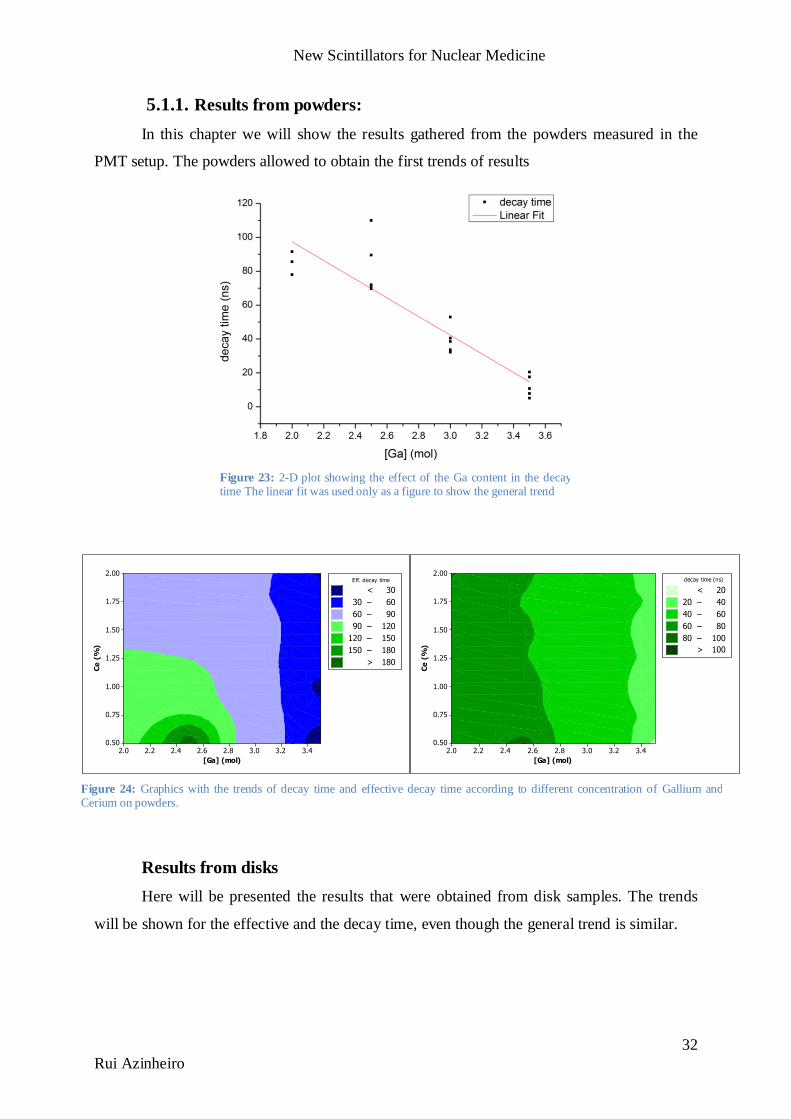
New Scintillators for Nuclear Medicine
32
Rui Azinheiro
5.1.1. Results from powders:
In this chapter we will show the results gathered from the powders measured in the
PMT setup. The powders allowed to obtain the first trends of results
Results from disks
Here will be presented the results that were obtained from disk samples. The trends
will be shown for the effective and the decay time, even though the general trend is similar.
[Ga] (mol)
Ce
(%
)
3.43.23.02.82.62.42.22.0
2.00
1.75
1.50
1.25
1.00
0.75
0.50
>
–
–
–
–
< 20
20 40
40 60
60 80
80 100
100
decay time (ns)
[Ga] (mol)
Ce
(%
)
3.43.23.02.82.62.42.22.0
2.00
1.75
1.50
1.25
1.00
0.75
0.50
>
–
–
–
–
–
< 30
30 60
60 90
90 120
120 150
150 180
180
Eff. decay time
Figure 24: Graphics with the trends of decay time and effective decay time according to different concentration of Gallium and Cerium on powders.
Figure 23: 2-D plot showing the effect of the Ga content in the decay time The linear fit was used only as a figure to show the general trend
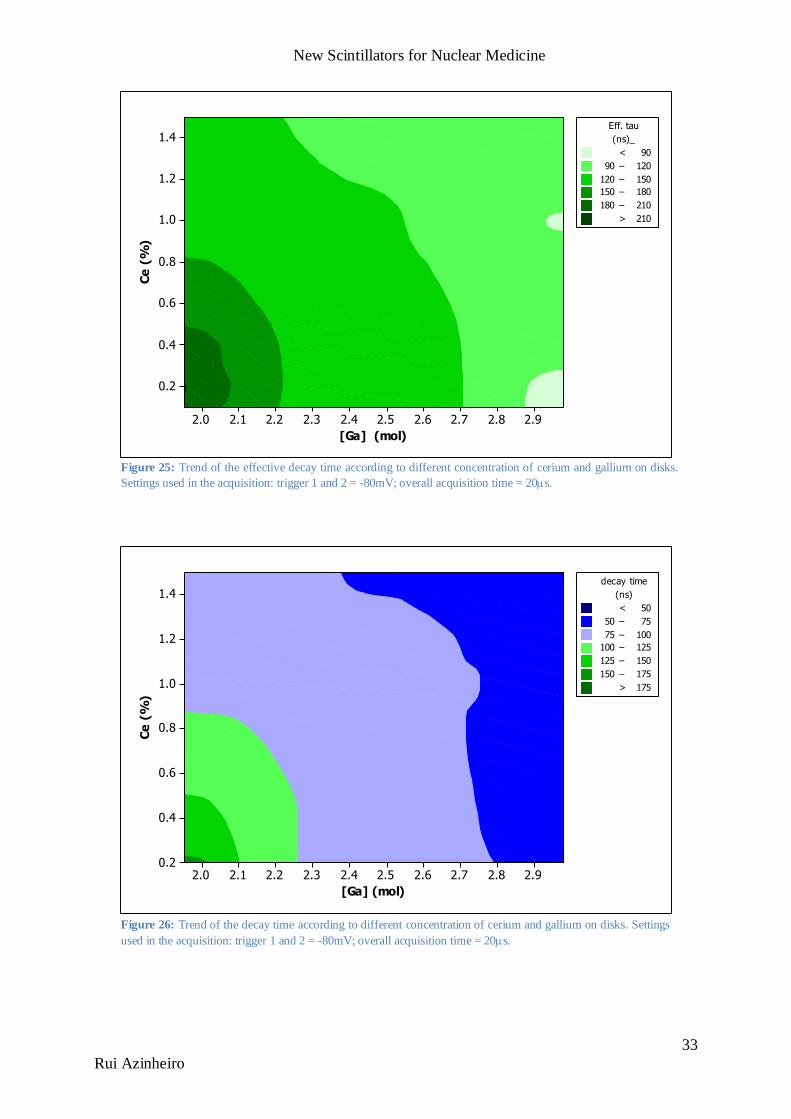
New Scintillators for Nuclear Medicine
33
Rui Azinheiro
Figure 25: Trend of the effective decay time according to different concentration of cerium and gallium on disks.
Settings used in the acquisition: trigger 1 and 2 = -80mV; overall acquisition time = 20s.
[Ga] (mol)
Ce
(%
)
2.92.82.72.62.52.42.32.22.12.0
1.4
1.2
1.0
0.8
0.6
0.4
0.2
>
–
–
–
–
< 90
90 120
120 150
150 180
180 210
210
(ns)_
Eff. tau
[Ga] (mol)
Ce
(%
)
2.92.82.72.62.52.42.32.22.12.0
1.4
1.2
1.0
0.8
0.6
0.4
0.2
>
–
–
–
–
–
< 50
50 75
75 100
100 125
125 150
150 175
175
(ns)
decay time
Figure 26: Trend of the decay time according to different concentration of cerium and gallium on disks. Settings
used in the acquisition: trigger 1 and 2 = -80mV; overall acquisition time = 20s.
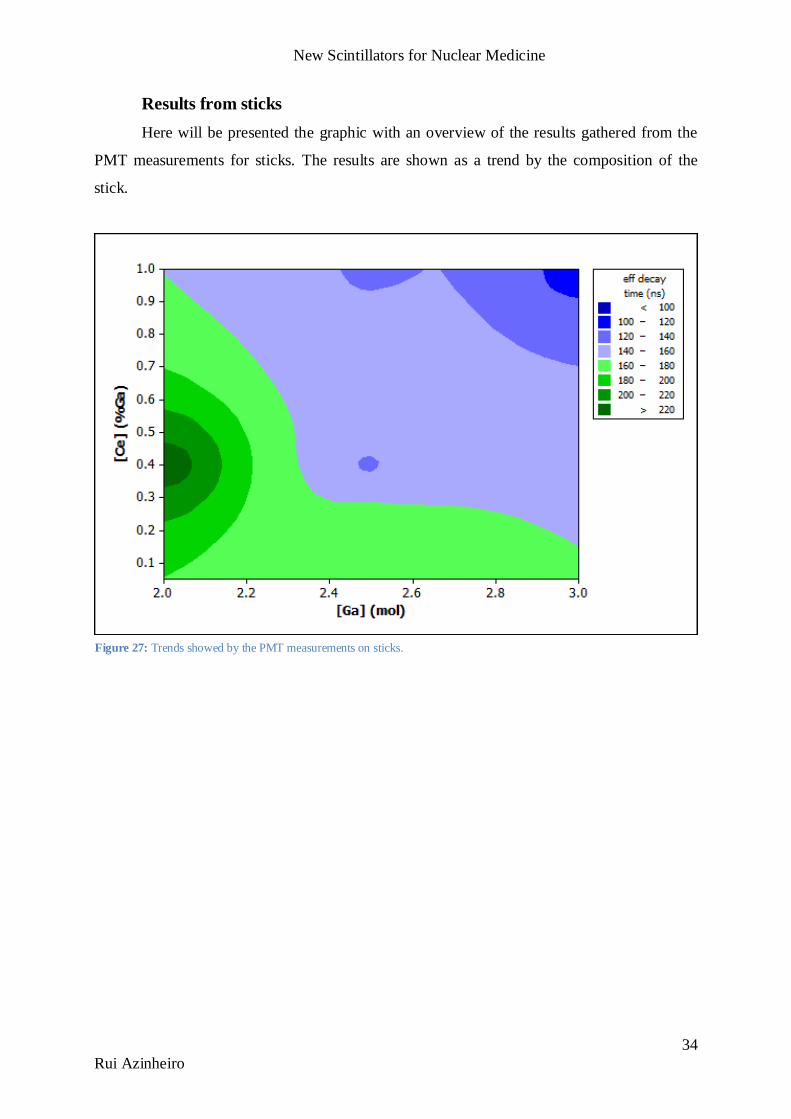
New Scintillators for Nuclear Medicine
34
Rui Azinheiro
Results from sticks
Here will be presented the graphic with an overview of the results gathered from the
PMT measurements for sticks. The results are shown as a trend by the composition of the
stick.
Figure 27: Trends showed by the PMT measurements on sticks.
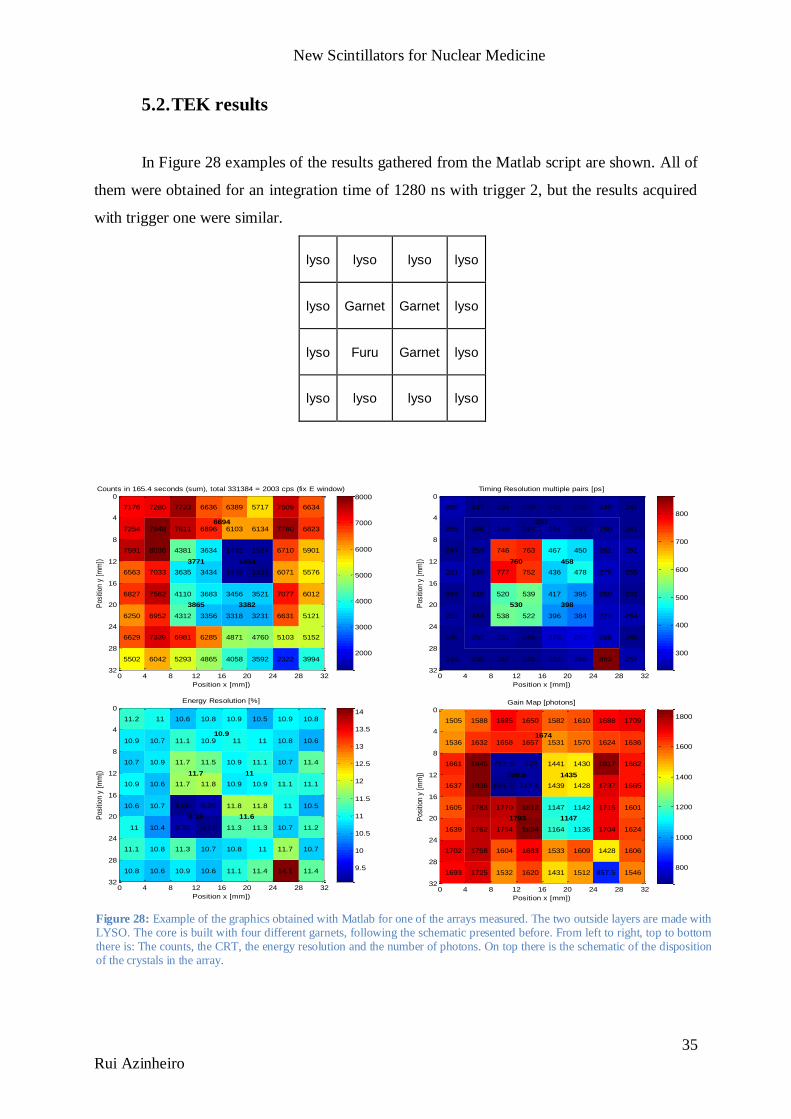
New Scintillators for Nuclear Medicine
35
Rui Azinheiro
5.2. TEK results
In Figure 28 examples of the results gathered from the Matlab script are shown. All of
them were obtained for an integration time of 1280 ns with trigger 2, but the results acquired
with trigger one were similar.
lyso lyso lyso lyso
lyso Garnet Garnet lyso
lyso Furu Garnet lyso
lyso lyso lyso lyso
Position x [mm])
Pos
ition
y [
mm
])
Counts in 165.4 seconds (sum), total 331384 = 2003 cps (fix E window)
7176 7280 7723 6636 6389 5717 7509 6634
7254 7948 7611 6896 6103 6134 7780 6823
7591 8036 4381 3634 1492 1527 6710 5901
6563 7033 3635 3434 1466 1326 6071 5576
6827 7562 4110 3683 3456 3521 7077 6012
6250 6952 4312 3356 3318 3231 6631 5121
6629 7339 6981 6285 4871 4760 5103 5152
5502 6042 5293 4865 4058 3592 2322 3994
3771 1453
3865 3382
6694
0 4 8 12 16 20 24 28 32
0
4
8
12
16
20
24
28
32
2000
3000
4000
5000
6000
7000
8000
Position x [mm])
Pos
ition
y [
mm
])
Timing Resolution multiple pairs [ps]
260 247 239 239 245 238 249 247
255 246 249 241 254 247 250 241
247 256 746 763 467 450 261 261
261 249 777 752 436 478 276 255
244 248 520 539 417 395 260 242
253 244 538 522 396 384 271 264
240 252 251 246 278 292 268 240
244 238 247 245 252 266 863 257
760 458
530 398
257
0 4 8 12 16 20 24 28 32
0
4
8
12
16
20
24
28
32
300
400
500
600
700
800
Position x [mm])
Pos
ition
y [
mm
])
Energy Resolution [%]
11.2 11 10.6 10.8 10.9 10.5 10.9 10.8
10.9 10.7 11.1 10.9 11 11 10.8 10.6
10.7 10.9 11.7 11.5 10.9 11.1 10.7 11.4
10.9 10.6 11.7 11.8 10.9 10.9 11.1 11.1
10.6 10.7 9.08 9.25 11.8 11.8 11 10.5
11 10.4 9.32 9.11 11.3 11.3 10.7 11.2
11.1 10.8 11.3 10.7 10.8 11 11.7 10.7
10.8 10.6 10.9 10.6 11.1 11.4 14.1 11.4
11.7 11
9.19 11.6
10.9
0 4 8 12 16 20 24 28 32
0
4
8
12
16
20
24
28
32
9.5
10
10.5
11
11.5
12
12.5
13
13.5
14
Position x [mm])
Pos
ition
y [
mm
])
Gain Map [photons]
1505 1588 1685 1650 1582 1610 1688 1709
1536 1632 1658 1657 1531 1570 1624 1636
1661 1845 713.3 722 1441 1430 1817 1682
1637 1836 691.5 712.4 1439 1428 1737 1665
1605 1783 1770 1812 1147 1142 1715 1601
1639 1762 1754 1834 1164 1136 1704 1624
1702 1758 1604 1683 1533 1609 1428 1606
1693 1725 1532 1620 1431 1512 857.5 1546
709.8 1435
1793 1147
1674
0 4 8 12 16 20 24 28 32
0
4
8
12
16
20
24
28
32
800
1000
1200
1400
1600
1800
Figure 28: Example of the graphics obtained with Matlab for one of the arrays measured. The two outside layers are made with LYSO. The core is built with four different garnets, following the schematic presented before. From left to right, top to bottom there is: The counts, the CRT, the energy resolution and the number of photons. On top there is the schematic of the disposition of the crystals in the array.
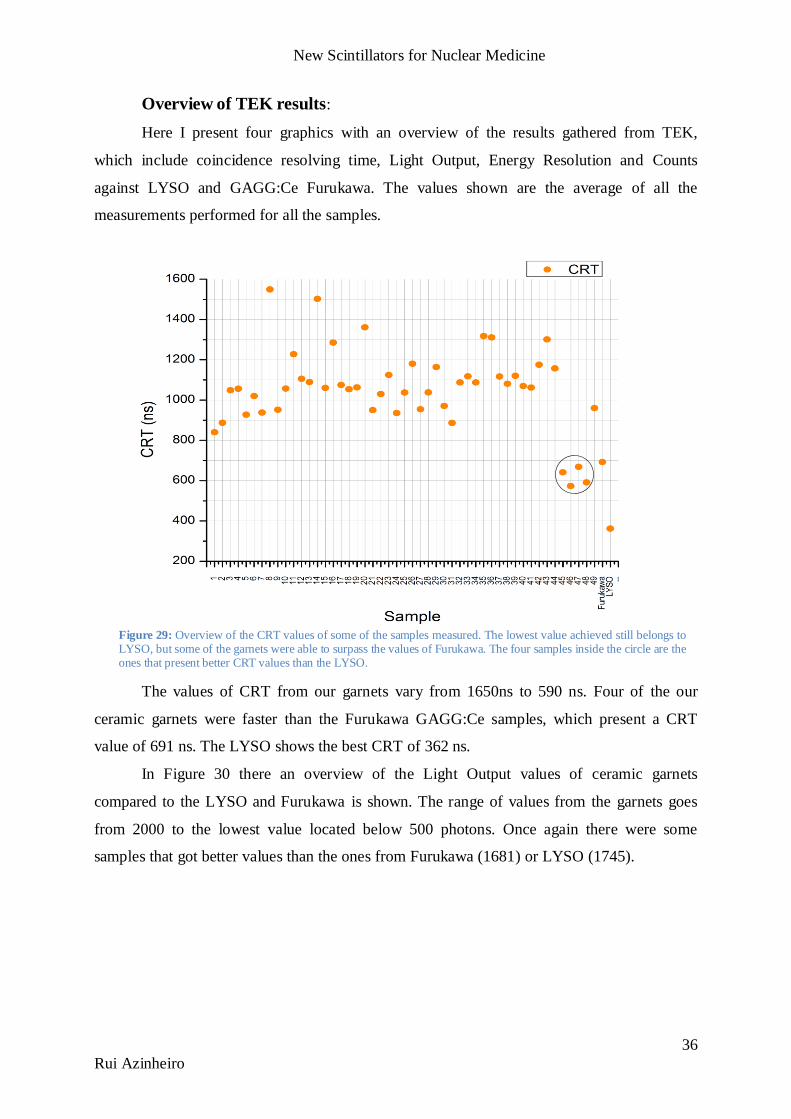
New Scintillators for Nuclear Medicine
36
Rui Azinheiro
Overview of TEK results:
Here I present four graphics with an overview of the results gathered from TEK,
which include coincidence resolving time, Light Output, Energy Resolution and Counts
against LYSO and GAGG:Ce Furukawa. The values shown are the average of all the
measurements performed for all the samples.
The values of CRT from our garnets vary from 1650ns to 590 ns. Four of the our
ceramic garnets were faster than the Furukawa GAGG:Ce samples, which present a CRT
value of 691 ns. The LYSO shows the best CRT of 362 ns.
In Figure 30 there an overview of the Light Output values of ceramic garnets
compared to the LYSO and Furukawa is shown. The range of values from the garnets goes
from 2000 to the lowest value located below 500 photons. Once again there were some
samples that got better values than the ones from Furukawa (1681) or LYSO (1745).
Figure 29: Overview of the CRT values of some of the samples measured. The lowest value achieved still belongs to LYSO, but some of the garnets were able to surpass the values of Furukawa. The four samples inside the circle are the ones that present better CRT values than the LYSO.
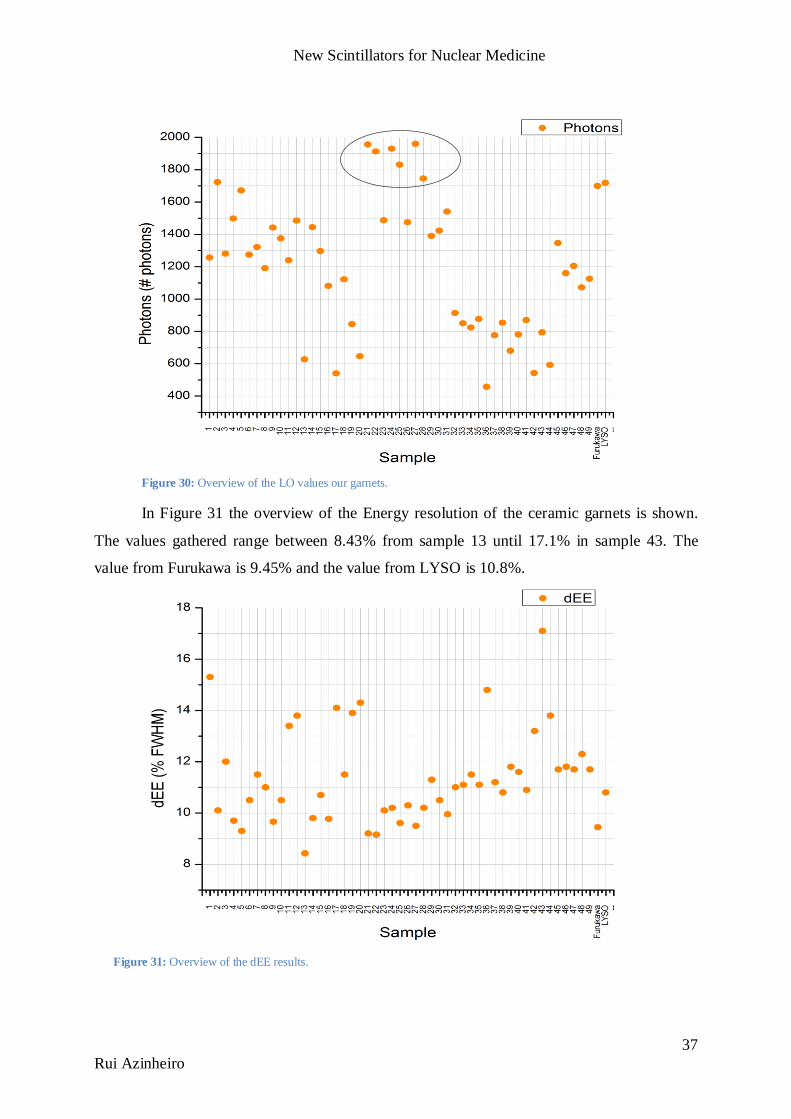
New Scintillators for Nuclear Medicine
37
Rui Azinheiro
In Figure 31 the overview of the Energy resolution of the ceramic garnets is shown.
The values gathered range between 8.43% from sample 13 until 17.1% in sample 43. The
value from Furukawa is 9.45% and the value from LYSO is 10.8%.
Figure 30: Overview of the LO values our garnets.
Figure 31: Overview of the dEE results.
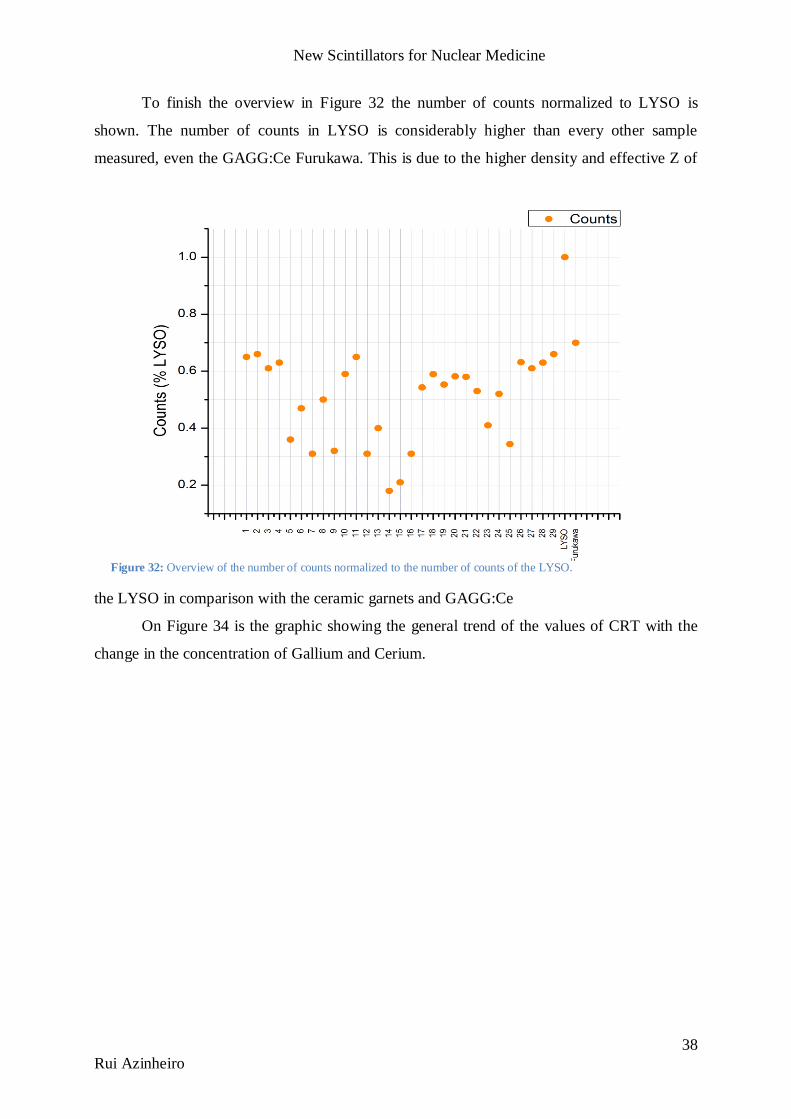
New Scintillators for Nuclear Medicine
38
Rui Azinheiro
To finish the overview in Figure 32 the number of counts normalized to LYSO is
shown. The number of counts in LYSO is considerably higher than every other sample
measured, even the GAGG:Ce Furukawa. This is due to the higher density and effective Z of
the LYSO in comparison with the ceramic garnets and GAGG:Ce
On Figure 34 is the graphic showing the general trend of the values of CRT with the
change in the concentration of Gallium and Cerium.
Figure 32: Overview of the number of counts normalized to the number of counts of the LYSO.
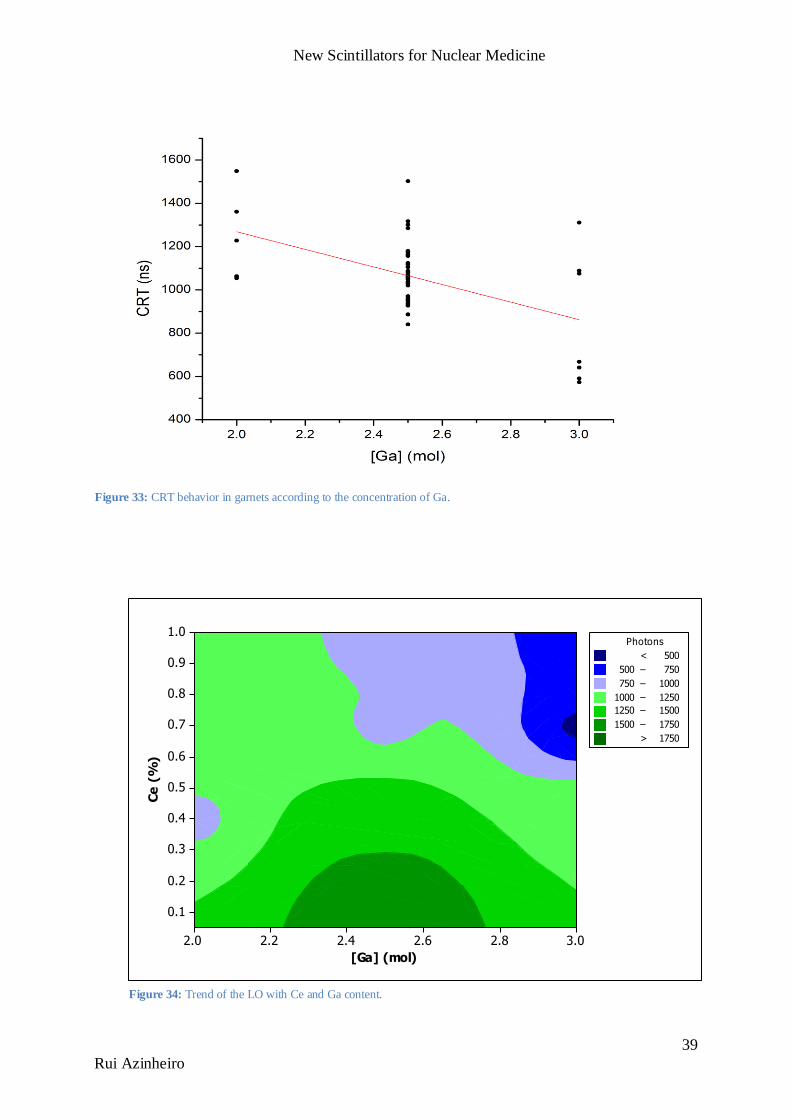
New Scintillators for Nuclear Medicine
39
Rui Azinheiro
Figure 34: Trend of the LO with Ce and Ga content.
[Ga] (mol)
Ce
(%
)
3.02.82.62.42.22.0
1.0
0.9
0.8
0.7
0.6
0.5
0.4
0.3
0.2
0.1
>
–
–
–
–
–
< 500
500 750
750 1000
1000 1250
1250 1500
1500 1750
1750
Photons
Figure 33: CRT behavior in garnets according to the concentration of Ga.
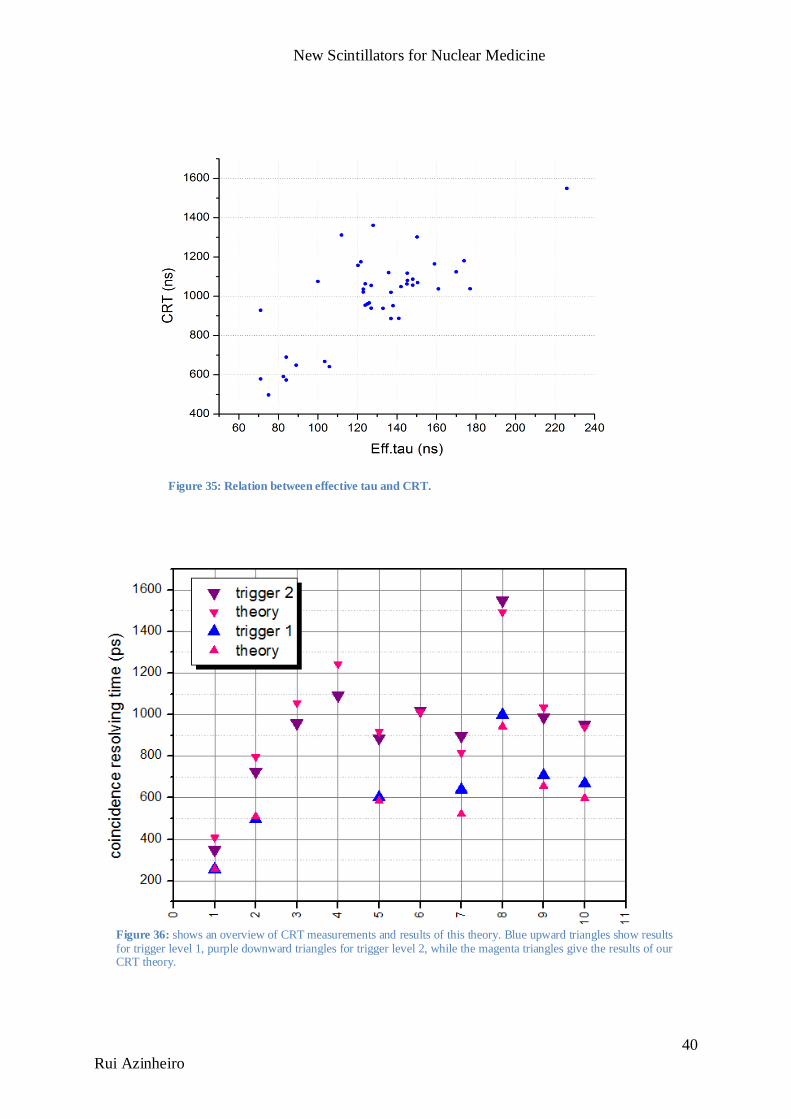
New Scintillators for Nuclear Medicine
40
Rui Azinheiro
Figure 36: shows an overview of CRT measurements and results of this theory. Blue upward triangles show results for trigger level 1, purple downward triangles for trigger level 2, while the magenta triangles give the results of our CRT theory.
Figure 35: Relation between effective tau and CRT.
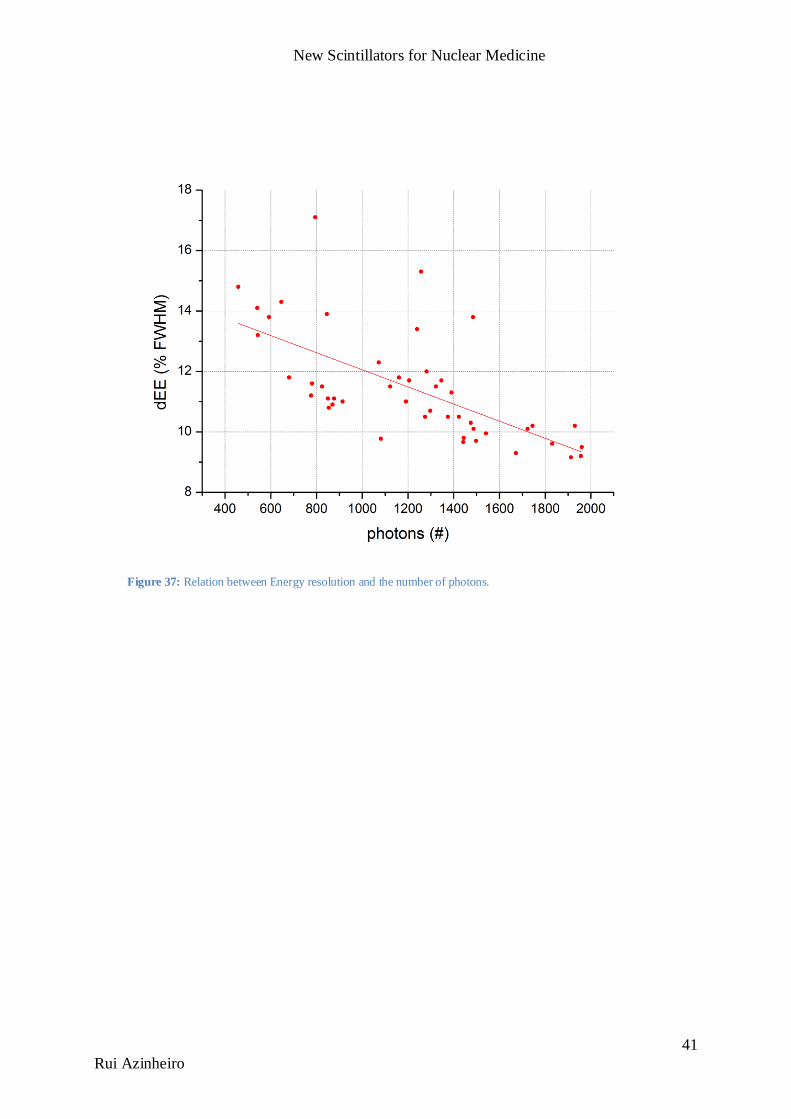
New Scintillators for Nuclear Medicine
41
Rui Azinheiro
Figure 37: Relation between Energy resolution and the number of photons.
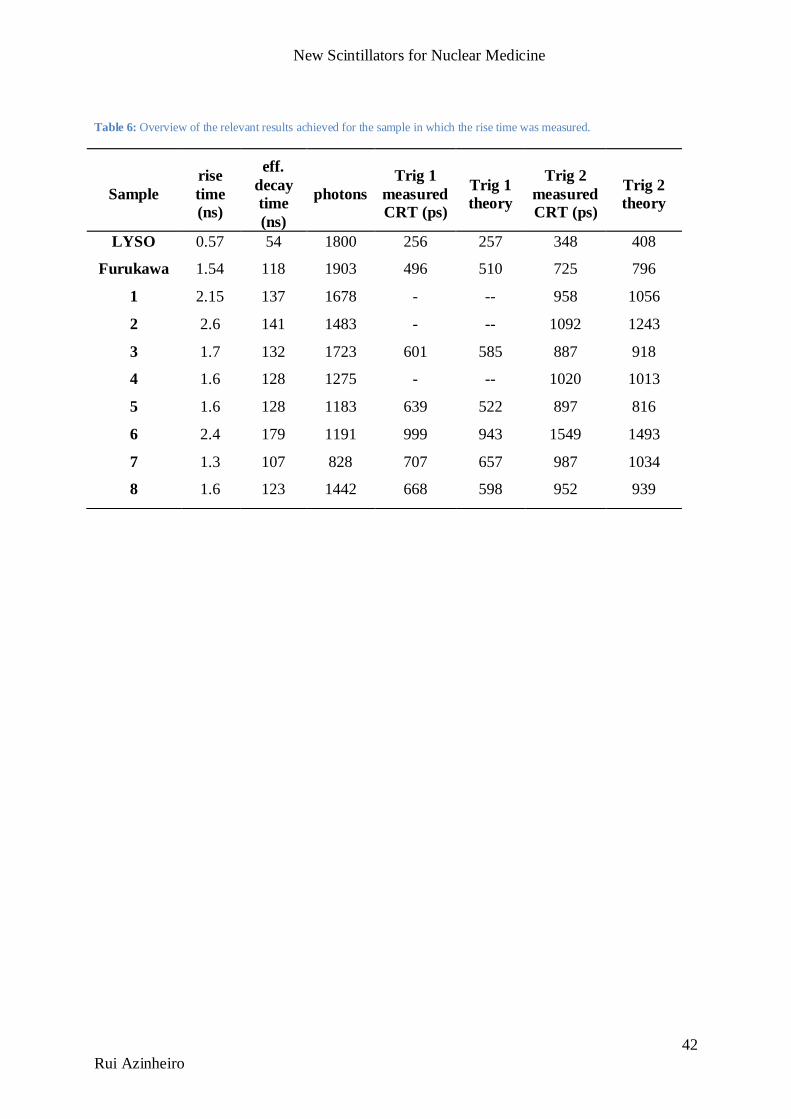
New Scintillators for Nuclear Medicine
42
Rui Azinheiro
Table 6: Overview of the relevant results achieved for the sample in which the rise time was measured.
Sample
rise
time
(ns)
eff.
decay
time
(ns)
photons
Trig 1
measured
CRT (ps)
Trig 1
theory
Trig 2
measured
CRT (ps)
Trig 2
theory
LYSO 0.57 54 1800 256 257 348 408
Furukawa 1.54 118 1903 496 510 725 796
1 2.15 137 1678 - -- 958 1056
2 2.6 141 1483 - -- 1092 1243
3 1.7 132 1723 601 585 887 918
4 1.6 128 1275 - -- 1020 1013
5 1.6 128 1183 639 522 897 816
6 2.4 179 1191 999 943 1549 1493
7 1.3 107 828 707 657 987 1034
8 1.6 123 1442 668 598 952 939
New Scintillators for Nuclear Medicine
43
Rui Azinheiro
6. DISCUSSION
To achieve the goal of this project that was to identify a ceramic scintillator for TOF
PET competitive with the current crystal scintillators used nowadays in PET scanners,
materials to build this ceramic like Lu, Ga, Gd, Al were explored. Ce was used as an
activator.
The overall results in the PMT showed that there were some samples with a faster
decay than the GAGG:Ce crystal from Furukawa, which was one of the goals to achieve. It
should also be mentioned that LYSO:Ce still presents a faster behavior than every ceramic
tested.
The first conclusions that it is possible to take from the PMT measurement phase is the
presence of a slow component/afterglow in every sample measured. This component was
enhanced every time the samples were exposed to UV rays from the room lighting system.
The presence of such component brought the need to create a new method to measure the fast
decay component, (the first one) since the way it was measured in the beginning, directly
from the software Originlab™, showed a high dependence on the slow component as well as
the interval that was chosen for the fit. Since the first component of the decay time is the most
important one to predict the values of the CRT, it was necessary to introduce a more accurate
way to calculate this first component. That is the reason why the effective decay time was
introduced (Figure 20).
The effective decay time takes into account the signal maximum right after signal rise,
given in terms of the PMT measurement by according to theory. With
the number of photons ∫
, measured during the integration time , the
signal maximum is better described by an effective decay time constant
with the integration time of the PMT signal the same as in the PDPC D-SiPM TEK
measurement (645 ns) defining the number of photons N. This parameter was also very
important to prove the theory to estimate the CRT values that was being developed at the
same time. This effective decay time was used in every analysis of the PMT results. In Figure
22 there is the relation between the effective decay, and the first component measured directly
on the software, as it is possible to see they show similar trends.
PMT measurements of powders showed a big effect of the Gallium (Ga) concentration
on the ceramic. The higher the concentration of, Ga the lower are the values of decay time.
New Scintillators for Nuclear Medicine
44
Rui Azinheiro
The effect of changing the Cerium (Ce) concentration also played a role. The higher the
concentration of Ce the lower is the CRT. The effect of these two elements in the powders
could be extrapolated to the disks or sticks, but the overall values of the decay times in disks
and sticks were in general higher. The measurement of the powders presented some problems
due to their complete lack of transparency and homogeneity. These two factors together
generated a problem of a really low signal, sometimes near the noise level of the PMT. The
trigger levels with the powders had to be adjusted to -15mV, to be possible to measure the
signal. Even with this trigger level it took a longer time than with disks or sticks to get the
10000 events wanted for the analysis.
The measurement of disks brought some better insight over the general effect of the
concentration of the different elements in the ceramics. This was also possible due to the high
amount of measurements made with disks. In the disks the effect of Ga was also verified, so
the higher the amount of Ga, the lower the decay time. But these measurements also brought a
good insight into the effect of the concentration of Ce. In all the disks measured it was
possible to conclude that the effective decay time, and the decay time were lower with higher
values of these two elements (Figure 25, Figure 26).
The measurements with sticks showed not so obvious trends. Analyzing Figure 27 it is
possible to see that the lowest effective decay time values were achieved with high Ce and
high Ga, but in this case it is not as conclusive as with disks. The reason for this to happen
might be due to the lower number of sticks measured compared with the number of disks.
Another problem with the measurement with the sticks was the lack of transparency of some
of them, causing some change in the results. The effect of the UV light in the afterglow was
also very different from stick to stick. This slow component was strong enough to delay some
of the measurements. When this happened the stick had to stay in the chamber until it was
possible to make the measurement. The right moment to make this measurement was
achieved when the current measured in the HV supply reached the 0.72mV. In the presence of
afterglow this value increased until ~0.8mV.
From the PDPC TEK measurements the objective was to check four different values:
CRT, light output (LO), counts and energy resolution (dE/E). The two most important
parameters to observe here were the CRT and the LO.
New Scintillators for Nuclear Medicine
45
Rui Azinheiro
Starting the analysis with the LO, it was verified that this parameter showed that there
were some big variations in the LO with samples showing a LO below 500 optical photons at
511 keV and another ones having values near 2000 (better than LYSO and Furukawa). During
these measurements it was also verified that there was a relation between the LO and the
energy resolution (dE/E) at 511 keV. The higher the values of light output (LO), the better the
values of the energy resolution (Figure 37). The trend of LO with Ga and Ce is shown in
Figure 34. The higher values of LO were achieved with Ga=2.5, being the LO lower to higher
or lower values. The effect of Ce is not that clear, but the best LO values were achieved for
high concentrations of Ce, which could indicate that the best CRT and LO values would be
achievable with high concentrations of Ce.
The measurements of the light output was one of the big challenges to face in this
project, because there were some samples that didn’t present a signal high enough to be
measurable in the TEK even though it was measurable on the PMTs. The fact that the signal
was not measurable in the silicon detectors, but it was on the PMT’s can be due to the fact
that the Philips PDPC D-SPMs are optimized to detect light in the blue region and the
ceramic garnets emit light in the green region of the electromagnetic spectrum.
The CRT was another of the parameters measured in the TEK setup. This is the main
parameter to identify if the project was a success, since this is the key parameter to have a
TOF PET. The main goal with the CRT was to obtain better values than the ones acquired
with the GAGG:Ce from Furukawa. The CRT values oscillated between 1502 ps and 572 ps.
The amount of Ga in the sample was also the main factor affecting these values. The higher
the amount of Ga the lower is the CRT. With the values of the CRT it was also possible to
show proportionality between the values of the effective decay time and the CRT. The higher
the effective decay time the higher the CRT. This trend showed that the decay time is one of
the main factors affecting the CRT. Another factor with great importance to the final value of
the CRT is the rise time of the samples. Due to the need of having special equipment, only
available at the TU Delft (University of Delft), to make these measurements, there are only a
few values available for the samples tested. Knowing this in advance, during the
implementation of this project a theory to predict the values of the CRT was also tested. The
formula used arises from a theoretical analysis of the CRT, based on the theory stated in [24].
The equation used to predict the CRT is the following: [25]
√
√
New Scintillators for Nuclear Medicine
46
Rui Azinheiro
In this prediction is the rise time, the effective decay time, measured from the
PMT, N is the number of photons taken from the TEK measurements and Q refers to the
trigger level. From Figure 36 it is possible to verify that our measurements are according to
theory.
Another conclusion that it possible to state from theory, and from our measurements,
is how trigger levels affects the CRT. The higher the trigger levels the higher the CRT. This is
easily explained by the number of photons necessary to have a valid signal. In Trigger 2
setting this number is higher, so on the overall is necessary to wait a longer time for a valid
signal. The trigger level also affects the number of counts, which is lower with Trigger 1. This
can also be explained by the number of photons needed to have a valid signal. Since in
Trigger 1 it is only necessary to have one photon, this will lead to an increase number of
triggers due to dark counts and consequently an increase of dead time of the detector and
consequently to a decrease in the time which it is making valid counts.
New Scintillators for Nuclear Medicine
47
Rui Azinheiro
7. CONCLUSIONS AND FUTURE WORK
During this internship I have taken over all the application relevant measurements in
an industrial research and development environment, performing measurements on more than
200 different samples using PMTs, and more than 50 in the arrays.
After all of these measurements it was possible to reach some conclusions regarding
the production of garnets for Time of Flight PET.
All results were analyzed considering the data from PMTs and signal height, CRT,
Counts and energy resolution were measured as a function of production parameters and exact
stoichiometry.
Results have shown the effect of the amount of Ga on decay time, CRT and LO. It was
also possible to verify the existence of trade-off between LO and CRT: the lower the CRT the
higher the LO. Regarding the effect of Ga, it was proven that the higher the amount of Ga, the
lower the values of CRT, but considering the trade-off referred before, it was concluded that
the ideal amount of Ga to be used should be somewhere in between 2.5 and 3. Further
experiments are needed to achieve the final composition.
In every PMT measurement we have seen a secondary decay time constant in garnet
samples. This secondary decay time is due to the afterglow present in every sample. The
existence of this afterglow was only shown under UV light, and the effect of X-ray is still
unknown. This is also another test that is necessary to make. This test assumes a greater
importance because the PET scanners are used along the CT scanners, making these detectors
highly exposed to X-rays.
The theory used to estimate the CRT values, based on exponential rise and decay was
proven with the CRT values of our samples. In order to apply this theory to every sample it
was still necessary to measure the rise time of every sample.
With this work it was also concluded that the use of the effective decay time, instead
of the regular decay time directly measured in the software is more accurate.
In the overall, considering the initial objective, we can assume that the main objective
of this project was achieved, with the production of ceramic garnets with a performance
suitable for TOF PET. Anyway the industrial production of them is still yet to be tested.
New Scintillators for Nuclear Medicine
48
Rui Azinheiro
8. REFERENCES
[1] M. E. PHELPS, PET: physics, Instrumentation, and Scanners, Vol. I. California, USA: Springer, 2006.
[2] J. Bronzino, The biomedical engineering handbook, Second edi. Florida: CRC Press, 1995.
[3] J. E. Turner and W. Road, Atoms , Radiation , and Radiation Protection. .
[4] F. Attix, Introduction to radiological physics and radiation dosimetry. Germany:
Wiley-VCH, 2004.
[5] F. R.B. and E. L.P., “Table of Radioactive Isotopes,” 2004. [Online]. Available:
http://ie.lbl.gov/toi/nuclide.asp?iZA=430399. [Accessed: 20-Aug-2013].
[6] M. Khalil, Basic sciences of nuclear medicine. London: Springer, 2011.
[7] M. N. Wernick and J. N. Aarsvold, Emission Tomography - The fundamentals of PET and SPECT, 1st ed. Elsevier academic press, 2004.
[8] M. Analoui, J. Bronzino, and D. Peterson, Medical Imaging: Principles and Practices. CRC Press, 2012.
[9] G. Muehllehner and J. S. Karp, “Positron emission tomography.,” Physics in medicine and biology, vol. 51, no. 13, pp. R117–37, Jul. 2006.
[10] M. Conti, “Focus on time-of-flight PET: the benefits of improved time resolution.,” European journal of nuclear medicine and molecular imaging, vol. 38, no. 6, pp.
1147–57, Jun. 2011.
[11] N. J. Cherepy, S. A. Payne, S. J. Asztalos, G. Hull, J. D. Kuntz, T. Niedermayr, and S.
Pimputkar, “Scintillators with Potential to Supersede Lanthanum Bromide,” pp. 873–880, 2010.
[12] J. Y. Yeom, S. Yamamoto, S. E. Derenzo, V. C. Spanoudaki, K. Kamada, T. Endo, and C. S. Levin, “First Performance Results of Ce:GAGG Scintillation Crystals With
Silicon Photomultipliers,” IEEE Transactions on Nuclear Science, vol. 60, no. 2, pp. 988–992, Apr. 2013.
[13] “Knoll Glenn F. Knoll. Radiation Detection and Measurement 3rd.pdf.” .
[14] M. Nikl, “Scintillation detectors for x-rays,” Measurement Science and Technology,
vol. 17, no. 4, pp. R37–R54, Apr. 2006.
[15] M. J. Weber, “Scintillation: mechanisms and new crystals,” Nuclear Instruments and
Methods in Physics Research Section A: Accelerators, Spectrometers, Detectors and Associated Equipment, vol. 527, no. 1–2, pp. 9–14, Jul. 2004.
New Scintillators for Nuclear Medicine
49
Rui Azinheiro
[16] M. J. Weber, “Inorganic scintillators: today and tomorrow,” Journal of Luminescence,
vol. 100, no. 1–4, pp. 35–45, Dec. 2002.
[17] R. Mao, C. Wu, L. Dai, and S. Lu, “Crystal growth and scintillation properties of LSO
and LYSO crystals,” Journal of Crystal Growth, vol. 368, pp. 97–100, Apr. 2013.
[18] C. Greskovich and S. Duclos, “Ceramic Scintillators,” Annual Review of Materials
Science, vol. 27, no. 1, pp. 69–88, Aug. 1997.
[19] P. Is and O. U. R. Business, Photomultiplier tubes Basics and Applications, Third edit.
Hamamatsu, 2006.
[20] T. Frach, G. Prescher, C. Degenhardt, R. De Gruyter, A. Schmitz, and R. Ballizany,
“The Digital Silicon Photomultiplier – Principle of Operation and Intrinsic Detector Performance,” pp. 1959–1965, 2009.
[21] C. Degenhardt, G. Prescher, T. Frach, A. Thon, and R. De Gruyter, “The Digital Silicon Photomultiplier – A Novel Sensor for the Detection of Scintillation Light,” pp.
2383–2386, 2009.
[22] R. Schulze, PDPC-TEK User Manual, Version 0. Aachen, Germany: Koninklijke
Philips Electronics 2012, 2012.
[23] C. Dege, “The digital Silicon Photomultiplier ,” pp. 2383–2386, Oct. 2009.
[24] Y. Shao, “A new timing model for calculating the intrinsic timing resolution of a scintillator detector.,” Physics in medicine and biology, vol. 52, no. 4, pp. 1103–17,
Mar. 2007.
[25] H. Wieczorek, “Private entry,” 2013.
[26] Philips, “Philips SPECT scanners,” 2009. [Online]. Available: http://www.newscenter.philips.com/nl_nl/standard/about/news/press/20091127_rsna_2
009_philips_persbericht.wpd.
[27] A. D. da Silva, “Philips BrightView XCT with Astonish,” 2012. [Online]. Available:
http://clinical.netforum.healthcare.philips.com/global/Explore/White-Papers/SpectCT/A-comprehensive-solution-for-extremity-imaging.
[28] DESY, “PET R&D IN HAMBURG: INTRODUCTION TO PET.” [Online]. Available: http://www-flc.desy.de/pet/intro.php.
[29] D. J. Kadrmas, M. E. Casey, M. Conti, B. W. Jakoby, C. Lois, and D. W. Townsend, “Impact of time-of-flight on PET tumor detection.,” Journal of nuclear medicine :
official publication, Society of Nuclear Medicine, vol. 50, no. 8, pp. 1315–23, Aug. 2009.
[30] H. B. L. M. Freeman, E. Clinical, and N. Medicine, Clinical Nuclear Medicine. Sprnger, 2007.

New Scintillators for Nuclear Medicine
50
Rui Azinheiro
[31] Jobwerx manufacturing network, “Philips Medical Systems nuclear medicine
advancements.” [Online]. Available: http://www.jobwerx.com/images/phg_948207_Gemini_lr.jpg.
[32] A. E. Perkins, “Astonish TF,” Philips Healthcare.
[33] D. Suson, “NaI Crystal,” 2004. [Online]. Available:
http://physics.tamuk.edu/~suson/html/3110/. [Accessed: 15-Aug-2013].


![Università degli Studi di Padovapaduaresearch.cab.unipd.it/10704/1/Chengying_Bai_Thesis.pdf1 1. Overview of porous geopolymers 1.1. Introduction In the 1970s, Davidovits [1-2] initially](https://img.pdfslide.net/doc/110x75/5fa3ae8c0bb5a60e4604183f/universit-degli-studi-di-1-1-overview-of-porous-geopolymers-11-introduction.jpg)