Embed Size (px)
Citation preview

1
New Shopping Centres and Retail Supply Quality:
A GIS based Micro-Analytical Model
Carsten Schürmann
Research Assistant
Institute of Spatial Planning, University of Dortmund
D-44221 Dortmund, Germany
Abstract
Retail supply planning processes usually look at demand sides from
purchasing power perspectives, but the fact that from a customer's
perspective retail supply quality is a value as such is often neglected.
On the one hand this might be intentionally, on the other hand this
might be due to methodological deficits on how to measure retail
supply quality. The model presented in this paper shifts the perspec-
tive to pay more attention to the customer's side and, moreover, of-
fers a quantitative way in calculating supply quality on a spatially
disaggregated level.
Introduction
During the last few years great structural changes with respect to size
and quality of retailing facilities took place in Europe. Similar to
American examples, new shopping centres had been constructed at
the urban periphery with thousands of square metres of floorspace. In
many cases, only economic risks for the companies and – to some
extent - effects on the labour market are calculated, but only excep-
tionally the improvements or deterioration of the retail supply quality
from a customer’s perspective are considered.
Such a customer’s perspective should be also the municipalities'
perspective by planning or approving new shopping centres. Until
now, there have been great uncertainties by the authorising authori-
ties about the impacts of new retailing facilities, mainly because of a

2
lack of easy-to-use quantitative methods for the evaluation of im-
pacts of new shopping centres.
This paper is a contribution to overcome these methodological defi-
cits. The approach presented here is based on a retail supply quality
gravitation model developed by Bökemann (1982), which models
quality of retail supply as a function of distance and floorspace of
shops.
The approach developed is applied to Hombruch, which is a suburb
in the south west of Dortmund with about 58,000 inhabitants and an
area of some 35 km2. On a formerly industrial location area a private
developer plans a new shopping mall with about 8,000 m2 floor-
space. Comparing this area with the current available floorspace area
of about 54,000 m2 for the entire district, the project increases the
total floorspace area of about 115 percent.
The impacts of the new shopping centre are simulated by calculating
the retail quality prior and after its realisation. Because one has to
assume under market conditions that after opening a new centre
some closures of existing smaller shops will occur, a retail turnover
expectation model according to Lakshmanan and Hansen (1965) has
been applied to define future supply, i.e. to identify those shops
which will probably have to close down.
The combination of the both models leads to the following proce-
dure:
1. Calculation of current supply quality.
2. Calculation of current sales of existing shops.
3. Calculation of future sales including existing and new shops, if
necessary by using different scenarios.
4. Estimation of development of sales by comparing results of
steps 2 and 3 to predict closures of shops.
5. Calculation of future retail supply quality.
6. Estimation of differences in supply quality by comparing results
of steps 1 and 5 to obtain information on benefits or deteriora-
tions.

3
Methodology
According to Bökemann (1982), the retail supply quality is defined
as the sum over all shopping centres' specific attractiveness which
affect the residence areas. Shopping centres' specific attractiveness
itself means the attractiveness of one single shop for one residential
building.
The attractiveness depends on the distance between the shop and the
residential building and on the shop’s floorspace. It is assumed, that
(i) the larger the floorspace the higher the attractiveness, because of a
increased variety of goods in larger shops, and (ii) that the greater the
distance the lower the attractiveness, because it is more
time-consuming to reach the shop.
In mathematical terms, the attractiveness Aij of shop j on residence i
is defined as
(1)
where Fj is the floorspace of the shop, represents an empirically
derived floorspace weighting factor which takes account of the fact
that there is no linear relationship between the floorspace and the
benefits for the customers. This means, comparing two shops with
500 and 1,000 m2, respectively, that the benefits of the greater one
are not twice but for instance 2.2 times higher. In this study it is as-
sumed that the value of is 1.2. f(dij) represents the distance decay
function and Cj is the concentration index. This index reflects the fact
that one single shop offers greater attractiveness to the customer if it
is surrounded by other shops than if it is remotely located. Equation
2 then gives the concentration index:
(2)
with
ijjjij
dfCFA
j kjkk
k
dfF
dfFC
jkk
j
)(
jkCj
,10
4
The concentration index is calculated as the sum of all floorspaces of
all shops k weighted by the distance from shop j over all other shops
k, divided by all distances weighted by the floorspace between all
shops (Schürmann 1996; 1999).
The retail supply quality Vi of residence i is then calculated as the
sum of all attractivenesses over all shops j:
(3)
The distances could be based either on airline distances (with or
without detour factor) or real network distances. If airline distances
are used, mode specific delay factors should be applied to differenti-
ate between pedestrians, cyclists, public transport users and car driv-
ers (a detailed description of the mode specific delay factors gives
Schürmann, 1996).
In this study airline distances including detour factors with mode
specific delay factors based on a transport survey (EMNID 1991) are
applied. The overall retail supply quality is defined as the logsum
over all these modes.
The equations described above are used to model the current and
future retail supply quality (see step 1 and 5 of the procedure). To
calculate current and future sales of the shops, a retail turnover ex-
pectation model according to Lakshmanan and Hansen is developed.
The mathematical form of this model is expressed as follows:
(4)
where Sj represents the sales of shop j, Pij represents the share of the
income which shop j gains from residence i, Ki represent the absolute
purchasing power per capita in i and finally Ii gives the number of
dwellers in residential building i. In this model, Pij is estimated by the
attractiveness A of shop j for building i divided by the sum over all
attractivenesses.
j
iji AV
i
iijj iIKPS

5
(5)
The Dortmund-specific purchasing power is based on surveys by
GfK (1996) with some slight modifications (Kruse 1996). A value of
about 9,700 DM per capita per year is assumed.
Implementation
This model is implemented by using a GIS based micro-analytical
model. Unlike other approaches, which consider entire districts or
blocks as the smallest spatial unit both on the supply side (retailing
facilities) and on the demand side (residential areas) (Bökemann
1983, Kagermeier 1991), this approach incorporates a spatially dis-
aggregate database in which every residential building serves as an
origin and every single shop serves as a destination in the distance
function.
Both the residential buildings and the shops are given with their lo-
cation (x-/y-coordinates) in the GIS database. Additionally, informa-
tion on floorspace and on branch are assigned to the shops, while the
number of dwellers is assigned to the residences. As stated above,
airline distances are used. No network information are employed at
the moment. Beyond that, for the retail turnover expectation model
only information on the purchasing power per capita are required
additionally.
The database necessary to run the retail supply quality model in its
simplest form is rather small. All data is available from the munici-
pality’s statistical offices and needs not to be gathered elsewhere.
Table 1 summarises the data requirements (including potential re-
finement data in italics).
j
ij
ij
ijA
AP

6
Table 1. GIS database.
Data fields Information
Supply side Location (x-/y-coordinates)
Floorspace
Branch
Branch-specific floorspace productivities
Residential buildings Location (x-/y-coordinates)
Number of dwellings
Population Number of dwellers per building
Purchasing power index
Socio-demographic indices (age, sex, etc.)
Car-ownership
Transport networks Mode specific delay factors
Road network
Public transport network
Case Study of Dortmund
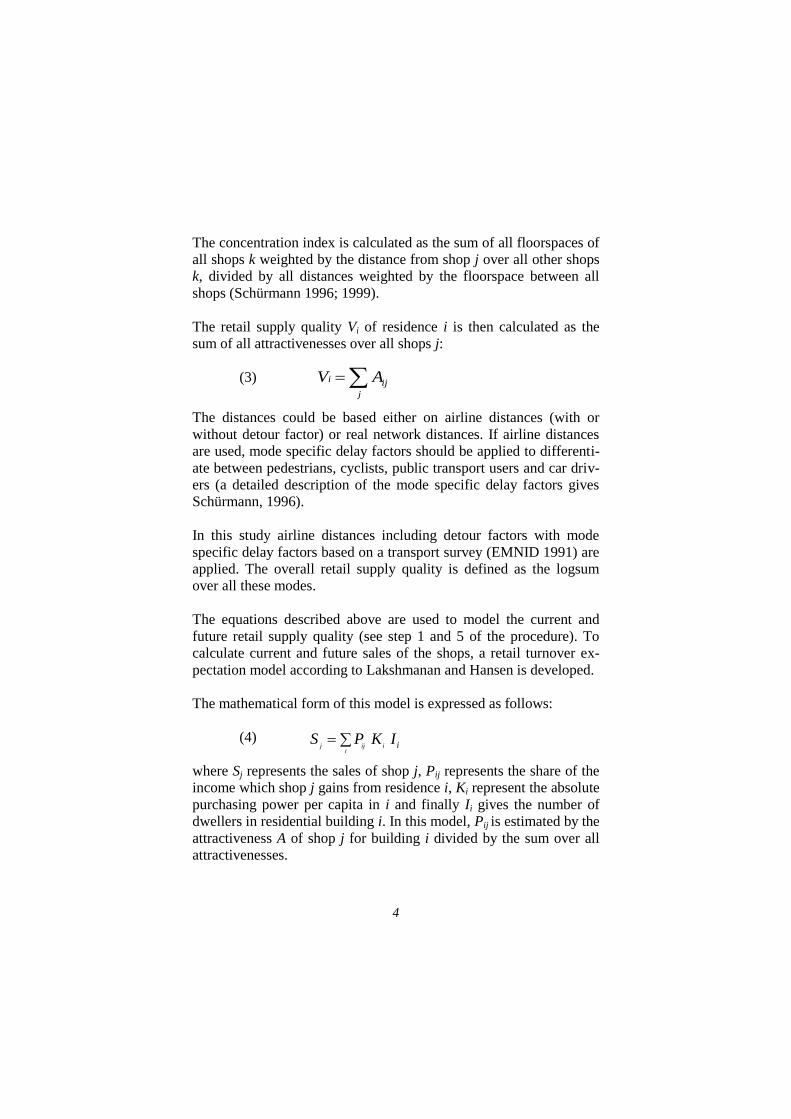
Figures 1 and 2 illustrate the GIS database. Each dot in Figure 1
represents one residential building. Figure 2 displays the distribution
of retail facilities within Hombruch. Most of the shops are located in
the district's centre along the pedestrian mall. Additionally, two more
significant locations are visible. First, in the north-west; second in
the eastern part along an important north-south orientated arterial
road.
7
Figure 1. Residential buildings in Dortmund-Hombruch.
Figure 3 shows the standardised retail supply quality over all modes
prior to the opening of the new shopping centre as an example of the
outcomes of the model application. It can be seen that residential
buildings in the centre of the district show the highest values with
more than 175 percent of the average. In general, the more you turn
to the periphery, the lower are the values the buildings obtain.

8
Figure 2. Retail facilities in Dortmund-Hombruch.

9
Figure 3. Current retail supply quality over all modes.
Because Figure 3 illustrates the results for dwellings only, but be-
yond the consideration of buildings the affected people are of inter-
est, Table 2 summarises the outcomes for all transport modes on a
more aggregate level. It is obvious, that the greatest differences in
the distribution over all classes occur for pedestrians. Although
31,270 people, i.e. 57 percent of all inhabitants, experience a retail
supply quality below the average, the class with more than 175 times
average shows the greatest scorings with 13,475 people (23 percent).
Summarising, there are great disparities in retail supply quality for

10
pedestrians. Considering the other modes, these disparities decrease
the faster the mode is. For cyclists, the overall structure looks quite
similar to the pedestrians' structure, but with slightly higher scorings
in medium classes. For public transport, the lowest and the highest
classes are not scored at all. Similarly, for cars the two lowest classes
are empty.
Table 2. Inhabitants per class prior to opening of the new centre.
Classes
Transport modes All modes
Walking Cycling Publ. transp. Cars (logsum)
abs. % abs. % abs. % abs. % abs. %
< 25 9,713 16.6 3,803 6.5 0 0.0 0 0.0 0 0.0
25 < 50 12,756 21.8 10,243 17.5 376 0.6 0 0.0 952 1.6
50 < 75 5,851 10.0 9,287 15.9 7,964 13.6 8,343 14.3 12,617 21.6 75 < 100 2,950 5.0 5,289 9.1 14,554 24.9 17,210 29.5 13,017 22.3
100 < 125 7,569 13.0 6,042 10.3 31,797 54.4 24,117 41.3 14,643 25.1
125 < 150 4,412 7.5 7,549 12.9 3,706 6.3 8,727 14.9 12,224 20.9 150 < 175 1,671 2.9 3,927 6.7 0 0.0 0 0.0 4,944 8.5
175 < 13,475 23.1 12,257 21.0 0 0.0 0 0.0 0 0.0
58,397 100 58,397 100 58,397 100 58,397 100 58,397 100
Mean 109.55 210.21 465.74 419.91 321.44
Parallel to decreasing disparities, the average increases from about
109 for pedestrians to about 420 for cars. Considering the totals, i.e.
the logsum, the highest scorings are obtained by medium classes.
The analysis of the development of sales has been performed by
applying four scenarios. The base assumption for all the scenarios is,
that the new shopping centre will operate profitably because of its
specific, up-to-date production factors. The other assumptions behind
the scenarios are as follows: - Scenario 1: Constant overall sales with increasing number of
shops.
- Scenario 2: Constant overall sales with increasing number of
shops with increasing purchasing power binding shares.

11
- Scenario 3: Growing overall sales (caused by new inhabitants)
with increasing number of shops.
- Scenario 4: Growing overall sales (caused by new inhabitants)
with increasing number of shops with increasing purchasing
power binding shares. The common results of all scenarios is, that for about 30 shops de-
creasing sales of more than 25 percent can be predicted. It is as-
sumed, that these shops will close down sooner or later. Figure 4
shows future retail supply quality after running the model once more.
Figure 4: Future retail supply quality over all modes.

12
As a first result, the overall average retail supply quality increased
after opening of the new shopping centre (Table 3). The observation
of decreasing disparities due to faster mode speeds is also true.
However, in detail the number of pedestrians with a retail quality
below the average stays almost the same, the number of public
transport users below the average increased just as the total number
of inhabitants with a quality below the average level. This means, the
shopping centre has no real equalising impacts, which might be a
political goal under aspects of justice.
Table3. Inhabitants per class after opening of the new centre.
Classes
Transport modes All modes
Walking Cycling Publ. transp. Cars (logsum)
abs. % abs. % abs. % abs. % abs. %
< 25 8,729 14.9 4,232 7.2 0 0.0 0 0.0 0 0.0
25 < 50 14,352 24.6 10,184 17.4 697 1.2 0 0.0 1,087 1.9
50 < 75 5,512 9.4 9,287 15.9 5,089 8.7 6,053 10.4 12,637 21.6 75 < 100 2,574 4.4 5,397 9.2 15,672 26.8 19,646 33.6 14,282 24.5
100 < 125 5,885 10.1 2,932 5.0 34,746 59.5 21,859 37.4 12,005 20.6
125 < 150 4,735 8.1 9,664 16.5 2,193 3.8 10,839 18.6 11,048 18.9 150 < 175 2,242 3.8 5,331 9.1 0 0.0 0 0.0 7,338 12.6
175 < 14,368 24.6 11,370 19.5 0 0.0 0 0.0 0 0.0
58,397 100 58,397 100 58,397 100 58,397 100 58,397 100
Mean 134.90 259.96 579.99 522.52 362.70
What does this general conclusion mean for the spatial distribution?
Which residential areas benefit and which deteriorate? Figure 5 illus-
trates the changes for the residential sides in absolute values for
walking.
As suggested, only very few buildings deteriorate, mainly in the
south-east of the district. This is not very surprisingly as the overall
average increased. For comparisons, if relative changes (all modes)
are taken into consideration (Figure 6), it becomes clear, that the
whole eastern part of Hombruch deteriorates, while the western part
gains profits, although there are some closures of smaller shops.

13
Figure 5. Absolute differences of retail supply quality for walking.
As Table 3 shows, the general level (average) of the supply quality is
increasing for all modes. This observation in combination with
higher scorings in classes above the average suggests general im-
provements of supply quality. Taken Figure 5 into account, this ob-
servation must be qualified in the sense, that indeed there are resi-
dential areas, i.e. numbers of inhabitants, which experience absolute
losses in retail supply quality for walking or cycling. Moreover, rela-
tive losses in supply quality for all modes (Figure 6) can be observed
for almost half the district.

14
Figure 6. Relative changes in retail supply quality over all modes.
Conclusions
The theoretical base for estimating retail supply quality presented in
this paper is well established (Bökemann, 1982), but until now for
various reasons the model has not been implemented on a spatially
disaggregate level. However, now the distribution of GIS technology
over the municipalities and GIS techniques themselves reached a
level where methodological procedures are indispensable - also in

15
the field of retail quality. The progress in GIS techniques allows the
development of disaggregate, easy-to-use applications to estimate the
impacts of new shopping centres on a house-by-house basis, which
can be applied by the municipalities themselves. This leads to greater
independence of municipalities from developer companies in the
question of how to appraise the impacts of new retail facilities.
In the past, retail trade concepts considered customers or residential
areas only from the perspective of purchasing power, and neglected
the fact that from a customer's view retail supply quality is a values
as such. This method shows a way to combine both perspectives. It
allows the identification of residential areas with a low level of retail
supply quality, makes plain the spatial pattern of purchasing power
as well as the purchasing power flows and finally give hints on loca-
tion, size and branch of new retailing facilities.
The advantage of this method is that the retail supply quality for
every residential building, i.e. for every inhabitant, can be modelled
separately, i.e. that the consequences of market changes can be esti-
mated on an individual base. Moreover, this advantage has even
more importance if this model is integrated into disaggregated mi-
cro-simulation models, for instance in simulating shopping trips in a
wider context of daily trip modelling.
Briefly, the advantages of this new analytical model are:
- Disaggregation: Applying a micro-analytical model on a
house-by-house basis.
- Database: Only a modest database is required. However, the
method is open for further refinements. The required database is
usually maintained by the municipalities themselves.
- Application: The model is applicable either for all shops over all
branches (as it is presented here) or for shops of one specific
branch only.
- Retail quality: It is easy to identify those residential buildings,
which have retail qualities below a pre-defined, minimum level.
- Service quality: It is also possible to use this approach to esti-
mate service supply qualities as well.

16
- Implementation: The model can either be implemented on each
commercial GIS software or with self-written programs. Im-
plementation in commercial GIS software is rather in line with
the municipality's abilities, whereas self-written programs could
have importance from a scientific perspective.
- GIS: The model is characterised by an open structure, which
requires only modest demands on the GIS with respect to calcu-
lating distances and shortest-path-algorithms.
- Scenarios: The model answers 'What, if ...' questions by running
possible future scenarios. This easily enables comparisons be-
tween different alternatives of retail development.
Refinements
Possible future refinements to the micro-analytical model as pre-
sented here concern aspects of retail probabilities, distance decay
functions, branch-specific weightings of the floorspace, differentiat-
ing between socio-economic groups and the enlargement to a real
micro-simulation model.
1. Retail probabilities:
Turning around the approach, the probability from residential
building i to buy in shop j can easily be calculated. In a simple
way, this probability is defined as attractiveness A of shop j to
building i divided by the sum over all attractiveness’ over all
shops.
(6)
j
ijA
AP ij
ij
This probability can then be used to model the catchment area
of one shop on a house-by-house basis. If all residences with a
retail probability of greater than zero are taken into considera-
tion, and all these probabilities multiplied with the number of
dwellers of each building are summed up, the maximum possi-
ble catchment area D of shop j is estimated.

17
(7) i
iIPDijj
Figure 7 shows one example of a probability distribution from
one shop for pedestrians.
Figure 7. Purchasing probability for a sample shop.
2. Distance decay function
The distance calculation should be based on real road and public
transport networks to obtain a more realistic view of the retail
supply quality.

18
3. Branch-specific floorspace weighting
As presented here, the floorspace is not branch-specific
weighted, although it is obvious that the meaning of the same
floorspace area for food-shops is totally different from the one
for furniture shops. This enhancement can be implemented by
adding a new factor into Equation 1 when estimating the attrac-
tiveness of a shop. This factor b should reflect the
branch-specific floorspace weightings, so that Equation 1 is
supplemented as follows:
(8)
This supplementation requires further information of
branch-specific floorspace productivities. 4. Socio-economic groups
Differentiating between socio-economic groups is another en-
hancement to get a more realistic picture. That requires infor-
mation on age, sex and marital status (Table 1) for each residen-
tial building, which are, however, available from the official
municipalities statistics. This means, not only the impacts on all
inhabitants as a whole are calculated (as presented here in Ta-
bles 2 and 3), but the impacts on each socio-economic group
separately. In particular this is recommended for the estimation
of the catchment areas of shops (Equation 6), which strongly
depend on the socio-economic structure of a district. 5. Environmental impacts
Only small enhancements are required to estimate environ-
mental impacts of new shopping centres. As one outcome the
model determines the retailing probabilities from a residential
building to a certain shops. This means the traffic flows between
residential buildings and shops can be calculated and above this,
using assumption on vehicle types, fuel consumption and car
emissions, environmental impacts on people (noise, air pollu-
tion) can then be estimated.
ijjbij
dfCFA j

19
6. Micro-simulation model
The model as presented here can be seen as a micro-analytical
model. However, this analytical model is the basis for develop-
ing a real micro-simulation model, because some behavioristical
assumptions are included as well (e.g. purchasing probabilities).
On the one hand, these refinements partly enlarge the GIS database
(see italics in Table 1), on the other hand they lead to more reason-
able, realistic and detailed information about the retail supply qual-
ity. In any case, in spite of these enhancements, all the data necessary
are available at the official statistics of the municipalities, and so the
model is still easy to apply.
References
Bökemann, D, 1982, ”Theorie der Raumplanung”, Wien: Olden-
bourg.
Bökemann, D, 1983: "Zentralitätsgefüge und Versorgungsqualität."
Grundlagen zu einem Zentrenkonzept im Auftrag der Magistratsab-
teilung 18 – Stadtstrukturplanung. Beiträge zur Stadtforschung,
Stadtentwicklung und Stadtgestaltung, Band 12. Magistrat der Stadt
Wien, Geschäftsgruppe Stadtentwicklung und Stadterneuerung,
Wien.
EMNID, 1991, ”KONTIV 1989. Tabellenteil”, Bielefeld.
GfK, 1996, Written information from 29.97.1996, Nürnberg.
Kagermeier, A., 1991: "Versorgungsorientierung und Einkaufsat-
traktivität. Eine empirische Untersuchung zum Konsumentenverhal-
ten im Umland von Passau." Passauer Schriften zur Geographie, Heft
8. Passau.
Kruse, 1996: Expert interview from 27.2.1996. Junkers & Kruse
Consultings, Stadtforschung & Stadtplanung, Dortmund.

20
Lakshmanan; Hansen, 1965, ”A retail market potential model”, in:
Journal of the American Institute of Planers.
Schürmann, C., 1996, ”Die Versorgungsqualität des Einzelhandels in
Dortmund-Hombruch”, diploma thesis, Dortmund: Fakultät Raum-
planung Universität Dortmund.
Schürmann, C., 1999, "Schöne heile Einkaufswelt. Mehr Schein als
Sein? Eine Methode zur Abschätzung der wohnstandörtlichen Ver-
sorgungsqualität." IRPUD Arbeitspapier 167. Dortmund.


![PHY-GITAL RETAIL WILL€¦ · DEVELOPING RETAIL SPACES IN INDIA #68 July 2019 [VOL. 12 NO. 5 `100] PHY-GITAL RETAIL WILL DEFINE SHOPPING CENTRES OF THE …](https://img.pdfslide.net/doc/110x75/60209b7a0742966163610958/phy-gital-retail-will-developing-retail-spaces-in-india-68-july-2019-vol-12-no.jpg)