Embed Size (px)
Citation preview
New South Wales
Population Health Survey
2006 Report on
adult health
WARNIN
G: Esti
mates o
ut of
date.
Please
chec
k Hea
lthStat
s NSW
for la
test e
stimate
s.
CENTRE FOR EPIDEMIOLOGY AND RESEARCH
NSW Department of Health
Locked Mail Bag 961
North Sydney NSW 2059
Telephone: 61 2 9424 5759
Copyright © NSW Department of Health 2007
This work is copyright. It may be reproduced in whole or in part
for study and training purposes subject to the inclusion of an acknowledgement
of the source. It may not be reproduced for commercial usage or sale.
Reproduction for purposes other than those indicated above requires
written permission from the NSW Department of Health.
State Health Publication No: HSP 070084
ISBN 978 1 74187 094 7
suggested citation:
Centre for Epidemiology and Research. 2006 Report on Adult Health from the New South WalesPopulation Health Survey. Sydney: NSW Department of Health, 2007.
further copies of this publication can be downloaded from the
New South Wales Health Survey Program website : www.health.nsw.gov.au/public-health/survey/hsurvey.html
WARNIN
G: Esti
mates o
ut of
date.
Please
chec
k Hea
lthStat
s NSW
for la
test e
stimate
s.
Contents
Foreword 5
Acknowledgements 6
Executive Summary 7
Snapshot 11
Methods 12
Outcomes of telephone calls 15Completed interviews and response rates by area health service 15Completed interviews by language 15
Representativeness of sample 16
Survey sample size and NSW population group and sex 16Socioeconomic Index (SEIFA) quintile 18Accessibility-Remoteness Index of Australia Plus (ARIA+) 19Survey conducted in languages other than English 20Aboriginal or Torres Strait Islander origin 21Country of birth 22Languages other than English spoken at home 23Current employment status 24Main job held last week 25Currently receive a pension or benefit, persons aged 65 and over 26Highest level of school completed 27Household structure 28Formal marital status 29Household income 30Number of children aged 0-5 years in the household 31Number of children under 16 years of age in the household 32Number of people aged 65 years and over in the household 33
Health behaviours 34
Alcohol 34
Alcohol drinking by risk 36Risk alcohol drinking 37High risk alcohol drinking 40
Cancer screening: breast and cervical 43
Screening mammogram within the last 2 years, females aged 50 to 69 years 45Pap test within the last 2 years, females aged 20 to 69 years 48Hysterectomy, females aged 20 to 69 years 51
Environmental health 54
Usual source of drinking water 56Type of water treatment 57Use public water as usual source of water 58Usual way of heating living areas of home 61Exposure to unflued heating 62
Food handling 65
Hand washing with soap when preparing raw meat 66
Immunisation 69
Vaccinated against influenza in the last 12 months, persons aged 50 years and over 71Vaccinated against influenza in the last 12 months, persons aged 65 years and over 74Last pneumococcal disease vaccination, persons aged 50 years and over 77Vaccinated against pneumococcal disease in the last 5 years, persons aged 50 years and over 78Vaccinated against pneumococcal disease in the last 5 years, persons aged 65 years and over 81Vaccinated against meningococcal C disease in the last year, persons aged 16 to 19 years 84Place where vaccinated against meningococcal C disease, persons who were vaccinated against meningococcal C disease aged 16 to 19 years
87
Injury prevention 88
Smoke alarm or detector in the home 91
1
WARNIN
G: Esti
mates o
ut of
date.
Please
chec
k Hea
lthStat
s NSW
for la
test e
stimate
s.
Homes with a smoke alarm or detector 92Last tested battery operated smoke alarm 95Last tested hard wired operated smoke alarm 96Fire in home which activated smoke alarm 97Home escape plan and recent practice of plan 100Swimming, fishing, rock fishing, snorkelling or scuba diving in last 4 weeks 101Swimming ability 104Very good or good swimming ability 105
Nutrition 108
Number of serves of fruit per day 113Recommended fruit consumption 114Knowledge of recommended fruit serves 117Consistency between knowledge and practice of consuming the recommended daily fruit intake 120Number of serves of vegetables per day 121Recommended vegetable consumption 122Three serves or more of vegetables a day 125Knowledge of recommended vegetable serves 128Consistency of knowledge and practice in the consumption of the recommended daily vegetable intake 131Type of milk usually consumed 132Usual use of lower fat milks 133Frequency of eating hot fried potato products per week 136Frequency of eating potato crisps or salty snacks per week 137Frequency of eating breakfast cereal, breads, pasta, rice and noodles per day 138Frequency of eating processed meat products per week 139Cups of soft drinks or cordials or sports drinks per week 140Frequency of eating takeaway food per week 141Food insecurity in the last 12 months 142
Physical activity 145
Adequate physical activity 148Usual transport to work 151Neighbourhood facilities 152Frequence of use of parks or reserves 153Frequence of use of sporting fields 154Frequence of use of swimming pools 155Frequence of use of footpaths 156Frequence of use of bikepaths 157Weekly use of any neighbourhood facilities 158
Smoking 161
Smoking status 166Current smoking 167Daily smoking 170Doctor advised to quit smoking 173Exposure to tobacco smoke in household 176Smoke-free households 177Smoke-free cars 180Impact of total smoking ban on attendance in bars and hotels 183More likely to attend hotels and licensed bars if smoking banned in hotels and licensed bars 184Less likely to attend hotels and licensed bars if smoking banned 187Impact of smoking ban in outdoor dining areas 190More likely to frequent outdoor dining areas if smoking banned from these areas 191Less likely to frequent outdoor dining areas if smoking banned from these areas 194
Health status 197
Asthma 197
Ever diagnosed with asthma 200Current asthma 203Asthma medications used in the last 12 months 206Asthma reliever used in the last 12 months 207Asthma preventer used in the last 12 months 210Written asthma management plan 213Level of interference with daily activities in the last 4 weeks 216Moderate to extreme interference with daily activities 217Current smoking 220
Diabetes or high blood glucose 223
Diabetes or high blood glucose 225Action taken to manage diabetes or high blood glucose 228
2
WARNIN
G: Esti
mates o
ut of
date.
Please
chec
k Hea
lthStat
s NSW
for la
test e
stimate
s.
Incontinence 229
Incontinence status in the last 4 weeks, persons aged 40 years and over 230Incontinence in the last 4 weeks, persons aged 40 years and over 231
Injury 234
Falls in the last 12 months, persons aged 65 years and over 236Number of falls in the last 12 months, persons aged 65 years and over 239Falls requiring medical treatment, persons who had a fall in the last 12 months aged 65 years and over 240Falls requiring hospitalisation, persons who had a fall in the last 12 months aged 65 years and over 243Any action taken to prevent falls, persons aged 65 years and over 246Type of action taken to prevent falls, persons who have made changes to their home or lifestyle aged 65 years and over
249
Fear of falling, persons aged 65 years and over 250
Mental health 253
Psychological distress by Kessler 10 categories 255High and very high psychological distress 256Times that physical problems have been the cause of psychological distress in last 4 weeks 259Effect of psychological stress on daily activities 259Attended a community event at least once in the last 6 months 260Helped out any local group or organisation at least once in the last 3 months 263Active member of a local organisation, church or club 266
Oral health 269
Time since last dental visit 272Visited a dental professional in the last 12 months 273Reason for not visiting a dental professional in the last 12 months 276All natural teeth missing 277Fluoride added to public water supply 280Agree with adding fluoride to water supply 281Places received information on water fluoridation 284Responsible body for decisions on fluoridation of water supply 285
Overweight and obesity 286
Body Mass Index categories 288Overweight and obesity 289Obesity 292
Self-rated health status 295
Self-rated health status 297Excellent, very good, or good self-rated health status 298Chronic disease risk factors 301Three or more chronic disease risk factors 302
Health services 305
Health service use and access 305
Health services attended in last 12 months 308Private health insurance 309Purchase medication using a concession card 312Avoided seeing doctor due to cost of medicine 315Limited use of prescription drugs because of cost 318Difficulties getting health care when needing it 321Types of difficulties getting health care when needing it 324
Emergency department presentations 325
Emergency department presentation in the previous 12 months 327Emergency department care ratings 330Emergency department care rated as excellent, very good or good 331Reason for rating most recent emergency visit as fair or poor 334
Hospital admissions 335
Hospital admission in the previous 12 months 336Hospital care ratings 339Hospital care rated as excellent, very good or good 340Reason for rating most recent overnight hospital stay as fair or poor 343
Community health centres 344
Community health centre attendance in the previous 12 months 345Community health centre care ratings 348Community health centre care rated as excellent, very good, or good 349
3
WARNIN
G: Esti
mates o
ut of
date.
Please
chec
k Hea
lthStat
s NSW
for la
test e
stimate
s.
Reason for rating most recent community health centre visit as fair or poor 352
Public dental services 353
Public dental service attendance in the previous 12 months 354Public dental service care rating 357Public dental service care rated as excellent, very good, or good 358Reason for rating most recent public dental service visit as fair or poor 361
Social capital 362
Attended a community event at least once in the last 6 months 365Helped out any local group or organisation at least once in the last 3 months 368Active member of a local organisation, church or club 371Most people can be trusted 374Feel safe walking down their street after dark 377Area has a reputation for being a safe place 380Visit neighbours 383Run into friends and acquaintances when shopping in local area 386Sad to leave neighbourhood 389
Conclusion 392
Health behaviours 394Health status 398Health services 401Social capital 403
Question modules 404
4
WARNIN
G: Esti
mates o
ut of
date.
Please
chec
k Hea
lthStat
s NSW
for la
test e
stimate
s.
Foreword
I am pleased to present the 2006 Report on Adult Health from the New South Wales Population HealthSurvey, which provides information on health behaviours, health status, access to health services, andsocial capital, for adults aged 16 years and over.
In 2006, data for the New South Wales Population Health Survey were collected from February to December.
After describing the survey methods, this report presents information on health behaviours including:alcohol, cancer screening (breast and cervical), environmental health (water quality and homeheating), food handling, immunisation (influenza, pneumococcal, and meningococcal), injuryprevention (fire safety in the home and swimming ability), nutrition, physical activity, and smoking. Thisis followed by a chapter on health status including: asthma, diabetes or high blood glucose,incontinence, mental health (psychological distress), injury (falls), oral health, overweight and obesity,and self-rated health. Next there is a chapter on health services including: health service use andaccess, emergency department presentations, hospital admissions, community health centres, andpublic dental services. Finally, there is a chapter on social capital.
In the PDF version of the report, indicators are presented for males and females by age,socioeconomic disadvantage and geographic location. Further information is presented in the HTMLversion. In the PDF version, indicators are compared to previous years wherever possible in theconcluding tables. In the HTML version these trends are reported as separate graphs within eachindicator. Both the PDF and HTML versions can be obtained from the New South Wales PopulationHealth Survey website at www.health.nsw.gov.au/public-health/survey/hsurvey.html.
This is a descriptive report and there is a wealth of other information in the survey dataset that may beof specific interest. For these reasons we encourage as many people as possible to analyse the datafurther. For further analysis within a health area, data can be accessed through the Health OutcomesInformation Statistical Toolkit (HOIST). For further analysis among health areas or at a statewide level,a data request needs to be lodged with the NSW Department of Health.
Comments on the New South Wales Population Health Survey are welcome.
I thank all the individuals and organisations who contributed their time and expertise to assist in thedevelopment and conduct of the Survey in 2006.
Denise RobinsonChief Health Officer and Deputy Director-General, Population HealthAugust 2007
5
WARNIN
G: Esti
mates o
ut of
date.
Please
chec
k Hea
lthStat
s NSW
for la
test e
stimate
s.
Acknowledgements
Questionnaire development and coordinationDeborah Baker, Margo Eyeson-Annan, and Lindy Fritsche.
Survey development and data collectionDeborah Baker, Don Bryson-Taylor, Margo Eyeson-Annan, Lindy Fritsche, Matthew Gorringe, JulieHolbrook, Jason van Ritten, and the NSW Health Survey Program Interviewers.
Report development and coordinationMargo Eyeson-Annan and Michael Giffin.
Biostatistical adviceKim Lim and Baohui Yang.
Data analysisMargo Eyeson-Annan, Ray Ferguson, Mazen Kassis, Scott Linton, and Baohui Yang.
Analysis and reporting infrastructureTim Churches, Ray Ferguson, Jill Kaldor, Scott Linton, Kevin Manefield, Peter Williams, Alan Willmore,and Baohui Yang.
Text contributorsMargo Eyeson-Annan and Michael Giffin.
EditorsMargo Eyeson-Annan and Michael Giffin.
6
WARNIN
G: Esti
mates o
ut of
date.
Please
chec
k Hea
lthStat
s NSW
for la
test e
stimate
s.
Executive Summary
IntroductionIn 2006, the NSW Department of Health, in conjunction with the 8 area health services, completed thefifth year of the New South Wales Population Health Survey, an ongoing survey of the health of peopleof New South Wales using computer assisted telephone interviewing (CATI). The main aims of thesurvey are: to provide detailed information on the health of the people of New South Wales; and tosupport the planning, implementation, and evaluation of health services and programs in New South Wales.
Prior to the introduction of the continuous survey in 2002, the Centre for Epidemiology and Researchconducted adult health surveys in 1997 and 1998, an older people’s health survey in 1999, and a childhealth survey in 2001. The reporting plan for the continuous survey includes an annual report on adulthealth for the whole state and annual reports on adult health for selected indicators by area health service.
This 2006 Report on Adult Health from the New South Wales Population Health Survey reports thehealth of residents aged 16 years and over.
The content of the survey was developed by the NSW Health Survey Program in consultation with keystakeholders, area health services, other government departments, and a range of experts. Thesurvey included: questions used in previous surveys, new questions developed specifically for 2006,and questions developed specifically for some of the area health services. All new questions notpreviously used were submitted to the NSW Department of Health Ethics Committee for approval priorto use. New questions were also field-tested prior to inclusion in the survey. The instrument wastranslated into 5 languages: Arabic, Chinese, Greek, Italian and Vietnamese.
Interviews were carried out continuously between February and December. The target population forthe adult report was all New South Wales residents aged 16 years and over living in households withprivate telephones. Households were sampled using list-assisted random digit dialling. When ahousehold was contacted, one person was randomly selected for interview. Information for the adultreport was collected on 7,962 adults.
Health behavioursHealth behaviours contribute to premature mortality and morbidity. Adult health behaviours measuredin 2006 include alcohol consumption, cancer screening (breast and cervical), environmental health(water quality and home heating), food handling, immunisation (influenza, pneumococcal, andmeningococcal), injury prevention (fire prevention in the home and swimming ability), nutrition(consumption of fruit, vegetables, breads and cereals, milk, fried potatoes, potato crisps and saltysnacks, processed meat products, soft drinks, fast foods, and food insecurity), physical activity(adequate physical activity and neighbourhood facilities), and smoking (including passive smoking inhomes, cars, licensed premises, and outdoor dining areas).
Just under one-third (32.8 per cent) of adults undertook any alcohol risk-drinking behaviour. Males,young adults, rural residents, and adults in the most disadvantaged quintile, undertook higher levels ofany alcohol risk-drinking behaviour.
Just over three-quarters (76.2 per cent) of females aged 50-69 years had a screening mammogramwithin the last 2 years. There was no variation between urban areas and rural areas, among healthareas, or by socioeconomic status. Over 7 in 10 females (72.8 per cent) aged 20-69 years had a Paptest in the past 2 years. The proportion increased with age group, and between rural areas comparedwith urban areas. There was no variation by level of socioeconomic disadvantage.
Just over 8 in 10 adults (81.7 per cent) used a public water supply as their usual source of drinkingwater. The proportion was higher in adults aged 75 years and over, and lower in rural areas comparedwith urban areas. The use of a public water supply as a usual source of drinking water decreased withsocioeconomic disadvantage.
7
WARNIN
G: Esti
mates o
ut of
date.
Please
chec
k Hea
lthStat
s NSW
for la
test e
stimate
s.

Just over two-thirds (66.5 per cent) of adults washed their hands with soap after preparing raw meat.The proportion was higher in females than than males, but decreased in females by age group. Alower proportion of adults in rural areas than urban areas washed their hands after preparing rawmeat. There was no variation by level of socioeconomic disadvantage.
Seventy-five per cent (75.0 per cent) of adults aged 65 years and over had been immunised againstinfluenza in the last 12 months. Just over 6 in 10 adults (60.9 per cent) aged 65 years and over hadbeen immunised against pneumococcal pneumonia in the last 5 years. Just over 7 in 10 adults (72.0per cent) aged 16-19 years had been immunised against meningococcal disease in the last year.
Just under 9 in 10 adults (86.9 per cent) had a smoke alarm or detector in their home. More ruralresidents than urban residents had a smoke alarm. There was no variation by level of socioeconomicdisadvantage. Just over one in 5 adults (22.8 per cent) swam, fished, rock fished, snorkelled or scubadived in the last 4 weeks. Of these, 55.3 per cent were very good or good swimmers.
Just over one-half (53.4 per cent) of adults consumed the recommended number of serves of fruiteach day (2 serves or more), just under one in 10 adults (9.4 per cent) consumed the recommendednumber of serves of vegetables each day (5 serves or more), 47.3 per cent consumed low fat orreduced fat or skim milk, 30.1 did not consume fried potato products (hot chips, french fries, wedges,or fried potatoes), 46.7 per cent did not eat potato crisps or salty snacks), 20.8 per cent did notconsume processed meat products (sausages, frankfurts, devon, salami, meat pies, bacon, or ham),46.3 per cent did not consume soft drinks or cordials or sports drinks, and 37.1 per cent did notconsume fast foods. Just over one in 20 adults (5.6 per cent) ran out of food and could not afford tobuy more on at least one occasion in the previous 12 months.
Just over one-half of adults (54.9 per cent) undertook adequate levels of physical activity (a total of150 minutes per week on 5 separate occasions). More males than females undertook adequate levelsof physical activity. Overall, 4.3 per cent of adults had no access to neighbourhood facilities. Amongthose adults with access to neighbourhood facilities, 47.7 per cent used them weekly or more. Therewas no variation between males and females, or by level of socioeconomic disadvantage. A higherproportion of adults in rural areas than urban areas used neighbourhood facilities weekly.
Overall, 17.7 per cent of adults were current smokers (that is, daily or occasional smokers). A higherproportion of males than females were current smokers. There was no variation between urban areasand rural areas. Current smoking increased with socioeconomic disadvantage. Overall, 87.7 per centof adults lived in smoke-free homes; however, the proportion of smoke-free homes decreased associoeconomic disadvantage increased. Overall, 87.7 per cent of adults had smoke-free cars;however, the proportion of smoke-free cars decreased as socioeconomic disadvantage increased.Overall, 35.0 per cent of adults would be more likely, and 6.6 per cent of adults would be less likely, tofrequent hotels or licensed premises if there was a total ban on smoking. Overall, 38.2 per cent ofadults would be more likely, and 6.3 per cent of adults would be less likely, to frequent outdoor diningareas if there was a total ban on smoking.
Health statusIn 2006, the New South Wales Population Health Survey collected information from adults on a rangeof health indicators including: asthma, diabetes or high blood glucose, incontinence, injury (falls),mental health (psychological distress), oral health, overweight and obesity, and self-rated health.
Just over 1 in 10 adults (10.9 per cent) had current asthma. More females than males had current asthma.
Overall, 7.4 per cent of adults had diabetes or high blood glucose. The prevalence increased with age.
Just over one in 5 adults (20.7 per cent) aged 40 years and over experienced urinary incontinence inthe last 4 weeks. The proportion was higher in females than males, and increased with age. Therewas no variation between urban areas and rural areas, but the proportion increased by level ofsocioeconomic disadvantage.
8
WARNIN
G: Esti
mates o
ut of
date.
Please
chec
k Hea
lthStat
s NSW
for la
test e
stimate
s.
Overall, 24.3 per cent of adults aged 65 years and over had a fall in the last 12 months. The proportionwas higher in females than males, and lower in rural areas than urban areas. There was no variationby level of socioeconomic disadvantage. Among those who had a fall, 28.7 per cent required medicaltreatment and 32.1 per cent required hospitalisation. Overall, 25.7 per cent of adults aged 65 yearsand over took action to prevent falls and 26.6 per cent feared falling.
Overall, 10.7 per cent of adults had high or very high levels of psychological distress. The proportionwas higher in females than males, and increased by level of socioeconomic disadvantage. Theproportion did not vary between urban areas and rural areas.
Overall, 58.1 per cent of adults visited a dental professional less than 12 months ago. The proportionwas higher in females than males, and lower in rural areas than urban areas. The proportiondecreased by level of socioeconomic disadvantage. Overall, 4.8 per cent of adults had all their naturalteeth missing. The proportion was higher in females than males, and higher in rural areas than urbanareas. The proportion increased by level of socioeconomic disadvantage. Overall, 86.1 per cent ofadults agreed with having their water supply fluoridated.
Using height and weight to classify Body Mass Index (BMI), just over one-half of adults (50.4 per cent)were either overweight or obese. More males than females were overweight or obese. Overall, 17.7per cent adults were obese. More males than females were obese.
Overall, 80.3 per cent of adults rated their health as excellent, very good, or good. An index of chronicdisease risk factors was calculated using the following indicators: any alcohol risk drinking,recommended daily fruit or vegetable intake, inadequate physical activity, current smoking, andobesity. Using the index, 20.1 per cent of adults had 3 or more chronic disease risk factors. Theproportion was lower in females than males, and higher proportion in rural areas than urban areas.The proportion increased by level of socioeconomic disadvantage.
Health servicesIn 2006, the New South Wales Population Health Survey collected information on health servicesused, private health insurance, cost of health services and medication, difficulties getting health care,emergency department presentations, hospital admissions, community health centres, and publicdental services.
Health service use
Overall, 71.0 per cent of adults did not attend any health service, 14.1 per cent were admitted tohospital for at least one night, 14.0 per cent presented to an emergency department, 7.3 per centattended a community health centre, and 4.3 per cent attended a public dental service or hospital.
Overall, 54.6 per cent of adults were covered by private health insurance, 35.8 per cent of adults useda concession card to purchase medication, 7.9 per cent of adults avoided seeing a doctor due to thecost of medication, and 10.1 per cent of adults limited the use of prescription medication because of cost.
Overall, excluding those who did not need health care, 13.2 per cent of adults had difficulties gettinghealth care. The main difficulties were: waiting time for an appointment with a general practitioner,difficulty in accessing specialists, cost of health services, waiting time for dental services, shortage ofgeneral practitioners in the area, transport issues, quality of treatment, shortage of health services,and waiting time in emergency departments. The proportion was lower in males than females, andhigher in rural areas than urban areas. The proportion increased by level of socioeconomic disadvantage.
Overall, 14.1 per cent of adults presented to an emergency department in the last 12 months. Ofthese, 81.1 per cent rated the care received as excellent, very good, or good.
Overall, 14.1 per cent of adults had been admitted to hospital in the last 12 months. Of these, over90.2 per cent rated the care received as excellent, very good, or good.
9
WARNIN
G: Esti
mates o
ut of
date.
Please
chec
k Hea
lthStat
s NSW
for la
test e
stimate
s.
Overall, 7.3 per cent of adults attended a community health centre in the last 12 months. Of these,over 91.4 per cent rated the care received as excellent, very good, or good.
Overall, 4.2 per cent of adults attended a public dental service in the last 12 months. Of these, 84.2per cent rated the care received as excellent, very good, or good.
Social capitalThe term social capital refers to the relationships and conventions that shape social networks, fostertrust, and facilitate cooperation for mutual benefit. In 2006, the New South Wales Population HealthSurvey included questions on social reciprocity and neighbourhood connection, feelings of trust andsafety, and participation in the local community.
Overall, 35.9 per cent of adults helped out at a local group or organisation in the last 3 months, 60.3per cent attended a local community event in the last 6 months, and 43.8 per cent were activemembers of a local organisation or social club.
Overall, 73.5 per cent agreed that most people could be trusted, 70.2 per cent felt safe walking downtheir street after dark, with more males than females feeling safe, and 75.3 per cent felt their area hada reputation for being safe.
Overall, 66.7 per cent of adults visited neighbours in the last week, 80.8 per cent ran into friends andacquaintances when shopping in their local area, and 73.0 per cent said they would feel sad if theyhad to leave their neighbourhood.
10
WARNIN
G: Esti
mates o
ut of
date.
Please
chec
k Hea
lthStat
s NSW
for la
test e
stimate
s.

Snapshot
Topic IndicatorMales
(95% CI)Females(95% CI)
Person(95% CI)
Health behaviours Risk alcohol drinking 37.3 (35.0-39.6) 28.4 (26.7-30.2) 32.8 (31.4-34.2)
Screening mammogram within the last 2 years 76.2 (73.4-79.0) 76.2 (73.4-79.0)
Pap test within the last 2 years 72.8 (70.6-74.9) 72.8 (70.6-74.9)
Recommended fruit consumption 47.0 (44.7-49.3) 59.6 (57.7-61.5) 53.4 (51.9-54.9)
Recommended vegetable consumption 6.4 (5.3-7.5) 12.4 (11.3-13.6) 9.4 (8.7-10.2)
Adequate physical activity 60.4 (58.1-62.7) 49.6 (47.6-51.5) 54.9 (53.4-56.4)
Current smoking 19.2 (17.3-21.1) 16.2 (14.8-17.7) 17.7 (16.5-18.9)
Health status Ever diagnosed with asthma 18.4 (16.6-20.2) 20.1 (18.6-21.6) 19.3 (18.1-20.4)
Diabetes or high blood glucose 8.5 (7.4-9.7) 6.4 (5.6-7.2) 7.4 (6.7-8.1)
High and very high psychological distress 9.4 (8.1-10.7) 11.9 (10.7-13.2) 10.7 (9.8-11.6)
Visited a dental professional in the last 12 months 56.4 (54.1-58.7) 59.8 (57.9-61.6) 58.1 (56.6-59.6)
Overweight and obesity 57.4 (55.0-59.7) 43.3 (41.4-45.2) 50.4 (48.9-52.0)
Excellent, very good, or good self-rated health status 82.5 (80.9-84.2) 78.1 (76.6-79.7) 80.3 (79.2-81.4)
Health services Difficulties getting health care when needing it 11.9 (10.5-13.3) 14.6 (13.3-15.9) 13.2 (12.3-14.2)
Emergency department presentation in the previous 12 months 14.1 (12.5-15.7) 14.0 (12.8-15.3) 14.1 (13.0-15.1)
Hospital admission in the previous 12 months 12.7 (11.3-14.1) 15.4 (14.1-16.8) 14.1 (13.1-15.1)
Community health centre attendance in the previous 12 months 5.7 (4.7-6.8) 8.8 (7.7-9.9) 7.3 (6.5-8.1)
Public dental service attendance in the previous 12 months 3.9 (2.9-4.8) 4.6 (3.8-5.4) 4.2 (3.6-4.8)
Social capital Attended a community event at least once in the last 6 months 57.0 (54.7-59.4) 63.6 (61.8-65.4) 60.3 (58.9-61.8)
Most people can be trusted 74.4 (72.3-76.4) 72.7 (71.0-74.5) 73.5 (72.2-74.9)
Visit neighbours 66.6 (64.4-68.9) 66.9 (65.1-68.6) 66.7 (65.3-68.2)
11
WARNIN
G: Esti
mates o
ut of
date.
Please
chec
k Hea
lthStat
s NSW
for la
test e
stimate
s.
Methods
IntroductionIn 2006, the NSW Department of Health, in conjunction with the 8 area health services, completed thefifth year of the New South Wales Population Health Survey, an ongoing survey of the health of peopleof New South Wales using computer assisted telephone interviewing (CATI). The main aims of thesurvey are to provide detailed information on the health of the people of New South Wales, and tosupport the planning, implementation, and evaluation of health services and programs in New South Wales.
Prior to the introduction of the continuous survey in 2002, the Centre for Epidemiology and Researchconducted adult health surveys in 1997 and 1998, an older people’s health survey in 1999, and a childhealth survey in 2001. The reporting plan for the continuous survey includes an annual report on adulthealth for the whole state and annual reports on adult health for selected indicators by area health service.
This section describes the methods used for the 2006 Report on Adult Health from the New SouthWales Population Health Survey, which reports the health of residents aged 16 years and over.
New South Wales Population Health Survey
Survey instrument
The survey instrument for the New South Wales Population Health Survey was developed by theHealth Survey Program in consultation with key stakeholders, area health services, other governmentdepartments, and a range of experts.
The survey instrument included: questions used in previous surveys, new questions developedspecifically for 2006, and questions developed specifically for some of the area health services. Allquestions not previously used were submitted to the Ethics Committee of the NSW Department ofHealth for approval prior to use. New questions were also field tested prior to inclusion in the survey.The survey instrument was translated into 5 languages: Arabic, Chinese, Greek, Italian and Vietnamese.
Survey sample
In 2006, the target population for the New South Wales Population Health Survey was all residentsliving in households with private telephones. The target sample comprised approximately 1,500 peoplein each of the 8 area health services (total sample of 12,000).
The sampling frame was developed as follows. Records from the Australia on Disk electronic whitepages (phone book) were geo-coded using MapInfo mapping software.[1,2] The geo-coded telephonenumbers were assigned to statistical local areas and area health services. The proportion of numbersfor each telephone prefix by area health service was calculated. All prefixes were expanded withsuffixes ranging from 0000 to 9999. The resulting list was then matched back to the electronic phonebook. All numbers that matched numbers in the electronic phone book were flagged and the numberwas assigned to the relevant geo-coded area health service. Unlisted numbers were assigned to thearea health service containing the greatest proportion of numbers with that prefix. Numbers were thenfiltered to eliminate contiguous unused blocks of greater than 10 numbers. The remaining numberswere then checked against the business numbers in the electronic phone book to eliminate businessnumbers. Finally, numbers were randomly sorted.
Households were contacted using random digit dialling. One person from the household was randomlyselected for inclusion in the survey.
12
WARNIN
G: Esti
mates o
ut of
date.
Please
chec
k Hea
lthStat
s NSW
for la
test e
stimate
s.
Interviews
In 2006, interviews were carried out continuously between February and December. Selectedhouseholds that had addresses in the electronic phone book were sent a letter describing the aimsand methods of the survey 2 weeks prior to initial attempts at telephone contact. An 1800 freecallcontact number was provided for potential respondents to verify the authenticity of the survey and toask any questions regarding the survey. Trained interviewers at the Health Survey Program CATIfacility carried out interviews. Up to 7 calls were made to establish initial contact with a household, and5 calls were made in order to contact a selected respondent.
Call outcomes and response rates
In total, 10,345 interviews were conducted, with at least 1,200 interviews in each area health serviceand 7,962 with adults aged 16 years or over. The overall response rate was 59.3 per cent (completedinterviews divided by completed interviews and refusals).
Data analysis
For analysis, the survey sample was weighted to adjust for differences in the probabilities of selectionamong subjects. These differences were due to the varying number of people living in eachhousehold, the number of residential telephone connections for the household, and the varyingsampling fraction in each health area.
Post-stratification weights were used to reduce the effect of differing non-response rates among malesand females and different age groups on the survey estimates. These weights were adjusted fordifferences between the age and sex structure of the survey sample and the Australian Bureau ofStatistics 2005 mid-year population estimates (excluding residents of institutions) for each area healthservice. Further information on the weighting process is provided elsewhere.[3]
Call and interview data were manipulated and analysed using SAS version 8.02.[4] TheSURVEYMEANS procedure in SAS was used to analyse the data and calculate point estimates and95 per cent confidence intervals for the estimates. The SURVEYMEANS procedure calculatesstandard errors adjusted for the design effect factor or DEFF (the variance for a non-random sampledivided by the variance for a simple random sample). It uses the Taylor expansion method to estimatesampling errors of estimators based on the stratified random sample.[4]
The 95 per cent confidence interval provides a range of values that should contain the actual value 95per cent of the time. In general, a wider confidence interval reflects less certainty in the estimate forthat indicator. The width of the confidence interval relates to the differing sample size for eachindicator. Wide confidence bands mean that although there may be a large difference between theestimates, because of the small sample size in some indicators the difference is not significantly different.[4] For a pairwised comparison of subgroup estimates, the p-value for a two-tailed test wascalculated using the normal distribution probability function PROBNORM in SAS, assumingapproximate normal distribution of each individual subgroup estimates with the estimated standarderrors, and approximate normal distribution for the estimated difference.
The K10 measure of psychological distress
In 2005, the K10 scale was included in the New South Wales Population Health Survey as a measureof psychological distress.[5,6] The K10 is a 10-item questionnaire intended to yield a global measure ofpsychological distress. It includes questions about the level of anxiety and depressive symptoms in themost recent 4-week period. For each question, there is a 5-level response scale based on the amountof time (from none of the time through to all the time) during a 4-week period that the personexperienced the particular problem.
When scoring responses to the questionnaire, between one and 5 points were assigned to eachsymptom with a value of one indicating that the person experiences the problem none of the time and5 indicating all of the time. It follows that the total K10 score for each person ranges from 10 points(that is, all responses are none of the time) through to 50 (all responses are all of the time.[7]
13
WARNIN
G: Esti
mates o
ut of
date.
Please
chec
k Hea
lthStat
s NSW
for la
test e
stimate
s.
The K10 scores calculated for the New South Wales Population Health Survey are a combination ofactual and imputed scores. Where a respondent answered all 10 questions, the K10 score was simplythe sum of the individual scores for each question. Where the respondent answered 9 questions, thescore for the missing question was imputed as the mean score of the 9 answered questions.
Indices of geographic remoteness and socioeconomicdisadvantage: ARIA and SEIFA
The Accessibility-Remoteness Index of Australia Plus (ARIA+) is the standard Australian Bureau ofStatistics (ABS) endorsed measure of remoteness.[8] It is derived using the road distances frompopulated localities to the nearest service centres across Australia. For each locality, the accessibilityto services is expressed as a continuous measure from 0 (high accessibility) to 15 (high remoteness)and grouped into 5 categories: major cities, inner regional, outer regional, remote, and very remote.
The Socio-Economic Indexes for Areas (SEIFA) describe the socioeconomic aspects of geographicalareas in Australia, using a number of underlying variables such as family and householdcharacteristics, personal educational qualifications, and occupation.[9] The SEIFA index used toprovide breakdowns of the New South Wales Population Health Survey data in 2006 is the Index ofRelative Socio-Economic Disadvantage. This index is calculated on attributes such as low income andeducational attainment, high unemployment, and people working in unskilled occupations. The SEIFAindex values are grouped into 5 quintiles, with quintile one being the least disadvantaged and quintile5 being the most disadvantaged.
Both the ARIA+ and SEIFA indexes were assigned to the results of the New South Wales PopulationHealth Survey in 2006 based on respondents’ postcode of residence. Rates for each SEIFA quintilewere calculated for several health indicators included in this report to enable socioeconomic comparisons.
Definition of urban and rural
In this report, the term urban means the respondent lived in one of the 4 area health servicesdesignated as metropolitan: Northern Sydney & Central Coast, South Eastern Sydney and Illawarra,Sydney South West, and Sydney West. The term rural means the respondent lived in one of the 4area health services designated as rural: Greater Southern, Greater Western, Hunter & New England,and North Coast.
References1. Australia on Disk [software]. Sydney: Australia on Disk, 2000. 2. MapInfo [software]. Troy, NY: MapInfo Corporation, 1997. 3. Williamson M, Baker D, Jorm L. The NSW Health Survey Program: Overview and methods
1996-2000. N S W Public Health Bull 2001; 12(S-2). 4. SAS Institute. The SAS System for Windows version 8.2. Cary, NC: SAS Institute Inc., 2001. 5. Kessler R, Mroczec D. An update of the development of mental health screening scales for the
US National Health Interview Survey. Ann Arbor MI: Survey Research Centre of the Institute forSocial Research, University of Michigan, Memo dated December 22, 1992.
6. Kessler R, Mroczec D. Final versions of our Non-Specific Psychological Distress Scale. Ann ArborMI: Survey Research Centre of the Institute for Social Research, University of Michigan, Memodated March 10, 1994.
7. Australian Bureau of Statistics. Information paper: Use of the Kessler Psychological DistressScale in ABS Health Surveys. Catalogue no. 4187.0.55.001. Canberra: ABS, 2003.
8. Australian Bureau of Statistics. ASGC Remoteness Classification: Purpose and Use. CensusPaper No. 03/01. Commonwealth of Australia, 2003.
9. Australian Bureau of Statistics. 1996 Census of Population and Housing: Socio-Economic Indexesfor Areas, Information Paper, Catalogue no. 2039.0. Canberra: ABS, 1998.
14
WARNIN
G: Esti
mates o
ut of
date.
Please
chec
k Hea
lthStat
s NSW
for la
test e
stimate
s.

Outcomes of telephone calls, NSW, 2006
OutcomeNumber of
telephone numbers
Unable to contact 10804
Not connected 26174
Business/institution telephone 5381
Fax number 4206
Household not in NSW or holiday house 414
Respondent away for duration of survey 1513
Respondents confused or deaf 760
Non-translated language 842
Refusal 7100
Complete 10345
Total 67539
Note: Operational data for the survey were downloaded using SAWTOOTH WinCati version 4.1. The data included the following information for each attempted’telephone’ number, including connected and non-connected numbers: the number dialled; the number of attempts of dialling to that number; the startingand ending time for each dialling attempt to the number; whether or not the number is listed in the EWP; and whether the number dialled has led to acompleted interview, or no answer, or a refusal, or a non-connected number, or any kind of out of scope number (including non-connected numbers, faxmachines, unusual tones, business-institution numbers, and households not eligible).
Completed interviews and response rates by area health service, NSW, 2006
Health AreaAdult
respondentsChild
respondentsTotal
respondentsResponse rate (%)
Sydney South West 1024 352 1376 52.3
South Eastern Sydney & Illawarra 945 257 1202 54.5
Sydney West 949 339 1288 55.7
Northern Sydney & Central Coast 1008 289 1297 57.6
Hunter & New England 1042 299 1341 63.6
North Coast 1024 261 1285 63.3
Greater Southern 999 295 1294 64.6
Greater Western 971 291 1262 66.4
NSW 7962 2383 10345 59.3
Note: Operational data for the survey were downloaded using SAWTOOTH WinCati version 4.1. Response rates were calculated as the number of completedinterviews divided by the sum of the number of completed interviews and number of refusals.
Completed interviews by language, NSW, 2006
Language Number of respondents
English 10093
Arabic 61
Chinese 61
Greek 49
Italian 41
Vietnamese 40
All 10345
Note: Operational data for the survey were downloaded using SAWTOOTH WinCati version 4.1.
15
WARNIN
G: Esti
mates o
ut of
date.
Please
chec
k Hea
lthStat
s NSW
for la
test e
stimate
s.
Representativeness of sample
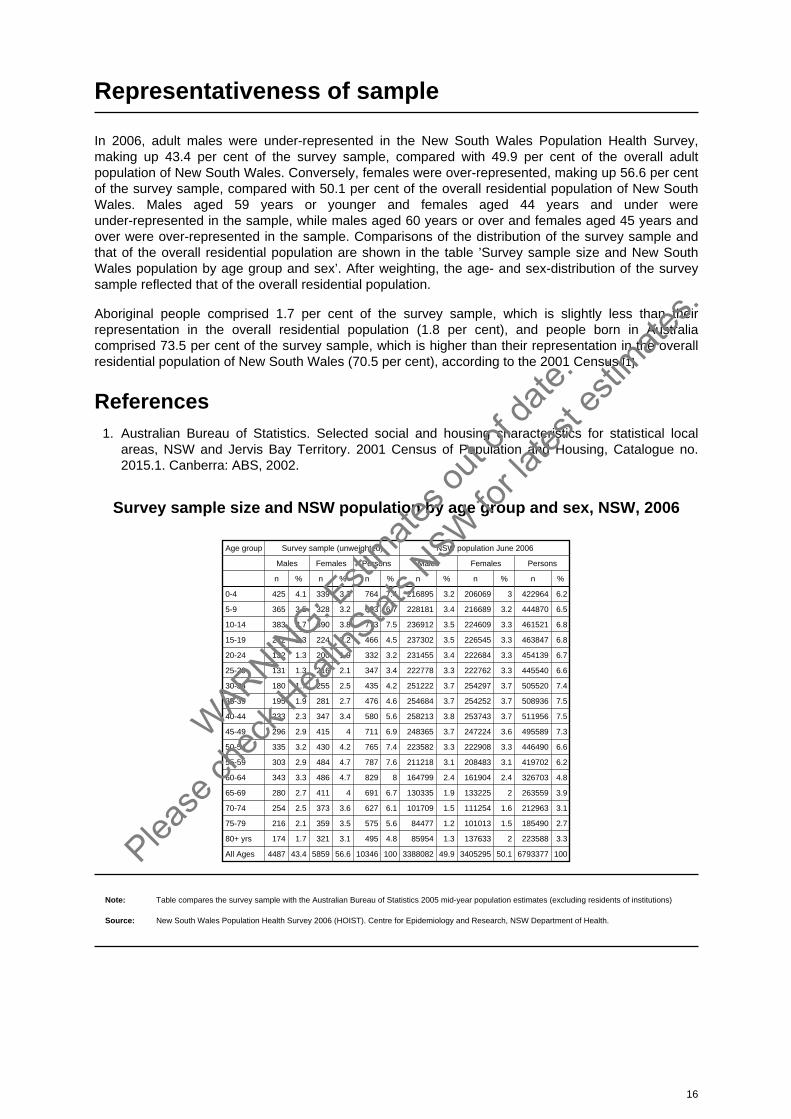
In 2006, adult males were under-represented in the New South Wales Population Health Survey,making up 43.4 per cent of the survey sample, compared with 49.9 per cent of the overall adultpopulation of New South Wales. Conversely, females were over-represented, making up 56.6 per centof the survey sample, compared with 50.1 per cent of the overall residential population of New SouthWales. Males aged 59 years or younger and females aged 44 years and under wereunder-represented in the sample, while males aged 60 years or over and females aged 45 years andover were over-represented in the sample. Comparisons of the distribution of the survey sample andthat of the overall residential population are shown in the table ’Survey sample size and New SouthWales population by age group and sex’. After weighting, the age- and sex-distribution of the surveysample reflected that of the overall residential population.
Aboriginal people comprised 1.7 per cent of the survey sample, which is slightly less than theirrepresentation in the overall residential population (1.8 per cent), and people born in Australiacomprised 73.5 per cent of the survey sample, which is higher than their representation in the overallresidential population of New South Wales (70.5 per cent), according to the 2001 Census.[1]
References1. Australian Bureau of Statistics. Selected social and housing characteristics for statistical local
areas, NSW and Jervis Bay Territory. 2001 Census of Population and Housing, Catalogue no.2015.1. Canberra: ABS, 2002.
Survey sample size and NSW population by age group and sex, NSW, 2006
Age group Survey sample (unweighted) NSW population June 2006
Males Females Persons Males Females Persons
n % n % n % n % n % n %
0-4 425 4.1 339 3.3 764 7.4 216895 3.2 206069 3 422964 6.2
5-9 365 3.5 328 3.2 693 6.7 228181 3.4 216689 3.2 444870 6.5
10-14 383 3.7 390 3.8 773 7.5 236912 3.5 224609 3.3 461521 6.8
15-19 242 2.3 224 2.2 466 4.5 237302 3.5 226545 3.3 463847 6.8
20-24 132 1.3 200 1.9 332 3.2 231455 3.4 222684 3.3 454139 6.7
25-29 131 1.3 216 2.1 347 3.4 222778 3.3 222762 3.3 445540 6.6
30-34 180 1.7 255 2.5 435 4.2 251222 3.7 254297 3.7 505520 7.4
35-39 195 1.9 281 2.7 476 4.6 254684 3.7 254252 3.7 508936 7.5
40-44 233 2.3 347 3.4 580 5.6 258213 3.8 253743 3.7 511956 7.5
45-49 296 2.9 415 4 711 6.9 248365 3.7 247224 3.6 495589 7.3
50-54 335 3.2 430 4.2 765 7.4 223582 3.3 222908 3.3 446490 6.6
55-59 303 2.9 484 4.7 787 7.6 211218 3.1 208483 3.1 419702 6.2
60-64 343 3.3 486 4.7 829 8 164799 2.4 161904 2.4 326703 4.8
65-69 280 2.7 411 4 691 6.7 130335 1.9 133225 2 263559 3.9
70-74 254 2.5 373 3.6 627 6.1 101709 1.5 111254 1.6 212963 3.1
75-79 216 2.1 359 3.5 575 5.6 84477 1.2 101013 1.5 185490 2.7
80+ yrs 174 1.7 321 3.1 495 4.8 85954 1.3 137633 2 223588 3.3
All Ages 4487 43.4 5859 56.6 10346 100 3388082 49.9 3405295 50.1 6793377 100
Note: Table compares the survey sample with the Australian Bureau of Statistics 2005 mid-year population estimates (excluding residents of institutions)
Source: New South Wales Population Health Survey 2006 (HOIST). Centre for Epidemiology and Research, NSW Department of Health.
16
WARNIN
G: Esti
mates o
ut of
date.
Please
chec
k Hea
lthStat
s NSW
for la
test e
stimate
s.
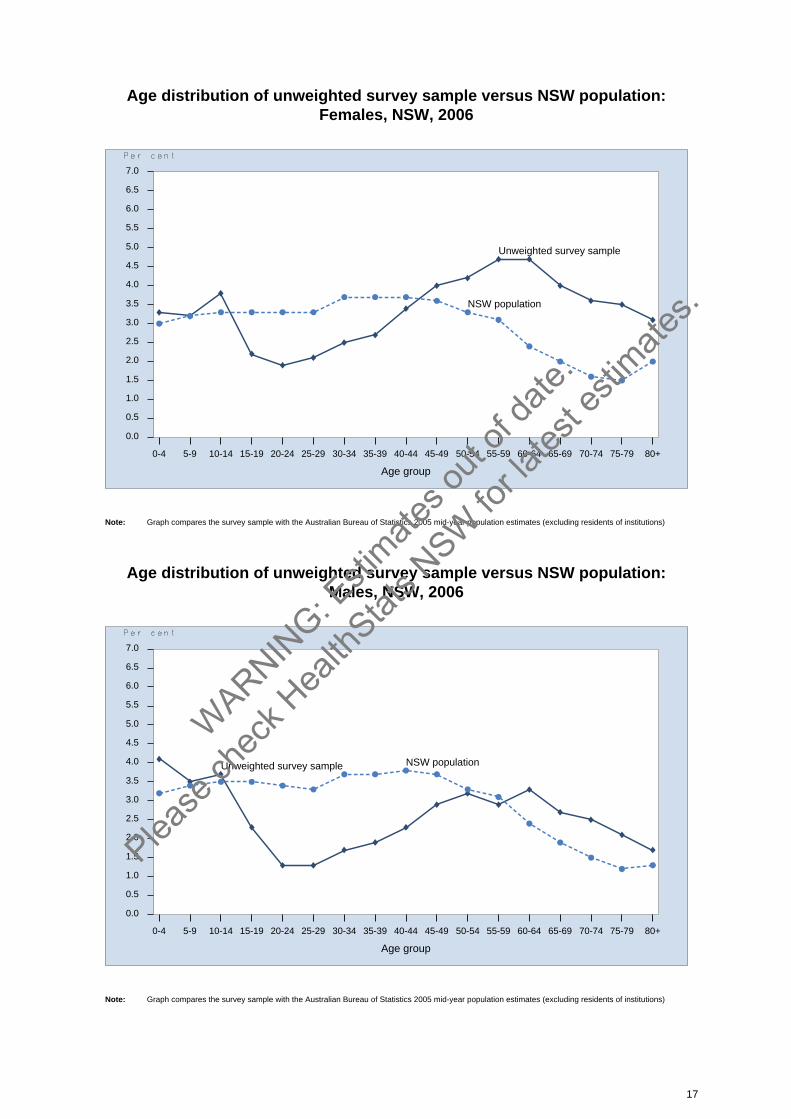
Age distribution of unweighted survey sample versus NSW population:Females, NSW, 2006
0-4 5-9 10-14 15-19 20-24 25-29 30-34 35-39 40-44 45-49 50-54 55-59 60-64 65-69 70-74 75-79 80+
0.0
0.5
1.0
1.5
2.0
2.5
3.0
3.5
4.0
4.5
5.0
5.5
6.0
6.5
7.0
Age group
Unweighted survey sample
NSW population
Note: Graph compares the survey sample with the Australian Bureau of Statistics 2005 mid-year population estimates (excluding residents of institutions)
Age distribution of unweighted survey sample versus NSW population:Males, NSW, 2006
0-4 5-9 10-14 15-19 20-24 25-29 30-34 35-39 40-44 45-49 50-54 55-59 60-64 65-69 70-74 75-79 80+
0.0
0.5
1.0
1.5
2.0
2.5
3.0
3.5
4.0
4.5
5.0
5.5
6.0
6.5
7.0
Age group
Unweighted survey sample NSW population
Note: Graph compares the survey sample with the Australian Bureau of Statistics 2005 mid-year population estimates (excluding residents of institutions)
17
WARNIN
G: Esti
mates o
ut of
date.
Please
chec
k Hea
lthStat
s NSW
for la
test e
stimate
s.
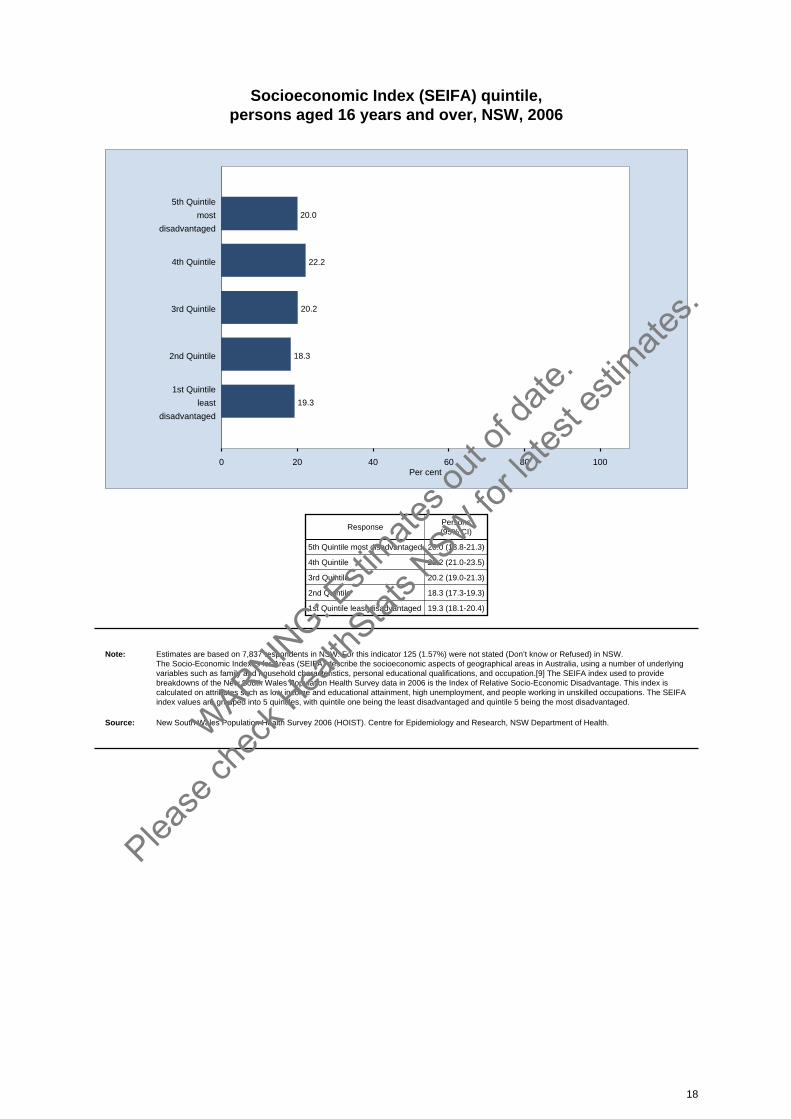
Socioeconomic Index (SEIFA) quintile, persons aged 16 years and over, NSW, 2006
0 20 40 60 80 100Per cent
20.0
5th Quintile
most
disadvantaged
22.24th Quintile
20.23rd Quintile
18.32nd Quintile
19.3
1st Quintile
least
disadvantaged
ResponsePersons(95% CI)
5th Quintile most disadvantaged 20.0 (18.8-21.3)
4th Quintile 22.2 (21.0-23.5)
3rd Quintile 20.2 (19.0-21.3)
2nd Quintile 18.3 (17.3-19.3)
1st Quintile least disadvantaged 19.3 (18.1-20.4)
Note: Estimates are based on 7,837 respondents in NSW. For this indicator 125 (1.57%) were not stated (Don’t know or Refused) in NSW. The Socio-Economic Indexes for Areas (SEIFA) describe the socioeconomic aspects of geographical areas in Australia, using a number of underlyingvariables such as family and household characteristics, personal educational qualifications, and occupation.[9] The SEIFA index used to providebreakdowns of the New South Wales Population Health Survey data in 2006 is the Index of Relative Socio-Economic Disadvantage. This index iscalculated on attributes such as low income and educational attainment, high unemployment, and people working in unskilled occupations. The SEIFAindex values are grouped into 5 quintiles, with quintile one being the least disadvantaged and quintile 5 being the most disadvantaged.
Source: New South Wales Population Health Survey 2006 (HOIST). Centre for Epidemiology and Research, NSW Department of Health.
18
WARNIN
G: Esti
mates o
ut of
date.
Please
chec
k Hea
lthStat
s NSW
for la
test e
stimate
s.
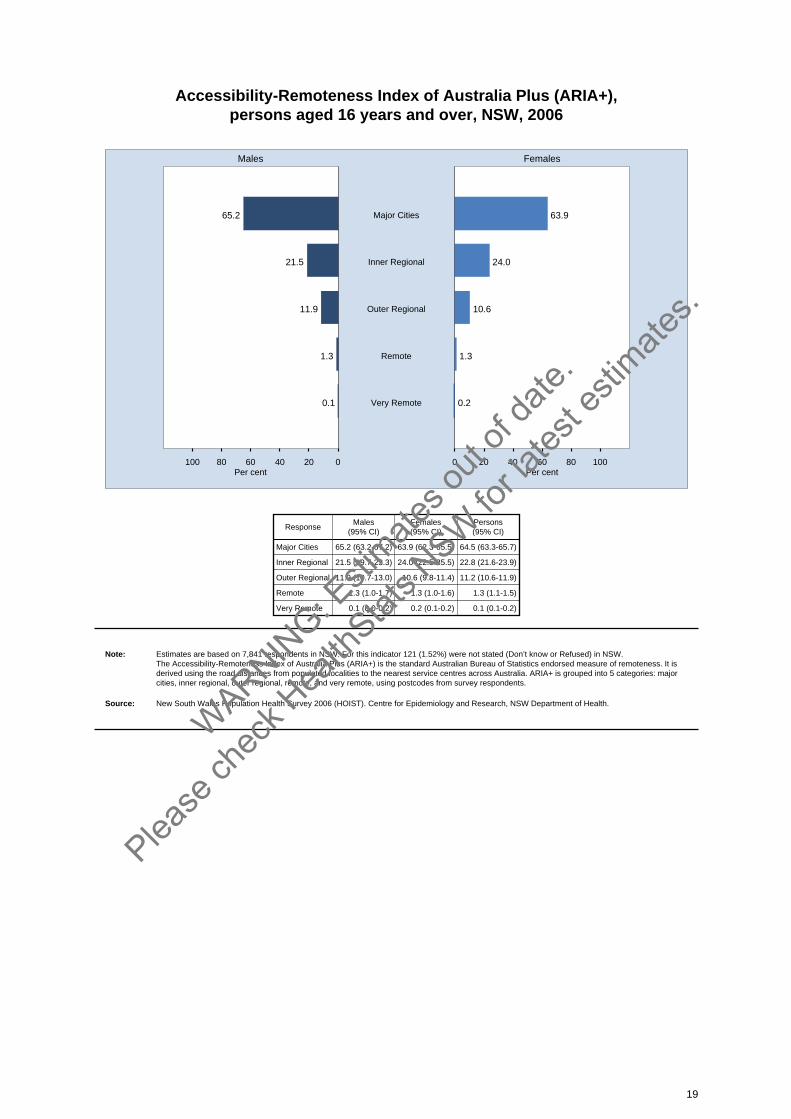
Accessibility-Remoteness Index of Australia Plus (ARIA+), persons aged 16 years and over, NSW, 2006
020406080100 0 20 40 60 80 100
Males Females
Per cent Per cent
65.2 63.9Major Cities
21.5 24.0Inner Regional
11.9 10.6Outer Regional
1.3 1.3Remote
0.1 0.2Very Remote
ResponseMales
(95% CI)Females(95% CI)
Persons(95% CI)
Major Cities 65.2 (63.2-67.2) 63.9 (62.3-65.5) 64.5 (63.3-65.7)
Inner Regional 21.5 (19.7-23.3) 24.0 (22.5-25.5) 22.8 (21.6-23.9)
Outer Regional 11.9 (10.7-13.0) 10.6 (9.8-11.4) 11.2 (10.6-11.9)
Remote 1.3 (1.0-1.7) 1.3 (1.0-1.6) 1.3 (1.1-1.5)
Very Remote 0.1 (0.0-0.2) 0.2 (0.1-0.2) 0.1 (0.1-0.2)
Note: Estimates are based on 7,841 respondents in NSW. For this indicator 121 (1.52%) were not stated (Don’t know or Refused) in NSW. The Accessibility-Remoteness Index of Australia Plus (ARIA+) is the standard Australian Bureau of Statistics endorsed measure of remoteness. It isderived using the road distances from populated localities to the nearest service centres across Australia. ARIA+ is grouped into 5 categories: majorcities, inner regional, outer regional, remote, and very remote, using postcodes from survey respondents.
Source: New South Wales Population Health Survey 2006 (HOIST). Centre for Epidemiology and Research, NSW Department of Health.
19
WARNIN
G: Esti
mates o
ut of
date.
Please
chec
k Hea
lthStat
s NSW
for la
test e
stimate
s.
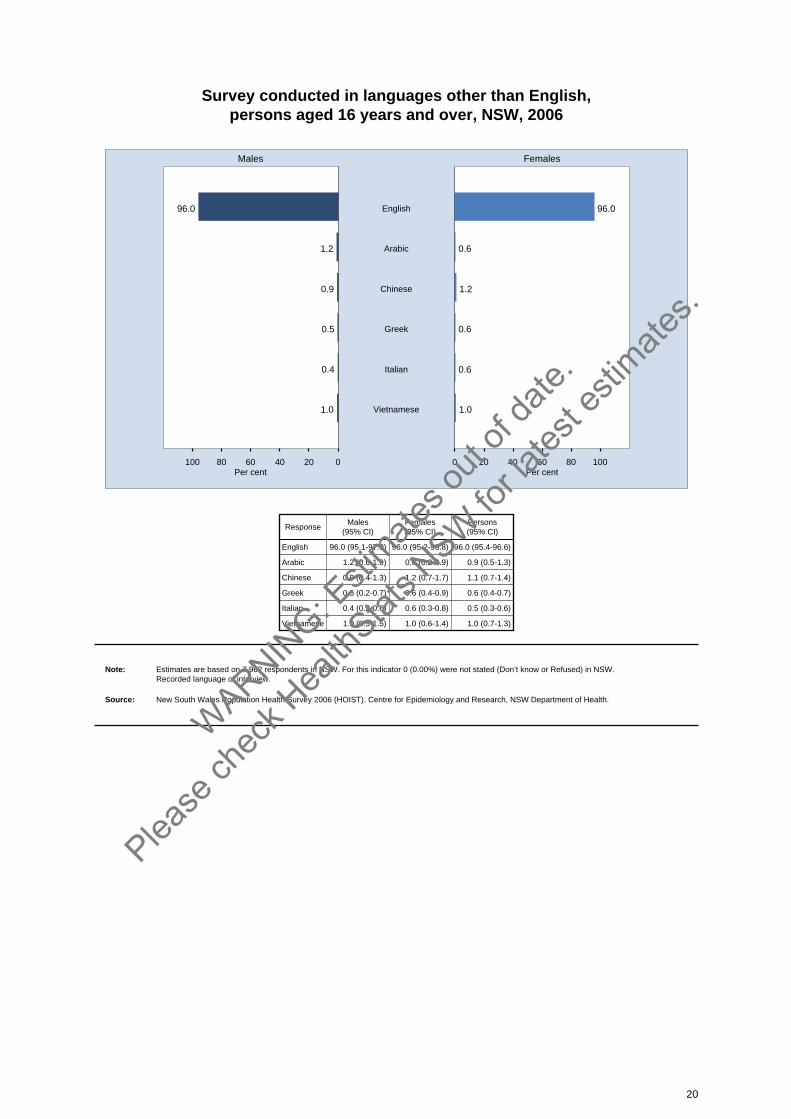
Survey conducted in languages other than English, persons aged 16 years and over, NSW, 2006
020406080100 0 20 40 60 80 100
Males Females
Per cent Per cent
96.0 96.0English
1.2 0.6Arabic
0.9 1.2Chinese
0.5 0.6Greek
0.4 0.6Italian
1.0 1.0Vietnamese
ResponseMales
(95% CI)Females(95% CI)
Persons(95% CI)
English 96.0 (95.1-97.0) 96.0 (95.2-96.8) 96.0 (95.4-96.6)
Arabic 1.2 (0.6-1.9) 0.6 (0.2-0.9) 0.9 (0.5-1.3)
Chinese 0.9 (0.4-1.3) 1.2 (0.7-1.7) 1.1 (0.7-1.4)
Greek 0.5 (0.2-0.7) 0.6 (0.4-0.9) 0.6 (0.4-0.7)
Italian 0.4 (0.2-0.6) 0.6 (0.3-0.8) 0.5 (0.3-0.6)
Vietnamese 1.0 (0.5-1.5) 1.0 (0.6-1.4) 1.0 (0.7-1.3)
Note: Estimates are based on 7,962 respondents in NSW. For this indicator 0 (0.00%) were not stated (Don’t know or Refused) in NSW. Recorded language of interview.
Source: New South Wales Population Health Survey 2006 (HOIST). Centre for Epidemiology and Research, NSW Department of Health.
20
WARNIN
G: Esti
mates o
ut of
date.
Please
chec
k Hea
lthStat
s NSW
for la
test e
stimate
s.
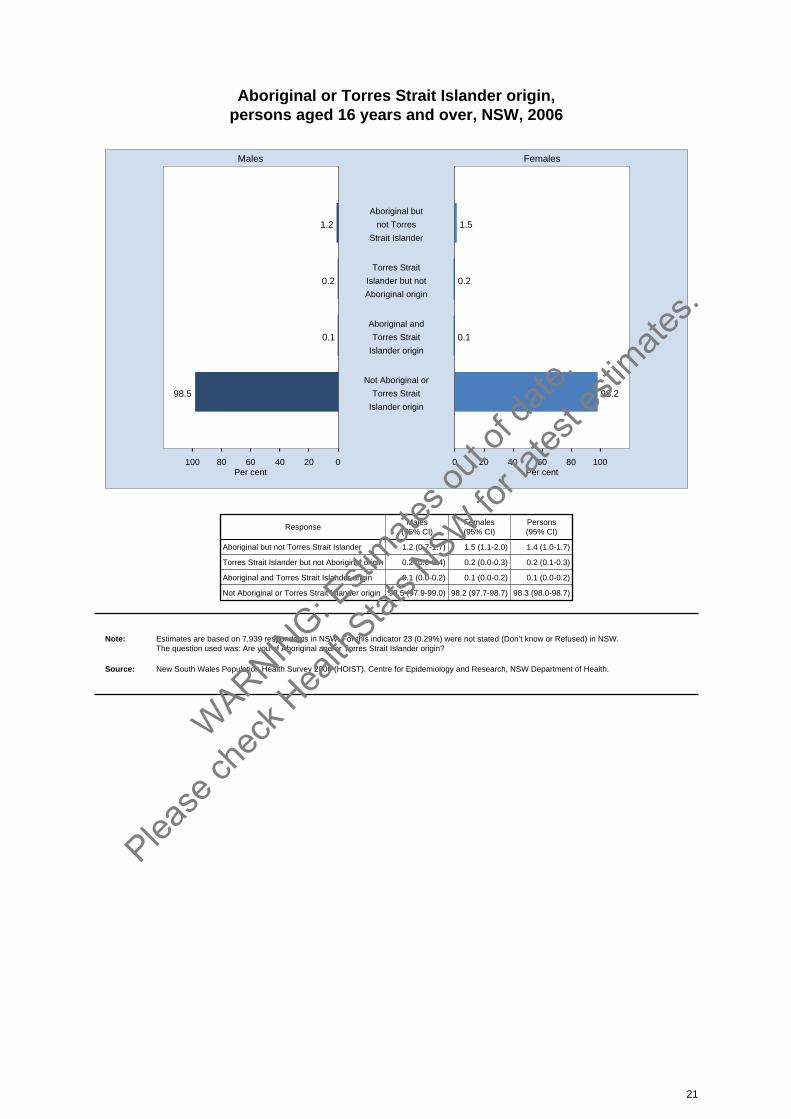
Aboriginal or Torres Strait Islander origin, persons aged 16 years and over, NSW, 2006
020406080100 0 20 40 60 80 100
Males Females
Per cent Per cent
1.2 1.5
Aboriginal but
not Torres
Strait Islander
0.2 0.2
Torres Strait
Islander but not
Aboriginal origin
0.1 0.1
Aboriginal and
Torres Strait
Islander origin
98.5 98.2
Not Aboriginal or
Torres Strait
Islander origin
ResponseMales
(95% CI)Females(95% CI)
Persons(95% CI)
Aboriginal but not Torres Strait Islander 1.2 (0.7-1.7) 1.5 (1.1-2.0) 1.4 (1.0-1.7)
Torres Strait Islander but not Aboriginal origin 0.2 (0.0-0.4) 0.2 (0.0-0.3) 0.2 (0.1-0.3)
Aboriginal and Torres Strait Islander origin 0.1 (0.0-0.2) 0.1 (0.0-0.2) 0.1 (0.0-0.2)
Not Aboriginal or Torres Strait Islander origin 98.5 (97.9-99.0) 98.2 (97.7-98.7) 98.3 (98.0-98.7)
Note: Estimates are based on 7,939 respondents in NSW. For this indicator 23 (0.29%) were not stated (Don’t know or Refused) in NSW. The question used was: Are you of Aboriginal and/or Torres Strait Islander origin?
Source: New South Wales Population Health Survey 2006 (HOIST). Centre for Epidemiology and Research, NSW Department of Health.
21
WARNIN
G: Esti
mates o
ut of
date.
Please
chec
k Hea
lthStat
s NSW
for la
test e
stimate
s.
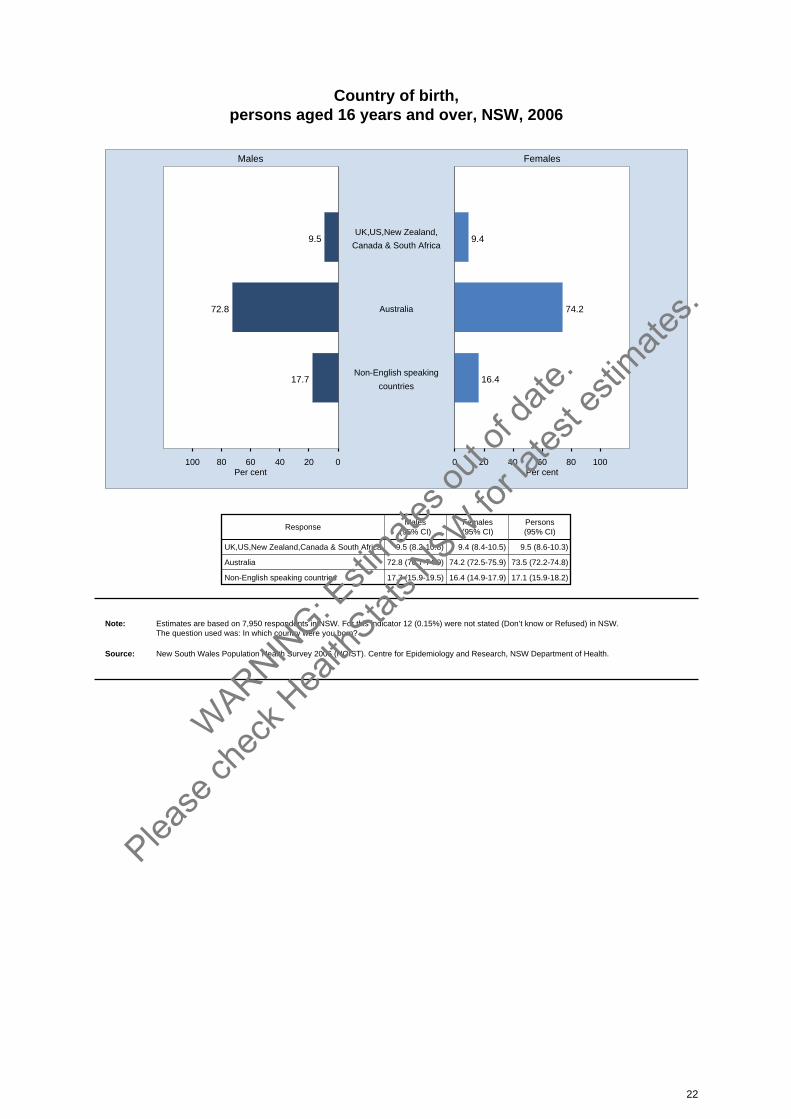
Country of birth, persons aged 16 years and over, NSW, 2006
020406080100 0 20 40 60 80 100
Males Females
Per cent Per cent
9.5 9.4UK,US,New Zealand,
Canada & South Africa
72.8 74.2Australia
17.7 16.4Non-English speaking
countries
ResponseMales
(95% CI)Females(95% CI)
Persons(95% CI)
UK,US,New Zealand,Canada & South Africa 9.5 (8.2-10.8) 9.4 (8.4-10.5) 9.5 (8.6-10.3)
Australia 72.8 (70.7-74.9) 74.2 (72.5-75.9) 73.5 (72.2-74.8)
Non-English speaking countries 17.7 (15.9-19.5) 16.4 (14.9-17.9) 17.1 (15.9-18.2)
Note: Estimates are based on 7,950 respondents in NSW. For this indicator 12 (0.15%) were not stated (Don’t know or Refused) in NSW. The question used was: In which country were you born?
Source: New South Wales Population Health Survey 2006 (HOIST). Centre for Epidemiology and Research, NSW Department of Health.
22
WARNIN
G: Esti
mates o
ut of
date.
Please
chec
k Hea
lthStat
s NSW
for la
test e
stimate
s.

Languages other than English spoken at home, persons who speak a language other than English aged 16 years and over,
NSW, 2006
020406080100 0 20 40 60 80 100
Males Females
Per cent Per cent
49.7 51.8Arabic, Lebanese
13.5 12.0Chinese, Cantonese,Mandarin
4.7 2.4Vietnamese
8.3 8.2Italian
7.0 6.3Greek
2.7 7.2Filipino, Tagalog
7.8 4.8Spanish
1.3 1.6Indonesian, Bahasa
5.1 5.7Hindi
ResponseMales
(95% CI)Females(95% CI)
Persons(95% CI)
Arabic, Lebanese 49.7 (42.8-56.6) 51.8 (45.5-58.0) 50.7 (46.0-55.4)
Chinese, Cantonese, Mandarin 13.5 (9.0-17.9) 12.0 (8.3-15.8) 12.8 (9.9-15.7)
Vietnamese 4.7 (1.6-7.8) 2.4 (0.5-4.3) 3.6 (1.8-5.4)
Italian 8.3 (4.3-12.3) 8.2 (5.0-11.4) 8.3 (5.7-10.8)
Greek 7.0 (3.3-10.8) 6.3 (3.2-9.4) 6.7 (4.2-9.1)
Filipino, Tagalog 2.7 (0.0-5.5) 7.2 (3.7-10.7) 4.9 (2.6-7.1)
Spanish 7.8 (4.0-11.5) 4.8 (2.1-7.4) 6.3 (4.0-8.7)
Indonesian, Bahasa 1.3 (0.2-2.3) 1.6 (0.0-3.3) 1.4 (0.4-2.4)
Hindi 5.1 (2.1-8.0) 5.7 (2.9-8.4) 5.4 (3.3-7.4)
Note: Estimates are based on 686 respondents in NSW. For this indicator 3 (0.44%) were not stated (Don’t know or Refused) in NSW. The question used was: Do you usually speak a language other than English at home?
Source: New South Wales Population Health Survey 2006 (HOIST). Centre for Epidemiology and Research, NSW Department of Health.
23
WARNIN
G: Esti
mates o
ut of
date.
Please
chec
k Hea
lthStat
s NSW
for la
test e
stimate
s.

Current employment status, persons aged 16 years and over, NSW, 2006
020406080100 0 20 40 60 80 100
Males Females
Per cent Per cent
64.8 46.7Worked for payment
or profit
3.1 4.1On paid leave
1.0 1.6Unpaid work in a
family business
1.2 1.9Other unpaid work
29.9 45.7Unemployed
ResponseMales
(95% CI)Females(95% CI)
Persons(95% CI)
Worked for payment or profit 64.8 (62.8-66.9) 46.7 (44.8-48.6) 55.7 (54.2-57.1)
On paid leave 3.1 (2.3-3.9) 4.1 (3.3-4.9) 3.6 (3.0-4.2)
Unpaid work in a family business 1.0 (0.6-1.4) 1.6 (1.1-2.1) 1.3 (1.0-1.6)
Other unpaid work 1.2 (0.8-1.6) 1.9 (1.4-2.4) 1.6 (1.3-1.9)
Unemployed 29.9 (28.0-31.8) 45.7 (43.8-47.5) 37.8 (36.5-39.2)
Note: Estimates are based on 7,951 respondents in NSW. For this indicator 11 (0.14%) were not stated (Don’t know or Refused) in NSW. The question used was: In the last week, which of the following best describes your employment status? Worked for payment or profit, worked forpayment/profit but absent on paid leave, holidays, on strike/stood down, unpaid work in a family business, other unpaid work, did not work, or did nothave a job?
Source: New South Wales Population Health Survey 2006 (HOIST). Centre for Epidemiology and Research, NSW Department of Health.
24
WARNIN
G: Esti
mates o
ut of
date.
Please
chec
k Hea
lthStat
s NSW
for la
test e
stimate
s.

Main job held last week, persons employed aged 16 years and over, NSW, 2006
020406080100 0 20 40 60 80 100
Males Females
Per cent Per cent
79.5 85.0A wage or
salary earner
7.8 6.2
Conducting
own business
with employees
12.4 7.7
Conducting
own business
without employees
0.4 1.2A helper not
receiving wages
ResponseMales
(95% CI)Females(95% CI)
Persons(95% CI)
A wage or salary earner 79.5 (77.2-81.7) 85.0 (83.0-86.9) 81.9 (80.4-83.4)
Conducting own business with employees 7.8 (6.3-9.2) 6.2 (4.8-7.5) 7.1 (6.1-8.1)
Conducting own business without employees 12.4 (10.7-14.2) 7.7 (6.2-9.1) 10.3 (9.2-11.5)
A helper not receiving wages 0.4 (0.1-0.6) 1.2 (0.7-1.8) 0.7 (0.5-1.0)
Note: Estimates are based on 3,895 respondents in NSW. For this indicator 5 (0.13%) were not stated (Don’t know or Refused) in NSW. The question used was: In the main job held in the last week were you: a wage or salary owner, conducting your own business with employees,conducting your own business without employees, a helper not receiving wages?
Source: New South Wales Population Health Survey 2006 (HOIST). Centre for Epidemiology and Research, NSW Department of Health.
25
WARNIN
G: Esti
mates o
ut of
date.
Please
chec
k Hea
lthStat
s NSW
for la
test e
stimate
s.
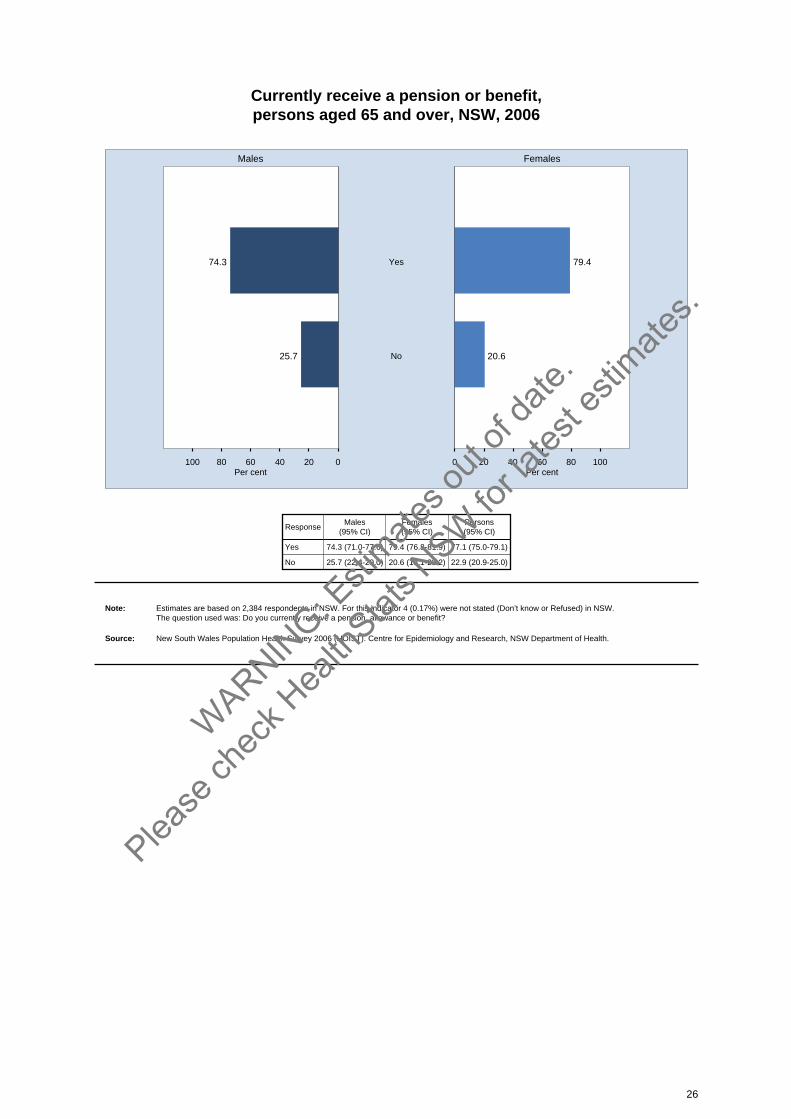
Currently receive a pension or benefit, persons aged 65 and over, NSW, 2006
020406080100 0 20 40 60 80 100
Males Females
Per cent Per cent
74.3 79.4Yes
25.7 20.6No
ResponseMales
(95% CI)Females(95% CI)
Persons(95% CI)
Yes 74.3 (71.0-77.6) 79.4 (76.8-81.9) 77.1 (75.0-79.1)
No 25.7 (22.4-29.0) 20.6 (18.1-23.2) 22.9 (20.9-25.0)
Note: Estimates are based on 2,384 respondents in NSW. For this indicator 4 (0.17%) were not stated (Don’t know or Refused) in NSW. The question used was: Do you currently receive a pension, allowance or benefit?
Source: New South Wales Population Health Survey 2006 (HOIST). Centre for Epidemiology and Research, NSW Department of Health.
26
WARNIN
G: Esti
mates o
ut of
date.
Please
chec
k Hea
lthStat
s NSW
for la
test e
stimate
s.
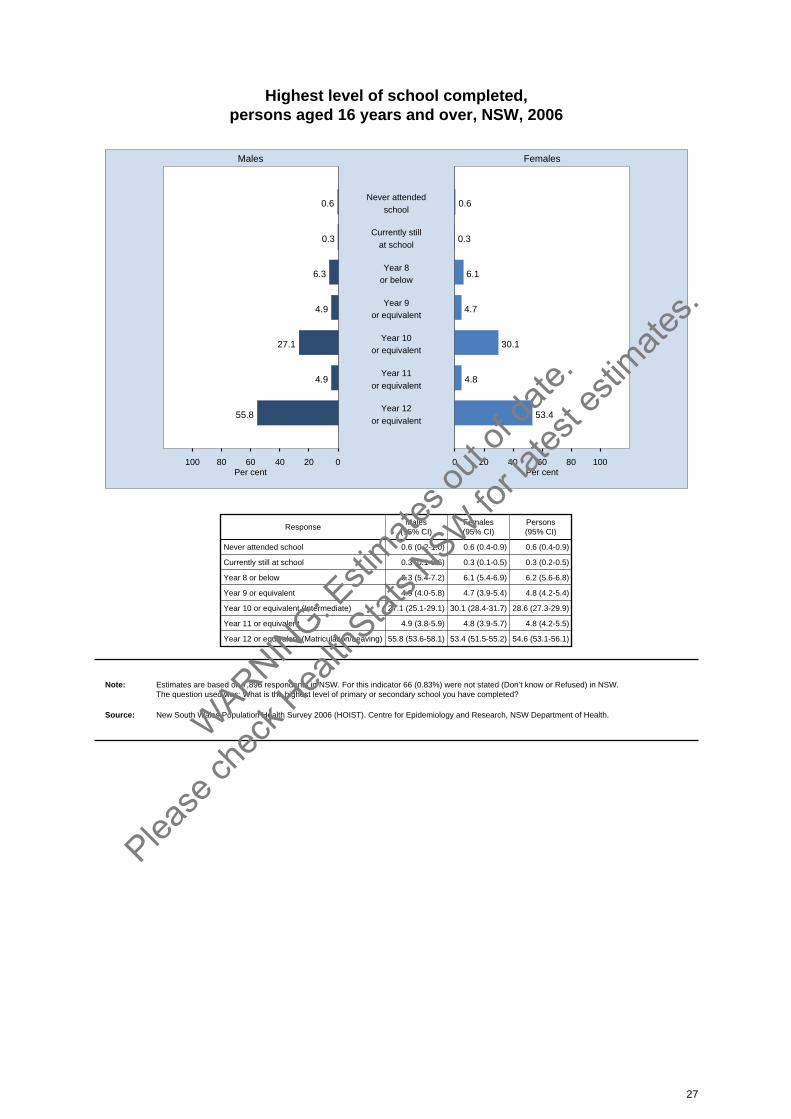
Highest level of school completed, persons aged 16 years and over, NSW, 2006
020406080100 0 20 40 60 80 100
Males Females
Per cent Per cent
0.6 0.6Never attended
school
0.3 0.3Currently still
at school
6.3 6.1Year 8
or below
4.9 4.7Year 9
or equivalent
27.1 30.1Year 10
or equivalent
4.9 4.8Year 11
or equivalent
55.8 53.4Year 12
or equivalent
ResponseMales
(95% CI)Females(95% CI)
Persons(95% CI)
Never attended school 0.6 (0.2-1.0) 0.6 (0.4-0.9) 0.6 (0.4-0.9)
Currently still at school 0.3 (0.1-0.6) 0.3 (0.1-0.5) 0.3 (0.2-0.5)
Year 8 or below 6.3 (5.4-7.2) 6.1 (5.4-6.9) 6.2 (5.6-6.8)
Year 9 or equivalent 4.9 (4.0-5.8) 4.7 (3.9-5.4) 4.8 (4.2-5.4)
Year 10 or equivalent (Intermediate) 27.1 (25.1-29.1) 30.1 (28.4-31.7) 28.6 (27.3-29.9)
Year 11 or equivalent 4.9 (3.8-5.9) 4.8 (3.9-5.7) 4.8 (4.2-5.5)
Year 12 or equivalent (Matriculation/Leaving) 55.8 (53.6-58.1) 53.4 (51.5-55.2) 54.6 (53.1-56.1)
Note: Estimates are based on 7,896 respondents in NSW. For this indicator 66 (0.83%) were not stated (Don’t know or Refused) in NSW. The question used was: What is the highest level of primary or secondary school you have completed?
Source: New South Wales Population Health Survey 2006 (HOIST). Centre for Epidemiology and Research, NSW Department of Health.
27
WARNIN
G: Esti
mates o
ut of
date.
Please
chec
k Hea
lthStat
s NSW
for la
test e
stimate
s.
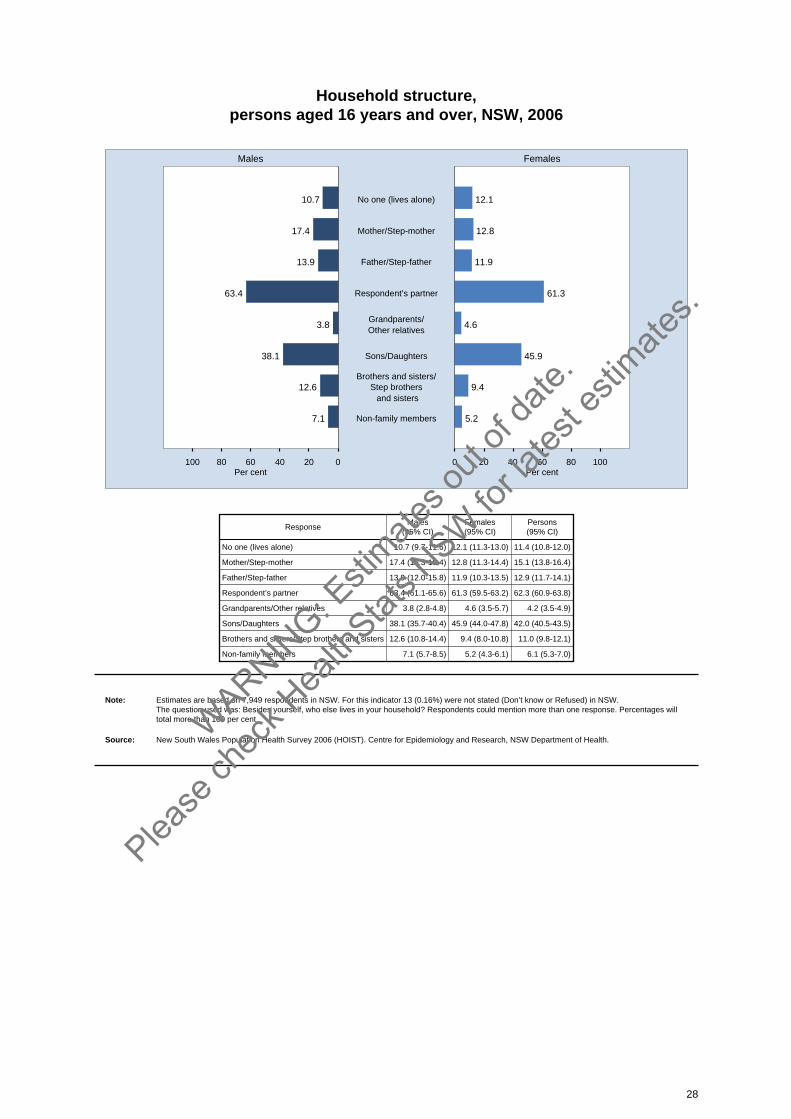
Household structure, persons aged 16 years and over, NSW, 2006
020406080100 0 20 40 60 80 100
Males Females
Per cent Per cent
10.7 12.1No one (lives alone)
17.4 12.8Mother/Step-mother
13.9 11.9Father/Step-father
63.4 61.3Respondent’s partner
3.8 4.6Grandparents/Other relatives
38.1 45.9Sons/Daughters
12.6 9.4Brothers and sisters/
Step brothers and sisters
7.1 5.2Non-family members
ResponseMales
(95% CI)Females(95% CI)
Persons(95% CI)
No one (lives alone) 10.7 (9.7-11.6) 12.1 (11.3-13.0) 11.4 (10.8-12.0)
Mother/Step-mother 17.4 (15.3-19.4) 12.8 (11.3-14.4) 15.1 (13.8-16.4)
Father/Step-father 13.9 (12.0-15.8) 11.9 (10.3-13.5) 12.9 (11.7-14.1)
Respondent’s partner 63.4 (61.1-65.6) 61.3 (59.5-63.2) 62.3 (60.9-63.8)
Grandparents/Other relatives 3.8 (2.8-4.8) 4.6 (3.5-5.7) 4.2 (3.5-4.9)
Sons/Daughters 38.1 (35.7-40.4) 45.9 (44.0-47.8) 42.0 (40.5-43.5)
Brothers and sisters/Step brothers and sisters 12.6 (10.8-14.4) 9.4 (8.0-10.8) 11.0 (9.8-12.1)
Non-family members 7.1 (5.7-8.5) 5.2 (4.3-6.1) 6.1 (5.3-7.0)
Note: Estimates are based on 7,949 respondents in NSW. For this indicator 13 (0.16%) were not stated (Don’t know or Refused) in NSW. The question used was: Besides yourself, who else lives in your household? Respondents could mention more than one response. Percentages willtotal more than 100 per cent.
Source: New South Wales Population Health Survey 2006 (HOIST). Centre for Epidemiology and Research, NSW Department of Health.
28
WARNIN
G: Esti
mates o
ut of
date.
Please
chec
k Hea
lthStat
s NSW
for la
test e
stimate
s.
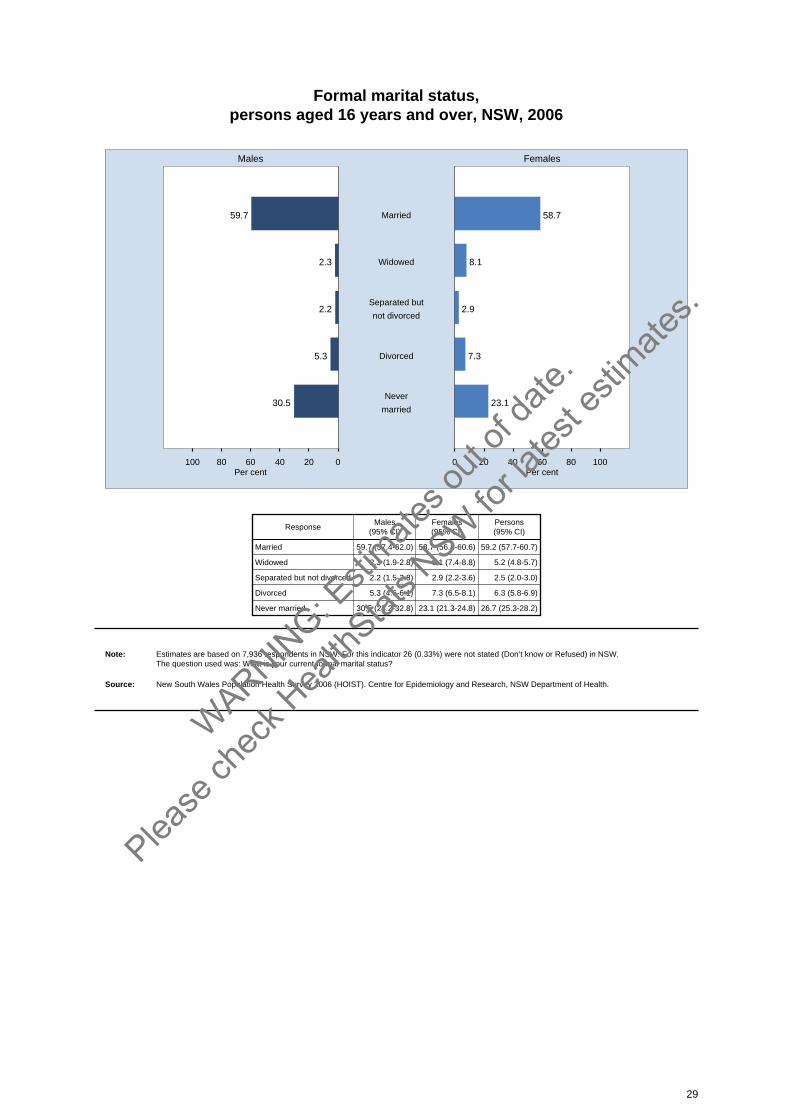
Formal marital status, persons aged 16 years and over, NSW, 2006
020406080100 0 20 40 60 80 100
Males Females
Per cent Per cent
59.7 58.7Married
2.3 8.1Widowed
2.2 2.9Separated but
not divorced
5.3 7.3Divorced
30.5 23.1Never
married
ResponseMales
(95% CI)Females(95% CI)
Persons(95% CI)
Married 59.7 (57.4-62.0) 58.7 (56.8-60.6) 59.2 (57.7-60.7)
Widowed 2.3 (1.9-2.8) 8.1 (7.4-8.8) 5.2 (4.8-5.7)
Separated but not divorced 2.2 (1.5-2.8) 2.9 (2.2-3.6) 2.5 (2.0-3.0)
Divorced 5.3 (4.6-6.1) 7.3 (6.5-8.1) 6.3 (5.8-6.9)
Never married 30.5 (28.2-32.8) 23.1 (21.3-24.8) 26.7 (25.3-28.2)
Note: Estimates are based on 7,936 respondents in NSW. For this indicator 26 (0.33%) were not stated (Don’t know or Refused) in NSW. The question used was: What is your current formal marital status?
Source: New South Wales Population Health Survey 2006 (HOIST). Centre for Epidemiology and Research, NSW Department of Health.
29
WARNIN
G: Esti
mates o
ut of
date.
Please
chec
k Hea
lthStat
s NSW
for la
test e
stimate
s.
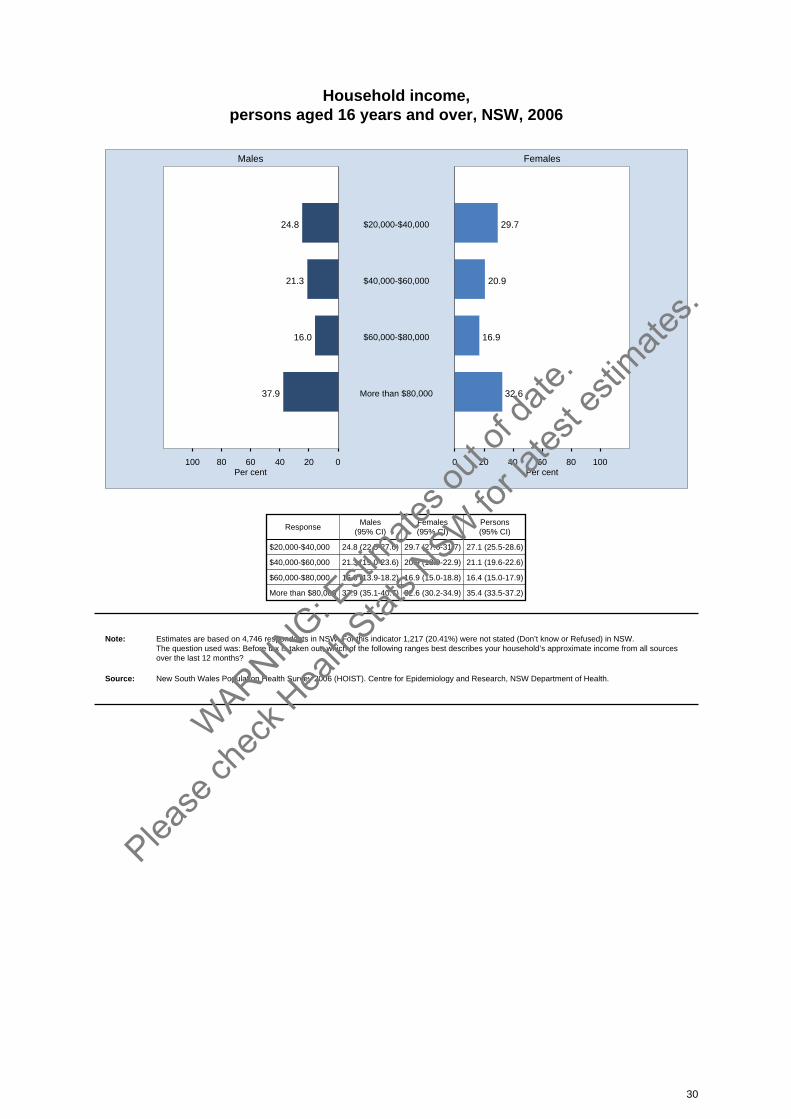
Household income, persons aged 16 years and over, NSW, 2006
020406080100 0 20 40 60 80 100
Males Females
Per cent Per cent
24.8 29.7$20,000-$40,000
21.3 20.9$40,000-$60,000
16.0 16.9$60,000-$80,000
37.9 32.6More than $80,000
ResponseMales
(95% CI)Females(95% CI)
Persons(95% CI)
$20,000-$40,000 24.8 (22.5-27.0) 29.7 (27.6-31.7) 27.1 (25.5-28.6)
$40,000-$60,000 21.3 (19.0-23.6) 20.9 (18.9-22.9) 21.1 (19.6-22.6)
$60,000-$80,000 16.0 (13.9-18.2) 16.9 (15.0-18.8) 16.4 (15.0-17.9)
More than $80,000 37.9 (35.1-40.7) 32.6 (30.2-34.9) 35.4 (33.5-37.2)
Note: Estimates are based on 4,746 respondents in NSW. For this indicator 1,217 (20.41%) were not stated (Don’t know or Refused) in NSW. The question used was: Before tax is taken out, which of the following ranges best describes your household’s approximate income from all sourcesover the last 12 months?
Source: New South Wales Population Health Survey 2006 (HOIST). Centre for Epidemiology and Research, NSW Department of Health.
30
WARNIN
G: Esti
mates o
ut of
date.
Please
chec
k Hea
lthStat
s NSW
for la
test e
stimate
s.

Number of children aged 0-5 years in the household, persons aged 16 years and over, NSW, 2006
020406080100 0 20 40 60 80 100
Males Females
Per cent Per cent
80.8 78.2No children
10.3 13.61 child
7.5 6.62 children
1.1 1.33 children
0.4 0.34 or more children
ResponseMales
(95% CI)Females(95% CI)
Persons(95% CI)
No children 80.8 (78.5-83.1) 78.2 (76.3-80.2) 79.5 (78.0-81.0)
1 child 10.3 (8.6-12.0) 13.6 (12.0-15.2) 11.9 (10.8-13.1)
2 children 7.5 (5.8-9.1) 6.6 (5.4-7.9) 7.0 (6.0-8.1)
3 children 1.1 (0.5-1.8) 1.3 (0.6-1.9) 1.2 (0.8-1.6)
4 or more children 0.4 (0.0-0.8) 0.3 (0.0-0.5) 0.3 (0.1-0.6)
Note: Estimates are based on 5,728 respondents in NSW. For this indicator 0 (0.00%) were not stated (Don’t know or Refused) in NSW. The question used was: Can you please tell me how many children under 6 years of age live in this household?
Source: New South Wales Population Health Survey 2006 (HOIST). Centre for Epidemiology and Research, NSW Department of Health.
31
WARNIN
G: Esti
mates o
ut of
date.
Please
chec
k Hea
lthStat
s NSW
for la
test e
stimate
s.
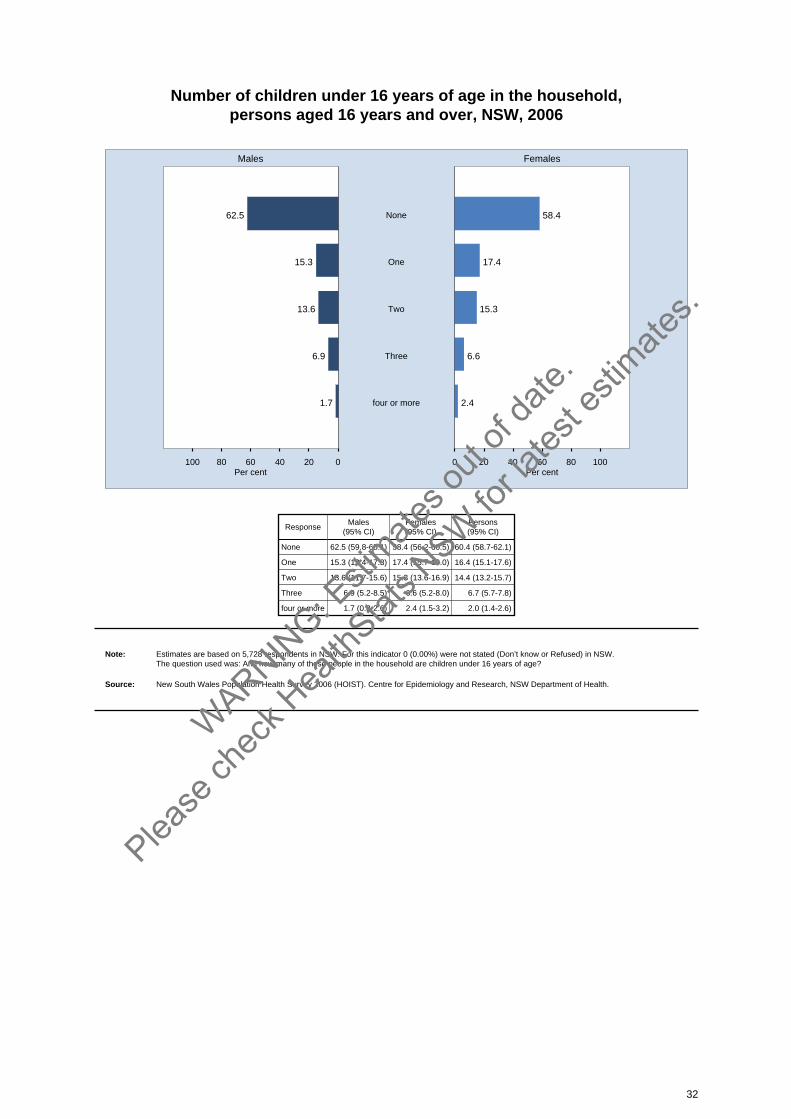
Number of children under 16 years of age in the household, persons aged 16 years and over, NSW, 2006
020406080100 0 20 40 60 80 100
Males Females
Per cent Per cent
62.5 58.4None
15.3 17.4One
13.6 15.3Two
6.9 6.6Three
1.7 2.4four or more
ResponseMales
(95% CI)Females(95% CI)
Persons(95% CI)
None 62.5 (59.8-65.1) 58.4 (56.2-60.5) 60.4 (58.7-62.1)
One 15.3 (13.4-17.3) 17.4 (15.7-19.0) 16.4 (15.1-17.6)
Two 13.6 (11.7-15.6) 15.3 (13.6-16.9) 14.4 (13.2-15.7)
Three 6.9 (5.2-8.5) 6.6 (5.2-8.0) 6.7 (5.7-7.8)
four or more 1.7 (0.8-2.6) 2.4 (1.5-3.2) 2.0 (1.4-2.6)
Note: Estimates are based on 5,728 respondents in NSW. For this indicator 0 (0.00%) were not stated (Don’t know or Refused) in NSW. The question used was: And how many of these people in the household are children under 16 years of age?
Source: New South Wales Population Health Survey 2006 (HOIST). Centre for Epidemiology and Research, NSW Department of Health.
32
WARNIN
G: Esti
mates o
ut of
date.
Please
chec
k Hea
lthStat
s NSW
for la
test e
stimate
s.

Number of people aged 65 years and over in the household, persons aged 16 years and over, NSW, 2006
020406080100 0 20 40 60 80 100
Males Females
Per cent Per cent
81.0 80.8No people 65+
7.3 7.81 person 65+
11.5 11.22 people 65+
0.2 0.23 or more people
ResponseMales
(95% CI)Females(95% CI)
Persons(95% CI)
No people 65+ 81.0 (79.3-82.8) 80.8 (79.3-82.2) 80.9 (79.8-82.0)
1 person 65+ 7.3 (6.1-8.5) 7.8 (6.7-8.9) 7.5 (6.7-8.4)
2 people 65+ 11.5 (10.2-12.7) 11.2 (10.2-12.3) 11.4 (10.5-12.2)
3 or more people 0.2 (0.0-0.4) 0.2 (0.0-0.4) 0.2 (0.1-0.3)
Note: Estimates are based on 5,728 respondents in NSW. For this indicator 0 (0.00%) were not stated (Don’t know or Refused) in NSW. The question used was: Can you please tell me how hmany people aged 65 years old or over live in this household?
Source: New South Wales Population Health Survey 2006 (HOIST). Centre for Epidemiology and Research, NSW Department of Health.
33
WARNIN
G: Esti
mates o
ut of
date.
Please
chec
k Hea
lthStat
s NSW
for la
test e
stimate
s.
Health behaviours
Health behaviours directly influence preventable morbidity and mortality throughout adulthood. Thischapter reports on alcohol, cancer screening (breast and cervical, and hysterectomy rate),environmental health (water quality and home heating), food handling, immunisation (influenza,pneumococcal, and meningococcal), injury prevention (fire safety measures in the home andswimming ability), nutrition, physical activity (adequate physical activity and neighbourhood facilities,and smoking (including current and daily smoking, smoke-fee homes and cars, and smoking inlicenced premises and outdoor dining areas).
Alcohol
IntroductionExcessive alcohol consumption is associated with a variety of adverse health consequences includingcirrhosis of the liver, mental illness, several types of cancer, pancreatitis, and fetal growth retardation.Adverse social effects include aggressive behaviour, family disruption, and reduced productivity. Ingeneral, higher levels of consumption are associated with higher levels of harm; however, high rates ofharm have been found among low to moderate drinkers on the occasions they drink to intoxication.[1]In Australia, alcohol is second only to tobacco as a cause of preventable morbidity and mortality.[2,3]The NSW Health Drug and Alcohol Plan 2006-2010 outlines the NSW Government’s commitment toreduce the problems caused by alcohol use.[4]
In 2006, the New South Wales Population Health Survey asked respondents: How often do youusually drink alcohol? On a day when you drink alcohol, how many standard drinks do you usuallyhave? In the last 4 weeks how often have you had more than 4 [if male] or 2 [if female] drinks in aday? In the last 4 weeks how often have you had 7-10 [if male] or 5-6 [if female] drinks in a day? In thelast 4 weeks, how often have you had 11 or more [if male] or 7 or more [if female] drinks in a day?
Any risk drinking behaviour was defined as per Guideline 1 of the Australian Alcohol Guidelines,[5] asone or more of the following: consuming alcohol every day, consuming on average more than 4 if maleor 2 if female standard drinks per day, or consuming more than 6 if male or 4 if female standard drinkson any occasion in the last 4 weeks.
High risk alcohol drinking was categorised into low risk (having consumed up to 6 standard drinks onany one day if male, or up to 4 drinks if female); risky (having consumed 7-10 standard drinks on anyone day if male, and 5-6 if female); and high risk (having consumed 11 or more standard drinks in anyone day if male, and 7 or more if female), as per Guideline 1 of the Australian Alcohol Guidelines.[5]
Results
Any risk drinking behaviour
In 2006, just under one third of adults (32.8 per cent) reported any risk drinking behaviour. Theproportion of males (37.3 per cent) reporting any risk drinking behaviour was significantly higher thanfemales (28.4 per cent).
Among males, there was no significant variation among age groups, compared with the overall adultmale population. Among females, risk drinking decreased significantly with age. A significantly higherproportion of those aged 16-24 years (39.6 per cent) and 25-34 years (36.0 per cent), and asignificantly lower proportion of those aged 55-64 per cent (21.3 per cent) and 65-74 years (20.3 percent) and over 75 years (16.8 per cent), undertook any risk drinking behaviour, compared with theoverall adult female population.
Risk drinking increased with socioeconomic disadvantage. A higher proportion of adults (37.0 percent) in the most disadvantaged quintile, and a lower proportion of adults (27.4 per cent) in the leastdisadvantaged quintile, undertook any risk drinking behaviours, compared with the overall adult
34
WARNIN
G: Esti
mates o
ut of
date.
Please
chec
k Hea
lthStat
s NSW
for la
test e
stimate
s.
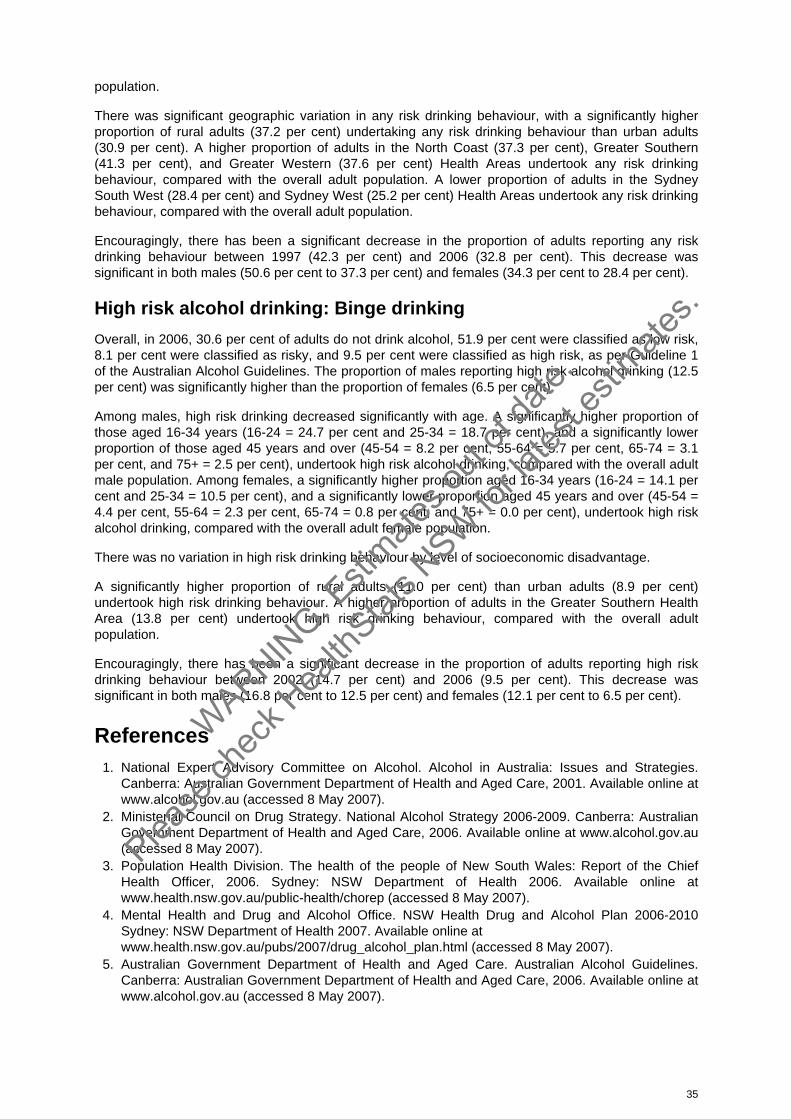
population.
There was significant geographic variation in any risk drinking behaviour, with a significantly higherproportion of rural adults (37.2 per cent) undertaking any risk drinking behaviour than urban adults(30.9 per cent). A higher proportion of adults in the North Coast (37.3 per cent), Greater Southern(41.3 per cent), and Greater Western (37.6 per cent) Health Areas undertook any risk drinkingbehaviour, compared with the overall adult population. A lower proportion of adults in the SydneySouth West (28.4 per cent) and Sydney West (25.2 per cent) Health Areas undertook any risk drinkingbehaviour, compared with the overall adult population.
Encouragingly, there has been a significant decrease in the proportion of adults reporting any riskdrinking behaviour between 1997 (42.3 per cent) and 2006 (32.8 per cent). This decrease wassignificant in both males (50.6 per cent to 37.3 per cent) and females (34.3 per cent to 28.4 per cent).
High risk alcohol drinking: Binge drinking
Overall, in 2006, 30.6 per cent of adults do not drink alcohol, 51.9 per cent were classified as low risk,8.1 per cent were classified as risky, and 9.5 per cent were classified as high risk, as per Guideline 1of the Australian Alcohol Guidelines. The proportion of males reporting high risk alcohol drinking (12.5per cent) was significantly higher than the proportion of females (6.5 per cent).
Among males, high risk drinking decreased significantly with age. A significantly higher proportion ofthose aged 16-34 years (16-24 = 24.7 per cent and 25-34 = 18.7 per cent), and a significantly lowerproportion of those aged 45 years and over (45-54 = 8.2 per cent, 55-64 = 5.7 per cent, 65-74 = 3.1per cent, and 75+ = 2.5 per cent), undertook high risk alcohol drinking, compared with the overall adultmale population. Among females, a significantly higher proportion aged 16-34 years (16-24 = 14.1 percent and 25-34 = 10.5 per cent), and a significantly lower proportion aged 45 years and over (45-54 =4.4 per cent, 55-64 = 2.3 per cent, 65-74 = 0.8 per cent, and 75+ = 0.0 per cent), undertook high riskalcohol drinking, compared with the overall adult female population.
There was no variation in high risk drinking behaviour by level of socioeconomic disadvantage.
A significantly higher proportion of rural adults (11.0 per cent) than urban adults (8.9 per cent)undertook high risk drinking behaviour. A higher proportion of adults in the Greater Southern HealthArea (13.8 per cent) undertook high risk drinking behaviour, compared with the overall adult population.
Encouragingly, there has been a significant decrease in the proportion of adults reporting high riskdrinking behaviour between 2002 (14.7 per cent) and 2006 (9.5 per cent). This decrease wassignificant in both males (16.8 per cent to 12.5 per cent) and females (12.1 per cent to 6.5 per cent).
References1. National Expert Advisory Committee on Alcohol. Alcohol in Australia: Issues and Strategies.
Canberra: Australian Government Department of Health and Aged Care, 2001. Available online atwww.alcohol.gov.au (accessed 8 May 2007).
2. Ministerial Council on Drug Strategy. National Alcohol Strategy 2006-2009. Canberra: AustralianGovernment Department of Health and Aged Care, 2006. Available online at www.alcohol.gov.au(accessed 8 May 2007).
3. Population Health Division. The health of the people of New South Wales: Report of the ChiefHealth Officer, 2006. Sydney: NSW Department of Health 2006. Available online atwww.health.nsw.gov.au/public-health/chorep (accessed 8 May 2007).
4. Mental Health and Drug and Alcohol Office. NSW Health Drug and Alcohol Plan 2006-2010Sydney: NSW Department of Health 2007. Available online atwww.health.nsw.gov.au/pubs/2007/drug_alcohol_plan.html (accessed 8 May 2007).
5. Australian Government Department of Health and Aged Care. Australian Alcohol Guidelines.Canberra: Australian Government Department of Health and Aged Care, 2006. Available online atwww.alcohol.gov.au (accessed 8 May 2007).
35
WARNIN
G: Esti
mates o
ut of
date.
Please
chec
k Hea
lthStat
s NSW
for la
test e
stimate
s.

Alcohol drinking by risk, persons aged 16 years and over, NSW, 2006
020406080100 0 20 40 60 80 100
Males Females
Per cent Per cent
22.4 38.6Does not drink
55.0 48.8Low Risk
10.2 6.1Risky
12.5 6.5High Risk
ResponseMales
(95% CI)Females(95% CI)
Persons(95% CI)
Does not drink 22.4 (20.5-24.3) 38.6 (36.8-40.5) 30.6 (29.2-31.9)
Low Risk 55.0 (52.7-57.3) 48.8 (46.9-50.7) 51.9 (50.4-53.4)
Risky 10.2 (8.7-11.6) 6.1 (5.2-7.0) 8.1 (7.2-9.0)
High Risk 12.5 (10.9-14.1) 6.5 (5.5-7.5) 9.5 (8.5-10.4)
Note: Estimates are based on 7,904 respondents in NSW. For this indicator 37 (0.47%) were not stated (Don’t know or Refused) in NSW. The questions used were: How often do you usually drink alcohol? In the last 4 weeks have you had more than [2 if female/4 if male] drinks in a day?In the last 4 weeks how often have you had [7-10 if male/5-6 if female] drinks in a day? and In the last 4 weeks how often have you had [11 or more ifmale/7 or more if female] drinks in a day? Based on the NHMRC Australian Alcohol Guidelines.
Source: New South Wales Population Health Survey 2006 (HOIST). Centre for Epidemiology and Research, NSW Department of Health.
36
WARNIN
G: Esti
mates o
ut of
date.
Please
chec
k Hea
lthStat
s NSW
for la
test e
stimate
s.

Risk alcohol drinking by age, persons aged 16 years and over, NSW, 2006
020406080100 0 20 40 60 80 100
Males Females
Per cent Per cent
32.1 16.875+
Age (years)
34.6 20.365-74
32.5 21.355-64
36.6 25.645-54
34.5 30.635-44
43.5 36.025-34
42.7 39.616-24
37.3 28.4All Ages
Age(years)
Males(95% CI)
Females(95% CI)
Persons(95% CI)
16-24 42.7 (36.1-49.2) 39.6 (33.5-45.7) 41.2 (36.7-45.7)
25-34 43.5 (36.6-50.5) 36.0 (30.8-41.2) 39.7 (35.4-44.1)
35-44 34.5 (29.1-40.0) 30.6 (26.3-34.8) 32.6 (29.1-36.0)
45-54 36.6 (31.8-41.4) 25.6 (22.2-29.1) 31.1 (28.1-34.1)
55-64 32.5 (28.1-36.8) 21.3 (18.2-24.4) 26.9 (24.2-29.6)
65-74 34.6 (29.9-39.4) 20.3 (16.8-23.8) 27.3 (24.3-30.2)
75+ 32.1 (26.8-37.4) 16.8 (13.4-20.2) 23.1 (20.1-26.2)
All Ages 37.3 (35.0-39.6) 28.4 (26.7-30.2) 32.8 (31.4-34.2)
Note: Estimates are based on 7,883 respondents in NSW. For this indicator 79 (0.99%) were not stated (Don’t know or Refused) in NSW. The indicator includes those who exceed Guideline 1 of the NHMRC Australian Alcohol Guidelines, as 1 or more of the following: consuming alcoholevery day, consuming on average more than [4 if male/2 if female] standard drinks, consuming more than [6 if male/4 if female] on any 1 occasion orday. The questions used to define the indicator were: How often do you usually drink alcohol? On a day when you drink alcohol, how many standarddrinks do you usually have? In the last 4 weeks have you had more than [7-10 if male/5-6 if female] drinks in a day? and In the last 4 weeks how oftenhave you had [11+ if male/7+ if female] drinks in a day? The questions used to define the 1997 and 1998 indicator were: How often do you have analcoholic drink of any kind? On a day when you have alcoholic drinks, how many standard drinks do you usually have? and On the last occasion youhad more than [4 if male/2 if female] drinks in a day, how many drinks did you actually have?
Source: New South Wales Population Health Survey 2006 (HOIST). Centre for Epidemiology and Research, NSW Department of Health.
37
WARNIN
G: Esti
mates o
ut of
date.
Please
chec
k Hea
lthStat
s NSW
for la
test e
stimate
s.
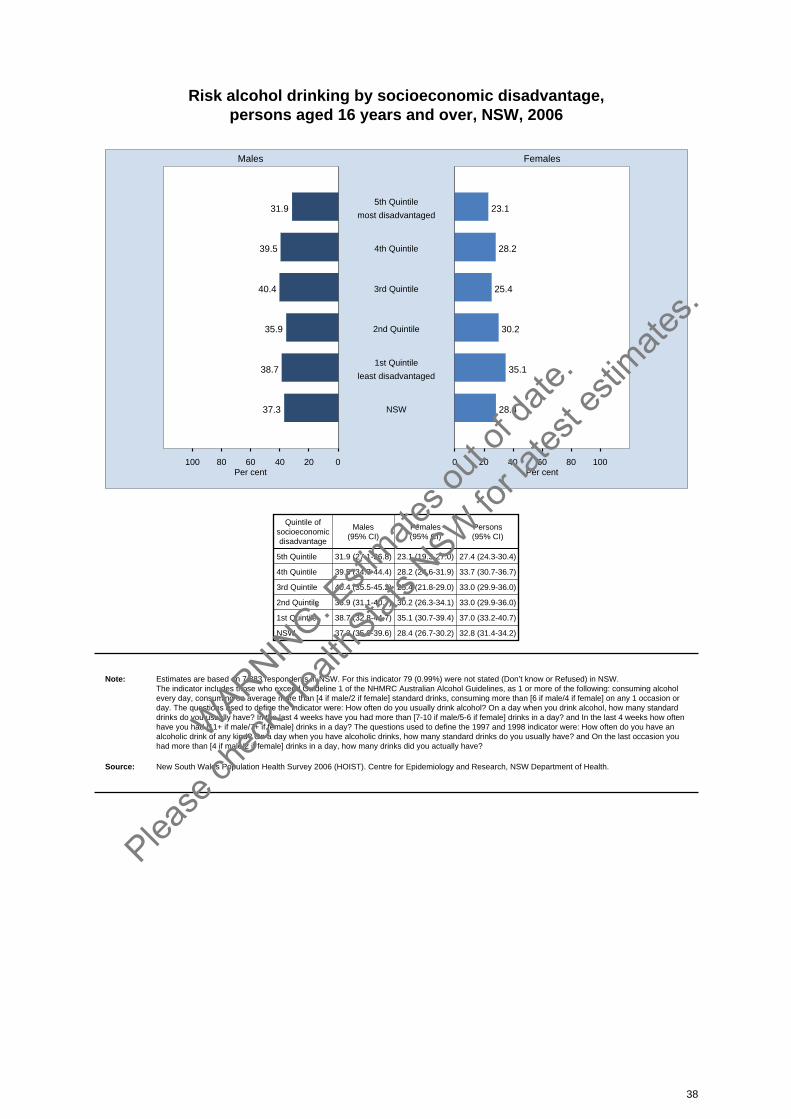
Risk alcohol drinking by socioeconomic disadvantage, persons aged 16 years and over, NSW, 2006
020406080100 0 20 40 60 80 100
Males Females
Per cent Per cent
31.9 23.15th Quintile
most disadvantaged
39.5 28.24th Quintile
40.4 25.43rd Quintile
35.9 30.22nd Quintile
38.7 35.11st Quintile
least disadvantaged
37.3 28.4NSW
Quintile ofsocioeconomicdisadvantage
Males(95% CI)
Females(95% CI)
Persons(95% CI)
5th Quintile 31.9 (27.1-36.8) 23.1 (19.3-27.0) 27.4 (24.3-30.4)
4th Quintile 39.5 (34.7-44.4) 28.2 (24.6-31.9) 33.7 (30.7-36.7)
3rd Quintile 40.4 (35.5-45.2) 25.4 (21.8-29.0) 33.0 (29.9-36.0)
2nd Quintile 35.9 (31.1-40.7) 30.2 (26.3-34.1) 33.0 (29.9-36.0)
1st Quintile 38.7 (32.8-44.7) 35.1 (30.7-39.4) 37.0 (33.2-40.7)
NSW 37.3 (35.0-39.6) 28.4 (26.7-30.2) 32.8 (31.4-34.2)
Note: Estimates are based on 7,883 respondents in NSW. For this indicator 79 (0.99%) were not stated (Don’t know or Refused) in NSW. The indicator includes those who exceed Guideline 1 of the NHMRC Australian Alcohol Guidelines, as 1 or more of the following: consuming alcoholevery day, consuming on average more than [4 if male/2 if female] standard drinks, consuming more than [6 if male/4 if female] on any 1 occasion orday. The questions used to define the indicator were: How often do you usually drink alcohol? On a day when you drink alcohol, how many standarddrinks do you usually have? In the last 4 weeks have you had more than [7-10 if male/5-6 if female] drinks in a day? and In the last 4 weeks how oftenhave you had [11+ if male/7+ if female] drinks in a day? The questions used to define the 1997 and 1998 indicator were: How often do you have analcoholic drink of any kind? On a day when you have alcoholic drinks, how many standard drinks do you usually have? and On the last occasion youhad more than [4 if male/2 if female] drinks in a day, how many drinks did you actually have?
Source: New South Wales Population Health Survey 2006 (HOIST). Centre for Epidemiology and Research, NSW Department of Health.
38
WARNIN
G: Esti
mates o
ut of
date.
Please
chec
k Hea
lthStat
s NSW
for la
test e
stimate
s.
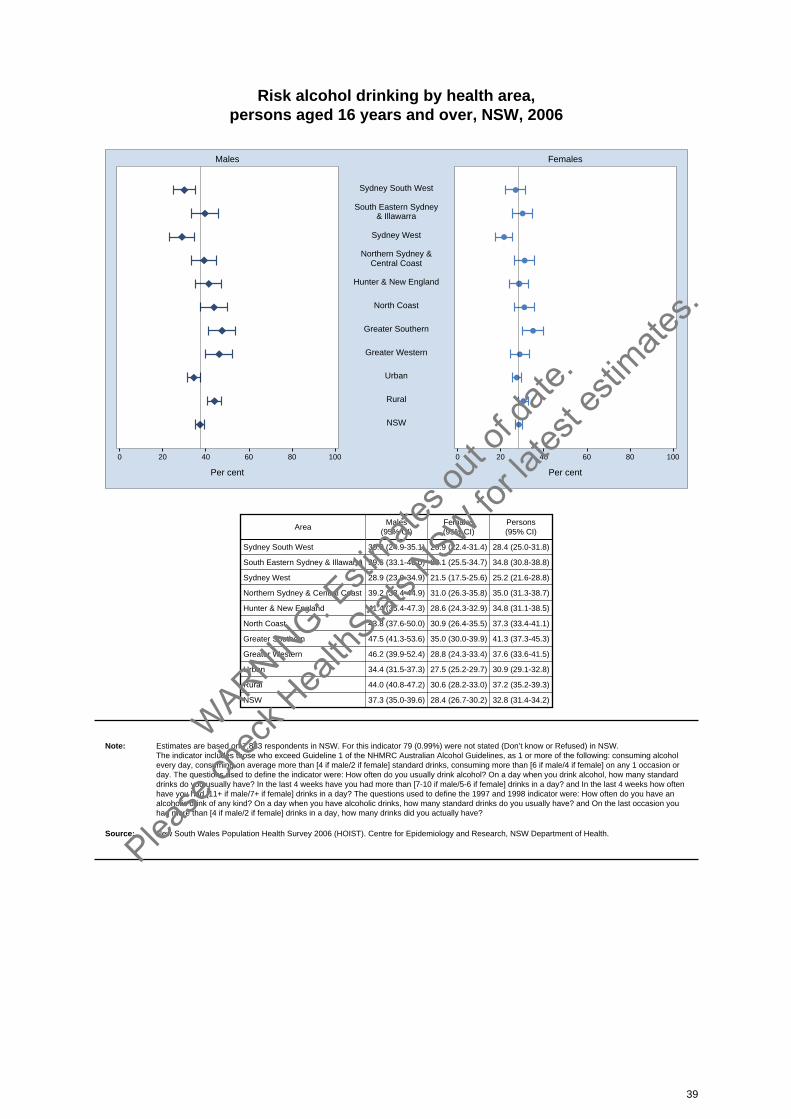
Risk alcohol drinking by health area, persons aged 16 years and over, NSW, 2006
0 20 40 60 80 100 0 20 40 60 80 100
Males Females
Per cent Per cent
Sydney South West
South Eastern Sydney& Illawarra
Sydney West
Northern Sydney &Central Coast
Hunter & New England
North Coast
Greater Southern
Greater Western
Urban
Rural
NSW
AreaMales
(95% CI)Females(95% CI)
Persons(95% CI)
Sydney South West 30.0 (24.9-35.1) 26.9 (22.4-31.4) 28.4 (25.0-31.8)
South Eastern Sydney & Illawarra 39.6 (33.1-46.0) 30.1 (25.5-34.7) 34.8 (30.8-38.8)
Sydney West 28.9 (23.0-34.9) 21.5 (17.5-25.6) 25.2 (21.6-28.8)
Northern Sydney & Central Coast 39.2 (33.4-44.9) 31.0 (26.3-35.8) 35.0 (31.3-38.7)
Hunter & New England 41.4 (35.4-47.3) 28.6 (24.3-32.9) 34.8 (31.1-38.5)
North Coast 43.8 (37.6-50.0) 30.9 (26.4-35.5) 37.3 (33.4-41.1)
Greater Southern 47.5 (41.3-53.6) 35.0 (30.0-39.9) 41.3 (37.3-45.3)
Greater Western 46.2 (39.9-52.4) 28.8 (24.3-33.4) 37.6 (33.6-41.5)
Urban 34.4 (31.5-37.3) 27.5 (25.2-29.7) 30.9 (29.1-32.8)
Rural 44.0 (40.8-47.2) 30.6 (28.2-33.0) 37.2 (35.2-39.3)
NSW 37.3 (35.0-39.6) 28.4 (26.7-30.2) 32.8 (31.4-34.2)
Note: Estimates are based on 7,883 respondents in NSW. For this indicator 79 (0.99%) were not stated (Don’t know or Refused) in NSW. The indicator includes those who exceed Guideline 1 of the NHMRC Australian Alcohol Guidelines, as 1 or more of the following: consuming alcoholevery day, consuming on average more than [4 if male/2 if female] standard drinks, consuming more than [6 if male/4 if female] on any 1 occasion orday. The questions used to define the indicator were: How often do you usually drink alcohol? On a day when you drink alcohol, how many standarddrinks do you usually have? In the last 4 weeks have you had more than [7-10 if male/5-6 if female] drinks in a day? and In the last 4 weeks how oftenhave you had [11+ if male/7+ if female] drinks in a day? The questions used to define the 1997 and 1998 indicator were: How often do you have analcoholic drink of any kind? On a day when you have alcoholic drinks, how many standard drinks do you usually have? and On the last occasion youhad more than [4 if male/2 if female] drinks in a day, how many drinks did you actually have?
Source: New South Wales Population Health Survey 2006 (HOIST). Centre for Epidemiology and Research, NSW Department of Health.
39
WARNIN
G: Esti
mates o
ut of
date.
Please
chec
k Hea
lthStat
s NSW
for la
test e
stimate
s.
High risk alcohol drinking by age, persons aged 16 years and over, NSW, 2006
020406080100 0 20 40 60 80 100
Males Females
Per cent Per cent
2.5 0.075+
Age (years)
3.1 0.865-74
5.7 2.355-64
8.2 4.445-54
13.9 8.235-44
18.7 10.525-34
24.7 14.116-24
12.5 6.5All Ages
Age(years)
Males(95% CI)
Females(95% CI)
Persons(95% CI)
16-24 24.7 (18.9-30.4) 14.1 (9.7-18.5) 19.6 (15.9-23.2)
25-34 18.7 (13.6-23.9) 10.5 (7.4-13.7) 14.6 (11.6-17.7)
35-44 13.9 (10.2-17.7) 8.2 (5.7-10.8) 11.1 (8.8-13.4)
45-54 8.2 (5.5-10.8) 4.4 (3.0-5.9) 6.3 (4.8-7.8)
55-64 5.7 (3.6-7.7) 2.3 (0.9-3.8) 4.0 (2.7-5.3)
65-74 3.1 (1.5-4.8) 0.8 (0.0-1.6) 1.9 (1.0-2.8)
75+ 2.5 (0.5-4.5) 0.0 (0.0-0.1) 1.1 (0.2-1.9)
All Ages 12.5 (10.9-14.1) 6.5 (5.5-7.6) 9.5 (8.6-10.5)
Note: Estimates are based on 7,931 respondents in NSW. For this indicator 31 (0.39%) were not stated (Don’t know or Refused) in NSW. The indicator includes those who consume alcohol and have had [11 or more if male/7 or more if female] drinks in a day. The questions used to definethe indicator were: How often do you usually drink alcohol? and In the last 4 weeks how often have you had [11 or more if male/7 or more if female]drinks in a day? Based on the NHMRC Australian Alcohol Guidelines.
Source: New South Wales Population Health Survey 2006 (HOIST). Centre for Epidemiology and Research, NSW Department of Health.
40
WARNIN
G: Esti
mates o
ut of
date.
Please
chec
k Hea
lthStat
s NSW
for la
test e
stimate
s.
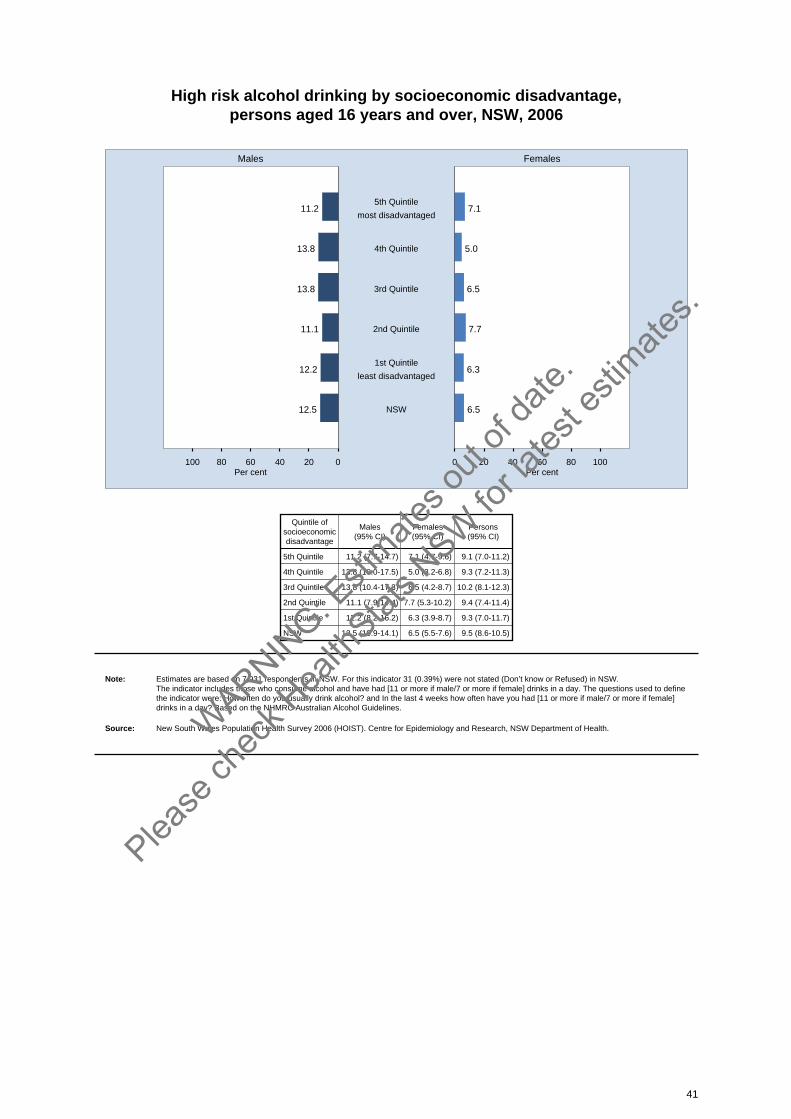
High risk alcohol drinking by socioeconomic disadvantage, persons aged 16 years and over, NSW, 2006
020406080100 0 20 40 60 80 100
Males Females
Per cent Per cent
11.2 7.15th Quintile
most disadvantaged
13.8 5.04th Quintile
13.8 6.53rd Quintile
11.1 7.72nd Quintile
12.2 6.31st Quintile
least disadvantaged
12.5 6.5NSW
Quintile ofsocioeconomicdisadvantage
Males(95% CI)
Females(95% CI)
Persons(95% CI)
5th Quintile 11.2 (7.7-14.7) 7.1 (4.7-9.6) 9.1 (7.0-11.2)
4th Quintile 13.8 (10.0-17.5) 5.0 (3.2-6.8) 9.3 (7.2-11.3)
3rd Quintile 13.8 (10.4-17.3) 6.5 (4.2-8.7) 10.2 (8.1-12.3)
2nd Quintile 11.1 (7.9-14.4) 7.7 (5.3-10.2) 9.4 (7.4-11.4)
1st Quintile 12.2 (8.2-16.2) 6.3 (3.9-8.7) 9.3 (7.0-11.7)
NSW 12.5 (10.9-14.1) 6.5 (5.5-7.6) 9.5 (8.6-10.5)
Note: Estimates are based on 7,931 respondents in NSW. For this indicator 31 (0.39%) were not stated (Don’t know or Refused) in NSW. The indicator includes those who consume alcohol and have had [11 or more if male/7 or more if female] drinks in a day. The questions used to definethe indicator were: How often do you usually drink alcohol? and In the last 4 weeks how often have you had [11 or more if male/7 or more if female]drinks in a day? Based on the NHMRC Australian Alcohol Guidelines.
Source: New South Wales Population Health Survey 2006 (HOIST). Centre for Epidemiology and Research, NSW Department of Health.
41
WARNIN
G: Esti
mates o
ut of
date.
Please
chec
k Hea
lthStat
s NSW
for la
test e
stimate
s.

High risk alcohol drinking by health area, persons aged 16 years and over, NSW, 2006
0 20 40 60 80 100 0 20 40 60 80 100
Males Females
Per cent Per cent
Sydney South West
South Eastern Sydney& Illawarra
Sydney West
Northern Sydney &Central Coast
Hunter & New England
North Coast
Greater Southern
Greater Western
Urban
Rural
NSW
AreaMales
(95% CI)Females(95% CI)
Persons(95% CI)
Sydney South West 11.3 (7.6-15.1) 7.4 (4.5-10.2) 9.3 (7.0-11.7)
South Eastern Sydney & Illawarra 12.2 (8.0-16.4) 6.3 (3.8-8.9) 9.3 (6.8-11.8)
Sydney West 10.0 (5.8-14.1) 4.9 (2.7-7.2) 7.4 (5.1-9.8)
Northern Sydney & Central Coast 12.6 (8.3-16.8) 6.0 (3.4-8.6) 9.2 (6.7-11.7)
Hunter & New England 10.5 (6.9-14.2) 7.2 (4.5-9.9) 8.8 (6.6-11.1)
North Coast 15.7 (10.4-21.0) 6.8 (4.2-9.5) 11.2 (8.2-14.2)
Greater Southern 20.3 (14.8-25.9) 7.1 (3.9-10.4) 13.8 (10.5-17.1)
Greater Western 16.4 (11.3-21.5) 8.1 (5.2-11.0) 12.3 (9.3-15.3)
Urban 11.5 (9.5-13.6) 6.3 (4.9-7.6) 8.9 (7.7-10.1)
Rural 14.8 (12.4-17.2) 7.2 (5.7-8.7) 11.0 (9.5-12.4)
NSW 12.5 (10.9-14.1) 6.5 (5.5-7.6) 9.5 (8.6-10.5)
Note: Estimates are based on 7,931 respondents in NSW. For this indicator 31 (0.39%) were not stated (Don’t know or Refused) in NSW. The indicator includes those who consume alcohol and have had [11 or more if male/7 or more if female] drinks in a day. The questions used to definethe indicator were: How often do you usually drink alcohol? and In the last 4 weeks how often have you had [11 or more if male/7 or more if female]drinks in a day? Based on the NHMRC Australian Alcohol Guidelines.
Source: New South Wales Population Health Survey 2006 (HOIST). Centre for Epidemiology and Research, NSW Department of Health.
42
WARNIN
G: Esti
mates o
ut of
date.
Please
chec
k Hea
lthStat
s NSW
for la
test e
stimate
s.
Cancer screening: breast and cervical
IntroductionIn New South Wales in 2004, breast cancer accounted for 27.4 per cent of all cancers in females, andwas the most common cause of cancer death in females. The median age at diagnosis of breastcancer in females was 59 years.[1] BreastScreen NSW offers women aged 50-69 years a freescreening mammogram every 2 years.[2] A screening mammogram differs from a diagnosticmammogram in that screening is conducted on females who have no history of breast cancer and nobreast problems or symptoms at the time the mammogram is taken. The NSW Cancer Plan2007-2010 outlines the NSW Government’s commitment to further reducing the effects of breast cancer.[3]
In New South Wales in 2004, cervical cancer accounted for 1.7 per cent of all cancers in females, and1.4 per cent of cancer deaths in females. The median age at diagnosis of cervical cancer was 48 years.[1] The NSW Cervical Screening Program encourages all females aged 18-69 years to have aPap test every 2 years, because cervical cancer is largely preventable if detected early and treatedappropriately. Cervical screening prevents around 90 per cent of cervical cancers.[4] The NSW CancerPlan 2007-2010 outlines the NSW Government’s commitment to further reducing the effects of cervical cancer.[3]
In 2006, the New South Wales Population Health Survey asked females aged 50-69 years: Have youever had a mammogram? When did you last have a mammogram? Can you tell me all the reasonswhy you had your last mammogram? Do you have mammograms regularly? What is the usual timeperiod between your mammograms? Females aged 20-69 years were asked: Have you ever had aPap test? When did you last have a Pap test? Do you have a Pap test regularly? What is the usualtime period between your Pap tests? Have you ever had a hysterectomy?
Results
Breast cancer screening
To establish the proportion of females who have screening mammograms, females who had a breastproblem, or had breast cancer in the past, were excluded from the data.
In 2006, 76.2 per cent of females aged 50-69 years had a screening mammogram within the last 2years. A significantly higher proportion of females aged 55-59 years (82.5 per cent) and 65-69 years(84.2 per cent), and a significantly lower proportion of females aged 50-54 years (63.5 per cent), had ascreening mammogram within the last 2 years.
There was no significant variation in the proportion of females aged 50-69 years having a screeningmammogram in the last 2 years between urban areas and rural areas, or among health areas, or bysocioeconomic status.
There was no significant difference in the proportion of females aged 50-69 years having a screeningmammogram in the last 2 years between 1997 and 2006.
Cervical cancer screening
To establish the proportion of females who have Pap tests, females who ever had a hysterectomywere excluded from the data.
In 2006, 72.8 per cent of females aged 20-69 years had a Pap test in the past 2 years. A significantlylower proportion of females aged 20-24 years (51.9 per cent) had a Pap test in the past 2 years. Asignificantly higher proportion of females aged 35-39 years (79.7 per cent), 40-44 years (78.5 percent), 45-49 years (78.8 per cent), and 50-54 years (79.5 per cent), had a Pap test within the last 2years, compared with the overall adult female population aged 20-69 years.
43
WARNIN
G: Esti
mates o
ut of
date.
Please
chec
k Hea
lthStat
s NSW
for la
test e
stimate
s.
A significantly higher proportion of females in rural areas (77.8 per cent) than urban areas (70.8 percent) had a Pap test within the last 2 years. A significantly higher proportion of females in the Hunter &New England Health Area (80.9 per cent), and a significantly lower proportion of females in theSydney West Health Area (65.0 per cent), had a Pap test in the last 2 years.
There was no significant variation in the proportion of females aged 20-69 years having a Pap test inthe last 2 years by socioeconomic status.
There was a significant decrease in the proportion of females who reported having a Pap test in thelast 2 years between 1998 (77.3 per cent) and 2006 (72.8 per cent).
Hysterectomy rate
In 2006, 12.6 per cent of females aged 20-69 ever had a hysterectomy. Hysterectomy increased with age.
A significantly higher proportion of females in rural areas (17.0 per cent) than urban areas (10.7 percent) ever had a hysterectomy. A significantly higher proportion of females in the Hunter & NewEngland (18.1 per cent) and Greater Southern (17.2 per cent) Health Areas, and a significantly lowerproportion of females in the Northern Sydney and Central Coast Health Area (8.8 per cent), ever had a hysterectomy.
There was no significant variation in the proportion of females aged 20-69 years ever having ahysterectomy by socioeconomic status.
There was a significant decrease in the proportion of females who ever had a hysterectomy between1997 (13.3 per cent) and 2006 (12.6 per cent).
References1. NSW Central Cancer Registry. Cancer in NSW: Incidence and Mortality 2004. Sydney: The
Cancer Institute NSW, 2006. Available online atwww.cancerinstitute.org.au/cancer_inst/publications/pdfs/IncidenceMortalityReport2004.pdf(accessed 8 May 2007).
2. The BreastScreen NSW website at www.bsnsw.org.au (accessed 8 May 2007). 3. The Cancer Institute NSW. NSW Cancer Plan 2007-2010. Sydney: The Cancer Institute NSW,
2006. Available online atwww.cancerinstitute.com.au/cancer_inst/publications/pdfs/NSWCancerPlan2007-2010.pdf(accessed 8 May 2007).
4. The NSW Cervical Screening Program website at www.csp.nsw.gov.au (accessed 8 May 2007).
44
WARNIN
G: Esti
mates o
ut of
date.
Please
chec
k Hea
lthStat
s NSW
for la
test e
stimate
s.

Screening mammogram within the last 2 years by age, females aged 50 to 69 years, NSW, 2006
0 20 40 60 80 100Per cent
84.265-69
Age (years)
78.960-64
82.555-59
63.550-54
76.2All Ages
Age(years)
Females(95% CI)
50-54 63.5 (57.1-69.9)
55-59 82.5 (78.0-87.0)
60-64 78.9 (74.0-83.8)
65-69 84.2 (79.4-88.9)
All Ages 76.2 (73.4-79.0)
Note: Estimates are based on 1,515 respondents in NSW. For this indicator 5 (0.33%) were not stated (Don’t know or Refused) in NSW. The indicator includes those who had a screening mammogram in the last 2 years. This excludes women who had a mammogram for a breastproblem or had breast cancer in the past. The questions used to define the indicator were: Have you ever had a mammogram?, When did you lasthave a mammogram?, and Can you tell me all the reasons why you had your last mammogram?
Source: New South Wales Population Health Survey 2006 (HOIST). Centre for Epidemiology and Research, NSW Department of Health.
45
WARNIN
G: Esti
mates o
ut of
date.
Please
chec
k Hea
lthStat
s NSW
for la
test e
stimate
s.
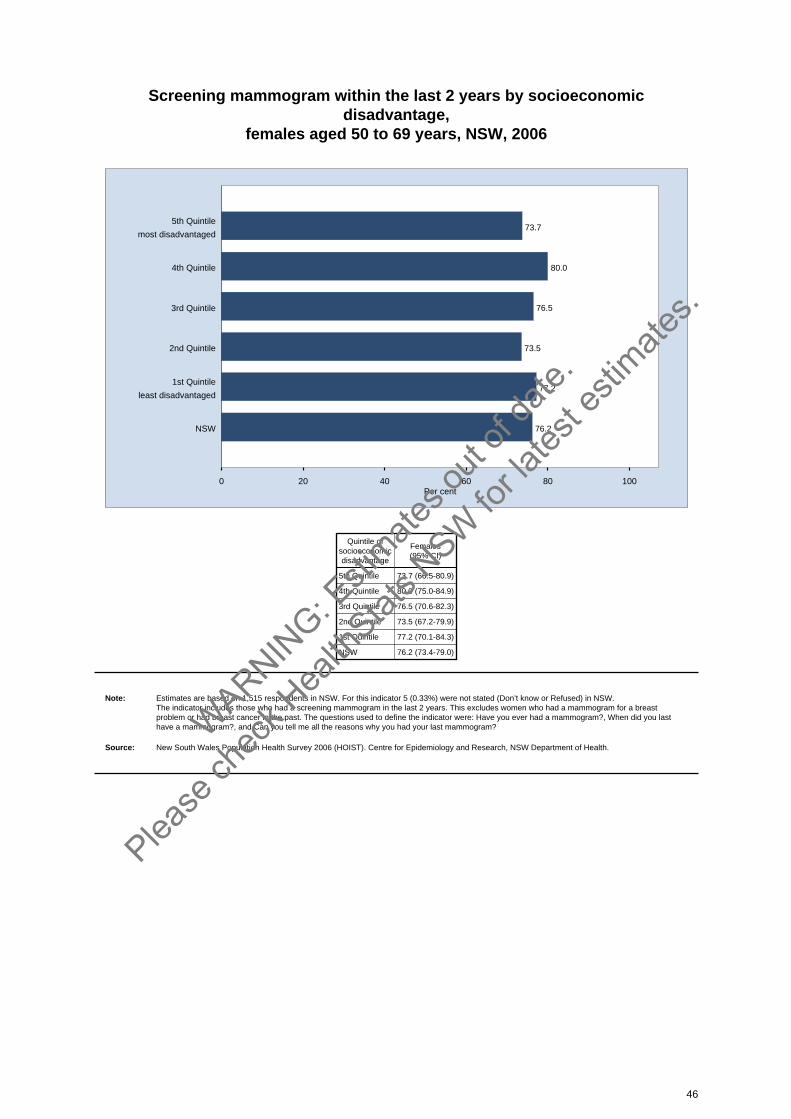
Screening mammogram within the last 2 years by socioeconomicdisadvantage,
females aged 50 to 69 years, NSW, 2006
0 20 40 60 80 100Per cent
73.75th Quintile
most disadvantaged
80.04th Quintile
76.53rd Quintile
73.52nd Quintile
77.21st Quintile
least disadvantaged
76.2NSW
Quintile ofsocioeconomicdisadvantage
Females(95% CI)
5th Quintile 73.7 (66.5-80.9)
4th Quintile 80.0 (75.0-84.9)
3rd Quintile 76.5 (70.6-82.3)
2nd Quintile 73.5 (67.2-79.9)
1st Quintile 77.2 (70.1-84.3)
NSW 76.2 (73.4-79.0)
Note: Estimates are based on 1,515 respondents in NSW. For this indicator 5 (0.33%) were not stated (Don’t know or Refused) in NSW. The indicator includes those who had a screening mammogram in the last 2 years. This excludes women who had a mammogram for a breastproblem or had breast cancer in the past. The questions used to define the indicator were: Have you ever had a mammogram?, When did you lasthave a mammogram?, and Can you tell me all the reasons why you had your last mammogram?
Source: New South Wales Population Health Survey 2006 (HOIST). Centre for Epidemiology and Research, NSW Department of Health.
46
WARNIN
G: Esti
mates o
ut of
date.
Please
chec
k Hea
lthStat
s NSW
for la
test e
stimate
s.
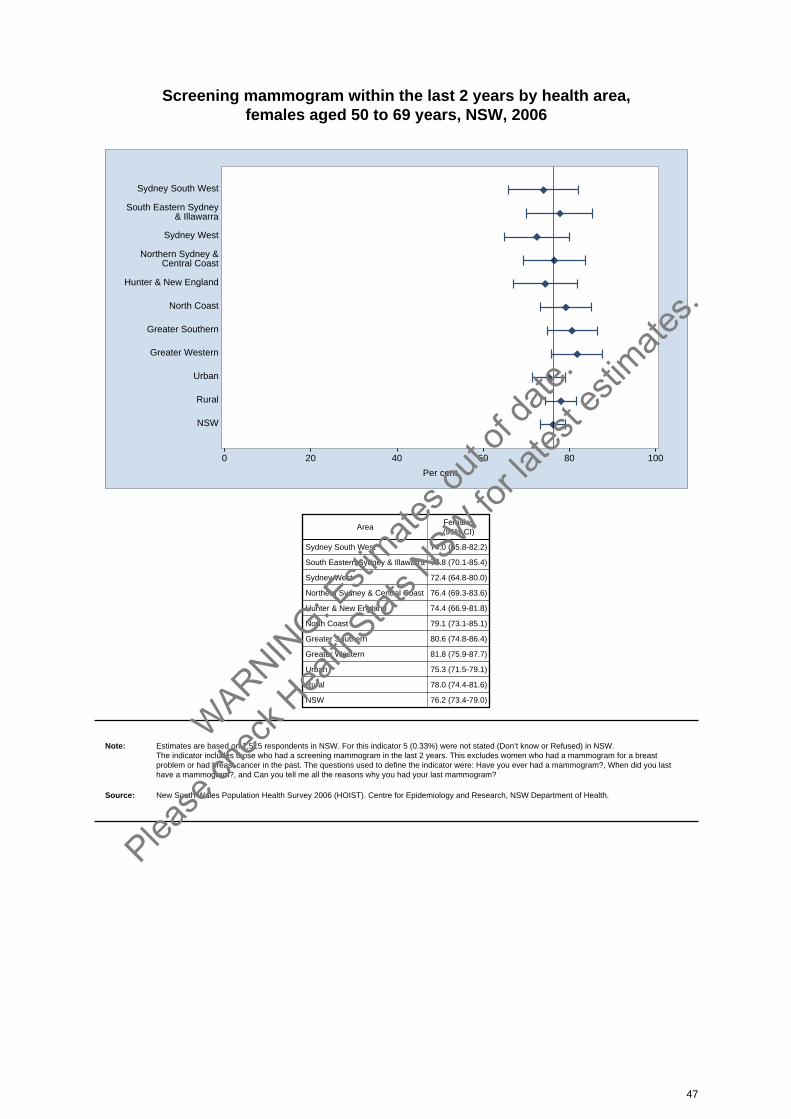
Screening mammogram within the last 2 years by health area, females aged 50 to 69 years, NSW, 2006
0 20 40 60 80 100
Per cent
Sydney South West
South Eastern Sydney& Illawarra
Sydney West
Northern Sydney &Central Coast
Hunter & New England
North Coast
Greater Southern
Greater Western
Urban
Rural
NSW
AreaFemales(95% CI)
Sydney South West 74.0 (65.8-82.2)
South Eastern Sydney & Illawarra 77.8 (70.1-85.4)
Sydney West 72.4 (64.8-80.0)
Northern Sydney & Central Coast 76.4 (69.3-83.6)
Hunter & New England 74.4 (66.9-81.8)
North Coast 79.1 (73.1-85.1)
Greater Southern 80.6 (74.8-86.4)
Greater Western 81.8 (75.9-87.7)
Urban 75.3 (71.5-79.1)
Rural 78.0 (74.4-81.6)
NSW 76.2 (73.4-79.0)
Note: Estimates are based on 1,515 respondents in NSW. For this indicator 5 (0.33%) were not stated (Don’t know or Refused) in NSW. The indicator includes those who had a screening mammogram in the last 2 years. This excludes women who had a mammogram for a breastproblem or had breast cancer in the past. The questions used to define the indicator were: Have you ever had a mammogram?, When did you lasthave a mammogram?, and Can you tell me all the reasons why you had your last mammogram?
Source: New South Wales Population Health Survey 2006 (HOIST). Centre for Epidemiology and Research, NSW Department of Health.
47
WARNIN
G: Esti
mates o
ut of
date.
Please
chec
k Hea
lthStat
s NSW
for la
test e
stimate
s.
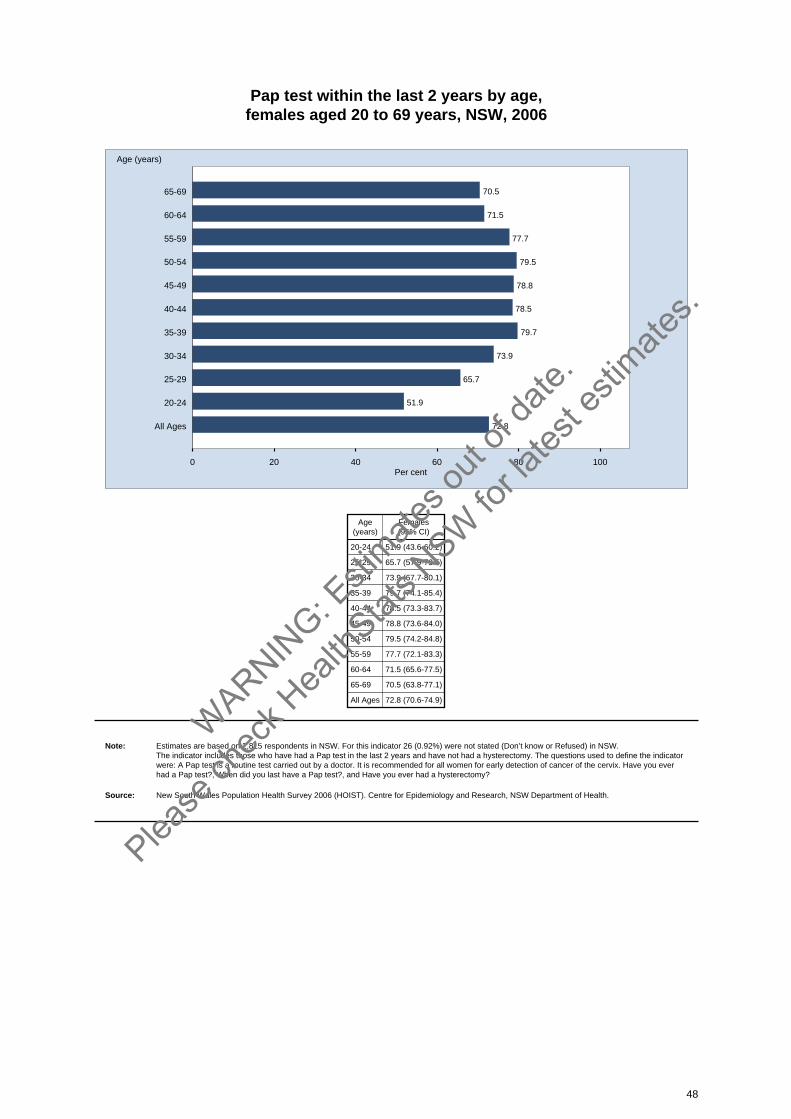
Pap test within the last 2 years by age, females aged 20 to 69 years, NSW, 2006
0 20 40 60 80 100Per cent
70.565-69
Age (years)
71.560-64
77.755-59
79.550-54
78.845-49
78.540-44
79.735-39
73.930-34
65.725-29
51.920-24
72.8All Ages
Age(years)
Females(95% CI)
20-24 51.9 (43.6-60.2)
25-29 65.7 (57.9-73.5)
30-34 73.9 (67.7-80.1)
35-39 79.7 (74.1-85.4)
40-44 78.5 (73.3-83.7)
45-49 78.8 (73.6-84.0)
50-54 79.5 (74.2-84.8)
55-59 77.7 (72.1-83.3)
60-64 71.5 (65.6-77.5)
65-69 70.5 (63.8-77.1)
All Ages 72.8 (70.6-74.9)
Note: Estimates are based on 2,815 respondents in NSW. For this indicator 26 (0.92%) were not stated (Don’t know or Refused) in NSW. The indicator includes those who have had a Pap test in the last 2 years and have not had a hysterectomy. The questions used to define the indicatorwere: A Pap test is a routine test carried out by a doctor. It is recommended for all women for early detection of cancer of the cervix. Have you everhad a Pap test?, When did you last have a Pap test?, and Have you ever had a hysterectomy?
Source: New South Wales Population Health Survey 2006 (HOIST). Centre for Epidemiology and Research, NSW Department of Health.
48
WARNIN
G: Esti
mates o
ut of
date.
Please
chec
k Hea
lthStat
s NSW
for la
test e
stimate
s.

Pap test within the last 2 years by socioeconomic disadvantage, females aged 20 to 69 years, NSW, 2006
0 20 40 60 80 100Per cent
69.85th Quintile
most disadvantaged
72.24th Quintile
70.93rd Quintile
73.82nd Quintile
76.61st Quintile
least disadvantaged
72.8NSW
Quintile ofsocioeconomicdisadvantage
Females(95% CI)
5th Quintile 69.8 (64.6-75.1)
4th Quintile 72.2 (67.4-77.0)
3rd Quintile 70.9 (65.5-76.3)
2nd Quintile 73.8 (69.4-78.3)
1st Quintile 76.6 (71.8-81.3)
NSW 72.8 (70.6-74.9)
Note: Estimates are based on 2,815 respondents in NSW. For this indicator 26 (0.92%) were not stated (Don’t know or Refused) in NSW. The indicator includes those who have had a Pap test in the last 2 years and have not had a hysterectomy. The questions used to define the indicatorwere: A Pap test is a routine test carried out by a doctor. It is recommended for all women for early detection of cancer of the cervix. Have you everhad a Pap test?, When did you last have a Pap test?, and Have you ever had a hysterectomy?
Source: New South Wales Population Health Survey 2006 (HOIST). Centre for Epidemiology and Research, NSW Department of Health.
49
WARNIN
G: Esti
mates o
ut of
date.
Please
chec
k Hea
lthStat
s NSW
for la
test e
stimate
s.

Pap test within the last 2 years by health area, females aged 20 to 69 years, NSW, 2006
0 20 40 60 80 100
Per cent
Sydney South West
South Eastern Sydney& Illawarra
Sydney West
Northern Sydney &Central Coast
Hunter & New England
North Coast
Greater Southern
Greater Western
Urban
Rural
NSW
AreaFemales(95% CI)
Sydney South West 69.7 (64.0-75.4)
South Eastern Sydney & Illawarra 72.9 (67.3-78.6)
Sydney West 65.0 (59.4-70.7)
Northern Sydney & Central Coast 75.4 (70.1-80.7)
Hunter & New England 80.9 (75.8-86.0)
North Coast 73.9 (68.1-79.6)
Greater Southern 77.1 (71.2-83.0)
Greater Western 76.8 (71.5-82.1)
Urban 70.8 (68.0-73.6)
Rural 77.8 (75.0-80.7)
NSW 72.8 (70.6-74.9)
Note: Estimates are based on 2,815 respondents in NSW. For this indicator 26 (0.92%) were not stated (Don’t know or Refused) in NSW. The indicator includes those who have had a Pap test in the last 2 years and have not had a hysterectomy. The questions used to define the indicatorwere: A Pap test is a routine test carried out by a doctor. It is recommended for all women for early detection of cancer of the cervix. Have you everhad a Pap test?, When did you last have a Pap test?, and Have you ever had a hysterectomy?
Source: New South Wales Population Health Survey 2006 (HOIST). Centre for Epidemiology and Research, NSW Department of Health.
50
WARNIN
G: Esti
mates o
ut of
date.
Please
chec
k Hea
lthStat
s NSW
for la
test e
stimate
s.
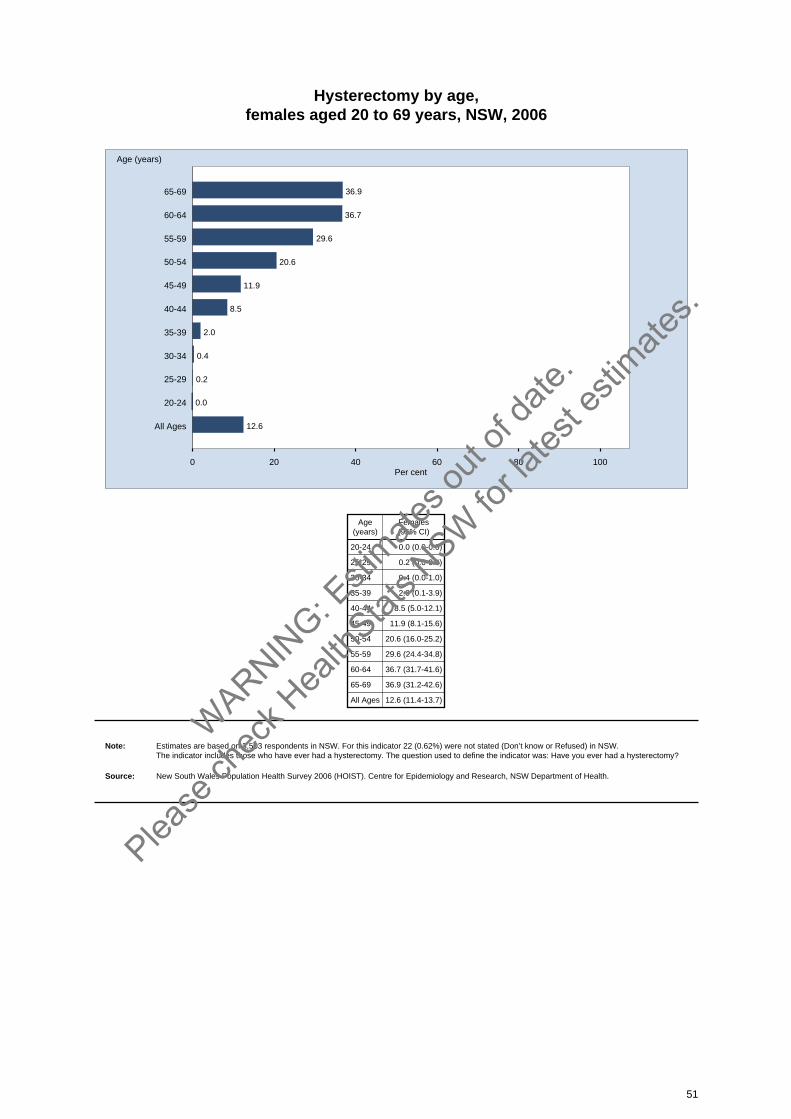
Hysterectomy by age, females aged 20 to 69 years, NSW, 2006
0 20 40 60 80 100Per cent
36.965-69
Age (years)
36.760-64
29.655-59
20.650-54
11.945-49
8.540-44
2.035-39
0.430-34
0.225-29
0.020-24
12.6All Ages
Age(years)
Females(95% CI)
20-24 0.0 (0.0-0.0)
25-29 0.2 (0.0-0.4)
30-34 0.4 (0.0-1.0)
35-39 2.0 (0.1-3.9)
40-44 8.5 (5.0-12.1)
45-49 11.9 (8.1-15.6)
50-54 20.6 (16.0-25.2)
55-59 29.6 (24.4-34.8)
60-64 36.7 (31.7-41.6)
65-69 36.9 (31.2-42.6)
All Ages 12.6 (11.4-13.7)
Note: Estimates are based on 3,503 respondents in NSW. For this indicator 22 (0.62%) were not stated (Don’t know or Refused) in NSW. The indicator includes those who have ever had a hysterectomy. The question used to define the indicator was: Have you ever had a hysterectomy?
Source: New South Wales Population Health Survey 2006 (HOIST). Centre for Epidemiology and Research, NSW Department of Health.
51
WARNIN
G: Esti
mates o
ut of
date.
Please
chec
k Hea
lthStat
s NSW
for la
test e
stimate
s.
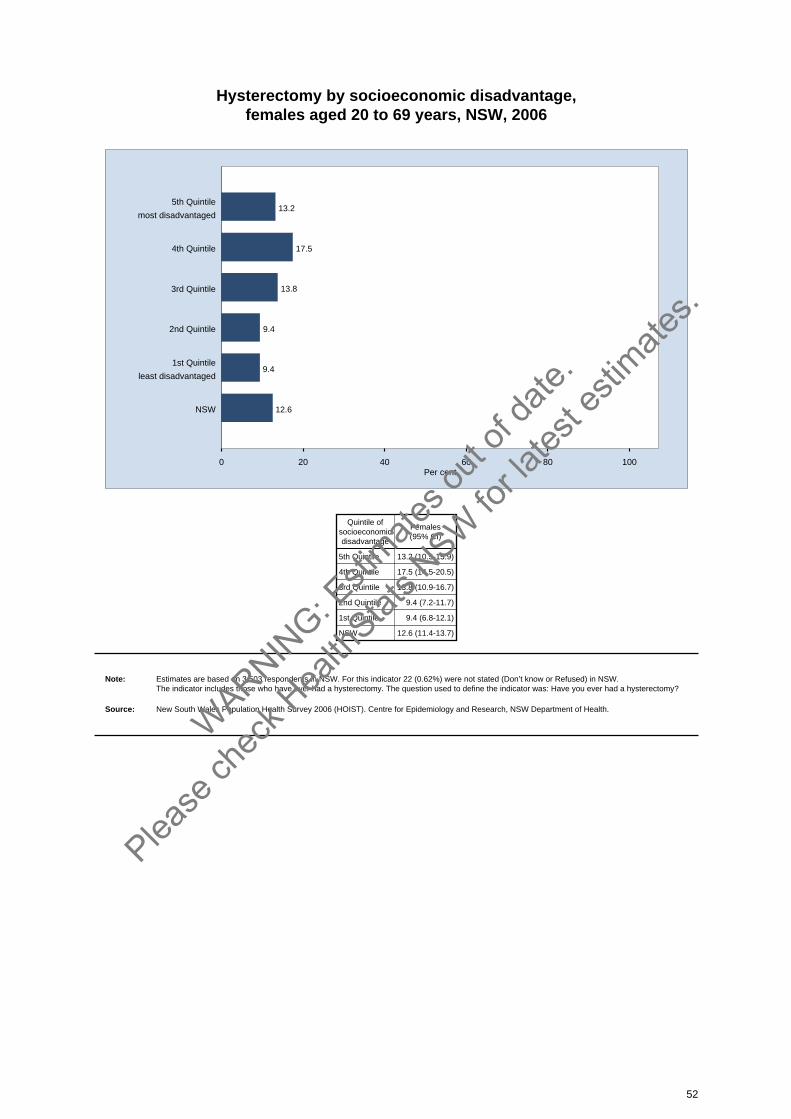
Hysterectomy by socioeconomic disadvantage, females aged 20 to 69 years, NSW, 2006
0 20 40 60 80 100Per cent
13.25th Quintile
most disadvantaged
17.54th Quintile
13.83rd Quintile
9.42nd Quintile
9.41st Quintile
least disadvantaged
12.6NSW
Quintile ofsocioeconomicdisadvantage
Females(95% CI)
5th Quintile 13.2 (10.5-15.9)
4th Quintile 17.5 (14.5-20.5)
3rd Quintile 13.8 (10.9-16.7)
2nd Quintile 9.4 (7.2-11.7)
1st Quintile 9.4 (6.8-12.1)
NSW 12.6 (11.4-13.7)
Note: Estimates are based on 3,503 respondents in NSW. For this indicator 22 (0.62%) were not stated (Don’t know or Refused) in NSW. The indicator includes those who have ever had a hysterectomy. The question used to define the indicator was: Have you ever had a hysterectomy?
Source: New South Wales Population Health Survey 2006 (HOIST). Centre for Epidemiology and Research, NSW Department of Health.
52
WARNIN
G: Esti
mates o
ut of
date.
Please
chec
k Hea
lthStat
s NSW
for la
test e
stimate
s.

Hysterectomy by health area, females aged 20 to 69 years, NSW, 2006
0 20 40 60 80 100
Per cent
Sydney South West
South Eastern Sydney& Illawarra
Sydney West
Northern Sydney &Central Coast
Hunter & New England
North Coast
Greater Southern
Greater Western
Urban
Rural
NSW
AreaFemales(95% CI)
Sydney South West 10.7 (7.9-13.6)
South Eastern Sydney & Illawarra 12.1 (8.9-15.3)
Sydney West 11.2 (8.2-14.2)
Northern Sydney & Central Coast 8.8 (6.1-11.6)
Hunter & New England 18.1 (14.6-21.7)
North Coast 15.9 (12.4-19.4)
Greater Southern 17.2 (13.6-20.8)
Greater Western 15.3 (11.9-18.6)
Urban 10.7 (9.2-12.2)
Rural 17.0 (15.1-18.9)
NSW 12.6 (11.4-13.7)
Note: Estimates are based on 3,503 respondents in NSW. For this indicator 22 (0.62%) were not stated (Don’t know or Refused) in NSW. The indicator includes those who have ever had a hysterectomy. The question used to define the indicator was: Have you ever had a hysterectomy?
Source: New South Wales Population Health Survey 2006 (HOIST). Centre for Epidemiology and Research, NSW Department of Health.
53
WARNIN
G: Esti
mates o
ut of
date.
Please
chec
k Hea
lthStat
s NSW
for la
test e
stimate
s.
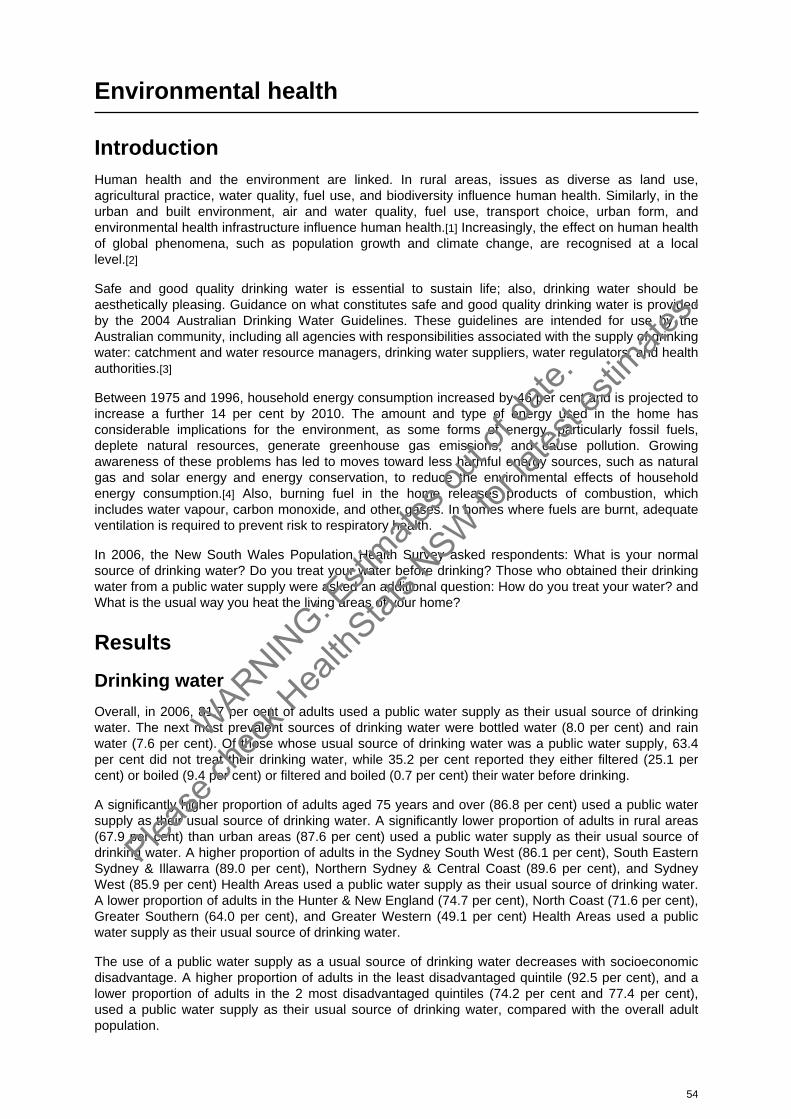
Environmental health
IntroductionHuman health and the environment are linked. In rural areas, issues as diverse as land use,agricultural practice, water quality, fuel use, and biodiversity influence human health. Similarly, in theurban and built environment, air and water quality, fuel use, transport choice, urban form, andenvironmental health infrastructure influence human health.[1] Increasingly, the effect on human healthof global phenomena, such as population growth and climate change, are recognised at a local level.[2]
Safe and good quality drinking water is essential to sustain life; also, drinking water should beaesthetically pleasing. Guidance on what constitutes safe and good quality drinking water is providedby the 2004 Australian Drinking Water Guidelines. These guidelines are intended for use by theAustralian community, including all agencies with responsibilities associated with the supply of drinkingwater: catchment and water resource managers, drinking water suppliers, water regulators, and health authorities.[3]
Between 1975 and 1996, household energy consumption increased by 46 per cent and is projected toincrease a further 14 per cent by 2010. The amount and type of energy used in the home hasconsiderable implications for the environment, as some forms of energy, particularly fossil fuels,deplete natural resources, generate greenhouse gas emissions, and cause pollution. Growingawareness of these problems has led to moves toward less harmful energy sources, such as naturalgas and solar energy and energy conservation, to reduce the environmental effects of householdenergy consumption.[4] Also, burning fuel in the home releases products of combustion, whichincludes water vapour, carbon monoxide, and other gases. In homes where fuels are burnt, adequateventilation is required to prevent risk to respiratory health.
In 2006, the New South Wales Population Health Survey asked respondents: What is your normalsource of drinking water? Do you treat your water before drinking? Those who obtained their drinkingwater from a public water supply were asked an additional question: How do you treat your water? andWhat is the usual way you heat the living areas of your home?
Results
Drinking water
Overall, in 2006, 81.7 per cent of adults used a public water supply as their usual source of drinkingwater. The next most prevalent sources of drinking water were bottled water (8.0 per cent) and rainwater (7.6 per cent). Of those whose usual source of drinking water was a public water supply, 63.4per cent did not treat their drinking water, while 35.2 per cent reported they either filtered (25.1 percent) or boiled (9.4 per cent) or filtered and boiled (0.7 per cent) their water before drinking.
A significantly higher proportion of adults aged 75 years and over (86.8 per cent) used a public watersupply as their usual source of drinking water. A significantly lower proportion of adults in rural areas(67.9 per cent) than urban areas (87.6 per cent) used a public water supply as their usual source ofdrinking water. A higher proportion of adults in the Sydney South West (86.1 per cent), South EasternSydney & Illawarra (89.0 per cent), Northern Sydney & Central Coast (89.6 per cent), and SydneyWest (85.9 per cent) Health Areas used a public water supply as their usual source of drinking water.A lower proportion of adults in the Hunter & New England (74.7 per cent), North Coast (71.6 per cent),Greater Southern (64.0 per cent), and Greater Western (49.1 per cent) Health Areas used a publicwater supply as their usual source of drinking water.
The use of a public water supply as a usual source of drinking water decreases with socioeconomicdisadvantage. A higher proportion of adults in the least disadvantaged quintile (92.5 per cent), and alower proportion of adults in the 2 most disadvantaged quintiles (74.2 per cent and 77.4 per cent),used a public water supply as their usual source of drinking water, compared with the overall adult population.
54
WARNIN
G: Esti
mates o
ut of
date.
Please
chec
k Hea
lthStat
s NSW
for la
test e
stimate
s.

There has been no significant change in the proportion of adults obtaining their drinking water from apublic water supply between 2002 and 2006.
Home heating: Exposure to unflued heating
Overall, in 2006, 29.6 per cent of adults heated their living areas with reverse cycle air conditioning,25.1 per cent with electric space or oil column heaters, 17.2 per cent with a gas heater without a flue,6.6 per cent with a gas heater with a flue, 9.8 per cent with a slow burning combustion heater, 2.0 percent with an open fireplace, and 0.2 per cent with a kerosene heater.
Overall, in 2006, 19.4 per cent of adults aged 16 years and over were exposed to unflued heating inthe home. A significantly higher proportion of adults aged 45-54 years (24.2 per cent), and asignificantly lower proportion of adults aged 65-74 years (16.1 per cent) and 75 years and over (13.8per cent) were exposed to unflued heating in the home. There was no significant variation in theproportion of adults in urban areas or rural areas exposed to unflued heating in the home; however, ahigher proportion of adults in the Northern Sydney & Central Coast (23.0 per cent) and GreaterWestern (23.1 per cent) Health Areas, and a lower proportion of adults in the North Coast Health Area(13.6 per cent), were exposed to unflued heating in the home, compared with the overall adult population.
Exposure to unflued heating in the home did not vary by level of socioeconomic disadvantage.
There has been significant decrease in the proportion of adults exposed to unflued heating in thehome between 2002 (22.7 per cent) and 2006 (19.4 per cent).
References1. Frumkin H. Urban Sprawl and Public Health. Public Health Reports 2002; 177. Available online at
www.cdc.gov/healthyplaces/articles/Urban%20Sprawl%20and%20Public%20Health%20-%20PHR.pdf(accessed 8 May 2007).
2. Commonwealth Department of Health and Ageing. Human Health and Climate Change inOceania: A Risk Assessment 2002. Canberra: Commonwealth Department of Health and Ageing,2003. Available online atwww.health.gov.au/internet/wcms/Publishing.nsf/Content/health-pubhlth-publicat-document-metadata-env_climate.htm
(accessed 8 May 2007). 3. National Health and Medical Research Council. Australian Drinking Water Guidelines. Canberra:
National Health and Medical Research Council, 2004. Available online atwww.nhmrc.gov.au/publications/synopses/eh19syn.htm (accessed 8 May 2007).
4. Australian Bureau of Statistics. Use of Resources: Household energy. Canberra: AustralianBureau of Statistics, 2006. Available online atusewww.abs.gov.au/ausstats/[email protected]/2f762f95845417aeca25706c00834efa/1892cf9fc515974bca2570ec0019ebaa!OpenDocument
(accessed 8 May 2007).
55
WARNIN
G: Esti
mates o
ut of
date.
Please
chec
k Hea
lthStat
s NSW
for la
test e
stimate
s.
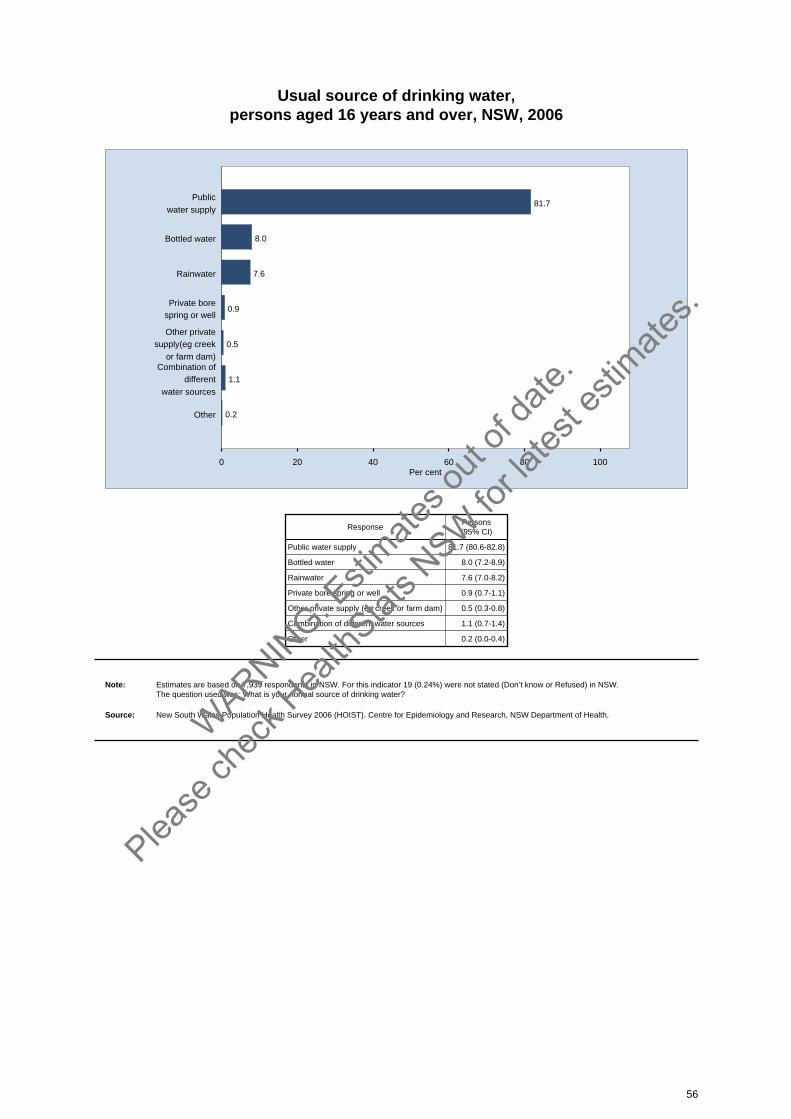
Usual source of drinking water, persons aged 16 years and over, NSW, 2006
0 20 40 60 80 100Per cent
81.7Public
water supply
8.0Bottled water
7.6Rainwater
0.9Private bore
spring or well
0.5
Other privatesupply(eg creek
or farm dam)
1.1
Combination ofdifferent
water sources
0.2Other
ResponsePersons(95% CI)
Public water supply 81.7 (80.6-82.8)
Bottled water 8.0 (7.2-8.9)
Rainwater 7.6 (7.0-8.2)
Private bore spring or well 0.9 (0.7-1.1)
Other private supply (eg creek or farm dam) 0.5 (0.3-0.8)
Combination of different water sources 1.1 (0.7-1.4)
Other 0.2 (0.0-0.4)
Note: Estimates are based on 7,939 respondents in NSW. For this indicator 19 (0.24%) were not stated (Don’t know or Refused) in NSW. The question used was: What is your normal source of drinking water?
Source: New South Wales Population Health Survey 2006 (HOIST). Centre for Epidemiology and Research, NSW Department of Health.
56
WARNIN
G: Esti
mates o
ut of
date.
Please
chec
k Hea
lthStat
s NSW
for la
test e
stimate
s.
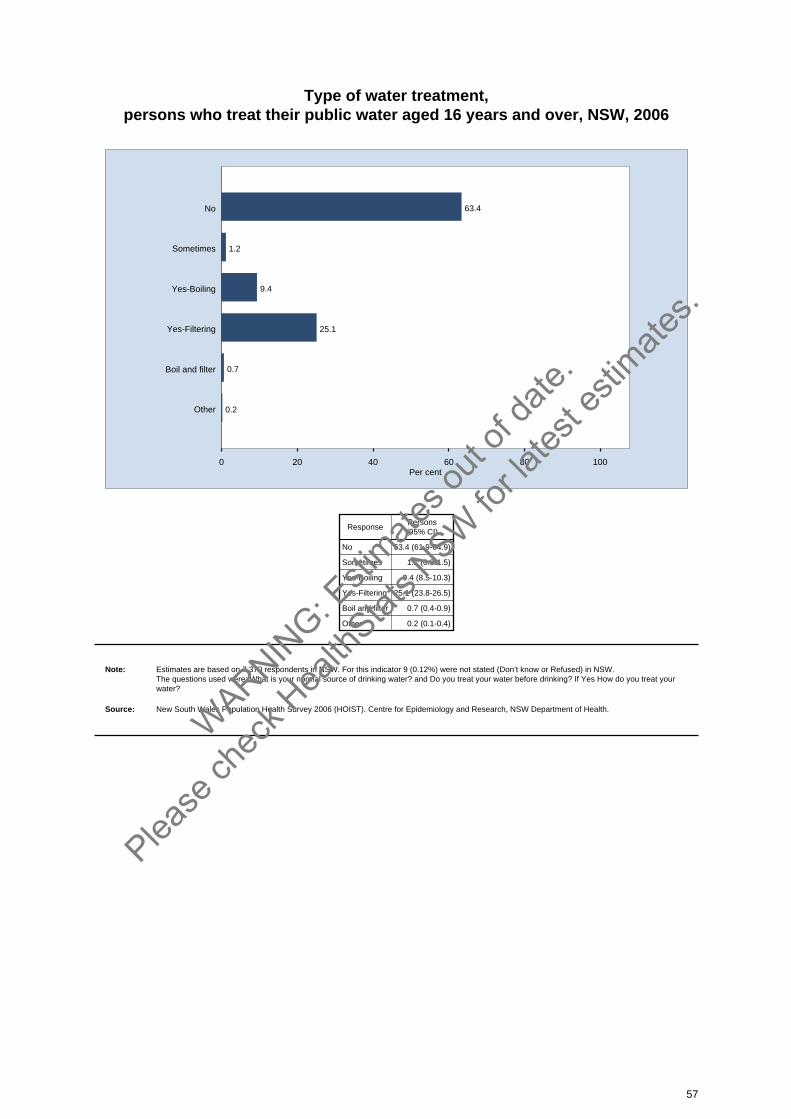
Type of water treatment, persons who treat their public water aged 16 years and over, NSW, 2006
0 20 40 60 80 100Per cent
63.4No
1.2Sometimes
9.4Yes-Boiling
25.1Yes-Filtering
0.7Boil and filter
0.2Other
ResponsePersons(95% CI)
No 63.4 (61.9-64.9)
Sometimes 1.2 (0.9-1.5)
Yes-Boiling 9.4 (8.5-10.3)
Yes-Filtering 25.1 (23.8-26.5)
Boil and filter 0.7 (0.4-0.9)
Other 0.2 (0.1-0.4)
Note: Estimates are based on 7,370 respondents in NSW. For this indicator 9 (0.12%) were not stated (Don’t know or Refused) in NSW. The questions used were: What is your normal source of drinking water? and Do you treat your water before drinking? If Yes How do you treat your water?
Source: New South Wales Population Health Survey 2006 (HOIST). Centre for Epidemiology and Research, NSW Department of Health.
57
WARNIN
G: Esti
mates o
ut of
date.
Please
chec
k Hea
lthStat
s NSW
for la
test e
stimate
s.
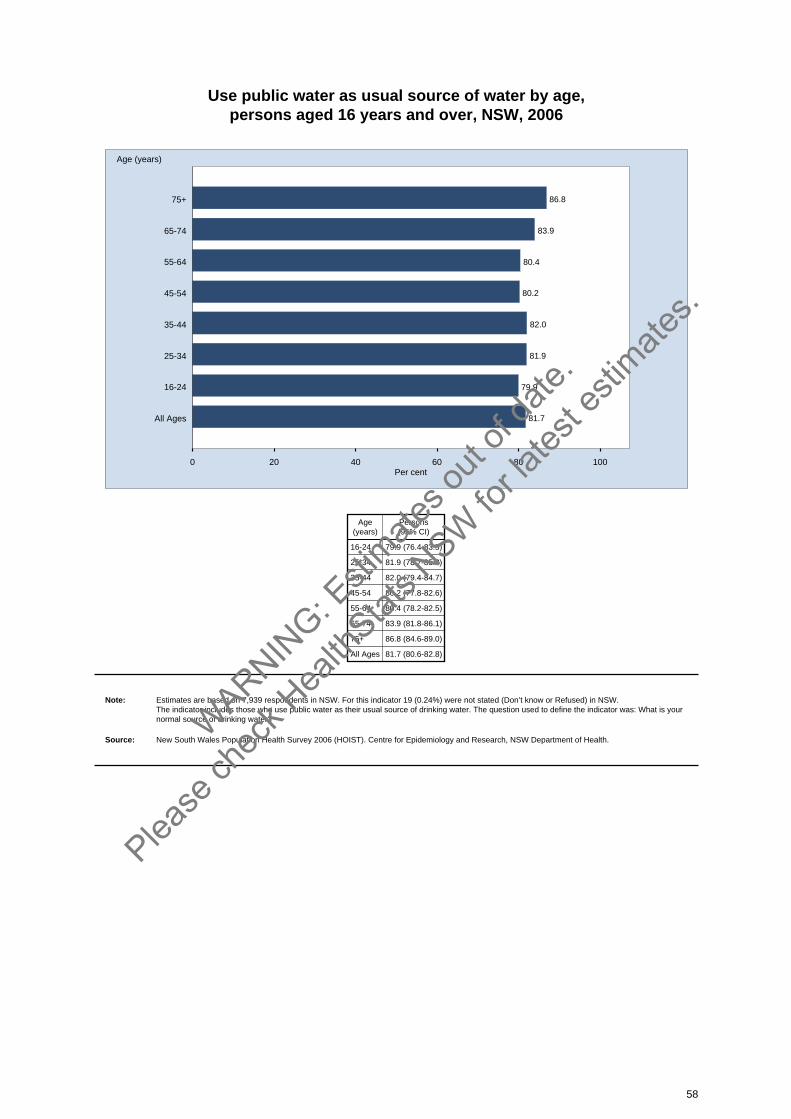
Use public water as usual source of water by age, persons aged 16 years and over, NSW, 2006
0 20 40 60 80 100Per cent
86.875+
Age (years)
83.965-74
80.455-64
80.245-54
82.035-44
81.925-34
79.916-24
81.7All Ages
Age(years)
Persons(95% CI)
16-24 79.9 (76.4-83.5)
25-34 81.9 (78.7-85.2)
35-44 82.0 (79.4-84.7)
45-54 80.2 (77.8-82.6)
55-64 80.4 (78.2-82.5)
65-74 83.9 (81.8-86.1)
75+ 86.8 (84.6-89.0)
All Ages 81.7 (80.6-82.8)
Note: Estimates are based on 7,939 respondents in NSW. For this indicator 19 (0.24%) were not stated (Don’t know or Refused) in NSW. The indicator includes those who use public water as their usual source of drinking water. The question used to define the indicator was: What is yournormal source of drinking water?
Source: New South Wales Population Health Survey 2006 (HOIST). Centre for Epidemiology and Research, NSW Department of Health.
58
WARNIN
G: Esti
mates o
ut of
date.
Please
chec
k Hea
lthStat
s NSW
for la
test e
stimate
s.
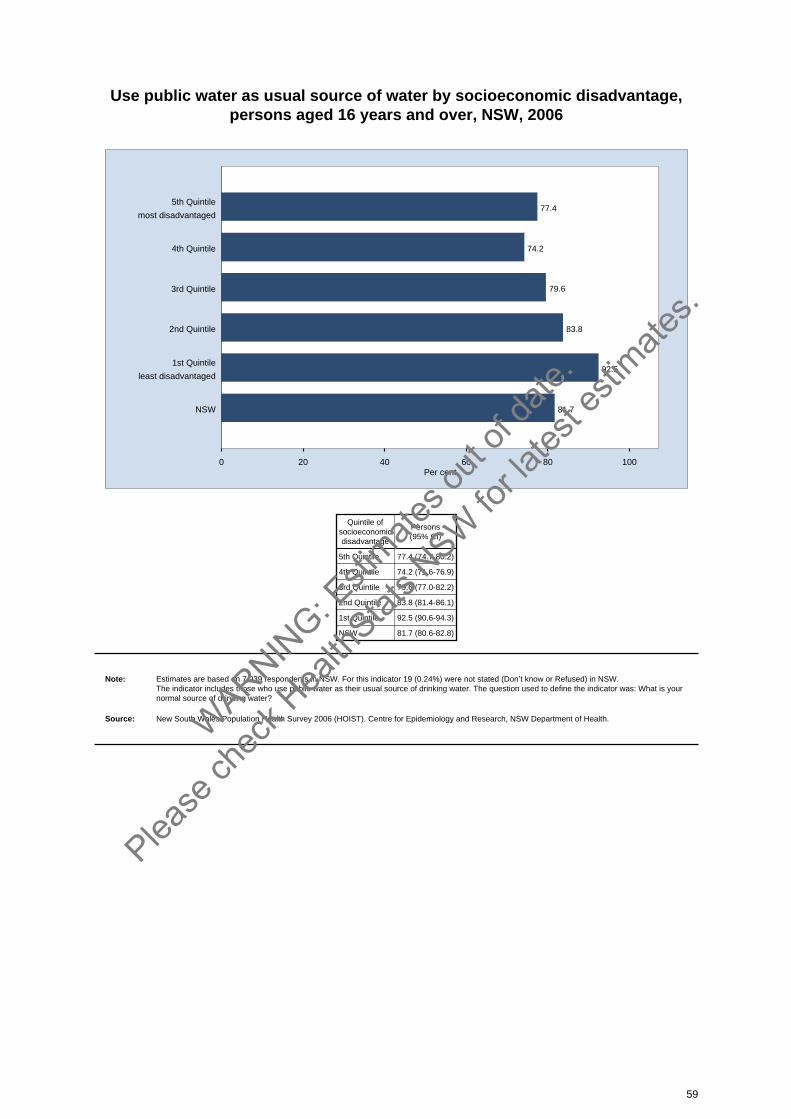
Use public water as usual source of water by socioeconomic disadvantage, persons aged 16 years and over, NSW, 2006
0 20 40 60 80 100Per cent
77.45th Quintile
most disadvantaged
74.24th Quintile
79.63rd Quintile
83.82nd Quintile
92.51st Quintile
least disadvantaged
81.7NSW
Quintile ofsocioeconomicdisadvantage
Persons(95% CI)
5th Quintile 77.4 (74.7-80.2)
4th Quintile 74.2 (71.6-76.9)
3rd Quintile 79.6 (77.0-82.2)
2nd Quintile 83.8 (81.4-86.1)
1st Quintile 92.5 (90.6-94.3)
NSW 81.7 (80.6-82.8)
Note: Estimates are based on 7,939 respondents in NSW. For this indicator 19 (0.24%) were not stated (Don’t know or Refused) in NSW. The indicator includes those who use public water as their usual source of drinking water. The question used to define the indicator was: What is yournormal source of drinking water?
Source: New South Wales Population Health Survey 2006 (HOIST). Centre for Epidemiology and Research, NSW Department of Health.
59
WARNIN
G: Esti
mates o
ut of
date.
Please
chec
k Hea
lthStat
s NSW
for la
test e
stimate
s.

Use public water as usual source of water by health area, persons aged 16 years and over, NSW, 2006
0 20 40 60 80 100
Per cent
Sydney South West
South Eastern Sydney& Illawarra
Sydney West
Northern Sydney &Central Coast
Hunter & New England
North Coast
Greater Southern
Greater Western
Urban
Rural
NSW
AreaPersons(95% CI)
Sydney South West 86.1 (83.5-88.7)
South Eastern Sydney & Illawarra 89.0 (86.3-91.6)
Sydney West 85.9 (83.1-88.7)
Northern Sydney & Central Coast 89.6 (87.1-92.0)
Hunter & New England 74.7 (71.4-78.1)
North Coast 71.6 (68.1-75.2)
Greater Southern 64.0 (60.2-67.8)
Greater Western 49.1 (45.1-53.0)
Urban 87.6 (86.3-88.9)
Rural 67.9 (66.1-69.8)
NSW 81.7 (80.6-82.8)
Note: Estimates are based on 7,939 respondents in NSW. For this indicator 19 (0.24%) were not stated (Don’t know or Refused) in NSW. The indicator includes those who use public water as their usual source of drinking water. The question used to define the indicator was: What is yournormal source of drinking water?
Source: New South Wales Population Health Survey 2006 (HOIST). Centre for Epidemiology and Research, NSW Department of Health.
60
WARNIN
G: Esti
mates o
ut of
date.
Please
chec
k Hea
lthStat
s NSW
for la
test e
stimate
s.
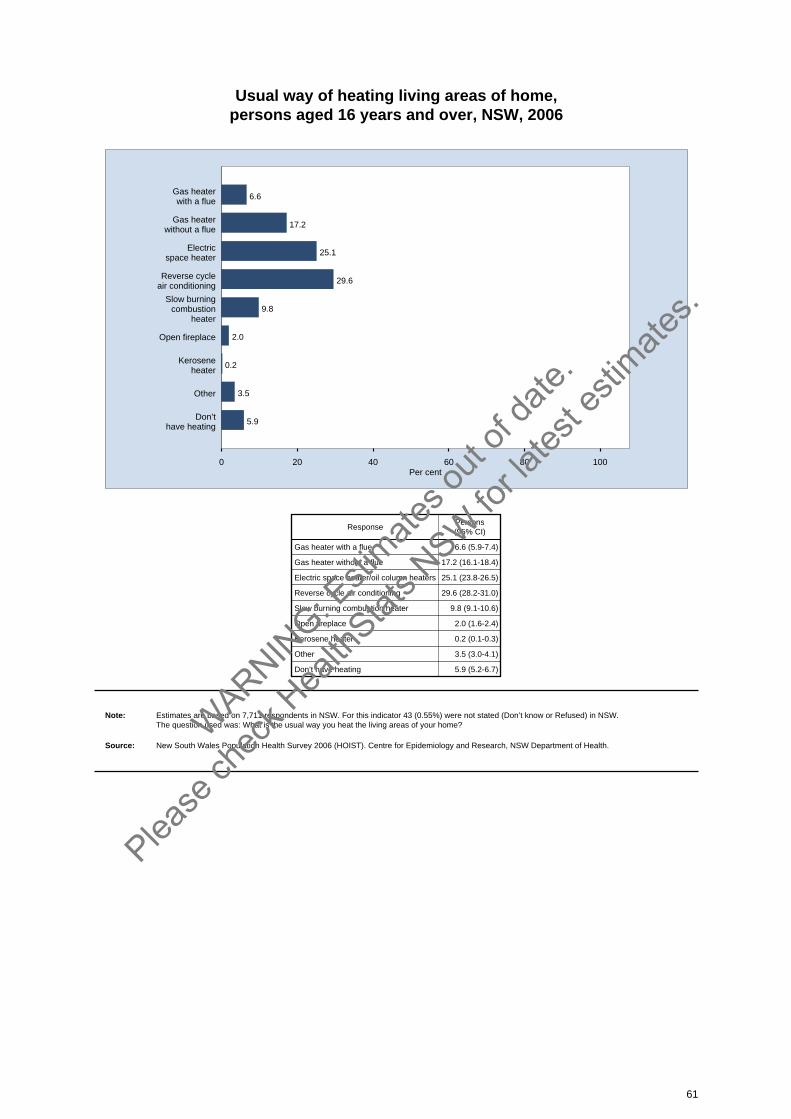
Usual way of heating living areas of home, persons aged 16 years and over, NSW, 2006
0 20 40 60 80 100Per cent
6.6Gas heaterwith a flue
17.2Gas heater
without a flue
25.1Electricspace heater
29.6Reverse cycleair conditioning
9.8Slow burning
combustionheater
2.0Open fireplace
0.2Keroseneheater
3.5Other
5.9Don’thave heating
ResponsePersons(95% CI)
Gas heater with a flue 6.6 (5.9-7.4)
Gas heater without a flue 17.2 (16.1-18.4)
Electric space heater/oil column heaters 25.1 (23.8-26.5)
Reverse cycle air conditioning 29.6 (28.2-31.0)
Slow burning combustion heater 9.8 (9.1-10.6)
Open fireplace 2.0 (1.6-2.4)
Kerosene heater 0.2 (0.1-0.3)
Other 3.5 (3.0-4.1)
Don’t have heating 5.9 (5.2-6.7)
Note: Estimates are based on 7,711 respondents in NSW. For this indicator 43 (0.55%) were not stated (Don’t know or Refused) in NSW. The question used was: What is the usual way you heat the living areas of your home?
Source: New South Wales Population Health Survey 2006 (HOIST). Centre for Epidemiology and Research, NSW Department of Health.
61
WARNIN
G: Esti
mates o
ut of
date.
Please
chec
k Hea
lthStat
s NSW
for la
test e
stimate
s.
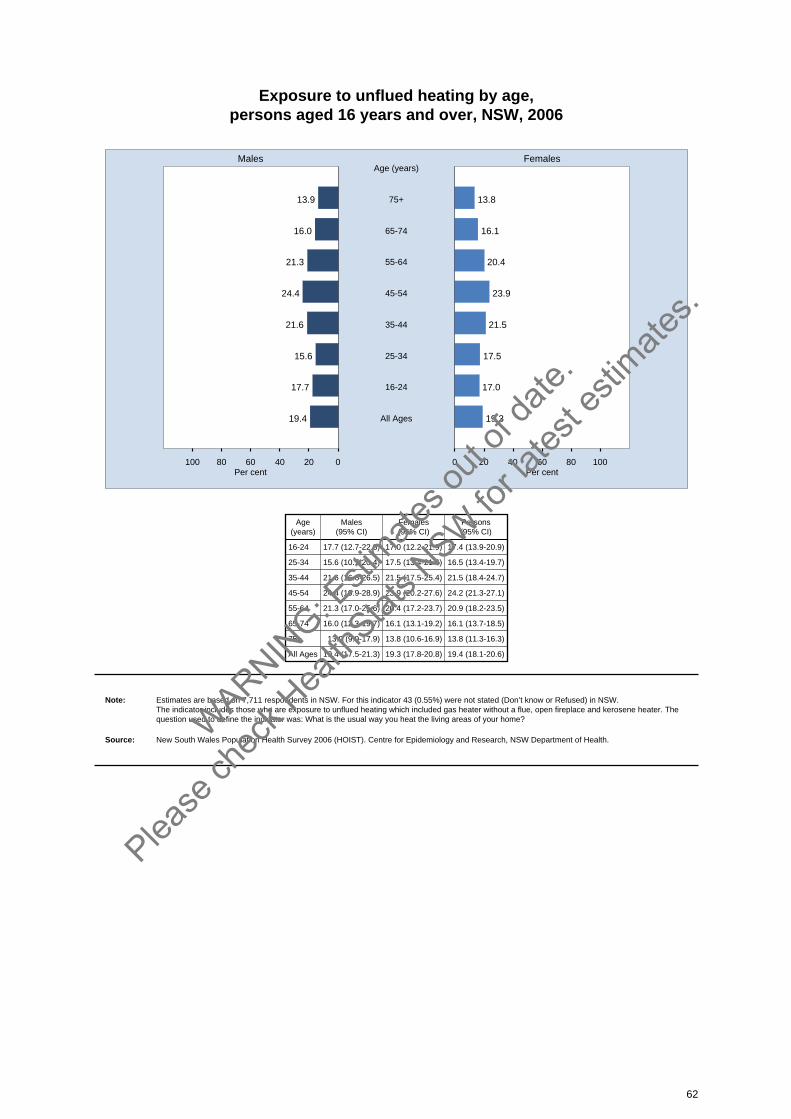
Exposure to unflued heating by age, persons aged 16 years and over, NSW, 2006
020406080100 0 20 40 60 80 100
Males Females
Per cent Per cent
13.9 13.875+
Age (years)
16.0 16.165-74
21.3 20.455-64
24.4 23.945-54
21.6 21.535-44
15.6 17.525-34
17.7 17.016-24
19.4 19.3All Ages
Age(years)
Males(95% CI)
Females(95% CI)
Persons(95% CI)
16-24 17.7 (12.7-22.8) 17.0 (12.2-21.9) 17.4 (13.9-20.9)
25-34 15.6 (10.7-20.4) 17.5 (13.4-21.6) 16.5 (13.4-19.7)
35-44 21.6 (16.6-26.5) 21.5 (17.5-25.4) 21.5 (18.4-24.7)
45-54 24.4 (19.9-28.9) 23.9 (20.2-27.6) 24.2 (21.3-27.1)
55-64 21.3 (17.0-25.6) 20.4 (17.2-23.7) 20.9 (18.2-23.5)
65-74 16.0 (12.3-19.7) 16.1 (13.1-19.2) 16.1 (13.7-18.5)
75+ 13.9 (9.9-17.9) 13.8 (10.6-16.9) 13.8 (11.3-16.3)
All Ages 19.4 (17.5-21.3) 19.3 (17.8-20.8) 19.4 (18.1-20.6)
Note: Estimates are based on 7,711 respondents in NSW. For this indicator 43 (0.55%) were not stated (Don’t know or Refused) in NSW. The indicator includes those who are exposure to unflued heating which included gas heater without a flue, open fireplace and kerosene heater. Thequestion used to define the indicator was: What is the usual way you heat the living areas of your home?
Source: New South Wales Population Health Survey 2006 (HOIST). Centre for Epidemiology and Research, NSW Department of Health.
62
WARNIN
G: Esti
mates o
ut of
date.
Please
chec
k Hea
lthStat
s NSW
for la
test e
stimate
s.
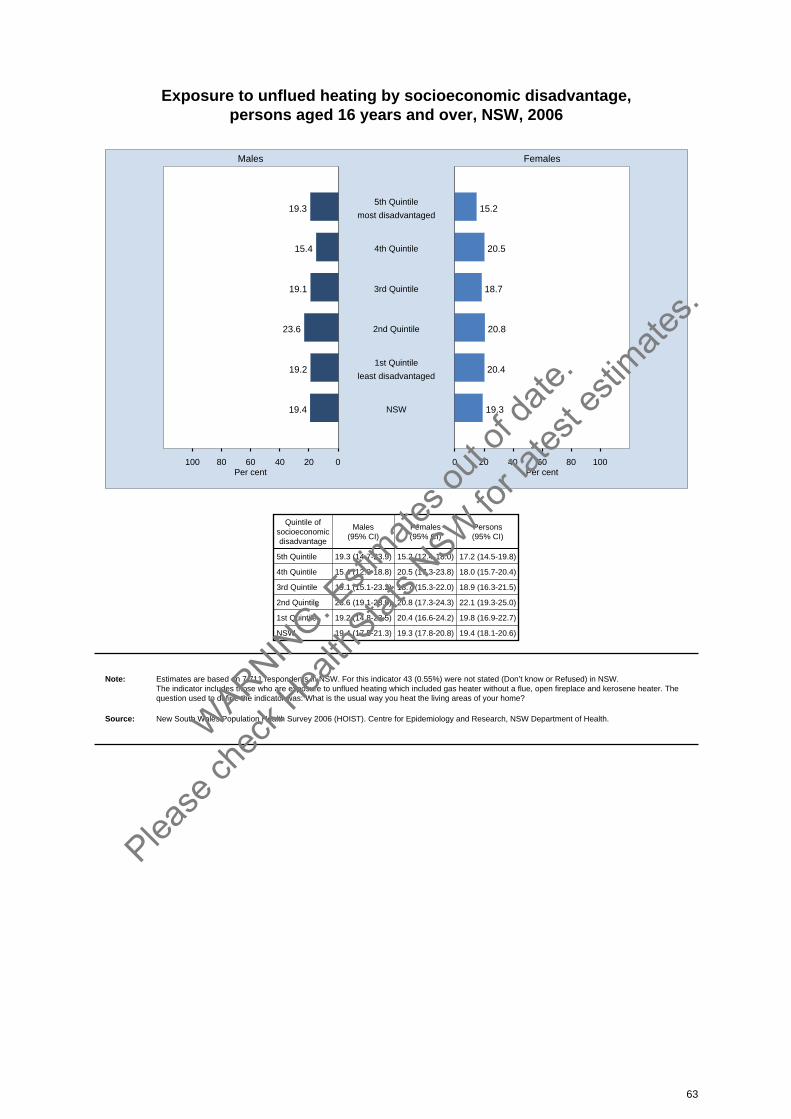
Exposure to unflued heating by socioeconomic disadvantage, persons aged 16 years and over, NSW, 2006
020406080100 0 20 40 60 80 100
Males Females
Per cent Per cent
19.3 15.25th Quintile
most disadvantaged
15.4 20.54th Quintile
19.1 18.73rd Quintile
23.6 20.82nd Quintile
19.2 20.41st Quintile
least disadvantaged
19.4 19.3NSW
Quintile ofsocioeconomicdisadvantage
Males(95% CI)
Females(95% CI)
Persons(95% CI)
5th Quintile 19.3 (14.7-23.9) 15.2 (12.4-18.0) 17.2 (14.5-19.8)
4th Quintile 15.4 (12.0-18.8) 20.5 (17.3-23.8) 18.0 (15.7-20.4)
3rd Quintile 19.1 (15.1-23.2) 18.7 (15.3-22.0) 18.9 (16.3-21.5)
2nd Quintile 23.6 (19.1-28.0) 20.8 (17.3-24.3) 22.1 (19.3-25.0)
1st Quintile 19.2 (14.8-23.5) 20.4 (16.6-24.2) 19.8 (16.9-22.7)
NSW 19.4 (17.5-21.3) 19.3 (17.8-20.8) 19.4 (18.1-20.6)
Note: Estimates are based on 7,711 respondents in NSW. For this indicator 43 (0.55%) were not stated (Don’t know or Refused) in NSW. The indicator includes those who are exposure to unflued heating which included gas heater without a flue, open fireplace and kerosene heater. Thequestion used to define the indicator was: What is the usual way you heat the living areas of your home?
Source: New South Wales Population Health Survey 2006 (HOIST). Centre for Epidemiology and Research, NSW Department of Health.
63
WARNIN
G: Esti
mates o
ut of
date.
Please
chec
k Hea
lthStat
s NSW
for la
test e
stimate
s.

Exposure to unflued heating by health area, persons aged 16 years and over, NSW, 2006
0 20 40 60 80 100 0 20 40 60 80 100
Males Females
Per cent Per cent
Sydney South West
South Eastern Sydney& Illawarra
Sydney West
Northern Sydney &Central Coast
Hunter & New England
North Coast
Greater Southern
Greater Western
Urban
Rural
NSW
AreaMales
(95% CI)Females(95% CI)
Persons(95% CI)
Sydney South West 20.7 (15.8-25.5) 17.2 (13.5-20.8) 18.9 (15.8-21.9)
South Eastern Sydney & Illawarra 20.3 (15.3-25.4) 22.3 (18.0-26.6) 21.3 (18.0-24.6)
Sydney West 18.2 (13.1-23.3) 14.5 (11.0-18.0) 16.3 (13.2-19.4)
Northern Sydney & Central Coast 20.9 (16.0-25.8) 25.0 (20.5-29.5) 23.0 (19.7-26.3)
Hunter & New England 17.5 (12.7-22.4) 17.4 (13.9-21.0) 17.5 (14.5-20.5)
North Coast 11.5 (7.4-15.7) 15.6 (12.1-19.2) 13.6 (10.9-16.4)
Greater Southern 21.0 (16.2-25.8) 19.8 (15.4-24.1) 20.4 (17.1-23.6)
Greater Western 24.8 (19.3-30.2) 21.4 (17.6-25.2) 23.1 (19.8-26.4)
Urban 20.1 (17.6-22.6) 19.8 (17.8-21.9) 20.0 (18.4-21.6)
Rural 18.0 (15.5-20.5) 18.1 (16.1-20.1) 18.0 (16.4-19.6)
NSW 19.4 (17.5-21.3) 19.3 (17.8-20.8) 19.4 (18.1-20.6)
Note: Estimates are based on 7,711 respondents in NSW. For this indicator 43 (0.55%) were not stated (Don’t know or Refused) in NSW. The indicator includes those who are exposure to unflued heating which included gas heater without a flue, open fireplace and kerosene heater. Thequestion used to define the indicator was: What is the usual way you heat the living areas of your home?
Source: New South Wales Population Health Survey 2006 (HOIST). Centre for Epidemiology and Research, NSW Department of Health.
64
WARNIN
G: Esti
mates o
ut of
date.
Please
chec
k Hea
lthStat
s NSW
for la
test e
stimate
s.
Food handling
IntroductionThe three most frequently encountered hazards associated with outbreaks of foodborne illness arecontamination, inadequate handling, and inappropriate temperature.[1] Those involved in foodpreparation are advised to always wash their hands with soap before handling food; wash hands,knives and chopping boards carefully after using them; keep uncooked meats and poultry separatefrom cooked food in the refrigerator; wash vegetables thoroughly before use; and prepare, cook andstore perishable foods at appropriate temperatures.[2,3,4,5]
In 2006 the New South Wales Population Health Survey asked respondents: Thinking about the lasttime you prepared raw meat or chicken when cooking, after preparing it did you: Wipe your hands orrinse them without using soap, or wash your hands with soap, or continue cooking without cleaningyour hands?
ResultsIn 2006, 66.5 per cent of adults washed their hands with soap after preparing raw meat. A significantlyhigher proportion of females (70.8 per cent) than males (61.4 per cent) washed their hands with soapafter preparing raw meat. The proportion of adults washing their hands with soap after preparing rawmeat decreased with age in females.
A significantly lower proportion of adults in rural areas (63.6 per cent) than urban areas (67.8 per cent)washed their hands with soap after preparing raw meat. A lower proportion of adults in the NorthCoast (59.3 per cent) and Greater Southern (60.3 per cent) Health Areas washed their hands withsoap after preparing raw meat, compared with the overall adult population.
There was no variation by level of socioeconomic disadvantage.
Encouragingly, there has been a significant increase in the proportion of adults who washed theirhands with soap after preparing raw meat between 2003 (60.7 per cent) and 2006 (66.5 per cent).This increase was significant in both males (56.2 per cent to 61.4 per cent) and females (64.3 per centto 70.8 per cent).
References1. Food Science Australia and Minter Ellison Consulting. National Risk Validation Project: Final
Report 2002. Canberra: Australian Government Department of Health and Ageing, 2002.Available online fromwww.health.gov.au/internet/wcms/publishing.nsf/Content/health-pubhlth-strateg-foodpolicy-pdf-validation.htm(accessed 9 May 2007).
2. NSW Food Authority. Safe Handling of Poultry and Red Meat. Sydney: NSW Food Authority,2005. Available online fromwww.foodauthority.nsw.gov.au/consumer/c-safe-handling-poultry-red-meat.asp (accessed 9 May2007).
3. NSW Food Authority. Safe Food Tips: Fact Sheet. Sydney: NSW Food Authority, 2005. Availableonline from www.foodauthority.nsw.gov.au/consumer/pdf/safe%20food%20tips.pdf (accessed 9May 2007).
4. NSW Department of Health. Controlling Viral Gastroenteritis Outbreaks: Fact Sheet. Sydney:NSW Department of Health, 2004. Available online fromwww.health.nsw.gov.au/infect/pdf/controlling_gastro_outbreaks.pdf (accessed 9 May 2007).
5. NSW Department of Health. Giardiasis: Fact Sheet.. Sydney: NSW Department of Health, 2001.Available online from www.health.nsw.gov.au/public-health/cdscu/facts/pdf/GiardiasisFS2001.pdf(accessed 9 May 2007).
65
WARNIN
G: Esti
mates o
ut of
date.
Please
chec
k Hea
lthStat
s NSW
for la
test e
stimate
s.
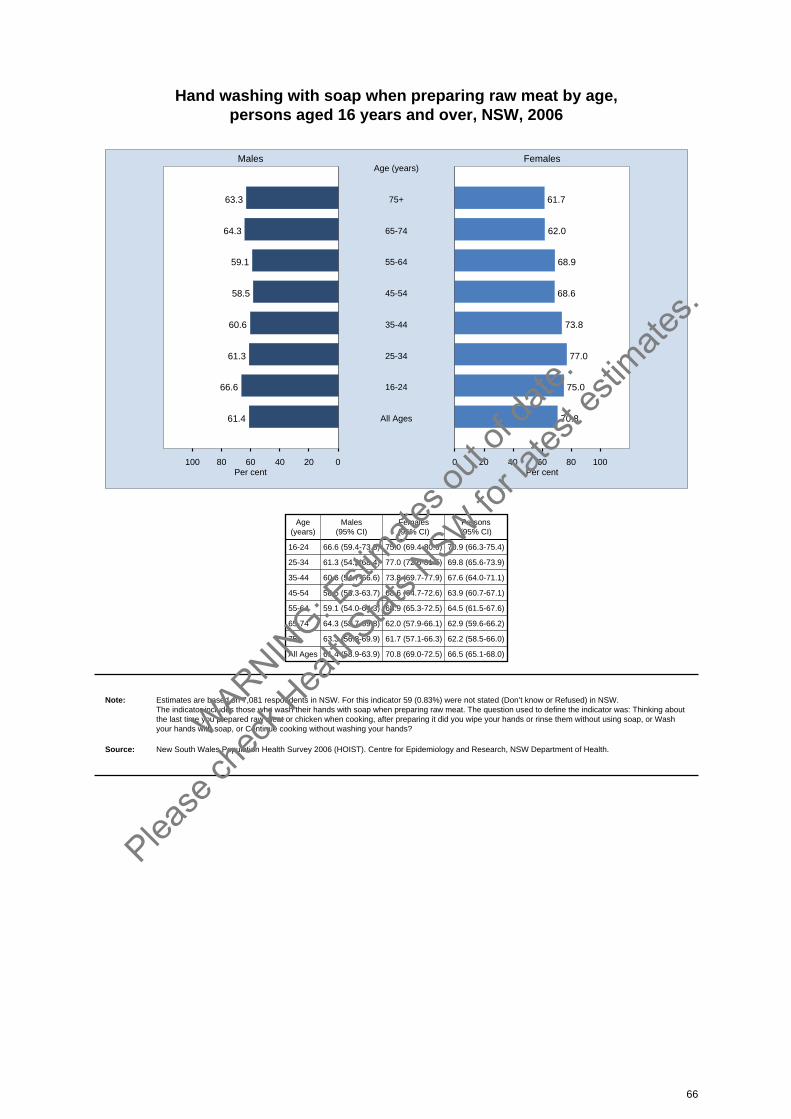
Hand washing with soap when preparing raw meat by age, persons aged 16 years and over, NSW, 2006
020406080100 0 20 40 60 80 100
Males Females
Per cent Per cent
63.3 61.775+
Age (years)
64.3 62.065-74
59.1 68.955-64
58.5 68.645-54
60.6 73.835-44
61.3 77.025-34
66.6 75.016-24
61.4 70.8All Ages
Age(years)
Males(95% CI)
Females(95% CI)
Persons(95% CI)
16-24 66.6 (59.4-73.8) 75.0 (69.4-80.6) 70.9 (66.3-75.4)
25-34 61.3 (54.2-68.4) 77.0 (72.6-81.5) 69.8 (65.6-73.9)
35-44 60.6 (54.7-66.6) 73.8 (69.7-77.9) 67.6 (64.0-71.1)
45-54 58.5 (53.3-63.7) 68.6 (64.7-72.6) 63.9 (60.7-67.1)
55-64 59.1 (54.0-64.3) 68.9 (65.3-72.5) 64.5 (61.5-67.6)
65-74 64.3 (58.7-69.8) 62.0 (57.9-66.1) 62.9 (59.6-66.2)
75+ 63.3 (56.8-69.9) 61.7 (57.1-66.3) 62.2 (58.5-66.0)
All Ages 61.4 (58.9-63.9) 70.8 (69.0-72.5) 66.5 (65.1-68.0)
Note: Estimates are based on 7,081 respondents in NSW. For this indicator 59 (0.83%) were not stated (Don’t know or Refused) in NSW. The indicator includes those who wash their hands with soap when preparing raw meat. The question used to define the indicator was: Thinking aboutthe last time you prepared raw meat or chicken when cooking, after preparing it did you wipe your hands or rinse them without using soap, or Washyour hands with soap, or Continue cooking without washing your hands?
Source: New South Wales Population Health Survey 2006 (HOIST). Centre for Epidemiology and Research, NSW Department of Health.
66
WARNIN
G: Esti
mates o
ut of
date.
Please
chec
k Hea
lthStat
s NSW
for la
test e
stimate
s.
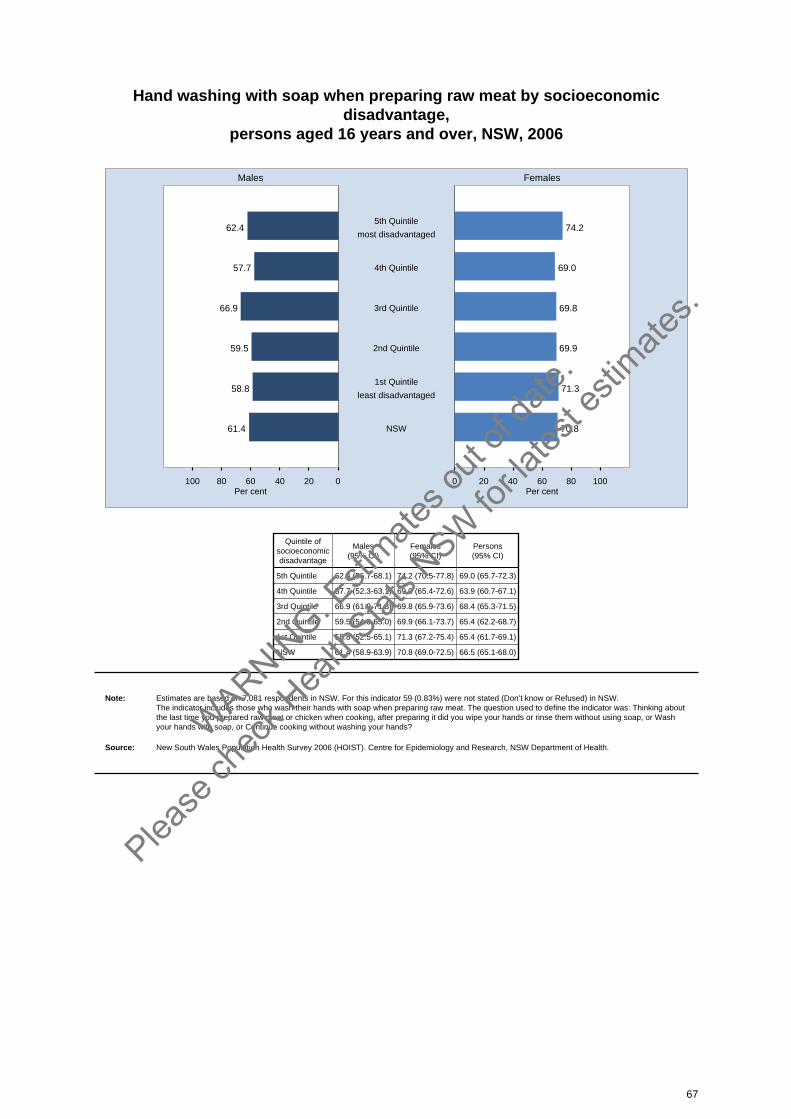
Hand washing with soap when preparing raw meat by socioeconomicdisadvantage,
persons aged 16 years and over, NSW, 2006
020406080100 0 20 40 60 80 100
Males Females
Per cent Per cent
62.4 74.25th Quintile
most disadvantaged
57.7 69.04th Quintile
66.9 69.83rd Quintile
59.5 69.92nd Quintile
58.8 71.31st Quintile
least disadvantaged
61.4 70.8NSW
Quintile ofsocioeconomicdisadvantage
Males(95% CI)
Females(95% CI)
Persons(95% CI)
5th Quintile 62.4 (56.7-68.1) 74.2 (70.5-77.8) 69.0 (65.7-72.3)
4th Quintile 57.7 (52.3-63.1) 69.0 (65.4-72.6) 63.9 (60.7-67.1)
3rd Quintile 66.9 (61.9-71.8) 69.8 (65.9-73.6) 68.4 (65.3-71.5)
2nd Quintile 59.5 (54.0-65.0) 69.9 (66.1-73.7) 65.4 (62.2-68.7)
1st Quintile 58.8 (52.5-65.1) 71.3 (67.2-75.4) 65.4 (61.7-69.1)
NSW 61.4 (58.9-63.9) 70.8 (69.0-72.5) 66.5 (65.1-68.0)
Note: Estimates are based on 7,081 respondents in NSW. For this indicator 59 (0.83%) were not stated (Don’t know or Refused) in NSW. The indicator includes those who wash their hands with soap when preparing raw meat. The question used to define the indicator was: Thinking aboutthe last time you prepared raw meat or chicken when cooking, after preparing it did you wipe your hands or rinse them without using soap, or Washyour hands with soap, or Continue cooking without washing your hands?
Source: New South Wales Population Health Survey 2006 (HOIST). Centre for Epidemiology and Research, NSW Department of Health.
67
WARNIN
G: Esti
mates o
ut of
date.
Please
chec
k Hea
lthStat
s NSW
for la
test e
stimate
s.
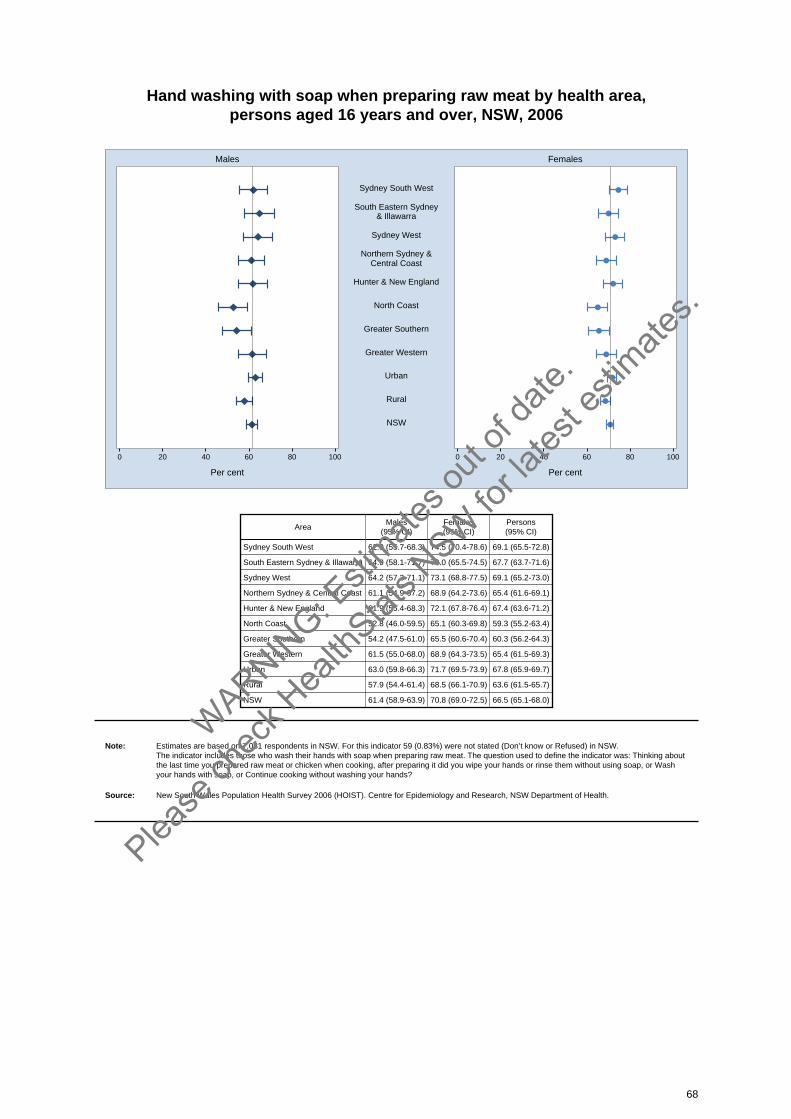
Hand washing with soap when preparing raw meat by health area, persons aged 16 years and over, NSW, 2006
0 20 40 60 80 100 0 20 40 60 80 100
Males Females
Per cent Per cent
Sydney South West
South Eastern Sydney& Illawarra
Sydney West
Northern Sydney &Central Coast
Hunter & New England
North Coast
Greater Southern
Greater Western
Urban
Rural
NSW
AreaMales
(95% CI)Females(95% CI)
Persons(95% CI)
Sydney South West 62.0 (55.7-68.3) 74.5 (70.4-78.6) 69.1 (65.5-72.8)
South Eastern Sydney & Illawarra 64.9 (58.1-71.7) 70.0 (65.5-74.5) 67.7 (63.7-71.6)
Sydney West 64.2 (57.3-71.1) 73.1 (68.8-77.5) 69.1 (65.2-73.0)
Northern Sydney & Central Coast 61.1 (54.9-67.2) 68.9 (64.2-73.6) 65.4 (61.6-69.1)
Hunter & New England 61.9 (55.4-68.3) 72.1 (67.8-76.4) 67.4 (63.6-71.2)
North Coast 52.8 (46.0-59.5) 65.1 (60.3-69.8) 59.3 (55.2-63.4)
Greater Southern 54.2 (47.5-61.0) 65.5 (60.6-70.4) 60.3 (56.2-64.3)
Greater Western 61.5 (55.0-68.0) 68.9 (64.3-73.5) 65.4 (61.5-69.3)
Urban 63.0 (59.8-66.3) 71.7 (69.5-73.9) 67.8 (65.9-69.7)
Rural 57.9 (54.4-61.4) 68.5 (66.1-70.9) 63.6 (61.5-65.7)
NSW 61.4 (58.9-63.9) 70.8 (69.0-72.5) 66.5 (65.1-68.0)
Note: Estimates are based on 7,081 respondents in NSW. For this indicator 59 (0.83%) were not stated (Don’t know or Refused) in NSW. The indicator includes those who wash their hands with soap when preparing raw meat. The question used to define the indicator was: Thinking aboutthe last time you prepared raw meat or chicken when cooking, after preparing it did you wipe your hands or rinse them without using soap, or Washyour hands with soap, or Continue cooking without washing your hands?
Source: New South Wales Population Health Survey 2006 (HOIST). Centre for Epidemiology and Research, NSW Department of Health.
68
WARNIN
G: Esti
mates o
ut of
date.
Please
chec
k Hea
lthStat
s NSW
for la
test e
stimate
s.
Immunisation
IntroductionIn New South Wales, despite substantial progress, increases are needed in immunisation coverage toreduce the incidence of vaccine preventable diseases.[1]
Influenza (flu), caused by the influenza virus, is characterised by abrupt onset of fever, myalgia,headache, sore throat, and acute cough. Infuenza can cause extreme malaise lasting several days.Although usually not life threatening, influenza can be complicated by secondary bacterial pneumoniain individuals whose medical condition makes them vulnerable. Under the National ImmunisationProgram, influenza vaccine is provided free to all people aged 65 years and over and is recommended annually.[1] Under the National Indigenous Pneumococcal and Influenza Immunisation Program, thevaccine is provided free to Aboriginal people aged 50 years and over and to those aged 15-49 yearswho have chronic conditions or illness, who are heavy drinkers, or who smoke tobacco.[1]
Streptococcus pneumoniae (pneumococcus), a bacterial inhabitant of the upper-respiratory tract, is amajor cause of pneumonia, meningitis, and middle ear infection, particularly in the elderly, Aboriginaland Torres Strait Islander people, and young children. The National Health and Medical ResearchCouncil recommends immunisation against pneumococcal disease for: all people aged 65 years andover; Aboriginal and Torres Strait Islander people aged 50 years and over; people over 5 years of agewho are immunocompromised, suffer from chronic conditions or illness, or smoke tobacco; and peoplewith asplenia, either functional or anatomical.[1]
The National Meningococcal C Vaccination Program commenced in January 2003, aimed at childrenand adolescents aged 1-18 years. Under this program, meningococcal C vaccine is available free ofcharge to people aged 1-19 years over the following 4 years.[1]
In 2006 the New South Wales Population Health Survey asked respondents aged 50 years and over:Were you vaccinated or immunised against flu in the past 12 months? When were you last vaccinatedor immunised against pneumonia? To evaluate the success of the National Meningococcal CVaccination Program, respondents aged 16-19 years were asked: Since January 2005 have you beenvaccinated against meningococcal C disease? When were you vaccinated? and, Where did youreceive the vaccine?
Results
Influenza vaccination
In adults aged 50 years and over, the proportion vaccinated against influenza in the last 12 monthswas 48.0 per cent, with a higher proportion of females (51.5 per cent) than males (44.2 per cent) beingvaccinated. There was no significant variation between urban areas and rural areas, or among healthareas, or by level of socioeconomic disadvantage. Overall, in this age group, vaccination hasincreased significantly between 1997 (34.6 per cent) and 2006 (48.0 per cent). This increase wassignificant in both males (32.1 per cent to 44.2 per cent) and females (36.8 per cent to 51.5 per cent).
In adults aged 65 years and over, the proportion vaccinated against influenza in the last 12 monthswas 75.0 per cent. In this age group, there was no significant difference in the proportion of femalesand males being vaccinated. There was no significant difference between rural areas and urban areas,or by level of socioeconomic disadvantage; however, a lower proportion of adults aged 65 years andover in the Greater Western Health Area (67.3 per cent) were vaccinated against influenza in the last12 months, compared with the overall adult population in this age group. Overall, in this age group,vaccination has increased significantly between 1997 (57.1 per cent) and 2006 (75.0 per cent). Thisincrease was significant in both males (55.7 per cent to 73.8 per cent) and females (58.1 per cent to75.9 per cent).
69
WARNIN
G: Esti
mates o
ut of
date.
Please
chec
k Hea
lthStat
s NSW
for la
test e
stimate
s.
Pneumococcal vaccination
In adults aged 50 years and over, just under one third (32.1 per cent) had a pneumococcal vaccinationin the last 5 years. In this age group, 14.4 per cent were vaccinated within the last 12 months, 17.8 percent 12 months to 5 years ago, 2.5 per cent more than 5 years ago, and 65.4 per cent had never beenvaccinated. A significantly higher proportion of females (33.9 per cent) than males (30.2 per cent) hadbeen vaccinated in the last 5 years. The proportion of adults being vaccinated increased significantlywith age (from 6.2 per cent among those aged 50-54 years to 71.3 per cent among those aged 80years and over). A significantly higher proportion of adults in rural areas (34.4 per cent) than urbanareas (30.9 per cent) had a pneumococcal vaccination in the last 5 years. A higher proportion of adultsin the Hunter & New England Health Area (38.6 per cent) had a pneumococcal vaccination in the last5 years. A lower proportion of adults in the least disadvantaged quintile (28.0 per cent) had apneumococcal vaccination in the last 5 years. Overall, in this age group, there has been a significantincrease in the proportion of adults being vaccinated in the last 5 years, from 19.2 per cent in 2002 to32.1 per cent in 2006.
In adults aged 65 years and over, the proportion vaccinated for pneumococcal pneumonia in the last 5years was 60.9 per cent. In this age group, there was no significant variation between males andfemales. A significantly lower proportion of adults aged 65-69 years (46.0 per cent), and a significantlyhigher proportion of adults aged 75 years and over (68.8 per cent and 71.3 per cent), had beenvaccinated in the last 5 years. In this age group, there was no significant difference between ruralareas and urban areas, or by level of socioeconomic disadvantage; however, a higher proportion ofadults in the Hunter & New England Health Area (69.2 per cent), and a lower proportion of adults inthe Greater Western Health Area (53.8 per cent) had been vaccinated in the last 5 years. Overall, inthis age group, there has been a significant increase in the proportion of adults being vaccinated in thelast 5 years, from 38.6 per cent in 2002 to 60.9 per cent in 2006.
Meningococcal vaccination
In 2006, among adults aged 16-19 years, 72.0 per cent were vaccinated against meningococcal C inthe last year. The proportion did not vary significantly between urban areas and rural areas; however,a lower proportion of adults in the Greater Western Health Area (46.9 per cent) were vaccinatedagainst meningococcal C in the last year, compared with the overall adult population in this age group.A higher proportion of adults in the second least advantaged quintile (85.6 per cent) were vaccinatedagainst meningococcal C in the last year.
Of those who had been vaccinated against meningococcal C in the last year, 82.7 per cent werevaccinated by a school clinic, 14.7 per cent by a general practitioner, and 1.8 per cent by a communityhealth centre.
Overall, in this age group, there has been a significant increase in the proportion of adults beingvaccinated against meningococcal C in the last year, from 62.5 per cent in 2005 to 72.0 per cent in 2006.
References1. National Health and Medical Research Council. The Australian Immunisation Handbook, 8th
Edition, Canberra: National Health and Medical Research Council, 2003.
70
WARNIN
G: Esti
mates o
ut of
date.
Please
chec
k Hea
lthStat
s NSW
for la
test e
stimate
s.
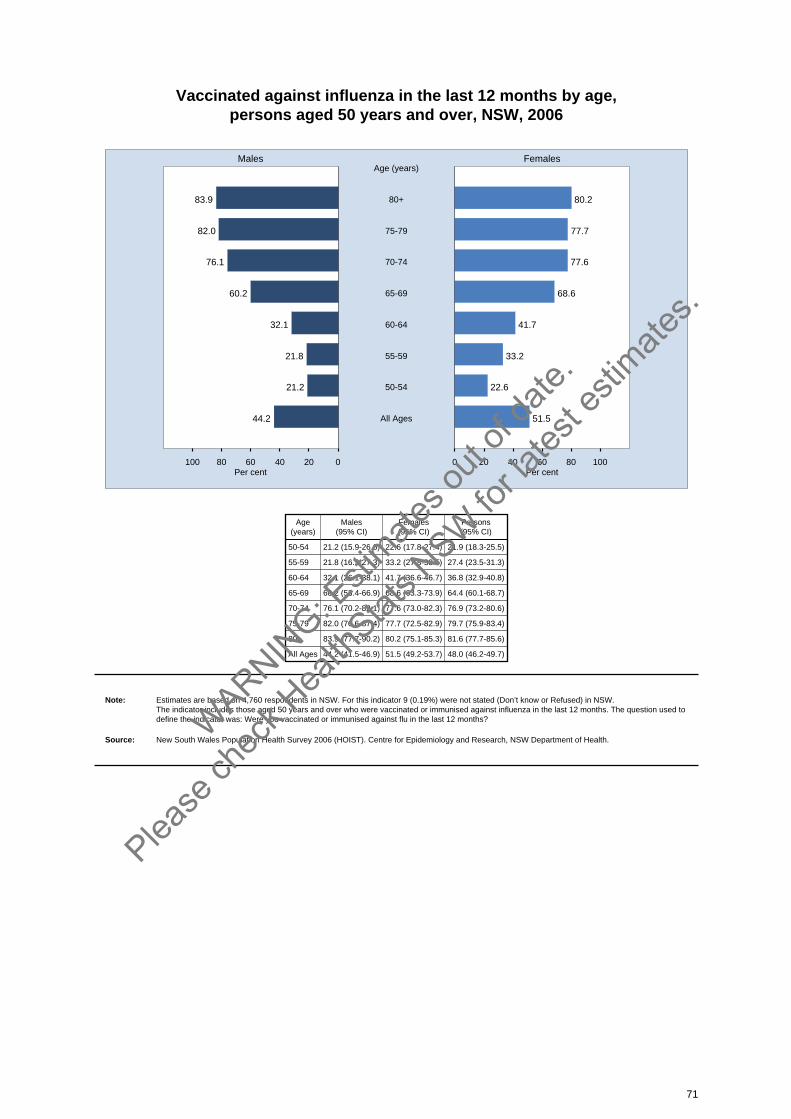
Vaccinated against influenza in the last 12 months by age, persons aged 50 years and over, NSW, 2006
020406080100 0 20 40 60 80 100
Males Females
Per cent Per cent
83.9 80.280+
Age (years)
82.0 77.775-79
76.1 77.670-74
60.2 68.665-69
32.1 41.760-64
21.8 33.255-59
21.2 22.650-54
44.2 51.5All Ages
Age(years)
Males(95% CI)
Females(95% CI)
Persons(95% CI)
50-54 21.2 (15.9-26.6) 22.6 (17.8-27.4) 21.9 (18.3-25.5)
55-59 21.8 (16.2-27.3) 33.2 (27.8-38.5) 27.4 (23.5-31.3)
60-64 32.1 (26.1-38.1) 41.7 (36.6-46.7) 36.8 (32.9-40.8)
65-69 60.2 (53.4-66.9) 68.6 (63.3-73.9) 64.4 (60.1-68.7)
70-74 76.1 (70.2-82.1) 77.6 (73.0-82.3) 76.9 (73.2-80.6)
75-79 82.0 (76.6-87.4) 77.7 (72.5-82.9) 79.7 (75.9-83.4)
80+ 83.9 (77.7-90.2) 80.2 (75.1-85.3) 81.6 (77.7-85.6)
All Ages 44.2 (41.5-46.9) 51.5 (49.2-53.7) 48.0 (46.2-49.7)
Note: Estimates are based on 4,760 respondents in NSW. For this indicator 9 (0.19%) were not stated (Don’t know or Refused) in NSW. The indicator includes those aged 50 years and over who were vaccinated or immunised against influenza in the last 12 months. The question used todefine the indicator was: Were you vaccinated or immunised against flu in the last 12 months?
Source: New South Wales Population Health Survey 2006 (HOIST). Centre for Epidemiology and Research, NSW Department of Health.
71
WARNIN
G: Esti
mates o
ut of
date.
Please
chec
k Hea
lthStat
s NSW
for la
test e
stimate
s.
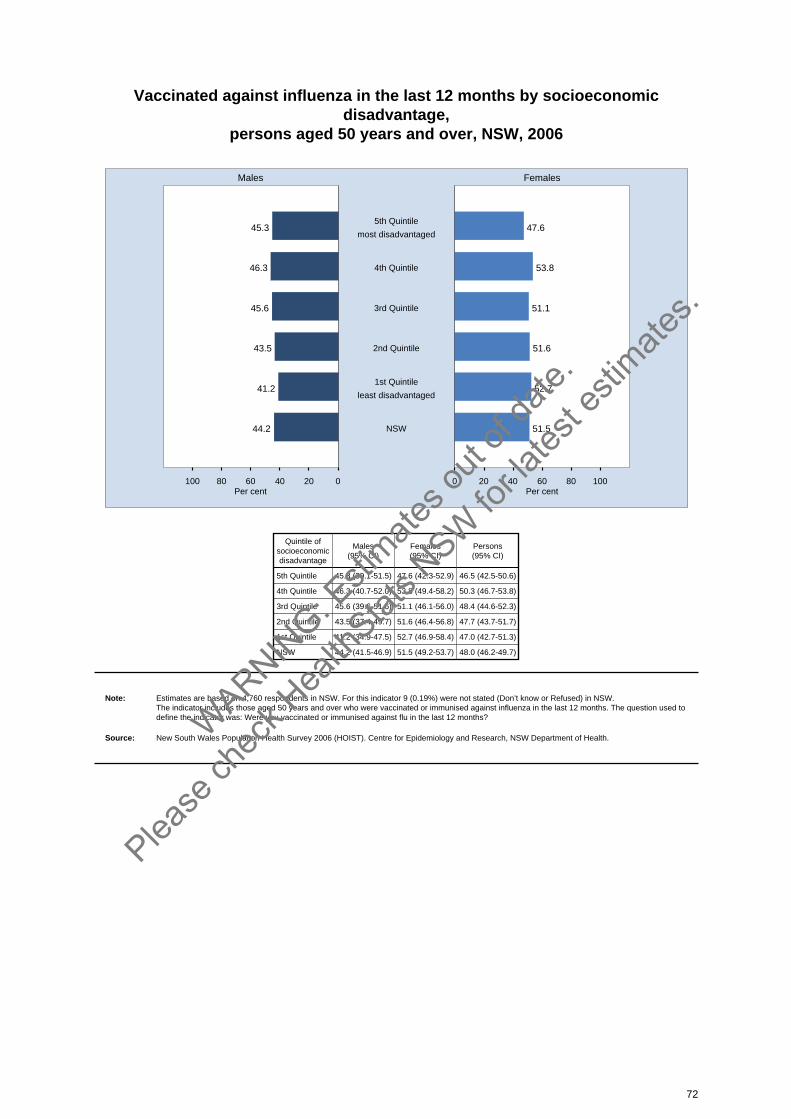
Vaccinated against influenza in the last 12 months by socioeconomicdisadvantage,
persons aged 50 years and over, NSW, 2006
020406080100 0 20 40 60 80 100
Males Females
Per cent Per cent
45.3 47.65th Quintile
most disadvantaged
46.3 53.84th Quintile
45.6 51.13rd Quintile
43.5 51.62nd Quintile
41.2 52.71st Quintile
least disadvantaged
44.2 51.5NSW
Quintile ofsocioeconomicdisadvantage
Males(95% CI)
Females(95% CI)
Persons(95% CI)
5th Quintile 45.3 (39.1-51.5) 47.6 (42.3-52.9) 46.5 (42.5-50.6)
4th Quintile 46.3 (40.7-52.0) 53.8 (49.4-58.2) 50.3 (46.7-53.8)
3rd Quintile 45.6 (39.6-51.6) 51.1 (46.1-56.0) 48.4 (44.6-52.3)
2nd Quintile 43.5 (37.4-49.7) 51.6 (46.4-56.8) 47.7 (43.7-51.7)
1st Quintile 41.2 (34.9-47.5) 52.7 (46.9-58.4) 47.0 (42.7-51.3)
NSW 44.2 (41.5-46.9) 51.5 (49.2-53.7) 48.0 (46.2-49.7)
Note: Estimates are based on 4,760 respondents in NSW. For this indicator 9 (0.19%) were not stated (Don’t know or Refused) in NSW. The indicator includes those aged 50 years and over who were vaccinated or immunised against influenza in the last 12 months. The question used todefine the indicator was: Were you vaccinated or immunised against flu in the last 12 months?
Source: New South Wales Population Health Survey 2006 (HOIST). Centre for Epidemiology and Research, NSW Department of Health.
72
WARNIN
G: Esti
mates o
ut of
date.
Please
chec
k Hea
lthStat
s NSW
for la
test e
stimate
s.
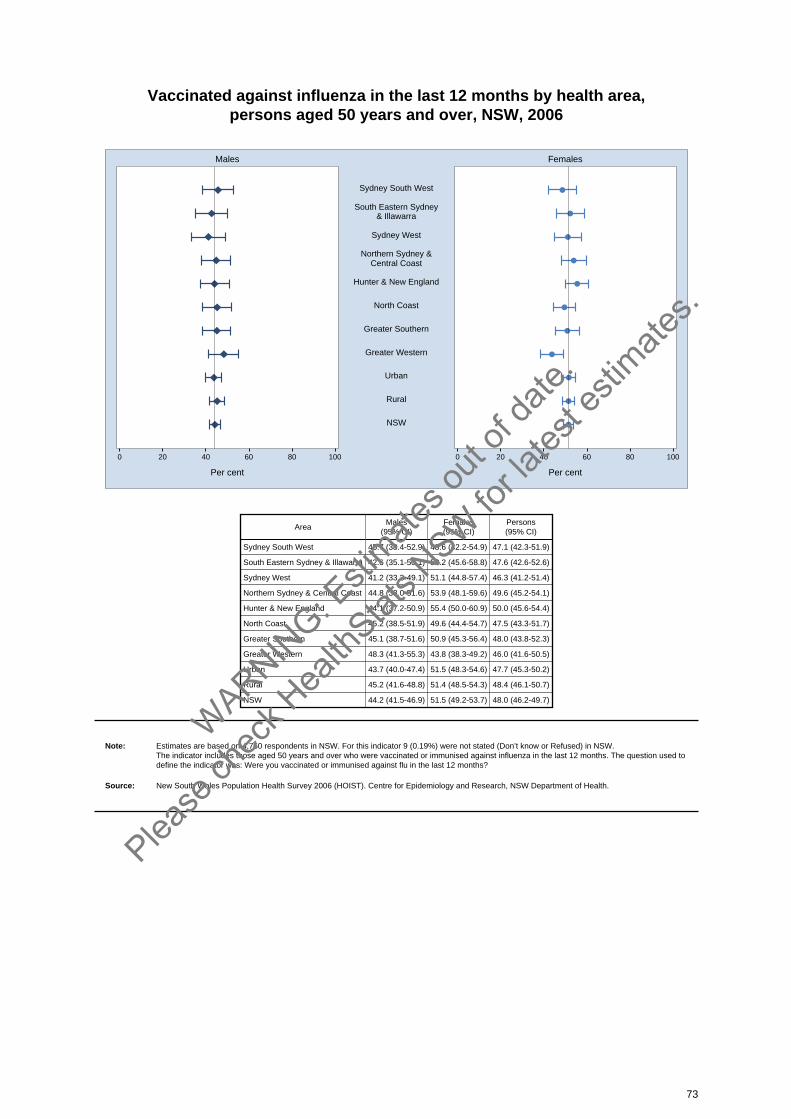
Vaccinated against influenza in the last 12 months by health area, persons aged 50 years and over, NSW, 2006
0 20 40 60 80 100 0 20 40 60 80 100
Males Females
Per cent Per cent
Sydney South West
South Eastern Sydney& Illawarra
Sydney West
Northern Sydney &Central Coast
Hunter & New England
North Coast
Greater Southern
Greater Western
Urban
Rural
NSW
AreaMales
(95% CI)Females(95% CI)
Persons(95% CI)
Sydney South West 45.7 (38.4-52.9) 48.6 (42.2-54.9) 47.1 (42.3-51.9)
South Eastern Sydney & Illawarra 42.6 (35.1-50.1) 52.2 (45.6-58.8) 47.6 (42.6-52.6)
Sydney West 41.2 (33.3-49.1) 51.1 (44.8-57.4) 46.3 (41.2-51.4)
Northern Sydney & Central Coast 44.8 (38.0-51.6) 53.9 (48.1-59.6) 49.6 (45.2-54.1)
Hunter & New England 44.1 (37.2-50.9) 55.4 (50.0-60.9) 50.0 (45.6-54.4)
North Coast 45.2 (38.5-51.9) 49.6 (44.4-54.7) 47.5 (43.3-51.7)
Greater Southern 45.1 (38.7-51.6) 50.9 (45.3-56.4) 48.0 (43.8-52.3)
Greater Western 48.3 (41.3-55.3) 43.8 (38.3-49.2) 46.0 (41.6-50.5)
Urban 43.7 (40.0-47.4) 51.5 (48.3-54.6) 47.7 (45.3-50.2)
Rural 45.2 (41.6-48.8) 51.4 (48.5-54.3) 48.4 (46.1-50.7)
NSW 44.2 (41.5-46.9) 51.5 (49.2-53.7) 48.0 (46.2-49.7)
Note: Estimates are based on 4,760 respondents in NSW. For this indicator 9 (0.19%) were not stated (Don’t know or Refused) in NSW. The indicator includes those aged 50 years and over who were vaccinated or immunised against influenza in the last 12 months. The question used todefine the indicator was: Were you vaccinated or immunised against flu in the last 12 months?
Source: New South Wales Population Health Survey 2006 (HOIST). Centre for Epidemiology and Research, NSW Department of Health.
73
WARNIN
G: Esti
mates o
ut of
date.
Please
chec
k Hea
lthStat
s NSW
for la
test e
stimate
s.
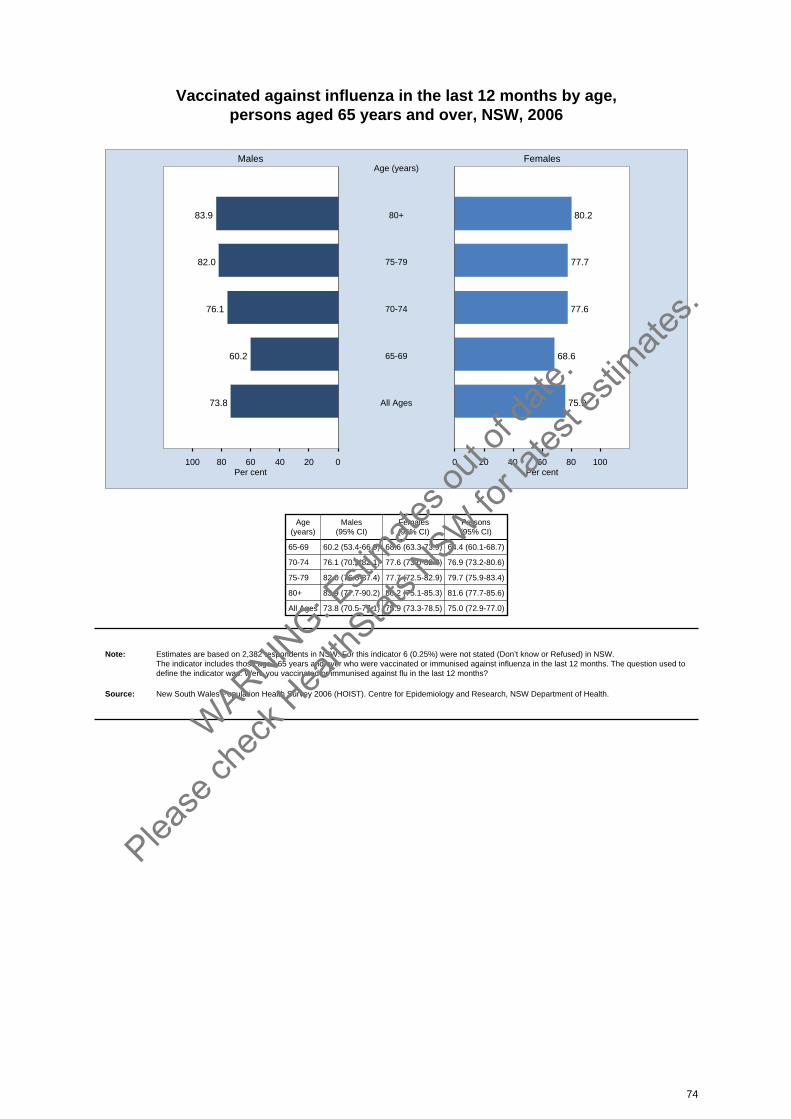
Vaccinated against influenza in the last 12 months by age, persons aged 65 years and over, NSW, 2006
020406080100 0 20 40 60 80 100
Males Females
Per cent Per cent
83.9 80.280+
Age (years)
82.0 77.775-79
76.1 77.670-74
60.2 68.665-69
73.8 75.9All Ages
Age(years)
Males(95% CI)
Females(95% CI)
Persons(95% CI)
65-69 60.2 (53.4-66.9) 68.6 (63.3-73.9) 64.4 (60.1-68.7)
70-74 76.1 (70.2-82.1) 77.6 (73.0-82.3) 76.9 (73.2-80.6)
75-79 82.0 (76.6-87.4) 77.7 (72.5-82.9) 79.7 (75.9-83.4)
80+ 83.9 (77.7-90.2) 80.2 (75.1-85.3) 81.6 (77.7-85.6)
All Ages 73.8 (70.5-77.1) 75.9 (73.3-78.5) 75.0 (72.9-77.0)
Note: Estimates are based on 2,382 respondents in NSW. For this indicator 6 (0.25%) were not stated (Don’t know or Refused) in NSW. The indicator includes those aged 65 years and over who were vaccinated or immunised against influenza in the last 12 months. The question used todefine the indicator was: Were you vaccinated or immunised against flu in the last 12 months?
Source: New South Wales Population Health Survey 2006 (HOIST). Centre for Epidemiology and Research, NSW Department of Health.
74
WARNIN
G: Esti
mates o
ut of
date.
Please
chec
k Hea
lthStat
s NSW
for la
test e
stimate
s.
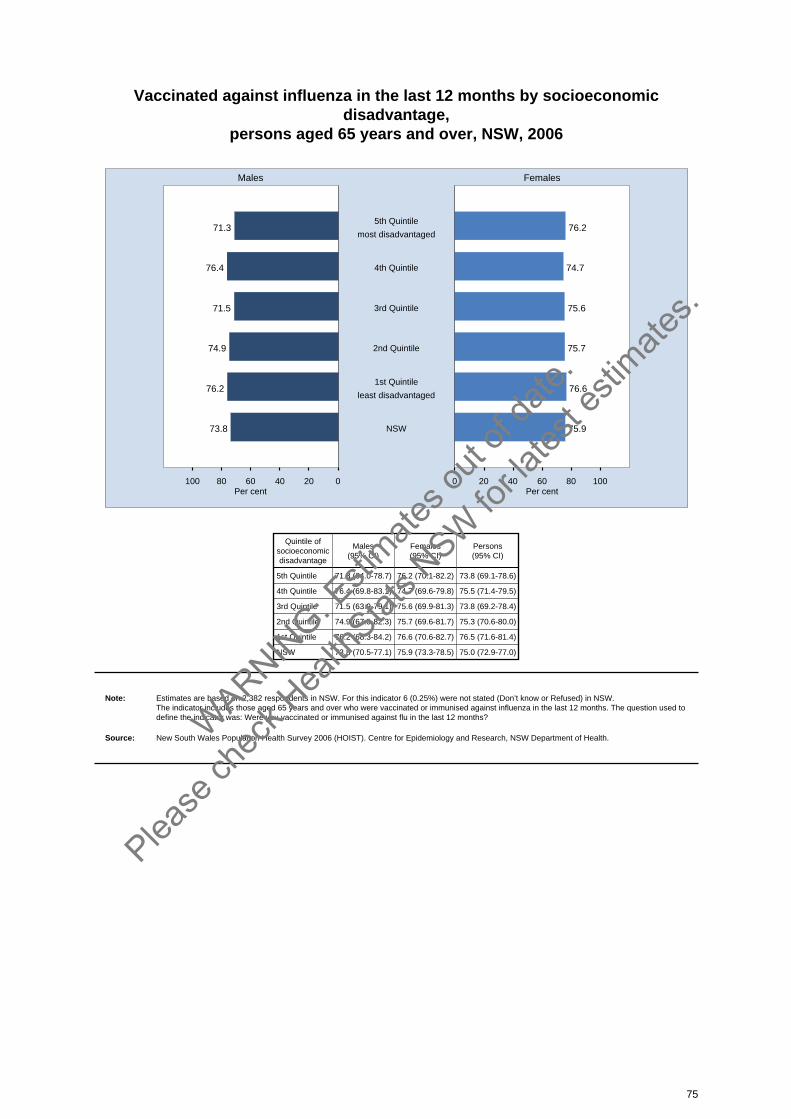
Vaccinated against influenza in the last 12 months by socioeconomicdisadvantage,
persons aged 65 years and over, NSW, 2006
020406080100 0 20 40 60 80 100
Males Females
Per cent Per cent
71.3 76.25th Quintile
most disadvantaged
76.4 74.74th Quintile
71.5 75.63rd Quintile
74.9 75.72nd Quintile
76.2 76.61st Quintile
least disadvantaged
73.8 75.9NSW
Quintile ofsocioeconomicdisadvantage
Males(95% CI)
Females(95% CI)
Persons(95% CI)
5th Quintile 71.3 (64.0-78.7) 76.2 (70.1-82.2) 73.8 (69.1-78.6)
4th Quintile 76.4 (69.8-83.1) 74.7 (69.6-79.8) 75.5 (71.4-79.5)
3rd Quintile 71.5 (63.9-79.1) 75.6 (69.9-81.3) 73.8 (69.2-78.4)
2nd Quintile 74.9 (67.5-82.3) 75.7 (69.6-81.7) 75.3 (70.6-80.0)
1st Quintile 76.2 (68.3-84.2) 76.6 (70.6-82.7) 76.5 (71.6-81.4)
NSW 73.8 (70.5-77.1) 75.9 (73.3-78.5) 75.0 (72.9-77.0)
Note: Estimates are based on 2,382 respondents in NSW. For this indicator 6 (0.25%) were not stated (Don’t know or Refused) in NSW. The indicator includes those aged 65 years and over who were vaccinated or immunised against influenza in the last 12 months. The question used todefine the indicator was: Were you vaccinated or immunised against flu in the last 12 months?
Source: New South Wales Population Health Survey 2006 (HOIST). Centre for Epidemiology and Research, NSW Department of Health.
75
WARNIN
G: Esti
mates o
ut of
date.
Please
chec
k Hea
lthStat
s NSW
for la
test e
stimate
s.
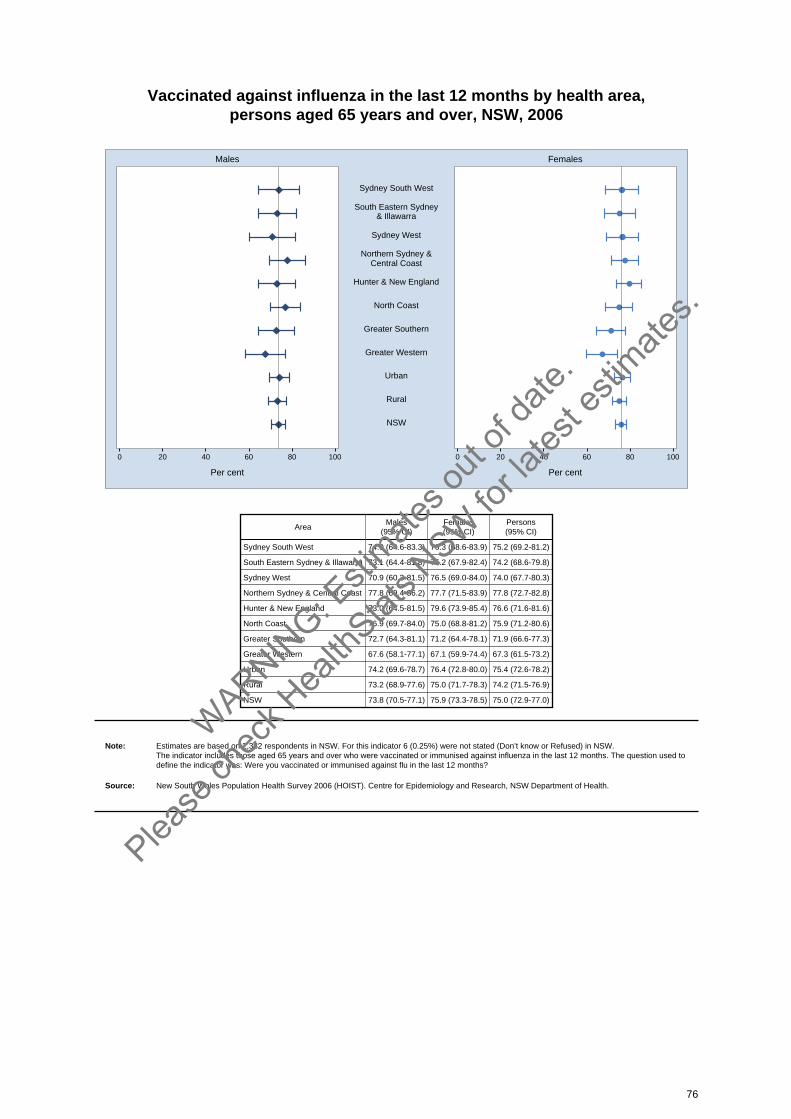
Vaccinated against influenza in the last 12 months by health area, persons aged 65 years and over, NSW, 2006
0 20 40 60 80 100 0 20 40 60 80 100
Males Females
Per cent Per cent
Sydney South West
South Eastern Sydney& Illawarra
Sydney West
Northern Sydney &Central Coast
Hunter & New England
North Coast
Greater Southern
Greater Western
Urban
Rural
NSW
AreaMales
(95% CI)Females(95% CI)
Persons(95% CI)
Sydney South West 74.0 (64.6-83.3) 76.3 (68.6-83.9) 75.2 (69.2-81.2)
South Eastern Sydney & Illawarra 73.1 (64.4-81.8) 75.2 (67.9-82.4) 74.2 (68.6-79.8)
Sydney West 70.9 (60.3-81.5) 76.5 (69.0-84.0) 74.0 (67.7-80.3)
Northern Sydney & Central Coast 77.8 (69.4-86.2) 77.7 (71.5-83.9) 77.8 (72.7-82.8)
Hunter & New England 73.0 (64.5-81.5) 79.6 (73.9-85.4) 76.6 (71.6-81.6)
North Coast 76.9 (69.7-84.0) 75.0 (68.8-81.2) 75.9 (71.2-80.6)
Greater Southern 72.7 (64.3-81.1) 71.2 (64.4-78.1) 71.9 (66.6-77.3)
Greater Western 67.6 (58.1-77.1) 67.1 (59.9-74.4) 67.3 (61.5-73.2)
Urban 74.2 (69.6-78.7) 76.4 (72.8-80.0) 75.4 (72.6-78.2)
Rural 73.2 (68.9-77.6) 75.0 (71.7-78.3) 74.2 (71.5-76.9)
NSW 73.8 (70.5-77.1) 75.9 (73.3-78.5) 75.0 (72.9-77.0)
Note: Estimates are based on 2,382 respondents in NSW. For this indicator 6 (0.25%) were not stated (Don’t know or Refused) in NSW. The indicator includes those aged 65 years and over who were vaccinated or immunised against influenza in the last 12 months. The question used todefine the indicator was: Were you vaccinated or immunised against flu in the last 12 months?
Source: New South Wales Population Health Survey 2006 (HOIST). Centre for Epidemiology and Research, NSW Department of Health.
76
WARNIN
G: Esti
mates o
ut of
date.
Please
chec
k Hea
lthStat
s NSW
for la
test e
stimate
s.
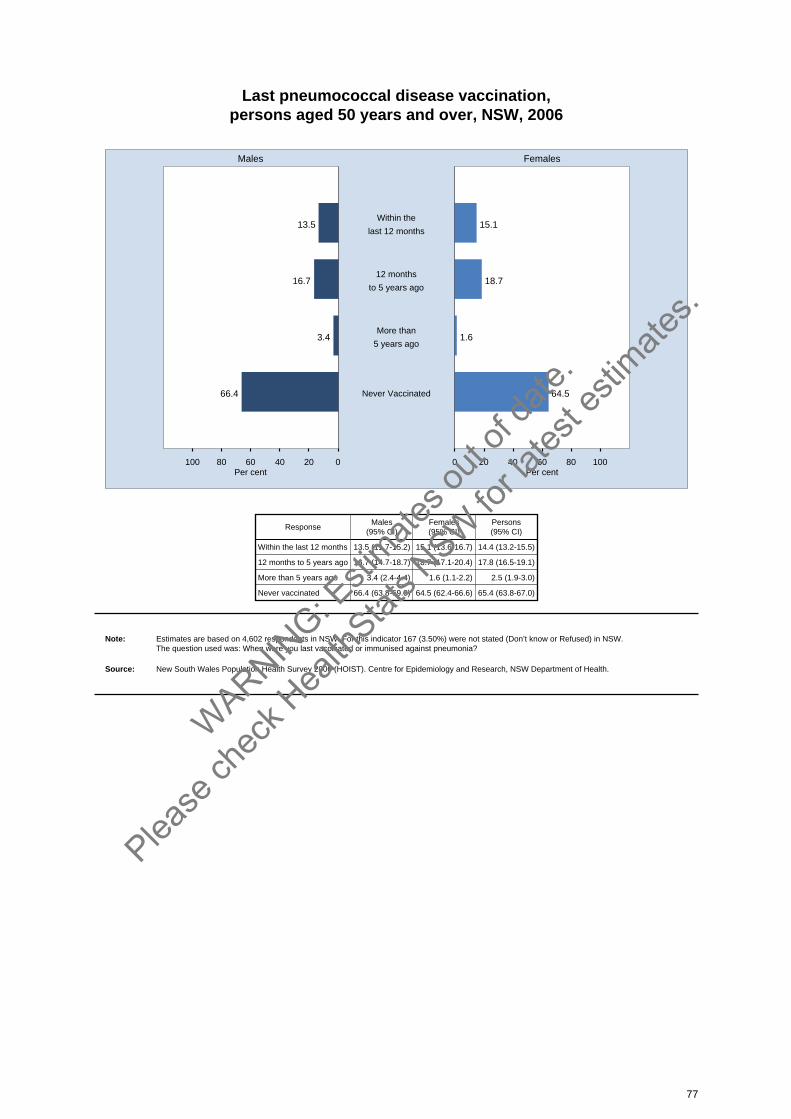
Last pneumococcal disease vaccination, persons aged 50 years and over, NSW, 2006
020406080100 0 20 40 60 80 100
Males Females
Per cent Per cent
13.5 15.1Within the
last 12 months
16.7 18.712 months
to 5 years ago
3.4 1.6More than
5 years ago
66.4 64.5Never Vaccinated
ResponseMales
(95% CI)Females(95% CI)
Persons(95% CI)
Within the last 12 months 13.5 (11.7-15.2) 15.1 (13.6-16.7) 14.4 (13.2-15.5)
12 months to 5 years ago 16.7 (14.7-18.7) 18.7 (17.1-20.4) 17.8 (16.5-19.1)
More than 5 years ago 3.4 (2.4-4.4) 1.6 (1.1-2.2) 2.5 (1.9-3.0)
Never vaccinated 66.4 (63.8-69.0) 64.5 (62.4-66.6) 65.4 (63.8-67.0)
Note: Estimates are based on 4,602 respondents in NSW. For this indicator 167 (3.50%) were not stated (Don’t know or Refused) in NSW. The question used was: When were you last vaccinated or immunised against pneumonia?
Source: New South Wales Population Health Survey 2006 (HOIST). Centre for Epidemiology and Research, NSW Department of Health.
77
WARNIN
G: Esti
mates o
ut of
date.
Please
chec
k Hea
lthStat
s NSW
for la
test e
stimate
s.
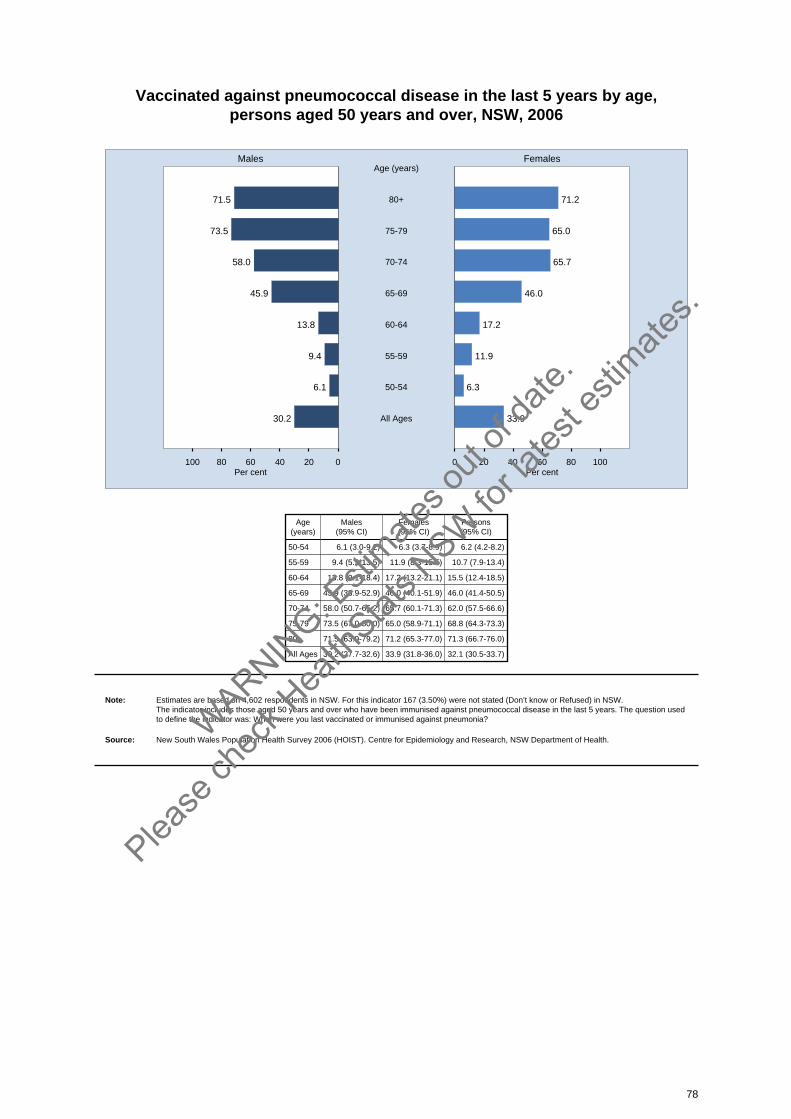
Vaccinated against pneumococcal disease in the last 5 years by age, persons aged 50 years and over, NSW, 2006
020406080100 0 20 40 60 80 100
Males Females
Per cent Per cent
71.5 71.280+
Age (years)
73.5 65.075-79
58.0 65.770-74
45.9 46.065-69
13.8 17.260-64
9.4 11.955-59
6.1 6.350-54
30.2 33.9All Ages
Age(years)
Males(95% CI)
Females(95% CI)
Persons(95% CI)
50-54 6.1 (3.0-9.2) 6.3 (3.7-8.9) 6.2 (4.2-8.2)
55-59 9.4 (5.2-13.5) 11.9 (8.3-15.5) 10.7 (7.9-13.4)
60-64 13.8 (9.1-18.4) 17.2 (13.2-21.1) 15.5 (12.4-18.5)
65-69 45.9 (38.9-52.9) 46.0 (40.1-51.9) 46.0 (41.4-50.5)
70-74 58.0 (50.7-65.2) 65.7 (60.1-71.3) 62.0 (57.5-66.6)
75-79 73.5 (67.0-80.0) 65.0 (58.9-71.1) 68.8 (64.3-73.3)
80+ 71.5 (63.9-79.2) 71.2 (65.3-77.0) 71.3 (66.7-76.0)
All Ages 30.2 (27.7-32.6) 33.9 (31.8-36.0) 32.1 (30.5-33.7)
Note: Estimates are based on 4,602 respondents in NSW. For this indicator 167 (3.50%) were not stated (Don’t know or Refused) in NSW. The indicator includes those aged 50 years and over who have been immunised against pneumococcal disease in the last 5 years. The question usedto define the indicator was: When were you last vaccinated or immunised against pneumonia?
Source: New South Wales Population Health Survey 2006 (HOIST). Centre for Epidemiology and Research, NSW Department of Health.
78
WARNIN
G: Esti
mates o
ut of
date.
Please
chec
k Hea
lthStat
s NSW
for la
test e
stimate
s.
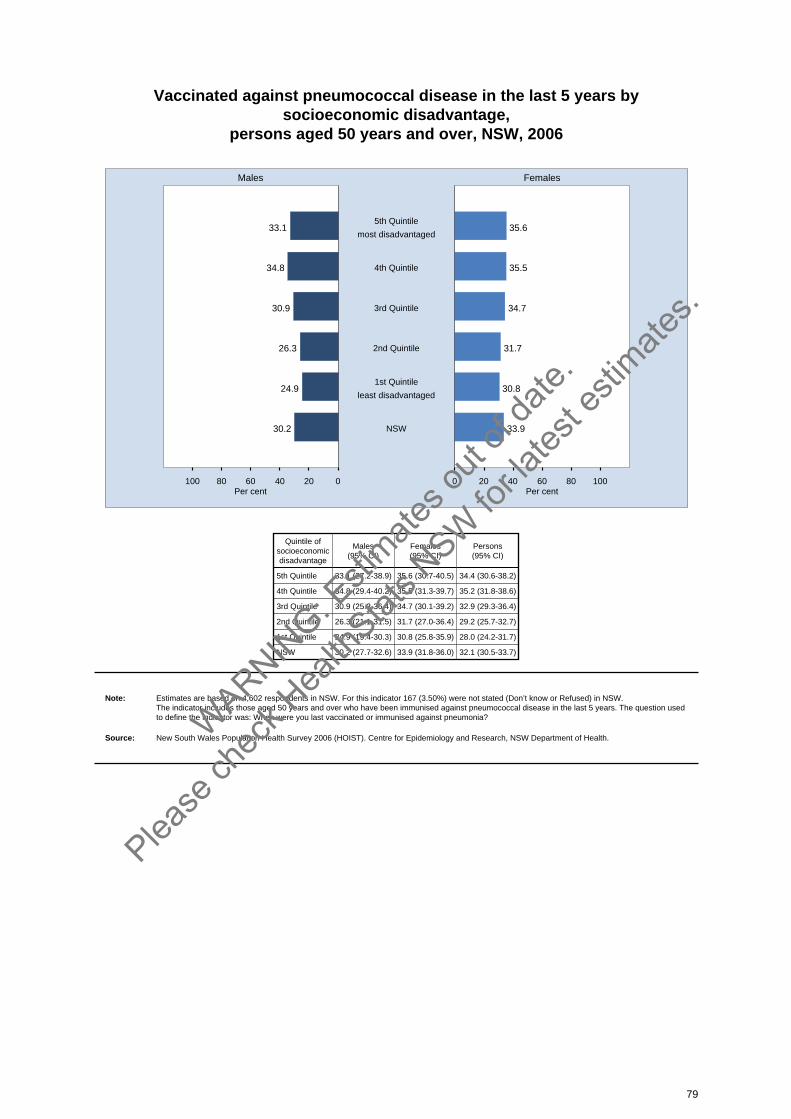
Vaccinated against pneumococcal disease in the last 5 years bysocioeconomic disadvantage,
persons aged 50 years and over, NSW, 2006
020406080100 0 20 40 60 80 100
Males Females
Per cent Per cent
33.1 35.65th Quintile
most disadvantaged
34.8 35.54th Quintile
30.9 34.73rd Quintile
26.3 31.72nd Quintile
24.9 30.81st Quintile
least disadvantaged
30.2 33.9NSW
Quintile ofsocioeconomicdisadvantage
Males(95% CI)
Females(95% CI)
Persons(95% CI)
5th Quintile 33.1 (27.2-38.9) 35.6 (30.7-40.5) 34.4 (30.6-38.2)
4th Quintile 34.8 (29.4-40.2) 35.5 (31.3-39.7) 35.2 (31.8-38.6)
3rd Quintile 30.9 (25.3-36.4) 34.7 (30.1-39.2) 32.9 (29.3-36.4)
2nd Quintile 26.3 (21.1-31.5) 31.7 (27.0-36.4) 29.2 (25.7-32.7)
1st Quintile 24.9 (19.4-30.3) 30.8 (25.8-35.9) 28.0 (24.2-31.7)
NSW 30.2 (27.7-32.6) 33.9 (31.8-36.0) 32.1 (30.5-33.7)
Note: Estimates are based on 4,602 respondents in NSW. For this indicator 167 (3.50%) were not stated (Don’t know or Refused) in NSW. The indicator includes those aged 50 years and over who have been immunised against pneumococcal disease in the last 5 years. The question usedto define the indicator was: When were you last vaccinated or immunised against pneumonia?
Source: New South Wales Population Health Survey 2006 (HOIST). Centre for Epidemiology and Research, NSW Department of Health.
79
WARNIN
G: Esti
mates o
ut of
date.
Please
chec
k Hea
lthStat
s NSW
for la
test e
stimate
s.
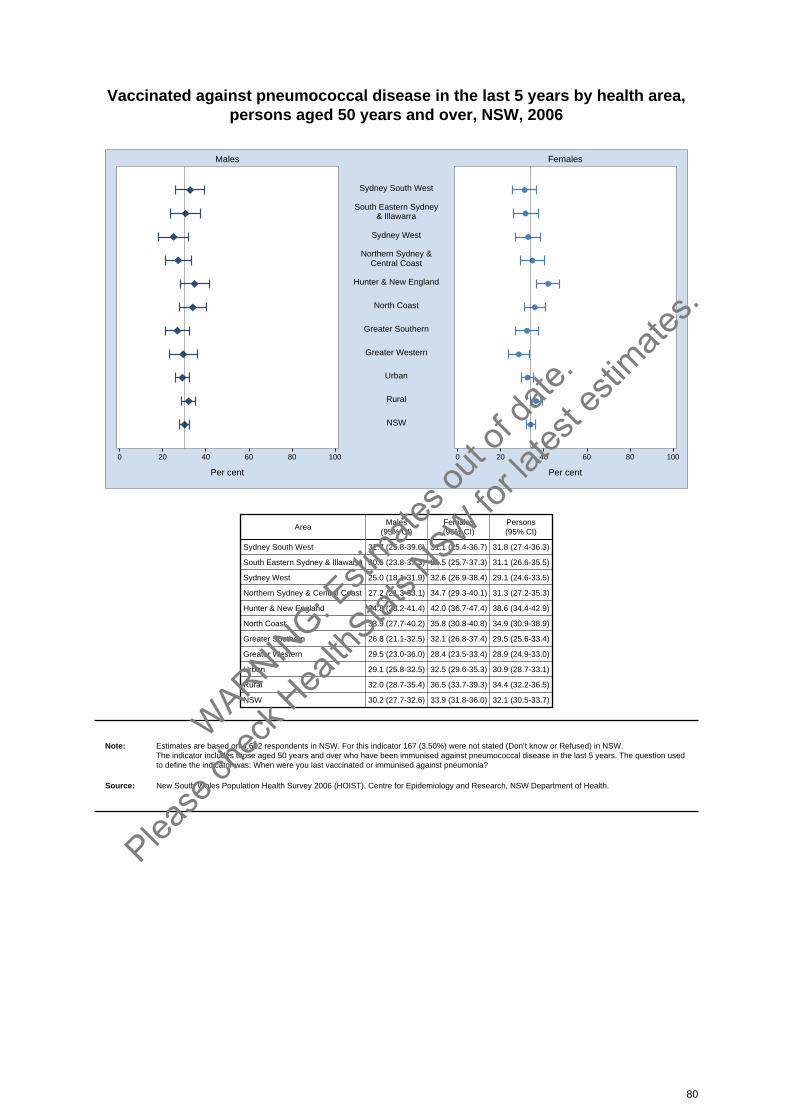
Vaccinated against pneumococcal disease in the last 5 years by health area, persons aged 50 years and over, NSW, 2006
0 20 40 60 80 100 0 20 40 60 80 100
Males Females
Per cent Per cent
Sydney South West
South Eastern Sydney& Illawarra
Sydney West
Northern Sydney &Central Coast
Hunter & New England
North Coast
Greater Southern
Greater Western
Urban
Rural
NSW
AreaMales
(95% CI)Females(95% CI)
Persons(95% CI)
Sydney South West 32.7 (25.8-39.6) 31.1 (25.4-36.7) 31.8 (27.4-36.3)
South Eastern Sydney & Illawarra 30.6 (23.8-37.3) 31.5 (25.7-37.3) 31.1 (26.6-35.5)
Sydney West 25.0 (18.1-31.9) 32.6 (26.9-38.4) 29.1 (24.6-33.5)
Northern Sydney & Central Coast 27.2 (21.3-33.1) 34.7 (29.3-40.1) 31.3 (27.2-35.3)
Hunter & New England 34.8 (28.2-41.4) 42.0 (36.7-47.4) 38.6 (34.4-42.9)
North Coast 33.9 (27.7-40.2) 35.8 (30.8-40.8) 34.9 (30.9-38.9)
Greater Southern 26.8 (21.1-32.5) 32.1 (26.8-37.4) 29.5 (25.6-33.4)
Greater Western 29.5 (23.0-36.0) 28.4 (23.5-33.4) 28.9 (24.9-33.0)
Urban 29.1 (25.8-32.5) 32.5 (29.6-35.3) 30.9 (28.7-33.1)
Rural 32.0 (28.7-35.4) 36.5 (33.7-39.3) 34.4 (32.2-36.5)
NSW 30.2 (27.7-32.6) 33.9 (31.8-36.0) 32.1 (30.5-33.7)
Note: Estimates are based on 4,602 respondents in NSW. For this indicator 167 (3.50%) were not stated (Don’t know or Refused) in NSW. The indicator includes those aged 50 years and over who have been immunised against pneumococcal disease in the last 5 years. The question usedto define the indicator was: When were you last vaccinated or immunised against pneumonia?
Source: New South Wales Population Health Survey 2006 (HOIST). Centre for Epidemiology and Research, NSW Department of Health.
80
WARNIN
G: Esti
mates o
ut of
date.
Please
chec
k Hea
lthStat
s NSW
for la
test e
stimate
s.
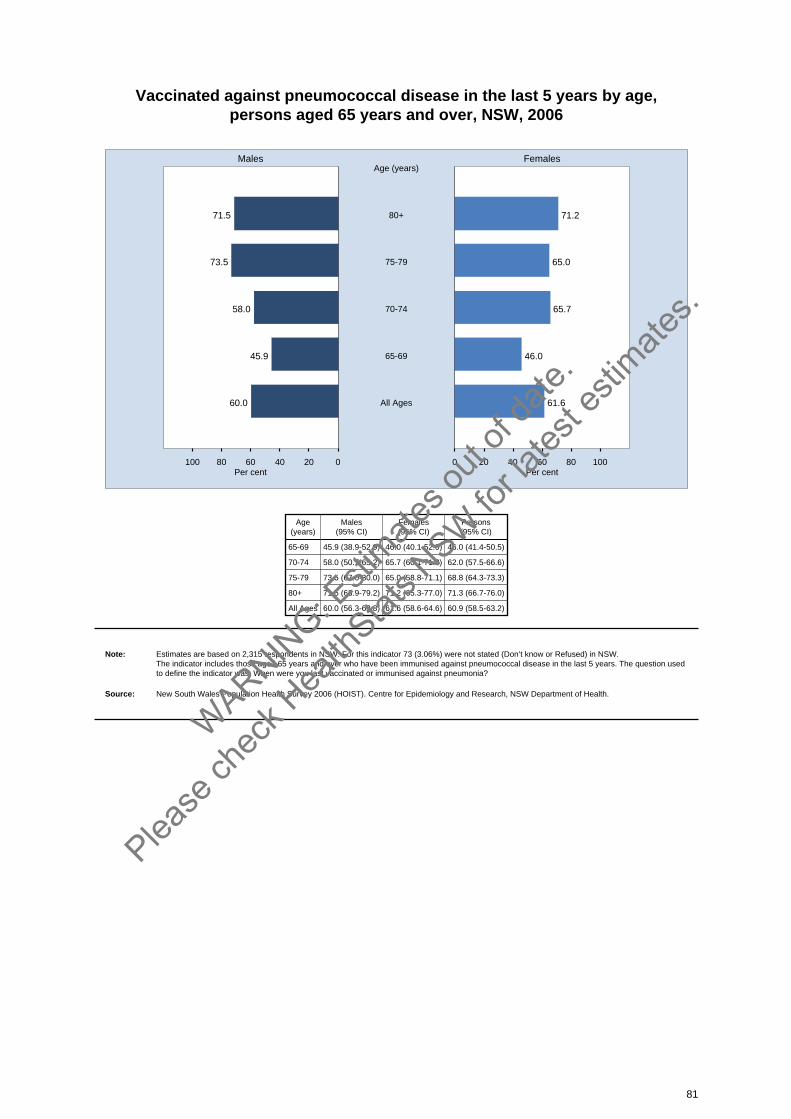
Vaccinated against pneumococcal disease in the last 5 years by age, persons aged 65 years and over, NSW, 2006
020406080100 0 20 40 60 80 100
Males Females
Per cent Per cent
71.5 71.280+
Age (years)
73.5 65.075-79
58.0 65.770-74
45.9 46.065-69
60.0 61.6All Ages
Age(years)
Males(95% CI)
Females(95% CI)
Persons(95% CI)
65-69 45.9 (38.9-52.9) 46.0 (40.1-52.0) 46.0 (41.4-50.5)
70-74 58.0 (50.7-65.2) 65.7 (60.1-71.3) 62.0 (57.5-66.6)
75-79 73.5 (67.0-80.0) 65.0 (58.8-71.1) 68.8 (64.3-73.3)
80+ 71.5 (63.9-79.2) 71.2 (65.3-77.0) 71.3 (66.7-76.0)
All Ages 60.0 (56.3-63.8) 61.6 (58.6-64.6) 60.9 (58.5-63.2)
Note: Estimates are based on 2,315 respondents in NSW. For this indicator 73 (3.06%) were not stated (Don’t know or Refused) in NSW. The indicator includes those aged 65 years and over who have been immunised against pneumococcal disease in the last 5 years. The question usedto define the indicator was: When were you last vaccinated or immunised against pneumonia?
Source: New South Wales Population Health Survey 2006 (HOIST). Centre for Epidemiology and Research, NSW Department of Health.
81
WARNIN
G: Esti
mates o
ut of
date.
Please
chec
k Hea
lthStat
s NSW
for la
test e
stimate
s.
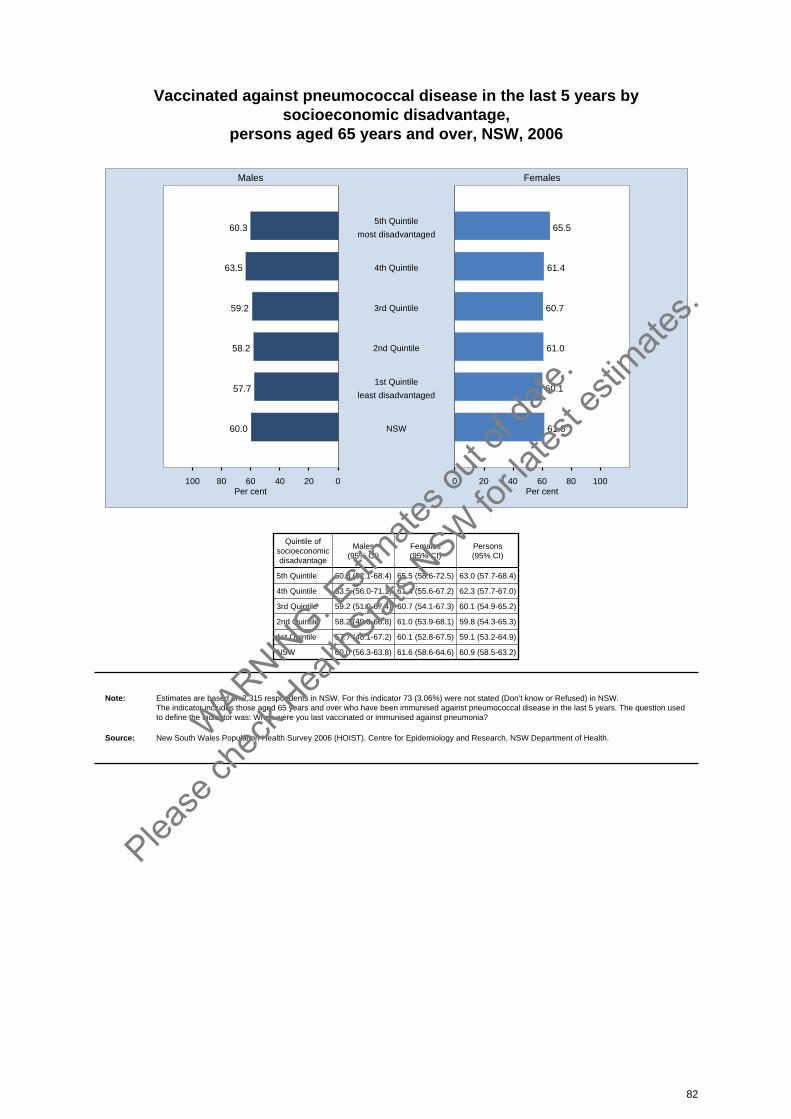
Vaccinated against pneumococcal disease in the last 5 years bysocioeconomic disadvantage,
persons aged 65 years and over, NSW, 2006
020406080100 0 20 40 60 80 100
Males Females
Per cent Per cent
60.3 65.55th Quintile
most disadvantaged
63.5 61.44th Quintile
59.2 60.73rd Quintile
58.2 61.02nd Quintile
57.7 60.11st Quintile
least disadvantaged
60.0 61.6NSW
Quintile ofsocioeconomicdisadvantage
Males(95% CI)
Females(95% CI)
Persons(95% CI)
5th Quintile 60.3 (52.1-68.4) 65.5 (58.6-72.5) 63.0 (57.7-68.4)
4th Quintile 63.5 (56.0-71.1) 61.4 (55.6-67.2) 62.3 (57.7-67.0)
3rd Quintile 59.2 (51.0-67.4) 60.7 (54.1-67.3) 60.1 (54.9-65.2)
2nd Quintile 58.2 (49.5-66.8) 61.0 (53.9-68.1) 59.8 (54.3-65.3)
1st Quintile 57.7 (48.1-67.2) 60.1 (52.8-67.5) 59.1 (53.2-64.9)
NSW 60.0 (56.3-63.8) 61.6 (58.6-64.6) 60.9 (58.5-63.2)
Note: Estimates are based on 2,315 respondents in NSW. For this indicator 73 (3.06%) were not stated (Don’t know or Refused) in NSW. The indicator includes those aged 65 years and over who have been immunised against pneumococcal disease in the last 5 years. The question usedto define the indicator was: When were you last vaccinated or immunised against pneumonia?
Source: New South Wales Population Health Survey 2006 (HOIST). Centre for Epidemiology and Research, NSW Department of Health.
82
WARNIN
G: Esti
mates o
ut of
date.
Please
chec
k Hea
lthStat
s NSW
for la
test e
stimate
s.
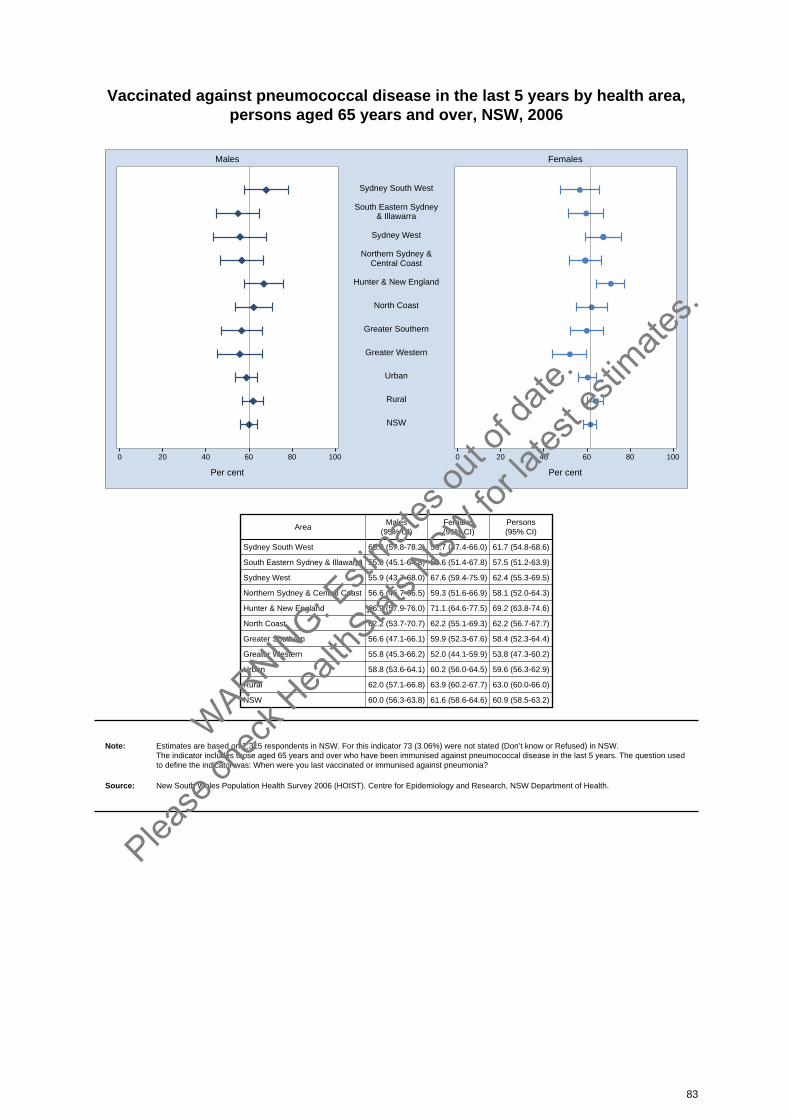
Vaccinated against pneumococcal disease in the last 5 years by health area, persons aged 65 years and over, NSW, 2006
0 20 40 60 80 100 0 20 40 60 80 100
Males Females
Per cent Per cent
Sydney South West
South Eastern Sydney& Illawarra
Sydney West
Northern Sydney &Central Coast
Hunter & New England
North Coast
Greater Southern
Greater Western
Urban
Rural
NSW
AreaMales
(95% CI)Females(95% CI)
Persons(95% CI)
Sydney South West 68.0 (57.8-78.2) 56.7 (47.4-66.0) 61.7 (54.8-68.6)
South Eastern Sydney & Illawarra 55.0 (45.1-64.8) 59.6 (51.4-67.8) 57.5 (51.2-63.9)
Sydney West 55.9 (43.7-68.0) 67.6 (59.4-75.9) 62.4 (55.3-69.5)
Northern Sydney & Central Coast 56.6 (46.7-66.5) 59.3 (51.6-66.9) 58.1 (52.0-64.3)
Hunter & New England 66.9 (57.9-76.0) 71.1 (64.6-77.5) 69.2 (63.8-74.6)
North Coast 62.2 (53.7-70.7) 62.2 (55.1-69.3) 62.2 (56.7-67.7)
Greater Southern 56.6 (47.1-66.1) 59.9 (52.3-67.6) 58.4 (52.3-64.4)
Greater Western 55.8 (45.3-66.2) 52.0 (44.1-59.9) 53.8 (47.3-60.2)
Urban 58.8 (53.6-64.1) 60.2 (56.0-64.5) 59.6 (56.3-62.9)
Rural 62.0 (57.1-66.8) 63.9 (60.2-67.7) 63.0 (60.0-66.0)
NSW 60.0 (56.3-63.8) 61.6 (58.6-64.6) 60.9 (58.5-63.2)
Note: Estimates are based on 2,315 respondents in NSW. For this indicator 73 (3.06%) were not stated (Don’t know or Refused) in NSW. The indicator includes those aged 65 years and over who have been immunised against pneumococcal disease in the last 5 years. The question usedto define the indicator was: When were you last vaccinated or immunised against pneumonia?
Source: New South Wales Population Health Survey 2006 (HOIST). Centre for Epidemiology and Research, NSW Department of Health.
83
WARNIN
G: Esti
mates o
ut of
date.
Please
chec
k Hea
lthStat
s NSW
for la
test e
stimate
s.
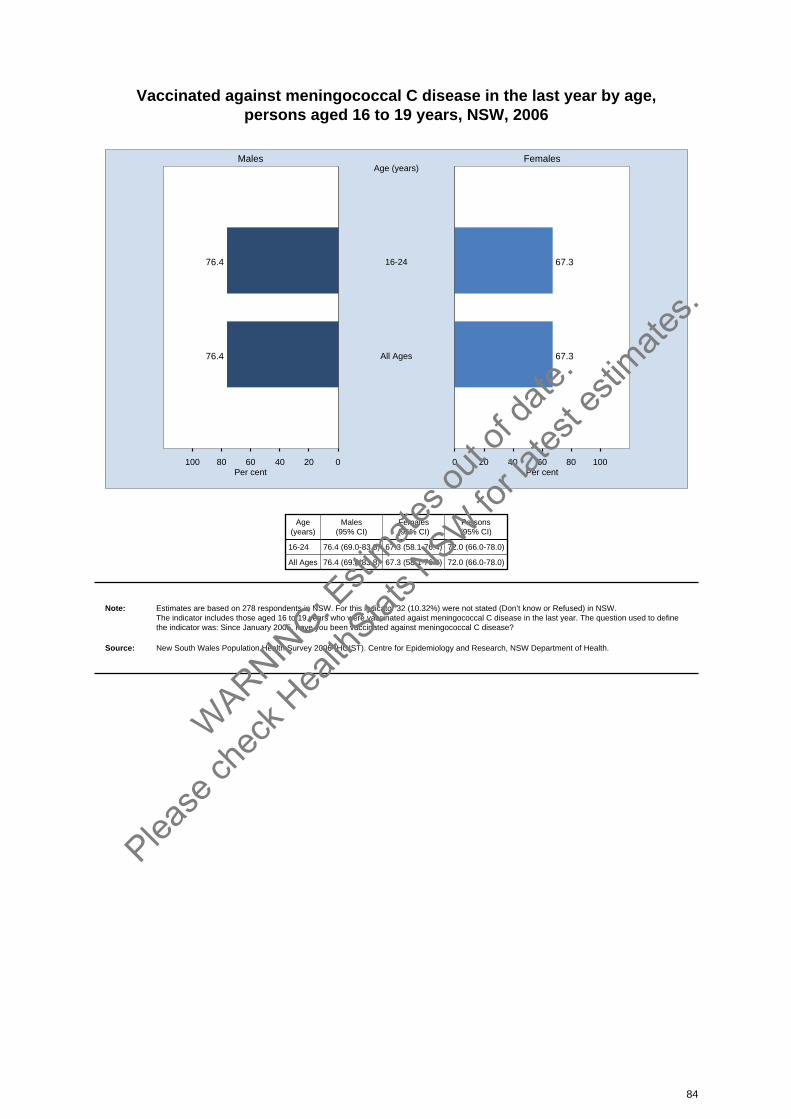
Vaccinated against meningococcal C disease in the last year by age, persons aged 16 to 19 years, NSW, 2006
020406080100 0 20 40 60 80 100
Males Females
Per cent Per cent
76.4 67.316-24
Age (years)
76.4 67.3All Ages
Age(years)
Males(95% CI)
Females(95% CI)
Persons(95% CI)
16-24 76.4 (69.0-83.8) 67.3 (58.1-76.4) 72.0 (66.0-78.0)
All Ages 76.4 (69.0-83.8) 67.3 (58.1-76.4) 72.0 (66.0-78.0)
Note: Estimates are based on 278 respondents in NSW. For this indicator 32 (10.32%) were not stated (Don’t know or Refused) in NSW. The indicator includes those aged 16 to 19 years who were vaccinated agaist meningococcal C disease in the last year. The question used to definethe indicator was: Since January 2005, have you been vaccinated against meningococcal C disease?
Source: New South Wales Population Health Survey 2006 (HOIST). Centre for Epidemiology and Research, NSW Department of Health.
84
WARNIN
G: Esti
mates o
ut of
date.
Please
chec
k Hea
lthStat
s NSW
for la
test e
stimate
s.

Vaccinated against meningococcal C disease in the last year bysocioeconomic disadvantage,
persons aged 16 to 19 years, NSW, 2006
020406080100 0 20 40 60 80 100
Males Females
Per cent Per cent
84.5 50.55th Quintile
most disadvantaged
77.2 56.24th Quintile
61.3 67.23rd Quintile
89.9 82.02nd Quintile
63.4 77.71st Quintile
least disadvantaged
76.4 67.3NSW
Quintile ofsocioeconomicdisadvantage
Males(95% CI)
Females(95% CI)
Persons(95% CI)
5th Quintile 84.5 (72.1-96.9) 50.5 (30.5-70.5) 67.6 (54.2-81.1)
4th Quintile 77.2 (62.1-92.4) 56.2 (31.8-80.5) 68.4 (53.7-83.2)
3rd Quintile 61.3 (42.4-80.2) 67.2 (48.3-86.0) 63.9 (50.4-77.5)
2nd Quintile 89.9 (79.0-100) 82.0 (67.9-96.1) 85.6 (76.5-94.7)
1st Quintile 63.4 (40.6-86.2) 77.7 (56.2-99.2) 70.5 (54.6-86.4)
NSW 76.4 (69.0-83.8) 67.3 (58.1-76.4) 72.0 (66.0-78.0)
Note: Estimates are based on 278 respondents in NSW. For this indicator 32 (10.32%) were not stated (Don’t know or Refused) in NSW. The indicator includes those aged 16 to 19 years who were vaccinated agaist meningococcal C disease in the last year. The question used to definethe indicator was: Since January 2005, have you been vaccinated against meningococcal C disease?
Source: New South Wales Population Health Survey 2006 (HOIST). Centre for Epidemiology and Research, NSW Department of Health.
85
WARNIN
G: Esti
mates o
ut of
date.
Please
chec
k Hea
lthStat
s NSW
for la
test e
stimate
s.
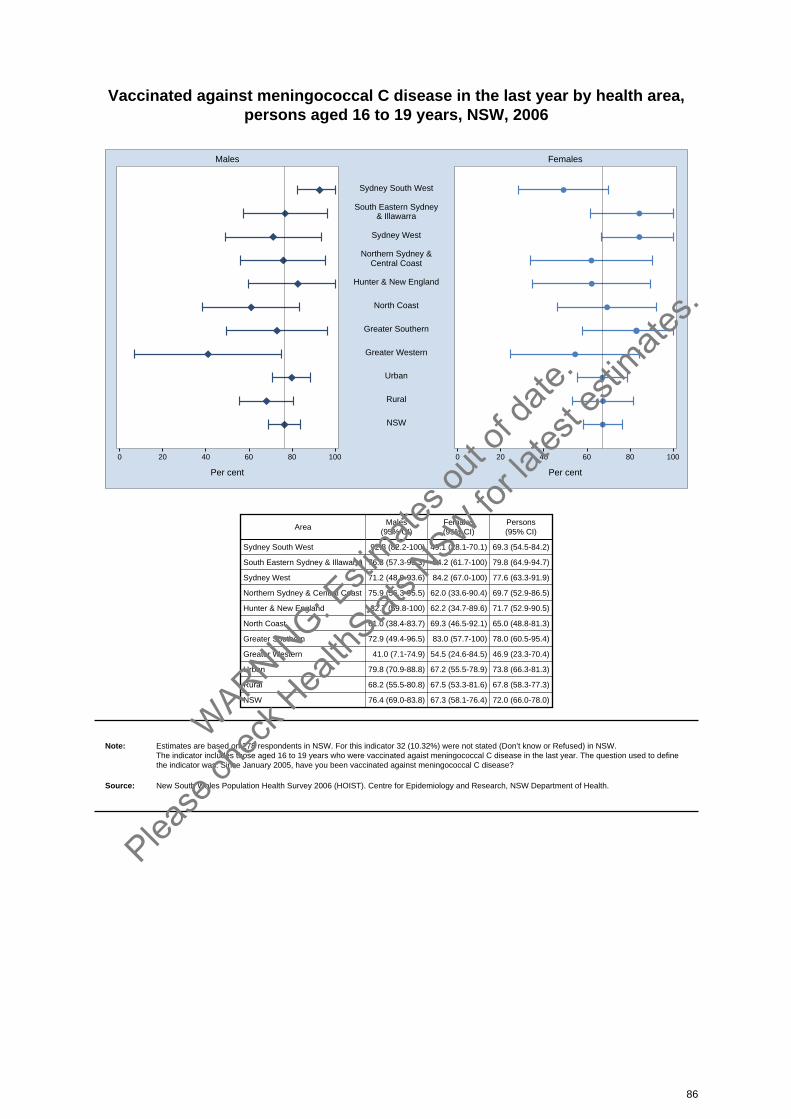
Vaccinated against meningococcal C disease in the last year by health area, persons aged 16 to 19 years, NSW, 2006
0 20 40 60 80 100 0 20 40 60 80 100
Males Females
Per cent Per cent
Sydney South West
South Eastern Sydney& Illawarra
Sydney West
Northern Sydney &Central Coast
Hunter & New England
North Coast
Greater Southern
Greater Western
Urban
Rural
NSW
AreaMales
(95% CI)Females(95% CI)
Persons(95% CI)
Sydney South West 92.8 (82.2-100) 49.1 (28.1-70.1) 69.3 (54.5-84.2)
South Eastern Sydney & Illawarra 76.8 (57.3-96.3) 84.2 (61.7-100) 79.8 (64.9-94.7)
Sydney West 71.2 (48.9-93.6) 84.2 (67.0-100) 77.6 (63.3-91.9)
Northern Sydney & Central Coast 75.9 (56.3-95.5) 62.0 (33.6-90.4) 69.7 (52.9-86.5)
Hunter & New England 82.7 (59.8-100) 62.2 (34.7-89.6) 71.7 (52.9-90.5)
North Coast 61.0 (38.4-83.7) 69.3 (46.5-92.1) 65.0 (48.8-81.3)
Greater Southern 72.9 (49.4-96.5) 83.0 (57.7-100) 78.0 (60.5-95.4)
Greater Western 41.0 (7.1-74.9) 54.5 (24.6-84.5) 46.9 (23.3-70.4)
Urban 79.8 (70.9-88.8) 67.2 (55.5-78.9) 73.8 (66.3-81.3)
Rural 68.2 (55.5-80.8) 67.5 (53.3-81.6) 67.8 (58.3-77.3)
NSW 76.4 (69.0-83.8) 67.3 (58.1-76.4) 72.0 (66.0-78.0)
Note: Estimates are based on 278 respondents in NSW. For this indicator 32 (10.32%) were not stated (Don’t know or Refused) in NSW. The indicator includes those aged 16 to 19 years who were vaccinated agaist meningococcal C disease in the last year. The question used to definethe indicator was: Since January 2005, have you been vaccinated against meningococcal C disease?
Source: New South Wales Population Health Survey 2006 (HOIST). Centre for Epidemiology and Research, NSW Department of Health.
86
WARNIN
G: Esti
mates o
ut of
date.
Please
chec
k Hea
lthStat
s NSW
for la
test e
stimate
s.

Place where vaccinated against meningococcal C disease, persons who were vaccinated against meningococcal C disease aged 16 to
19 years, NSW, 2006
020406080100 0 20 40 60 80 100
Males Females
Per cent Per cent
18.3 10.5GP
0.5 3.4Community Health
Centre
80.6 85.2School Clinic
0.6 0.9Other
ResponseMales
(95% CI)Females(95% CI)
Persons(95% CI)
GP 18.3 (9.5-27.0) 10.5 (3.4-17.6) 14.7 (8.9-20.6)
Community Health Centre 0.5 (0.0-1.6) 3.4 (0.0-8.3) 1.8 (0.0-4.1)
School Clinic 80.6 (71.7-89.5) 85.2 (76.8-93.6) 82.7 (76.5-88.9)
Other 0.6 (0.0-1.5) 0.9 (0.0-2.6) 0.7 (0.0-1.6)
Note: Estimates are based on 196 respondents in NSW. For this indicator 1 (0.51%) were not stated (Don’t know or Refused) in NSW. The questions used were: Since January 2005 have you been vaccinated against meningococcal C disease? and Where did you receive the vaccine?
Source: New South Wales Population Health Survey 2006 (HOIST). Centre for Epidemiology and Research, NSW Department of Health.
87
WARNIN
G: Esti
mates o
ut of
date.
Please
chec
k Hea
lthStat
s NSW
for la
test e
stimate
s.
Injury prevention
IntroductionIn New South Wales, on average, 20 deaths and 100 hospitalisations are attributed to house fireseach year.[1,2] Most mortality and morbidity happens at night, while people are sleeping, and is due tosmoke inhalation rather than burns. Functional and correctly situated smoke alarms detect low levelsof smoke and sound an alarm before the smoke becomes too dense for people to escape. Theydramatically reduce fatalities, injuries, and damage to property.[3] However, studies have shown asignificant proportion of smoke alarms are not functional.[3,4,5]
The NSW Building Legislation Amendment (Smoke Alarms) Act 2005 commenced on 1 May 2006.[6]This legislation requires that: one or more smoke alarms are installed in residential buildings wherepeople sleep, smoke alarms are maintained in functional order, and people do not remove thesealarms or interfere with their operation.[6]
In Australia, among all age groups, drowning is the fourth largest cause of unintentional death.[7,8] TheDepartment of Health and Aged Care has identified drowning and near drowning as one of the 4priority areas within the National Injury Prevention Plan.[9] While there has been considerable successin reducing the death toll from drowning, most deaths are preventable. While data on death fromdrowning are available via the National Coroners Information System and the National Mortality Database,[10,11] information on events of near drowning is not readily available.
In 2006, the New South Wales Population Health Survey asked respondents: Do you have smokealarms installed in your home? Are they hard wired or battery operated? When did you last test thebattery operated smoke alarms? When did you last change the battery in your smoke alarms? Whendid you last test the hard wired smoke alarms? How many battery operated smoke alarms do youhave? How many hard wired smoke alarms do you have? Have you had a fire in your home in the last12 months? Does your household have a written home escape plan? When did your household lastpractice your home escape plan? In the last 4 weeks did you do any of the following: swimming,fishing, rock fishing, snorkelling, or scuba diving? Those who answered yes to the last question wereasked: How would you rate your swimming ability?
Results
Fire safety measures in the home
Overall, in 2006, 86.9 per cent of New South Wales adults had a smoke alarm or detector, whetherbattery operated or hard wired or both, installed in their home. A significantly lower proportion of adultsaged 16-25 years (82.1 per cent), and a significantly higher proportion of adults aged 35-44 years(89.5 per cent), had smoke alarms installed in their home, compared with the overall adult population.A significantly higher proportion of adults in rural areas (90.0 per cent) than urban areas (85.5 percent) had a smoke alarm installed in their home. A higher proportion of adults in the Hunter & NewEngland (92.2 per cent) and Northern Sydney & Central Coast (89.7 per cent) Health Areas, and alower proportion of adults in the Sydney South West Health Area (82.5 per cent) had a smoke alarminstalled in their home, compared with the overall adult population. The proportion of adults withsmoke alarms installed in their home did not vary by socioeconomic status. The proportion of adultswho had smoke alarms, whether battery operated or hard wired, installed in their home increasedsignificantly from 1997 (58.2 per cent) to 2006 (86.9 per cent).
Of those adults with a battery operated alarm, 48.0 per cent tested the alarm within the last month,34.2 per cent tested the alarm 1-5 months ago, 9.1 per cent tested the alarm 6-12 months ago, 3.1 percent tested the alarm more than a year ago, and 5.3 per cent had never tested the alarm. Of thoseadults with a hard wired alarm, 35.8 per cent tested the alarm within the last month, 34.6 per centtested the alarm 1-5 months ago, 11.5 per cent tested the alarm 6-12 months ago, 5.2 per cent testedthe alarm more than a year ago, and 12.9 per cent had never tested the alarm.
88
WARNIN
G: Esti
mates o
ut of
date.
Please
chec
k Hea
lthStat
s NSW
for la
test e
stimate
s.

Overall, in 2006, 0.7 per cent of New South Wales adults had a fire in the home that activated thealarm or detector. A significantly lower proportion of adults aged 25-34 years (0.3 per cent) had a firein the home that activated the alarm, compared with the overall adult population. There was nosignificant difference in the proportion of adults in rural areas and urban areas who had a fire thatactivated the alarm or detector; however, a lower proportion of adults in the Sydney West Health Area(0.2 per cent) had a fire that activated the alarm or detector, compared with the overall adultpopulation. The proportion of adults with a fire that activated the alarm or detector did not vary bysocioeconomic status. The proportion of adults who had a fire that activated the alarm or detectordecreased significantly from 1998 (2.4 per cent) to 2006 (0.7 per cent).
Overall, in 2006, 7.0 per cent of adults had a home escape plan and had practised it, 15.1 per centhad a home escape plan but had never practised it, and 77.9 per cent did not have a home escape plan.
Swimming, fishing, rock fishing, snorkelling or scuba diving in thelast 4 weeks
In 2006, just over one in 5 adults (22.8 per cent) swam, fished, rock fished, snorkelled or scuba divedin the last 4 weeks. A significantly lower proportion of females (18.5 per cent) than males (27.2 percent) swam, fished, rock fished, snorkelled or scuba dived in the last 4 weeks. A significantly higherproportion of adults aged 1624 years (28.6 per cent) and 25-34 years (27.0 per cent) and 3544 years(29.9 per cent), and a significantly lower proportion of adults aged 55-64 years (16.3 per cent) and65-74 years (14.0 per cent) and 75 years and over (7.0 per cent), swam, fished, rock fished,snorkelled or scuba dived in the last 4 weeks, compared with the overall adult population.
There was no significant difference in the proportion of adults in rural areas and urban areas whoswam, fished, rock fished, snorkelled or scuba dived in the last 4 weeks. A higher proportion of adultsin the North Coast (28.2 per cent) and South Eastern Sydney & Illawarra (27.0 per cent) and NorthernSydney & Central Coast (29.2 per cent) Health Areas, and a lower proportion of residents in theSydney West (13.7 per cent) and Greater Western (12.7 per cent) Health Areas, swam, fished, rockfished, snorkelled or scuba dived in the last 4 weeks, compared with the overall adult population.
A higher proportion of adults in the least disadvantaged quintile (26.9 per cent), and a lower proportionof adults in the most disadvantaged quintile (19.0 per cent), swam, fished, rock fished, snorkelled orscuba dived in the last 4 weeks, compared with the overall adult population.
In 2006, New South Wales adults who swam, fished, rock fished, snorkelled or scuba dived in the last4 weeks were asked to rate their swimming ability. Of those, 27.0 per cent rated themselves as a verygood swimmer, 28.3 per cent as a good swimmer, 36.4 per cent as an average swimmer, 7.7 per centas a poor swimmer, and 0.6 per cent said they could not swim.
Ratings of very good and good were combined to give an overall positive rating of swimming ability. In2006, 55.3 per cent of adults who swam, fished, rock fished, snorkelled or scuba dived in the last 4weeks were very good or good swimmers. A significantly lower proportion of females (47.1 per cent)than males (61.0 per cent) were very good or good swimmers. Swimming ability decreased with age.A significantly higher proportion of adults aged 16-24 years (71.9 per cent) and 25-34 years (66.6 percent) were very good or good swimmers. A significantly lower proportion of adults aged 45-54 years(43.0 per cent), 55-64 per cent (37.0 per cent), 65-74 years (28.0 per cent), and 75 years and over(32.1 per cent), were very good or good swimmers.
The proportion of adults who swam, fished, rock fished, snorkelled or scuba dived in the last 4 weekswho were very good or good swimmers did not vary significantly between urban areas and rural areas,or by level of socioeconomic disadvantage; however, a lower proportion of residents in Sydney SouthWest Health Area (45.9 per cent) were very good or good swimmers, compared with the overall adultpopulation who swam, fished, rock fished, snorkelled or scuba dived in the last 4 weeks.
89
WARNIN
G: Esti
mates o
ut of
date.
Please
chec
k Hea
lthStat
s NSW
for la
test e
stimate
s.
References1. Schmertmann M, Finch C, and Williamson A. NSW Injury Profile: A review of injury deaths during
1998-2002. Sydney: NSW Injury Risk Management Research Centre, 2004. Available online atwww.irmrc.unsw.edu.au (accessed 9 May 2007).
2. Hayen A, and Mitchell R. NSW Injury Profile: A review of injury dospitalisations during 1989-90 to 2003-04. Sydney: NSW Injury Risk Management Research Centre, 2005. Available online atwww.irmrc.unsw.edu.au (accessed 9 May 2007).
3. Haddix A, Mallonee S, Waxweiler R, Douglas M. Cost effectiveness analysis of a smoke alarmgiveaway program in Oklahoma City, Oklahoma. Injury Prevention 2001; 7: 276-281. Abstractavailable online atwww.ncbi.nlm.nih.gov/entrez/query.fcgi?cmd=Retrieve&db=pubmed&dopt=Abstract&list_uids=11770651(accessed 9 May 2007).
4. Douglas M, Mallonee S, Istre G. Estimating the proportion of homes with functioning smokealarms: A comparison of telephone survey and household survey results. Am J Public Health1999; 89(7): 1112-1114. Abstract available online atwww.ncbi.nlm.nih.gov/entrez/query.fcgi?cmd=Retrieve&db=pubmed&dopt=Abstract&list_uids=10394329(accessed 9 May 2007).
5. Australasian Fire Authorities Council. Accidental fire fatalities in residential structures: Who’s at risk? Melbourne: Australasian Fire Authorities Council, 2005. Available online atwww.afac.com.au/awsv2/publications/documents/ResidentialFireFatalitiesReportOctober2005.pdf(accessed 9 May 2007).
6. NSW Fire Brigades. Smoke Alarm web page and What Does The Legislation Mean? web page atwww.nswfb.nsw.gov.au (accessed 9 May 2007).
7. Australian Water Safety Council. National Water Safety Plan 20042007. Sydney: Australian WaterSafety Council, 2004.
8. Royal Life Saving Society. The NSW Drowning Report 2004. Available fromwww.safewaters.nsw.gov.au/statistics.htm, accessed 5 June 2007.
9. Strategic Injury Prevention Partnership. National Injury Prevention Plan: Priorities for 20012003.Canberra: Department of Health and Aged Care, 2004.
10. Monash University National Centre for Coronial Information. The National Coroners InformationSystem. Available from www.vifp.monash.edu.au/ncis, accessed 5 June 2007.
11. Australian Institute of Health and Welfare (AIHW). The AIHW National Mortality Database.Available from www.aihw.gov.au/mortality/mortality_database.cfm, accessed 5 June 2007.
90
WARNIN
G: Esti
mates o
ut of
date.
Please
chec
k Hea
lthStat
s NSW
for la
test e
stimate
s.
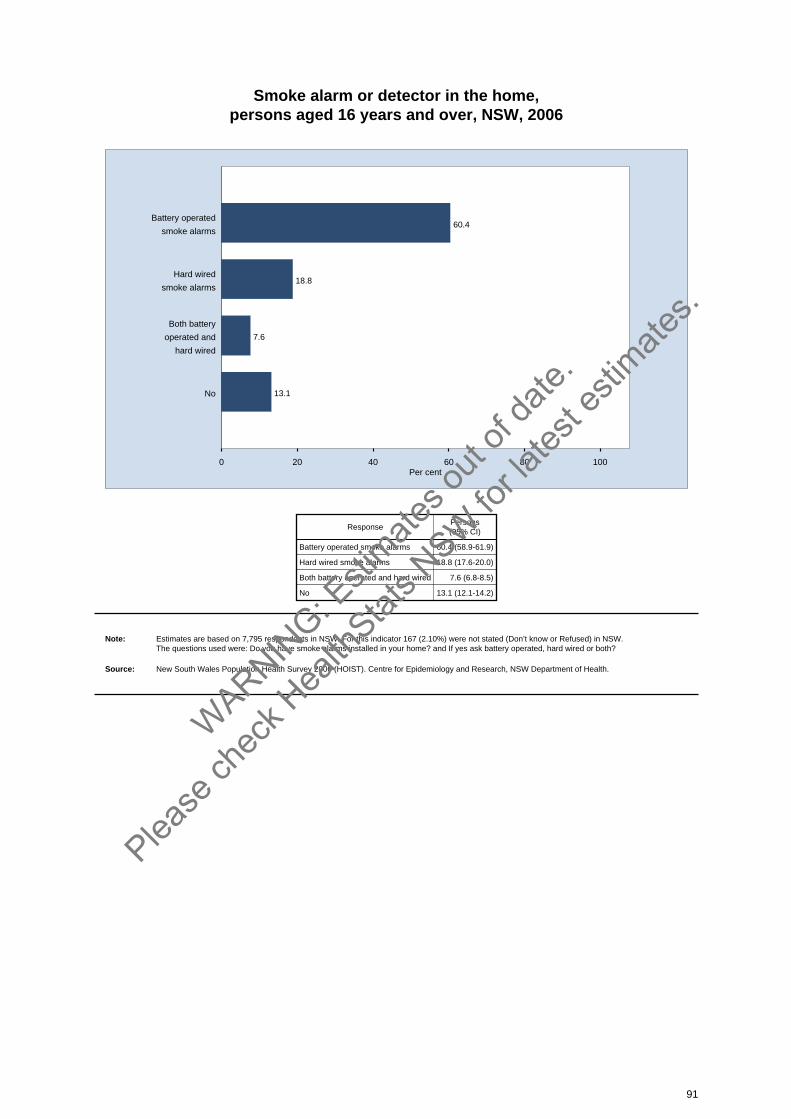
Smoke alarm or detector in the home, persons aged 16 years and over, NSW, 2006
0 20 40 60 80 100Per cent
60.4Battery operated
smoke alarms
18.8Hard wired
smoke alarms
7.6
Both battery
operated and
hard wired
13.1No
ResponsePersons(95% CI)
Battery operated smoke alarms 60.4 (58.9-61.9)
Hard wired smoke alarms 18.8 (17.6-20.0)
Both battery operated and hard wired 7.6 (6.8-8.5)
No 13.1 (12.1-14.2)
Note: Estimates are based on 7,795 respondents in NSW. For this indicator 167 (2.10%) were not stated (Don’t know or Refused) in NSW. The questions used were: Do you have smoke alarms installed in your home? and If yes ask battery operated, hard wired or both?
Source: New South Wales Population Health Survey 2006 (HOIST). Centre for Epidemiology and Research, NSW Department of Health.
91
WARNIN
G: Esti
mates o
ut of
date.
Please
chec
k Hea
lthStat
s NSW
for la
test e
stimate
s.

Homes with a smoke alarm or detector by age, persons aged 16 years and over, NSW, 2006
0 20 40 60 80 100Per cent
88.075+
Age (years)
87.365-74
86.255-64
89.045-54
89.535-44
85.325-34
82.116-24
86.9All Ages
Age(years)
Persons(95% CI)
16-24 82.1 (78.5-85.7)
25-34 85.3 (82.0-88.6)
35-44 89.5 (87.3-91.7)
45-54 89.0 (87.1-91.0)
55-64 86.2 (84.1-88.3)
65-74 87.3 (85.0-89.6)
75+ 88.0 (85.7-90.4)
All Ages 86.9 (85.8-87.9)
Note: Estimates are based on 7,795 respondents in NSW. For this indicator 164 (2.06%) were not stated (Don’t know or Refused) in NSW. The indicator includes those who have a smoke alarm or detector in their home. The question used to define the indicator was: Do you have smokealarms installed in your home?
Source: New South Wales Population Health Survey 2006 (HOIST). Centre for Epidemiology and Research, NSW Department of Health.
92
WARNIN
G: Esti
mates o
ut of
date.
Please
chec
k Hea
lthStat
s NSW
for la
test e
stimate
s.
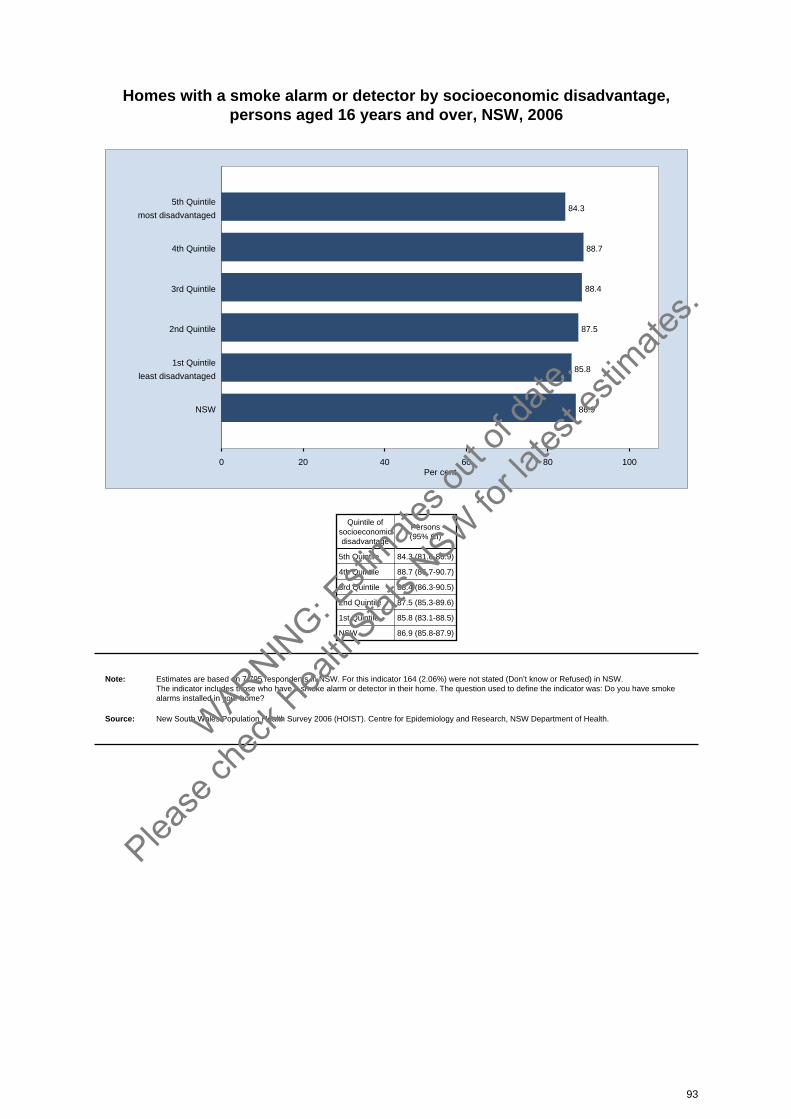
Homes with a smoke alarm or detector by socioeconomic disadvantage, persons aged 16 years and over, NSW, 2006
0 20 40 60 80 100Per cent
84.35th Quintile
most disadvantaged
88.74th Quintile
88.43rd Quintile
87.52nd Quintile
85.81st Quintile
least disadvantaged
86.9NSW
Quintile ofsocioeconomicdisadvantage
Persons(95% CI)
5th Quintile 84.3 (81.6-86.9)
4th Quintile 88.7 (86.7-90.7)
3rd Quintile 88.4 (86.3-90.5)
2nd Quintile 87.5 (85.3-89.6)
1st Quintile 85.8 (83.1-88.5)
NSW 86.9 (85.8-87.9)
Note: Estimates are based on 7,795 respondents in NSW. For this indicator 164 (2.06%) were not stated (Don’t know or Refused) in NSW. The indicator includes those who have a smoke alarm or detector in their home. The question used to define the indicator was: Do you have smokealarms installed in your home?
Source: New South Wales Population Health Survey 2006 (HOIST). Centre for Epidemiology and Research, NSW Department of Health.
93
WARNIN
G: Esti
mates o
ut of
date.
Please
chec
k Hea
lthStat
s NSW
for la
test e
stimate
s.
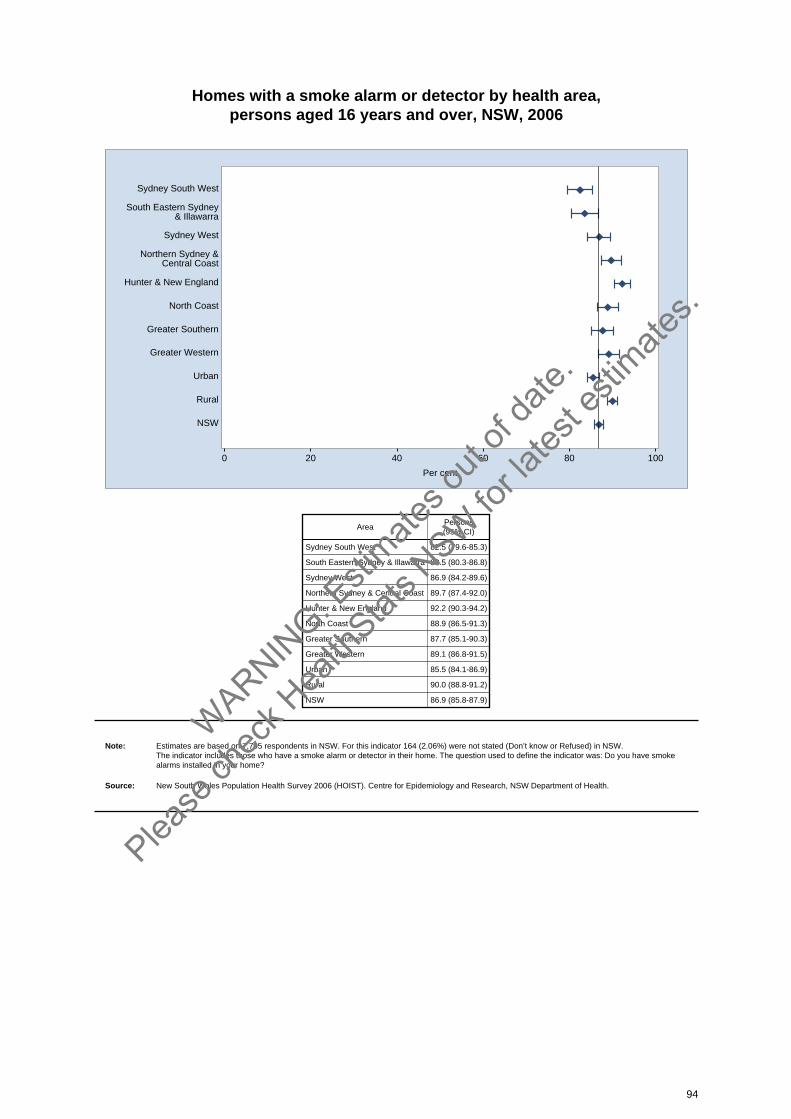
Homes with a smoke alarm or detector by health area, persons aged 16 years and over, NSW, 2006
0 20 40 60 80 100
Per cent
Sydney South West
South Eastern Sydney& Illawarra
Sydney West
Northern Sydney &Central Coast
Hunter & New England
North Coast
Greater Southern
Greater Western
Urban
Rural
NSW
AreaPersons(95% CI)
Sydney South West 82.5 (79.6-85.3)
South Eastern Sydney & Illawarra 83.5 (80.3-86.8)
Sydney West 86.9 (84.2-89.6)
Northern Sydney & Central Coast 89.7 (87.4-92.0)
Hunter & New England 92.2 (90.3-94.2)
North Coast 88.9 (86.5-91.3)
Greater Southern 87.7 (85.1-90.3)
Greater Western 89.1 (86.8-91.5)
Urban 85.5 (84.1-86.9)
Rural 90.0 (88.8-91.2)
NSW 86.9 (85.8-87.9)
Note: Estimates are based on 7,795 respondents in NSW. For this indicator 164 (2.06%) were not stated (Don’t know or Refused) in NSW. The indicator includes those who have a smoke alarm or detector in their home. The question used to define the indicator was: Do you have smokealarms installed in your home?
Source: New South Wales Population Health Survey 2006 (HOIST). Centre for Epidemiology and Research, NSW Department of Health.
94
WARNIN
G: Esti
mates o
ut of
date.
Please
chec
k Hea
lthStat
s NSW
for la
test e
stimate
s.
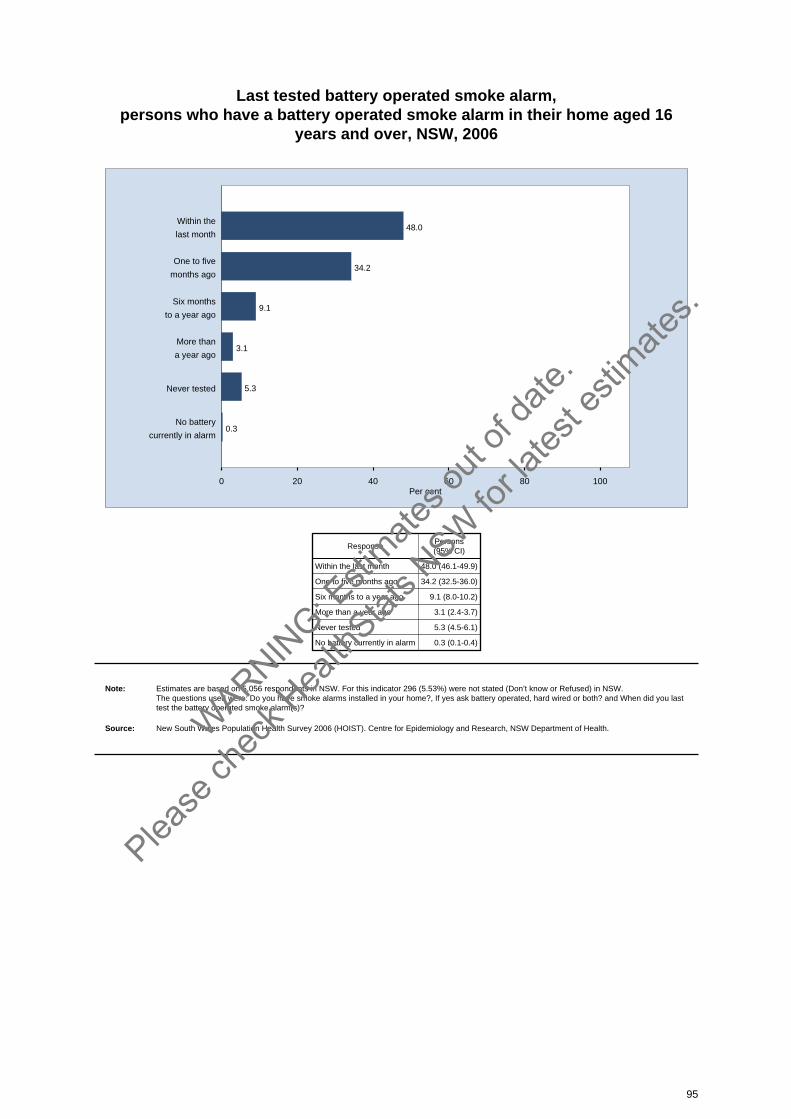
Last tested battery operated smoke alarm, persons who have a battery operated smoke alarm in their home aged 16
years and over, NSW, 2006
0 20 40 60 80 100Per cent
48.0Within the
last month
34.2One to five
months ago
9.1Six months
to a year ago
3.1More than
a year ago
5.3Never tested
0.3No battery
currently in alarm
ResponsePersons(95% CI)
Within the last month 48.0 (46.1-49.9)
One to five months ago 34.2 (32.5-36.0)
Six months to a year ago 9.1 (8.0-10.2)
More than a year ago 3.1 (2.4-3.7)
Never tested 5.3 (4.5-6.1)
No battery currently in alarm 0.3 (0.1-0.4)
Note: Estimates are based on 5,056 respondents in NSW. For this indicator 296 (5.53%) were not stated (Don’t know or Refused) in NSW. The questions used were: Do you have smoke alarms installed in your home?, If yes ask battery operated, hard wired or both? and When did you lasttest the battery operated smoke alarm(s)?
Source: New South Wales Population Health Survey 2006 (HOIST). Centre for Epidemiology and Research, NSW Department of Health.
95
WARNIN
G: Esti
mates o
ut of
date.
Please
chec
k Hea
lthStat
s NSW
for la
test e
stimate
s.
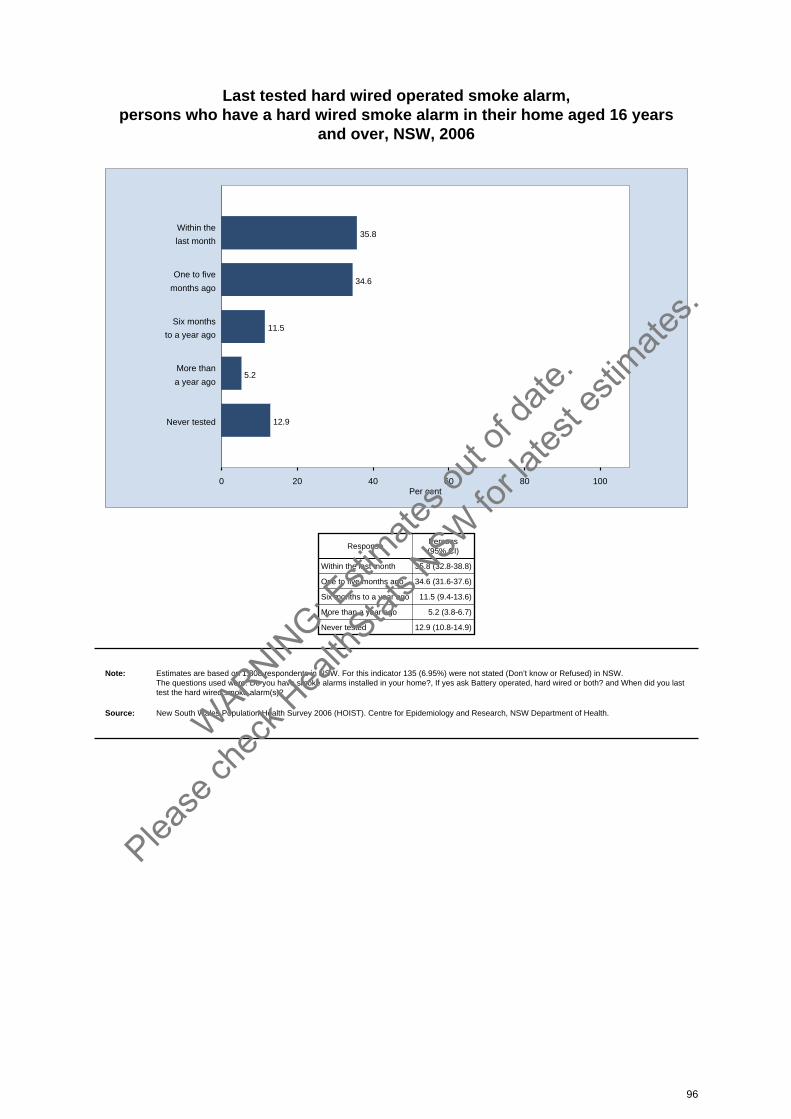
Last tested hard wired operated smoke alarm, persons who have a hard wired smoke alarm in their home aged 16 years
and over, NSW, 2006
0 20 40 60 80 100Per cent
35.8Within the
last month
34.6One to five
months ago
11.5Six months
to a year ago
5.2More than
a year ago
12.9Never tested
ResponsePersons(95% CI)
Within the last month 35.8 (32.8-38.8)
One to five months ago 34.6 (31.6-37.6)
Six months to a year ago 11.5 (9.4-13.6)
More than a year ago 5.2 (3.8-6.7)
Never tested 12.9 (10.8-14.9)
Note: Estimates are based on 1,808 respondents in NSW. For this indicator 135 (6.95%) were not stated (Don’t know or Refused) in NSW. The questions used were: Do you have smoke alarms installed in your home?, If yes ask Battery operated, hard wired or both? and When did you lasttest the hard wired smoke alarm(s)?
Source: New South Wales Population Health Survey 2006 (HOIST). Centre for Epidemiology and Research, NSW Department of Health.
96
WARNIN
G: Esti
mates o
ut of
date.
Please
chec
k Hea
lthStat
s NSW
for la
test e
stimate
s.

Fire in home which activated smoke alarm by age, persons aged 16 years and over, NSW, 2006
0 20 40 60 80 100Per cent
0.475+
Age (years)
0.465-74
0.655-64
0.845-54
1.135-44
0.325-34
1.316-24
0.7All Ages
Age(years)
Persons(95% CI)
16-24 1.3 (0.4-2.3)
25-34 0.3 (0.0-0.6)
35-44 1.1 (0.4-1.8)
45-54 0.8 (0.2-1.4)
55-64 0.6 (0.2-1.0)
65-74 0.4 (0.1-0.8)
75+ 0.4 (0.0-0.9)
All Ages 0.7 (0.5-1.0)
Note: Estimates are based on 7,957 respondents in NSW. For this indicator 5 (0.06%) were not stated (Don’t know or Refused) in NSW. The indicator includes those who had a fire in their home that activated a smoke alarm. The question used to define the indicator was: Have you had afire in your home in the last 12 months?
Source: New South Wales Population Health Survey 2006 (HOIST). Centre for Epidemiology and Research, NSW Department of Health.
97
WARNIN
G: Esti
mates o
ut of
date.
Please
chec
k Hea
lthStat
s NSW
for la
test e
stimate
s.
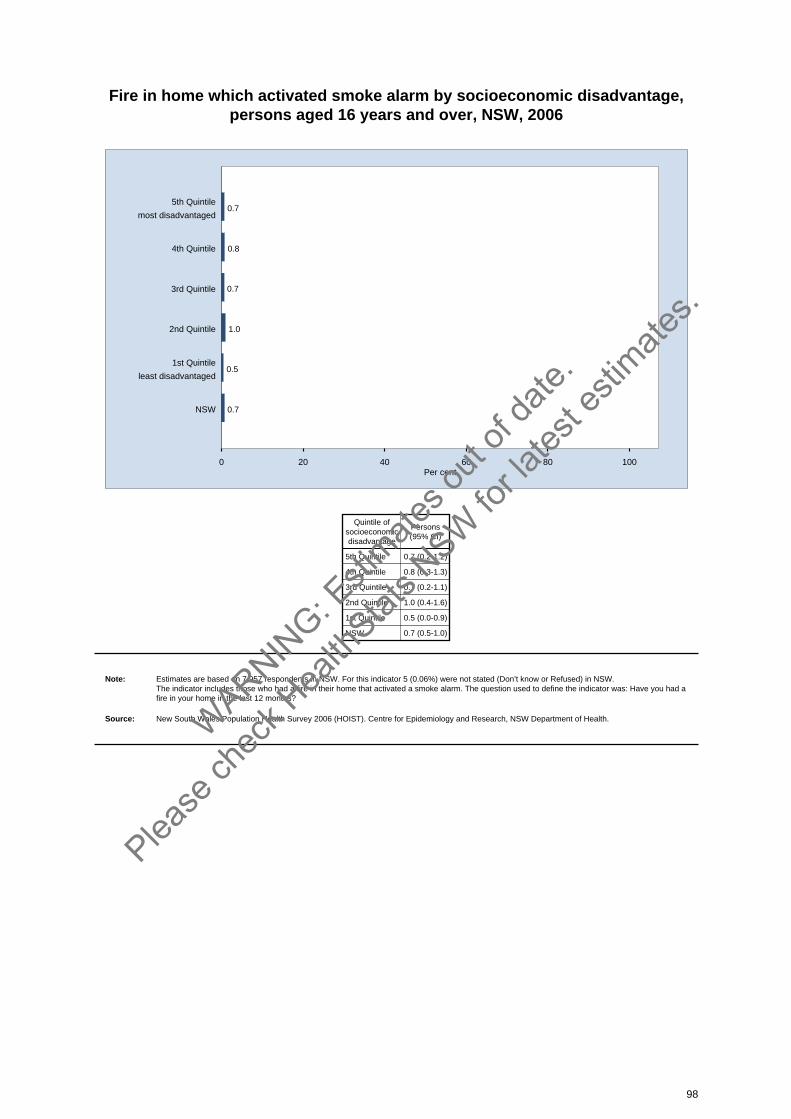
Fire in home which activated smoke alarm by socioeconomic disadvantage, persons aged 16 years and over, NSW, 2006
0 20 40 60 80 100Per cent
0.75th Quintile
most disadvantaged
0.84th Quintile
0.73rd Quintile
1.02nd Quintile
0.51st Quintile
least disadvantaged
0.7NSW
Quintile ofsocioeconomicdisadvantage
Persons(95% CI)
5th Quintile 0.7 (0.2-1.2)
4th Quintile 0.8 (0.3-1.3)
3rd Quintile 0.7 (0.2-1.1)
2nd Quintile 1.0 (0.4-1.6)
1st Quintile 0.5 (0.0-0.9)
NSW 0.7 (0.5-1.0)
Note: Estimates are based on 7,957 respondents in NSW. For this indicator 5 (0.06%) were not stated (Don’t know or Refused) in NSW. The indicator includes those who had a fire in their home that activated a smoke alarm. The question used to define the indicator was: Have you had afire in your home in the last 12 months?
Source: New South Wales Population Health Survey 2006 (HOIST). Centre for Epidemiology and Research, NSW Department of Health.
98
WARNIN
G: Esti
mates o
ut of
date.
Please
chec
k Hea
lthStat
s NSW
for la
test e
stimate
s.
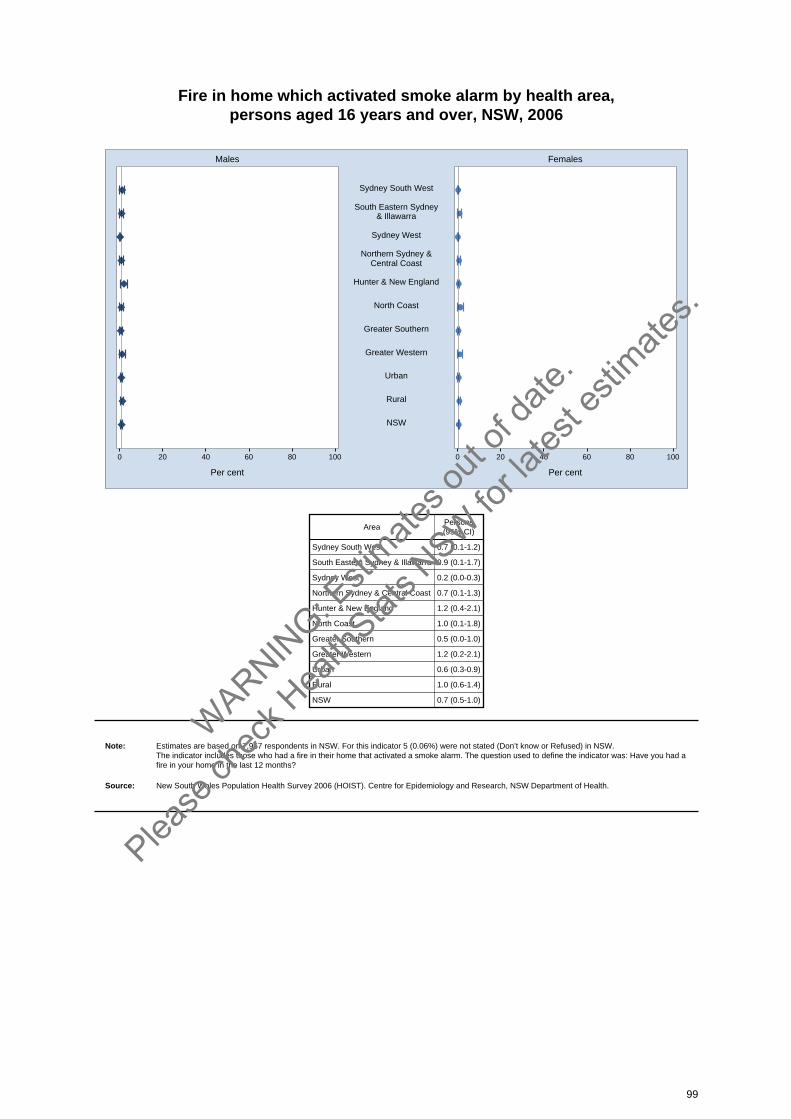
Fire in home which activated smoke alarm by health area, persons aged 16 years and over, NSW, 2006
0 20 40 60 80 100 0 20 40 60 80 100
Males Females
Per cent Per cent
Sydney South West
South Eastern Sydney& Illawarra
Sydney West
Northern Sydney &Central Coast
Hunter & New England
North Coast
Greater Southern
Greater Western
Urban
Rural
NSW
AreaPersons(95% CI)
Sydney South West 0.7 (0.1-1.2)
South Eastern Sydney & Illawarra 0.9 (0.1-1.7)
Sydney West 0.2 (0.0-0.3)
Northern Sydney & Central Coast 0.7 (0.1-1.3)
Hunter & New England 1.2 (0.4-2.1)
North Coast 1.0 (0.1-1.8)
Greater Southern 0.5 (0.0-1.0)
Greater Western 1.2 (0.2-2.1)
Urban 0.6 (0.3-0.9)
Rural 1.0 (0.6-1.4)
NSW 0.7 (0.5-1.0)
Note: Estimates are based on 7,957 respondents in NSW. For this indicator 5 (0.06%) were not stated (Don’t know or Refused) in NSW. The indicator includes those who had a fire in their home that activated a smoke alarm. The question used to define the indicator was: Have you had afire in your home in the last 12 months?
Source: New South Wales Population Health Survey 2006 (HOIST). Centre for Epidemiology and Research, NSW Department of Health.
99
WARNIN
G: Esti
mates o
ut of
date.
Please
chec
k Hea
lthStat
s NSW
for la
test e
stimate
s.
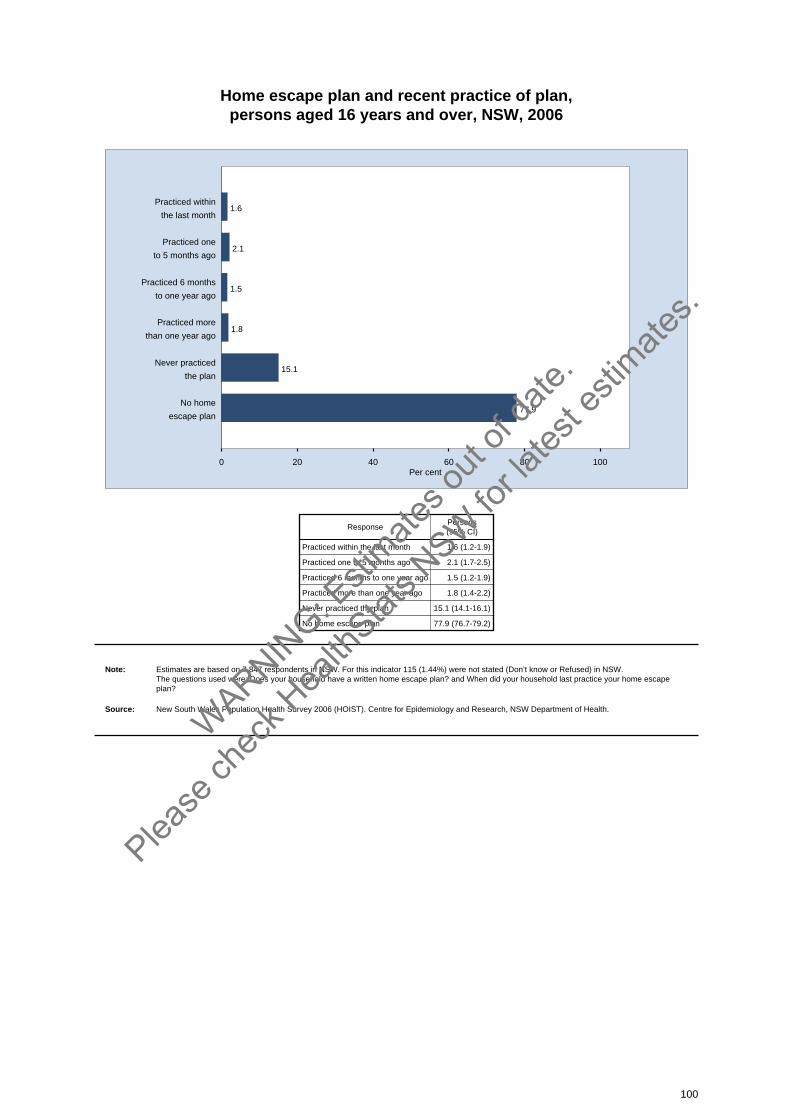
Home escape plan and recent practice of plan, persons aged 16 years and over, NSW, 2006
0 20 40 60 80 100Per cent
1.6Practiced within
the last month
2.1Practiced one
to 5 months ago
1.5Practiced 6 months
to one year ago
1.8Practiced more
than one year ago
15.1Never practiced
the plan
77.9No home
escape plan
ResponsePersons(95% CI)
Practiced within the last month 1.6 (1.2-1.9)
Practiced one to 5 months ago 2.1 (1.7-2.5)
Practiced 6 months to one year ago 1.5 (1.2-1.9)
Practiced more than one year ago 1.8 (1.4-2.2)
Never practiced the plan 15.1 (14.1-16.1)
No home escape plan 77.9 (76.7-79.2)
Note: Estimates are based on 7,847 respondents in NSW. For this indicator 115 (1.44%) were not stated (Don’t know or Refused) in NSW. The questions used were: Does your household have a written home escape plan? and When did your household last practice your home escape plan?
Source: New South Wales Population Health Survey 2006 (HOIST). Centre for Epidemiology and Research, NSW Department of Health.
100
WARNIN
G: Esti
mates o
ut of
date.
Please
chec
k Hea
lthStat
s NSW
for la
test e
stimate
s.
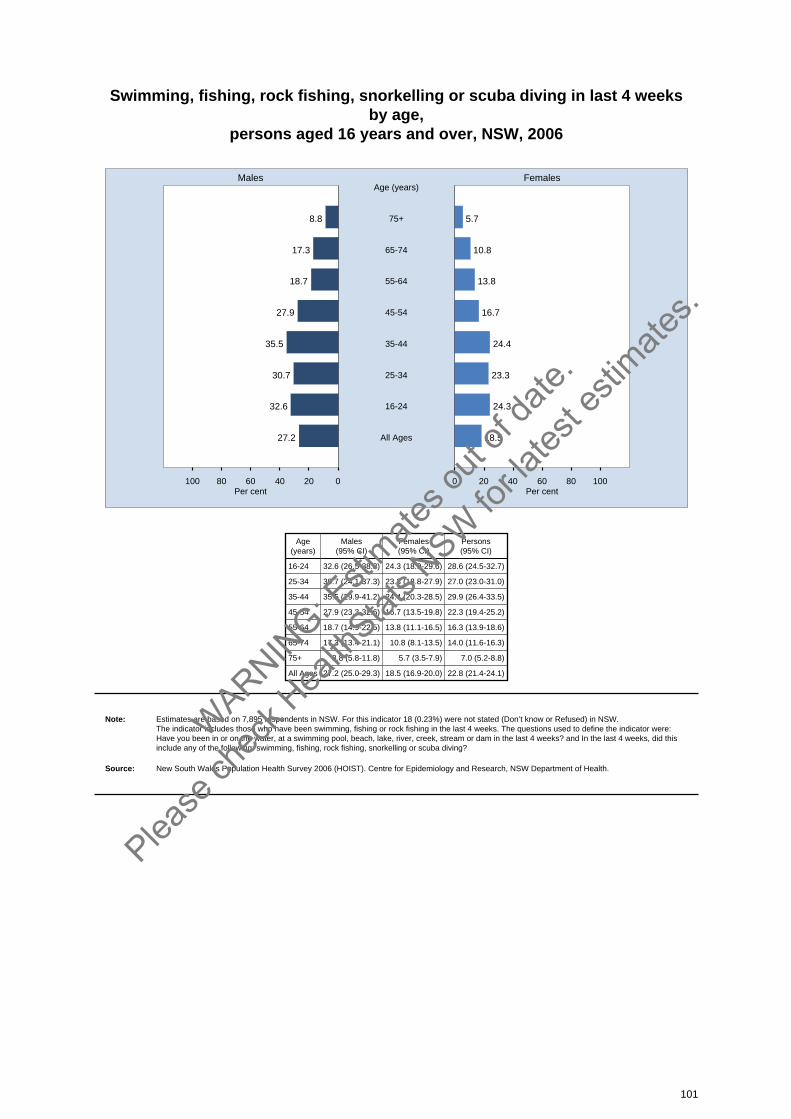
Swimming, fishing, rock fishing, snorkelling or scuba diving in last 4 weeksby age,
persons aged 16 years and over, NSW, 2006
020406080100 0 20 40 60 80 100
Males Females
Per cent Per cent
8.8 5.775+
Age (years)
17.3 10.865-74
18.7 13.855-64
27.9 16.745-54
35.5 24.435-44
30.7 23.325-34
32.6 24.316-24
27.2 18.5All Ages
Age(years)
Males(95% CI)
Females(95% CI)
Persons(95% CI)
16-24 32.6 (26.5-38.8) 24.3 (18.9-29.6) 28.6 (24.5-32.7)
25-34 30.7 (24.1-37.3) 23.3 (18.8-27.9) 27.0 (23.0-31.0)
35-44 35.5 (29.9-41.2) 24.4 (20.3-28.5) 29.9 (26.4-33.5)
45-54 27.9 (23.3-32.6) 16.7 (13.5-19.8) 22.3 (19.4-25.2)
55-64 18.7 (14.9-22.5) 13.8 (11.1-16.5) 16.3 (13.9-18.6)
65-74 17.3 (13.4-21.1) 10.8 (8.1-13.5) 14.0 (11.6-16.3)
75+ 8.8 (5.8-11.8) 5.7 (3.5-7.9) 7.0 (5.2-8.8)
All Ages 27.2 (25.0-29.3) 18.5 (16.9-20.0) 22.8 (21.4-24.1)
Note: Estimates are based on 7,895 respondents in NSW. For this indicator 18 (0.23%) were not stated (Don’t know or Refused) in NSW. The indicator includes those who have been swimming, fishing or rock fishing in the last 4 weeks. The questions used to define the indicator were:Have you been in or on the water, at a swimming pool, beach, lake, river, creek, stream or dam in the last 4 weeks? and In the last 4 weeks, did thisinclude any of the following: swimming, fishing, rock fishing, snorkelling or scuba diving?
Source: New South Wales Population Health Survey 2006 (HOIST). Centre for Epidemiology and Research, NSW Department of Health.
101
WARNIN
G: Esti
mates o
ut of
date.
Please
chec
k Hea
lthStat
s NSW
for la
test e
stimate
s.

Swimming, fishing, rock fishing, snorkelling or scuba diving in last 4 weeksby socioeconomic disadvantage,
persons aged 16 years and over, NSW, 2006
020406080100 0 20 40 60 80 100
Males Females
Per cent Per cent
24.8 13.75th Quintile
most disadvantaged
28.0 18.74th Quintile
25.0 16.13rd Quintile
27.8 19.32nd Quintile
30.4 23.21st Quintile
least disadvantaged
27.2 18.5NSW
Quintile ofsocioeconomicdisadvantage
Males(95% CI)
Females(95% CI)
Persons(95% CI)
5th Quintile 24.8 (20.0-29.6) 13.7 (10.6-16.8) 19.0 (16.2-21.9)
4th Quintile 28.0 (23.4-32.5) 18.7 (15.4-22.0) 23.2 (20.4-26.0)
3rd Quintile 25.0 (20.6-29.3) 16.1 (12.7-19.5) 20.6 (17.8-23.4)
2nd Quintile 27.8 (22.9-32.7) 19.3 (15.9-22.7) 23.4 (20.4-26.4)
1st Quintile 30.4 (24.7-36.0) 23.2 (19.3-27.1) 26.9 (23.4-30.3)
NSW 27.2 (25.0-29.3) 18.5 (16.9-20.0) 22.8 (21.4-24.1)
Note: Estimates are based on 7,895 respondents in NSW. For this indicator 18 (0.23%) were not stated (Don’t know or Refused) in NSW. The indicator includes those who have been swimming, fishing or rock fishing in the last 4 weeks. The questions used to define the indicator were:Have you been in or on the water, at a swimming pool, beach, lake, river, creek, stream or dam in the last 4 weeks? and In the last 4 weeks, did thisinclude any of the following: swimming, fishing, rock fishing, snorkelling or scuba diving?
Source: New South Wales Population Health Survey 2006 (HOIST). Centre for Epidemiology and Research, NSW Department of Health.
102
WARNIN
G: Esti
mates o
ut of
date.
Please
chec
k Hea
lthStat
s NSW
for la
test e
stimate
s.
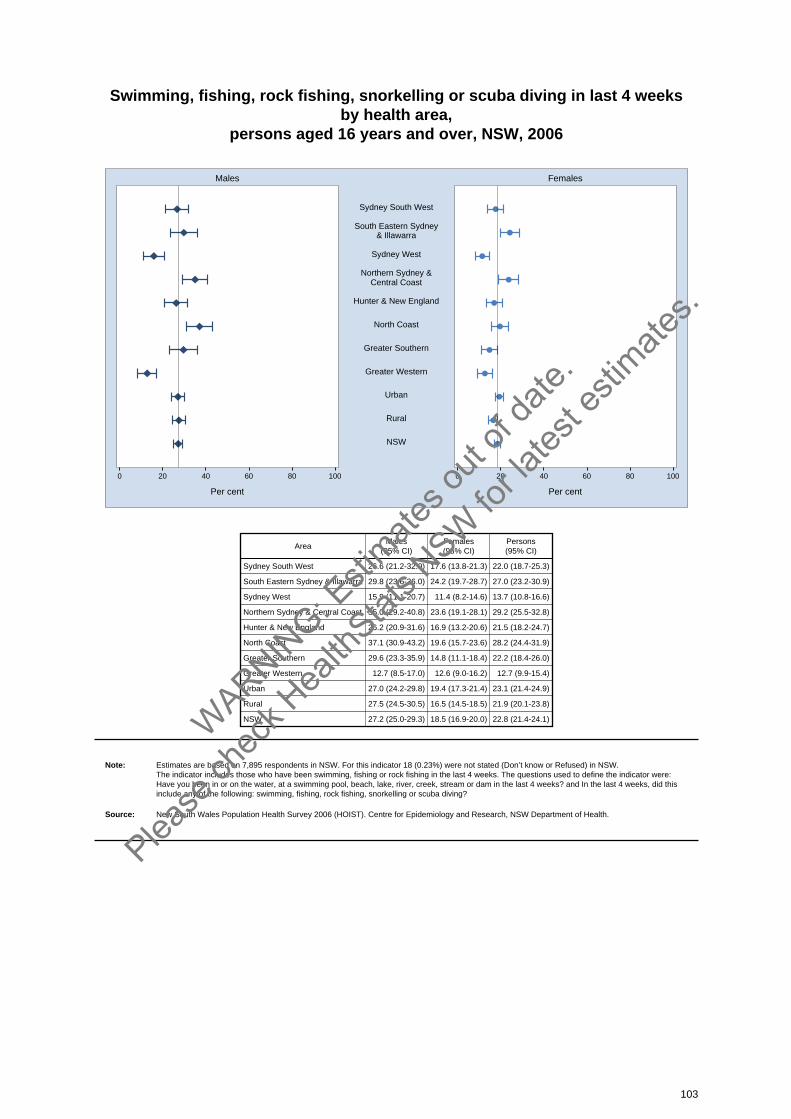
Swimming, fishing, rock fishing, snorkelling or scuba diving in last 4 weeksby health area,
persons aged 16 years and over, NSW, 2006
0 20 40 60 80 100 0 20 40 60 80 100
Males Females
Per cent Per cent
Sydney South West
South Eastern Sydney& Illawarra
Sydney West
Northern Sydney &Central Coast
Hunter & New England
North Coast
Greater Southern
Greater Western
Urban
Rural
NSW
AreaMales
(95% CI)Females(95% CI)
Persons(95% CI)
Sydney South West 26.6 (21.2-32.0) 17.6 (13.8-21.3) 22.0 (18.7-25.3)
South Eastern Sydney & Illawarra 29.8 (23.6-36.0) 24.2 (19.7-28.7) 27.0 (23.2-30.9)
Sydney West 15.9 (11.1-20.7) 11.4 (8.2-14.6) 13.7 (10.8-16.6)
Northern Sydney & Central Coast 35.0 (29.2-40.8) 23.6 (19.1-28.1) 29.2 (25.5-32.8)
Hunter & New England 26.2 (20.9-31.6) 16.9 (13.2-20.6) 21.5 (18.2-24.7)
North Coast 37.1 (30.9-43.2) 19.6 (15.7-23.6) 28.2 (24.4-31.9)
Greater Southern 29.6 (23.3-35.9) 14.8 (11.1-18.4) 22.2 (18.4-26.0)
Greater Western 12.7 (8.5-17.0) 12.6 (9.0-16.2) 12.7 (9.9-15.4)
Urban 27.0 (24.2-29.8) 19.4 (17.3-21.4) 23.1 (21.4-24.9)
Rural 27.5 (24.5-30.5) 16.5 (14.5-18.5) 21.9 (20.1-23.8)
NSW 27.2 (25.0-29.3) 18.5 (16.9-20.0) 22.8 (21.4-24.1)
Note: Estimates are based on 7,895 respondents in NSW. For this indicator 18 (0.23%) were not stated (Don’t know or Refused) in NSW. The indicator includes those who have been swimming, fishing or rock fishing in the last 4 weeks. The questions used to define the indicator were:Have you been in or on the water, at a swimming pool, beach, lake, river, creek, stream or dam in the last 4 weeks? and In the last 4 weeks, did thisinclude any of the following: swimming, fishing, rock fishing, snorkelling or scuba diving?
Source: New South Wales Population Health Survey 2006 (HOIST). Centre for Epidemiology and Research, NSW Department of Health.
103
WARNIN
G: Esti
mates o
ut of
date.
Please
chec
k Hea
lthStat
s NSW
for la
test e
stimate
s.

Swimming ability, persons who went swimming, fishing, rock fishing, snorkelling or scuba
diving in the last 4 weeks ages 16 years and over, NSW, 2006
020406080100 0 20 40 60 80 100
Males Females
Per cent Per cent
30.8 21.6Very strong
swimmer
30.2 25.5Good swimmer
31.3 43.7Average swimmer
7.3 8.3Poor swimmer
0.4 0.9can’t swimm
ResponseMales
(95% CI)Females(95% CI)
Persons(95% CI)
Very strong swimmer 30.8 (26.1-35.5) 21.6 (17.6-25.6) 27.0 (23.8-30.3)
Good swimmer 30.2 (25.8-34.5) 25.5 (21.4-29.7) 28.3 (25.2-31.4)
Average swimmer 31.3 (27.0-35.7) 43.7 (39.0-48.3) 36.4 (33.1-39.6)
Poor swimmer 7.3 (5.1-9.5) 8.3 (6.0-10.6) 7.7 (6.1-9.3)
can’t swimm 0.4 (0.0-0.8) 0.9 (0.3-1.5) 0.6 (0.3-1.0)
Note: Estimates are based on 1,410 respondents in NSW. For this indicator 6 (0.42%) were not stated (Don’t know or Refused) in NSW. The questions used were: In the last 4 weeks, did you do any of the following: swimming, fishing, rock fishing, snorkelling or scuba diving? and Howwould you rate your swimming ability?
Source: New South Wales Population Health Survey 2006 (HOIST). Centre for Epidemiology and Research, NSW Department of Health.
104
WARNIN
G: Esti
mates o
ut of
date.
Please
chec
k Hea
lthStat
s NSW
for la
test e
stimate
s.
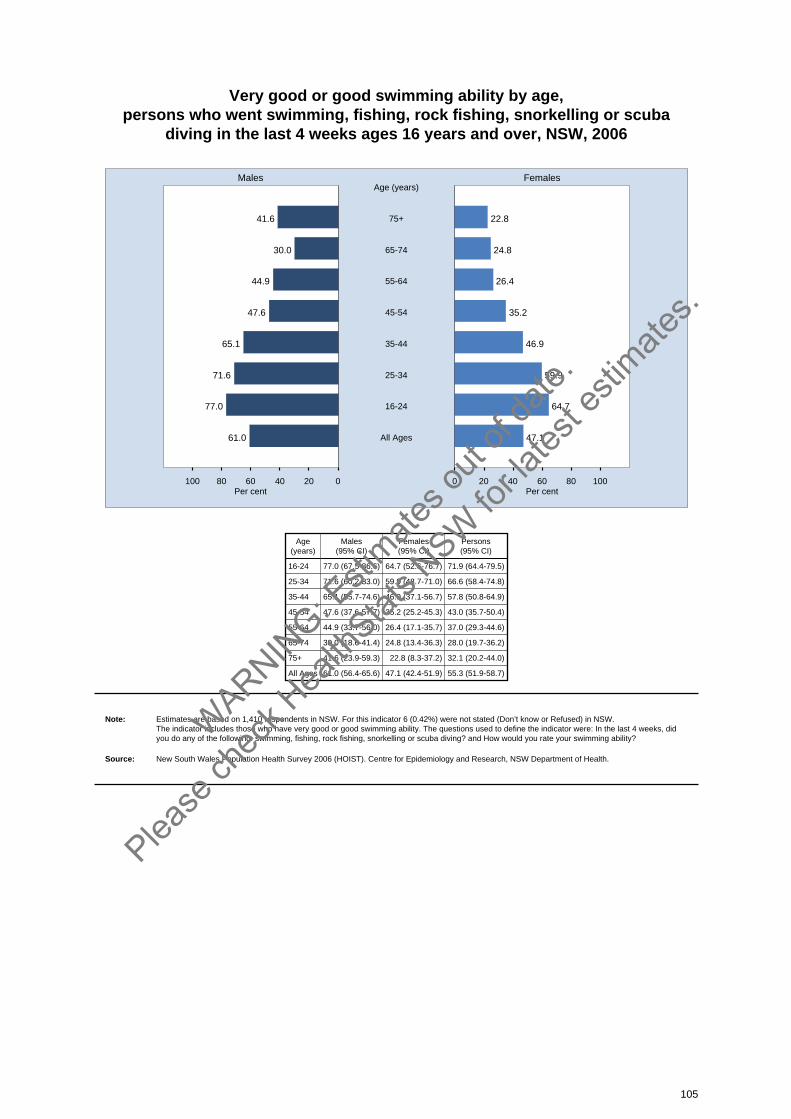
Very good or good swimming ability by age, persons who went swimming, fishing, rock fishing, snorkelling or scuba
diving in the last 4 weeks ages 16 years and over, NSW, 2006
020406080100 0 20 40 60 80 100
Males Females
Per cent Per cent
41.6 22.875+
Age (years)
30.0 24.865-74
44.9 26.455-64
47.6 35.245-54
65.1 46.935-44
71.6 59.925-34
77.0 64.716-24
61.0 47.1All Ages
Age(years)
Males(95% CI)
Females(95% CI)
Persons(95% CI)
16-24 77.0 (67.5-86.6) 64.7 (52.6-76.7) 71.9 (64.4-79.5)
25-34 71.6 (60.2-83.0) 59.9 (48.7-71.0) 66.6 (58.4-74.8)
35-44 65.1 (55.7-74.6) 46.9 (37.1-56.7) 57.8 (50.8-64.9)
45-54 47.6 (37.6-57.7) 35.2 (25.2-45.3) 43.0 (35.7-50.4)
55-64 44.9 (33.7-56.0) 26.4 (17.1-35.7) 37.0 (29.3-44.6)
65-74 30.0 (18.6-41.4) 24.8 (13.4-36.3) 28.0 (19.7-36.2)
75+ 41.6 (23.9-59.3) 22.8 (8.3-37.2) 32.1 (20.2-44.0)
All Ages 61.0 (56.4-65.6) 47.1 (42.4-51.9) 55.3 (51.9-58.7)
Note: Estimates are based on 1,410 respondents in NSW. For this indicator 6 (0.42%) were not stated (Don’t know or Refused) in NSW. The indicator includes those who have very good or good swimming ability. The questions used to define the indicator were: In the last 4 weeks, didyou do any of the following: swimming, fishing, rock fishing, snorkelling or scuba diving? and How would you rate your swimming ability?
Source: New South Wales Population Health Survey 2006 (HOIST). Centre for Epidemiology and Research, NSW Department of Health.
105
WARNIN
G: Esti
mates o
ut of
date.
Please
chec
k Hea
lthStat
s NSW
for la
test e
stimate
s.
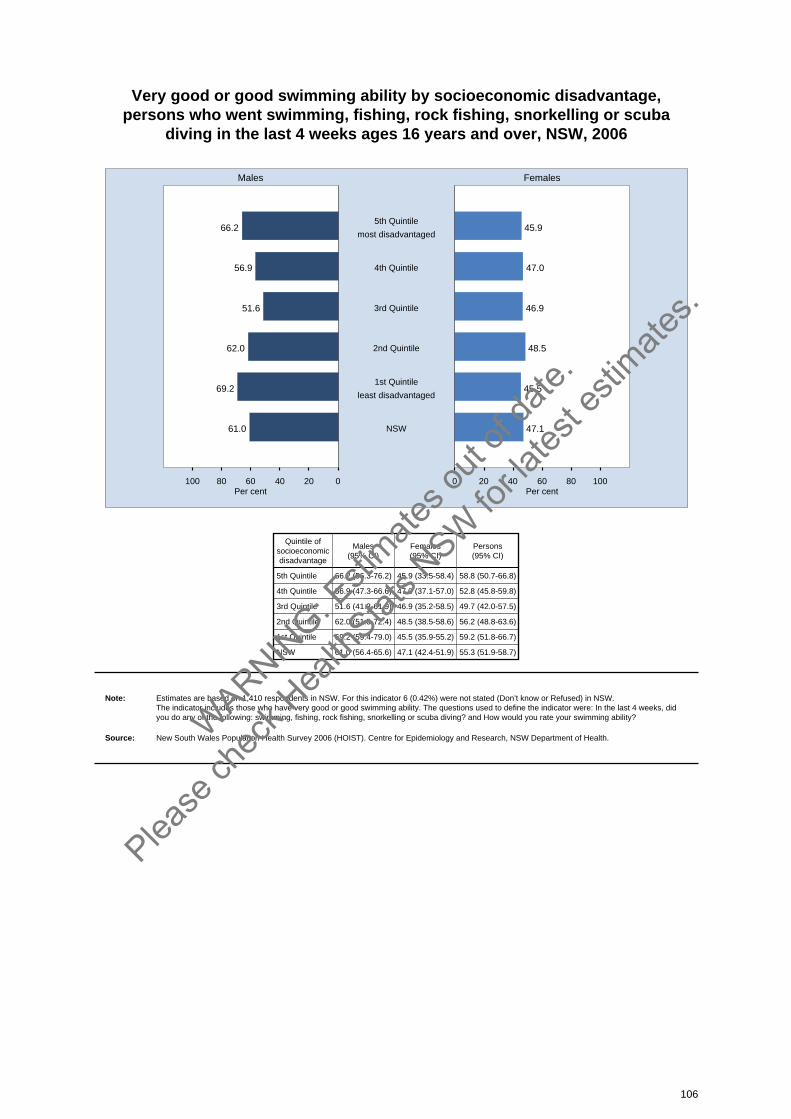
Very good or good swimming ability by socioeconomic disadvantage, persons who went swimming, fishing, rock fishing, snorkelling or scuba
diving in the last 4 weeks ages 16 years and over, NSW, 2006
020406080100 0 20 40 60 80 100
Males Females
Per cent Per cent
66.2 45.95th Quintile
most disadvantaged
56.9 47.04th Quintile
51.6 46.93rd Quintile
62.0 48.52nd Quintile
69.2 45.51st Quintile
least disadvantaged
61.0 47.1NSW
Quintile ofsocioeconomicdisadvantage
Males(95% CI)
Females(95% CI)
Persons(95% CI)
5th Quintile 66.2 (56.3-76.2) 45.9 (33.5-58.4) 58.8 (50.7-66.8)
4th Quintile 56.9 (47.3-66.6) 47.0 (37.1-57.0) 52.8 (45.8-59.8)
3rd Quintile 51.6 (41.3-61.9) 46.9 (35.2-58.5) 49.7 (42.0-57.5)
2nd Quintile 62.0 (51.5-72.4) 48.5 (38.5-58.6) 56.2 (48.8-63.6)
1st Quintile 69.2 (59.4-79.0) 45.5 (35.9-55.2) 59.2 (51.8-66.7)
NSW 61.0 (56.4-65.6) 47.1 (42.4-51.9) 55.3 (51.9-58.7)
Note: Estimates are based on 1,410 respondents in NSW. For this indicator 6 (0.42%) were not stated (Don’t know or Refused) in NSW. The indicator includes those who have very good or good swimming ability. The questions used to define the indicator were: In the last 4 weeks, didyou do any of the following: swimming, fishing, rock fishing, snorkelling or scuba diving? and How would you rate your swimming ability?
Source: New South Wales Population Health Survey 2006 (HOIST). Centre for Epidemiology and Research, NSW Department of Health.
106
WARNIN
G: Esti
mates o
ut of
date.
Please
chec
k Hea
lthStat
s NSW
for la
test e
stimate
s.
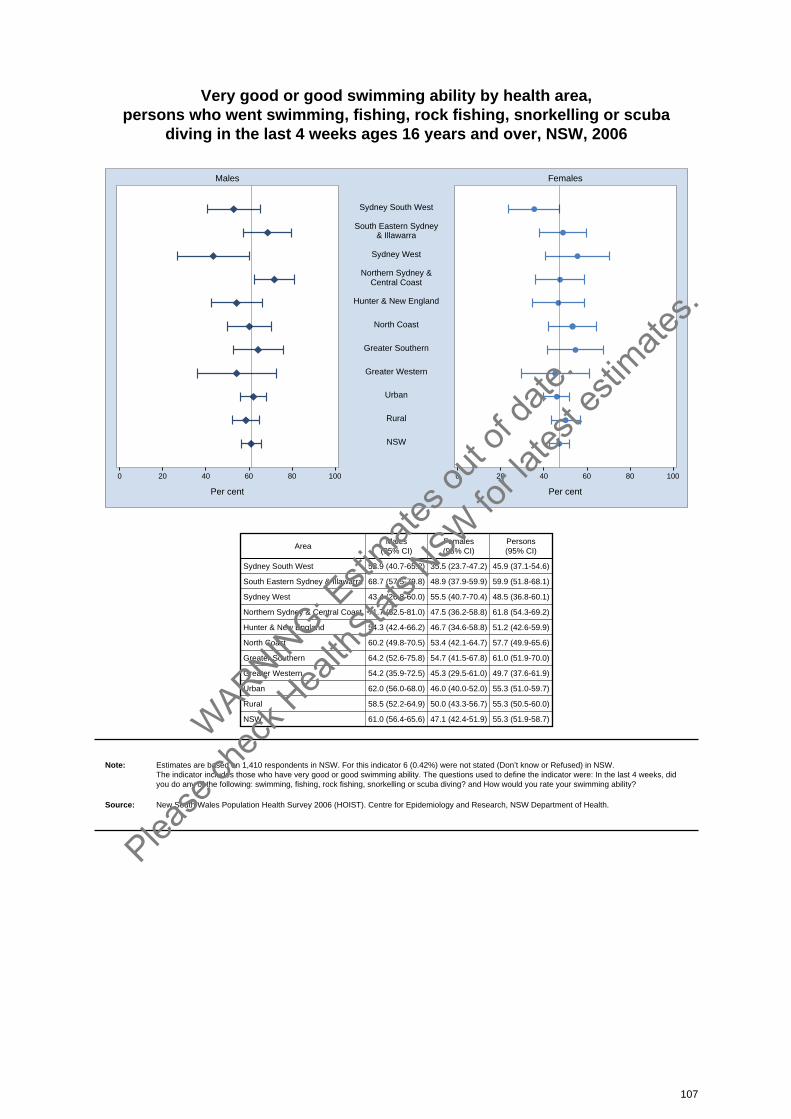
Very good or good swimming ability by health area, persons who went swimming, fishing, rock fishing, snorkelling or scuba
diving in the last 4 weeks ages 16 years and over, NSW, 2006
0 20 40 60 80 100 0 20 40 60 80 100
Males Females
Per cent Per cent
Sydney South West
South Eastern Sydney& Illawarra
Sydney West
Northern Sydney &Central Coast
Hunter & New England
North Coast
Greater Southern
Greater Western
Urban
Rural
NSW
AreaMales
(95% CI)Females(95% CI)
Persons(95% CI)
Sydney South West 52.9 (40.7-65.2) 35.5 (23.7-47.2) 45.9 (37.1-54.6)
South Eastern Sydney & Illawarra 68.7 (57.5-79.8) 48.9 (37.9-59.9) 59.9 (51.8-68.1)
Sydney West 43.4 (26.8-60.0) 55.5 (40.7-70.4) 48.5 (36.8-60.1)
Northern Sydney & Central Coast 71.7 (62.5-81.0) 47.5 (36.2-58.8) 61.8 (54.3-69.2)
Hunter & New England 54.3 (42.4-66.2) 46.7 (34.6-58.8) 51.2 (42.6-59.9)
North Coast 60.2 (49.8-70.5) 53.4 (42.1-64.7) 57.7 (49.9-65.6)
Greater Southern 64.2 (52.6-75.8) 54.7 (41.5-67.8) 61.0 (51.9-70.0)
Greater Western 54.2 (35.9-72.5) 45.3 (29.5-61.0) 49.7 (37.6-61.9)
Urban 62.0 (56.0-68.0) 46.0 (40.0-52.0) 55.3 (51.0-59.7)
Rural 58.5 (52.2-64.9) 50.0 (43.3-56.7) 55.3 (50.5-60.0)
NSW 61.0 (56.4-65.6) 47.1 (42.4-51.9) 55.3 (51.9-58.7)
Note: Estimates are based on 1,410 respondents in NSW. For this indicator 6 (0.42%) were not stated (Don’t know or Refused) in NSW. The indicator includes those who have very good or good swimming ability. The questions used to define the indicator were: In the last 4 weeks, didyou do any of the following: swimming, fishing, rock fishing, snorkelling or scuba diving? and How would you rate your swimming ability?
Source: New South Wales Population Health Survey 2006 (HOIST). Centre for Epidemiology and Research, NSW Department of Health.
107
WARNIN
G: Esti
mates o
ut of
date.
Please
chec
k Hea
lthStat
s NSW
for la
test e
stimate
s.

Nutrition
IntroductionNutrition is important at all stages of life. Dietary factors are linked to health and disease, either asprotective influences or as risk factors. Some of the diseases and conditions to which diet contributessubstantially, either to protection or risk, include: coronary heart disease, some cancers, type-2diabetes, overweight and obesity, osteoporosis, dental caries, gall bladder disease, and diverticular disease.[1-6]
The Australian Guide to Healthy Eating and National ’Go for 2 and 5’ Fruits and Vegetables Campaignstress the importance of eating plenty of plant foods (bread, cereal, rice, pasta, noodles, legumes, 5serves of vegetables, and 2 serves of fruit); moderate amounts of animal foods (milk, yogurt, cheese,meat, fish, poultry, and eggs); and small amounts of fat, salt and sugars. It is also essential to drinkplenty of water.[2,3]
An adequate intake of fruit and vegetables, and breads and cereals, has a protective influence on health.[1-6] However, most population groups eat less than the recommended amounts of these foods.[1] A diet high in fat consumption is associated with health risk, which is why it is important tomonitor fat consumption in dairy foods, fried potatoes, potato crisps and salty snacks, and processed meats.
Despite the good quality of the food supply, there are some groups who lack food security: that is, whodo not have sufficient access at all times to sufficient food for an active and healthy life. Foodinsecurity is associated with socioeconomic disadvantage and is a likely contributor to ill health.
In 2006, the New South Wales Population Health Survey included a dietary questionnaire on usualconsumption of fruit and vegetables, breads and cereals (including pasta, rice and noodles), type ofmilk consumed (including low fat, reduced fat, and skim milk), selected foods high in fats (friedpotatoes, potato crisps and salty snacks, and processed meats), red meat (excluding pork or ham),soft drinks, fast foods, knowledge of recommended servings of fruit and vegetables, and food insecurity.[7] Several of these questions were validated using the 1995 National Nutrition Survey andthe Tasmanian Dietary Key Indicators Study. The validated questions were found to be reliable forrelative ranking of intake between respondents but not for measuring a respondent’s number ofserves; however, they are still useful for ongoing comparitive monitoring.[8]
Respondents were asked: How many serves of fruit do you usually eat each day? How many servesof fruit do you think you should eat each day to be healthy? How many serves of vegetables do youusually eat each day? How many serves of vegetables do you think you should eat each day to behealthy? How often do you usually eat bread? How often do you eat breakfast cereal? How often doyou eat pasta, rice, noodles, or other cooked cereals? What type of milk do you usually have? Howoften do you eat hot chips, french fries, wedges, or fried potatoes? How often do you eat potato crispsor other salty snacks such as twisties or corn chips? How often do you eat processed meat productssuch as sausages, frankfurts, devon, salami, meat pies, bacon, or ham? How many cups of soft drink,cordials or sports drink do you usually drink in a day? How often do you have meals or snacks such asburgers, pizza, chicken or chips from take-away places? In the last 12 months, were there any timesthat you ran out of food and couldn’t afford to buy more?
Results
Consumption of fruit
Overall, in 2006, 7.7 per cent of adults consumed no fruit, 11.8 per cent consumed less than one servea day, 27.1 per cent consumed one serve a day, 30.4 per cent consumed 2 serves a day, 15.2 percent consumed 3 serves a day, and 7.8 per cent consumed more than 3 serves a day.
108
WARNIN
G: Esti
mates o
ut of
date.
Please
chec
k Hea
lthStat
s NSW
for la
test e
stimate
s.
Therefore, 53.4 per cent of adults consumed the recommended number of serves of fruit each day (2serves or more). A significantly higher proportion of females (59.6 per cent) than males (47.0 per cent)consumed the recommended number of serves of fruit a day. Among males, a significantly higherproportion of those aged 75 years and over (53.6 cent) and a significantly lower proportion of thoseaged 25-34 years (38.6 per cent) consumed the recommended number of serves of fruit each day,compared with the overall adult male population. Among females, a significantly lower proportion ofthose aged 16-24 years (52.8 per cent) and 25-34 years (53.5 per cent), and a significantly higherproportion of those aged 55-64 years (65.3 per cent) and 65-74 years (70.3 per cent) and 75 yearsand over (67.3 per cent), consumed the recommended number of serves of fruit a day, compared withthe overall adult female population.
Overall, the proportion of adults consuming the recommended number of serves of fruit each day didnot vary significantly between rural areas and urban areas; however, a higher proportion of adults inthe Northern Sydney & Central Coast Health Area (57.6 per cent), and a lower proportion of adults inthe Sydney West (49.1 per cent) and Greater Western (48.9 per cent) Health Areas, consumed therecommended number of serves of fruit each day, compared with the overall adult population.
The proportion of adults consuming the recommended number of serves of fruit each day did not varyaccording to level of socioeconomic disadvantage.
Consumption of the recommended number of serves of fruit each day has increased significantly, from46.1 per cent in 1997 to 53.4 per cent in 2006.
Overall, in 2006, 85.0 per cent of adults knew the recommended daily number of serves of fruit.Females (90.3 per cent) were significantly more likely than males (79.1 per cent) to know therecommended daily number of serves of fruit. A significantly lower number of adults aged 75 yearsand over (78.8 per cent) knew the recommended daily number of serves of fruit, compared with theoverall adult population. There was no significant variation between urban areas and rural areas, oramong health areas, or by level of socioeconomic disadvantage.
Overall, in 2006, 52.4 per cent of adults knew and consumed the recommended number of serves offruit each day, 32.5 per cent knew but did not consume the recommended number of serves, 2.2 percent did not know but consumed the recommended number of serves, and 12.9 per cent neither knewnor consumed the recommended number of serves.
Consumption of vegetables
Overall, in 2006, 1.1 per cent of adults consumed no vegetables, 5.1 per cent consumed less than oneserve a day, 24.6 per cent consumed one serve a day, 28.4 per cent consumed 2 serves a day, 19.5per cent consumed 3 serves a day, 11.9 per cent consumed 4 serves a day, 5.8 per cent consumed 5serves a day, and 3.7 per cent consumed more than 5 serves a day.
Approximately 9.4 per cent of adults consumed the recommended number of serves of vegetables aday (5 serves or more). A significantly higher proportion of females (12.4 per cent) than males (6.4 percent) consumed the recommended number of serves of vegetables a day. Among females,consumption of the recommended number of serves of vegetables increased with age. A significantlylower proportion of those aged 16-24 years (4.8 per cent) and 25-34 years (7.3 per cent), and asignificantly higher proportion of those aged 55-64 years (20.8 per cent), 65-74 years (17.4 per cent)and 75 years and over (16.3 per cent) consumed the recommended number of serves of vegetables aday, compared with the overall adult female population. Among males, a significantly lower proportionof those aged 16-24 years (3.2 per cent), and a significantly higher proportion of those aged 55-64years (10.0 per cent), consumed the recommended number of serves of vegetables a day, comparedwith the overall adult male population.
A significantly higher proportion of adults in rural areas (12.0 per cent) than urban areas (8.3 per cent)consumed the recommended number of serves of vegetables a day. A higher proportion of adults inthe Hunter & New England (12.5 per cent) and North Coast (12.2 per cent) and Greater Western (12.1per cent) Health Areas, and a lower proportion of adults in the Sydney West Health Area (6.3 percent), consumed the recommended number of serves of vegetables a day, compared with the overalladult population.
109
WARNIN
G: Esti
mates o
ut of
date.
Please
chec
k Hea
lthStat
s NSW
for la
test e
stimate
s.
A higher proportion of adults in the second most disadvantaged quintile (11.7 per cent) consumed therecommended number of serves of vegetables a day, compared with the overall adult population.
While the overall proportion of adults consuming the recommended serves of vegetables a day hasnot significantly changed between 1997 and 2006, vegetable consumption has decreased significantlyin males (from 8.0 per cent to 6.4 per cent) and increased significantly in females (from 9.7 per cent to12.4 per cent).
To monitor trends in vegetable consumption below the recommended levels, the New SouthPopulation Health Survey reports adults who consume 3 or more serves of vegetables a day. Overall,in 2006, 40.9 per cent of adults consumed 3 or more serves of vegetables a day. A significantly higherproportion of females (50.8 per cent) than males (30.9 per cent) consumed 3 or more serves ofvegetables a day. Among females, consumption of 3 or more serves of vegetables a day increasedwith age. A significantly lower proportion of those aged 16-24 years (31.8 per cent), and a significantlyhigher proportion of those aged 55-64 years (61.0 per cent), 65-74 years (60.3 per cent), and 75 yearsand over (61.8 per cent) consumed 3 or more serves of vegetables a day, compared with the overalladult female population. Among males, consumption of 3 or more serves of vegetables a dayincreased with age. A significantly lower proportion of those aged 16-24 years (19.9 per cent) and25-34 years (23.1 per cent), and a significantly higher proportion of those aged 65-74 years (44.9 percent) and 75 years and over (43.9 per cent), consumed 3 or more serves of vegetables a day,compared with the overall adult male population.
A significantly higher proportion of adults in rural areas (45.3 per cent) than urban areas (39.0 percent) consumed 3 or more serves of vegetables a day. A higher proportion of adults in the Hunter &New England (45.3 per cent) and North Coast (45.3 per cent) and Greater Southern (45.6 per cent)Health Areas, and a lower proportion of adults in the Sydney West (35.5 per cent) and Sydney SouthWest (36.2 per cent) Health Areas, consumed 3 or more serves of vegetables a day, compared withthe overall adult population.
A higher proportion of adults in the second most disadvantaged quintile (45.2 per cent), and a lowerproportion of adults in the most disdvantaged quintile (37.1 per cent), consumed 3 or more serves ofvegetables a day, compared with the overall adult population.
There has been a significant increase in the proportion of adults consuming 3 or more serves ofvegetables a day, between 1997 (34.0 per cent) and 2006 (40.9 per cent). The increase has not beensignificant in males but has been significant in females (from 39.4 per cent to 50.8 per cent).
Overall, in 2006, 27.4 per cent of adults knew the recommended daily number of serves of vegetables.Females (37.2 per cent) were significantly more likely than males (16.5 per cent) to know therecommended daily number of serves of vegetables. There was no significant variation among agegroups, or between urban areas and rural areas, or by level of socioeconomic disadvantage; however,a lower proportion of adults in the Sydney South West Health Area (23.5 per cent) knew therecommended daily number of serves of vegetables, compared with the overall adult population.
Overall, in 2006, 7.1 per cent of adults knew and consumed the recommended number of serves ofvegetables each day, 17.9 per cent knew but did not consume the recommended number of serves,2.5 per cent did not know but consumed the recommended number of serves, and 72.6 per centneither knew nor consumed the recommended number of serves.
Consumption of low fat or reduced fat or skim milk
Overall, in 2006, 47.3 per cent of adults usually consumed low fat or reduced fat or skim milk. Asignificantly higher proportion of females (53.9 per cent) than males (40.7 per cent) consumed low fator reduced fat or skim milk. Among males, consumption of low fat or reduced fat or skim milkincreased with age. A significantly lower proportion of those aged 16-24 years (24.5 per cent), and asignificantly higher proportion of those aged 55-64 years (50.0 per cent) and 65-74 years (54.9 percent) and 75 years and over (47.4 per cent), consumed low fat or reduced fat or skim milk, comparedwith the overall adult male population. Among females, consumption of low fat or reduced fat or skimmilk increased with age. A significantly lower proportion of those aged 16-24 years (40.8 per cent) anda significantly higher proportion of those aged 55-64 years (64.1 per cent) and 65-74 years (62.6 percent), consumed low fat or reduced fat or skim milk, compared with the overall adult female
110
WARNIN
G: Esti
mates o
ut of
date.
Please
chec
k Hea
lthStat
s NSW
for la
test e
stimate
s.
population.
A significantly lower proportion of adults in rural areas (44.9 per cent) than urban areas (48.4 per cent)consumed low fat or reduced fat or skim milk. A higher proportion of adults in the Northern Sydney &Central Coast Health Area (55.3 per cent), and a lower proportion of adults in the Greater WesternHealth Area (42.2 per cent), consumed low fat or reduced fat or skim milk. A higher proportion ofadults in the least disdavantaged quintile (56.5 per cent), and a lower proportion of adults in the mostdisdavantaged quintile (39.9 per cent), consumed low fat or reduced fat or skim milk, compared withthe overall adult population.
The proportion of adults usually consuming low fat or reduced fat or skim milk has increasedsignificantly between 1997 (45.5 per cent) and 2006 (47.3 per cent). This increase has not beensignificant in females but has been significant in males (from 37.2 per cent to 40.7 per cent).
Consumption of breads and cereals
Overall, in 2006, 0.5 per cent of adults did not consume breads and cereals (including pasta, rice andnoodles), 4.7 per cent consumed breads and cereals less than once a day, 28.8 per cent consumedbreads and cereals once a day, 39.3 per cent twice a day, 19.6 per cent 3 times a day, 4.9 per cent 4times a day, 1.3 per cent 5 times a day, and 0.8 per cent more than 5 times a day.
Consumption of fried potatoes
Overall, in 2006, 30.1 per cent of adults did not consume fried potatoes (hot chips, french fries,wedges, or fried potatoes), 29.2 per cent consumed fried potatoes less than once a week, 24.9 percent once a week, 8.9 per cent twice a week, 3.8 per cent 3 times a week, 1.3 per cent 4 times aweek, 0.4 per cent 5 times a week, and 1.4 per cent more than 5 times a week.
Consumption of potato crisps or other salty snacks
Overall, in 2006, 46.7 per cent of adults did not consume potato crisps or other salty snacks, 21.3 percent consumed potato crisps or other salty snacks less than once a week, 15.1 per cent once a week,7.0 per cent twice a week, 3.9 per cent 3 times a week, 1.7 per cent 4 times a week, 0.7 per cent 5times a week, and 3.6 per cent more than 5 times a week.
Consumption of processed meat products
Overall, in 2006, 20.8 per cent of adults did not consume processed meat products (sausages,frankfurts, devon, salami, meat pies, bacon, or ham), 15.7 per cent consumed processed meatproducts less than once a week, 24.3 per cent consumed them once a week, 17.8 per cent twice aweek, 9.0 per cent 3 times a week, 3.7 per cent 4 times a week, 2.2 per cent 5 times a week, and 6.6per cent more than 5 times a week.
Consumption of soft drinks or cordials or sports drinks
Overall, in 2006, 46.3 per cent of adults did not consume soft drinks or cordials or sports drinks, 7.2per cent consumed one cup a week, 6.6 per cent consumed 2 cups a week, 8.3 per cent consumed3-5 cups a week, 14.2 per cent consumed 6-10 cups a week, and 17.3 per cent consumed 11 or morecups a week.
Consumption of fast foods
Overall, in 2006, 37.1 per cent of adults did not consume fast foods, 33.2 per cent consumed fastfoods less than once a week, 19.9 per cent consumed fast foods weekly, 9.6 per cent consumed fastfoods more than once a week but less than daily, and 0.2 per cent consumed fast foods daily or more.
111
WARNIN
G: Esti
mates o
ut of
date.
Please
chec
k Hea
lthStat
s NSW
for la
test e
stimate
s.
Food insecurity
Overall, in 2006, 5.6 per cent of adults experienced some food insecurity in the past 12 months. Therewas no significant difference between males and females experiencing food insecurity. The proportionof adults who experienced food insecurity was significantly lower among those aged 55-64 years (3.8per cent) and 65-74 years (1.7 per cent) and 75 years and over (1.3 per cent), and significantly higheramong those aged 25-34 years (8.4 per cent), compared with the overall adult population.
There was no significant variation between urban areas and rural areas; however, a lower proportionof adults in the Northern Sydney & Central Coast Health Area (2.6 per cent) experienced foodinsecurity, compared with the overall adult population.
Food insecurity increased with socioeconomic disadvantage. A higher proportion of adultsexperienced food insecurity in the most disadvantaged quintile (7.7 per cent) and a lower proportion ofadults experienced food insecurity in the least disadvantaged quintile, compared with the overall adult population.
There was no significant change in the proportion of adults experiencing food insecurity between 2002and 2006.
References1. National Health and Medical Research Council. Dietary Guidelines for Australian Adults.
Canberra: NHMRC, 2003. Available online atwww.nhmrc.gov.au/publications/synopses/dietsyn.htm (accessed 9 May 2007).
2. National Health and Medical Research Council. Australian Guide to Healthy Eating. Canberra:NHMRC, 2003. Available online atwww.health.gov.au/internet/wcms/Publishing.nsf/Content/health-pubhlth-strateg-food-guide-index.htm(accessed 9 May 2007).
3. National ’Go for 2 and 5’ Fruits and Vegetables Campaign website atwww.healthyactive.gov.au/2and5/about.htm (accessed 9 May 2007).
4. Ness AR, Powles JW. Fruit and vegetables and cardiovascular disease: A review. Int J Epidemiol,1997, 26; 1-13.
5. Margetts B and Pietinen P (Editors). European Prospective Investigation into Cancer andNutrition: Validity Studies on Dietary Assessment Methods. Int J Epidemiol, 1997, 26(S-1).
6. Brunner E, Wunsch H, Marmot M. What is an optimal diet? Relationship of macronutrient intake toobesity, glucose tolerance, lipoprotein cholesterol levels and the metabolic syndrome in theWhitehall II study. Int J Obes Relat Metab Disord, 2001, 25: 45-53.
7. Mark GC, Webb K, Rutishauser IHE, Riley M. Monitoring food habits in the Australian populationusing short questions. Canberra: Australian Government Department of Health and Aged Care,2001. Available online atwww.aodgp.gov.au/internet/wcms/publishing.nsf/Content/health-pubhlth-strateg-food-pdf-foodhabits-cnt.htm(accessed 9 May 2007).
8. Rutishauser IHE, Webb K, Abraham B, Allsop R. Evaluation of short dietary questions from the1995 National Nutrition Survey. Canberra: Australian Food and Nutrition Monitoring Unit,Commonwealth Department of Health and Aged Care, 2001. Available online atwww.health.gov.au/internet/wcms/publishing.nsf/Content/health-pubhlth-strateg-food-pdf-evaluation-cnt.htm(accessed 9 May 2007).
112
WARNIN
G: Esti
mates o
ut of
date.
Please
chec
k Hea
lthStat
s NSW
for la
test e
stimate
s.

Number of serves of fruit per day, persons aged 16 years and over, NSW, 2006
020406080100 0 20 40 60 80 100
Males Females
Per cent Per cent
9.0 6.4No serves
15.0 8.7Less than 1
serve
29.0 25.31 serve
26.4 34.32 serves
12.6 17.73 serves
8.1 7.6More than 3
serves
ResponseMales
(95% CI)Females(95% CI)
Persons(95% CI)
No serves 9.0 (7.6-10.4) 6.4 (5.5-7.3) 7.7 (6.9-8.5)
Less than 1 serve 15.0 (13.3-16.7) 8.7 (7.6-9.8) 11.8 (10.8-12.8)
1 serve 29.0 (26.8-31.1) 25.3 (23.6-27.0) 27.1 (25.8-28.5)
2 serves 26.4 (24.3-28.4) 34.3 (32.5-36.1) 30.4 (29.0-31.7)
3 serves 12.6 (11.1-14.2) 17.7 (16.3-19.1) 15.2 (14.1-16.2)
More than 3 serves 8.1 (6.8-9.3) 7.6 (6.6-8.5) 7.8 (7.0-8.6)
Note: Estimates are based on 7,887 respondents in NSW. For this indicator 75 (0.94%) were not stated (Don’t know or Refused) in NSW. The question used was: How many serves of fruit do you usually eat each day? One serve is equivalent to one medium piece or 2 small pieces of fruit.
Source: New South Wales Population Health Survey 2006 (HOIST). Centre for Epidemiology and Research, NSW Department of Health.
113
WARNIN
G: Esti
mates o
ut of
date.
Please
chec
k Hea
lthStat
s NSW
for la
test e
stimate
s.
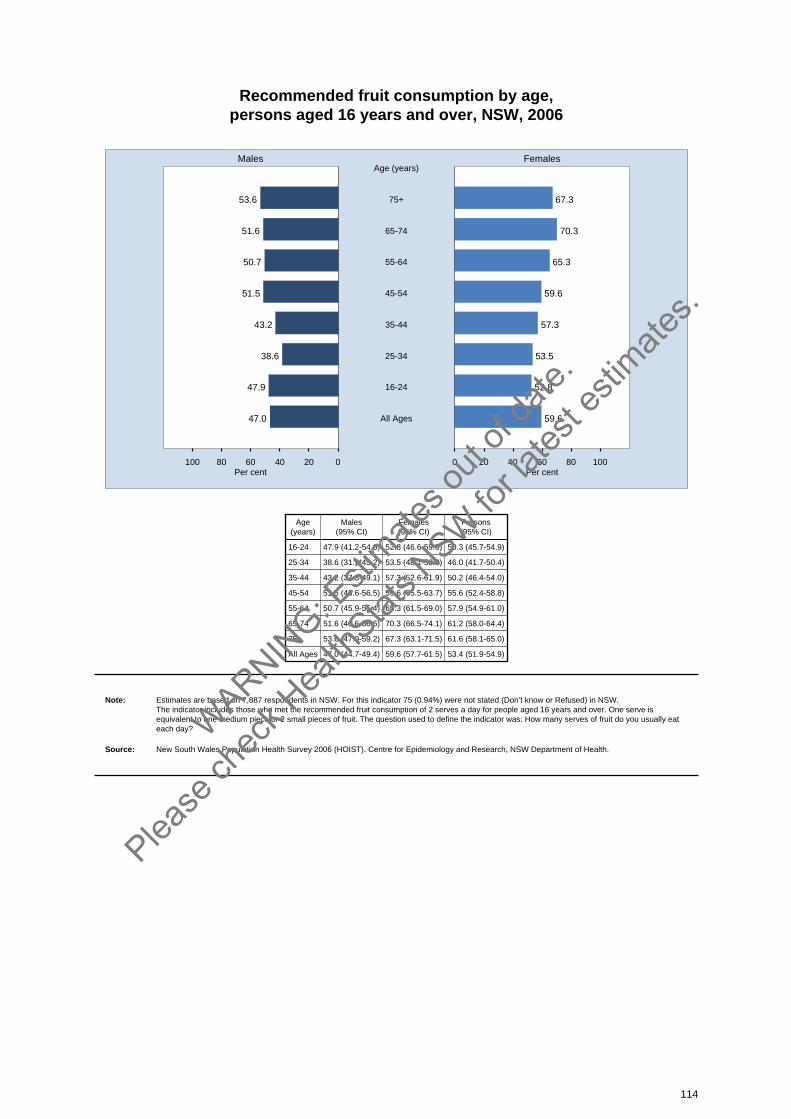
Recommended fruit consumption by age, persons aged 16 years and over, NSW, 2006
020406080100 0 20 40 60 80 100
Males Females
Per cent Per cent
53.6 67.375+
Age (years)
51.6 70.365-74
50.7 65.355-64
51.5 59.645-54
43.2 57.335-44
38.6 53.525-34
47.9 52.816-24
47.0 59.6All Ages
Age(years)
Males(95% CI)
Females(95% CI)
Persons(95% CI)
16-24 47.9 (41.2-54.6) 52.8 (46.6-59.0) 50.3 (45.7-54.9)
25-34 38.6 (31.9-45.2) 53.5 (48.1-58.9) 46.0 (41.7-50.4)
35-44 43.2 (37.3-49.1) 57.3 (52.6-61.9) 50.2 (46.4-54.0)
45-54 51.5 (46.6-56.5) 59.6 (55.5-63.7) 55.6 (52.4-58.8)
55-64 50.7 (45.9-55.4) 65.3 (61.5-69.0) 57.9 (54.9-61.0)
65-74 51.6 (46.6-56.6) 70.3 (66.5-74.1) 61.2 (58.0-64.4)
75+ 53.6 (47.9-59.2) 67.3 (63.1-71.5) 61.6 (58.1-65.0)
All Ages 47.0 (44.7-49.4) 59.6 (57.7-61.5) 53.4 (51.9-54.9)
Note: Estimates are based on 7,887 respondents in NSW. For this indicator 75 (0.94%) were not stated (Don’t know or Refused) in NSW. The indicator includes those who met the recommended fruit consumption of 2 serves a day for people aged 16 years and over. One serve isequivalent to one medium piece or 2 small pieces of fruit. The question used to define the indicator was: How many serves of fruit do you usually eateach day?
Source: New South Wales Population Health Survey 2006 (HOIST). Centre for Epidemiology and Research, NSW Department of Health.
114
WARNIN
G: Esti
mates o
ut of
date.
Please
chec
k Hea
lthStat
s NSW
for la
test e
stimate
s.
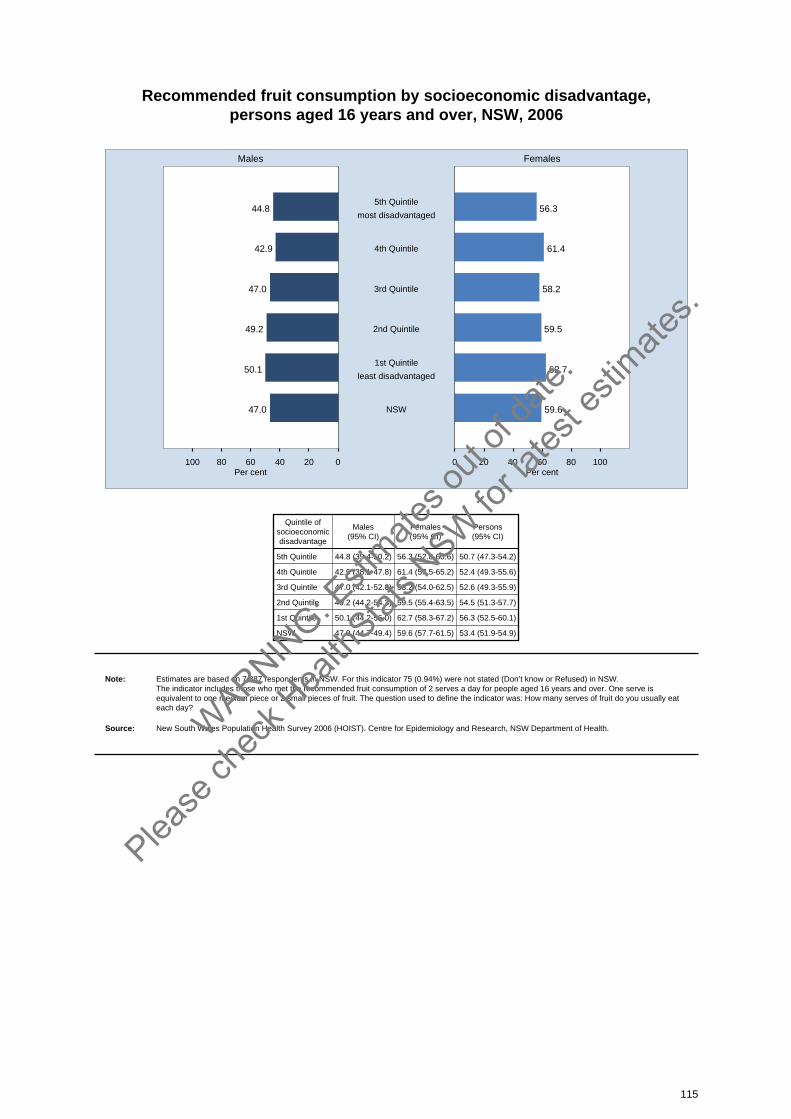
Recommended fruit consumption by socioeconomic disadvantage, persons aged 16 years and over, NSW, 2006
020406080100 0 20 40 60 80 100
Males Females
Per cent Per cent
44.8 56.35th Quintile
most disadvantaged
42.9 61.44th Quintile
47.0 58.23rd Quintile
49.2 59.52nd Quintile
50.1 62.71st Quintile
least disadvantaged
47.0 59.6NSW
Quintile ofsocioeconomicdisadvantage
Males(95% CI)
Females(95% CI)
Persons(95% CI)
5th Quintile 44.8 (39.4-50.2) 56.3 (52.0-60.6) 50.7 (47.3-54.2)
4th Quintile 42.9 (38.1-47.8) 61.4 (57.5-65.2) 52.4 (49.3-55.6)
3rd Quintile 47.0 (42.1-52.0) 58.2 (54.0-62.5) 52.6 (49.3-55.9)
2nd Quintile 49.2 (44.2-54.3) 59.5 (55.4-63.5) 54.5 (51.3-57.7)
1st Quintile 50.1 (44.2-56.0) 62.7 (58.3-67.2) 56.3 (52.5-60.1)
NSW 47.0 (44.7-49.4) 59.6 (57.7-61.5) 53.4 (51.9-54.9)
Note: Estimates are based on 7,887 respondents in NSW. For this indicator 75 (0.94%) were not stated (Don’t know or Refused) in NSW. The indicator includes those who met the recommended fruit consumption of 2 serves a day for people aged 16 years and over. One serve isequivalent to one medium piece or 2 small pieces of fruit. The question used to define the indicator was: How many serves of fruit do you usually eateach day?
Source: New South Wales Population Health Survey 2006 (HOIST). Centre for Epidemiology and Research, NSW Department of Health.
115
WARNIN
G: Esti
mates o
ut of
date.
Please
chec
k Hea
lthStat
s NSW
for la
test e
stimate
s.
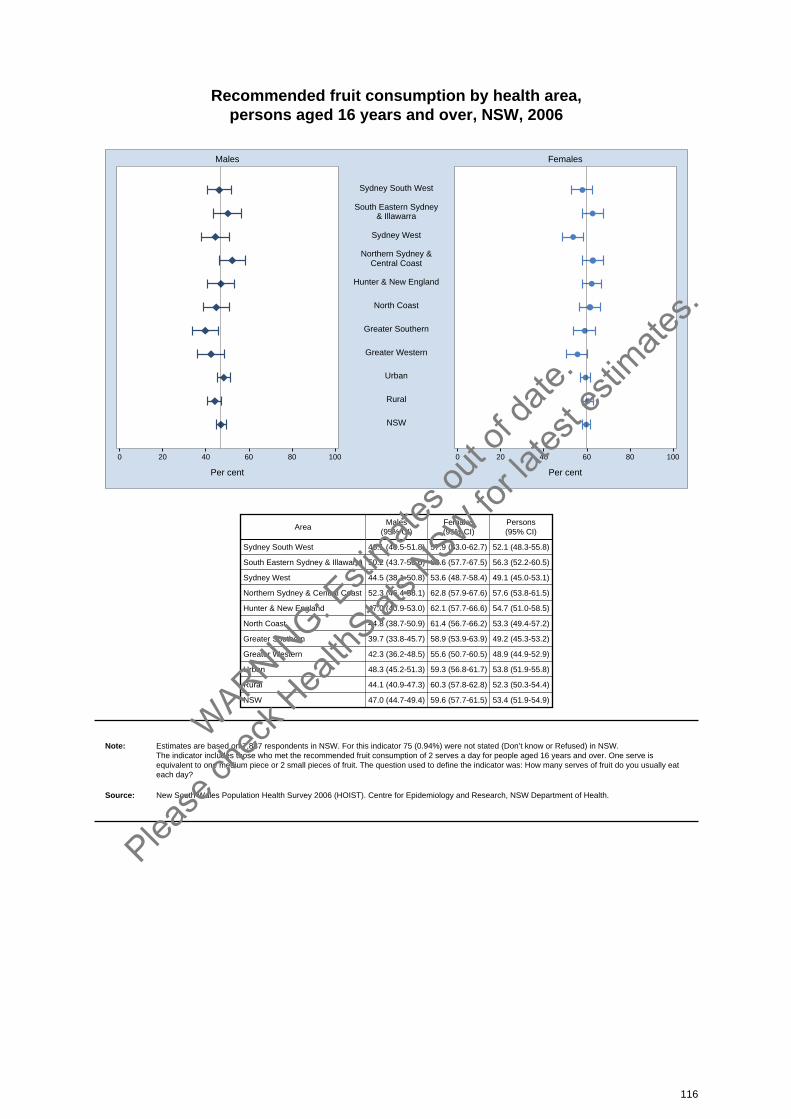
Recommended fruit consumption by health area, persons aged 16 years and over, NSW, 2006
0 20 40 60 80 100 0 20 40 60 80 100
Males Females
Per cent Per cent
Sydney South West
South Eastern Sydney& Illawarra
Sydney West
Northern Sydney &Central Coast
Hunter & New England
North Coast
Greater Southern
Greater Western
Urban
Rural
NSW
AreaMales
(95% CI)Females(95% CI)
Persons(95% CI)
Sydney South West 46.1 (40.5-51.8) 57.9 (53.0-62.7) 52.1 (48.3-55.8)
South Eastern Sydney & Illawarra 50.2 (43.7-56.6) 62.6 (57.7-67.5) 56.3 (52.2-60.5)
Sydney West 44.5 (38.1-50.8) 53.6 (48.7-58.4) 49.1 (45.0-53.1)
Northern Sydney & Central Coast 52.3 (46.4-58.1) 62.8 (57.9-67.6) 57.6 (53.8-61.5)
Hunter & New England 47.0 (40.9-53.0) 62.1 (57.7-66.6) 54.7 (51.0-58.5)
North Coast 44.8 (38.7-50.9) 61.4 (56.7-66.2) 53.3 (49.4-57.2)
Greater Southern 39.7 (33.8-45.7) 58.9 (53.9-63.9) 49.2 (45.3-53.2)
Greater Western 42.3 (36.2-48.5) 55.6 (50.7-60.5) 48.9 (44.9-52.9)
Urban 48.3 (45.2-51.3) 59.3 (56.8-61.7) 53.8 (51.9-55.8)
Rural 44.1 (40.9-47.3) 60.3 (57.8-62.8) 52.3 (50.3-54.4)
NSW 47.0 (44.7-49.4) 59.6 (57.7-61.5) 53.4 (51.9-54.9)
Note: Estimates are based on 7,887 respondents in NSW. For this indicator 75 (0.94%) were not stated (Don’t know or Refused) in NSW. The indicator includes those who met the recommended fruit consumption of 2 serves a day for people aged 16 years and over. One serve isequivalent to one medium piece or 2 small pieces of fruit. The question used to define the indicator was: How many serves of fruit do you usually eateach day?
Source: New South Wales Population Health Survey 2006 (HOIST). Centre for Epidemiology and Research, NSW Department of Health.
116
WARNIN
G: Esti
mates o
ut of
date.
Please
chec
k Hea
lthStat
s NSW
for la
test e
stimate
s.

Knowledge of recommended fruit serves by age, persons aged 16 years and over, NSW, 2006
020406080100 0 20 40 60 80 100
Males Females
Per cent Per cent
72.1 83.475+
Age (years)
76.1 90.865-74
76.6 91.255-64
80.7 90.345-54
77.7 90.635-44
82.0 90.425-34
81.7 91.816-24
79.1 90.3All Ages
Age(years)
Males(95% CI)
Females(95% CI)
Persons(95% CI)
16-24 81.7 (76.2-87.3) 91.8 (88.1-95.5) 86.7 (83.3-90.1)
25-34 82.0 (76.2-87.9) 90.4 (86.7-94.1) 86.6 (83.2-89.9)
35-44 77.7 (72.4-82.9) 90.6 (87.7-93.6) 84.3 (81.3-87.3)
45-54 80.7 (76.3-85.1) 90.3 (87.9-92.8) 85.8 (83.3-88.2)
55-64 76.6 (71.9-81.2) 91.2 (88.7-93.8) 84.2 (81.5-86.8)
65-74 76.1 (70.9-81.2) 90.8 (88.2-93.5) 84.2 (81.5-87.0)
75+ 72.1 (65.5-78.8) 83.4 (79.4-87.5) 78.8 (75.1-82.5)
All Ages 79.1 (77.0-81.2) 90.3 (89.1-91.5) 85.0 (83.8-86.2)
Note: Estimates are based on 6,500 respondents in NSW. For this indicator 191 (2.85%) were not stated (Don’t know or Refused) in NSW. The indicator includes those who know the recommended daily consumption of fruit, that being 2 or more serves. The question used to define theindicator was: How many serves of fruit do you think you should eat each day to be healthy?
Source: New South Wales Population Health Survey 2006 (HOIST). Centre for Epidemiology and Research, NSW Department of Health.
117
WARNIN
G: Esti
mates o
ut of
date.
Please
chec
k Hea
lthStat
s NSW
for la
test e
stimate
s.
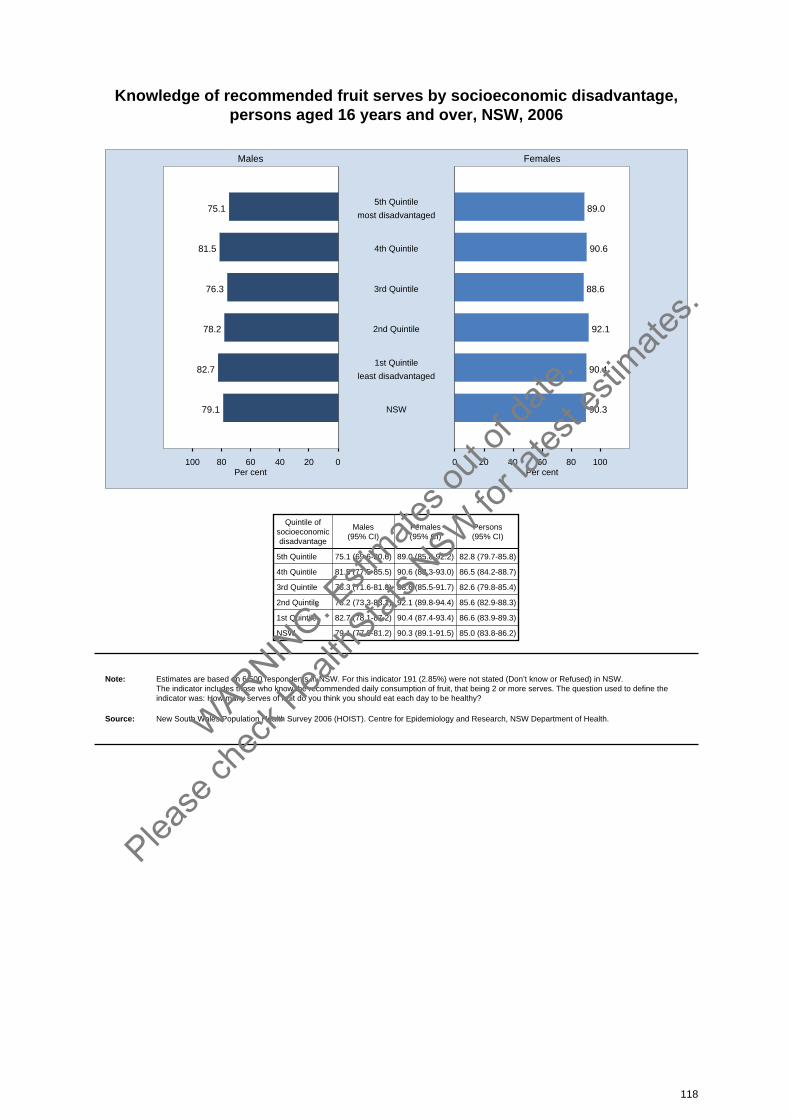
Knowledge of recommended fruit serves by socioeconomic disadvantage, persons aged 16 years and over, NSW, 2006
020406080100 0 20 40 60 80 100
Males Females
Per cent Per cent
75.1 89.05th Quintile
most disadvantaged
81.5 90.64th Quintile
76.3 88.63rd Quintile
78.2 92.12nd Quintile
82.7 90.41st Quintile
least disadvantaged
79.1 90.3NSW
Quintile ofsocioeconomicdisadvantage
Males(95% CI)
Females(95% CI)
Persons(95% CI)
5th Quintile 75.1 (69.6-80.6) 89.0 (85.8-92.2) 82.8 (79.7-85.8)
4th Quintile 81.5 (77.5-85.5) 90.6 (88.3-93.0) 86.5 (84.2-88.7)
3rd Quintile 76.3 (71.6-81.0) 88.6 (85.5-91.7) 82.6 (79.8-85.4)
2nd Quintile 78.2 (73.3-83.1) 92.1 (89.8-94.4) 85.6 (82.9-88.3)
1st Quintile 82.7 (78.1-87.2) 90.4 (87.4-93.4) 86.6 (83.9-89.3)
NSW 79.1 (77.0-81.2) 90.3 (89.1-91.5) 85.0 (83.8-86.2)
Note: Estimates are based on 6,500 respondents in NSW. For this indicator 191 (2.85%) were not stated (Don’t know or Refused) in NSW. The indicator includes those who know the recommended daily consumption of fruit, that being 2 or more serves. The question used to define theindicator was: How many serves of fruit do you think you should eat each day to be healthy?
Source: New South Wales Population Health Survey 2006 (HOIST). Centre for Epidemiology and Research, NSW Department of Health.
118
WARNIN
G: Esti
mates o
ut of
date.
Please
chec
k Hea
lthStat
s NSW
for la
test e
stimate
s.
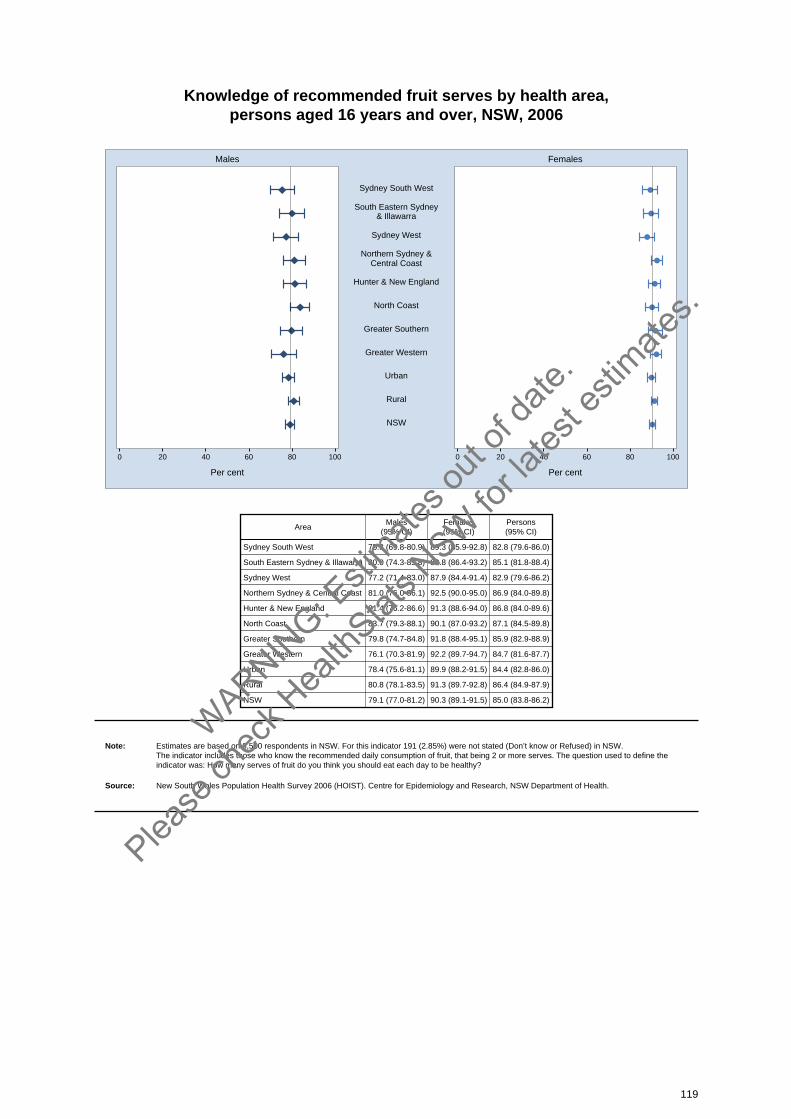
Knowledge of recommended fruit serves by health area, persons aged 16 years and over, NSW, 2006
0 20 40 60 80 100 0 20 40 60 80 100
Males Females
Per cent Per cent
Sydney South West
South Eastern Sydney& Illawarra
Sydney West
Northern Sydney &Central Coast
Hunter & New England
North Coast
Greater Southern
Greater Western
Urban
Rural
NSW
AreaMales
(95% CI)Females(95% CI)
Persons(95% CI)
Sydney South West 75.3 (69.8-80.9) 89.3 (85.9-92.8) 82.8 (79.6-86.0)
South Eastern Sydney & Illawarra 80.0 (74.3-85.8) 89.8 (86.4-93.2) 85.1 (81.8-88.4)
Sydney West 77.2 (71.4-83.0) 87.9 (84.4-91.4) 82.9 (79.6-86.2)
Northern Sydney & Central Coast 81.0 (76.0-86.1) 92.5 (90.0-95.0) 86.9 (84.0-89.8)
Hunter & New England 81.4 (76.2-86.6) 91.3 (88.6-94.0) 86.8 (84.0-89.6)
North Coast 83.7 (79.3-88.1) 90.1 (87.0-93.2) 87.1 (84.5-89.8)
Greater Southern 79.8 (74.7-84.8) 91.8 (88.4-95.1) 85.9 (82.9-88.9)
Greater Western 76.1 (70.3-81.9) 92.2 (89.7-94.7) 84.7 (81.6-87.7)
Urban 78.4 (75.6-81.1) 89.9 (88.2-91.5) 84.4 (82.8-86.0)
Rural 80.8 (78.1-83.5) 91.3 (89.7-92.8) 86.4 (84.9-87.9)
NSW 79.1 (77.0-81.2) 90.3 (89.1-91.5) 85.0 (83.8-86.2)
Note: Estimates are based on 6,500 respondents in NSW. For this indicator 191 (2.85%) were not stated (Don’t know or Refused) in NSW. The indicator includes those who know the recommended daily consumption of fruit, that being 2 or more serves. The question used to define theindicator was: How many serves of fruit do you think you should eat each day to be healthy?
Source: New South Wales Population Health Survey 2006 (HOIST). Centre for Epidemiology and Research, NSW Department of Health.
119
WARNIN
G: Esti
mates o
ut of
date.
Please
chec
k Hea
lthStat
s NSW
for la
test e
stimate
s.
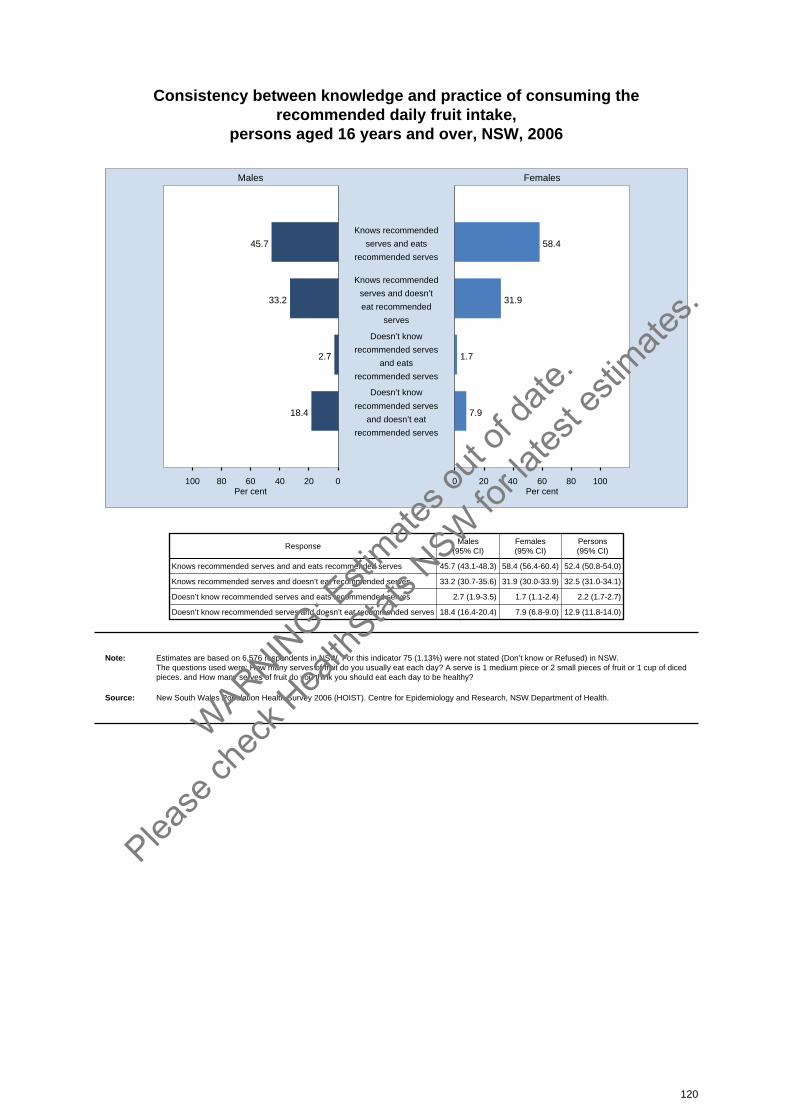
Consistency between knowledge and practice of consuming therecommended daily fruit intake,
persons aged 16 years and over, NSW, 2006
020406080100 0 20 40 60 80 100
Males Females
Per cent Per cent
45.7 58.4
Knows recommended
serves and eats
recommended serves
33.2 31.9
Knows recommended
serves and doesn’t
eat recommended
serves
2.7 1.7
Doesn’t know
recommended serves
and eats
recommended serves
18.4 7.9
Doesn’t know
recommended serves
and doesn’t eat
recommended serves
ResponseMales
(95% CI)Females(95% CI)
Persons(95% CI)
Knows recommended serves and and eats recommended serves 45.7 (43.1-48.3) 58.4 (56.4-60.4) 52.4 (50.8-54.0)
Knows recommended serves and doesn’t eat recommended serves 33.2 (30.7-35.6) 31.9 (30.0-33.9) 32.5 (31.0-34.1)
Doesn’t know recommended serves and eats recommended serves 2.7 (1.9-3.5) 1.7 (1.1-2.4) 2.2 (1.7-2.7)
Doesn’t know recommended serves and doesn’t eat recommended serves 18.4 (16.4-20.4) 7.9 (6.8-9.0) 12.9 (11.8-14.0)
Note: Estimates are based on 6,576 respondents in NSW. For this indicator 75 (1.13%) were not stated (Don’t know or Refused) in NSW. The questions used were: How many serves of fruit do you usually eat each day? A serve is 1 medium piece or 2 small pieces of fruit or 1 cup of dicedpieces. and How many serves of fruit do you think you should eat each day to be healthy?
Source: New South Wales Population Health Survey 2006 (HOIST). Centre for Epidemiology and Research, NSW Department of Health.
120
WARNIN
G: Esti
mates o
ut of
date.
Please
chec
k Hea
lthStat
s NSW
for la
test e
stimate
s.
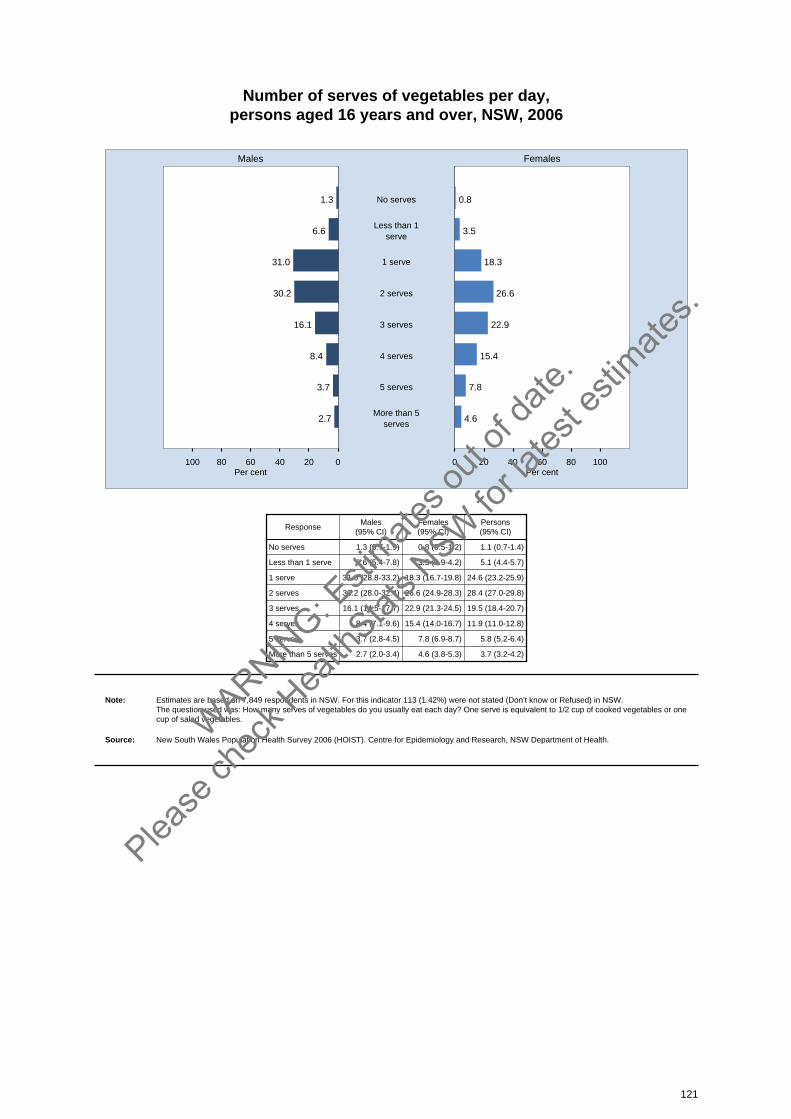
Number of serves of vegetables per day, persons aged 16 years and over, NSW, 2006
020406080100 0 20 40 60 80 100
Males Females
Per cent Per cent
1.3 0.8No serves
6.6 3.5Less than 1
serve
31.0 18.31 serve
30.2 26.62 serves
16.1 22.93 serves
8.4 15.44 serves
3.7 7.85 serves
2.7 4.6More than 5
serves
ResponseMales
(95% CI)Females(95% CI)
Persons(95% CI)
No serves 1.3 (0.7-1.9) 0.8 (0.5-1.2) 1.1 (0.7-1.4)
Less than 1 serve 6.6 (5.4-7.8) 3.5 (2.9-4.2) 5.1 (4.4-5.7)
1 serve 31.0 (28.8-33.2) 18.3 (16.7-19.8) 24.6 (23.2-25.9)
2 serves 30.2 (28.0-32.4) 26.6 (24.9-28.3) 28.4 (27.0-29.8)
3 serves 16.1 (14.5-17.7) 22.9 (21.3-24.5) 19.5 (18.4-20.7)
4 serves 8.4 (7.1-9.6) 15.4 (14.0-16.7) 11.9 (11.0-12.8)
5 serves 3.7 (2.8-4.5) 7.8 (6.9-8.7) 5.8 (5.2-6.4)
More than 5 serves 2.7 (2.0-3.4) 4.6 (3.8-5.3) 3.7 (3.2-4.2)
Note: Estimates are based on 7,849 respondents in NSW. For this indicator 113 (1.42%) were not stated (Don’t know or Refused) in NSW. The question used was: How many serves of vegetables do you usually eat each day? One serve is equivalent to 1/2 cup of cooked vegetables or onecup of salad vegetables.
Source: New South Wales Population Health Survey 2006 (HOIST). Centre for Epidemiology and Research, NSW Department of Health.
121
WARNIN
G: Esti
mates o
ut of
date.
Please
chec
k Hea
lthStat
s NSW
for la
test e
stimate
s.

Recommended vegetable consumption by age, persons aged 16 years and over, NSW, 2006
020406080100 0 20 40 60 80 100
Males Females
Per cent Per cent
9.2 16.375+
Age (years)
8.4 17.465-74
10.0 20.855-64
7.0 13.245-54
4.6 11.735-44
5.7 7.325-34
3.2 4.816-24
6.4 12.4All Ages
Age(years)
Males(95% CI)
Females(95% CI)
Persons(95% CI)
16-24 3.2 (1.1-5.2) 4.8 (2.2-7.3) 3.9 (2.3-5.6)
25-34 5.7 (2.7-8.7) 7.3 (4.5-10.2) 6.5 (4.4-8.6)
35-44 4.6 (2.1-7.1) 11.7 (8.8-14.6) 8.1 (6.2-10.0)
45-54 7.0 (4.1-9.8) 13.2 (10.5-16.0) 10.1 (8.1-12.1)
55-64 10.0 (7.2-12.8) 20.8 (17.8-23.8) 15.3 (13.3-17.4)
65-74 8.4 (5.9-11.0) 17.4 (14.2-20.6) 13.1 (11.0-15.2)
75+ 9.2 (6.0-12.4) 16.3 (12.7-19.9) 13.3 (10.8-15.8)
All Ages 6.4 (5.3-7.5) 12.4 (11.3-13.6) 9.4 (8.7-10.2)
Note: Estimates are based on 7,849 respondents in NSW. For this indicator 113 (1.42%) were not stated (Don’t know or Refused) in NSW. The indicator includes those who met the recommended consumption of vegetables. The recommended vegetable intake is 5 serves per day forpersons aged 16 years and over. One serve is equivalent to 1/2 cup of cooked vegetables or one cup of salad vegetables. The question used to definethe indicator was: How many serves of vegetables do you usually eat each day?
Source: New South Wales Population Health Survey 2006 (HOIST). Centre for Epidemiology and Research, NSW Department of Health.
122
WARNIN
G: Esti
mates o
ut of
date.
Please
chec
k Hea
lthStat
s NSW
for la
test e
stimate
s.
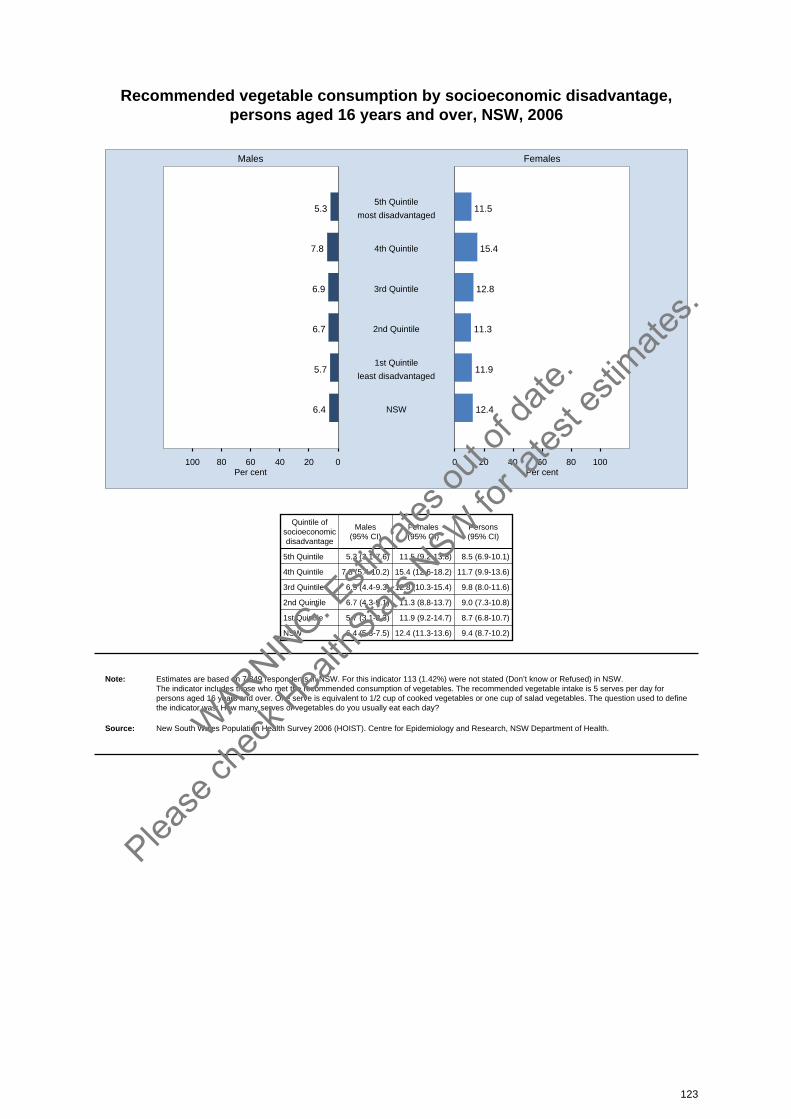
Recommended vegetable consumption by socioeconomic disadvantage, persons aged 16 years and over, NSW, 2006
020406080100 0 20 40 60 80 100
Males Females
Per cent Per cent
5.3 11.55th Quintile
most disadvantaged
7.8 15.44th Quintile
6.9 12.83rd Quintile
6.7 11.32nd Quintile
5.7 11.91st Quintile
least disadvantaged
6.4 12.4NSW
Quintile ofsocioeconomicdisadvantage
Males(95% CI)
Females(95% CI)
Persons(95% CI)
5th Quintile 5.3 (3.1-7.6) 11.5 (9.2-13.8) 8.5 (6.9-10.1)
4th Quintile 7.8 (5.4-10.2) 15.4 (12.6-18.2) 11.7 (9.9-13.6)
3rd Quintile 6.9 (4.4-9.3) 12.8 (10.3-15.4) 9.8 (8.0-11.6)
2nd Quintile 6.7 (4.3-9.1) 11.3 (8.8-13.7) 9.0 (7.3-10.8)
1st Quintile 5.7 (3.1-8.3) 11.9 (9.2-14.7) 8.7 (6.8-10.7)
NSW 6.4 (5.3-7.5) 12.4 (11.3-13.6) 9.4 (8.7-10.2)
Note: Estimates are based on 7,849 respondents in NSW. For this indicator 113 (1.42%) were not stated (Don’t know or Refused) in NSW. The indicator includes those who met the recommended consumption of vegetables. The recommended vegetable intake is 5 serves per day forpersons aged 16 years and over. One serve is equivalent to 1/2 cup of cooked vegetables or one cup of salad vegetables. The question used to definethe indicator was: How many serves of vegetables do you usually eat each day?
Source: New South Wales Population Health Survey 2006 (HOIST). Centre for Epidemiology and Research, NSW Department of Health.
123
WARNIN
G: Esti
mates o
ut of
date.
Please
chec
k Hea
lthStat
s NSW
for la
test e
stimate
s.

Recommended vegetable consumption by health area, persons aged 16 years and over, NSW, 2006
0 20 40 60 80 100 0 20 40 60 80 100
Males Females
Per cent Per cent
Sydney South West
South Eastern Sydney& Illawarra
Sydney West
Northern Sydney &Central Coast
Hunter & New England
North Coast
Greater Southern
Greater Western
Urban
Rural
NSW
AreaMales
(95% CI)Females(95% CI)
Persons(95% CI)
Sydney South West 6.7 (3.7-9.7) 8.1 (5.6-10.6) 7.4 (5.5-9.4)
South Eastern Sydney & Illawarra 7.7 (4.6-10.7) 14.2 (10.9-17.6) 10.9 (8.6-13.2)
Sydney West 5.0 (2.4-7.7) 7.6 (5.3-9.9) 6.3 (4.6-8.1)
Northern Sydney & Central Coast 5.2 (2.7-7.7) 11.6 (8.6-14.6) 8.5 (6.5-10.4)
Hunter & New England 7.1 (4.5-9.7) 17.6 (14.0-21.1) 12.5 (10.2-14.7)
North Coast 7.6 (4.7-10.5) 16.6 (13.4-19.8) 12.2 (10.0-14.4)
Greater Southern 5.9 (3.4-8.3) 16.5 (13.0-20.0) 11.2 (9.0-13.3)
Greater Western 6.7 (4.0-9.4) 17.5 (14.0-21.1) 12.1 (9.8-14.3)
Urban 6.2 (4.8-7.6) 10.4 (9.0-11.8) 8.3 (7.3-9.3)
Rural 6.9 (5.5-8.3) 17.1 (15.2-19.0) 12.0 (10.9-13.2)
NSW 6.4 (5.3-7.5) 12.4 (11.3-13.6) 9.4 (8.7-10.2)
Note: Estimates are based on 7,849 respondents in NSW. For this indicator 113 (1.42%) were not stated (Don’t know or Refused) in NSW. The indicator includes those who met the recommended consumption of vegetables. The recommended vegetable intake is 5 serves per day forpersons aged 16 years and over. One serve is equivalent to 1/2 cup of cooked vegetables or one cup of salad vegetables. The question used to definethe indicator was: How many serves of vegetables do you usually eat each day?
Source: New South Wales Population Health Survey 2006 (HOIST). Centre for Epidemiology and Research, NSW Department of Health.
124
WARNIN
G: Esti
mates o
ut of
date.
Please
chec
k Hea
lthStat
s NSW
for la
test e
stimate
s.
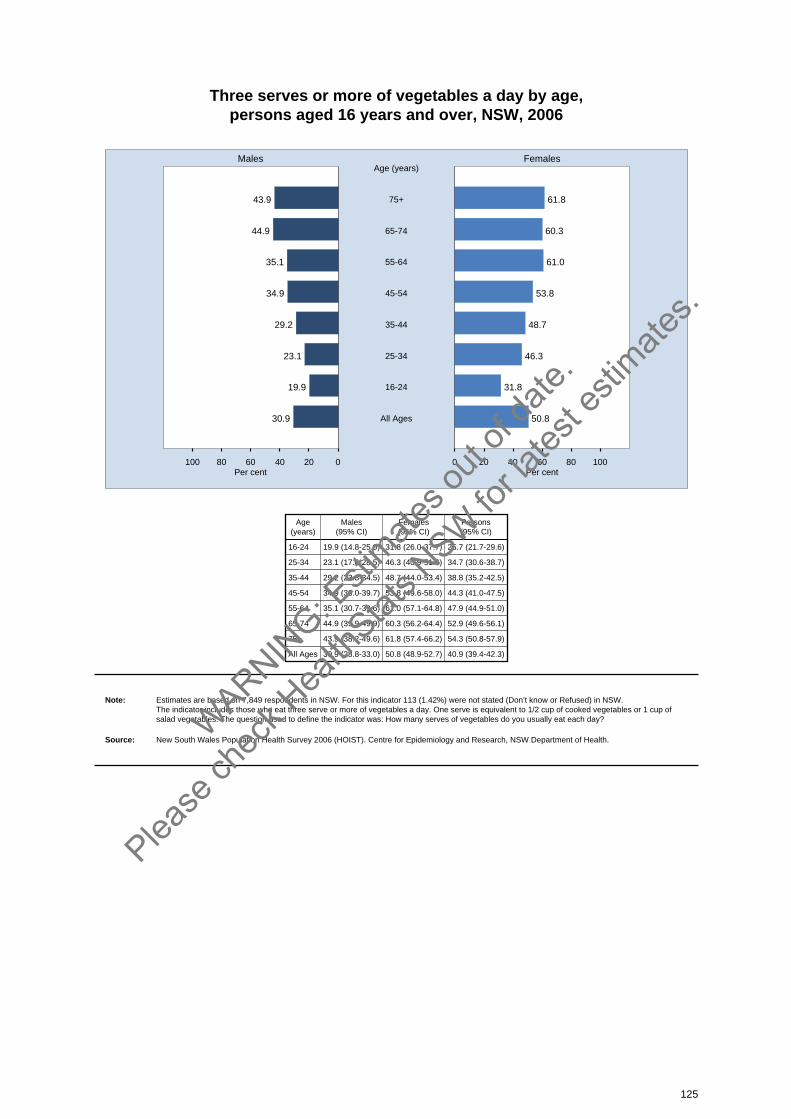
Three serves or more of vegetables a day by age, persons aged 16 years and over, NSW, 2006
020406080100 0 20 40 60 80 100
Males Females
Per cent Per cent
43.9 61.875+
Age (years)
44.9 60.365-74
35.1 61.055-64
34.9 53.845-54
29.2 48.735-44
23.1 46.325-34
19.9 31.816-24
30.9 50.8All Ages
Age(years)
Males(95% CI)
Females(95% CI)
Persons(95% CI)
16-24 19.9 (14.8-25.0) 31.8 (26.0-37.7) 25.7 (21.7-29.6)
25-34 23.1 (17.6-28.5) 46.3 (40.9-51.6) 34.7 (30.6-38.7)
35-44 29.2 (23.8-34.5) 48.7 (44.0-53.4) 38.8 (35.2-42.5)
45-54 34.9 (30.0-39.7) 53.8 (49.6-58.0) 44.3 (41.0-47.5)
55-64 35.1 (30.7-39.6) 61.0 (57.1-64.8) 47.9 (44.9-51.0)
65-74 44.9 (39.9-49.9) 60.3 (56.2-64.4) 52.9 (49.6-56.1)
75+ 43.9 (38.2-49.6) 61.8 (57.4-66.2) 54.3 (50.8-57.9)
All Ages 30.9 (28.8-33.0) 50.8 (48.9-52.7) 40.9 (39.4-42.3)
Note: Estimates are based on 7,849 respondents in NSW. For this indicator 113 (1.42%) were not stated (Don’t know or Refused) in NSW. The indicator includes those who eat three serve or more of vegetables a day. One serve is equivalent to 1/2 cup of cooked vegetables or 1 cup ofsalad vegetables. The question used to define the indicator was: How many serves of vegetables do you usually eat each day?
Source: New South Wales Population Health Survey 2006 (HOIST). Centre for Epidemiology and Research, NSW Department of Health.
125
WARNIN
G: Esti
mates o
ut of
date.
Please
chec
k Hea
lthStat
s NSW
for la
test e
stimate
s.
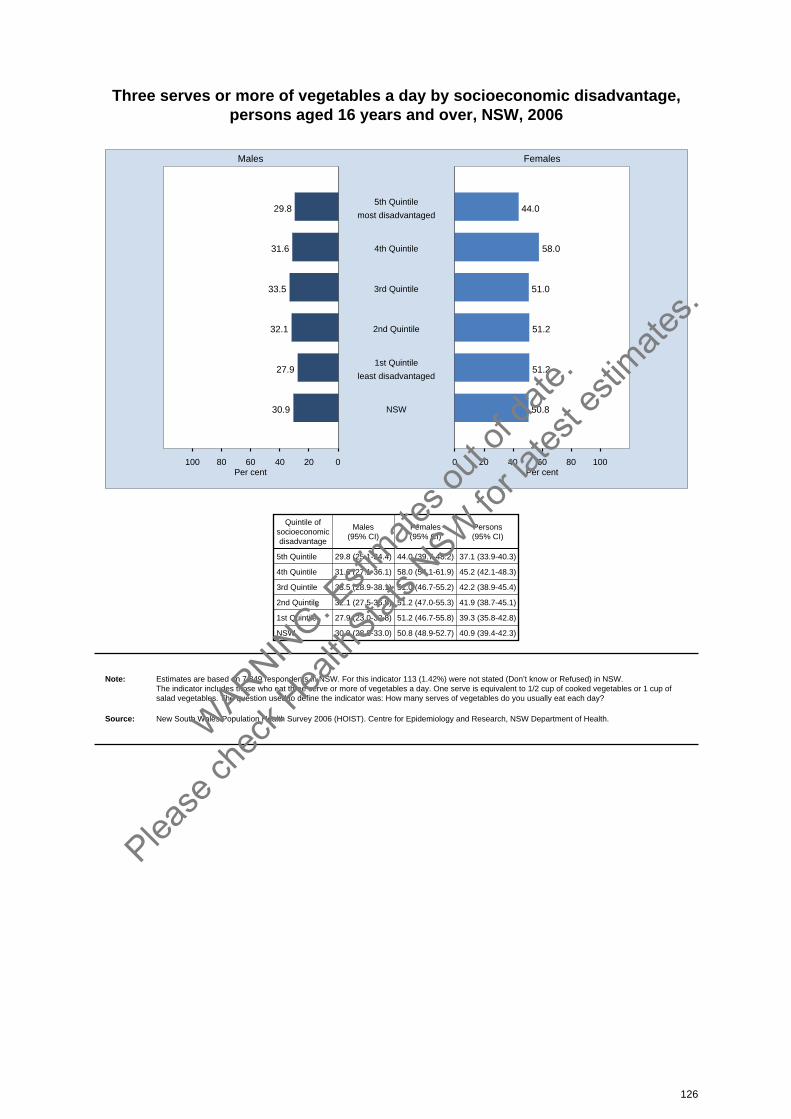
Three serves or more of vegetables a day by socioeconomic disadvantage, persons aged 16 years and over, NSW, 2006
020406080100 0 20 40 60 80 100
Males Females
Per cent Per cent
29.8 44.05th Quintile
most disadvantaged
31.6 58.04th Quintile
33.5 51.03rd Quintile
32.1 51.22nd Quintile
27.9 51.21st Quintile
least disadvantaged
30.9 50.8NSW
Quintile ofsocioeconomicdisadvantage
Males(95% CI)
Females(95% CI)
Persons(95% CI)
5th Quintile 29.8 (25.1-34.4) 44.0 (39.7-48.2) 37.1 (33.9-40.3)
4th Quintile 31.6 (27.1-36.1) 58.0 (54.1-61.9) 45.2 (42.1-48.3)
3rd Quintile 33.5 (28.9-38.1) 51.0 (46.7-55.2) 42.2 (38.9-45.4)
2nd Quintile 32.1 (27.5-36.8) 51.2 (47.0-55.3) 41.9 (38.7-45.1)
1st Quintile 27.9 (23.0-32.8) 51.2 (46.7-55.8) 39.3 (35.8-42.8)
NSW 30.9 (28.8-33.0) 50.8 (48.9-52.7) 40.9 (39.4-42.3)
Note: Estimates are based on 7,849 respondents in NSW. For this indicator 113 (1.42%) were not stated (Don’t know or Refused) in NSW. The indicator includes those who eat three serve or more of vegetables a day. One serve is equivalent to 1/2 cup of cooked vegetables or 1 cup ofsalad vegetables. The question used to define the indicator was: How many serves of vegetables do you usually eat each day?
Source: New South Wales Population Health Survey 2006 (HOIST). Centre for Epidemiology and Research, NSW Department of Health.
126
WARNIN
G: Esti
mates o
ut of
date.
Please
chec
k Hea
lthStat
s NSW
for la
test e
stimate
s.
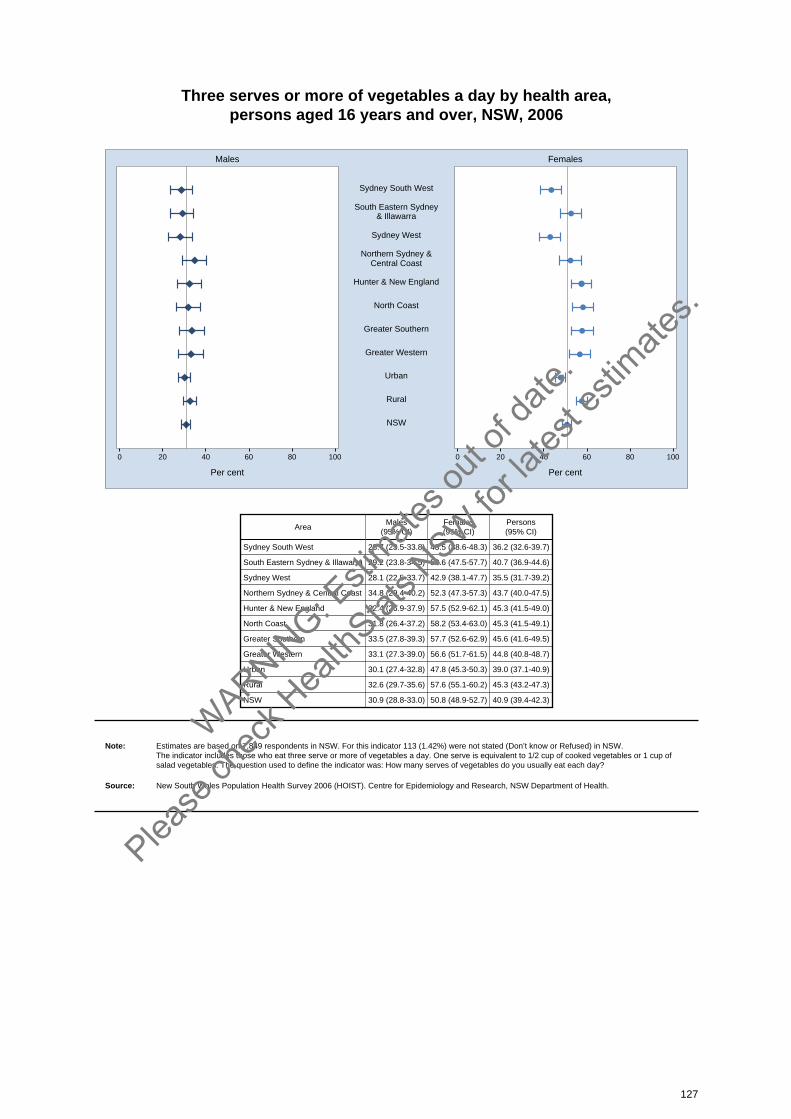
Three serves or more of vegetables a day by health area, persons aged 16 years and over, NSW, 2006
0 20 40 60 80 100 0 20 40 60 80 100
Males Females
Per cent Per cent
Sydney South West
South Eastern Sydney& Illawarra
Sydney West
Northern Sydney &Central Coast
Hunter & New England
North Coast
Greater Southern
Greater Western
Urban
Rural
NSW
AreaMales
(95% CI)Females(95% CI)
Persons(95% CI)
Sydney South West 28.7 (23.5-33.8) 43.5 (38.6-48.3) 36.2 (32.6-39.7)
South Eastern Sydney & Illawarra 29.2 (23.8-34.5) 52.6 (47.5-57.7) 40.7 (36.9-44.6)
Sydney West 28.1 (22.5-33.7) 42.9 (38.1-47.7) 35.5 (31.7-39.2)
Northern Sydney & Central Coast 34.8 (29.4-40.2) 52.3 (47.3-57.3) 43.7 (40.0-47.5)
Hunter & New England 32.4 (26.9-37.9) 57.5 (52.9-62.1) 45.3 (41.5-49.0)
North Coast 31.8 (26.4-37.2) 58.2 (53.4-63.0) 45.3 (41.5-49.1)
Greater Southern 33.5 (27.8-39.3) 57.7 (52.6-62.9) 45.6 (41.6-49.5)
Greater Western 33.1 (27.3-39.0) 56.6 (51.7-61.5) 44.8 (40.8-48.7)
Urban 30.1 (27.4-32.8) 47.8 (45.3-50.3) 39.0 (37.1-40.9)
Rural 32.6 (29.7-35.6) 57.6 (55.1-60.2) 45.3 (43.2-47.3)
NSW 30.9 (28.8-33.0) 50.8 (48.9-52.7) 40.9 (39.4-42.3)
Note: Estimates are based on 7,849 respondents in NSW. For this indicator 113 (1.42%) were not stated (Don’t know or Refused) in NSW. The indicator includes those who eat three serve or more of vegetables a day. One serve is equivalent to 1/2 cup of cooked vegetables or 1 cup ofsalad vegetables. The question used to define the indicator was: How many serves of vegetables do you usually eat each day?
Source: New South Wales Population Health Survey 2006 (HOIST). Centre for Epidemiology and Research, NSW Department of Health.
127
WARNIN
G: Esti
mates o
ut of
date.
Please
chec
k Hea
lthStat
s NSW
for la
test e
stimate
s.
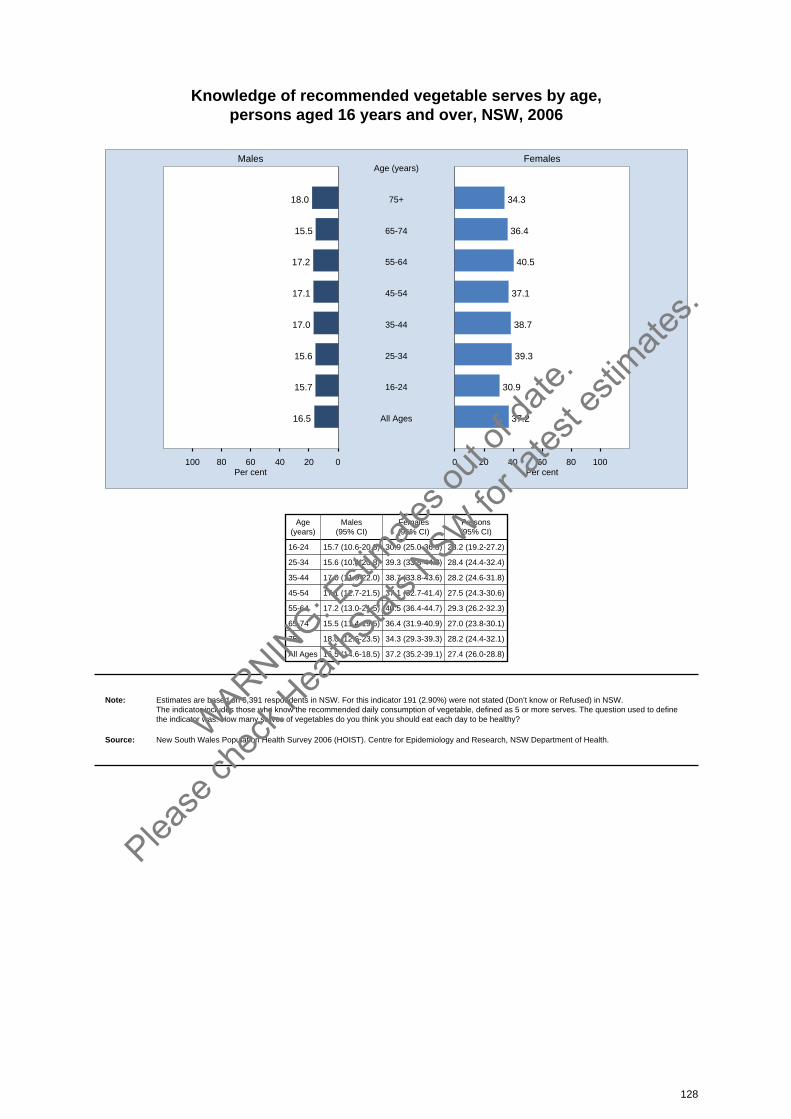
Knowledge of recommended vegetable serves by age, persons aged 16 years and over, NSW, 2006
020406080100 0 20 40 60 80 100
Males Females
Per cent Per cent
18.0 34.375+
Age (years)
15.5 36.465-74
17.2 40.555-64
17.1 37.145-54
17.0 38.735-44
15.6 39.325-34
15.7 30.916-24
16.5 37.2All Ages
Age(years)
Males(95% CI)
Females(95% CI)
Persons(95% CI)
16-24 15.7 (10.6-20.8) 30.9 (25.0-36.8) 23.2 (19.2-27.2)
25-34 15.6 (10.4-20.8) 39.3 (33.8-44.8) 28.4 (24.4-32.4)
35-44 17.0 (11.9-22.0) 38.7 (33.8-43.6) 28.2 (24.6-31.8)
45-54 17.1 (12.7-21.5) 37.1 (32.7-41.4) 27.5 (24.3-30.6)
55-64 17.2 (13.0-21.5) 40.5 (36.4-44.7) 29.3 (26.2-32.3)
65-74 15.5 (11.4-19.5) 36.4 (31.9-40.9) 27.0 (23.8-30.1)
75+ 18.0 (12.6-23.5) 34.3 (29.3-39.3) 28.2 (24.4-32.1)
All Ages 16.5 (14.6-18.5) 37.2 (35.2-39.1) 27.4 (26.0-28.8)
Note: Estimates are based on 6,391 respondents in NSW. For this indicator 191 (2.90%) were not stated (Don’t know or Refused) in NSW. The indicator includes those who know the recommended daily consumption of vegetable, defined as 5 or more serves. The question used to definethe indicator was: How many serves of vegetables do you think you should eat each day to be healthy?
Source: New South Wales Population Health Survey 2006 (HOIST). Centre for Epidemiology and Research, NSW Department of Health.
128
WARNIN
G: Esti
mates o
ut of
date.
Please
chec
k Hea
lthStat
s NSW
for la
test e
stimate
s.
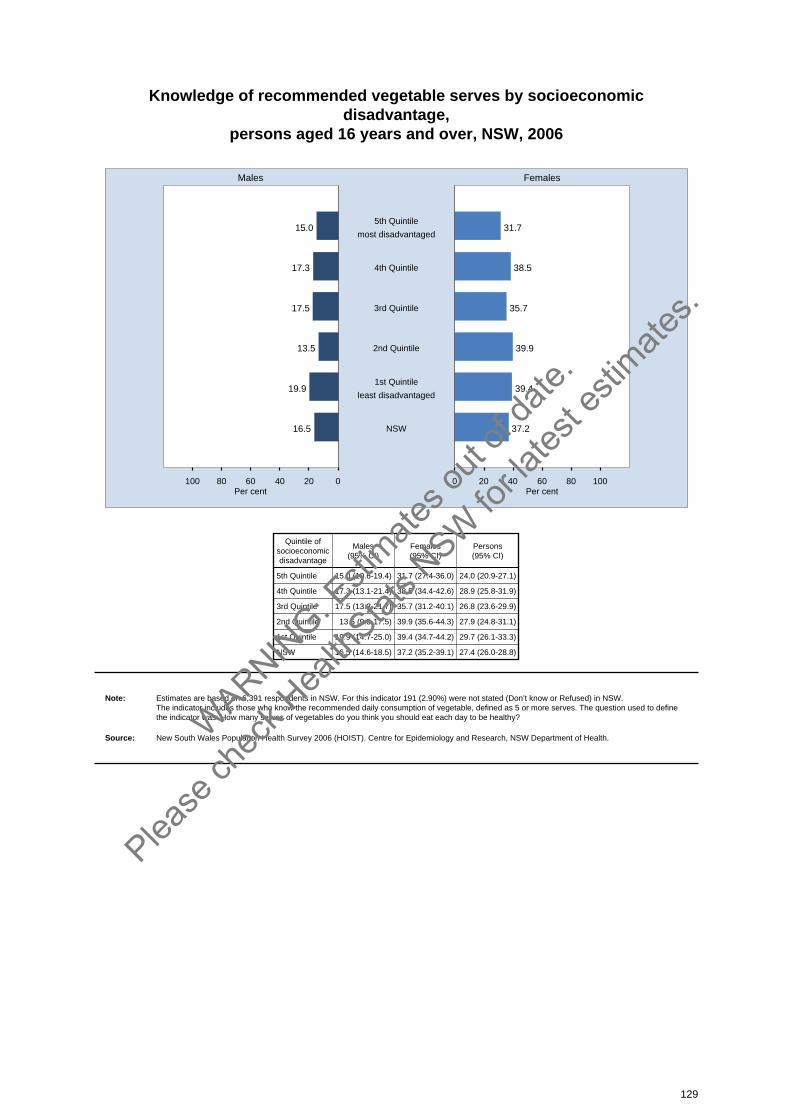
Knowledge of recommended vegetable serves by socioeconomicdisadvantage,
persons aged 16 years and over, NSW, 2006
020406080100 0 20 40 60 80 100
Males Females
Per cent Per cent
15.0 31.75th Quintile
most disadvantaged
17.3 38.54th Quintile
17.5 35.73rd Quintile
13.5 39.92nd Quintile
19.9 39.41st Quintile
least disadvantaged
16.5 37.2NSW
Quintile ofsocioeconomicdisadvantage
Males(95% CI)
Females(95% CI)
Persons(95% CI)
5th Quintile 15.0 (10.6-19.4) 31.7 (27.4-36.0) 24.0 (20.9-27.1)
4th Quintile 17.3 (13.1-21.4) 38.5 (34.4-42.6) 28.9 (25.8-31.9)
3rd Quintile 17.5 (13.3-21.7) 35.7 (31.2-40.1) 26.8 (23.6-29.9)
2nd Quintile 13.5 (9.5-17.5) 39.9 (35.6-44.3) 27.9 (24.8-31.1)
1st Quintile 19.9 (14.7-25.0) 39.4 (34.7-44.2) 29.7 (26.1-33.3)
NSW 16.5 (14.6-18.5) 37.2 (35.2-39.1) 27.4 (26.0-28.8)
Note: Estimates are based on 6,391 respondents in NSW. For this indicator 191 (2.90%) were not stated (Don’t know or Refused) in NSW. The indicator includes those who know the recommended daily consumption of vegetable, defined as 5 or more serves. The question used to definethe indicator was: How many serves of vegetables do you think you should eat each day to be healthy?
Source: New South Wales Population Health Survey 2006 (HOIST). Centre for Epidemiology and Research, NSW Department of Health.
129
WARNIN
G: Esti
mates o
ut of
date.
Please
chec
k Hea
lthStat
s NSW
for la
test e
stimate
s.
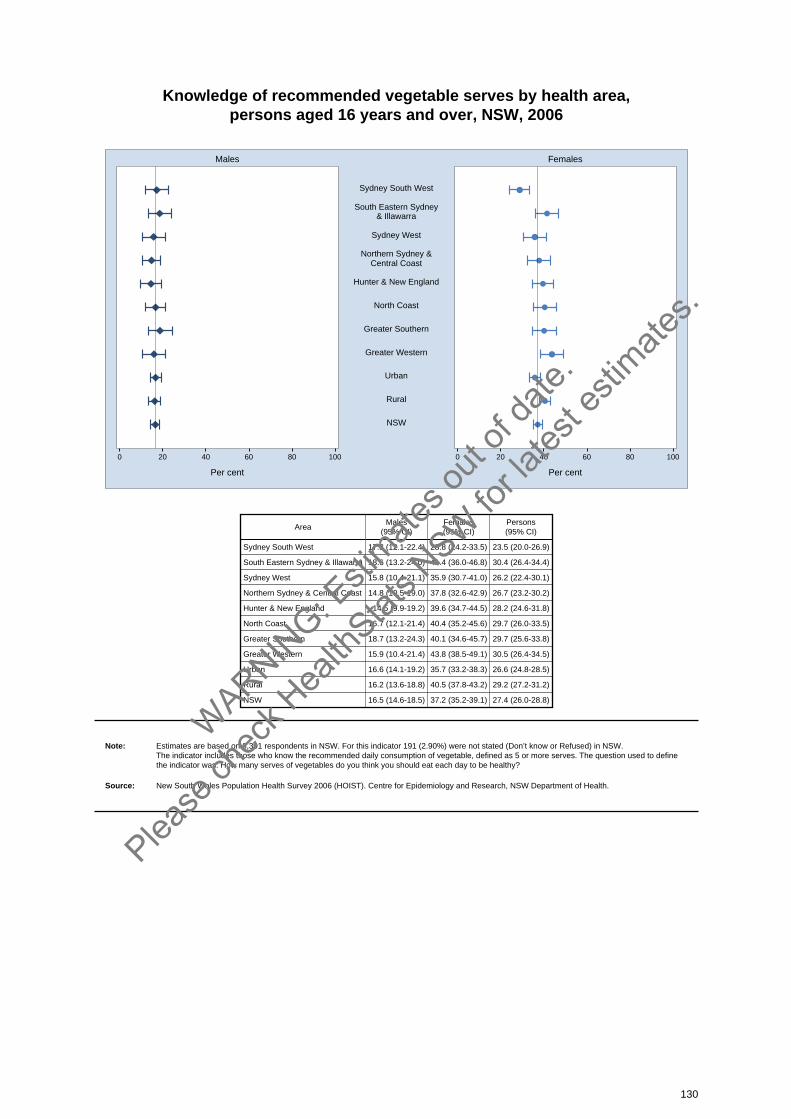
Knowledge of recommended vegetable serves by health area, persons aged 16 years and over, NSW, 2006
0 20 40 60 80 100 0 20 40 60 80 100
Males Females
Per cent Per cent
Sydney South West
South Eastern Sydney& Illawarra
Sydney West
Northern Sydney &Central Coast
Hunter & New England
North Coast
Greater Southern
Greater Western
Urban
Rural
NSW
AreaMales
(95% CI)Females(95% CI)
Persons(95% CI)
Sydney South West 17.3 (12.1-22.4) 28.8 (24.2-33.5) 23.5 (20.0-26.9)
South Eastern Sydney & Illawarra 18.6 (13.2-24.0) 41.4 (36.0-46.8) 30.4 (26.4-34.4)
Sydney West 15.8 (10.4-21.1) 35.9 (30.7-41.0) 26.2 (22.4-30.1)
Northern Sydney & Central Coast 14.8 (10.5-19.0) 37.8 (32.6-42.9) 26.7 (23.2-30.2)
Hunter & New England 14.5 (9.9-19.2) 39.6 (34.7-44.5) 28.2 (24.6-31.8)
North Coast 16.7 (12.1-21.4) 40.4 (35.2-45.6) 29.7 (26.0-33.5)
Greater Southern 18.7 (13.2-24.3) 40.1 (34.6-45.7) 29.7 (25.6-33.8)
Greater Western 15.9 (10.4-21.4) 43.8 (38.5-49.1) 30.5 (26.4-34.5)
Urban 16.6 (14.1-19.2) 35.7 (33.2-38.3) 26.6 (24.8-28.5)
Rural 16.2 (13.6-18.8) 40.5 (37.8-43.2) 29.2 (27.2-31.2)
NSW 16.5 (14.6-18.5) 37.2 (35.2-39.1) 27.4 (26.0-28.8)
Note: Estimates are based on 6,391 respondents in NSW. For this indicator 191 (2.90%) were not stated (Don’t know or Refused) in NSW. The indicator includes those who know the recommended daily consumption of vegetable, defined as 5 or more serves. The question used to definethe indicator was: How many serves of vegetables do you think you should eat each day to be healthy?
Source: New South Wales Population Health Survey 2006 (HOIST). Centre for Epidemiology and Research, NSW Department of Health.
130
WARNIN
G: Esti
mates o
ut of
date.
Please
chec
k Hea
lthStat
s NSW
for la
test e
stimate
s.
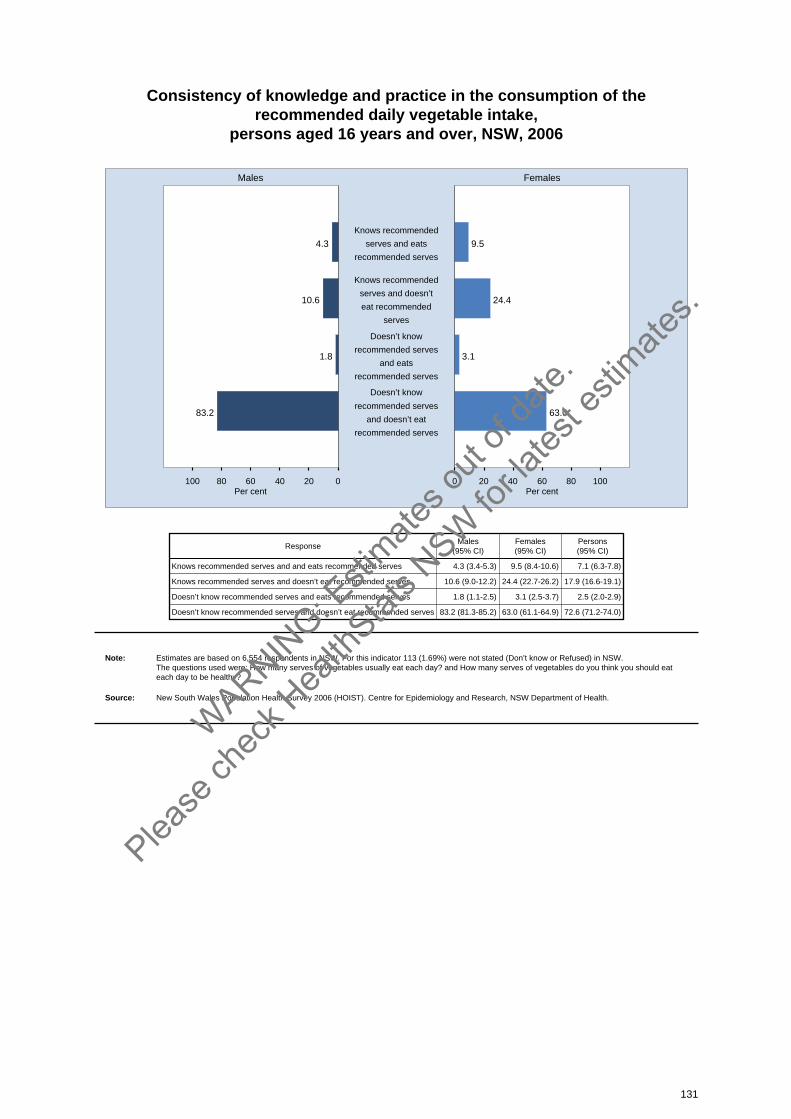
Consistency of knowledge and practice in the consumption of therecommended daily vegetable intake,
persons aged 16 years and over, NSW, 2006
020406080100 0 20 40 60 80 100
Males Females
Per cent Per cent
4.3 9.5
Knows recommended
serves and eats
recommended serves
10.6 24.4
Knows recommended
serves and doesn’t
eat recommended
serves
1.8 3.1
Doesn’t know
recommended serves
and eats
recommended serves
83.2 63.0
Doesn’t know
recommended serves
and doesn’t eat
recommended serves
ResponseMales
(95% CI)Females(95% CI)
Persons(95% CI)
Knows recommended serves and and eats recommended serves 4.3 (3.4-5.3) 9.5 (8.4-10.6) 7.1 (6.3-7.8)
Knows recommended serves and doesn’t eat recommended serves 10.6 (9.0-12.2) 24.4 (22.7-26.2) 17.9 (16.6-19.1)
Doesn’t know recommended serves and eats recommended serves 1.8 (1.1-2.5) 3.1 (2.5-3.7) 2.5 (2.0-2.9)
Doesn’t know recommended serves and doesn’t eat recommended serves 83.2 (81.3-85.2) 63.0 (61.1-64.9) 72.6 (71.2-74.0)
Note: Estimates are based on 6,554 respondents in NSW. For this indicator 113 (1.69%) were not stated (Don’t know or Refused) in NSW. The questions used were: How many serves of vegetables usually eat each day? and How many serves of vegetables do you think you should eateach day to be healthy?
Source: New South Wales Population Health Survey 2006 (HOIST). Centre for Epidemiology and Research, NSW Department of Health.
131
WARNIN
G: Esti
mates o
ut of
date.
Please
chec
k Hea
lthStat
s NSW
for la
test e
stimate
s.

Type of milk usually consumed, persons aged 16 years and over, NSW, 2006
020406080100 0 20 40 60 80 100
Males Females
Per cent Per cent
53.5 42.5Regular milk
(whole or full cream)
30.3 33.8Low /reduced
fat milk
10.4 20.1Skim milk
0.3 0.3Evaporated or
sweetened milk
0.4 0.3Other
5.1 3.1Don’t have milk
ResponseMales
(95% CI)Females(95% CI)
Persons(95% CI)
Regular milk (whole or full cream) 53.5 (51.1-55.8) 42.5 (40.6-44.3) 47.9 (46.4-49.4)
Low /reduced fat milk 30.3 (28.3-32.4) 33.8 (32.1-35.6) 32.1 (30.7-33.5)
Skim milk 10.4 (9.0-11.7) 20.1 (18.6-21.5) 15.2 (14.2-16.3)
Evaporated or sweetened milk 0.3 (0.1-0.4) 0.3 (0.1-0.5) 0.3 (0.1-0.4)
Other 0.4 (0.1-0.7) 0.3 (0.1-0.5) 0.3 (0.2-0.5)
Don’t have milk 5.1 (3.9-6.3) 3.1 (2.5-3.8) 4.1 (3.5-4.8)
Note: Estimates are based on 7,940 respondents in NSW. For this indicator 18 (0.23%) were not stated (Don’t know or Refused) in NSW. The question used was: What type of milk do you usually have?
Source: New South Wales Population Health Survey 2006 (HOIST). Centre for Epidemiology and Research, NSW Department of Health.
132
WARNIN
G: Esti
mates o
ut of
date.
Please
chec
k Hea
lthStat
s NSW
for la
test e
stimate
s.
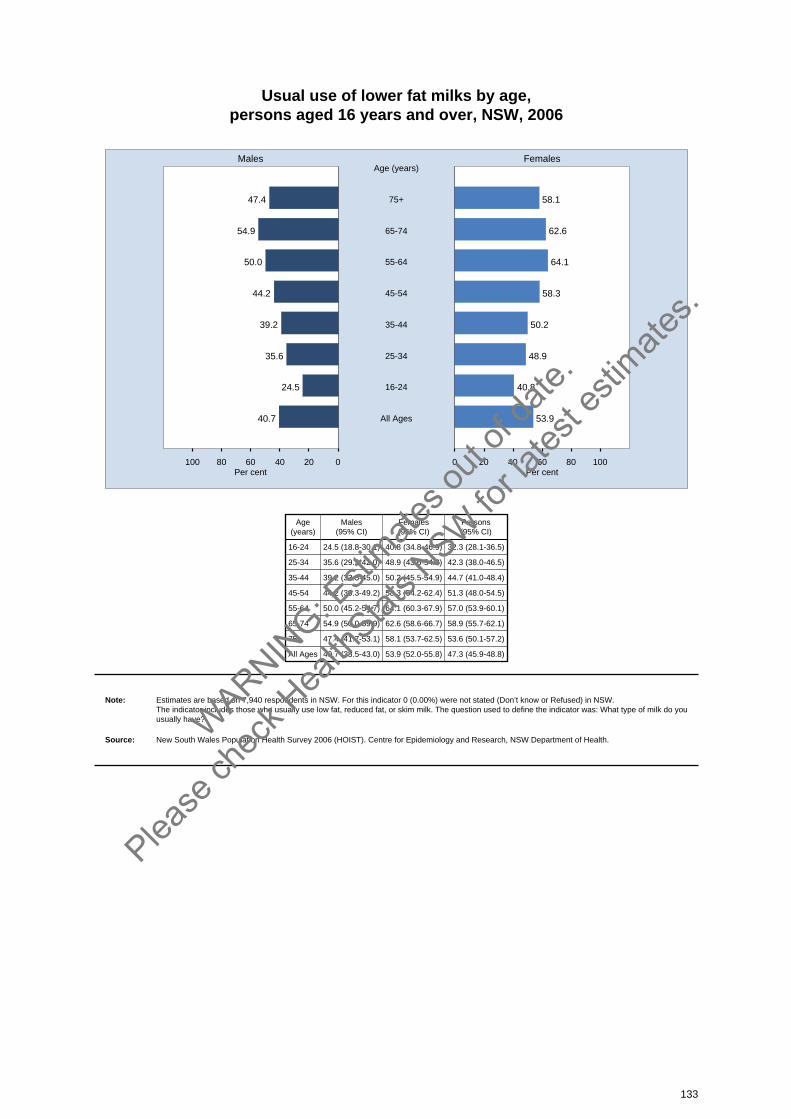
Usual use of lower fat milks by age, persons aged 16 years and over, NSW, 2006
020406080100 0 20 40 60 80 100
Males Females
Per cent Per cent
47.4 58.175+
Age (years)
54.9 62.665-74
50.0 64.155-64
44.2 58.345-54
39.2 50.235-44
35.6 48.925-34
24.5 40.816-24
40.7 53.9All Ages
Age(years)
Males(95% CI)
Females(95% CI)
Persons(95% CI)
16-24 24.5 (18.8-30.1) 40.8 (34.8-46.9) 32.3 (28.1-36.5)
25-34 35.6 (29.2-42.0) 48.9 (43.6-54.3) 42.3 (38.0-46.5)
35-44 39.2 (33.5-45.0) 50.2 (45.5-54.9) 44.7 (41.0-48.4)
45-54 44.2 (39.3-49.2) 58.3 (54.2-62.4) 51.3 (48.0-54.5)
55-64 50.0 (45.2-54.7) 64.1 (60.3-67.9) 57.0 (53.9-60.1)
65-74 54.9 (50.0-59.9) 62.6 (58.6-66.7) 58.9 (55.7-62.1)
75+ 47.4 (41.7-53.1) 58.1 (53.7-62.5) 53.6 (50.1-57.2)
All Ages 40.7 (38.5-43.0) 53.9 (52.0-55.8) 47.3 (45.9-48.8)
Note: Estimates are based on 7,940 respondents in NSW. For this indicator 0 (0.00%) were not stated (Don’t know or Refused) in NSW. The indicator includes those who usually use low fat, reduced fat, or skim milk. The question used to define the indicator was: What type of milk do youusually have?
Source: New South Wales Population Health Survey 2006 (HOIST). Centre for Epidemiology and Research, NSW Department of Health.
133
WARNIN
G: Esti
mates o
ut of
date.
Please
chec
k Hea
lthStat
s NSW
for la
test e
stimate
s.
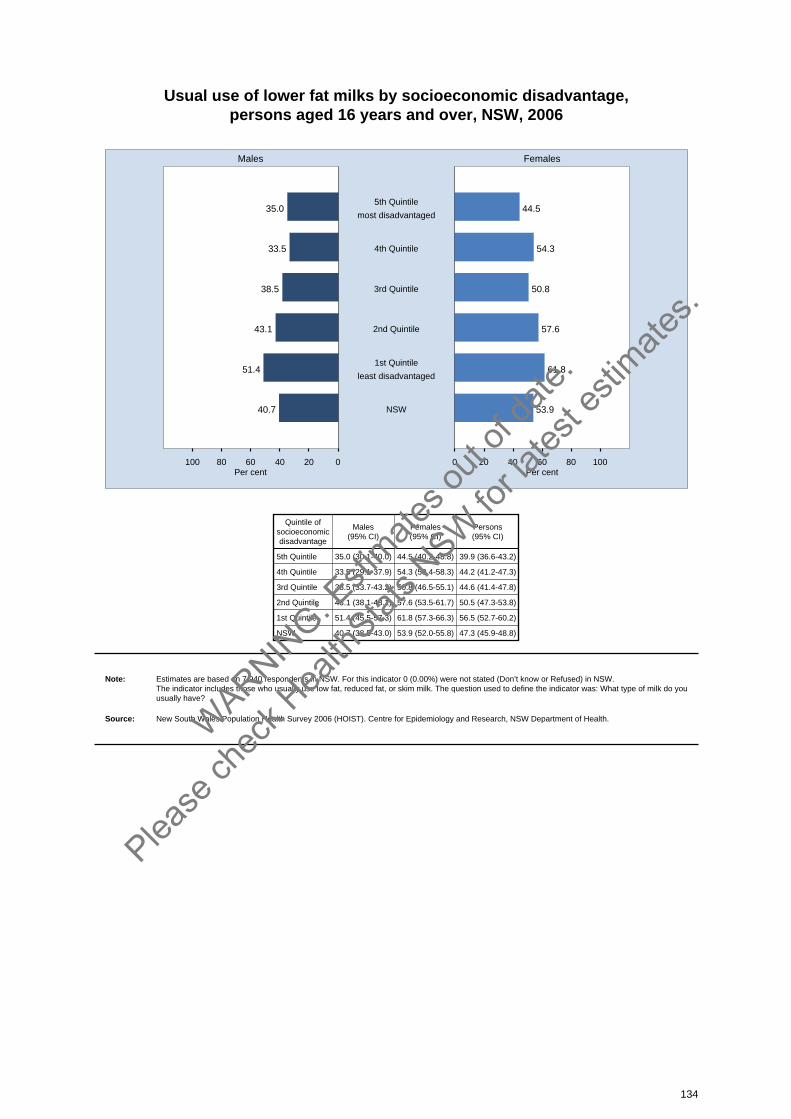
Usual use of lower fat milks by socioeconomic disadvantage, persons aged 16 years and over, NSW, 2006
020406080100 0 20 40 60 80 100
Males Females
Per cent Per cent
35.0 44.55th Quintile
most disadvantaged
33.5 54.34th Quintile
38.5 50.83rd Quintile
43.1 57.62nd Quintile
51.4 61.81st Quintile
least disadvantaged
40.7 53.9NSW
Quintile ofsocioeconomicdisadvantage
Males(95% CI)
Females(95% CI)
Persons(95% CI)
5th Quintile 35.0 (30.1-40.0) 44.5 (40.2-48.8) 39.9 (36.6-43.2)
4th Quintile 33.5 (29.1-37.9) 54.3 (50.4-58.3) 44.2 (41.2-47.3)
3rd Quintile 38.5 (33.7-43.2) 50.8 (46.5-55.1) 44.6 (41.4-47.8)
2nd Quintile 43.1 (38.1-48.1) 57.6 (53.5-61.7) 50.5 (47.3-53.8)
1st Quintile 51.4 (45.5-57.3) 61.8 (57.3-66.3) 56.5 (52.7-60.2)
NSW 40.7 (38.5-43.0) 53.9 (52.0-55.8) 47.3 (45.9-48.8)
Note: Estimates are based on 7,940 respondents in NSW. For this indicator 0 (0.00%) were not stated (Don’t know or Refused) in NSW. The indicator includes those who usually use low fat, reduced fat, or skim milk. The question used to define the indicator was: What type of milk do youusually have?
Source: New South Wales Population Health Survey 2006 (HOIST). Centre for Epidemiology and Research, NSW Department of Health.
134
WARNIN
G: Esti
mates o
ut of
date.
Please
chec
k Hea
lthStat
s NSW
for la
test e
stimate
s.

Usual use of lower fat milks by health area, persons aged 16 years and over, NSW, 2006
0 20 40 60 80 100 0 20 40 60 80 100
Males Females
Per cent Per cent
Sydney South West
South Eastern Sydney& Illawarra
Sydney West
Northern Sydney &Central Coast
Hunter & New England
North Coast
Greater Southern
Greater Western
Urban
Rural
NSW
AreaMales
(95% CI)Females(95% CI)
Persons(95% CI)
Sydney South West 41.6 (36.1-47.2) 49.1 (44.2-54.0) 45.4 (41.7-49.1)
South Eastern Sydney & Illawarra 40.7 (34.6-46.9) 56.3 (51.2-61.3) 48.5 (44.4-52.5)
Sydney West 39.1 (33.1-45.2) 50.6 (45.7-55.4) 44.8 (40.9-48.8)
Northern Sydney & Central Coast 48.7 (42.9-54.5) 61.6 (56.7-66.5) 55.3 (51.5-59.1)
Hunter & New England 36.4 (30.8-42.0) 55.9 (51.2-60.5) 46.3 (42.6-50.1)
North Coast 36.8 (31.2-42.4) 51.3 (46.4-56.1) 44.2 (40.4-47.9)
Greater Southern 36.6 (30.9-42.3) 53.2 (48.1-58.3) 44.9 (41.0-48.8)
Greater Western 37.1 (31.1-43.1) 47.4 (42.5-52.2) 42.2 (38.3-46.1)
Urban 42.5 (39.5-45.4) 54.3 (51.8-56.7) 48.4 (46.5-50.3)
Rural 36.7 (33.6-39.7) 53.0 (50.4-55.6) 44.9 (42.9-46.9)
NSW 40.7 (38.5-43.0) 53.9 (52.0-55.8) 47.3 (45.9-48.8)
Note: Estimates are based on 7,940 respondents in NSW. For this indicator 0 (0.00%) were not stated (Don’t know or Refused) in NSW. The indicator includes those who usually use low fat, reduced fat, or skim milk. The question used to define the indicator was: What type of milk do youusually have?
Source: New South Wales Population Health Survey 2006 (HOIST). Centre for Epidemiology and Research, NSW Department of Health.
135
WARNIN
G: Esti
mates o
ut of
date.
Please
chec
k Hea
lthStat
s NSW
for la
test e
stimate
s.
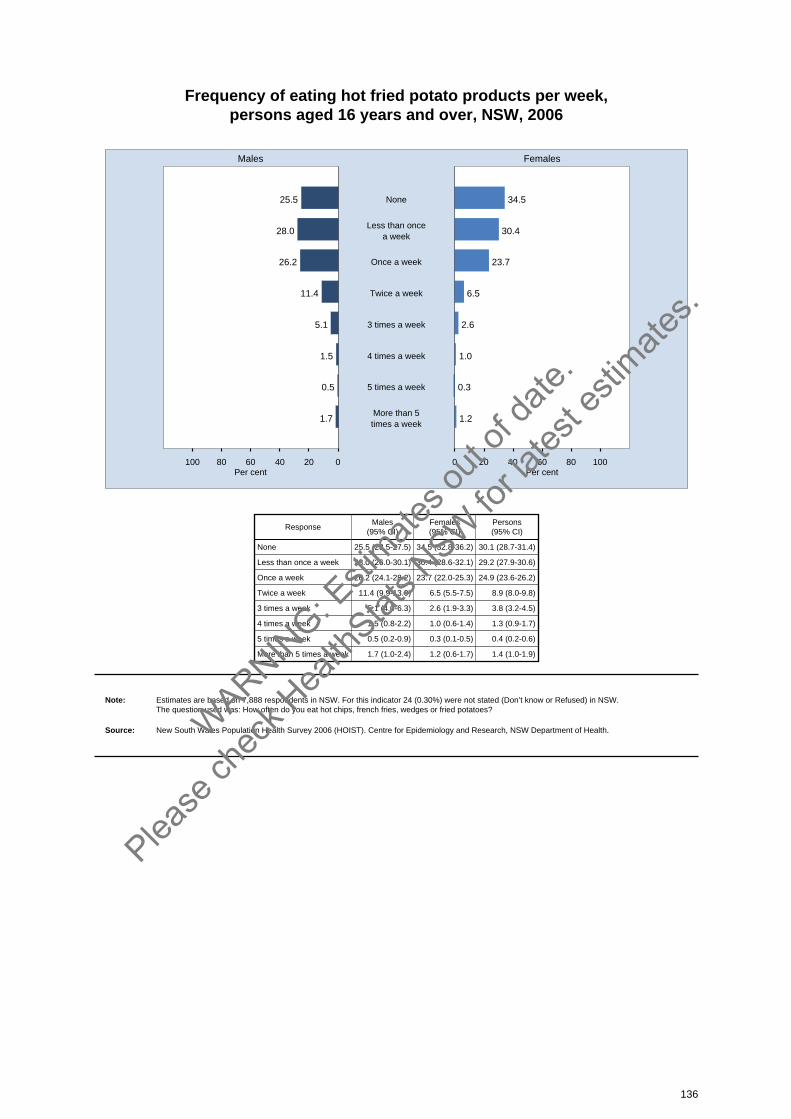
Frequency of eating hot fried potato products per week, persons aged 16 years and over, NSW, 2006
020406080100 0 20 40 60 80 100
Males Females
Per cent Per cent
25.5 34.5None
28.0 30.4Less than once
a week
26.2 23.7Once a week
11.4 6.5Twice a week
5.1 2.63 times a week
1.5 1.04 times a week
0.5 0.35 times a week
1.7 1.2More than 5times a week
ResponseMales
(95% CI)Females(95% CI)
Persons(95% CI)
None 25.5 (23.5-27.5) 34.5 (32.8-36.2) 30.1 (28.7-31.4)
Less than once a week 28.0 (26.0-30.1) 30.4 (28.6-32.1) 29.2 (27.9-30.6)
Once a week 26.2 (24.1-28.2) 23.7 (22.0-25.3) 24.9 (23.6-26.2)
Twice a week 11.4 (9.9-13.0) 6.5 (5.5-7.5) 8.9 (8.0-9.8)
3 times a week 5.1 (4.0-6.3) 2.6 (1.9-3.3) 3.8 (3.2-4.5)
4 times a week 1.5 (0.8-2.2) 1.0 (0.6-1.4) 1.3 (0.9-1.7)
5 times a week 0.5 (0.2-0.9) 0.3 (0.1-0.5) 0.4 (0.2-0.6)
More than 5 times a week 1.7 (1.0-2.4) 1.2 (0.6-1.7) 1.4 (1.0-1.9)
Note: Estimates are based on 7,888 respondents in NSW. For this indicator 24 (0.30%) were not stated (Don’t know or Refused) in NSW. The question used was: How often do you eat hot chips, french fries, wedges or fried potatoes?
Source: New South Wales Population Health Survey 2006 (HOIST). Centre for Epidemiology and Research, NSW Department of Health.
136
WARNIN
G: Esti
mates o
ut of
date.
Please
chec
k Hea
lthStat
s NSW
for la
test e
stimate
s.
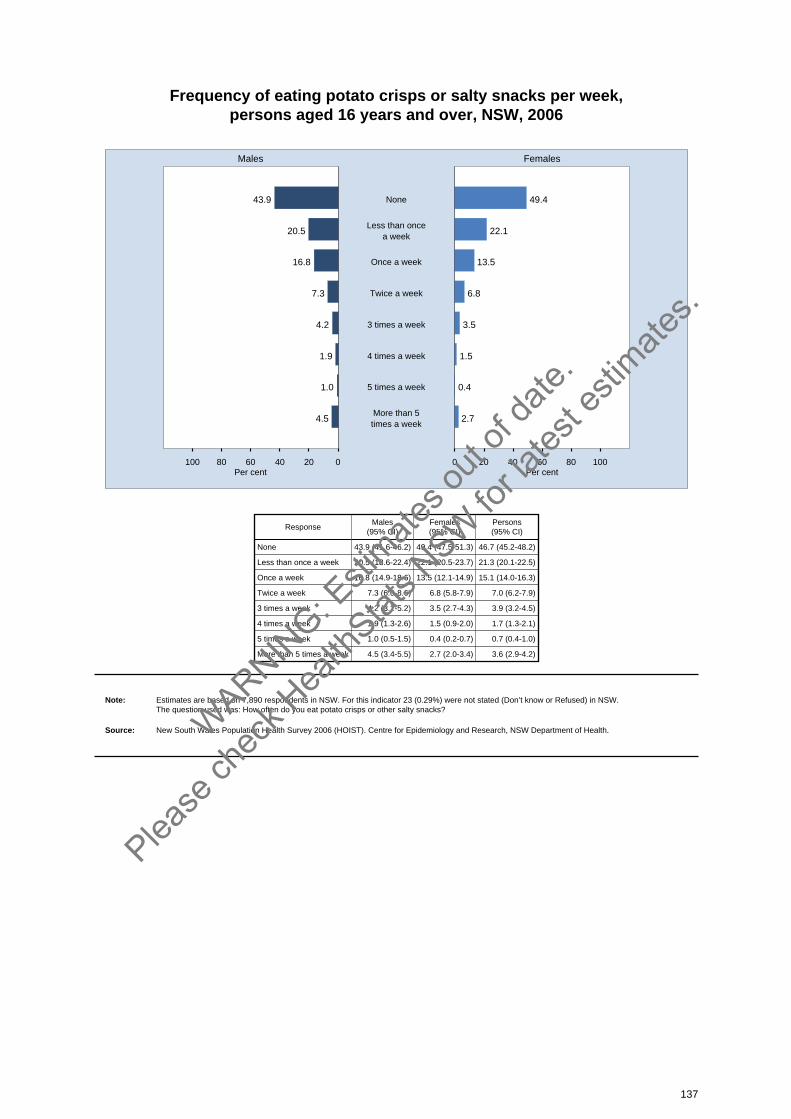
Frequency of eating potato crisps or salty snacks per week, persons aged 16 years and over, NSW, 2006
020406080100 0 20 40 60 80 100
Males Females
Per cent Per cent
43.9 49.4None
20.5 22.1Less than once
a week
16.8 13.5Once a week
7.3 6.8Twice a week
4.2 3.53 times a week
1.9 1.54 times a week
1.0 0.45 times a week
4.5 2.7More than 5times a week
ResponseMales
(95% CI)Females(95% CI)
Persons(95% CI)
None 43.9 (41.6-46.2) 49.4 (47.5-51.3) 46.7 (45.2-48.2)
Less than once a week 20.5 (18.6-22.4) 22.1 (20.5-23.7) 21.3 (20.1-22.5)
Once a week 16.8 (14.9-18.6) 13.5 (12.1-14.9) 15.1 (14.0-16.3)
Twice a week 7.3 (6.0-8.6) 6.8 (5.8-7.9) 7.0 (6.2-7.9)
3 times a week 4.2 (3.2-5.2) 3.5 (2.7-4.3) 3.9 (3.2-4.5)
4 times a week 1.9 (1.3-2.6) 1.5 (0.9-2.0) 1.7 (1.3-2.1)
5 times a week 1.0 (0.5-1.5) 0.4 (0.2-0.7) 0.7 (0.4-1.0)
More than 5 times a week 4.5 (3.4-5.5) 2.7 (2.0-3.4) 3.6 (2.9-4.2)
Note: Estimates are based on 7,890 respondents in NSW. For this indicator 23 (0.29%) were not stated (Don’t know or Refused) in NSW. The question used was: How often do you eat potato crisps or other salty snacks?
Source: New South Wales Population Health Survey 2006 (HOIST). Centre for Epidemiology and Research, NSW Department of Health.
137
WARNIN
G: Esti
mates o
ut of
date.
Please
chec
k Hea
lthStat
s NSW
for la
test e
stimate
s.

Frequency of eating breakfast cereal, breads, pasta, rice and noodles perday,
persons aged 16 years and over, NSW, 2006
020406080100 0 20 40 60 80 100
Males Females
Per cent Per cent
0.3 0.7None
3.5 5.9less than once
a day
26.4 31.2once a day
39.7 38.9twice a day
22.0 17.23 times a day
5.6 4.34 times a day
1.6 1.15 times a day
1.0 0.7More than 5times a day
ResponseMales
(95% CI)Females(95% CI)
Persons(95% CI)
None 0.3 (0.1-0.5) 0.7 (0.3-1.0) 0.5 (0.3-0.6)
Less than once a day 3.5 (2.7-4.3) 5.9 (5.1-6.8) 4.7 (4.1-5.3)
Once a day 26.4 (24.3-28.5) 31.2 (29.5-33.0) 28.8 (27.5-30.2)
Twice a day 39.7 (37.4-42.0) 38.9 (37.0-40.7) 39.3 (37.8-40.7)
3 times a day 22.0 (20.1-23.9) 17.2 (15.8-18.7) 19.6 (18.4-20.8)
4 times a day 5.6 (4.6-6.6) 4.3 (3.4-5.1) 4.9 (4.3-5.6)
5 times a day 1.6 (0.9-2.3) 1.1 (0.6-1.6) 1.3 (0.9-1.8)
More than 5 times a day 1.0 (0.5-1.5) 0.7 (0.3-1.0) 0.8 (0.5-1.1)
Note: Estimates are based on 7,896 respondents in NSW. For this indicator 66 (0.83%) were not stated (Don’t know or Refused) in NSW. The questions used were: How often do you usually eat bread?, How often do you eat breakfast cereal?, and How often do you eat pasta, rice,noodles or other cooked cereals?
Source: New South Wales Population Health Survey 2006 (HOIST). Centre for Epidemiology and Research, NSW Department of Health.
138
WARNIN
G: Esti
mates o
ut of
date.
Please
chec
k Hea
lthStat
s NSW
for la
test e
stimate
s.
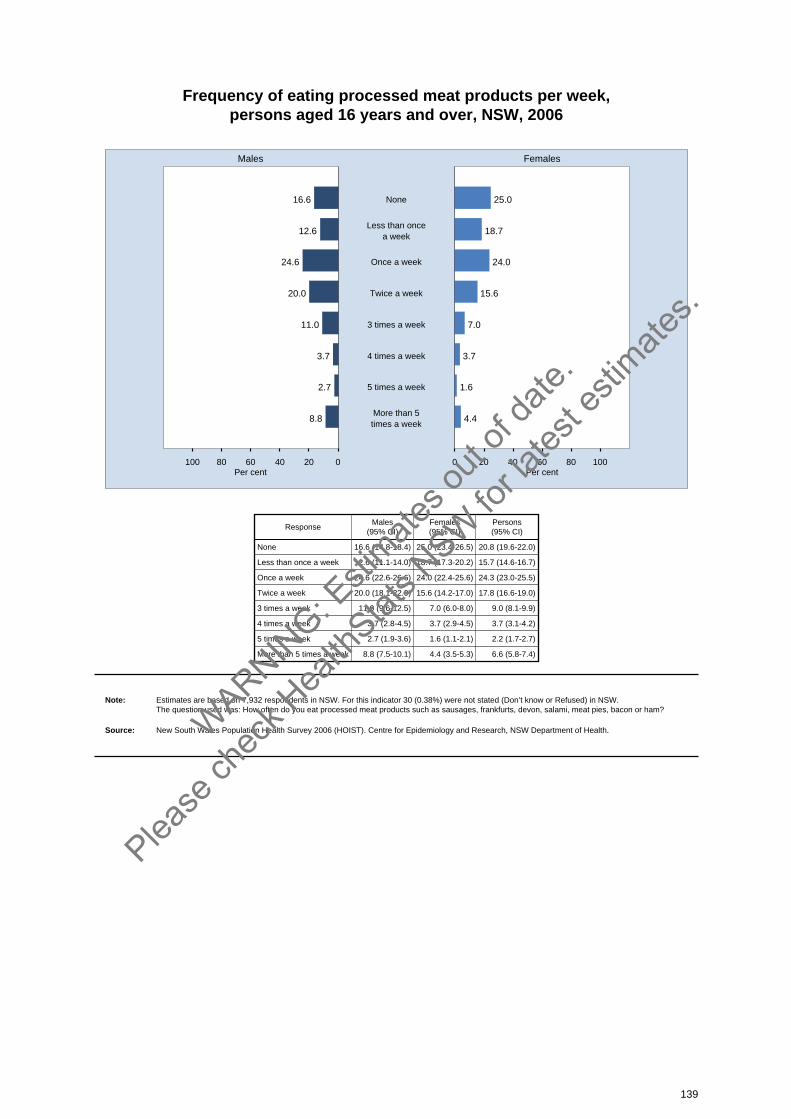
Frequency of eating processed meat products per week, persons aged 16 years and over, NSW, 2006
020406080100 0 20 40 60 80 100
Males Females
Per cent Per cent
16.6 25.0None
12.6 18.7Less than once
a week
24.6 24.0Once a week
20.0 15.6Twice a week
11.0 7.03 times a week
3.7 3.74 times a week
2.7 1.65 times a week
8.8 4.4More than 5times a week
ResponseMales
(95% CI)Females(95% CI)
Persons(95% CI)
None 16.6 (14.8-18.4) 25.0 (23.4-26.5) 20.8 (19.6-22.0)
Less than once a week 12.6 (11.1-14.0) 18.7 (17.3-20.2) 15.7 (14.6-16.7)
Once a week 24.6 (22.6-26.6) 24.0 (22.4-25.6) 24.3 (23.0-25.5)
Twice a week 20.0 (18.1-22.0) 15.6 (14.2-17.0) 17.8 (16.6-19.0)
3 times a week 11.0 (9.6-12.5) 7.0 (6.0-8.0) 9.0 (8.1-9.9)
4 times a week 3.7 (2.8-4.5) 3.7 (2.9-4.5) 3.7 (3.1-4.2)
5 times a week 2.7 (1.9-3.6) 1.6 (1.1-2.1) 2.2 (1.7-2.7)
More than 5 times a week 8.8 (7.5-10.1) 4.4 (3.5-5.3) 6.6 (5.8-7.4)
Note: Estimates are based on 7,932 respondents in NSW. For this indicator 30 (0.38%) were not stated (Don’t know or Refused) in NSW. The question used was: How often do you eat processed meat products such as sausages, frankfurts, devon, salami, meat pies, bacon or ham?
Source: New South Wales Population Health Survey 2006 (HOIST). Centre for Epidemiology and Research, NSW Department of Health.
139
WARNIN
G: Esti
mates o
ut of
date.
Please
chec
k Hea
lthStat
s NSW
for la
test e
stimate
s.

Cups of soft drinks or cordials or sports drinks per week, persons aged 16 years and over, NSW, 2006
020406080100 0 20 40 60 80 100
Males Females
Per cent Per cent
39.5 52.9None
7.4 6.9One cup
7.5 5.8Two cups
9.6 7.13 to 5 cups
14.6 13.96 to 10 cups
21.4 13.411 or more cups
ResponseMales
(95% CI)Females(95% CI)
Persons(95% CI)
None 39.5 (37.3-41.8) 52.9 (51.0-54.8) 46.3 (44.8-47.8)
One cup 7.4 (6.2-8.7) 6.9 (5.9-7.9) 7.2 (6.4-8.0)
Two cups 7.5 (6.3-8.7) 5.8 (4.9-6.7) 6.6 (5.9-7.4)
3 to 5 cups 9.6 (8.1-11.0) 7.1 (6.1-8.1) 8.3 (7.4-9.2)
6 to 10 cups 14.6 (12.9-16.3) 13.9 (12.5-15.3) 14.2 (13.1-15.3)
11 or more cups 21.4 (19.3-23.4) 13.4 (12.0-14.8) 17.3 (16.1-18.6)
Note: Estimates are based on 7,864 respondents in NSW. For this indicator 49 (0.62%) were not stated (Don’t know or Refused) in NSW. The question used was: How many cups of soft drink, cordials or sports drink, such as lemonade or Gatorade, usually drink in a day?
Source: New South Wales Population Health Survey 2006 (HOIST). Centre for Epidemiology and Research, NSW Department of Health.
140
WARNIN
G: Esti
mates o
ut of
date.
Please
chec
k Hea
lthStat
s NSW
for la
test e
stimate
s.

Frequency of eating takeaway food per week, persons aged 16 years and over, NSW, 2006
020406080100 0 20 40 60 80 100
Males Females
Per cent Per cent
32.7 41.4Daily or more
31.6 34.8
More than
once per week
but less daily
21.7 18.2Weekly
13.7 5.6Less than
weekly
0.3 0.0None
ResponseMales
(95% CI)Females(95% CI)
Persons(95% CI)
Daily or more 32.7 (30.6-34.8) 41.4 (39.6-43.3) 37.1 (35.7-38.5)
More than once per week but less daily 31.6 (29.4-33.8) 34.8 (32.9-36.6) 33.2 (31.8-34.6)
Weekly 21.7 (19.6-23.7) 18.2 (16.5-19.8) 19.9 (18.6-21.2)
Less than weekly 13.7 (11.8-15.6) 5.6 (4.5-6.6) 9.6 (8.5-10.7)
None 0.3 (0.0-0.6) 0.0 (0.0-0.1) 0.2 (0.0-0.3)
Note: Estimates are based on 7,666 respondents in NSW. For this indicator 38 (0.49%) were not stated (Don’t know or Refused) in NSW. The question used was: How often did you have meals or snacks such as burgers,pizza, chicken or chips from places like McDonalds, Hungry Jacks,Pizza Hut, KFC, Red Rooster, or local take-away places?
Source: New South Wales Population Health Survey 2006 (HOIST). Centre for Epidemiology and Research, NSW Department of Health.
141
WARNIN
G: Esti
mates o
ut of
date.
Please
chec
k Hea
lthStat
s NSW
for la
test e
stimate
s.
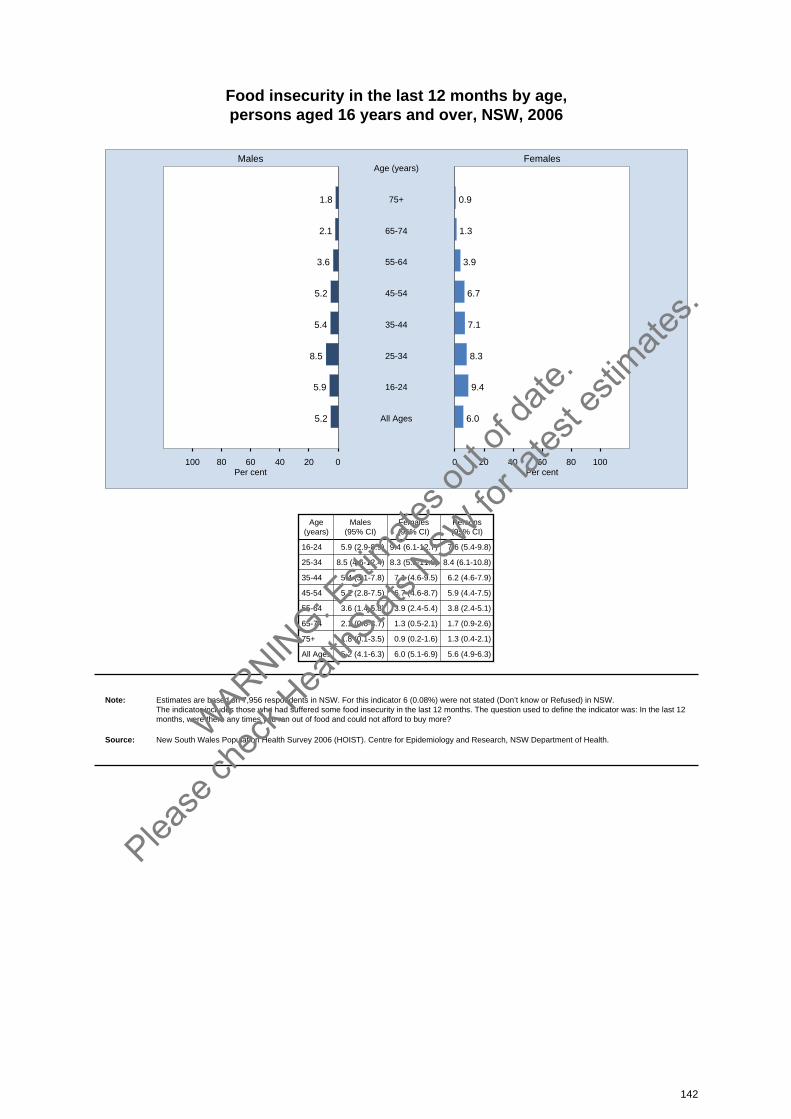
Food insecurity in the last 12 months by age, persons aged 16 years and over, NSW, 2006
020406080100 0 20 40 60 80 100
Males Females
Per cent Per cent
1.8 0.975+
Age (years)
2.1 1.365-74
3.6 3.955-64
5.2 6.745-54
5.4 7.135-44
8.5 8.325-34
5.9 9.416-24
5.2 6.0All Ages
Age(years)
Males(95% CI)
Females(95% CI)
Persons(95% CI)
16-24 5.9 (2.9-8.9) 9.4 (6.1-12.7) 7.6 (5.4-9.8)
25-34 8.5 (4.6-12.4) 8.3 (5.6-11.0) 8.4 (6.1-10.8)
35-44 5.4 (3.1-7.8) 7.1 (4.6-9.5) 6.2 (4.6-7.9)
45-54 5.2 (2.8-7.5) 6.7 (4.6-8.7) 5.9 (4.4-7.5)
55-64 3.6 (1.4-5.8) 3.9 (2.4-5.4) 3.8 (2.4-5.1)
65-74 2.1 (0.6-3.7) 1.3 (0.5-2.1) 1.7 (0.9-2.6)
75+ 1.8 (0.1-3.5) 0.9 (0.2-1.6) 1.3 (0.4-2.1)
All Ages 5.2 (4.1-6.3) 6.0 (5.1-6.9) 5.6 (4.9-6.3)
Note: Estimates are based on 7,956 respondents in NSW. For this indicator 6 (0.08%) were not stated (Don’t know or Refused) in NSW. The indicator includes those who had suffered some food insecurity in the last 12 months. The question used to define the indicator was: In the last 12months, were there any times you ran out of food and could not afford to buy more?
Source: New South Wales Population Health Survey 2006 (HOIST). Centre for Epidemiology and Research, NSW Department of Health.
142
WARNIN
G: Esti
mates o
ut of
date.
Please
chec
k Hea
lthStat
s NSW
for la
test e
stimate
s.
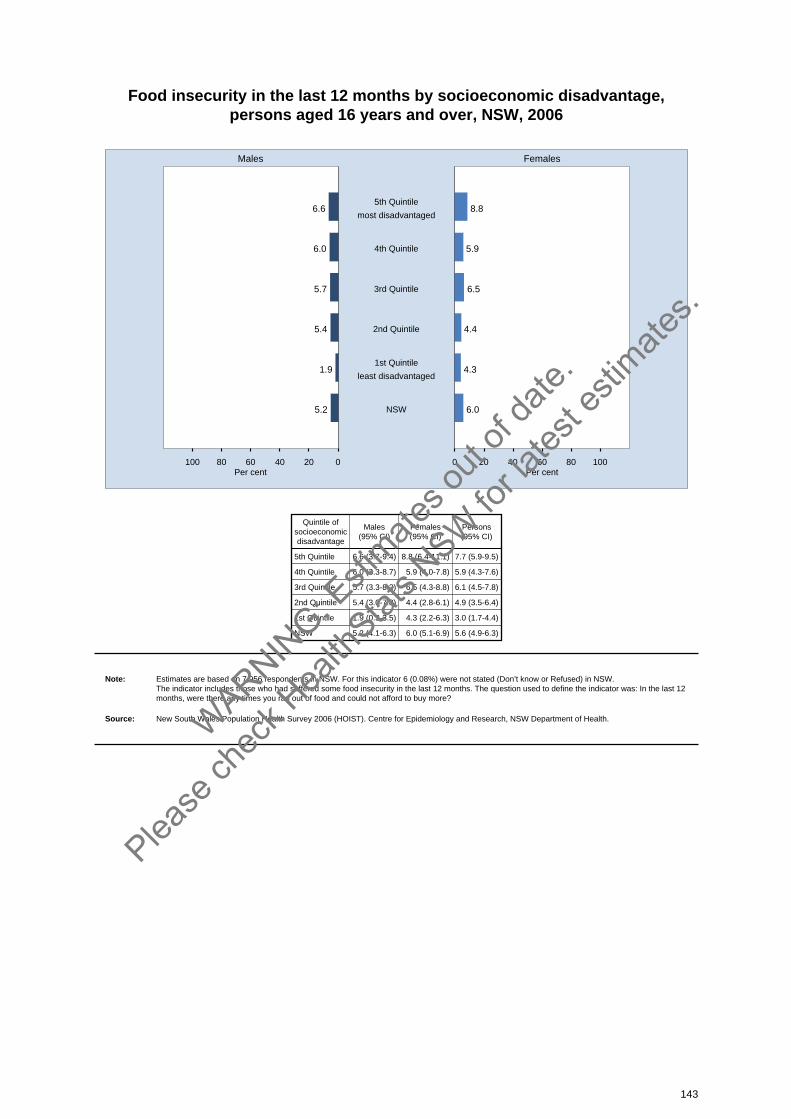
Food insecurity in the last 12 months by socioeconomic disadvantage, persons aged 16 years and over, NSW, 2006
020406080100 0 20 40 60 80 100
Males Females
Per cent Per cent
6.6 8.85th Quintile
most disadvantaged
6.0 5.94th Quintile
5.7 6.53rd Quintile
5.4 4.42nd Quintile
1.9 4.31st Quintile
least disadvantaged
5.2 6.0NSW
Quintile ofsocioeconomicdisadvantage
Males(95% CI)
Females(95% CI)
Persons(95% CI)
5th Quintile 6.6 (3.7-9.4) 8.8 (6.4-11.1) 7.7 (5.9-9.5)
4th Quintile 6.0 (3.3-8.7) 5.9 (4.0-7.8) 5.9 (4.3-7.6)
3rd Quintile 5.7 (3.3-8.2) 6.5 (4.3-8.8) 6.1 (4.5-7.8)
2nd Quintile 5.4 (3.0-7.8) 4.4 (2.8-6.1) 4.9 (3.5-6.4)
1st Quintile 1.9 (0.3-3.5) 4.3 (2.2-6.3) 3.0 (1.7-4.4)
NSW 5.2 (4.1-6.3) 6.0 (5.1-6.9) 5.6 (4.9-6.3)
Note: Estimates are based on 7,956 respondents in NSW. For this indicator 6 (0.08%) were not stated (Don’t know or Refused) in NSW. The indicator includes those who had suffered some food insecurity in the last 12 months. The question used to define the indicator was: In the last 12months, were there any times you ran out of food and could not afford to buy more?
Source: New South Wales Population Health Survey 2006 (HOIST). Centre for Epidemiology and Research, NSW Department of Health.
143
WARNIN
G: Esti
mates o
ut of
date.
Please
chec
k Hea
lthStat
s NSW
for la
test e
stimate
s.
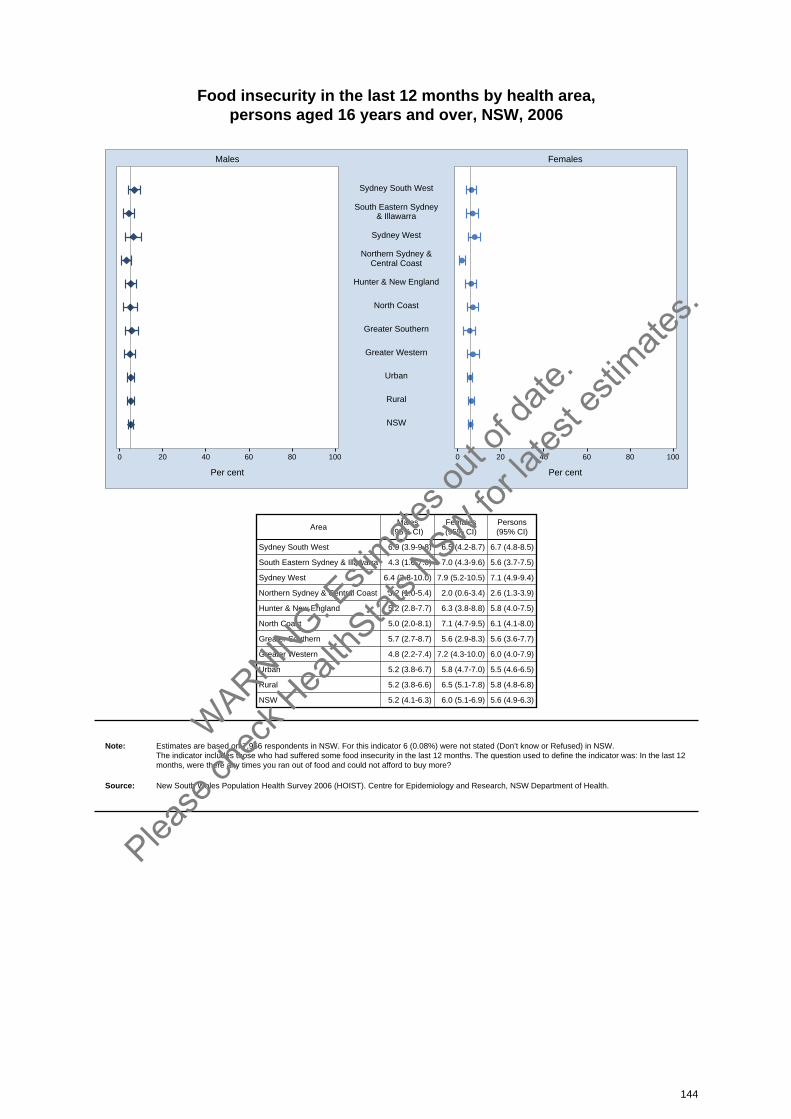
Food insecurity in the last 12 months by health area, persons aged 16 years and over, NSW, 2006
0 20 40 60 80 100 0 20 40 60 80 100
Males Females
Per cent Per cent
Sydney South West
South Eastern Sydney& Illawarra
Sydney West
Northern Sydney &Central Coast
Hunter & New England
North Coast
Greater Southern
Greater Western
Urban
Rural
NSW
AreaMales
(95% CI)Females(95% CI)
Persons(95% CI)
Sydney South West 6.9 (3.9-9.8) 6.5 (4.2-8.7) 6.7 (4.8-8.5)
South Eastern Sydney & Illawarra 4.3 (1.6-7.0) 7.0 (4.3-9.6) 5.6 (3.7-7.5)
Sydney West 6.4 (2.8-10.0) 7.9 (5.2-10.5) 7.1 (4.9-9.4)
Northern Sydney & Central Coast 3.2 (1.0-5.4) 2.0 (0.6-3.4) 2.6 (1.3-3.9)
Hunter & New England 5.2 (2.8-7.7) 6.3 (3.8-8.8) 5.8 (4.0-7.5)
North Coast 5.0 (2.0-8.1) 7.1 (4.7-9.5) 6.1 (4.1-8.0)
Greater Southern 5.7 (2.7-8.7) 5.6 (2.9-8.3) 5.6 (3.6-7.7)
Greater Western 4.8 (2.2-7.4) 7.2 (4.3-10.0) 6.0 (4.0-7.9)
Urban 5.2 (3.8-6.7) 5.8 (4.7-7.0) 5.5 (4.6-6.5)
Rural 5.2 (3.8-6.6) 6.5 (5.1-7.8) 5.8 (4.8-6.8)
NSW 5.2 (4.1-6.3) 6.0 (5.1-6.9) 5.6 (4.9-6.3)
Note: Estimates are based on 7,956 respondents in NSW. For this indicator 6 (0.08%) were not stated (Don’t know or Refused) in NSW. The indicator includes those who had suffered some food insecurity in the last 12 months. The question used to define the indicator was: In the last 12months, were there any times you ran out of food and could not afford to buy more?
Source: New South Wales Population Health Survey 2006 (HOIST). Centre for Epidemiology and Research, NSW Department of Health.
144
WARNIN
G: Esti
mates o
ut of
date.
Please
chec
k Hea
lthStat
s NSW
for la
test e
stimate
s.
Physical activity
IntroductionPhysical activity is an important factor in maintaining good health. People who participate inmoderate-to-vigorous levels of physical activity have lower rates of preventable mortality than thosewho are physically inactive; also, physical activity decreases risk of cardiovascular disease, somecancers, some mental illness, type-2 diabetes, overweight and obesity, and preventable injury.[1]
The National Physical Activity Guidelines for Adults state the minimum amount of physical activityrecommended to maintain good health is at least 30 minutes of moderate activity on most, andpreferably all, days of the week.[2]
This can be undertaken in shorter bursts of exercise, such as 3 lots of 10 minutes. Exercise ofmoderate intensity includes brisk walking, dancing, swimming, or cycling. The Guidelines alsoencourage people to think of movement as an opportunity rather than an inconvenience, and to beactive every day in as many ways as possible.
In the New South Wales Population Health Survey, adequate physical activity is calculated fromquestions asked in the Active Australia Survey,[3] and is defined as undertaking physical activity for atotal of 150 minutes per week over 5 separate occasions. The total minutes are calculated by addingminutes in the last week spent walking continuously for at least 10 minutes, minutes doing moderatephysical activity, plus minutes doing vigorous physical activity multiplied by 2.
Active transport, such as walking, cycling or using public transport to get to or from a destination,especially work, is an achievable way for most people to incorporate the recommended 30 minutes ofphysical activity into their lives. Monitoring the active transport habits of the population providesimportant information about physical activity.
In order to encourage physical activity and active transport, it is important to have quality infrastructureand adequate neighbourhood facilities, such as sporting fields, public swimming pools, parks orreserves, footpaths, bike paths, and other facilities.
In 2006, the New South Wales Population Health Survey asked respondents: In the last week, howmany times have you walked continuously for at least 10 minutes for recreation or exercise or to get toor from places? What do you estimate was the total time you spent walking in this way in the lastweek? In the last week, how many times did you do any vigorous physical activity that made youbreathe harder or puff and pant? What do you estimate was the total time you spent doing thisvigorous physical activity in the last week? In the last week, how many times did you do any othermore moderate physical activity you haven’t already mentioned? What do you estimate was the totaltime you spent doing these moderate activities in the last week? and, How do you usually get to work?Does your neighbourhood have any of the following facilities: sporting fields, public swimming pools,parks or reserves, footpaths, bikepaths, and other facilities. How often do you use these facilities eachday, week, or month?
Results
Adequate physical activity
Overall, in 2006, 54.9 per cent of adults undertook adequate levels of physical activity. A significantlyhigher proportion of males (60.4 per cent) than females (49.6 per cent) undertook adequate physicalactivity. Among males, physical activity decreased with age. A significantly higher proportion aged16-24 years (72.3 per cent) and 25-34 years (67.9 per cent), and a significantly lower proportion aged65-74 years (51.9 per cent) and 75 years and over (40.9 per cent), undertook adequate physicalactivity, compared with the overall male population. Among females, physical activity decreased withage. A significantly higher proportion aged 16-24 years (61.4 per cent) and 25-34 years (55.7 percent), and a significantly lower proportion aged 65-74 years (42.5 per cent) and 75 years and over(29.5 per cent), undertook adequate physical activity, compared with the overall adult female population.
145
WARNIN
G: Esti
mates o
ut of
date.
Please
chec
k Hea
lthStat
s NSW
for la
test e
stimate
s.
There was no significant difference in the proportion of adults undertaking adequate levels of physicalactivity between urban and rural areas; however, a higher proportion of adults in the Northern Sydney& Central Coast Health Area (60.3 per cent), and a lower proportion of adults in the Sydney WestHealth Area (48.7 per cent), undertook adequate physical activity, compared with the overall adultpopulation. Adequate physical activity decreases with socioeconomic disadvantage. A lowerproportion of adults in the most disadvantaged quintile(49.7 per cent), and a higher proportion ofadults in the least disadvantaged quintile (62.4 per cent), undertook adequate levels of physicalactivity, compared with the overall adult population.
There has been a significant increase in the proportion of adults undertaking adequate physicalactivity, from 1998 (47.9 per cent) to 2006 (54.9 per cent). This increase was significant in both males(52.5 per cent to 60.4 per cent) and females (43.4 per cent to 49.6 per cent).
Active transport
Overall, in 2006, the majority of adults did not use active transport to travel to work, as 77.1 per centcommuted by car, motorbike, truck, or taxi, and only 11.3 per cent caught a train, 6.1 per cent caught abus, 7.7 per cent walked all or part of the way, 1.2 per cent rode a bicycle, and 0.4 per cent caught a ferry.
Neighbourhood facilities
Overall, in 2006, 4.3 per cent of adults had no access to neighbourhood facilities, 79.1 per cent hadaccess to sporting fields, 88.8 per cent had access to parks or reserves, 63.4 per cent had access topublic swimming pools, 82.3 per cent had access to footpaths, and 54.1 per cent had access to bikepaths.
Among those adults with access to parks or reserves, 7.9 per cent used them daily or more, 15.3 percent used them more than once a week but less than daily, 16.0 per cent used them weekly, 15.7 percent used them less than weekly, and 45.0 per cent never used them. Among those adults with accessto sporting fields, 3.6 per cent used them daily or more, 7.9 per cent used them more than once aweek but less than daily, 10.9 per cent used them weekly, 7.0 per cent used them less than weekly,and 70.5 per cent never used them. Among those adults with access to swimming pools, 1.1 per centused them daily or more, 8.3 per cent used them more than once a week but less than daily, 9.1 percent used them weekly, 8.1 per cent used them less than weekly, and 73.4 per cent never used them.Among those adults with access to footpaths, 52.2 per cent used them daily or more, 22.9 per centused them more than once a week but less than daily, 7.6 per cent used them weekly, 3.9 per centused them less than weekly, and 13.5 per cent never used them. Among those adults with access tobikepaths, 3.1 per cent used them daily or more, 5.2 per cent used them more than once a week butless than daily, 5.9 per cent used them weekly, 7.7 per cent used them less than weekly, and 78.1 percent never used them.
Among those adults with access to neighbourhood facilities, 47.7 per cent used them weekly or more.There was no significant variation between males and females. A significantly higher proportion ofadults aged 25-34 years (57 per cent) and 35-44 years (58.8 per cent), and a significantly lowerproportion of adults aged 55-64 years (36.6 per cent) and 65-74 years (35.1 per cent) and 75 yearsand over (23.3 per cent), used neighbourhood facilities weekly or more.
A significantly lower proportion of adults in rural areas (35.7 per cent) than urban areas (51.3 per cent)used neighbourhood facilities weekly or more, compared with the overall adult population. A higherproportion of adults in the South Eastern Sydney & Illawarra Health Area (58.5 per cent), and a lowerproportion of adults in the Hunter & New England (38.2 per cent) and North Coast (30.1 per cent) andGreater Western (29.0 per cent) Health Areas, used neighbourhood facilities weekly or more,compared with the overall adult female population.
There was no variation in the proportion of adults using neighbourhood facilities weekly or more bylevel of socioeconomic disadvantage.
146
WARNIN
G: Esti
mates o
ut of
date.
Please
chec
k Hea
lthStat
s NSW
for la
test e
stimate
s.
References1. Bauman A, Bellew B, Vita P, Brown W, and Owen T. Getting Australia Active: Towards better
practice for the promotion of physical activity. Melbourne: National Public Health Partnership,2002. Available online at www.nphp.gov.au/publications/sigpah/gaa.pdf (accessed 9 May 2007).
2. Australian Government Department of Health and Aged Care. National Physical ActivityGuidelines for Australians. Canberra: Australian Government Department of Health and AgedCare, 2005. Available online atwww.health.gov.au/internet/wcms/Publishing.nsf/Content/phd-physical-activity-adults-pdf-cnt.htm(accessed 9 May 2007).
3. Australian Institute of Health and Welfare. The Active Australia Survey: A guide and manual forimplementation, analysis and reporting. Canberra: AIHW, 2003. Available online atwww.aihw.gov.au/publications/index.cfm/title/8559 (accessed 9 May 2007).
147
WARNIN
G: Esti
mates o
ut of
date.
Please
chec
k Hea
lthStat
s NSW
for la
test e
stimate
s.
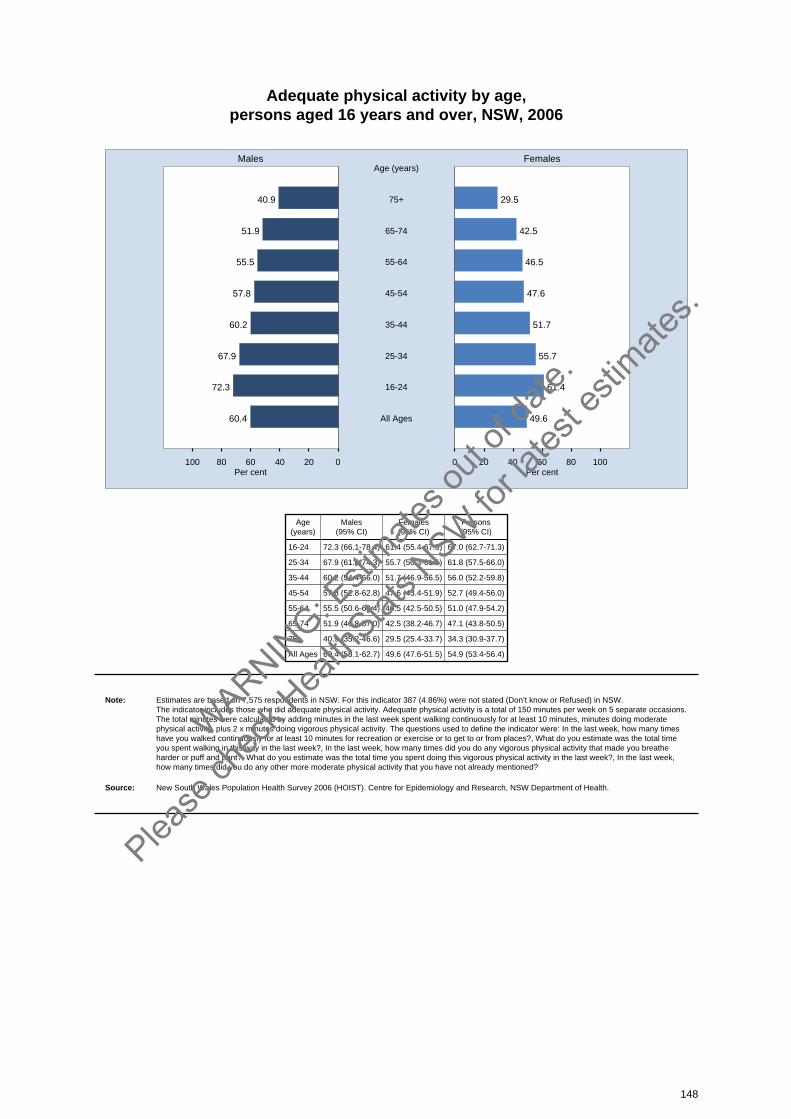
Adequate physical activity by age, persons aged 16 years and over, NSW, 2006
020406080100 0 20 40 60 80 100
Males Females
Per cent Per cent
40.9 29.575+
Age (years)
51.9 42.565-74
55.5 46.555-64
57.8 47.645-54
60.2 51.735-44
67.9 55.725-34
72.3 61.416-24
60.4 49.6All Ages
Age(years)
Males(95% CI)
Females(95% CI)
Persons(95% CI)
16-24 72.3 (66.1-78.4) 61.4 (55.4-67.3) 67.0 (62.7-71.3)
25-34 67.9 (61.6-74.3) 55.7 (50.3-61.1) 61.8 (57.5-66.0)
35-44 60.2 (54.4-66.0) 51.7 (46.9-56.5) 56.0 (52.2-59.8)
45-54 57.8 (52.8-62.8) 47.6 (43.4-51.9) 52.7 (49.4-56.0)
55-64 55.5 (50.6-60.4) 46.5 (42.5-50.5) 51.0 (47.9-54.2)
65-74 51.9 (46.8-57.0) 42.5 (38.2-46.7) 47.1 (43.8-50.5)
75+ 40.9 (35.2-46.6) 29.5 (25.4-33.7) 34.3 (30.9-37.7)
All Ages 60.4 (58.1-62.7) 49.6 (47.6-51.5) 54.9 (53.4-56.4)
Note: Estimates are based on 7,575 respondents in NSW. For this indicator 387 (4.86%) were not stated (Don’t know or Refused) in NSW. The indicator includes those who did adequate physical activity. Adequate physical activity is a total of 150 minutes per week on 5 separate occasions.The total minutes were calculated by adding minutes in the last week spent walking continuously for at least 10 minutes, minutes doing moderatephysical activity, plus 2 x minutes doing vigorous physical activity. The questions used to define the indicator were: In the last week, how many timeshave you walked continuously for at least 10 minutes for recreation or exercise or to get to or from places?, What do you estimate was the total timeyou spent walking in this way in the last week?, In the last week, how many times did you do any vigorous physical activity that made you breatheharder or puff and pant?, What do you estimate was the total time you spent doing this vigorous physical activity in the last week?, In the last week,how many times did you do any other more moderate physical activity that you have not already mentioned?
Source: New South Wales Population Health Survey 2006 (HOIST). Centre for Epidemiology and Research, NSW Department of Health.
148
WARNIN
G: Esti
mates o
ut of
date.
Please
chec
k Hea
lthStat
s NSW
for la
test e
stimate
s.
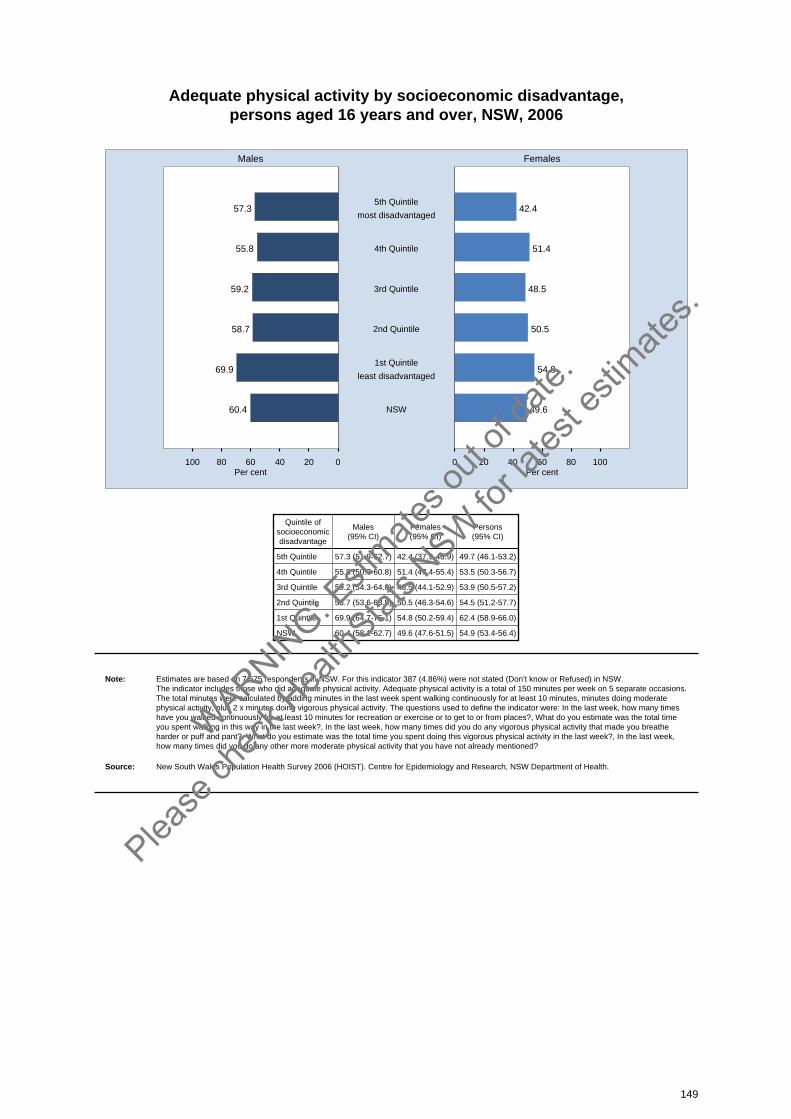
Adequate physical activity by socioeconomic disadvantage, persons aged 16 years and over, NSW, 2006
020406080100 0 20 40 60 80 100
Males Females
Per cent Per cent
57.3 42.45th Quintile
most disadvantaged
55.8 51.44th Quintile
59.2 48.53rd Quintile
58.7 50.52nd Quintile
69.9 54.81st Quintile
least disadvantaged
60.4 49.6NSW
Quintile ofsocioeconomicdisadvantage
Males(95% CI)
Females(95% CI)
Persons(95% CI)
5th Quintile 57.3 (51.9-62.7) 42.4 (37.9-46.9) 49.7 (46.1-53.2)
4th Quintile 55.8 (50.7-60.8) 51.4 (47.4-55.4) 53.5 (50.3-56.7)
3rd Quintile 59.2 (54.3-64.0) 48.5 (44.1-52.9) 53.9 (50.5-57.2)
2nd Quintile 58.7 (53.6-63.8) 50.5 (46.3-54.6) 54.5 (51.2-57.7)
1st Quintile 69.9 (64.7-75.1) 54.8 (50.2-59.4) 62.4 (58.9-66.0)
NSW 60.4 (58.1-62.7) 49.6 (47.6-51.5) 54.9 (53.4-56.4)
Note: Estimates are based on 7,575 respondents in NSW. For this indicator 387 (4.86%) were not stated (Don’t know or Refused) in NSW. The indicator includes those who did adequate physical activity. Adequate physical activity is a total of 150 minutes per week on 5 separate occasions.The total minutes were calculated by adding minutes in the last week spent walking continuously for at least 10 minutes, minutes doing moderatephysical activity, plus 2 x minutes doing vigorous physical activity. The questions used to define the indicator were: In the last week, how many timeshave you walked continuously for at least 10 minutes for recreation or exercise or to get to or from places?, What do you estimate was the total timeyou spent walking in this way in the last week?, In the last week, how many times did you do any vigorous physical activity that made you breatheharder or puff and pant?, What do you estimate was the total time you spent doing this vigorous physical activity in the last week?, In the last week,how many times did you do any other more moderate physical activity that you have not already mentioned?
Source: New South Wales Population Health Survey 2006 (HOIST). Centre for Epidemiology and Research, NSW Department of Health.
149
WARNIN
G: Esti
mates o
ut of
date.
Please
chec
k Hea
lthStat
s NSW
for la
test e
stimate
s.
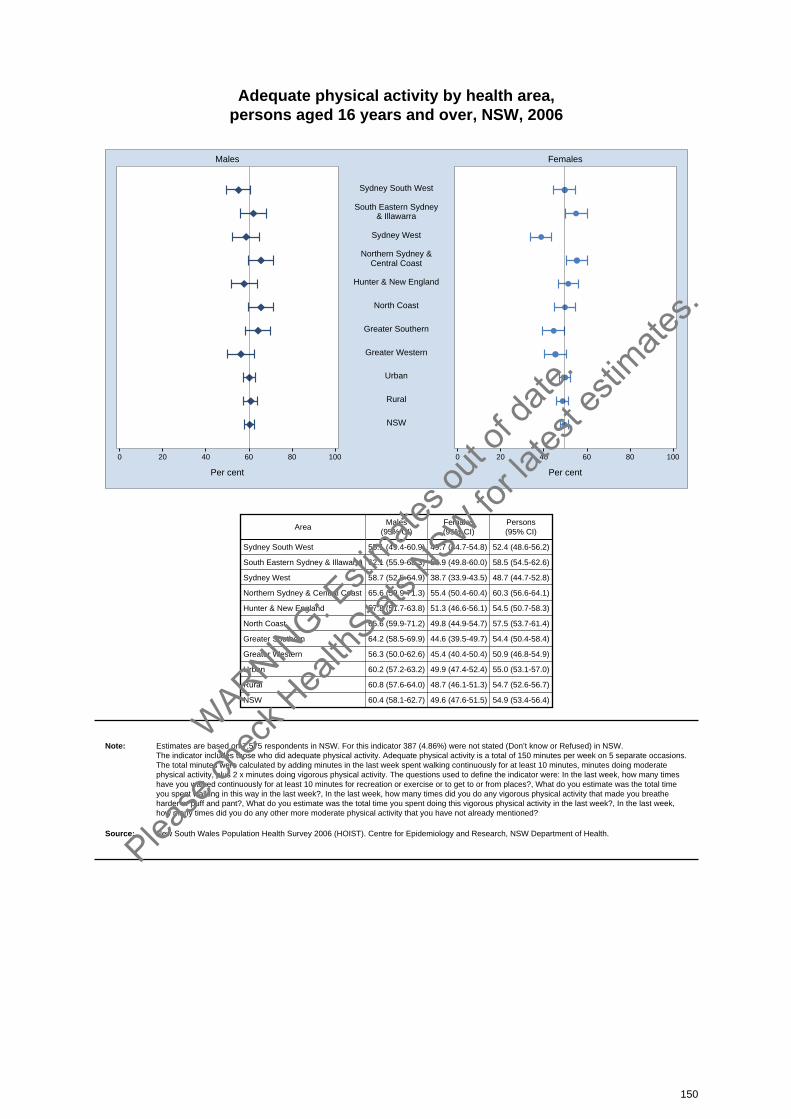
Adequate physical activity by health area, persons aged 16 years and over, NSW, 2006
0 20 40 60 80 100 0 20 40 60 80 100
Males Females
Per cent Per cent
Sydney South West
South Eastern Sydney& Illawarra
Sydney West
Northern Sydney &Central Coast
Hunter & New England
North Coast
Greater Southern
Greater Western
Urban
Rural
NSW
AreaMales
(95% CI)Females(95% CI)
Persons(95% CI)
Sydney South West 55.1 (49.4-60.9) 49.7 (44.7-54.8) 52.4 (48.6-56.2)
South Eastern Sydney & Illawarra 62.1 (55.9-68.3) 54.9 (49.8-60.0) 58.5 (54.5-62.6)
Sydney West 58.7 (52.5-64.9) 38.7 (33.9-43.5) 48.7 (44.7-52.8)
Northern Sydney & Central Coast 65.6 (59.9-71.3) 55.4 (50.4-60.4) 60.3 (56.6-64.1)
Hunter & New England 57.8 (51.7-63.8) 51.3 (46.6-56.1) 54.5 (50.7-58.3)
North Coast 65.6 (59.9-71.2) 49.8 (44.9-54.7) 57.5 (53.7-61.4)
Greater Southern 64.2 (58.5-69.9) 44.6 (39.5-49.7) 54.4 (50.4-58.4)
Greater Western 56.3 (50.0-62.6) 45.4 (40.4-50.4) 50.9 (46.8-54.9)
Urban 60.2 (57.2-63.2) 49.9 (47.4-52.4) 55.0 (53.1-57.0)
Rural 60.8 (57.6-64.0) 48.7 (46.1-51.3) 54.7 (52.6-56.7)
NSW 60.4 (58.1-62.7) 49.6 (47.6-51.5) 54.9 (53.4-56.4)
Note: Estimates are based on 7,575 respondents in NSW. For this indicator 387 (4.86%) were not stated (Don’t know or Refused) in NSW. The indicator includes those who did adequate physical activity. Adequate physical activity is a total of 150 minutes per week on 5 separate occasions.The total minutes were calculated by adding minutes in the last week spent walking continuously for at least 10 minutes, minutes doing moderatephysical activity, plus 2 x minutes doing vigorous physical activity. The questions used to define the indicator were: In the last week, how many timeshave you walked continuously for at least 10 minutes for recreation or exercise or to get to or from places?, What do you estimate was the total timeyou spent walking in this way in the last week?, In the last week, how many times did you do any vigorous physical activity that made you breatheharder or puff and pant?, What do you estimate was the total time you spent doing this vigorous physical activity in the last week?, In the last week,how many times did you do any other more moderate physical activity that you have not already mentioned?
Source: New South Wales Population Health Survey 2006 (HOIST). Centre for Epidemiology and Research, NSW Department of Health.
150
WARNIN
G: Esti
mates o
ut of
date.
Please
chec
k Hea
lthStat
s NSW
for la
test e
stimate
s.
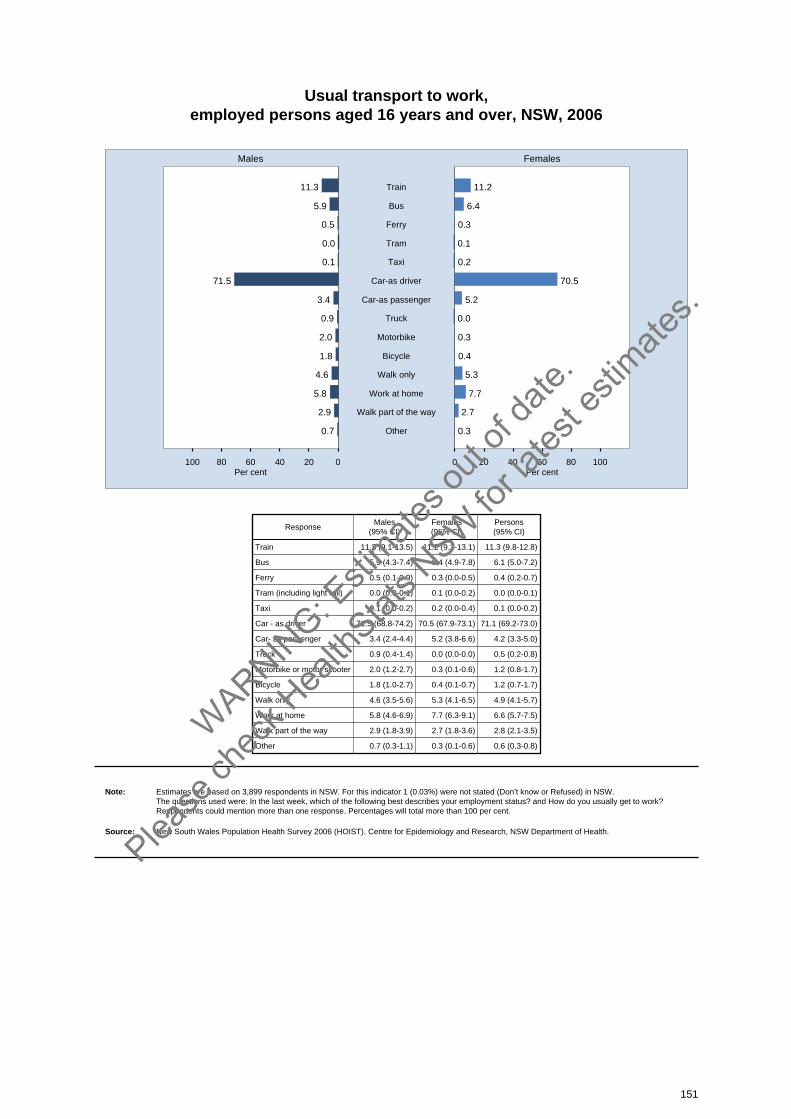
Usual transport to work, employed persons aged 16 years and over, NSW, 2006
020406080100 0 20 40 60 80 100
Males Females
Per cent Per cent
11.3 11.2Train
5.9 6.4Bus
0.5 0.3Ferry
0.0 0.1Tram
0.1 0.2Taxi
71.5 70.5Car-as driver
3.4 5.2Car-as passenger
0.9 0.0Truck
2.0 0.3Motorbike
1.8 0.4Bicycle
4.6 5.3Walk only
5.8 7.7Work at home
2.9 2.7Walk part of the way
0.7 0.3Other
ResponseMales
(95% CI)Females(95% CI)
Persons(95% CI)
Train 11.3 (9.1-13.5) 11.2 (9.2-13.1) 11.3 (9.8-12.8)
Bus 5.9 (4.3-7.4) 6.4 (4.9-7.8) 6.1 (5.0-7.2)
Ferry 0.5 (0.1-0.9) 0.3 (0.0-0.5) 0.4 (0.2-0.7)
Tram (including light rail) 0.0 (0.0-0.1) 0.1 (0.0-0.2) 0.0 (0.0-0.1)
Taxi 0.1 (0.0-0.2) 0.2 (0.0-0.4) 0.1 (0.0-0.2)
Car - as driver 71.5 (68.8-74.2) 70.5 (67.9-73.1) 71.1 (69.2-73.0)
Car- as passenger 3.4 (2.4-4.4) 5.2 (3.8-6.6) 4.2 (3.3-5.0)
Truck 0.9 (0.4-1.4) 0.0 (0.0-0.0) 0.5 (0.2-0.8)
Motorbike or motor scooter 2.0 (1.2-2.7) 0.3 (0.1-0.6) 1.2 (0.8-1.7)
Bicycle 1.8 (1.0-2.7) 0.4 (0.1-0.7) 1.2 (0.7-1.7)
Walk only 4.6 (3.5-5.6) 5.3 (4.1-6.5) 4.9 (4.1-5.7)
Work at home 5.8 (4.6-6.9) 7.7 (6.3-9.1) 6.6 (5.7-7.5)
Walk part of the way 2.9 (1.8-3.9) 2.7 (1.8-3.6) 2.8 (2.1-3.5)
Other 0.7 (0.3-1.1) 0.3 (0.1-0.6) 0.6 (0.3-0.8)
Note: Estimates are based on 3,899 respondents in NSW. For this indicator 1 (0.03%) were not stated (Don’t know or Refused) in NSW. The questions used were: In the last week, which of the following best describes your employment status? and How do you usually get to work?Respondents could mention more than one response. Percentages will total more than 100 per cent.
Source: New South Wales Population Health Survey 2006 (HOIST). Centre for Epidemiology and Research, NSW Department of Health.
151
WARNIN
G: Esti
mates o
ut of
date.
Please
chec
k Hea
lthStat
s NSW
for la
test e
stimate
s.
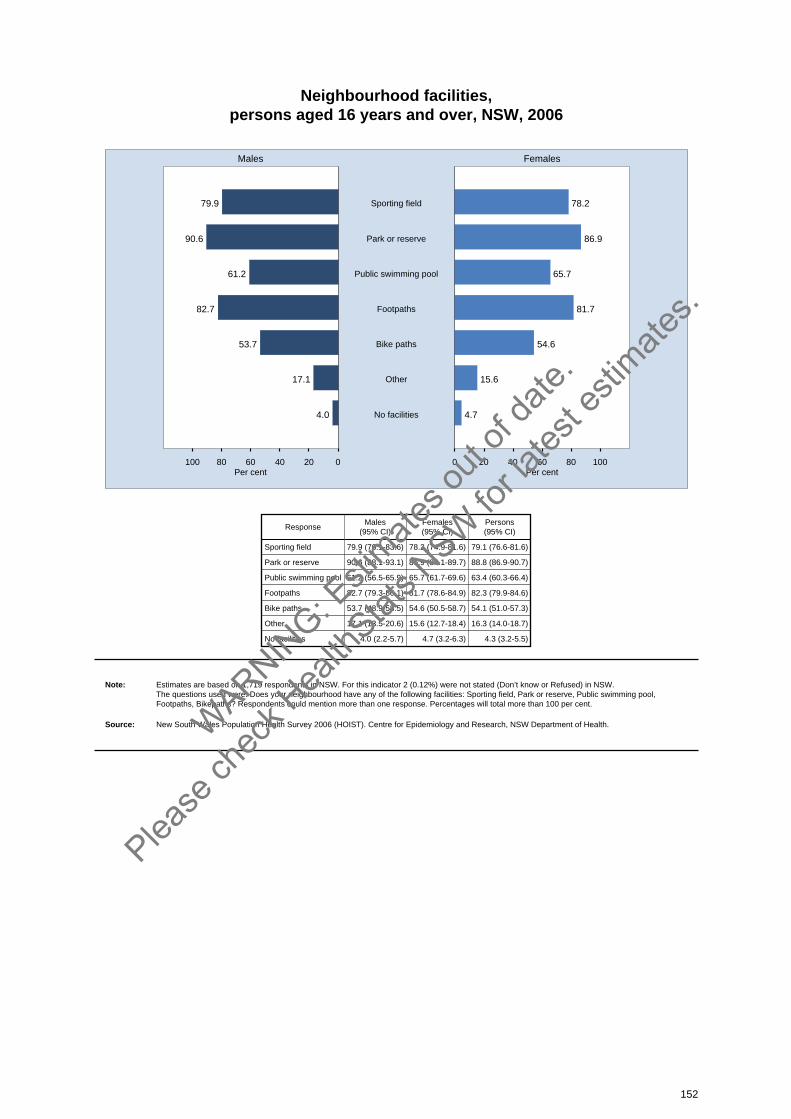
Neighbourhood facilities, persons aged 16 years and over, NSW, 2006
020406080100 0 20 40 60 80 100
Males Females
Per cent Per cent
79.9 78.2Sporting field
90.6 86.9Park or reserve
61.2 65.7Public swimming pool
82.7 81.7Footpaths
53.7 54.6Bike paths
17.1 15.6Other
4.0 4.7No facilities
ResponseMales
(95% CI)Females(95% CI)
Persons(95% CI)
Sporting field 79.9 (76.1-83.6) 78.2 (74.9-81.6) 79.1 (76.6-81.6)
Park or reserve 90.6 (88.1-93.1) 86.9 (84.1-89.7) 88.8 (86.9-90.7)
Public swimming pool 61.2 (56.5-65.9) 65.7 (61.7-69.6) 63.4 (60.3-66.4)
Footpaths 82.7 (79.3-86.1) 81.7 (78.6-84.9) 82.3 (79.9-84.6)
Bike paths 53.7 (48.9-58.5) 54.6 (50.5-58.7) 54.1 (51.0-57.3)
Other 17.1 (13.5-20.6) 15.6 (12.7-18.4) 16.3 (14.0-18.7)
No facilities 4.0 (2.2-5.7) 4.7 (3.2-6.3) 4.3 (3.2-5.5)
Note: Estimates are based on 1,719 respondents in NSW. For this indicator 2 (0.12%) were not stated (Don’t know or Refused) in NSW. The questions used were: Does your neighbourhood have any of the following facilities: Sporting field, Park or reserve, Public swimming pool,Footpaths, Bikepaths? Respondents could mention more than one response. Percentages will total more than 100 per cent.
Source: New South Wales Population Health Survey 2006 (HOIST). Centre for Epidemiology and Research, NSW Department of Health.
152
WARNIN
G: Esti
mates o
ut of
date.
Please
chec
k Hea
lthStat
s NSW
for la
test e
stimate
s.
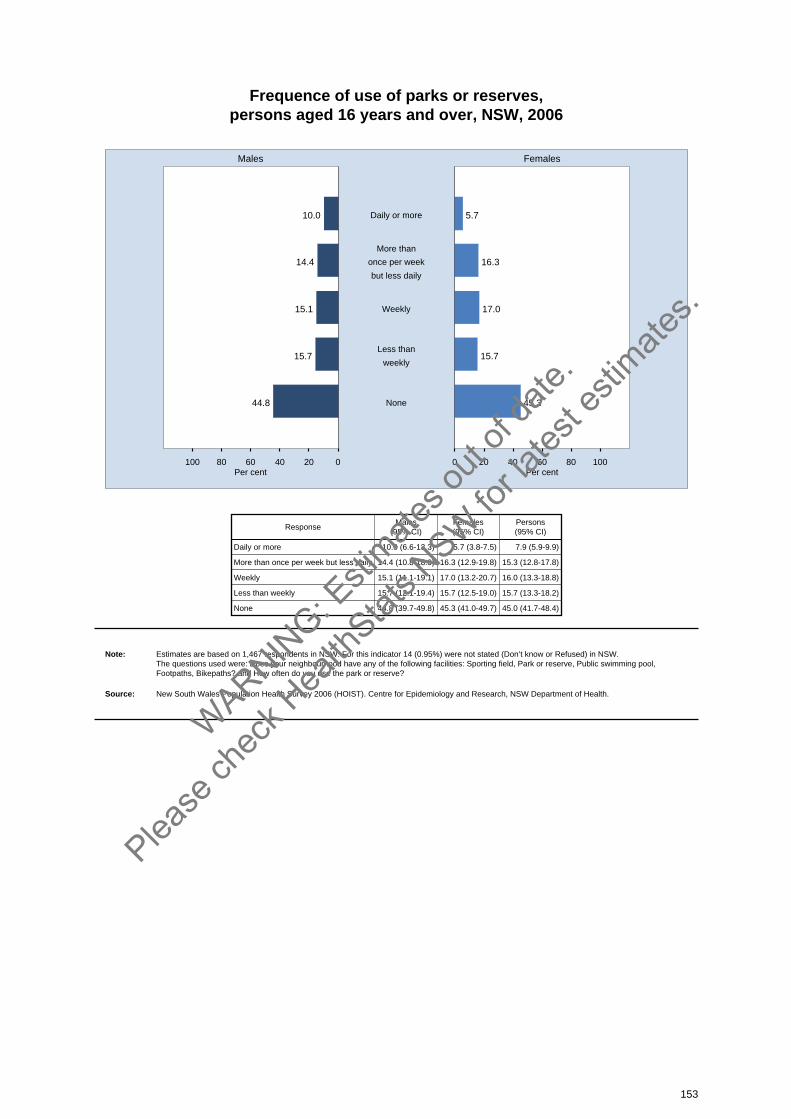
Frequence of use of parks or reserves, persons aged 16 years and over, NSW, 2006
020406080100 0 20 40 60 80 100
Males Females
Per cent Per cent
10.0 5.7Daily or more
14.4 16.3
More than
once per week
but less daily
15.1 17.0Weekly
15.7 15.7Less than
weekly
44.8 45.3None
ResponseMales
(95% CI)Females(95% CI)
Persons(95% CI)
Daily or more 10.0 (6.6-13.3) 5.7 (3.8-7.5) 7.9 (5.9-9.9)
More than once per week but less daily 14.4 (10.8-18.0) 16.3 (12.9-19.8) 15.3 (12.8-17.8)
Weekly 15.1 (11.1-19.1) 17.0 (13.2-20.7) 16.0 (13.3-18.8)
Less than weekly 15.7 (12.1-19.4) 15.7 (12.5-19.0) 15.7 (13.3-18.2)
None 44.8 (39.7-49.8) 45.3 (41.0-49.7) 45.0 (41.7-48.4)
Note: Estimates are based on 1,467 respondents in NSW. For this indicator 14 (0.95%) were not stated (Don’t know or Refused) in NSW. The questions used were: Does your neighbourhood have any of the following facilities: Sporting field, Park or reserve, Public swimming pool,Footpaths, Bikepaths? and How often do you use the park or reserve?
Source: New South Wales Population Health Survey 2006 (HOIST). Centre for Epidemiology and Research, NSW Department of Health.
153
WARNIN
G: Esti
mates o
ut of
date.
Please
chec
k Hea
lthStat
s NSW
for la
test e
stimate
s.
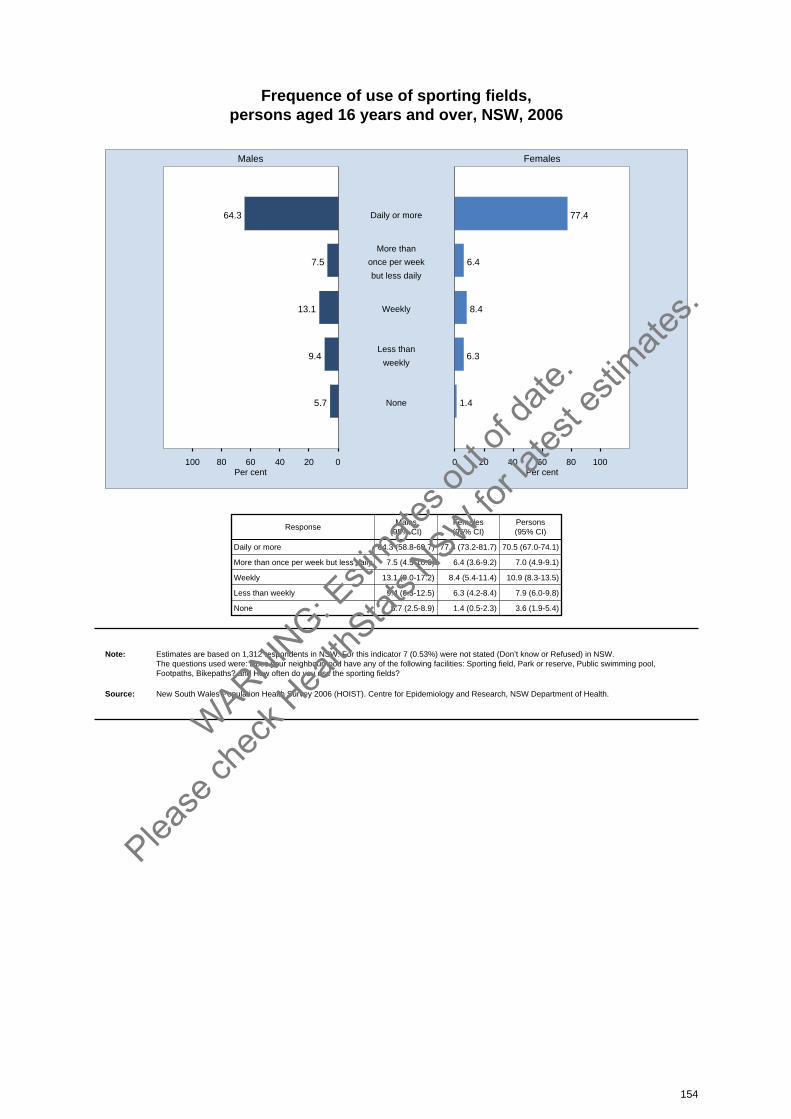
Frequence of use of sporting fields, persons aged 16 years and over, NSW, 2006
020406080100 0 20 40 60 80 100
Males Females
Per cent Per cent
64.3 77.4Daily or more
7.5 6.4
More than
once per week
but less daily
13.1 8.4Weekly
9.4 6.3Less than
weekly
5.7 1.4None
ResponseMales
(95% CI)Females(95% CI)
Persons(95% CI)
Daily or more 64.3 (58.8-69.7) 77.4 (73.2-81.7) 70.5 (67.0-74.1)
More than once per week but less daily 7.5 (4.5-10.6) 6.4 (3.6-9.2) 7.0 (4.9-9.1)
Weekly 13.1 (9.0-17.2) 8.4 (5.4-11.4) 10.9 (8.3-13.5)
Less than weekly 9.4 (6.3-12.5) 6.3 (4.2-8.4) 7.9 (6.0-9.8)
None 5.7 (2.5-8.9) 1.4 (0.5-2.3) 3.6 (1.9-5.4)
Note: Estimates are based on 1,312 respondents in NSW. For this indicator 7 (0.53%) were not stated (Don’t know or Refused) in NSW. The questions used were: Does your neighbourhood have any of the following facilities: Sporting field, Park or reserve, Public swimming pool,Footpaths, Bikepaths? and How often do you use the sporting fields?
Source: New South Wales Population Health Survey 2006 (HOIST). Centre for Epidemiology and Research, NSW Department of Health.
154
WARNIN
G: Esti
mates o
ut of
date.
Please
chec
k Hea
lthStat
s NSW
for la
test e
stimate
s.
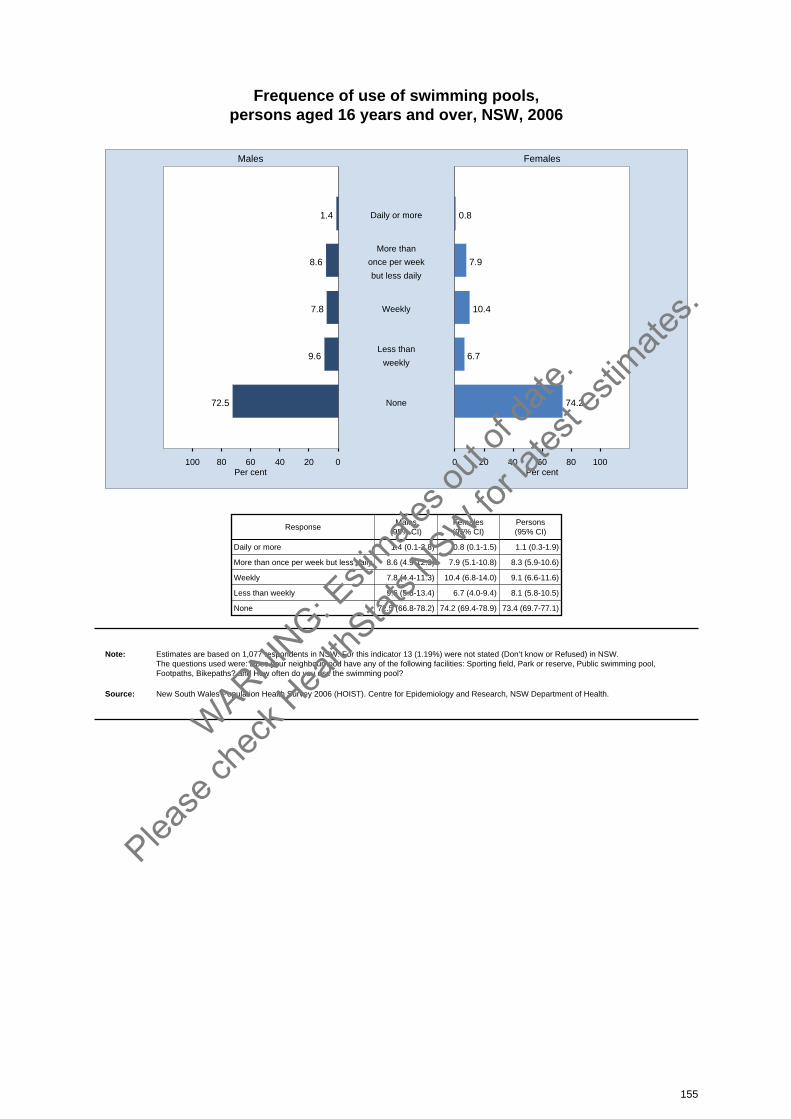
Frequence of use of swimming pools, persons aged 16 years and over, NSW, 2006
020406080100 0 20 40 60 80 100
Males Females
Per cent Per cent
1.4 0.8Daily or more
8.6 7.9
More than
once per week
but less daily
7.8 10.4Weekly
9.6 6.7Less than
weekly
72.5 74.2None
ResponseMales
(95% CI)Females(95% CI)
Persons(95% CI)
Daily or more 1.4 (0.1-2.8) 0.8 (0.1-1.5) 1.1 (0.3-1.9)
More than once per week but less daily 8.6 (4.9-12.3) 7.9 (5.1-10.8) 8.3 (5.9-10.6)
Weekly 7.8 (4.4-11.3) 10.4 (6.8-14.0) 9.1 (6.6-11.6)
Less than weekly 9.6 (5.8-13.4) 6.7 (4.0-9.4) 8.1 (5.8-10.5)
None 72.5 (66.8-78.2) 74.2 (69.4-78.9) 73.4 (69.7-77.1)
Note: Estimates are based on 1,077 respondents in NSW. For this indicator 13 (1.19%) were not stated (Don’t know or Refused) in NSW. The questions used were: Does your neighbourhood have any of the following facilities: Sporting field, Park or reserve, Public swimming pool,Footpaths, Bikepaths? and How often do you use the swimming pool?
Source: New South Wales Population Health Survey 2006 (HOIST). Centre for Epidemiology and Research, NSW Department of Health.
155
WARNIN
G: Esti
mates o
ut of
date.
Please
chec
k Hea
lthStat
s NSW
for la
test e
stimate
s.
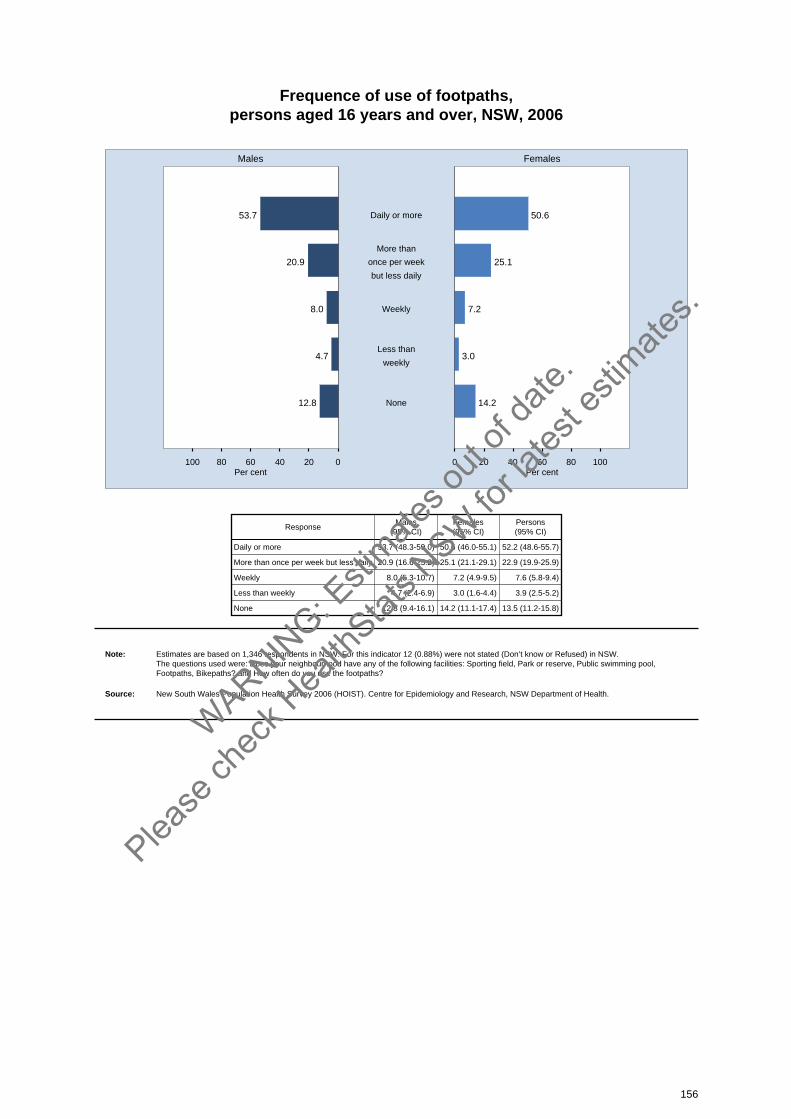
Frequence of use of footpaths, persons aged 16 years and over, NSW, 2006
020406080100 0 20 40 60 80 100
Males Females
Per cent Per cent
53.7 50.6Daily or more
20.9 25.1
More than
once per week
but less daily
8.0 7.2Weekly
4.7 3.0Less than
weekly
12.8 14.2None
ResponseMales
(95% CI)Females(95% CI)
Persons(95% CI)
Daily or more 53.7 (48.3-59.0) 50.6 (46.0-55.1) 52.2 (48.6-55.7)
More than once per week but less daily 20.9 (16.6-25.2) 25.1 (21.1-29.1) 22.9 (19.9-25.9)
Weekly 8.0 (5.3-10.7) 7.2 (4.9-9.5) 7.6 (5.8-9.4)
Less than weekly 4.7 (2.4-6.9) 3.0 (1.6-4.4) 3.9 (2.5-5.2)
None 12.8 (9.4-16.1) 14.2 (11.1-17.4) 13.5 (11.2-15.8)
Note: Estimates are based on 1,346 respondents in NSW. For this indicator 12 (0.88%) were not stated (Don’t know or Refused) in NSW. The questions used were: Does your neighbourhood have any of the following facilities: Sporting field, Park or reserve, Public swimming pool,Footpaths, Bikepaths? and How often do you use the footpaths?
Source: New South Wales Population Health Survey 2006 (HOIST). Centre for Epidemiology and Research, NSW Department of Health.
156
WARNIN
G: Esti
mates o
ut of
date.
Please
chec
k Hea
lthStat
s NSW
for la
test e
stimate
s.
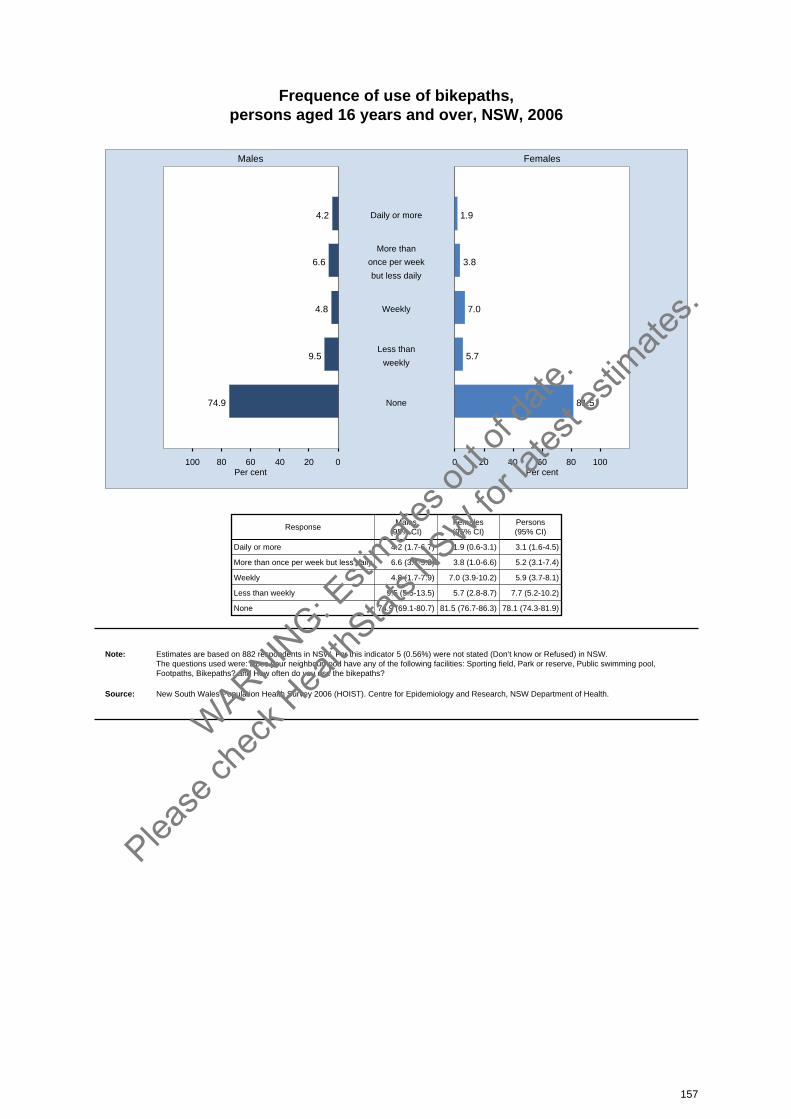
Frequence of use of bikepaths, persons aged 16 years and over, NSW, 2006
020406080100 0 20 40 60 80 100
Males Females
Per cent Per cent
4.2 1.9Daily or more
6.6 3.8
More than
once per week
but less daily
4.8 7.0Weekly
9.5 5.7Less than
weekly
74.9 81.5None
ResponseMales
(95% CI)Females(95% CI)
Persons(95% CI)
Daily or more 4.2 (1.7-6.7) 1.9 (0.6-3.1) 3.1 (1.6-4.5)
More than once per week but less daily 6.6 (3.4-9.8) 3.8 (1.0-6.6) 5.2 (3.1-7.4)
Weekly 4.8 (1.7-7.9) 7.0 (3.9-10.2) 5.9 (3.7-8.1)
Less than weekly 9.5 (5.5-13.5) 5.7 (2.8-8.7) 7.7 (5.2-10.2)
None 74.9 (69.1-80.7) 81.5 (76.7-86.3) 78.1 (74.3-81.9)
Note: Estimates are based on 882 respondents in NSW. For this indicator 5 (0.56%) were not stated (Don’t know or Refused) in NSW. The questions used were: Does your neighbourhood have any of the following facilities: Sporting field, Park or reserve, Public swimming pool,Footpaths, Bikepaths? and How often do you use the bikepaths?
Source: New South Wales Population Health Survey 2006 (HOIST). Centre for Epidemiology and Research, NSW Department of Health.
157
WARNIN
G: Esti
mates o
ut of
date.
Please
chec
k Hea
lthStat
s NSW
for la
test e
stimate
s.
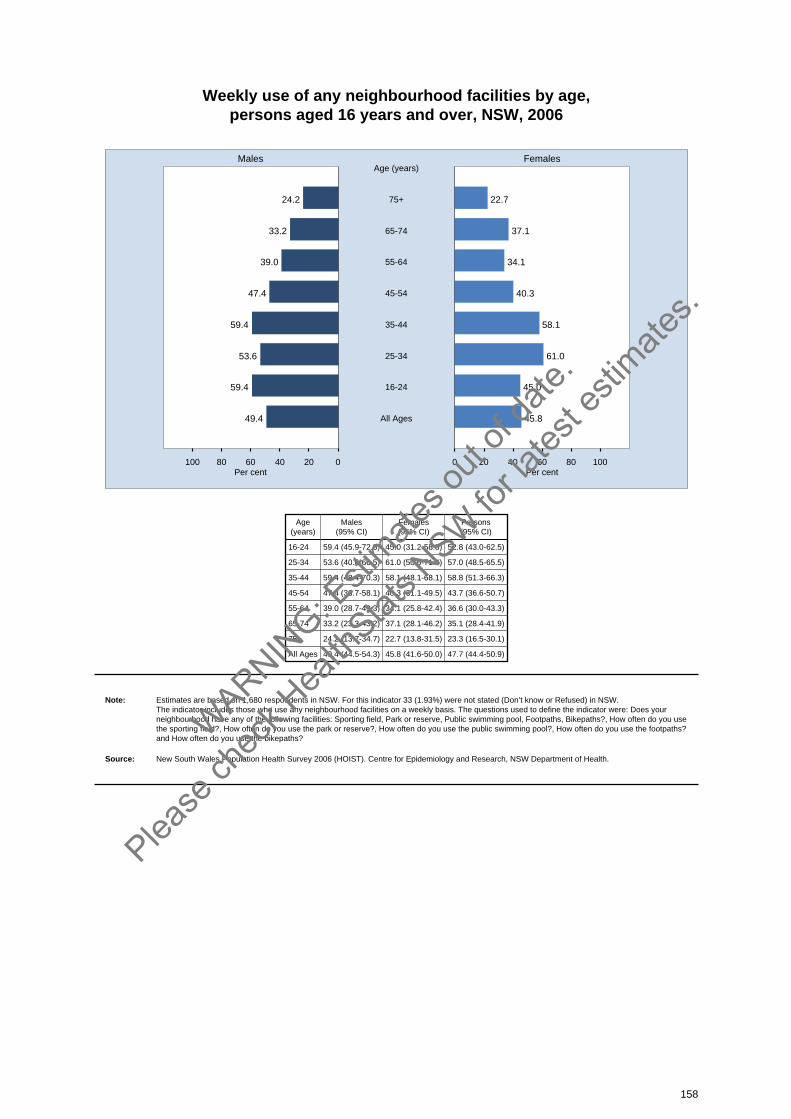
Weekly use of any neighbourhood facilities by age, persons aged 16 years and over, NSW, 2006
020406080100 0 20 40 60 80 100
Males Females
Per cent Per cent
24.2 22.775+
Age (years)
33.2 37.165-74
39.0 34.155-64
47.4 40.345-54
59.4 58.135-44
53.6 61.025-34
59.4 45.016-24
49.4 45.8All Ages
Age(years)
Males(95% CI)
Females(95% CI)
Persons(95% CI)
16-24 59.4 (45.9-72.8) 45.0 (31.2-58.8) 52.8 (43.0-62.5)
25-34 53.6 (40.6-66.5) 61.0 (50.6-71.4) 57.0 (48.5-65.5)
35-44 59.4 (48.4-70.3) 58.1 (48.1-68.1) 58.8 (51.3-66.3)
45-54 47.4 (36.7-58.1) 40.3 (31.1-49.5) 43.7 (36.6-50.7)
55-64 39.0 (28.7-49.3) 34.1 (25.8-42.4) 36.6 (30.0-43.3)
65-74 33.2 (23.3-43.2) 37.1 (28.1-46.2) 35.1 (28.4-41.9)
75+ 24.2 (13.7-34.7) 22.7 (13.8-31.5) 23.3 (16.5-30.1)
All Ages 49.4 (44.5-54.3) 45.8 (41.6-50.0) 47.7 (44.4-50.9)
Note: Estimates are based on 1,680 respondents in NSW. For this indicator 33 (1.93%) were not stated (Don’t know or Refused) in NSW. The indicator includes those who use any neighbourhood facilities on a weekly basis. The questions used to define the indicator were: Does yourneighbourhood have any of the following facilities: Sporting field, Park or reserve, Public swimming pool, Footpaths, Bikepaths?, How often do you usethe sporting field?, How often do you use the park or reserve?, How often do you use the public swimming pool?, How often do you use the footpaths?and How often do you use the bikepaths?
Source: New South Wales Population Health Survey 2006 (HOIST). Centre for Epidemiology and Research, NSW Department of Health.
158
WARNIN
G: Esti
mates o
ut of
date.
Please
chec
k Hea
lthStat
s NSW
for la
test e
stimate
s.
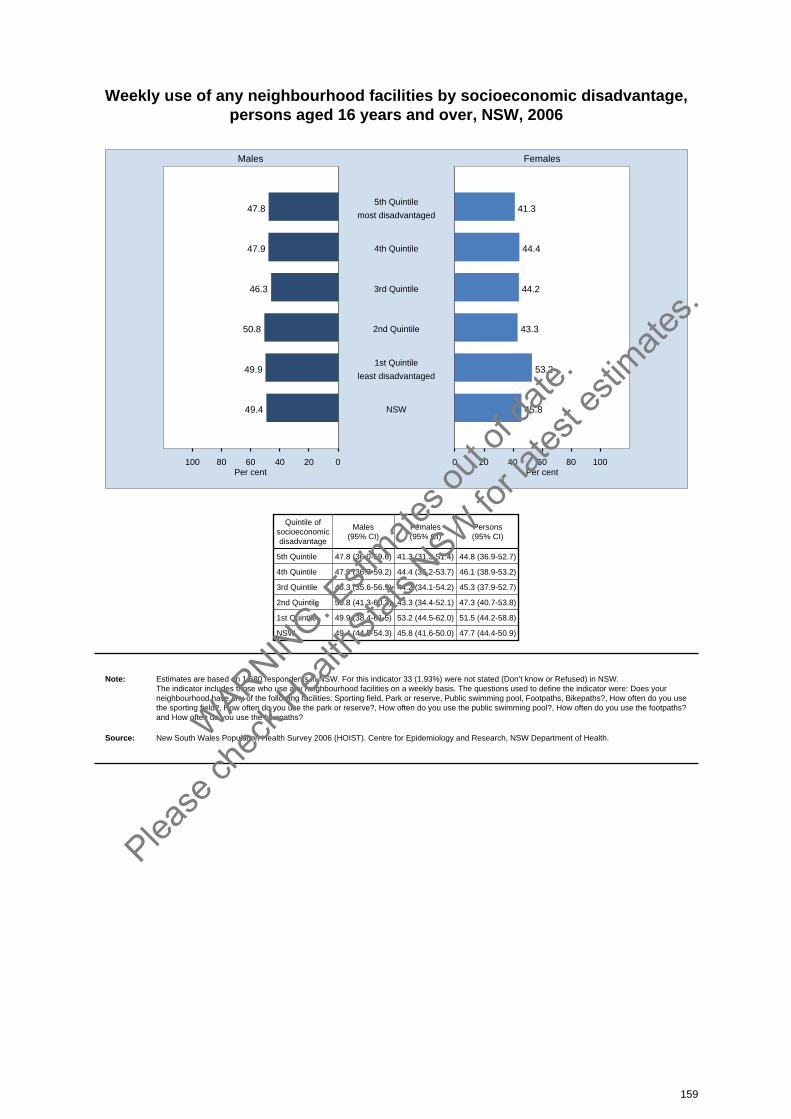
Weekly use of any neighbourhood facilities by socioeconomic disadvantage, persons aged 16 years and over, NSW, 2006
020406080100 0 20 40 60 80 100
Males Females
Per cent Per cent
47.8 41.35th Quintile
most disadvantaged
47.9 44.44th Quintile
46.3 44.23rd Quintile
50.8 43.32nd Quintile
49.9 53.21st Quintile
least disadvantaged
49.4 45.8NSW
Quintile ofsocioeconomicdisadvantage
Males(95% CI)
Females(95% CI)
Persons(95% CI)
5th Quintile 47.8 (36.0-59.6) 41.3 (31.3-51.4) 44.8 (36.9-52.7)
4th Quintile 47.9 (36.7-59.2) 44.4 (35.2-53.7) 46.1 (38.9-53.2)
3rd Quintile 46.3 (35.6-56.9) 44.2 (34.1-54.2) 45.3 (37.9-52.7)
2nd Quintile 50.8 (41.3-60.3) 43.3 (34.4-52.1) 47.3 (40.7-53.8)
1st Quintile 49.9 (38.4-61.5) 53.2 (44.5-62.0) 51.5 (44.2-58.8)
NSW 49.4 (44.5-54.3) 45.8 (41.6-50.0) 47.7 (44.4-50.9)
Note: Estimates are based on 1,680 respondents in NSW. For this indicator 33 (1.93%) were not stated (Don’t know or Refused) in NSW. The indicator includes those who use any neighbourhood facilities on a weekly basis. The questions used to define the indicator were: Does yourneighbourhood have any of the following facilities: Sporting field, Park or reserve, Public swimming pool, Footpaths, Bikepaths?, How often do you usethe sporting field?, How often do you use the park or reserve?, How often do you use the public swimming pool?, How often do you use the footpaths?and How often do you use the bikepaths?
Source: New South Wales Population Health Survey 2006 (HOIST). Centre for Epidemiology and Research, NSW Department of Health.
159
WARNIN
G: Esti
mates o
ut of
date.
Please
chec
k Hea
lthStat
s NSW
for la
test e
stimate
s.

Weekly use of any neighbourhood facilities by health area, persons aged 16 years and over, NSW, 2006
0 20 40 60 80 100 0 20 40 60 80 100
Males Females
Per cent Per cent
Sydney South West
South Eastern Sydney& Illawarra
Sydney West
Northern Sydney &Central Coast
Hunter & New England
North Coast
Greater Southern
Greater Western
Urban
Rural
NSW
AreaMales
(95% CI)Females(95% CI)
Persons(95% CI)
Sydney South West 49.6 (38.4-60.8) 43.3 (32.9-53.6) 46.7 (39.0-54.4)
South Eastern Sydney & Illawarra 56.0 (44.2-67.7) 61.2 (51.3-71.2) 58.5 (50.8-66.2)
Sydney West 54.0 (40.9-67.1) 39.2 (29.1-49.2) 47.0 (38.3-55.7)
Northern Sydney & Central Coast 53.7 (42.6-64.9) 49.8 (39.9-59.6) 51.7 (44.3-59.1)
Hunter & New England 41.7 (29.1-54.2) 33.9 (23.2-44.6) 38.2 (29.8-46.7)
North Coast 32.0 (17.5-46.6) 27.8 (16.7-38.8) 30.1 (20.7-39.4)
Greater Southern 39.0 (24.1-53.9) 40.2 (28.9-51.4) 39.6 (30.0-49.1)
Greater Western 27.5 (13.3-41.7) 30.7 (20.9-40.4) 29.0 (20.4-37.7)
Urban 53.2 (47.4-59.1) 49.3 (44.2-54.3) 51.3 (47.4-55.2)
Rural 37.4 (30.0-44.7) 33.7 (27.9-39.6) 35.7 (30.9-40.5)
NSW 49.4 (44.5-54.3) 45.8 (41.6-50.0) 47.7 (44.4-50.9)
Note: Estimates are based on 1,680 respondents in NSW. For this indicator 33 (1.93%) were not stated (Don’t know or Refused) in NSW. The indicator includes those who use any neighbourhood facilities on a weekly basis. The questions used to define the indicator were: Does yourneighbourhood have any of the following facilities: Sporting field, Park or reserve, Public swimming pool, Footpaths, Bikepaths?, How often do you usethe sporting field?, How often do you use the park or reserve?, How often do you use the public swimming pool?, How often do you use the footpaths?and How often do you use the bikepaths?
Source: New South Wales Population Health Survey 2006 (HOIST). Centre for Epidemiology and Research, NSW Department of Health.
160
WARNIN
G: Esti
mates o
ut of
date.
Please
chec
k Hea
lthStat
s NSW
for la
test e
stimate
s.

Smoking
IntroductionTobacco smoking is the leading cause of preventable mortality and morbidity in New South Wales.While the relationship between smoking, lung cancer, and cardiovascular disease has long beenevidenced, a substantial number of other diseases are now known to be associated with smoking,including: cancers of the stomach, bladder, cervix, uterus, oesophagus, mouth, larynx, pancreas, andkidney; leukemia; chronic obstructive pulmonary disease and pneumonia; respiratory effects in uteroand infancy (including sudden infant death syndrome), childhood, adolescence and adulthood; fetaldeath and stillbirths; problems with fertility; low birthweight; complications in pregnancy; cataract; hipfractures; low bone density; peptic ulcers in persons who are Heliobacter pylori positive; and periodontitis.
Smoking diminishes the overall health of smokers and contributes to widespread organ damage. Assmokers need to be aware that smoking carries far greater risks than the most widely known diseases,health care providers should use this new evidence to counsel their patients against smoking.Smokers who quit can lower their risk of a wide range of diseases and improve their health generally.Those who have never smoked can avoid the burden of disease and the years of lost life smoking causes.[1]
Exposure to environmental tobacco smoke (passive smoking) is a significant cause of preventablemortality and morbidity in New South Wales. Passive smoking causes lung, nasal and sinus cancer;stroke and ischemic heart disease in adults; lower respiratory infections (croup, bronchitis, bronchiolitisand pneumonia), onset of asthma and worsening of asthma, respiratory symptoms, reduced lungfunction, middle-ear disease, and eye and nasal irritation in children; reduced birthweight; and suddeninfant death syndrome in infants. There is also a causal association between passive smoking andcervical cancer; decreased pulmonary function and exacerbation of cystic fibrosis in adults; andcardiovascular health and the development of neurodevelopmental and behavioural problems inchildren. The risk of breast cancer appears to increase with passive smoking during puberty but notwith overall lifetime exposure. Most of the evidence of harm caused by passive smoking is based onstudies in the home environment; however, passive smoking is harmful wherever it takes place.[2]
In New South Wales there are several pieces of legislation relating to the control of environmentaltobacco smoke: the Smoke-free Environment Amendment Act 2004; the Smoke-free EnvironmentAmendment Regulation 2005; and the Smoke-free Environment Amendment (Enclosed Places)Regulation 2006, which provide for 3 incremental phases in the lead up to a total smoking ban inenclosed public areas of licensed premises by July 2007. Also, the Smoke-free Environment Act 2000and the Smoke-free Environment Regulation 2000 both ban smoking in most other enclosed publicplaces. Further information about legislation relating to environmental tobacco smoke is available fromthe NSW Department of Health’s Tobacco and Health website.[3]
In 2006 the New South Wales Population Health Survey asked respondents: Which of the followingbest describes your smoking status: I smoke daily, I smoke occasionally, I don’t smoke now but I usedto, I’ve tried it a few times but never smoked regularly, I’ve never smoked? The last time you went toyour general practitioner, was your smoking discussed and were you advised to quit smoking? Whichof the following best describes your home situation: My home is smoke-free, People occasionallysmoke in the house, People frequently smoke in the house? Are people allowed to smoke in your car?If there was a total ban on smoking in hotels and licensed bars would you go there: More often, Lessoften, and It would make no difference? If there was a total ban on smoking in outdoor dining areaswould you go there: More often, Less often, It would make no difference?
161
WARNIN
G: Esti
mates o
ut of
date.
Please
chec
k Hea
lthStat
s NSW
for la
test e
stimate
s.
Results Current smoking
Overall, in 2006, 13.9 per cent smoked daily, 3.8 per cent smoked occasionally, 25.3 per cent did notbut used to smoke, 10.3 per cent tried smoking a few times but never regularly smoked, and 46.7 percent never smoked. Therefore, 17.7 per cent of adults were current (daily or occasional) smokers. Asignificantly higher proportion of males (19.2 per cent) than females (16.2 per cent) were currentsmokers. Among males, a significantly higher proportion of adults aged 25-34 years (29.4 per cent),and a significantly lower proportion of adults aged 65-74 years (9.4 per cent) and 75 years and over(3.1 per cent), were current smokers, compared with the overall adult male population. Amongfemales, a significantly higher proportion of adults aged 25-34 years (22.3 per cent), and a significantlylower proportion of adults aged 65-74 years (7.6 per cent) and 75 years and over (4.6 per cent), werecurrent smokers, compared with the overall adult female population.
There was no significant variation between the proportion of adults in rural areas and urban areas whowere current smokers; however, a higher proportion of adults in the Greater Western Health Area(22.7 per cent), and a lower proportion of adults in the Northern Sydney & Central Coast Health Area(14.2 per cent), were current smokers.
The proportion of adults who were current smokers increased with socioeconomic disadvantage. Ahigher proportion of adults in the most disadvantaged quintile (24.3 per cent), and a lower proportionof adults in the 2 least disadvantaged quintiles (12.9 per cent and 14.9 per cent), were currentsmokers, compared with the overall adult population.
There was a significant decrease in the prevalence of current smoking between 1997 (24.0 per cent)and 2005 (17.7 per cent). The significant decrease was in both males (27.1 per cent to 19.2 per cent)and females (21.1 per cent to 16.2 per cent).
Daily smoking
Overall, in 2006, 13.9 per cent of adults smoked daily. There was no significant variation betweenmales and females who smoked daily. A significantly higher proportion of adults aged 25-34 years(18.0 per cent) and 35-44 years (18.4 per cent), and a significantly lower proportion of adults aged55-64 years (11.5 per cent) and 65-74 years (7.0 per cent) and 75 years and over (3.1 per cent),smoked daily, compared with the overall adult population.
A significantly higher proportion of adults in rural areas (15.8 per cent) than urban areas (13.1 percent) smoked daily. A higher proportion of adults in the Greater Western Health Area (19.5 per cent),and a lower proportion of adults in the Northern Sydney & Central Coast Health Area (10.3 per cent),smoked daily.
The proportion of adults who smoked daily increased with socioeconomic disadvantage. A higherproportion of adults in the most disadvantaged quintile (18.3 per cent), and a lower proportion of adultsin the 2 least disadvantaged quintiles (8.8 per cent and 11.4 per cent), smoked daily, compared withthe overall adult population.
There was a significant decrease in the prevalence of daily smoking between 2002 (16.4 per cent) and2006 (13.9 per cent). This decrease was significant in males (18.5 per cent to 15.0 per cent).
Advice to quit smoking
Overall, in 2006, 48.4 per cent of adults who smoked were advised to quit smoking the last time theyvisited their general practitioner. There was no significant variation between males and females whowere advised to quit smoking. A significantly lower proportion of adults aged 16-24 years (30.4 percent), and a significantly higher proportion of adults aged 45-54 years (61.6 per cent) and 65-74 years(63.2 per cent), were advised to quit smoking, compared with the overall adult population.
There was no significant variation between adults in rural areas and urban areas, or by level ofsocioeconomic disadvantage; however, a higher proportion of adults in the South Eastern Sydney &Illawarra Health Area (59.5 per cent) were advised to quit smoking, compared with the overall adultpopulation. There was no significant variation in the proportion of adults who were advised to quitsmoking between 2005 and 2006.
162
WARNIN
G: Esti
mates o
ut of
date.
Please
chec
k Hea
lthStat
s NSW
for la
test e
stimate
s.
Smoking in the home
Overall, in 2006, 87.7 per cent of adults lived in smoke-free homes. The proportion of adults living in asmoke-free home was significantly lower among those aged 16-24 years (82.5 per cent), andsignificantly higher among those aged 65-74 years (92.2 per cent) and 75 years and over (93.1 percent), compared with the overall adult population.
There was no significant variation in the proportion of adults in rural areas and urban areas living insmoke-free homes; however, a higher proportion of adults in the Northern Sydney & Central CoastHealth Area (92.4 per cent), and a lower proportion of adults in the Sydney South West (84.7 per cent)and Greater Western (82.4 per cent) Health Areas, lived in smoke-free homes, compared with theoverall adult population.
The proportion of adults living in smoke-free homes increased as socioeconomic disadvantagedecreased. Compared to the overall population, the least disadvantaged quintile (93.8 per cent) had ahigher proportion of adults living in smoke-free homes, and the most disadvantaged quintile (81.7 percent) had a lower proportion of adults living in smoke-free homes.
There has been a significant increase in the proportion of adults living in smoke-free homes between1997 (69.7 per cent) and 2006 (87.7 per cent). This increase was significant in both males (69.4 percent to 87.1 per cent) and females (70.0 per cent to 88.2 per cent).
Smoking in cars
Overall, in 2006, 87.7 per cent of adults had smoke-free cars. A significantly higher proportion ofadults aged 65-74 years (92.6 per cent) and 75 years and over (92.1 per cent) had smoke-free cars.
There was no significant variation in the proportion of adults in rural areas and urban areas withsmoke-free cars; however, a higher proportion of adults in the Northern Sydney & Central CoastHealth Area (90.3 per cent), and a lower proportion of adults in the Greater Western Health Area (84.3per cent), had smoke-free cars, compared with the overall adult population.
The proportion of smoke-free cars decreased as socioeconomic disadvantage increased. Comparedto the overall adult population, the most disadvantaged quintile (84.4 per cent) had a lower proportionof adults with smoke-free cars.
There has been a significant increase in the proportion of smoke-free cars, from 81.2 per cent in 2003to 87.7 per cent in 2006. This increase was significant in both males (77.9 per cent to 85.3 per cent)and females (84.6 per cent to 90.0 per cent).
Smoking in hotels and licensed premises
Overall, in 2006, 35.0 per cent of adults would be more likely to frequent hotels and licensed premisesif there was a total ban on smoking. A significantly higher proportion of females (36.7 per cent) thanmales (33.3 per cent) would be more likely to frequent hotels and licensed premises if there was atotal ban on smoking. Among males, a significantly lower proportion of adults aged 75 years and over(22.3 per cent) would be more likely to frequent hotels and licensed premises if there was a total banon smoking, compared with the overall adult male population. Among females, a significantly lowerproportion of adults aged 75 years and over (21.3 per cent) would be more likely to frequent hotelsand licensed premises if there was a total ban on smoking, compared with the overall adult female population.
A significantly lower proportion of adults in rural areas (31.6 per cent) than urban areas (36.5 per cent)would be more likely to frequent hotels and licensed premises if there was a total ban on smoking,compared with the overall adult population. A higher proportion of adults in the Northern Sydney &Central Coast Health Area (39.7 per cent), and a lower proportion of adults in the Greater WesternHealth Area (28.8 per cent) 39.7 per cent), would be more likely to frequent hotels and licensedpremises if there was a total ban on smoking, compared with the overall adult population.
163
WARNIN
G: Esti
mates o
ut of
date.
Please
chec
k Hea
lthStat
s NSW
for la
test e
stimate
s.
A higher proportion of adults in the 2 least disadvantaged quintiles (40.8 per cent and 39.4 per cent),and a lower proportion of adults in the third most disadvantaged quintile (31.6 per cent) and mostdisadvantaged quintile (28.4 per cent), would be more likely to frequent hotels and licensed premises ifthere was a total ban on smoking, compared with the overall adult population.
The proportion of adults who would be more likely to frequent hotels and licensed premises if therewas a total ban on smoking has increased significantly from 24.2 per cent in 2003 to 35.5 per cent in2006. The significant increase was observed in both males (23.1 per cent to 33.3 per cent) andfemales (25.5 per cent to 36.7 per cent).
Overall, in 2006, 6.6 per cent of adults would be less likely to frequent hotels and licensed premises ifthere was a total ban on smoking. A significantly lower proportion of females (5.6 per cent) than males(7.5 per cent) would be less likely to frequent hotels and licensed premises if there was a total ban onsmoking. Among males, a significantly lower proportion of adults aged 55-64 years (4.5 per cent) and65-74 years (4.0 per cent) and 75 years and over (2.7 per cent), and a significantly higher proportionof adults aged 25-34 years (13.1 per cent), would be less likely to frequent hotels and licensedpremises if there was a total ban on smoking, compared with the overall adult male population. Amongfemales, a significantly lower proportion of adults aged 65-74 years (2.5 per cent) and 75 years andover (2.3 per cent) would be less likely to frequent hotels and licensed premises if there was a totalban on smoking, compared with the overall adult female population.
There was no significant variation between rural areas and urban areas or among health areas.
A lower proportion of adults in the least disadvantaged quintile (4.6 per cent), and a higher proportionof adults in the most disadvantaged quintile (9.4 per cent), would be less likely to frequent hotels andlicensed premises if there was a total ban on smoking, compared with the overall adult population.
The proportion of adults who would be less likely to frequent hotels and licensed premises if there wasa total ban on smoking has decreased significantly from 9.8 per cent in 2003 to 6.6 per cent in 2006.This decrease was significant in both males (10.5 per cent to 7.5 per cent) and females (8.9 per centto 5.6 per cent).
Smoking in outdoor dining areas
Overall, in 2006, 38.2 per cent of adults would be more likely to frequent outdoor dining areas if therewas a total ban on smoking. A significantly higher proportion of females (40.4 per cent) than males(36.0 per cent) would be more likely to frequent outdoor dining areas if there was a total ban onsmoking. Among males, there was no significant variation by age group. Among females, asignificantly lower proportion of adults aged 75 years and over (29.7 per cent) would be more likely tofrequent outdoor dining areas if there was a total ban on smoking, compared with the overall adultfemale population.
A significantly lower proportion of adults in rural areas (35.9 per cent) than urban areas (39.2 per cent)would be more likely to frequent outdoor dining areas if there was a total ban on smoking, comparedwith the overall adult population. A lower proportion of adults in the Greater Western Health Area (32.1per cent) would be more likely to frequent outdoor dining areas if there was a total ban on smoking,compared with the overall adult population.
A higher proportion of adults in the least disadvantaged quintile (44.2 per cent), and a lower proportionof adults in the most disadvantaged quintile (31.7 per cent), would be more likely to frequent outdoordining areas if there was a total ban on smoking, compared with the overall adult population.
Overall, in 2006, 6.3 per cent of adults would be less likely to frequent outdoor dining areas if therewas a total ban on smoking. There was no variation between males and females. A significantly lowerproportion of adults aged 65-74 years (3.0 per cent) and 75 years and over (2.1 per cent) would beless likely to frequent outdoor dining areas if there was a total ban on smoking, compared with theoverall adult population.
A significantly lower proportion of adults in rural areas (5.2 per cent) than urban areas (6.9 per cent)would be less likely to frequent outdoor dining areas if there was a total ban on smoking, comparedwith the overall adult population. A higher proportion of adults in the Sydney South West Health Area(9.0 per cent) would be less likely to frequent outdoor dining areas if there was a total ban on smoking,
164
WARNIN
G: Esti
mates o
ut of
date.
Please
chec
k Hea
lthStat
s NSW
for la
test e
stimate
s.
compared with the overall adult population.
A higher proportion of adults in the most disadvantaged quintile (9.0 per cent) would be less likely tofrequent outdoor dining areas if there was a total ban on smoking, compared with the overall adult population.
References1. United States Department of Health and Human Services. The Health Consequences of Smoking:
A Report of the Surgeon-General. Atlanta: United States Department of Health and HumanServices, Centers for Disease Control and Prevention, Office on Smoking and Health, 2004.Available online at www.cdc.gov/tobacco/sgr/sgr_2004/index.htm (accessed 9 May 2007).
2. Commonwealth Department of Health and Ageing and the National Drug Strategy. EnvironmentalTobacco Smoke in Australia. Canberra: Commonwealth Department of Health and Ageing, 2002.Available online atwww.health.gov.au/internet/wcms/publishing.nsf/Content/health-pubhlth-publicat-document-env_ets-cnt.htm/$file/env_ets.pdf
(accessed 9 May 2007). 3. Centre for Chronic Disease Prevention and Health Advancement, Tobacco and Health Branch
Website. The Law and Policy. Sydney: NSW Department of Health, 2007. Available online atwww.health.nsw.gov.au/public-health/health-promotion/tobacco/legislation/index.html (accessed 9May 2007).
165
WARNIN
G: Esti
mates o
ut of
date.
Please
chec
k Hea
lthStat
s NSW
for la
test e
stimate
s.
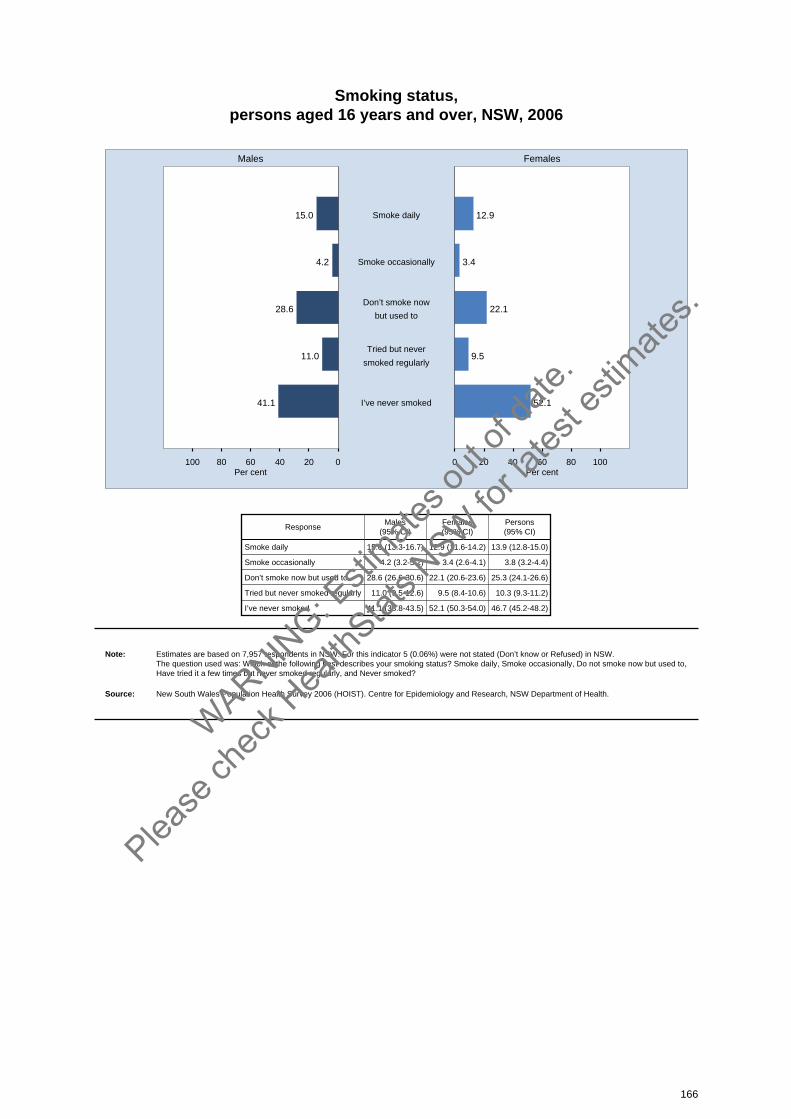
Smoking status, persons aged 16 years and over, NSW, 2006
020406080100 0 20 40 60 80 100
Males Females
Per cent Per cent
15.0 12.9Smoke daily
4.2 3.4Smoke occasionally
28.6 22.1Don’t smoke now
but used to
11.0 9.5Tried but never
smoked regularly
41.1 52.1I’ve never smoked
ResponseMales
(95% CI)Females(95% CI)
Persons(95% CI)
Smoke daily 15.0 (13.3-16.7) 12.9 (11.6-14.2) 13.9 (12.8-15.0)
Smoke occasionally 4.2 (3.2-5.2) 3.4 (2.6-4.1) 3.8 (3.2-4.4)
Don’t smoke now but used to 28.6 (26.6-30.6) 22.1 (20.6-23.6) 25.3 (24.1-26.6)
Tried but never smoked regularly 11.0 (9.5-12.6) 9.5 (8.4-10.6) 10.3 (9.3-11.2)
I’ve never smoked 41.1 (38.8-43.5) 52.1 (50.3-54.0) 46.7 (45.2-48.2)
Note: Estimates are based on 7,957 respondents in NSW. For this indicator 5 (0.06%) were not stated (Don’t know or Refused) in NSW. The question used was: Which of the following best describes your smoking status? Smoke daily, Smoke occasionally, Do not smoke now but used to,Have tried it a few times but never smoked regularly, and Never smoked?
Source: New South Wales Population Health Survey 2006 (HOIST). Centre for Epidemiology and Research, NSW Department of Health.
166
WARNIN
G: Esti
mates o
ut of
date.
Please
chec
k Hea
lthStat
s NSW
for la
test e
stimate
s.
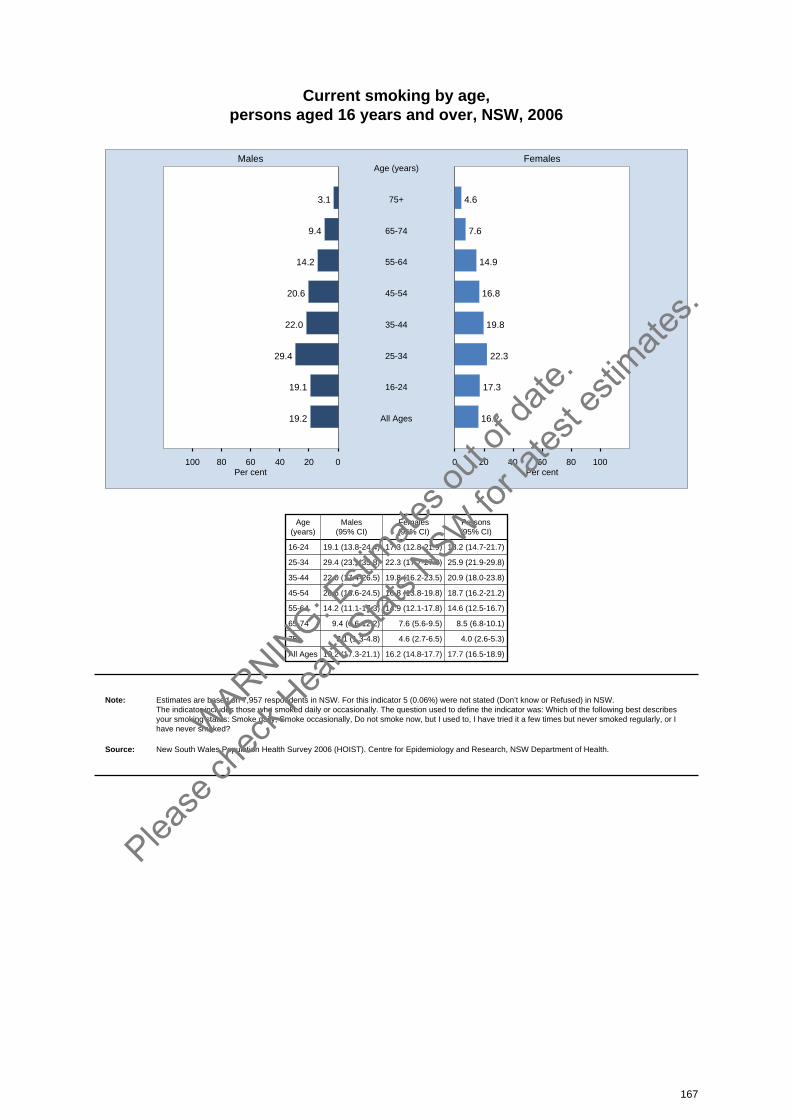
Current smoking by age, persons aged 16 years and over, NSW, 2006
020406080100 0 20 40 60 80 100
Males Females
Per cent Per cent
3.1 4.675+
Age (years)
9.4 7.665-74
14.2 14.955-64
20.6 16.845-54
22.0 19.835-44
29.4 22.325-34
19.1 17.316-24
19.2 16.2All Ages
Age(years)
Males(95% CI)
Females(95% CI)
Persons(95% CI)
16-24 19.1 (13.8-24.4) 17.3 (12.8-21.9) 18.2 (14.7-21.7)
25-34 29.4 (23.1-35.8) 22.3 (17.7-27.0) 25.9 (21.9-29.8)
35-44 22.0 (17.4-26.5) 19.8 (16.2-23.5) 20.9 (18.0-23.8)
45-54 20.6 (16.6-24.5) 16.8 (13.8-19.8) 18.7 (16.2-21.2)
55-64 14.2 (11.1-17.3) 14.9 (12.1-17.8) 14.6 (12.5-16.7)
65-74 9.4 (6.6-12.2) 7.6 (5.6-9.5) 8.5 (6.8-10.1)
75+ 3.1 (1.3-4.8) 4.6 (2.7-6.5) 4.0 (2.6-5.3)
All Ages 19.2 (17.3-21.1) 16.2 (14.8-17.7) 17.7 (16.5-18.9)
Note: Estimates are based on 7,957 respondents in NSW. For this indicator 5 (0.06%) were not stated (Don’t know or Refused) in NSW. The indicator includes those who smoked daily or occasionally. The question used to define the indicator was: Which of the following best describesyour smoking status: Smoke daily, Smoke occasionally, Do not smoke now, but I used to, I have tried it a few times but never smoked regularly, or Ihave never smoked?
Source: New South Wales Population Health Survey 2006 (HOIST). Centre for Epidemiology and Research, NSW Department of Health.
167
WARNIN
G: Esti
mates o
ut of
date.
Please
chec
k Hea
lthStat
s NSW
for la
test e
stimate
s.
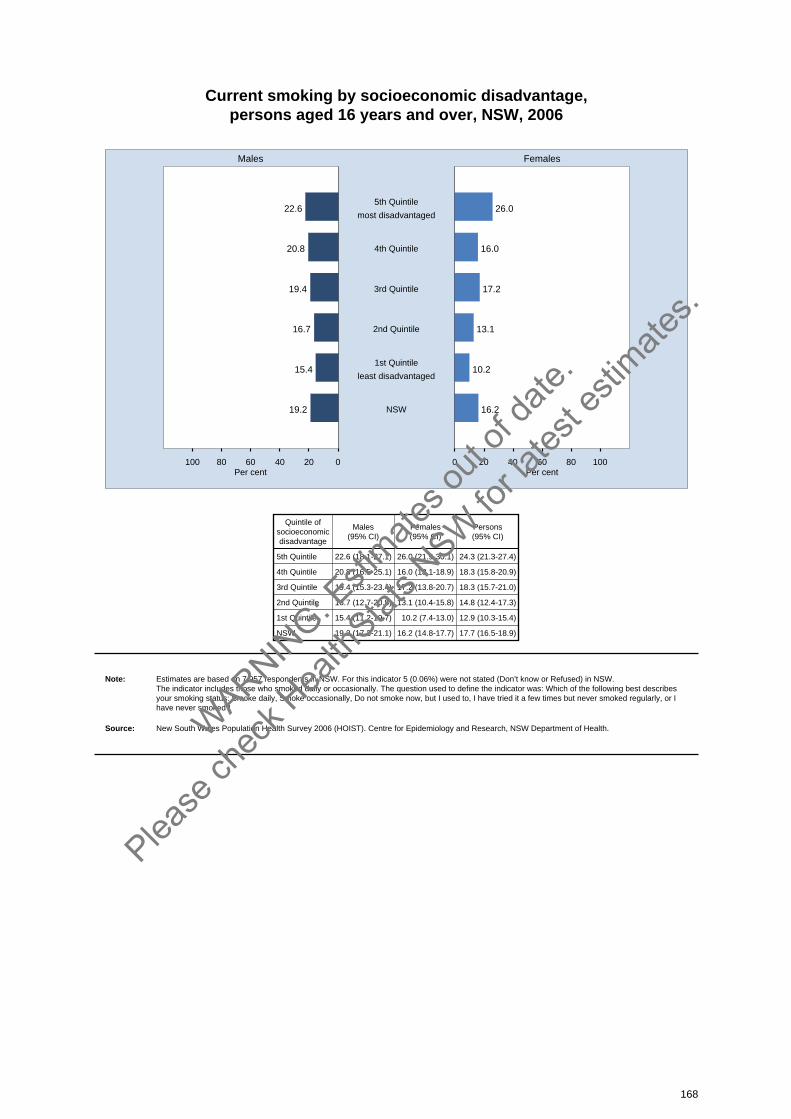
Current smoking by socioeconomic disadvantage, persons aged 16 years and over, NSW, 2006
020406080100 0 20 40 60 80 100
Males Females
Per cent Per cent
22.6 26.05th Quintile
most disadvantaged
20.8 16.04th Quintile
19.4 17.23rd Quintile
16.7 13.12nd Quintile
15.4 10.21st Quintile
least disadvantaged
19.2 16.2NSW
Quintile ofsocioeconomicdisadvantage
Males(95% CI)
Females(95% CI)
Persons(95% CI)
5th Quintile 22.6 (18.1-27.1) 26.0 (21.9-30.1) 24.3 (21.3-27.4)
4th Quintile 20.8 (16.5-25.1) 16.0 (13.1-18.9) 18.3 (15.8-20.9)
3rd Quintile 19.4 (15.3-23.4) 17.2 (13.8-20.7) 18.3 (15.7-21.0)
2nd Quintile 16.7 (12.7-20.8) 13.1 (10.4-15.8) 14.8 (12.4-17.3)
1st Quintile 15.4 (11.2-19.7) 10.2 (7.4-13.0) 12.9 (10.3-15.4)
NSW 19.2 (17.3-21.1) 16.2 (14.8-17.7) 17.7 (16.5-18.9)
Note: Estimates are based on 7,957 respondents in NSW. For this indicator 5 (0.06%) were not stated (Don’t know or Refused) in NSW. The indicator includes those who smoked daily or occasionally. The question used to define the indicator was: Which of the following best describesyour smoking status: Smoke daily, Smoke occasionally, Do not smoke now, but I used to, I have tried it a few times but never smoked regularly, or Ihave never smoked?
Source: New South Wales Population Health Survey 2006 (HOIST). Centre for Epidemiology and Research, NSW Department of Health.
168
WARNIN
G: Esti
mates o
ut of
date.
Please
chec
k Hea
lthStat
s NSW
for la
test e
stimate
s.
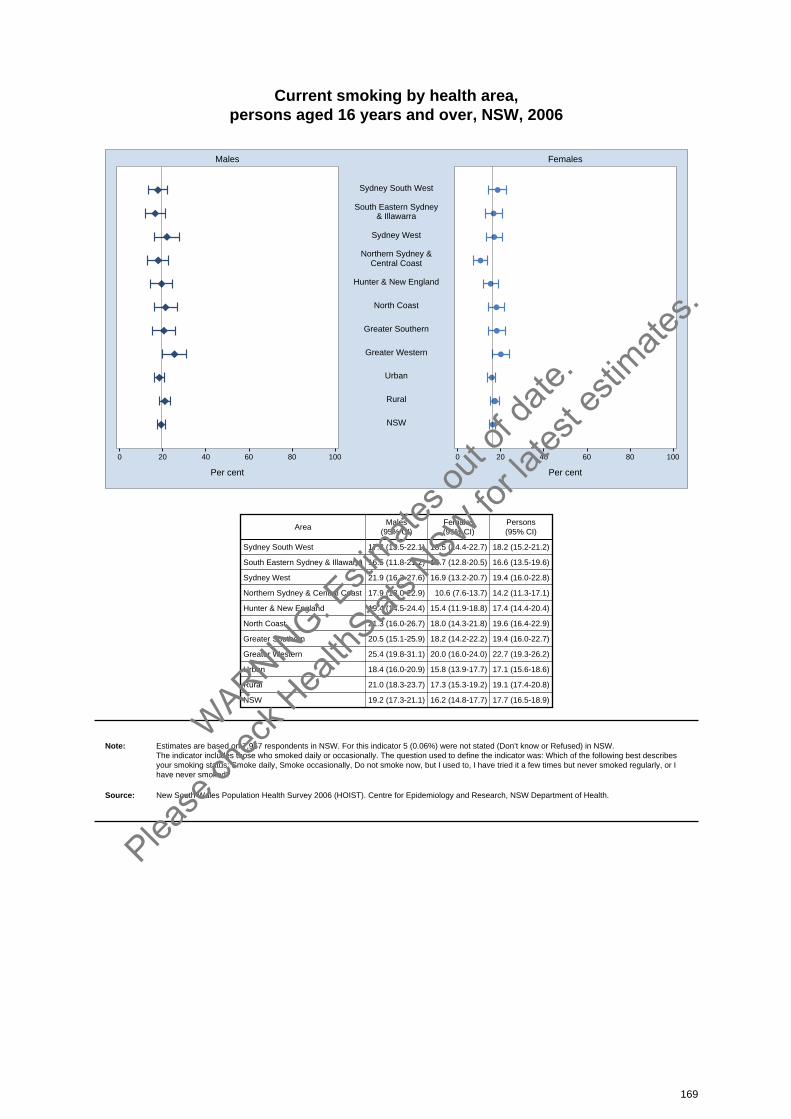
Current smoking by health area, persons aged 16 years and over, NSW, 2006
0 20 40 60 80 100 0 20 40 60 80 100
Males Females
Per cent Per cent
Sydney South West
South Eastern Sydney& Illawarra
Sydney West
Northern Sydney &Central Coast
Hunter & New England
North Coast
Greater Southern
Greater Western
Urban
Rural
NSW
AreaMales
(95% CI)Females(95% CI)
Persons(95% CI)
Sydney South West 17.8 (13.5-22.1) 18.5 (14.4-22.7) 18.2 (15.2-21.2)
South Eastern Sydney & Illawarra 16.5 (11.8-21.2) 16.7 (12.8-20.5) 16.6 (13.5-19.6)
Sydney West 21.9 (16.3-27.6) 16.9 (13.2-20.7) 19.4 (16.0-22.8)
Northern Sydney & Central Coast 17.9 (13.0-22.9) 10.6 (7.6-13.7) 14.2 (11.3-17.1)
Hunter & New England 19.4 (14.5-24.4) 15.4 (11.9-18.8) 17.4 (14.4-20.4)
North Coast 21.3 (16.0-26.7) 18.0 (14.3-21.8) 19.6 (16.4-22.9)
Greater Southern 20.5 (15.1-25.9) 18.2 (14.2-22.2) 19.4 (16.0-22.7)
Greater Western 25.4 (19.8-31.1) 20.0 (16.0-24.0) 22.7 (19.3-26.2)
Urban 18.4 (16.0-20.9) 15.8 (13.9-17.7) 17.1 (15.6-18.6)
Rural 21.0 (18.3-23.7) 17.3 (15.3-19.2) 19.1 (17.4-20.8)
NSW 19.2 (17.3-21.1) 16.2 (14.8-17.7) 17.7 (16.5-18.9)
Note: Estimates are based on 7,957 respondents in NSW. For this indicator 5 (0.06%) were not stated (Don’t know or Refused) in NSW. The indicator includes those who smoked daily or occasionally. The question used to define the indicator was: Which of the following best describesyour smoking status: Smoke daily, Smoke occasionally, Do not smoke now, but I used to, I have tried it a few times but never smoked regularly, or Ihave never smoked?
Source: New South Wales Population Health Survey 2006 (HOIST). Centre for Epidemiology and Research, NSW Department of Health.
169
WARNIN
G: Esti
mates o
ut of
date.
Please
chec
k Hea
lthStat
s NSW
for la
test e
stimate
s.
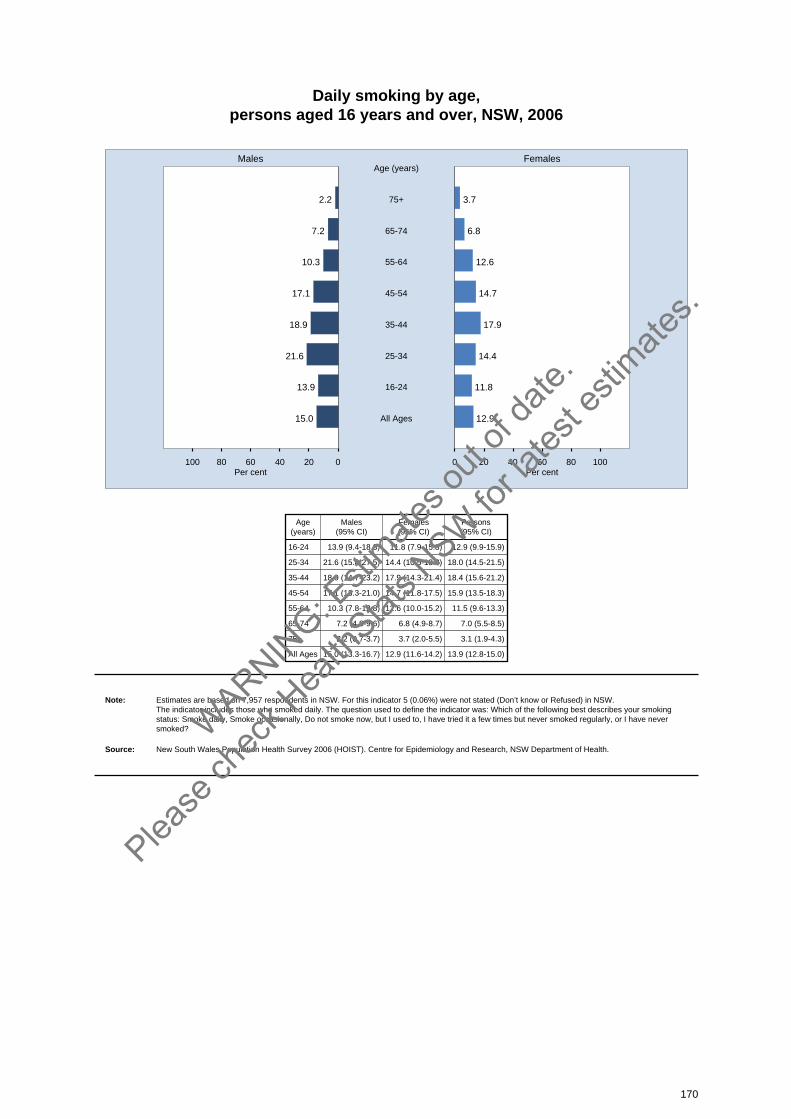
Daily smoking by age, persons aged 16 years and over, NSW, 2006
020406080100 0 20 40 60 80 100
Males Females
Per cent Per cent
2.2 3.775+
Age (years)
7.2 6.865-74
10.3 12.655-64
17.1 14.745-54
18.9 17.935-44
21.6 14.425-34
13.9 11.816-24
15.0 12.9All Ages
Age(years)
Males(95% CI)
Females(95% CI)
Persons(95% CI)
16-24 13.9 (9.4-18.3) 11.8 (7.9-15.8) 12.9 (9.9-15.9)
25-34 21.6 (15.8-27.5) 14.4 (10.5-18.3) 18.0 (14.5-21.5)
35-44 18.9 (14.7-23.2) 17.9 (14.3-21.4) 18.4 (15.6-21.2)
45-54 17.1 (13.3-21.0) 14.7 (11.8-17.5) 15.9 (13.5-18.3)
55-64 10.3 (7.8-12.8) 12.6 (10.0-15.2) 11.5 (9.6-13.3)
65-74 7.2 (4.8-9.6) 6.8 (4.9-8.7) 7.0 (5.5-8.5)
75+ 2.2 (0.7-3.7) 3.7 (2.0-5.5) 3.1 (1.9-4.3)
All Ages 15.0 (13.3-16.7) 12.9 (11.6-14.2) 13.9 (12.8-15.0)
Note: Estimates are based on 7,957 respondents in NSW. For this indicator 5 (0.06%) were not stated (Don’t know or Refused) in NSW. The indicator includes those who smoked daily. The question used to define the indicator was: Which of the following best describes your smokingstatus: Smoke daily, Smoke occasionally, Do not smoke now, but I used to, I have tried it a few times but never smoked regularly, or I have never smoked?
Source: New South Wales Population Health Survey 2006 (HOIST). Centre for Epidemiology and Research, NSW Department of Health.
170
WARNIN
G: Esti
mates o
ut of
date.
Please
chec
k Hea
lthStat
s NSW
for la
test e
stimate
s.

Daily smoking by socioeconomic disadvantage, persons aged 16 years and over, NSW, 2006
020406080100 0 20 40 60 80 100
Males Females
Per cent Per cent
16.8 19.85th Quintile
most disadvantaged
17.7 13.24th Quintile
16.3 14.83rd Quintile
12.1 10.82nd Quintile
10.7 6.91st Quintile
least disadvantaged
15.0 12.9NSW
Quintile ofsocioeconomicdisadvantage
Males(95% CI)
Females(95% CI)
Persons(95% CI)
5th Quintile 16.8 (12.9-20.7) 19.8 (16.1-23.5) 18.3 (15.6-21.0)
4th Quintile 17.7 (13.5-21.8) 13.2 (10.5-15.8) 15.4 (12.9-17.8)
3rd Quintile 16.3 (12.5-20.1) 14.8 (11.6-18.0) 15.6 (13.1-18.1)
2nd Quintile 12.1 (8.4-15.7) 10.8 (8.3-13.3) 11.4 (9.2-13.6)
1st Quintile 10.7 (7.0-14.4) 6.9 (4.6-9.1) 8.8 (6.6-11.0)
NSW 15.0 (13.3-16.7) 12.9 (11.6-14.2) 13.9 (12.8-15.0)
Note: Estimates are based on 7,957 respondents in NSW. For this indicator 5 (0.06%) were not stated (Don’t know or Refused) in NSW. The indicator includes those who smoked daily. The question used to define the indicator was: Which of the following best describes your smokingstatus: Smoke daily, Smoke occasionally, Do not smoke now, but I used to, I have tried it a few times but never smoked regularly, or I have never smoked?
Source: New South Wales Population Health Survey 2006 (HOIST). Centre for Epidemiology and Research, NSW Department of Health.
171
WARNIN
G: Esti
mates o
ut of
date.
Please
chec
k Hea
lthStat
s NSW
for la
test e
stimate
s.
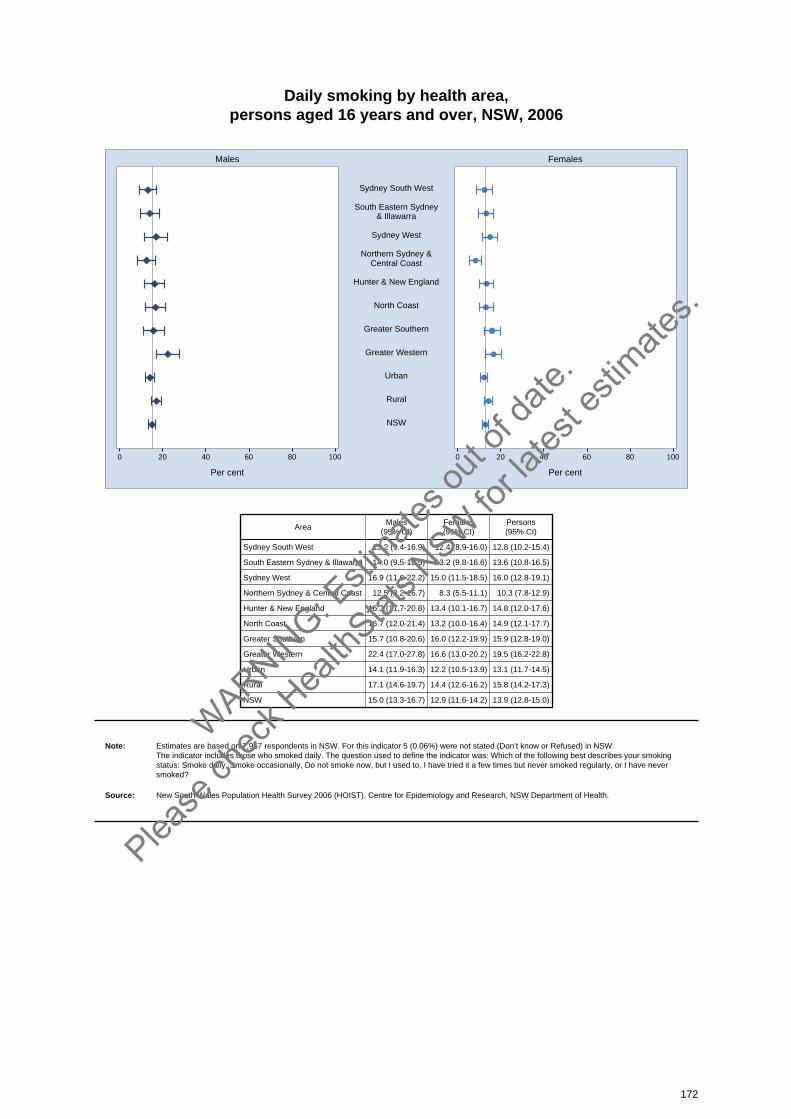
Daily smoking by health area, persons aged 16 years and over, NSW, 2006
0 20 40 60 80 100 0 20 40 60 80 100
Males Females
Per cent Per cent
Sydney South West
South Eastern Sydney& Illawarra
Sydney West
Northern Sydney &Central Coast
Hunter & New England
North Coast
Greater Southern
Greater Western
Urban
Rural
NSW
AreaMales
(95% CI)Females(95% CI)
Persons(95% CI)
Sydney South West 13.2 (9.4-16.9) 12.4 (8.9-16.0) 12.8 (10.2-15.4)
South Eastern Sydney & Illawarra 14.0 (9.5-18.5) 13.2 (9.8-16.6) 13.6 (10.8-16.5)
Sydney West 16.9 (11.6-22.2) 15.0 (11.5-18.5) 16.0 (12.8-19.1)
Northern Sydney & Central Coast 12.5 (8.2-16.7) 8.3 (5.5-11.1) 10.3 (7.8-12.9)
Hunter & New England 16.3 (11.7-20.8) 13.4 (10.1-16.7) 14.8 (12.0-17.6)
North Coast 16.7 (12.0-21.4) 13.2 (10.0-16.4) 14.9 (12.1-17.7)
Greater Southern 15.7 (10.8-20.6) 16.0 (12.2-19.9) 15.9 (12.8-19.0)
Greater Western 22.4 (17.0-27.8) 16.6 (13.0-20.2) 19.5 (16.2-22.8)
Urban 14.1 (11.9-16.3) 12.2 (10.5-13.9) 13.1 (11.7-14.5)
Rural 17.1 (14.6-19.7) 14.4 (12.6-16.2) 15.8 (14.2-17.3)
NSW 15.0 (13.3-16.7) 12.9 (11.6-14.2) 13.9 (12.8-15.0)
Note: Estimates are based on 7,957 respondents in NSW. For this indicator 5 (0.06%) were not stated (Don’t know or Refused) in NSW. The indicator includes those who smoked daily. The question used to define the indicator was: Which of the following best describes your smokingstatus: Smoke daily, Smoke occasionally, Do not smoke now, but I used to, I have tried it a few times but never smoked regularly, or I have never smoked?
Source: New South Wales Population Health Survey 2006 (HOIST). Centre for Epidemiology and Research, NSW Department of Health.
172
WARNIN
G: Esti
mates o
ut of
date.
Please
chec
k Hea
lthStat
s NSW
for la
test e
stimate
s.

Doctor advised to quit smoking by age, persons who are current smokers aged 16 years and over, NSW, 2006
020406080100 0 20 40 60 80 100
Males Females
Per cent Per cent
62.1 61.975+
Age (years)
66.4 59.565-74
49.9 51.255-64
66.4 55.845-54
49.1 55.035-44
36.3 49.225-34
21.4 41.116-24
45.7 51.6All Ages
Age(years)
Males(95% CI)
Females(95% CI)
Persons(95% CI)
16-24 21.4 (9.1-33.6) 41.1 (27.0-55.1) 30.4 (20.9-39.9)
25-34 36.3 (23.9-48.8) 49.2 (37.2-61.2) 42.0 (33.1-50.8)
35-44 49.1 (37.8-60.5) 55.0 (44.8-65.1) 51.9 (44.2-59.6)
45-54 66.4 (56.7-76.0) 55.8 (46.4-65.1) 61.6 (54.7-68.4)
55-64 49.9 (38.4-61.5) 51.2 (40.8-61.6) 50.6 (42.9-58.4)
65-74 66.4 (51.5-81.3) 59.5 (46.4-72.6) 63.2 (53.2-73.3)
75+ 62.1 (34.3-89.9) 61.9 (42.7-81.0) 61.9 (46.2-77.7)
All Ages 45.7 (40.1-51.3) 51.6 (46.7-56.5) 48.4 (44.7-52.2)
Note: Estimates are based on 1,301 respondents in NSW. For this indicator 13 (0.99%) were not stated (Don’t know or Refused) in NSW. The indicator includes those who smoke and were advised to quit smoking the last time they visited their general practitioner. The questions used todefine the indicator were: What is you current smoking status? and The last time you went to your general practitioner, did the doctor discuss yoursmoking and advise you to quit smoking?
Source: New South Wales Population Health Survey 2006 (HOIST). Centre for Epidemiology and Research, NSW Department of Health.
173
WARNIN
G: Esti
mates o
ut of
date.
Please
chec
k Hea
lthStat
s NSW
for la
test e
stimate
s.
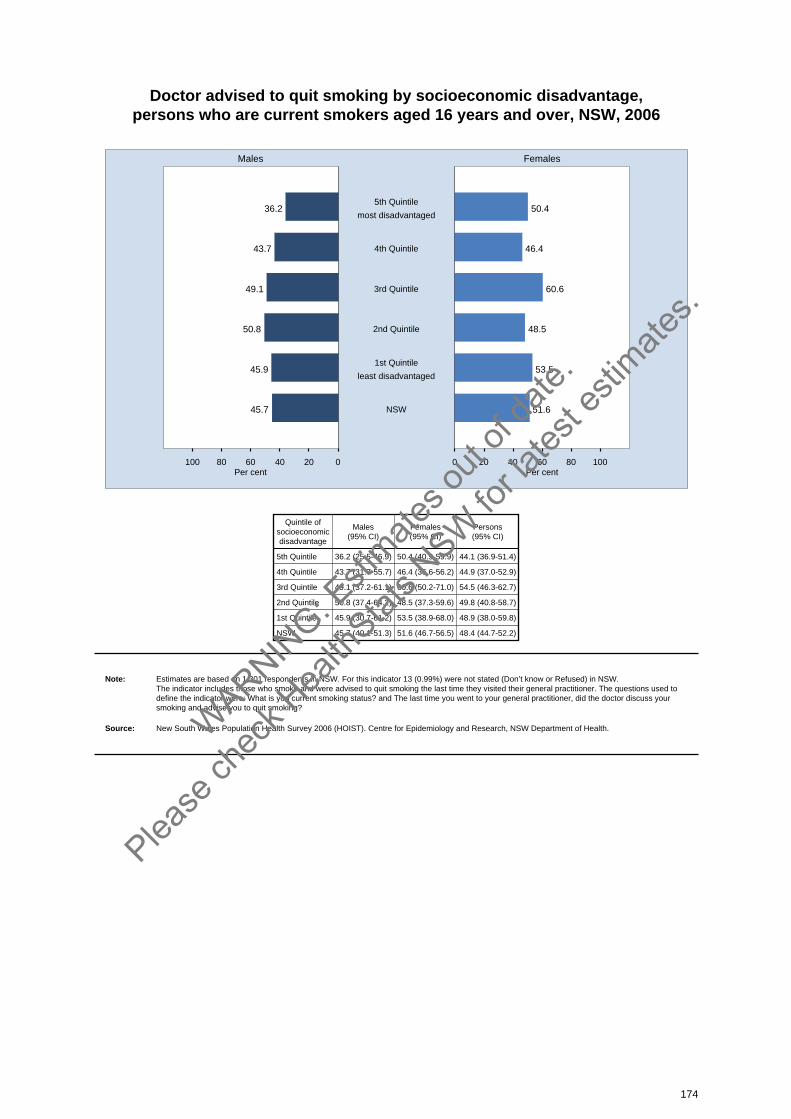
Doctor advised to quit smoking by socioeconomic disadvantage, persons who are current smokers aged 16 years and over, NSW, 2006
020406080100 0 20 40 60 80 100
Males Females
Per cent Per cent
36.2 50.45th Quintile
most disadvantaged
43.7 46.44th Quintile
49.1 60.63rd Quintile
50.8 48.52nd Quintile
45.9 53.51st Quintile
least disadvantaged
45.7 51.6NSW
Quintile ofsocioeconomicdisadvantage
Males(95% CI)
Females(95% CI)
Persons(95% CI)
5th Quintile 36.2 (25.5-46.9) 50.4 (40.9-59.9) 44.1 (36.9-51.4)
4th Quintile 43.7 (31.7-55.7) 46.4 (36.6-56.2) 44.9 (37.0-52.9)
3rd Quintile 49.1 (37.2-61.1) 60.6 (50.2-71.0) 54.5 (46.3-62.7)
2nd Quintile 50.8 (37.4-64.2) 48.5 (37.3-59.6) 49.8 (40.8-58.7)
1st Quintile 45.9 (30.7-61.2) 53.5 (38.9-68.0) 48.9 (38.0-59.8)
NSW 45.7 (40.1-51.3) 51.6 (46.7-56.5) 48.4 (44.7-52.2)
Note: Estimates are based on 1,301 respondents in NSW. For this indicator 13 (0.99%) were not stated (Don’t know or Refused) in NSW. The indicator includes those who smoke and were advised to quit smoking the last time they visited their general practitioner. The questions used todefine the indicator were: What is you current smoking status? and The last time you went to your general practitioner, did the doctor discuss yoursmoking and advise you to quit smoking?
Source: New South Wales Population Health Survey 2006 (HOIST). Centre for Epidemiology and Research, NSW Department of Health.
174
WARNIN
G: Esti
mates o
ut of
date.
Please
chec
k Hea
lthStat
s NSW
for la
test e
stimate
s.
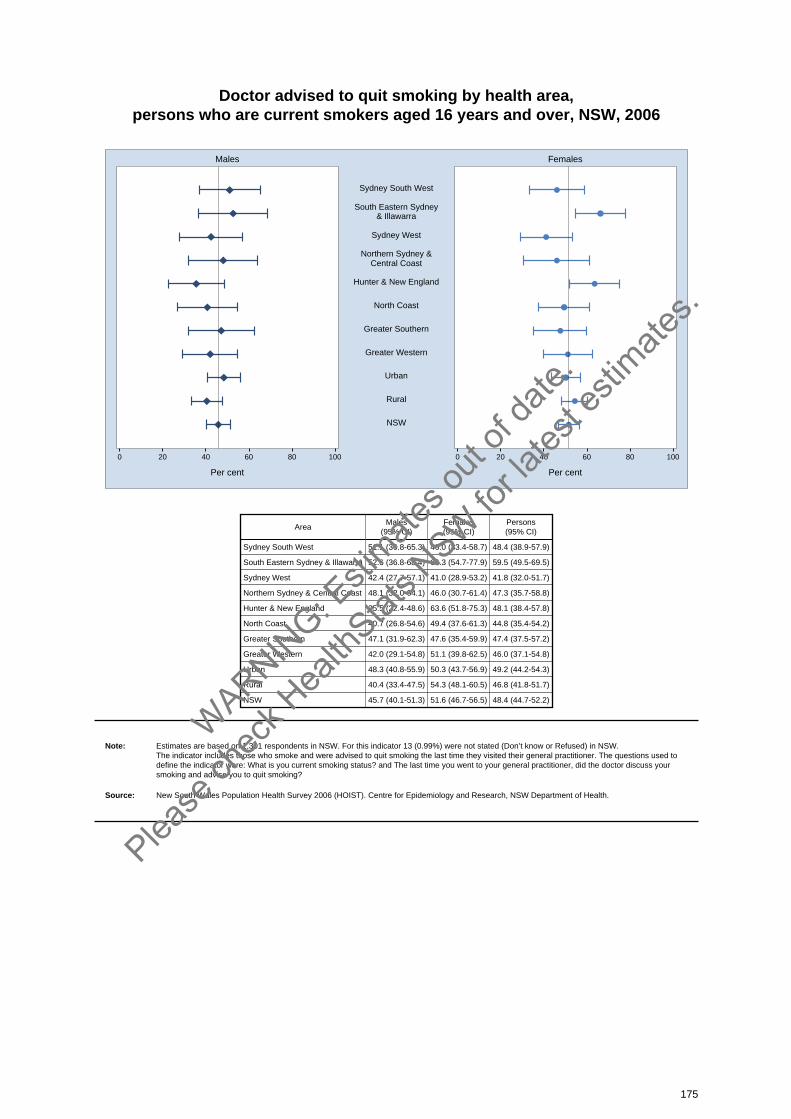
Doctor advised to quit smoking by health area, persons who are current smokers aged 16 years and over, NSW, 2006
0 20 40 60 80 100 0 20 40 60 80 100
Males Females
Per cent Per cent
Sydney South West
South Eastern Sydney& Illawarra
Sydney West
Northern Sydney &Central Coast
Hunter & New England
North Coast
Greater Southern
Greater Western
Urban
Rural
NSW
AreaMales
(95% CI)Females(95% CI)
Persons(95% CI)
Sydney South West 51.1 (36.8-65.3) 46.0 (33.4-58.7) 48.4 (38.9-57.9)
South Eastern Sydney & Illawarra 52.6 (36.8-68.4) 66.3 (54.7-77.9) 59.5 (49.5-69.5)
Sydney West 42.4 (27.7-57.1) 41.0 (28.9-53.2) 41.8 (32.0-51.7)
Northern Sydney & Central Coast 48.1 (32.0-64.1) 46.0 (30.7-61.4) 47.3 (35.7-58.8)
Hunter & New England 35.5 (22.4-48.6) 63.6 (51.8-75.3) 48.1 (38.4-57.8)
North Coast 40.7 (26.8-54.6) 49.4 (37.6-61.3) 44.8 (35.4-54.2)
Greater Southern 47.1 (31.9-62.3) 47.6 (35.4-59.9) 47.4 (37.5-57.2)
Greater Western 42.0 (29.1-54.8) 51.1 (39.8-62.5) 46.0 (37.1-54.8)
Urban 48.3 (40.8-55.9) 50.3 (43.7-56.9) 49.2 (44.2-54.3)
Rural 40.4 (33.4-47.5) 54.3 (48.1-60.5) 46.8 (41.8-51.7)
NSW 45.7 (40.1-51.3) 51.6 (46.7-56.5) 48.4 (44.7-52.2)
Note: Estimates are based on 1,301 respondents in NSW. For this indicator 13 (0.99%) were not stated (Don’t know or Refused) in NSW. The indicator includes those who smoke and were advised to quit smoking the last time they visited their general practitioner. The questions used todefine the indicator were: What is you current smoking status? and The last time you went to your general practitioner, did the doctor discuss yoursmoking and advise you to quit smoking?
Source: New South Wales Population Health Survey 2006 (HOIST). Centre for Epidemiology and Research, NSW Department of Health.
175
WARNIN
G: Esti
mates o
ut of
date.
Please
chec
k Hea
lthStat
s NSW
for la
test e
stimate
s.
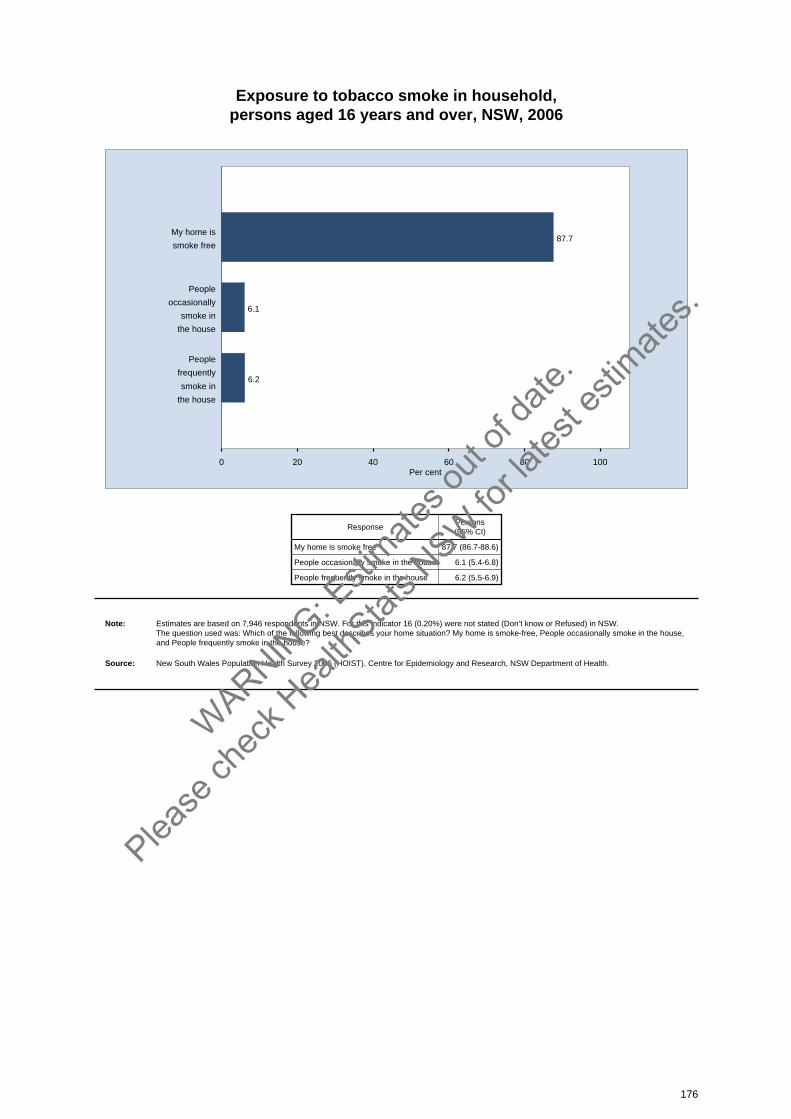
Exposure to tobacco smoke in household, persons aged 16 years and over, NSW, 2006
0 20 40 60 80 100Per cent
87.7My home is
smoke free
6.1
People
occasionally
smoke in
the house
6.2
People
frequently
smoke in
the house
ResponsePersons(95% CI)
My home is smoke free 87.7 (86.7-88.6)
People occasionally smoke in the house 6.1 (5.4-6.8)
People frequently smoke in the house 6.2 (5.5-6.9)
Note: Estimates are based on 7,946 respondents in NSW. For this indicator 16 (0.20%) were not stated (Don’t know or Refused) in NSW. The question used was: Which of the following best describes your home situation? My home is smoke-free, People occasionally smoke in the house,and People frequently smoke in the house?
Source: New South Wales Population Health Survey 2006 (HOIST). Centre for Epidemiology and Research, NSW Department of Health.
176
WARNIN
G: Esti
mates o
ut of
date.
Please
chec
k Hea
lthStat
s NSW
for la
test e
stimate
s.
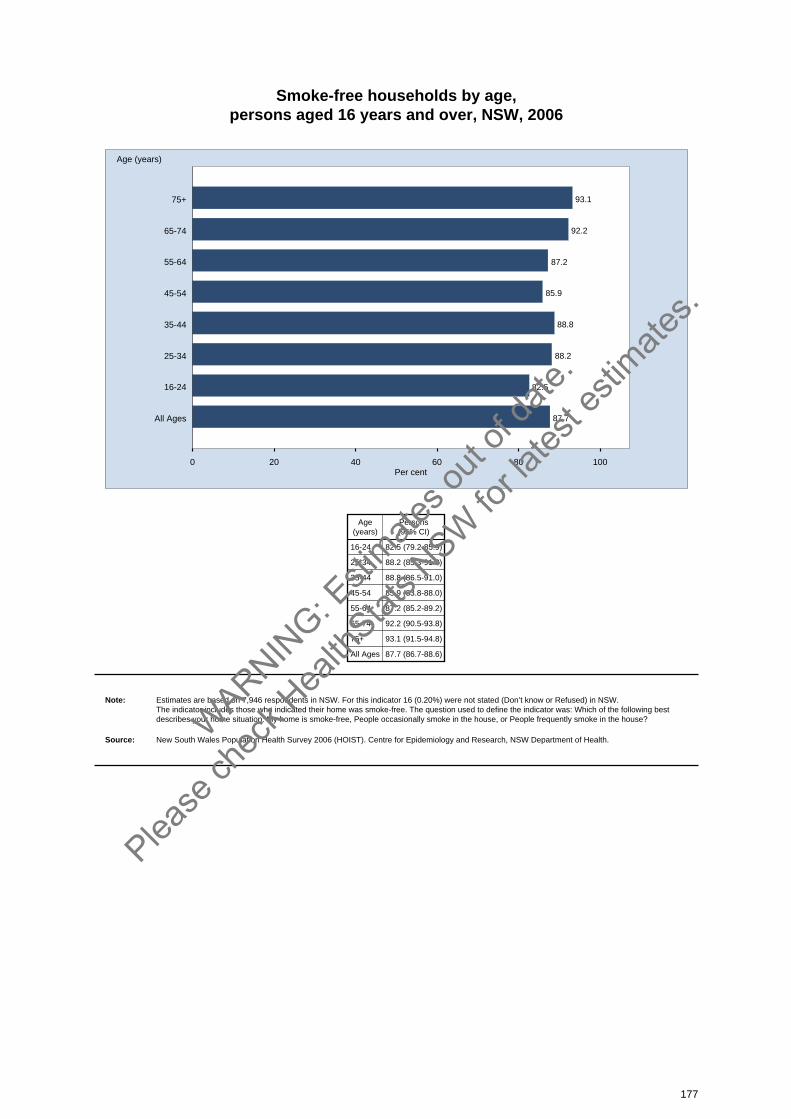
Smoke-free households by age, persons aged 16 years and over, NSW, 2006
0 20 40 60 80 100Per cent
93.175+
Age (years)
92.265-74
87.255-64
85.945-54
88.835-44
88.225-34
82.516-24
87.7All Ages
Age(years)
Persons(95% CI)
16-24 82.5 (79.2-85.9)
25-34 88.2 (85.3-91.0)
35-44 88.8 (86.5-91.0)
45-54 85.9 (83.8-88.0)
55-64 87.2 (85.2-89.2)
65-74 92.2 (90.5-93.8)
75+ 93.1 (91.5-94.8)
All Ages 87.7 (86.7-88.6)
Note: Estimates are based on 7,946 respondents in NSW. For this indicator 16 (0.20%) were not stated (Don’t know or Refused) in NSW. The indicator includes those who indicated their home was smoke-free. The question used to define the indicator was: Which of the following bestdescribes your home situation: My home is smoke-free, People occasionally smoke in the house, or People frequently smoke in the house?
Source: New South Wales Population Health Survey 2006 (HOIST). Centre for Epidemiology and Research, NSW Department of Health.
177
WARNIN
G: Esti
mates o
ut of
date.
Please
chec
k Hea
lthStat
s NSW
for la
test e
stimate
s.
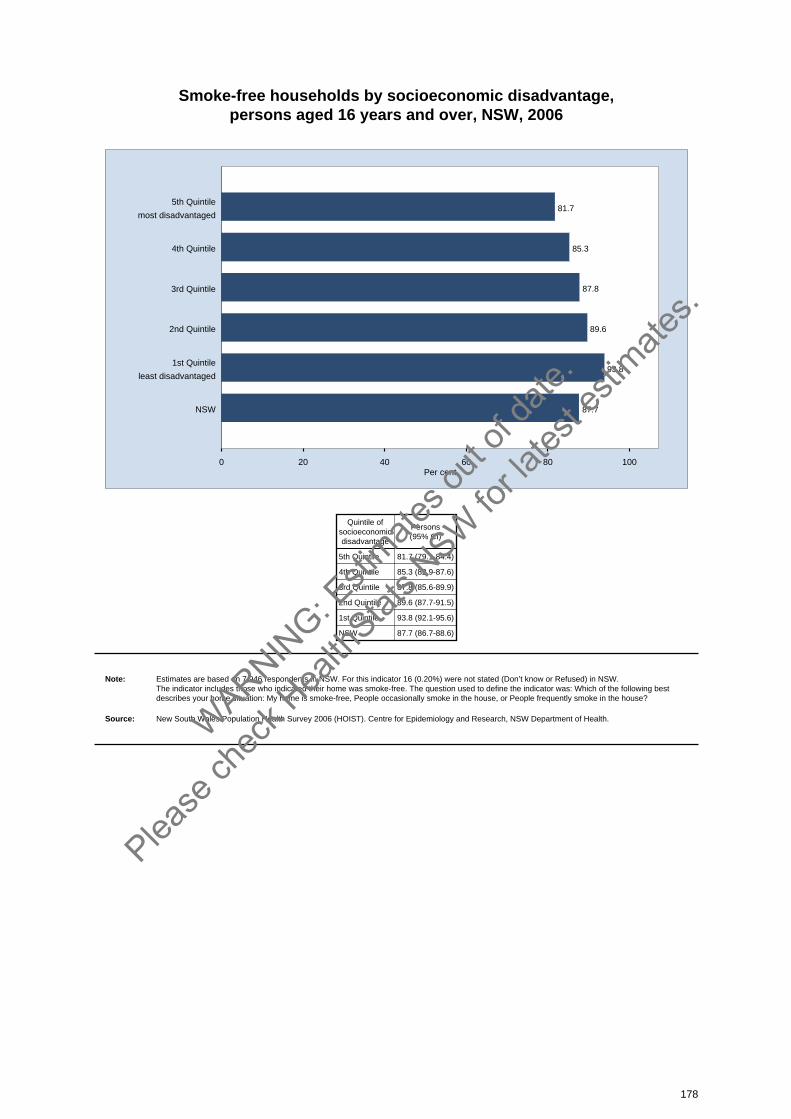
Smoke-free households by socioeconomic disadvantage, persons aged 16 years and over, NSW, 2006
0 20 40 60 80 100Per cent
81.75th Quintile
most disadvantaged
85.34th Quintile
87.83rd Quintile
89.62nd Quintile
93.81st Quintile
least disadvantaged
87.7NSW
Quintile ofsocioeconomicdisadvantage
Persons(95% CI)
5th Quintile 81.7 (79.1-84.4)
4th Quintile 85.3 (82.9-87.6)
3rd Quintile 87.8 (85.6-89.9)
2nd Quintile 89.6 (87.7-91.5)
1st Quintile 93.8 (92.1-95.6)
NSW 87.7 (86.7-88.6)
Note: Estimates are based on 7,946 respondents in NSW. For this indicator 16 (0.20%) were not stated (Don’t know or Refused) in NSW. The indicator includes those who indicated their home was smoke-free. The question used to define the indicator was: Which of the following bestdescribes your home situation: My home is smoke-free, People occasionally smoke in the house, or People frequently smoke in the house?
Source: New South Wales Population Health Survey 2006 (HOIST). Centre for Epidemiology and Research, NSW Department of Health.
178
WARNIN
G: Esti
mates o
ut of
date.
Please
chec
k Hea
lthStat
s NSW
for la
test e
stimate
s.

Smoke-free households by health area, persons aged 16 years and over, NSW, 2006
0 20 40 60 80 100
Per cent
Sydney South West
South Eastern Sydney& Illawarra
Sydney West
Northern Sydney &Central Coast
Hunter & New England
North Coast
Greater Southern
Greater Western
Urban
Rural
NSW
AreaPersons(95% CI)
Sydney South West 84.7 (82.0-87.5)
South Eastern Sydney & Illawarra 89.3 (87.0-91.7)
Sydney West 86.7 (83.8-89.5)
Northern Sydney & Central Coast 92.4 (90.5-94.2)
Hunter & New England 86.8 (84.2-89.4)
North Coast 86.9 (84.3-89.5)
Greater Southern 88.3 (86.0-90.5)
Greater Western 82.4 (79.4-85.5)
Urban 88.2 (86.9-89.4)
Rural 86.5 (85.2-87.9)
NSW 87.7 (86.7-88.6)
Note: Estimates are based on 7,946 respondents in NSW. For this indicator 16 (0.20%) were not stated (Don’t know or Refused) in NSW. The indicator includes those who indicated their home was smoke-free. The question used to define the indicator was: Which of the following bestdescribes your home situation: My home is smoke-free, People occasionally smoke in the house, or People frequently smoke in the house?
Source: New South Wales Population Health Survey 2006 (HOIST). Centre for Epidemiology and Research, NSW Department of Health.
179
WARNIN
G: Esti
mates o
ut of
date.
Please
chec
k Hea
lthStat
s NSW
for la
test e
stimate
s.

Smoke-free cars by age, persons aged 16 years and over, NSW, 2006
0 20 40 60 80 100Per cent
92.175+
Age (years)
92.665-74
89.355-64
85.945-54
89.135-44
85.125-34
84.516-24
87.7All Ages
Age(years)
Persons(95% CI)
16-24 84.5 (81.0-88.0)
25-34 85.1 (81.8-88.4)
35-44 89.1 (86.9-91.3)
45-54 85.9 (83.7-88.2)
55-64 89.3 (87.4-91.1)
65-74 92.6 (90.9-94.3)
75+ 92.1 (90.0-94.1)
All Ages 87.7 (86.6-88.7)
Note: Estimates are based on 7,251 respondents in NSW. For this indicator 19 (0.26%) were not stated (Don’t know or Refused) in NSW. The indicator includes those who indicated their car was smoke-free. The question used to define the indicator was: Are people allowed to smoke inyour car?
Source: New South Wales Population Health Survey 2006 (HOIST). Centre for Epidemiology and Research, NSW Department of Health.
180
WARNIN
G: Esti
mates o
ut of
date.
Please
chec
k Hea
lthStat
s NSW
for la
test e
stimate
s.

Smoke-free cars by socioeconomic disadvantage, persons aged 16 years and over, NSW, 2006
0 20 40 60 80 100Per cent
84.45th Quintile
most disadvantaged
85.94th Quintile
88.83rd Quintile
88.92nd Quintile
90.11st Quintile
least disadvantaged
87.7NSW
Quintile ofsocioeconomicdisadvantage
Persons(95% CI)
5th Quintile 84.4 (81.8-87.0)
4th Quintile 85.9 (83.5-88.3)
3rd Quintile 88.8 (86.7-90.9)
2nd Quintile 88.9 (86.8-91.1)
1st Quintile 90.1 (87.6-92.6)
NSW 87.7 (86.6-88.7)
Note: Estimates are based on 7,251 respondents in NSW. For this indicator 19 (0.26%) were not stated (Don’t know or Refused) in NSW. The indicator includes those who indicated their car was smoke-free. The question used to define the indicator was: Are people allowed to smoke inyour car?
Source: New South Wales Population Health Survey 2006 (HOIST). Centre for Epidemiology and Research, NSW Department of Health.
181
WARNIN
G: Esti
mates o
ut of
date.
Please
chec
k Hea
lthStat
s NSW
for la
test e
stimate
s.
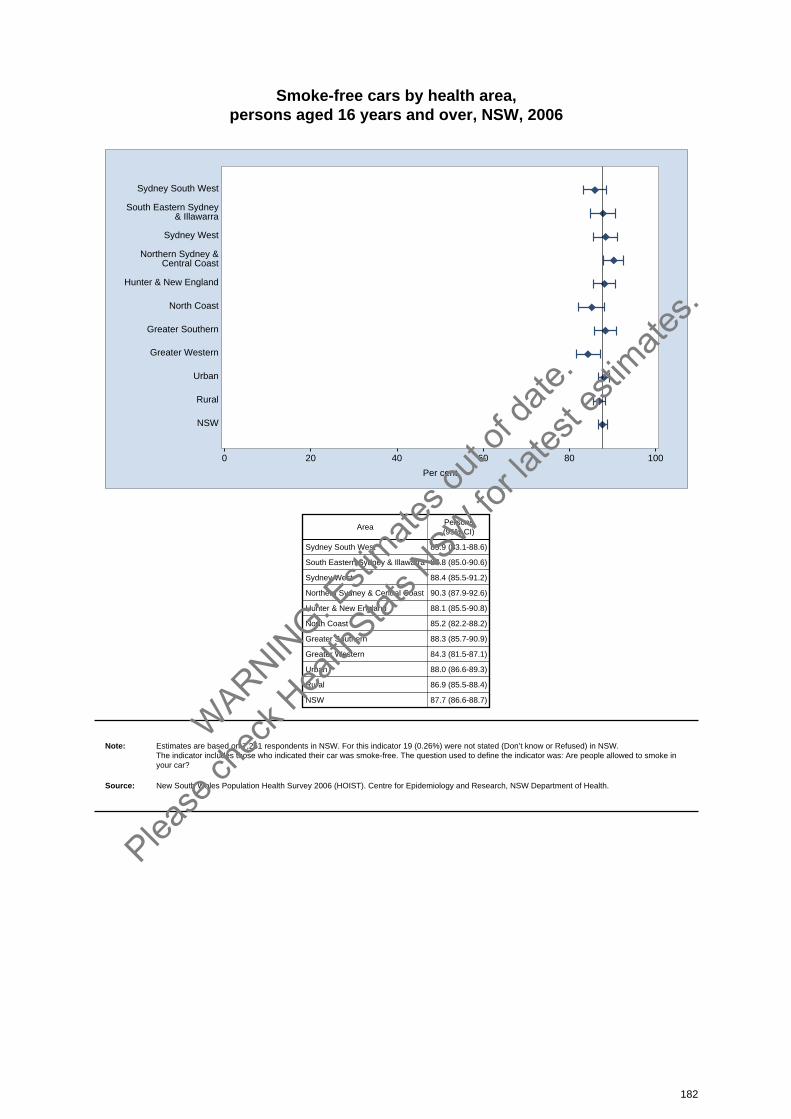
Smoke-free cars by health area, persons aged 16 years and over, NSW, 2006
0 20 40 60 80 100
Per cent
Sydney South West
South Eastern Sydney& Illawarra
Sydney West
Northern Sydney &Central Coast
Hunter & New England
North Coast
Greater Southern
Greater Western
Urban
Rural
NSW
AreaPersons(95% CI)
Sydney South West 85.9 (83.1-88.6)
South Eastern Sydney & Illawarra 87.8 (85.0-90.6)
Sydney West 88.4 (85.5-91.2)
Northern Sydney & Central Coast 90.3 (87.9-92.6)
Hunter & New England 88.1 (85.5-90.8)
North Coast 85.2 (82.2-88.2)
Greater Southern 88.3 (85.7-90.9)
Greater Western 84.3 (81.5-87.1)
Urban 88.0 (86.6-89.3)
Rural 86.9 (85.5-88.4)
NSW 87.7 (86.6-88.7)
Note: Estimates are based on 7,251 respondents in NSW. For this indicator 19 (0.26%) were not stated (Don’t know or Refused) in NSW. The indicator includes those who indicated their car was smoke-free. The question used to define the indicator was: Are people allowed to smoke inyour car?
Source: New South Wales Population Health Survey 2006 (HOIST). Centre for Epidemiology and Research, NSW Department of Health.
182
WARNIN
G: Esti
mates o
ut of
date.
Please
chec
k Hea
lthStat
s NSW
for la
test e
stimate
s.
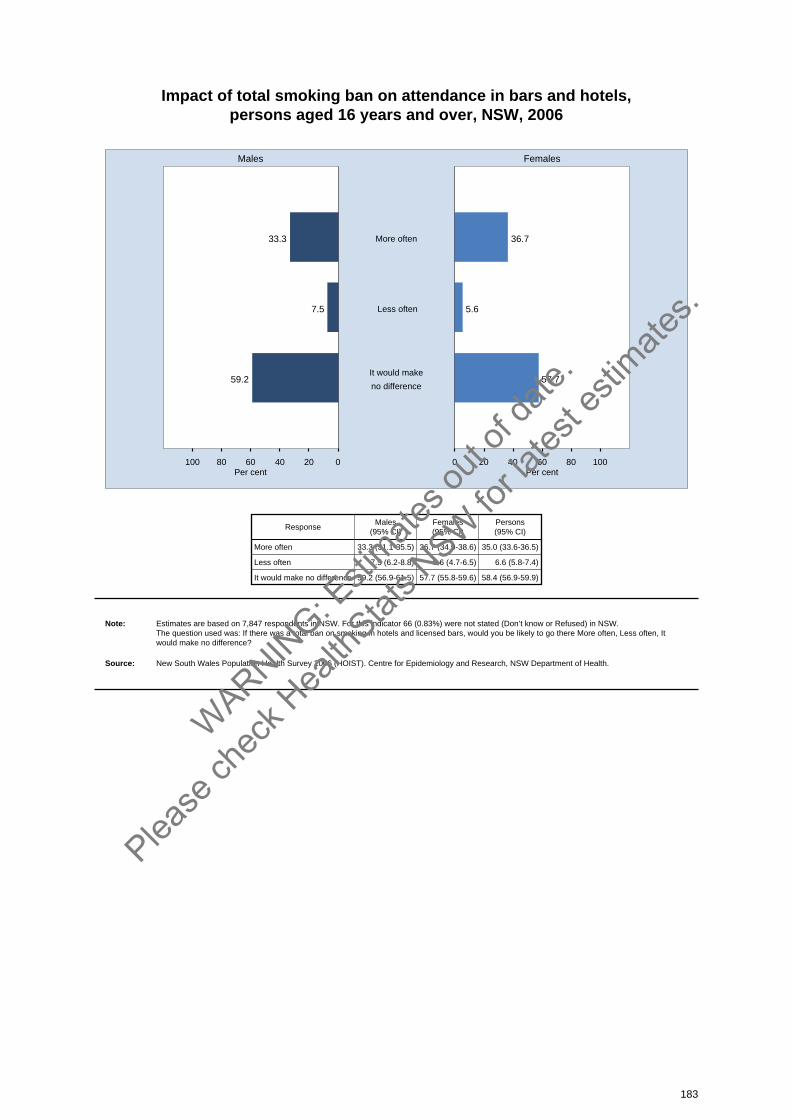
Impact of total smoking ban on attendance in bars and hotels, persons aged 16 years and over, NSW, 2006
020406080100 0 20 40 60 80 100
Males Females
Per cent Per cent
33.3 36.7More often
7.5 5.6 Less often
59.2 57.7It would make
no difference
ResponseMales
(95% CI)Females(95% CI)
Persons(95% CI)
More often 33.3 (31.1-35.5) 36.7 (34.9-38.6) 35.0 (33.6-36.5)
Less often 7.5 (6.2-8.8) 5.6 (4.7-6.5) 6.6 (5.8-7.4)
It would make no difference 59.2 (56.9-61.5) 57.7 (55.8-59.6) 58.4 (56.9-59.9)
Note: Estimates are based on 7,847 respondents in NSW. For this indicator 66 (0.83%) were not stated (Don’t know or Refused) in NSW. The question used was: If there was a total ban on smoking in hotels and licensed bars, would you be likely to go there More often, Less often, Itwould make no difference?
Source: New South Wales Population Health Survey 2006 (HOIST). Centre for Epidemiology and Research, NSW Department of Health.
183
WARNIN
G: Esti
mates o
ut of
date.
Please
chec
k Hea
lthStat
s NSW
for la
test e
stimate
s.

More likely to attend hotels and licensed bars if smoking banned in hotelsand licensed bars by age,
persons aged 16 years and over, NSW, 2006
020406080100 0 20 40 60 80 100
Males Females
Per cent Per cent
22.3 21.375+
Age (years)
31.0 34.665-74
38.2 37.455-64
35.8 38.445-54
34.1 37.135-44
31.7 39.225-34
32.6 41.516-24
33.3 36.7All Ages
Age(years)
Males(95% CI)
Females(95% CI)
Persons(95% CI)
16-24 32.6 (26.3-39.0) 41.5 (35.3-47.6) 36.9 (32.5-41.3)
25-34 31.7 (25.3-38.0) 39.2 (33.9-44.4) 35.4 (31.3-39.6)
35-44 34.1 (28.5-39.8) 37.1 (32.6-41.7) 35.6 (32.0-39.2)
45-54 35.8 (31.0-40.7) 38.4 (34.3-42.4) 37.1 (33.9-40.3)
55-64 38.2 (33.4-42.9) 37.4 (33.6-41.3) 37.8 (34.7-40.9)
65-74 31.0 (26.4-35.6) 34.6 (30.6-38.7) 32.9 (29.8-35.9)
75+ 22.3 (17.5-27.1) 21.3 (17.6-25.0) 21.7 (18.8-24.7)
All Ages 33.3 (31.1-35.5) 36.7 (34.9-38.6) 35.0 (33.6-36.5)
Note: Estimates are based on 7,847 respondents in NSW. For this indicator 66 (0.83%) were not stated (Don’t know or Refused) in NSW. The indicator includes those who would be more likely to frequent licensed bars and hotels if there was a total ban on smoking. The question used todefine the indicator was: If there was a total ban on smoking in hotels and licensed bars, would you be likely to go there More often, Less often, Itwould make no difference?
Source: New South Wales Population Health Survey 2006 (HOIST). Centre for Epidemiology and Research, NSW Department of Health.
184
WARNIN
G: Esti
mates o
ut of
date.
Please
chec
k Hea
lthStat
s NSW
for la
test e
stimate
s.
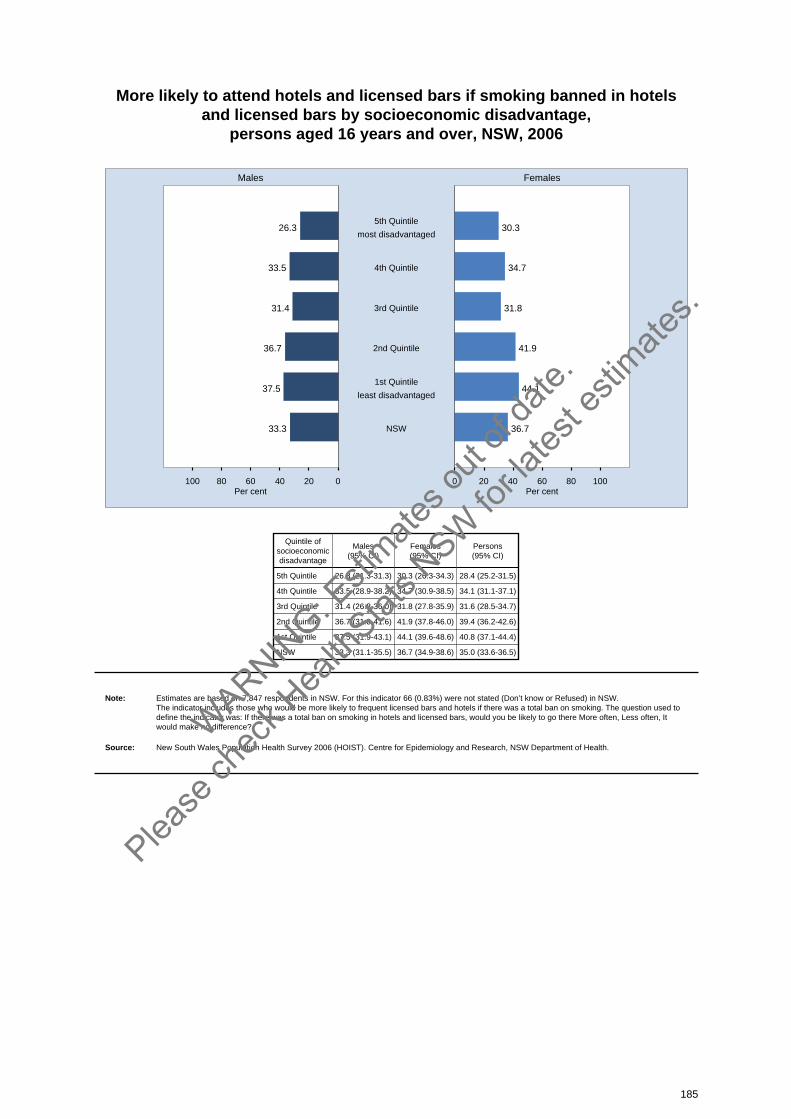
More likely to attend hotels and licensed bars if smoking banned in hotelsand licensed bars by socioeconomic disadvantage,
persons aged 16 years and over, NSW, 2006
020406080100 0 20 40 60 80 100
Males Females
Per cent Per cent
26.3 30.35th Quintile
most disadvantaged
33.5 34.74th Quintile
31.4 31.83rd Quintile
36.7 41.92nd Quintile
37.5 44.11st Quintile
least disadvantaged
33.3 36.7NSW
Quintile ofsocioeconomicdisadvantage
Males(95% CI)
Females(95% CI)
Persons(95% CI)
5th Quintile 26.3 (21.3-31.3) 30.3 (26.3-34.3) 28.4 (25.2-31.5)
4th Quintile 33.5 (28.9-38.2) 34.7 (30.9-38.5) 34.1 (31.1-37.1)
3rd Quintile 31.4 (26.8-36.0) 31.8 (27.8-35.9) 31.6 (28.5-34.7)
2nd Quintile 36.7 (31.8-41.6) 41.9 (37.8-46.0) 39.4 (36.2-42.6)
1st Quintile 37.5 (31.9-43.1) 44.1 (39.6-48.6) 40.8 (37.1-44.4)
NSW 33.3 (31.1-35.5) 36.7 (34.9-38.6) 35.0 (33.6-36.5)
Note: Estimates are based on 7,847 respondents in NSW. For this indicator 66 (0.83%) were not stated (Don’t know or Refused) in NSW. The indicator includes those who would be more likely to frequent licensed bars and hotels if there was a total ban on smoking. The question used todefine the indicator was: If there was a total ban on smoking in hotels and licensed bars, would you be likely to go there More often, Less often, Itwould make no difference?
Source: New South Wales Population Health Survey 2006 (HOIST). Centre for Epidemiology and Research, NSW Department of Health.
185
WARNIN
G: Esti
mates o
ut of
date.
Please
chec
k Hea
lthStat
s NSW
for la
test e
stimate
s.
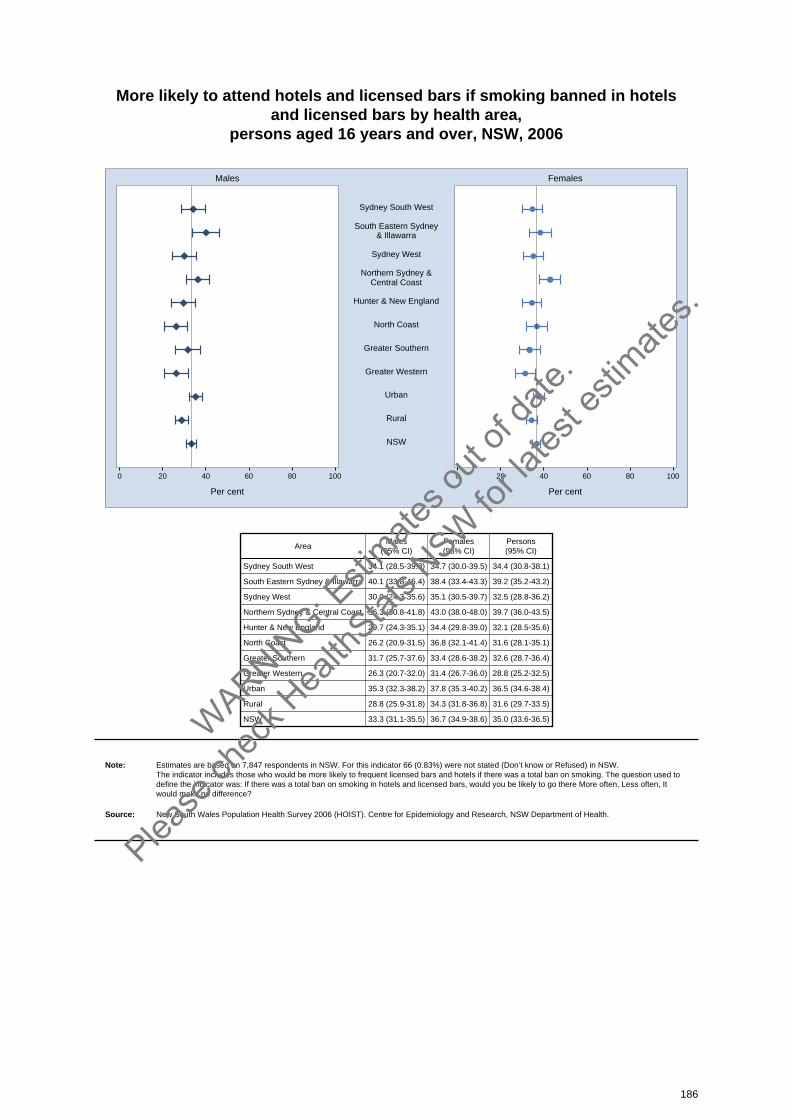
More likely to attend hotels and licensed bars if smoking banned in hotelsand licensed bars by health area,
persons aged 16 years and over, NSW, 2006
0 20 40 60 80 100 0 20 40 60 80 100
Males Females
Per cent Per cent
Sydney South West
South Eastern Sydney& Illawarra
Sydney West
Northern Sydney &Central Coast
Hunter & New England
North Coast
Greater Southern
Greater Western
Urban
Rural
NSW
AreaMales
(95% CI)Females(95% CI)
Persons(95% CI)
Sydney South West 34.1 (28.5-39.8) 34.7 (30.0-39.5) 34.4 (30.8-38.1)
South Eastern Sydney & Illawarra 40.1 (33.8-46.4) 38.4 (33.4-43.3) 39.2 (35.2-43.2)
Sydney West 30.0 (24.3-35.6) 35.1 (30.5-39.7) 32.5 (28.8-36.2)
Northern Sydney & Central Coast 36.3 (30.8-41.8) 43.0 (38.0-48.0) 39.7 (36.0-43.5)
Hunter & New England 29.7 (24.3-35.1) 34.4 (29.8-39.0) 32.1 (28.5-35.6)
North Coast 26.2 (20.9-31.5) 36.8 (32.1-41.4) 31.6 (28.1-35.1)
Greater Southern 31.7 (25.7-37.6) 33.4 (28.6-38.2) 32.6 (28.7-36.4)
Greater Western 26.3 (20.7-32.0) 31.4 (26.7-36.0) 28.8 (25.2-32.5)
Urban 35.3 (32.3-38.2) 37.8 (35.3-40.2) 36.5 (34.6-38.4)
Rural 28.8 (25.9-31.8) 34.3 (31.8-36.8) 31.6 (29.7-33.5)
NSW 33.3 (31.1-35.5) 36.7 (34.9-38.6) 35.0 (33.6-36.5)
Note: Estimates are based on 7,847 respondents in NSW. For this indicator 66 (0.83%) were not stated (Don’t know or Refused) in NSW. The indicator includes those who would be more likely to frequent licensed bars and hotels if there was a total ban on smoking. The question used todefine the indicator was: If there was a total ban on smoking in hotels and licensed bars, would you be likely to go there More often, Less often, Itwould make no difference?
Source: New South Wales Population Health Survey 2006 (HOIST). Centre for Epidemiology and Research, NSW Department of Health.
186
WARNIN
G: Esti
mates o
ut of
date.
Please
chec
k Hea
lthStat
s NSW
for la
test e
stimate
s.
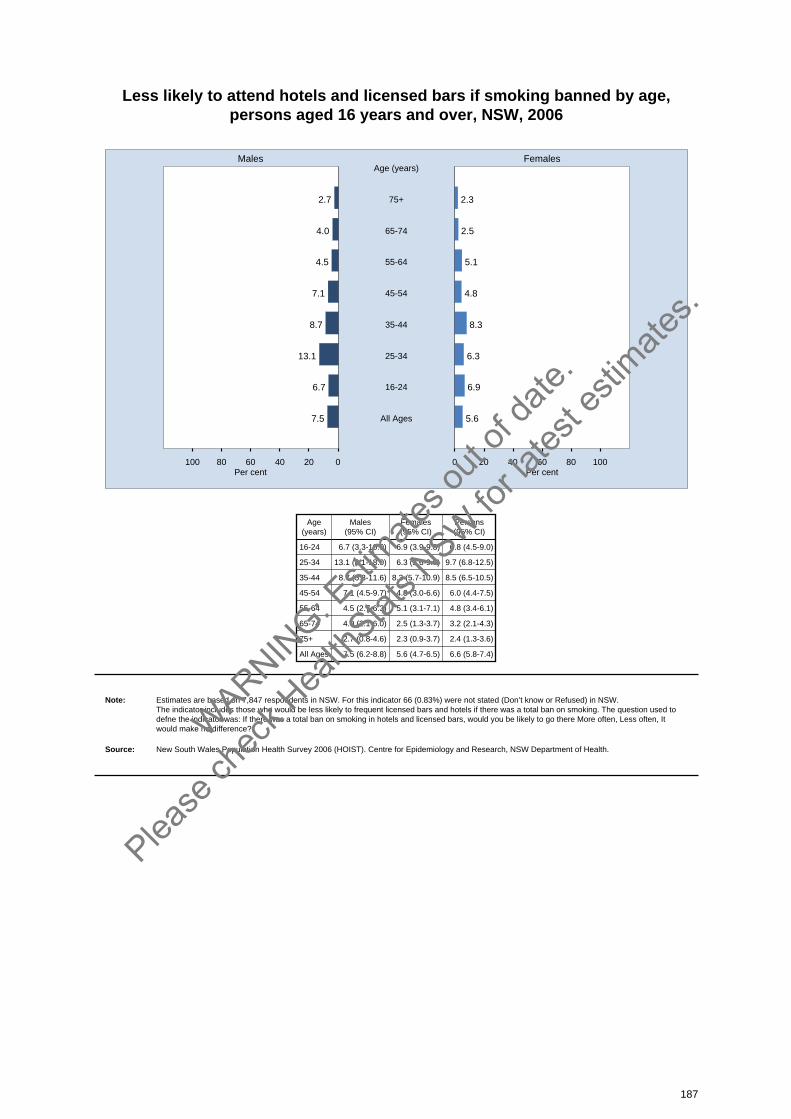
Less likely to attend hotels and licensed bars if smoking banned by age, persons aged 16 years and over, NSW, 2006
020406080100 0 20 40 60 80 100
Males Females
Per cent Per cent
2.7 2.375+
Age (years)
4.0 2.565-74
4.5 5.155-64
7.1 4.845-54
8.7 8.335-44
13.1 6.325-34
6.7 6.916-24
7.5 5.6All Ages
Age(years)
Males(95% CI)
Females(95% CI)
Persons(95% CI)
16-24 6.7 (3.3-10.0) 6.9 (3.9-9.8) 6.8 (4.5-9.0)
25-34 13.1 (8.1-18.0) 6.3 (3.6-9.0) 9.7 (6.8-12.5)
35-44 8.7 (5.8-11.6) 8.3 (5.7-10.9) 8.5 (6.5-10.5)
45-54 7.1 (4.5-9.7) 4.8 (3.0-6.6) 6.0 (4.4-7.5)
55-64 4.5 (2.7-6.3) 5.1 (3.1-7.1) 4.8 (3.4-6.1)
65-74 4.0 (2.1-6.0) 2.5 (1.3-3.7) 3.2 (2.1-4.3)
75+ 2.7 (0.8-4.6) 2.3 (0.9-3.7) 2.4 (1.3-3.6)
All Ages 7.5 (6.2-8.8) 5.6 (4.7-6.5) 6.6 (5.8-7.4)
Note: Estimates are based on 7,847 respondents in NSW. For this indicator 66 (0.83%) were not stated (Don’t know or Refused) in NSW. The indicator includes those who would be less likely to frequent licensed bars and hotels if there was a total ban on smoking. The question used todefne the indicator was: If there was a total ban on smoking in hotels and licensed bars, would you be likely to go there More often, Less often, Itwould make no difference?
Source: New South Wales Population Health Survey 2006 (HOIST). Centre for Epidemiology and Research, NSW Department of Health.
187
WARNIN
G: Esti
mates o
ut of
date.
Please
chec
k Hea
lthStat
s NSW
for la
test e
stimate
s.
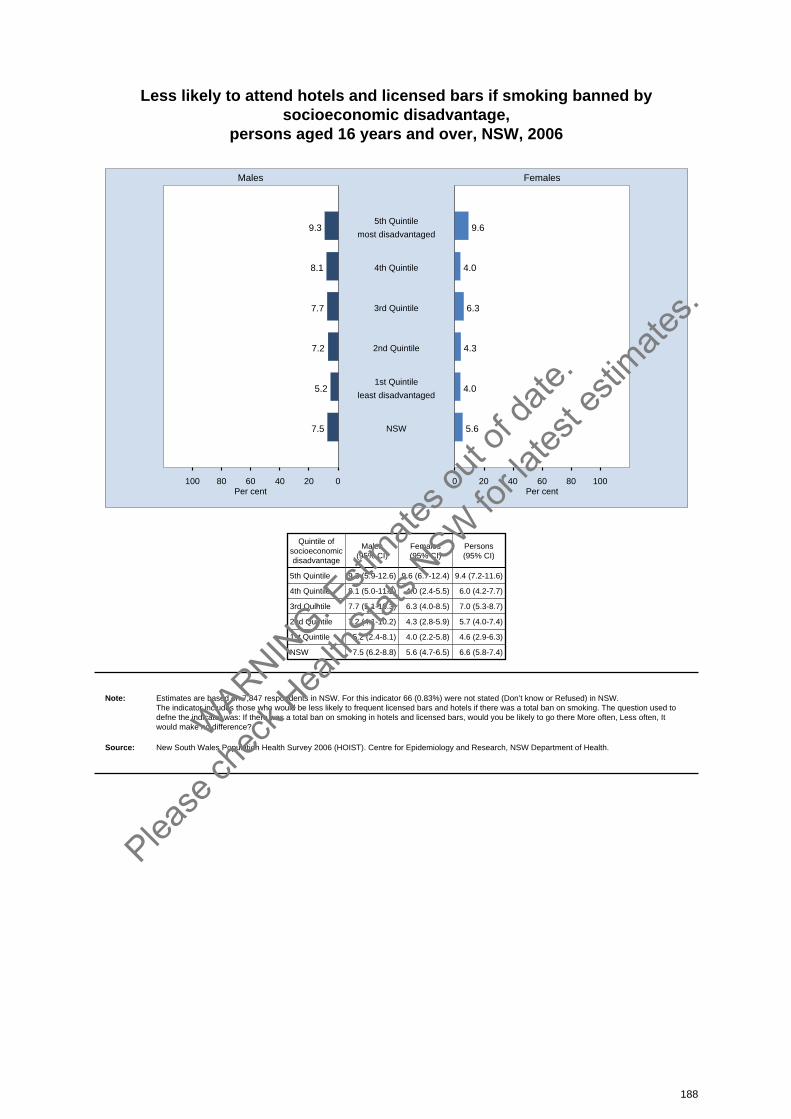
Less likely to attend hotels and licensed bars if smoking banned bysocioeconomic disadvantage,
persons aged 16 years and over, NSW, 2006
020406080100 0 20 40 60 80 100
Males Females
Per cent Per cent
9.3 9.65th Quintile
most disadvantaged
8.1 4.04th Quintile
7.7 6.33rd Quintile
7.2 4.32nd Quintile
5.2 4.01st Quintile
least disadvantaged
7.5 5.6NSW
Quintile ofsocioeconomicdisadvantage
Males(95% CI)
Females(95% CI)
Persons(95% CI)
5th Quintile 9.3 (5.9-12.6) 9.6 (6.7-12.4) 9.4 (7.2-11.6)
4th Quintile 8.1 (5.0-11.2) 4.0 (2.4-5.5) 6.0 (4.2-7.7)
3rd Quintile 7.7 (5.1-10.3) 6.3 (4.0-8.5) 7.0 (5.3-8.7)
2nd Quintile 7.2 (4.1-10.2) 4.3 (2.8-5.9) 5.7 (4.0-7.4)
1st Quintile 5.2 (2.4-8.1) 4.0 (2.2-5.8) 4.6 (2.9-6.3)
NSW 7.5 (6.2-8.8) 5.6 (4.7-6.5) 6.6 (5.8-7.4)
Note: Estimates are based on 7,847 respondents in NSW. For this indicator 66 (0.83%) were not stated (Don’t know or Refused) in NSW. The indicator includes those who would be less likely to frequent licensed bars and hotels if there was a total ban on smoking. The question used todefne the indicator was: If there was a total ban on smoking in hotels and licensed bars, would you be likely to go there More often, Less often, Itwould make no difference?
Source: New South Wales Population Health Survey 2006 (HOIST). Centre for Epidemiology and Research, NSW Department of Health.
188
WARNIN
G: Esti
mates o
ut of
date.
Please
chec
k Hea
lthStat
s NSW
for la
test e
stimate
s.
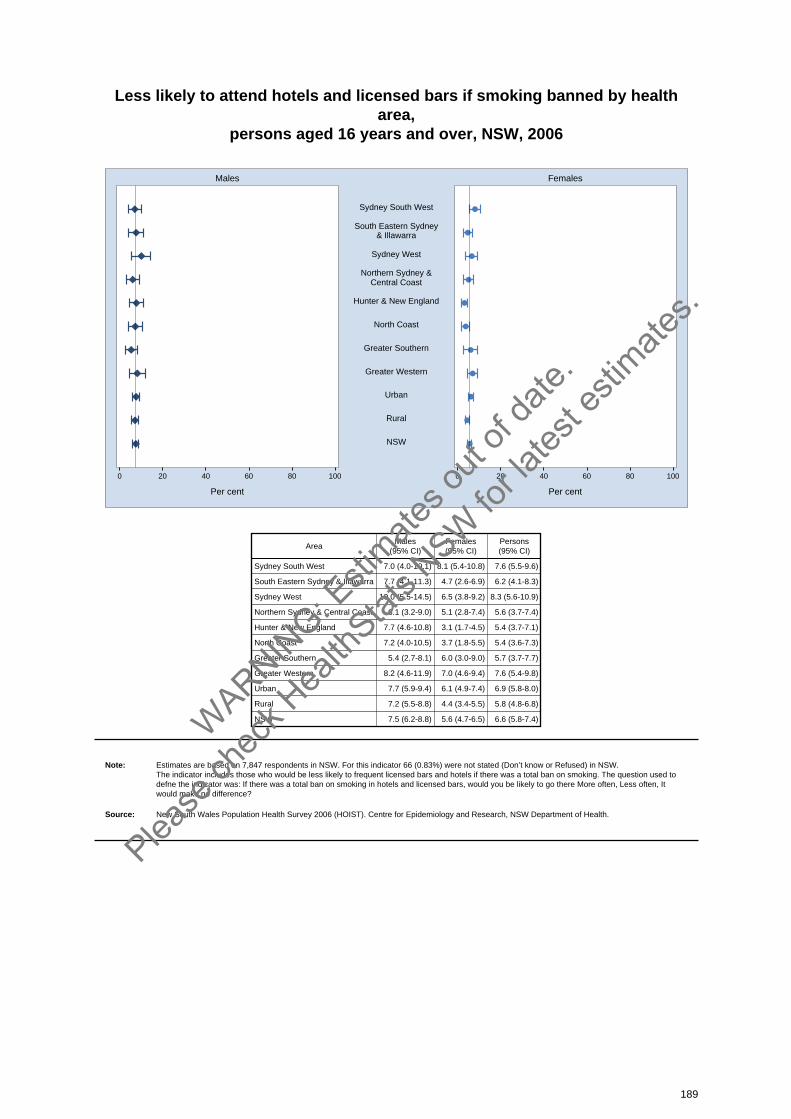
Less likely to attend hotels and licensed bars if smoking banned by healtharea,
persons aged 16 years and over, NSW, 2006
0 20 40 60 80 100 0 20 40 60 80 100
Males Females
Per cent Per cent
Sydney South West
South Eastern Sydney& Illawarra
Sydney West
Northern Sydney &Central Coast
Hunter & New England
North Coast
Greater Southern
Greater Western
Urban
Rural
NSW
AreaMales
(95% CI)Females(95% CI)
Persons(95% CI)
Sydney South West 7.0 (4.0-10.1) 8.1 (5.4-10.8) 7.6 (5.5-9.6)
South Eastern Sydney & Illawarra 7.7 (4.1-11.3) 4.7 (2.6-6.9) 6.2 (4.1-8.3)
Sydney West 10.0 (5.5-14.5) 6.5 (3.8-9.2) 8.3 (5.6-10.9)
Northern Sydney & Central Coast 6.1 (3.2-9.0) 5.1 (2.8-7.4) 5.6 (3.7-7.4)
Hunter & New England 7.7 (4.6-10.8) 3.1 (1.7-4.5) 5.4 (3.7-7.1)
North Coast 7.2 (4.0-10.5) 3.7 (1.8-5.5) 5.4 (3.6-7.3)
Greater Southern 5.4 (2.7-8.1) 6.0 (3.0-9.0) 5.7 (3.7-7.7)
Greater Western 8.2 (4.6-11.9) 7.0 (4.6-9.4) 7.6 (5.4-9.8)
Urban 7.7 (5.9-9.4) 6.1 (4.9-7.4) 6.9 (5.8-8.0)
Rural 7.2 (5.5-8.8) 4.4 (3.4-5.5) 5.8 (4.8-6.8)
NSW 7.5 (6.2-8.8) 5.6 (4.7-6.5) 6.6 (5.8-7.4)
Note: Estimates are based on 7,847 respondents in NSW. For this indicator 66 (0.83%) were not stated (Don’t know or Refused) in NSW. The indicator includes those who would be less likely to frequent licensed bars and hotels if there was a total ban on smoking. The question used todefne the indicator was: If there was a total ban on smoking in hotels and licensed bars, would you be likely to go there More often, Less often, Itwould make no difference?
Source: New South Wales Population Health Survey 2006 (HOIST). Centre for Epidemiology and Research, NSW Department of Health.
189
WARNIN
G: Esti
mates o
ut of
date.
Please
chec
k Hea
lthStat
s NSW
for la
test e
stimate
s.
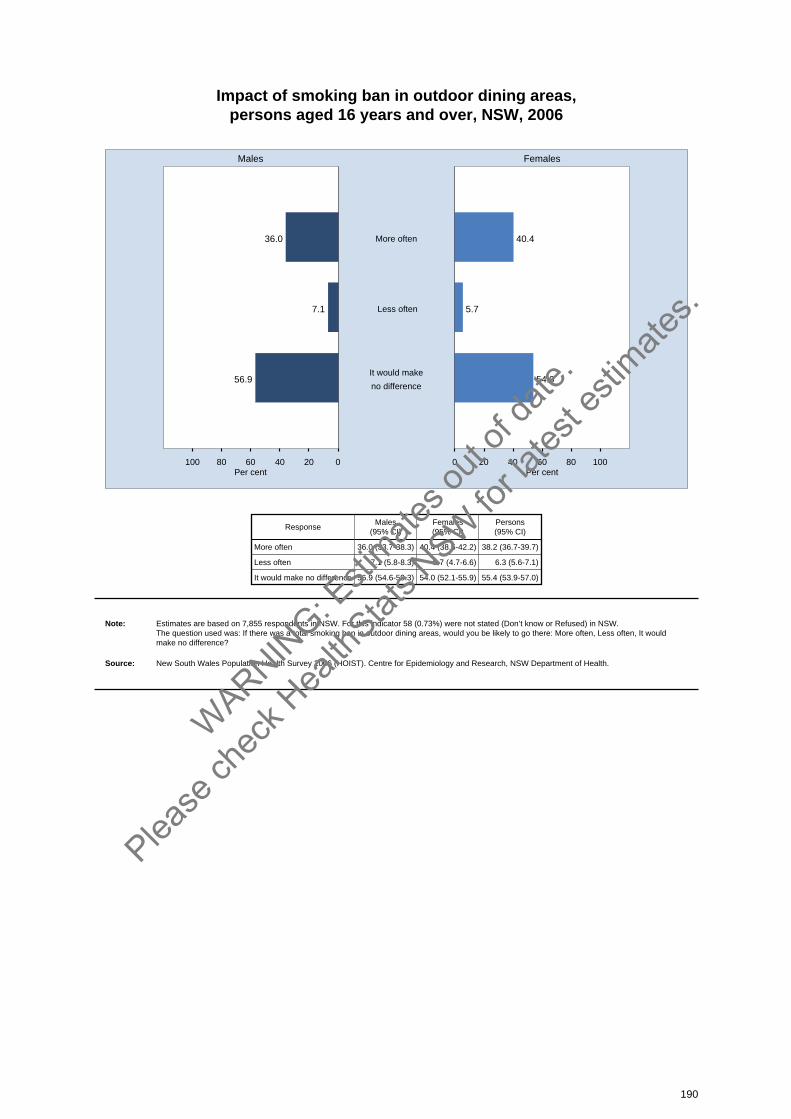
Impact of smoking ban in outdoor dining areas, persons aged 16 years and over, NSW, 2006
020406080100 0 20 40 60 80 100
Males Females
Per cent Per cent
36.0 40.4More often
7.1 5.7 Less often
56.9 54.0It would make
no difference
ResponseMales
(95% CI)Females(95% CI)
Persons(95% CI)
More often 36.0 (33.7-38.3) 40.4 (38.5-42.2) 38.2 (36.7-39.7)
Less often 7.1 (5.8-8.3) 5.7 (4.7-6.6) 6.3 (5.6-7.1)
It would make no difference 56.9 (54.6-59.3) 54.0 (52.1-55.9) 55.4 (53.9-57.0)
Note: Estimates are based on 7,855 respondents in NSW. For this indicator 58 (0.73%) were not stated (Don’t know or Refused) in NSW. The question used was: If there was a total smoking ban in outdoor dining areas, would you be likely to go there: More often, Less often, It wouldmake no difference?
Source: New South Wales Population Health Survey 2006 (HOIST). Centre for Epidemiology and Research, NSW Department of Health.
190
WARNIN
G: Esti
mates o
ut of
date.
Please
chec
k Hea
lthStat
s NSW
for la
test e
stimate
s.
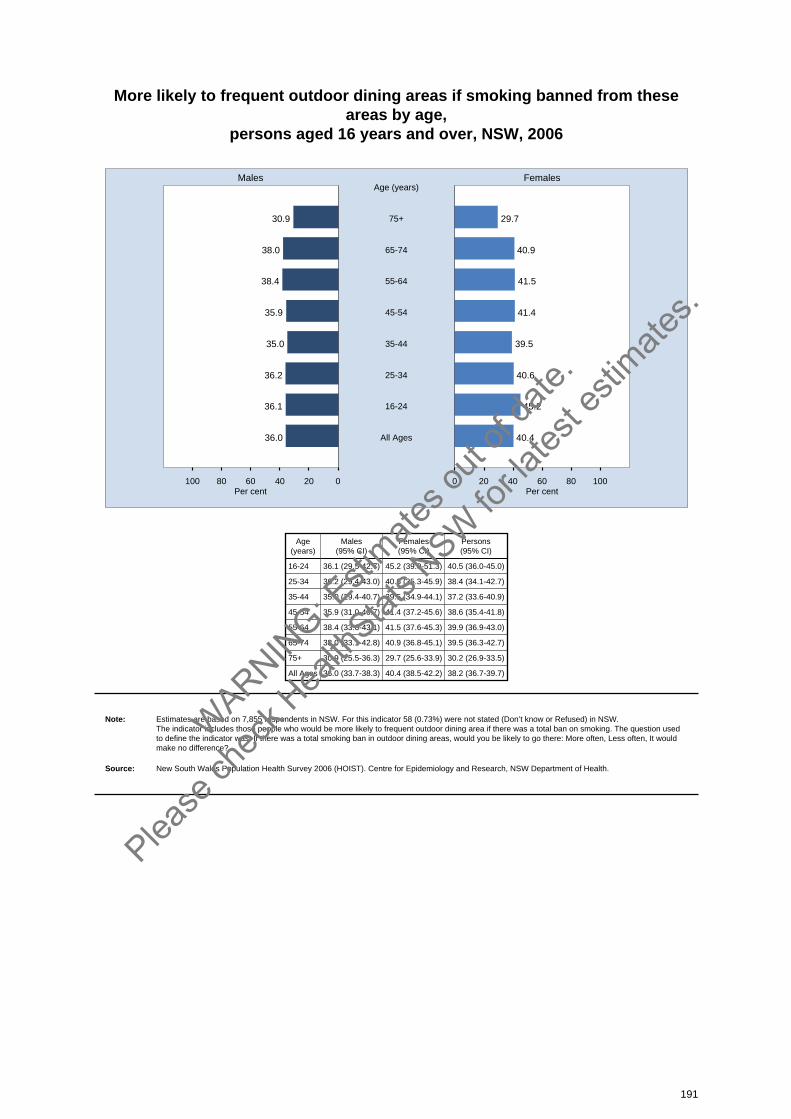
More likely to frequent outdoor dining areas if smoking banned from theseareas by age,
persons aged 16 years and over, NSW, 2006
020406080100 0 20 40 60 80 100
Males Females
Per cent Per cent
30.9 29.775+
Age (years)
38.0 40.965-74
38.4 41.555-64
35.9 41.445-54
35.0 39.535-44
36.2 40.625-34
36.1 45.216-24
36.0 40.4All Ages
Age(years)
Males(95% CI)
Females(95% CI)
Persons(95% CI)
16-24 36.1 (29.5-42.7) 45.2 (39.0-51.3) 40.5 (36.0-45.0)
25-34 36.2 (29.4-43.0) 40.6 (35.3-45.9) 38.4 (34.1-42.7)
35-44 35.0 (29.4-40.7) 39.5 (34.9-44.1) 37.2 (33.6-40.9)
45-54 35.9 (31.0-40.7) 41.4 (37.2-45.6) 38.6 (35.4-41.8)
55-64 38.4 (33.6-43.1) 41.5 (37.6-45.3) 39.9 (36.9-43.0)
65-74 38.0 (33.1-42.8) 40.9 (36.8-45.1) 39.5 (36.3-42.7)
75+ 30.9 (25.5-36.3) 29.7 (25.6-33.9) 30.2 (26.9-33.5)
All Ages 36.0 (33.7-38.3) 40.4 (38.5-42.2) 38.2 (36.7-39.7)
Note: Estimates are based on 7,855 respondents in NSW. For this indicator 58 (0.73%) were not stated (Don’t know or Refused) in NSW. The indicator includes those people who would be more likely to frequent outdoor dining area if there was a total ban on smoking. The question usedto define the indicator was: If there was a total smoking ban in outdoor dining areas, would you be likely to go there: More often, Less often, It wouldmake no difference?
Source: New South Wales Population Health Survey 2006 (HOIST). Centre for Epidemiology and Research, NSW Department of Health.
191
WARNIN
G: Esti
mates o
ut of
date.
Please
chec
k Hea
lthStat
s NSW
for la
test e
stimate
s.

More likely to frequent outdoor dining areas if smoking banned from theseareas by socioeconomic disadvantage,
persons aged 16 years and over, NSW, 2006
020406080100 0 20 40 60 80 100
Males Females
Per cent Per cent
28.7 34.55th Quintile
most disadvantaged
34.1 39.04th Quintile
35.2 36.63rd Quintile
39.2 43.62nd Quintile
41.2 47.31st Quintile
least disadvantaged
36.0 40.4NSW
Quintile ofsocioeconomicdisadvantage
Males(95% CI)
Females(95% CI)
Persons(95% CI)
5th Quintile 28.7 (23.6-33.8) 34.5 (30.3-38.6) 31.7 (28.4-35.0)
4th Quintile 34.1 (29.4-38.8) 39.0 (35.1-42.9) 36.6 (33.6-39.7)
3rd Quintile 35.2 (30.5-40.0) 36.6 (32.4-40.7) 35.9 (32.7-39.0)
2nd Quintile 39.2 (34.2-44.2) 43.6 (39.6-47.7) 41.5 (38.3-44.7)
1st Quintile 41.2 (35.3-47.1) 47.3 (42.8-51.8) 44.2 (40.5-47.9)
NSW 36.0 (33.7-38.3) 40.4 (38.5-42.2) 38.2 (36.7-39.7)
Note: Estimates are based on 7,855 respondents in NSW. For this indicator 58 (0.73%) were not stated (Don’t know or Refused) in NSW. The indicator includes those people who would be more likely to frequent outdoor dining area if there was a total ban on smoking. The question usedto define the indicator was: If there was a total smoking ban in outdoor dining areas, would you be likely to go there: More often, Less often, It wouldmake no difference?
Source: New South Wales Population Health Survey 2006 (HOIST). Centre for Epidemiology and Research, NSW Department of Health.
192
WARNIN
G: Esti
mates o
ut of
date.
Please
chec
k Hea
lthStat
s NSW
for la
test e
stimate
s.
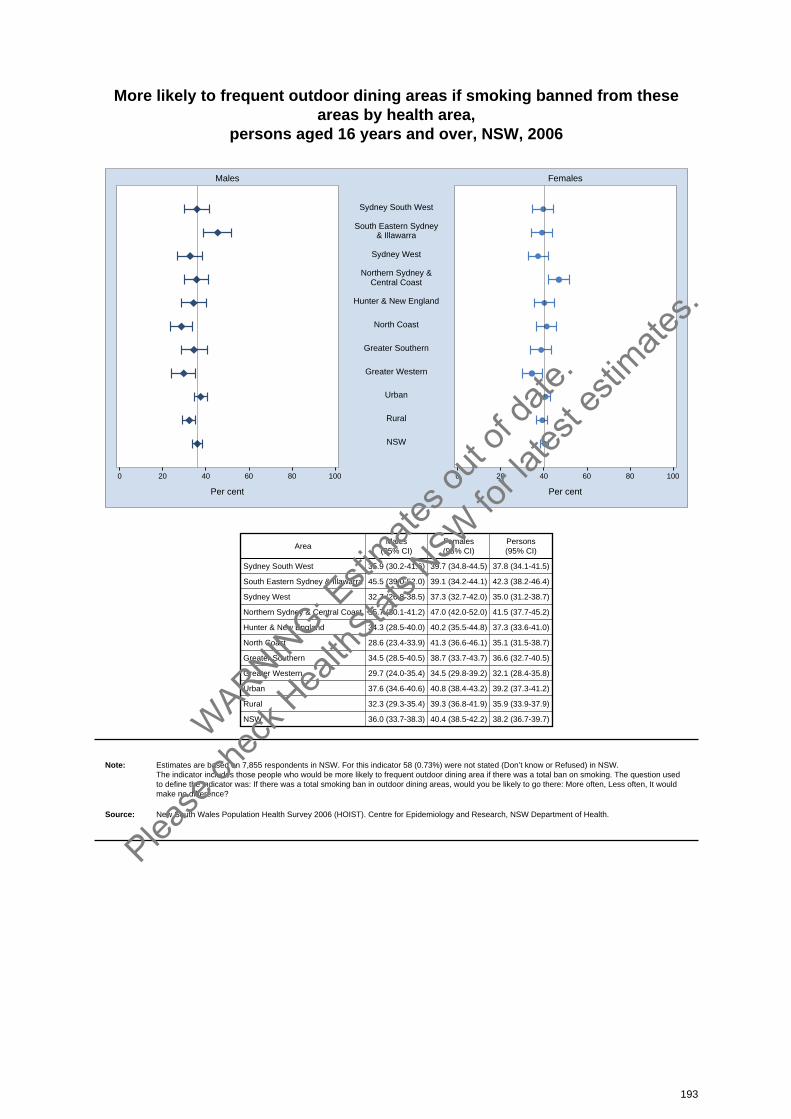
More likely to frequent outdoor dining areas if smoking banned from theseareas by health area,
persons aged 16 years and over, NSW, 2006
0 20 40 60 80 100 0 20 40 60 80 100
Males Females
Per cent Per cent
Sydney South West
South Eastern Sydney& Illawarra
Sydney West
Northern Sydney &Central Coast
Hunter & New England
North Coast
Greater Southern
Greater Western
Urban
Rural
NSW
AreaMales
(95% CI)Females(95% CI)
Persons(95% CI)
Sydney South West 35.9 (30.2-41.6) 39.7 (34.8-44.5) 37.8 (34.1-41.5)
South Eastern Sydney & Illawarra 45.5 (39.0-52.0) 39.1 (34.2-44.1) 42.3 (38.2-46.4)
Sydney West 32.7 (26.8-38.5) 37.3 (32.7-42.0) 35.0 (31.2-38.7)
Northern Sydney & Central Coast 35.7 (30.1-41.2) 47.0 (42.0-52.0) 41.5 (37.7-45.2)
Hunter & New England 34.3 (28.5-40.0) 40.2 (35.5-44.8) 37.3 (33.6-41.0)
North Coast 28.6 (23.4-33.9) 41.3 (36.6-46.1) 35.1 (31.5-38.7)
Greater Southern 34.5 (28.5-40.5) 38.7 (33.7-43.7) 36.6 (32.7-40.5)
Greater Western 29.7 (24.0-35.4) 34.5 (29.8-39.2) 32.1 (28.4-35.8)
Urban 37.6 (34.6-40.6) 40.8 (38.4-43.2) 39.2 (37.3-41.2)
Rural 32.3 (29.3-35.4) 39.3 (36.8-41.9) 35.9 (33.9-37.9)
NSW 36.0 (33.7-38.3) 40.4 (38.5-42.2) 38.2 (36.7-39.7)
Note: Estimates are based on 7,855 respondents in NSW. For this indicator 58 (0.73%) were not stated (Don’t know or Refused) in NSW. The indicator includes those people who would be more likely to frequent outdoor dining area if there was a total ban on smoking. The question usedto define the indicator was: If there was a total smoking ban in outdoor dining areas, would you be likely to go there: More often, Less often, It wouldmake no difference?
Source: New South Wales Population Health Survey 2006 (HOIST). Centre for Epidemiology and Research, NSW Department of Health.
193
WARNIN
G: Esti
mates o
ut of
date.
Please
chec
k Hea
lthStat
s NSW
for la
test e
stimate
s.
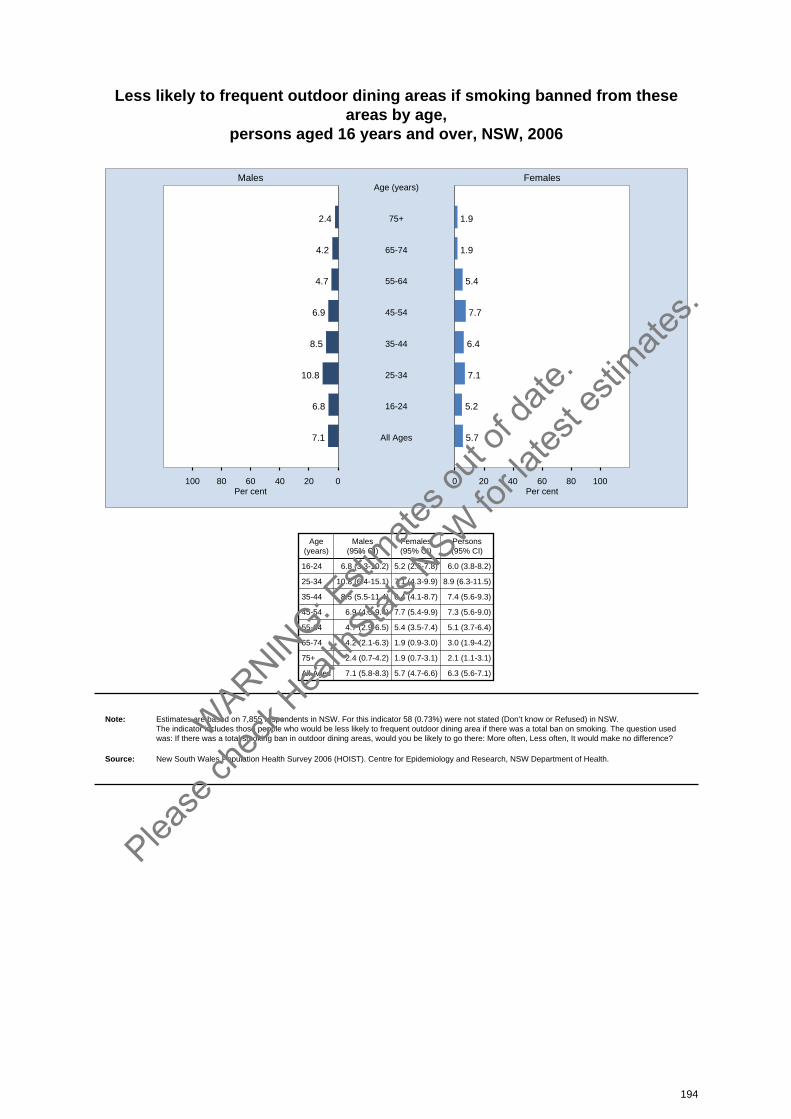
Less likely to frequent outdoor dining areas if smoking banned from theseareas by age,
persons aged 16 years and over, NSW, 2006
020406080100 0 20 40 60 80 100
Males Females
Per cent Per cent
2.4 1.975+
Age (years)
4.2 1.965-74
4.7 5.455-64
6.9 7.745-54
8.5 6.435-44
10.8 7.125-34
6.8 5.216-24
7.1 5.7All Ages
Age(years)
Males(95% CI)
Females(95% CI)
Persons(95% CI)
16-24 6.8 (3.3-10.2) 5.2 (2.6-7.8) 6.0 (3.8-8.2)
25-34 10.8 (6.4-15.1) 7.1 (4.3-9.9) 8.9 (6.3-11.5)
35-44 8.5 (5.5-11.4) 6.4 (4.1-8.7) 7.4 (5.6-9.3)
45-54 6.9 (4.3-9.4) 7.7 (5.4-9.9) 7.3 (5.6-9.0)
55-64 4.7 (2.9-6.5) 5.4 (3.5-7.4) 5.1 (3.7-6.4)
65-74 4.2 (2.1-6.3) 1.9 (0.9-3.0) 3.0 (1.9-4.2)
75+ 2.4 (0.7-4.2) 1.9 (0.7-3.1) 2.1 (1.1-3.1)
All Ages 7.1 (5.8-8.3) 5.7 (4.7-6.6) 6.3 (5.6-7.1)
Note: Estimates are based on 7,855 respondents in NSW. For this indicator 58 (0.73%) were not stated (Don’t know or Refused) in NSW. The indicator includes those people who would be less likely to frequent outdoor dining area if there was a total ban on smoking. The question usedwas: If there was a total smoking ban in outdoor dining areas, would you be likely to go there: More often, Less often, It would make no difference?
Source: New South Wales Population Health Survey 2006 (HOIST). Centre for Epidemiology and Research, NSW Department of Health.
194
WARNIN
G: Esti
mates o
ut of
date.
Please
chec
k Hea
lthStat
s NSW
for la
test e
stimate
s.
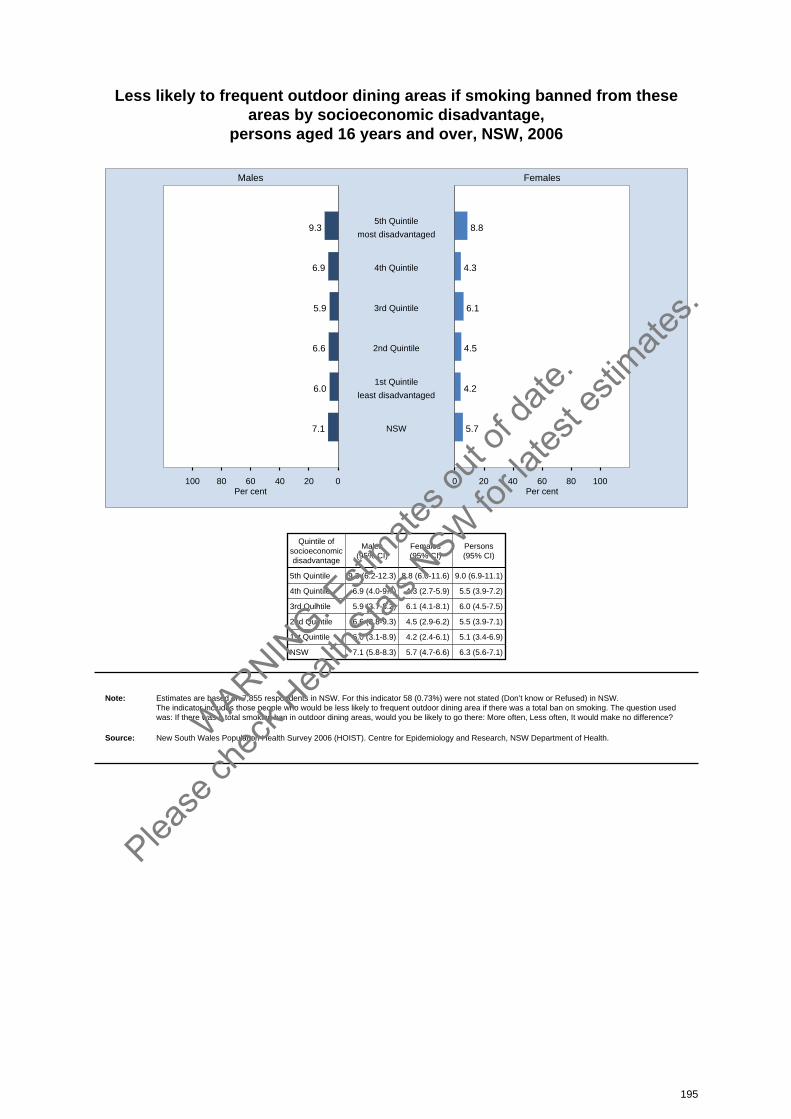
Less likely to frequent outdoor dining areas if smoking banned from theseareas by socioeconomic disadvantage,
persons aged 16 years and over, NSW, 2006
020406080100 0 20 40 60 80 100
Males Females
Per cent Per cent
9.3 8.85th Quintile
most disadvantaged
6.9 4.34th Quintile
5.9 6.13rd Quintile
6.6 4.52nd Quintile
6.0 4.21st Quintile
least disadvantaged
7.1 5.7NSW
Quintile ofsocioeconomicdisadvantage
Males(95% CI)
Females(95% CI)
Persons(95% CI)
5th Quintile 9.3 (6.2-12.3) 8.8 (6.0-11.6) 9.0 (6.9-11.1)
4th Quintile 6.9 (4.0-9.7) 4.3 (2.7-5.9) 5.5 (3.9-7.2)
3rd Quintile 5.9 (3.7-8.2) 6.1 (4.1-8.1) 6.0 (4.5-7.5)
2nd Quintile 6.6 (3.8-9.3) 4.5 (2.9-6.2) 5.5 (3.9-7.1)
1st Quintile 6.0 (3.1-8.9) 4.2 (2.4-6.1) 5.1 (3.4-6.9)
NSW 7.1 (5.8-8.3) 5.7 (4.7-6.6) 6.3 (5.6-7.1)
Note: Estimates are based on 7,855 respondents in NSW. For this indicator 58 (0.73%) were not stated (Don’t know or Refused) in NSW. The indicator includes those people who would be less likely to frequent outdoor dining area if there was a total ban on smoking. The question usedwas: If there was a total smoking ban in outdoor dining areas, would you be likely to go there: More often, Less often, It would make no difference?
Source: New South Wales Population Health Survey 2006 (HOIST). Centre for Epidemiology and Research, NSW Department of Health.
195
WARNIN
G: Esti
mates o
ut of
date.
Please
chec
k Hea
lthStat
s NSW
for la
test e
stimate
s.

Less likely to frequent outdoor dining areas if smoking banned from theseareas by health area,
persons aged 16 years and over, NSW, 2006
0 20 40 60 80 100 0 20 40 60 80 100
Males Females
Per cent Per cent
Sydney South West
South Eastern Sydney& Illawarra
Sydney West
Northern Sydney &Central Coast
Hunter & New England
North Coast
Greater Southern
Greater Western
Urban
Rural
NSW
AreaMales
(95% CI)Females(95% CI)
Persons(95% CI)
Sydney South West 8.1 (5.1-11.1) 9.9 (6.7-13.0) 9.0 (6.8-11.2)
South Eastern Sydney & Illawarra 5.9 (2.6-9.2) 4.8 (2.9-6.8) 5.4 (3.5-7.3)
Sydney West 8.8 (4.8-12.7) 5.6 (3.4-7.9) 7.2 (4.9-9.5)
Northern Sydney & Central Coast 7.7 (4.6-10.9) 3.7 (1.8-5.6) 5.7 (3.8-7.5)
Hunter & New England 5.9 (3.2-8.5) 3.7 (2.1-5.2) 4.7 (3.2-6.3)
North Coast 6.9 (3.8-10.0) 3.0 (1.6-4.3) 4.9 (3.2-6.6)
Greater Southern 5.6 (2.3-9.0) 6.2 (3.3-9.1) 5.9 (3.7-8.1)
Greater Western 4.5 (1.5-7.5) 6.8 (4.3-9.3) 5.6 (3.7-7.6)
Urban 7.6 (5.9-9.3) 6.2 (4.9-7.4) 6.9 (5.8-7.9)
Rural 5.8 (4.3-7.4) 4.5 (3.5-5.5) 5.2 (4.2-6.1)
NSW 7.1 (5.8-8.3) 5.7 (4.7-6.6) 6.3 (5.6-7.1)
Note: Estimates are based on 7,855 respondents in NSW. For this indicator 58 (0.73%) were not stated (Don’t know or Refused) in NSW. The indicator includes those people who would be less likely to frequent outdoor dining area if there was a total ban on smoking. The question usedwas: If there was a total smoking ban in outdoor dining areas, would you be likely to go there: More often, Less often, It would make no difference?
Source: New South Wales Population Health Survey 2006 (HOIST). Centre for Epidemiology and Research, NSW Department of Health.
196
WARNIN
G: Esti
mates o
ut of
date.
Please
chec
k Hea
lthStat
s NSW
for la
test e
stimate
s.
Health status
Monitoring the health status of a population helps to detect emerging patterns of illness and diseaseand provides information to inform policy and planning of health services. This section reports onasthma, diabetes or high blood glucose, incontinence, injury (falls), mental health (psychologicaldistress), oral health, overweight and obesity, and self-rated health.
Asthma
IntroductionAsthma is a chronic inflammatory disorder of the airways in which, in response to a wide range oftriggers, the airways narrow too much and too easily, resulting in episodes of wheeze, chest tightness,and shortness of breath. The prevalence of asthma is relatively high in Australia by international standards.[1-3]
The effects of asthma can include: disturbed sleep, tiredness, and reduced participation in theworkforce and organised sport and other activities. Asthma ranks among the top 10 problemsmanaged by general practitioners and is a major cause for hospital admission in children.[1-3]
Asthma is not curable but can be managed effectively. Current recommended management strategiesinclude: increased use of preventer medications, reduced use of reliever medications, use of astructured or written asthma management plan, avoidance of known triggers, and regular review by ageneral practitioner. Research has shown most patients with an asthma management plan found ituseful for managing their asthma.[4-6]
In 2006, the New South Wales Population Health Survey asked respondents: Have you ever been toldby a doctor or hospital you have asthma? Have you had symptoms of or treatment for asthma in thelast 12 months? What are the names or brands of all the [preventer or reliever] medications you tookfor asthma in the last 12 months? Do you have a written asthma management plan from your doctoron how to treat your asthma? During the last 4 weeks did your asthma interfere with your ability tomanage your day-to-day activities?; Did it interfere with these activities: A little bit, Moderately, Quite abit, Extremely?
Results
Ever had asthma
Overall, in 2006, 19.3 per cent of adults had ever being told by a doctor or hospital they had asthma.There was no significant variation between males and females. A significantly higher proportion ofadults aged 16-24 years (23.7 per cent) and 25-34 years (25.5 per cent), and a significantly lowerproportion of adults aged 65-74 years (15.4 per cent) and 75 years and over (13.0 per cent), ever hadasthma. A significantly higher proportion of adults in rural areas (21.8 per cent) than urban areas (18.2per cent) ever had asthma. A higher proportion of adults in the Greater Western Health Area (24.6 percent) ever had asthma. There was no variation by level of socioeconomic disadvantage. Theproportion of adults who ever had asthma has increased significantly between 1997 (16.8 per cent)and 2006 (19.3 per cent). This increase was significant in males (15.2 per cent to 18.4 per cent) butnot in females (18.4 per cent to 20.1 per cent).
Currently have asthma
Overall, in 2006, 10.9 per cent of adults currently have doctor-diagnosed asthma. A significantly higherproportion of females (11.8 per cent) than males (9.9 per cent) currently have doctor-diagnosedasthma. There was no significant variation among age groups, or among health areas, or by level ofsocioeconomic disadvantage. A significantly higher proportion of adults in rural areas (12.7 per cent)than urban areas (10.1 per cent) currently have asthma. There has been no significant variation in theproportion of adults who have current asthma between 1997 and 2006.
197
WARNIN
G: Esti
mates o
ut of
date.
Please
chec
k Hea
lthStat
s NSW
for la
test e
stimate
s.
Use of medication
Overall, in 2006, 42.4 per cent of adults with current asthma used short-acting bronchodilators, 22.4per cent used combined inhaled steroids and long-acting bronchodilators, 9.2 per cent used inhaledcorticosteroids, 0.3 per cent used cromone, 0.0 per cent used leukotriene receptor antagonists, and2.3 per cent used oral steroids.
Overall, in 2006, among those adults with current asthma, 84.3 per cent used reliever medication(short-acting bronchodilators, long-acting bronchodilators, and combined inhaled steroids andlong-acting bronchodilators). A significantly higher proportion of females (89.1 per cent) than males(78.4 per cent) use reliever medication. There was no significant variation by age group, or by level ofsocioeconomic disadvantage; however, a higher proportion of adults with current asthma in theSydney West Health Area (94.6), and a lower proportion of adults with current asthma in the SouthEastern Sydney & Illawarra Health Area (70.0 per cent), used reliever medication, compared with theoverall adult population with current asthma.
Overall, in 2006, among those adults with current asthma, 51.2 per cent used preventer medication(inhaled corticosteroids, cromone, leukotriene receptor antagonists, oral steriods, long-actingbronchodilators, and combined inhaled steroids and long-acting bronchodilators). There was nosignificant variation between males and females, or by age group, or between rural areas and urbanareas, or among health areas, or by level of socioeconomic disadvantage.
Written asthma management plan
Overall, in 2006, among those with current asthma, 37.6 per cent had a written asthma managementplan. There was no significant variation between males and females, by age group, between ruralareas and urban areas, among health areas, or by level of socioeconomic disadvantage. Theproportion of adults with current asthma who have a written asthma management plan has not variedsignificantly between 1997 and 2006.
Interference with daily activities
Overall, in 2006, among adults who had current asthma, 82.4 per cent had no interference with dailyactivities, 5.4 per cent had a little interference, 6.4 per cent had moderate interference, 3.6 per centhad quite a lot of inteference, and 2.2 per cent had extreme interference.
Therefore, 12.2 per cent had moderate to extreme interference with their ability to undertake dailyactivities because of their asthma. There was no significant variation between males and females,among age groups, between rural areas and urban areas, or by level of socioeconomic disadvantage;however, a lower proportion of adults with current asthma in the Greater Western Health Area (6.2 percent) had moderate to extreme interference with their ability to undertake daily activities because oftheir asthma, compared with the overall adult population with current asthma. The proportion of adultswith current asthma who have moderate to extreme interference with their ability to undertake dailyactivities because of their asthma has decreased significantly between 1997 (22.6 per cent) and 2006(12.2 per cent). This decrease was significant in females (26.8 per cent to 12.8 per cent).
Current smoking
Overall, in 2006, among adults with current asthma, 19.0 per cent were current smokers. There wasno significant variation between males and females. A significantly lower proportion of adults withcurrent asthma aged 55-64 years (10.0 per cent) and 65-74 years (7.7 per cent) and 75 years andover (5.4 per cent) were current smokers. There was no significant variation between rural areas andurban areas, or among health areas, or by level of socioeconomic disadvantage.
References1. Australian Government Department of Health and Ageing. Health Insite: Asthma website at
www.healthinsite.gov.au/topics/asthma (accessed 10 May 2007). 2. Australian Centre for Asthma Monitoring. Asthma in Australia: Findings from the 2004-05 National
198
WARNIN
G: Esti
mates o
ut of
date.
Please
chec
k Hea
lthStat
s NSW
for la
test e
stimate
s.
Health Survey. Sydney: Australian Centre for Asthma Monitoring, 2007. Available online atwww.asthmamonitoring.org (accesssed 10 May 2007).
3. Australian Centre for Asthma Monitoring. Survey questions for monitoring national asthma indicators. Sydney: Australian Centre for Asthma Monitoring, 2007. Available online atwww.asthmamonitoring.org (accesssed 10 May 2007).
4. Australian Centre for Asthma Monitoring. Patterns of medication use in Australia. Sydney:Australian Centre for Asthma Monitoring, 2007. Available online at www.asthmamonitoring.org(accesssed 10 May 2007).
5. Gibson PG, Coughlan J, Wilson AJ et al. Self management education and regular practitionerreview for adults with asthma. Cochrane Database of Systematic Reviews. Oxford: John Wiley &Sons, 2006. Abstract and plain language summary available online atwww.cochrane.org/reviews/en/ab001117.html (accessed 10 May 2007).
6. Douglass J, Aroni R, Goeman D, Stewart K, Sawyer S, Thien F, Abramson M. A qualitative studyof action plans for asthma. BMJ 2002; 324: 1003. Abstract available online atwww.bmj.com/cgi/content/abstract/324/7344/1003 (accessed 10 May 2007).
199
WARNIN
G: Esti
mates o
ut of
date.
Please
chec
k Hea
lthStat
s NSW
for la
test e
stimate
s.
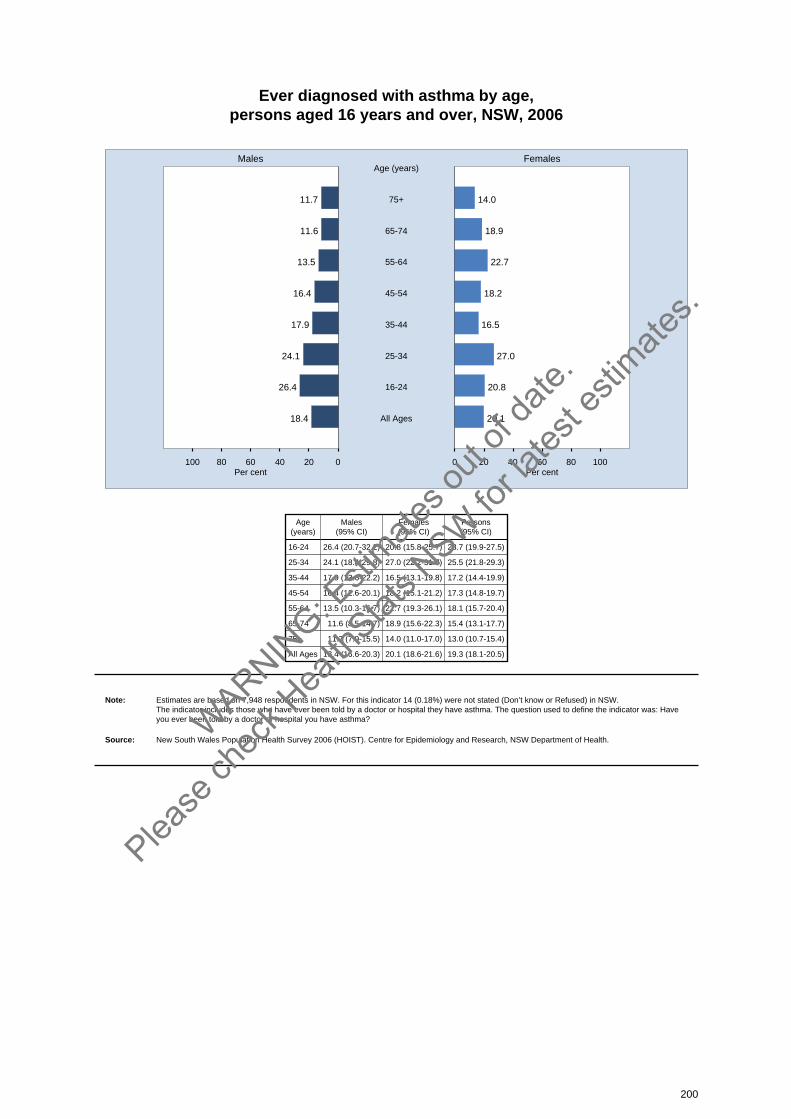
Ever diagnosed with asthma by age, persons aged 16 years and over, NSW, 2006
020406080100 0 20 40 60 80 100
Males Females
Per cent Per cent
11.7 14.075+
Age (years)
11.6 18.965-74
13.5 22.755-64
16.4 18.245-54
17.9 16.535-44
24.1 27.025-34
26.4 20.816-24
18.4 20.1All Ages
Age(years)
Males(95% CI)
Females(95% CI)
Persons(95% CI)
16-24 26.4 (20.7-32.2) 20.8 (15.8-25.7) 23.7 (19.9-27.5)
25-34 24.1 (18.4-29.8) 27.0 (22.2-31.7) 25.5 (21.8-29.3)
35-44 17.9 (13.6-22.2) 16.5 (13.1-19.8) 17.2 (14.4-19.9)
45-54 16.4 (12.6-20.1) 18.2 (15.1-21.2) 17.3 (14.8-19.7)
55-64 13.5 (10.3-16.7) 22.7 (19.3-26.1) 18.1 (15.7-20.4)
65-74 11.6 (8.5-14.7) 18.9 (15.6-22.3) 15.4 (13.1-17.7)
75+ 11.7 (7.9-15.5) 14.0 (11.0-17.0) 13.0 (10.7-15.4)
All Ages 18.4 (16.6-20.3) 20.1 (18.6-21.6) 19.3 (18.1-20.5)
Note: Estimates are based on 7,948 respondents in NSW. For this indicator 14 (0.18%) were not stated (Don’t know or Refused) in NSW. The indicator includes those who have ever been told by a doctor or hospital they have asthma. The question used to define the indicator was: Haveyou ever been told by a doctor or hospital you have asthma?
Source: New South Wales Population Health Survey 2006 (HOIST). Centre for Epidemiology and Research, NSW Department of Health.
200
WARNIN
G: Esti
mates o
ut of
date.
Please
chec
k Hea
lthStat
s NSW
for la
test e
stimate
s.
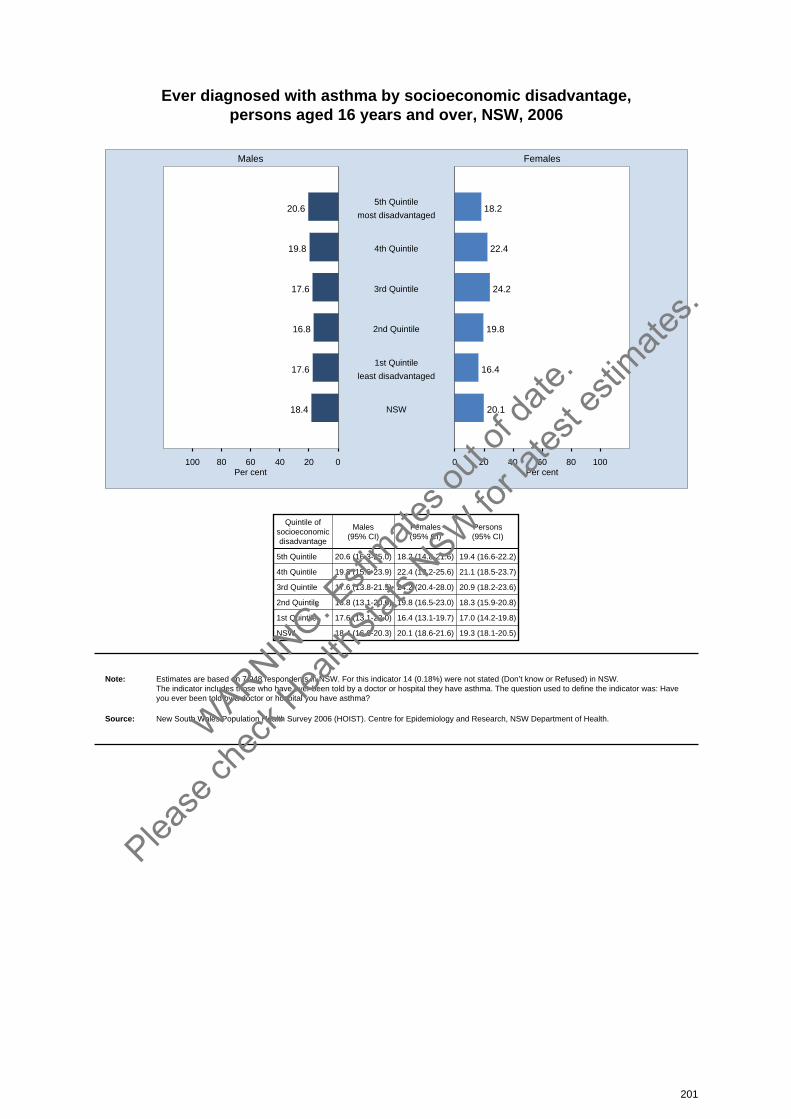
Ever diagnosed with asthma by socioeconomic disadvantage, persons aged 16 years and over, NSW, 2006
020406080100 0 20 40 60 80 100
Males Females
Per cent Per cent
20.6 18.25th Quintile
most disadvantaged
19.8 22.44th Quintile
17.6 24.23rd Quintile
16.8 19.82nd Quintile
17.6 16.41st Quintile
least disadvantaged
18.4 20.1NSW
Quintile ofsocioeconomicdisadvantage
Males(95% CI)
Females(95% CI)
Persons(95% CI)
5th Quintile 20.6 (16.3-25.0) 18.2 (14.8-21.6) 19.4 (16.6-22.2)
4th Quintile 19.8 (15.6-23.9) 22.4 (19.2-25.6) 21.1 (18.5-23.7)
3rd Quintile 17.6 (13.8-21.5) 24.2 (20.4-28.0) 20.9 (18.2-23.6)
2nd Quintile 16.8 (13.1-20.6) 19.8 (16.5-23.0) 18.3 (15.9-20.8)
1st Quintile 17.6 (13.1-22.0) 16.4 (13.1-19.7) 17.0 (14.2-19.8)
NSW 18.4 (16.6-20.3) 20.1 (18.6-21.6) 19.3 (18.1-20.5)
Note: Estimates are based on 7,948 respondents in NSW. For this indicator 14 (0.18%) were not stated (Don’t know or Refused) in NSW. The indicator includes those who have ever been told by a doctor or hospital they have asthma. The question used to define the indicator was: Haveyou ever been told by a doctor or hospital you have asthma?
Source: New South Wales Population Health Survey 2006 (HOIST). Centre for Epidemiology and Research, NSW Department of Health.
201
WARNIN
G: Esti
mates o
ut of
date.
Please
chec
k Hea
lthStat
s NSW
for la
test e
stimate
s.

Ever diagnosed with asthma by health area, persons aged 16 years and over, NSW, 2006
0 20 40 60 80 100 0 20 40 60 80 100
Males Females
Per cent Per cent
Sydney South West
South Eastern Sydney& Illawarra
Sydney West
Northern Sydney &Central Coast
Hunter & New England
North Coast
Greater Southern
Greater Western
Urban
Rural
NSW
AreaMales
(95% CI)Females(95% CI)
Persons(95% CI)
Sydney South West 17.3 (13.2-21.3) 18.0 (14.2-21.7) 17.6 (14.9-20.4)
South Eastern Sydney & Illawarra 18.6 (13.4-23.8) 20.4 (16.2-24.6) 19.5 (16.2-22.8)
Sydney West 14.5 (10.0-19.0) 21.4 (17.4-25.3) 17.9 (14.9-20.9)
Northern Sydney & Central Coast 18.2 (13.5-22.8) 17.1 (13.5-20.7) 17.6 (14.7-20.6)
Hunter & New England 21.7 (16.2-27.1) 20.9 (17.0-24.7) 21.3 (17.9-24.6)
North Coast 20.4 (15.4-25.4) 19.6 (15.7-23.4) 20.0 (16.8-23.1)
Greater Southern 21.4 (15.9-26.9) 24.4 (20.1-28.7) 22.9 (19.4-26.3)
Greater Western 21.3 (15.7-26.9) 28.0 (23.4-32.5) 24.6 (21.0-28.2)
Urban 17.2 (14.9-19.5) 19.1 (17.2-21.1) 18.2 (16.7-19.7)
Rural 21.3 (18.4-24.1) 22.3 (20.2-24.5) 21.8 (20.0-23.6)
NSW 18.4 (16.6-20.3) 20.1 (18.6-21.6) 19.3 (18.1-20.5)
Note: Estimates are based on 7,948 respondents in NSW. For this indicator 14 (0.18%) were not stated (Don’t know or Refused) in NSW. The indicator includes those who have ever been told by a doctor or hospital they have asthma. The question used to define the indicator was: Haveyou ever been told by a doctor or hospital you have asthma?
Source: New South Wales Population Health Survey 2006 (HOIST). Centre for Epidemiology and Research, NSW Department of Health.
202
WARNIN
G: Esti
mates o
ut of
date.
Please
chec
k Hea
lthStat
s NSW
for la
test e
stimate
s.
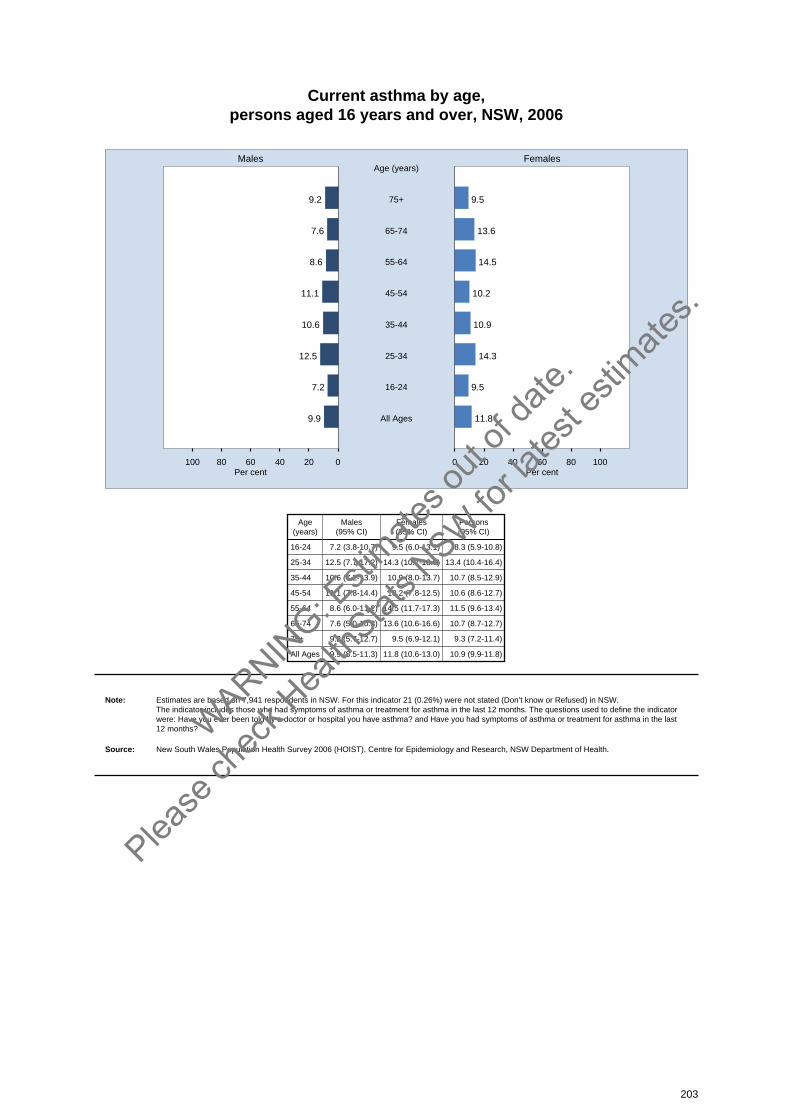
Current asthma by age, persons aged 16 years and over, NSW, 2006
020406080100 0 20 40 60 80 100
Males Females
Per cent Per cent
9.2 9.575+
Age (years)
7.6 13.665-74
8.6 14.555-64
11.1 10.245-54
10.6 10.935-44
12.5 14.325-34
7.2 9.516-24
9.9 11.8All Ages
Age(years)
Males(95% CI)
Females(95% CI)
Persons(95% CI)
16-24 7.2 (3.8-10.7) 9.5 (6.0-13.1) 8.3 (5.9-10.8)
25-34 12.5 (7.7-17.2) 14.3 (10.7-18.0) 13.4 (10.4-16.4)
35-44 10.6 (7.2-13.9) 10.9 (8.0-13.7) 10.7 (8.5-12.9)
45-54 11.1 (7.8-14.4) 10.2 (7.8-12.5) 10.6 (8.6-12.7)
55-64 8.6 (6.0-11.2) 14.5 (11.7-17.3) 11.5 (9.6-13.4)
65-74 7.6 (5.0-10.3) 13.6 (10.6-16.6) 10.7 (8.7-12.7)
75+ 9.2 (5.7-12.7) 9.5 (6.9-12.1) 9.3 (7.2-11.4)
All Ages 9.9 (8.5-11.3) 11.8 (10.6-13.0) 10.9 (9.9-11.8)
Note: Estimates are based on 7,941 respondents in NSW. For this indicator 21 (0.26%) were not stated (Don’t know or Refused) in NSW. The indicator includes those who had symptoms of asthma or treatment for asthma in the last 12 months. The questions used to define the indicatorwere: Have you ever been told by a doctor or hospital you have asthma? and Have you had symptoms of asthma or treatment for asthma in the last12 months?
Source: New South Wales Population Health Survey 2006 (HOIST). Centre for Epidemiology and Research, NSW Department of Health.
203
WARNIN
G: Esti
mates o
ut of
date.
Please
chec
k Hea
lthStat
s NSW
for la
test e
stimate
s.
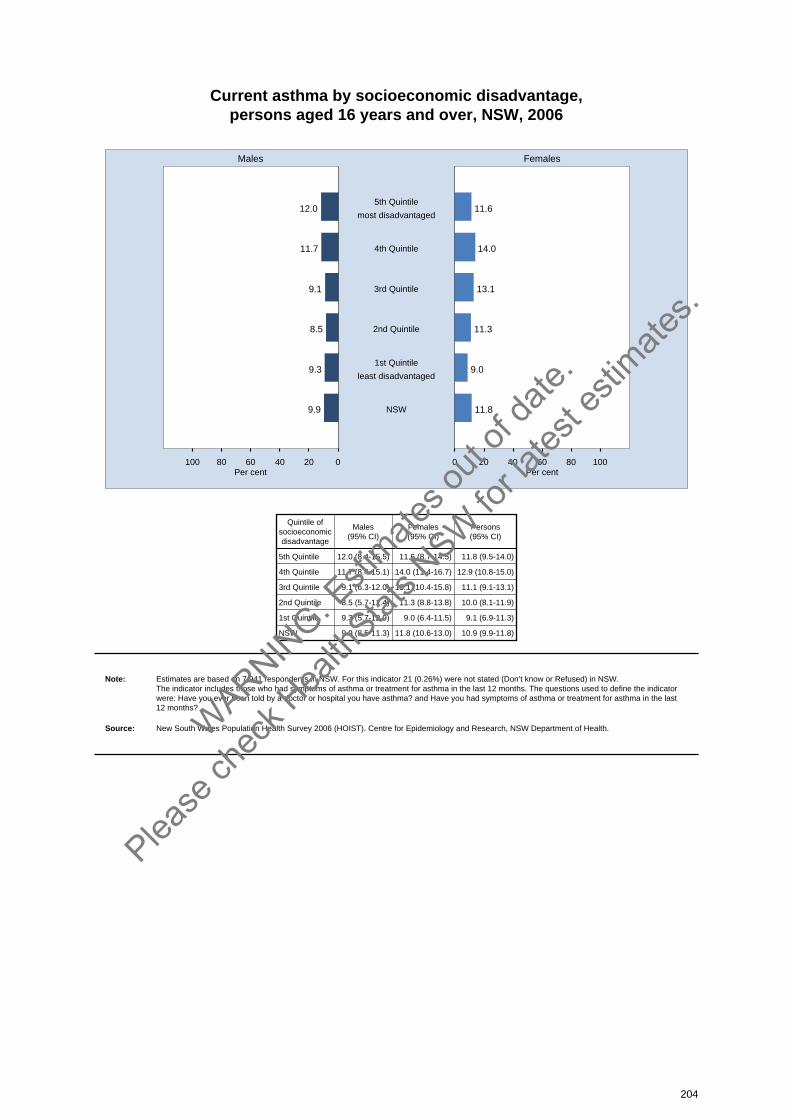
Current asthma by socioeconomic disadvantage, persons aged 16 years and over, NSW, 2006
020406080100 0 20 40 60 80 100
Males Females
Per cent Per cent
12.0 11.65th Quintile
most disadvantaged
11.7 14.04th Quintile
9.1 13.13rd Quintile
8.5 11.32nd Quintile
9.3 9.01st Quintile
least disadvantaged
9.9 11.8NSW
Quintile ofsocioeconomicdisadvantage
Males(95% CI)
Females(95% CI)
Persons(95% CI)
5th Quintile 12.0 (8.4-15.5) 11.6 (8.7-14.5) 11.8 (9.5-14.0)
4th Quintile 11.7 (8.4-15.1) 14.0 (11.4-16.7) 12.9 (10.8-15.0)
3rd Quintile 9.1 (6.3-12.0) 13.1 (10.4-15.8) 11.1 (9.1-13.1)
2nd Quintile 8.5 (5.7-11.4) 11.3 (8.8-13.8) 10.0 (8.1-11.9)
1st Quintile 9.3 (5.7-12.9) 9.0 (6.4-11.5) 9.1 (6.9-11.3)
NSW 9.9 (8.5-11.3) 11.8 (10.6-13.0) 10.9 (9.9-11.8)
Note: Estimates are based on 7,941 respondents in NSW. For this indicator 21 (0.26%) were not stated (Don’t know or Refused) in NSW. The indicator includes those who had symptoms of asthma or treatment for asthma in the last 12 months. The questions used to define the indicatorwere: Have you ever been told by a doctor or hospital you have asthma? and Have you had symptoms of asthma or treatment for asthma in the last12 months?
Source: New South Wales Population Health Survey 2006 (HOIST). Centre for Epidemiology and Research, NSW Department of Health.
204
WARNIN
G: Esti
mates o
ut of
date.
Please
chec
k Hea
lthStat
s NSW
for la
test e
stimate
s.
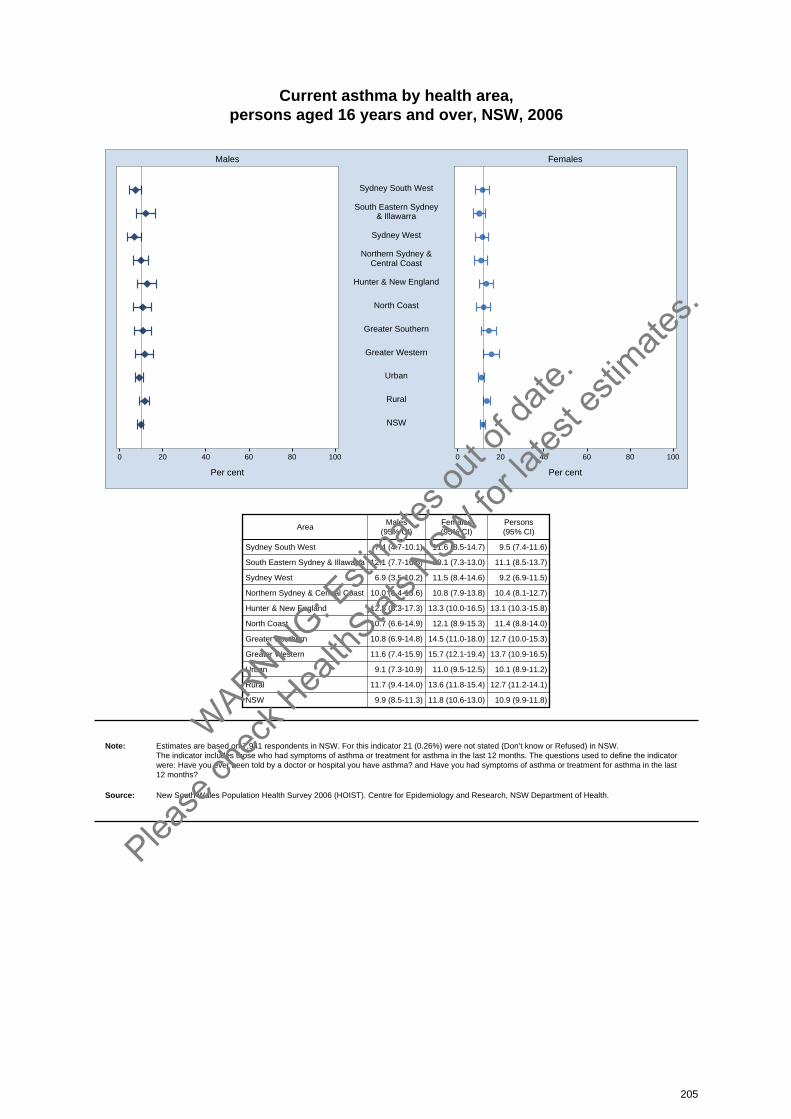
Current asthma by health area, persons aged 16 years and over, NSW, 2006
0 20 40 60 80 100 0 20 40 60 80 100
Males Females
Per cent Per cent
Sydney South West
South Eastern Sydney& Illawarra
Sydney West
Northern Sydney &Central Coast
Hunter & New England
North Coast
Greater Southern
Greater Western
Urban
Rural
NSW
AreaMales
(95% CI)Females(95% CI)
Persons(95% CI)
Sydney South West 7.4 (4.7-10.1) 11.6 (8.5-14.7) 9.5 (7.4-11.6)
South Eastern Sydney & Illawarra 12.1 (7.7-16.5) 10.1 (7.3-13.0) 11.1 (8.5-13.7)
Sydney West 6.9 (3.5-10.2) 11.5 (8.4-14.6) 9.2 (6.9-11.5)
Northern Sydney & Central Coast 10.0 (6.4-13.6) 10.8 (7.9-13.8) 10.4 (8.1-12.7)
Hunter & New England 12.8 (8.3-17.3) 13.3 (10.0-16.5) 13.1 (10.3-15.8)
North Coast 10.7 (6.6-14.9) 12.1 (8.9-15.3) 11.4 (8.8-14.0)
Greater Southern 10.8 (6.9-14.8) 14.5 (11.0-18.0) 12.7 (10.0-15.3)
Greater Western 11.6 (7.4-15.9) 15.7 (12.1-19.4) 13.7 (10.9-16.5)
Urban 9.1 (7.3-10.9) 11.0 (9.5-12.5) 10.1 (8.9-11.2)
Rural 11.7 (9.4-14.0) 13.6 (11.8-15.4) 12.7 (11.2-14.1)
NSW 9.9 (8.5-11.3) 11.8 (10.6-13.0) 10.9 (9.9-11.8)
Note: Estimates are based on 7,941 respondents in NSW. For this indicator 21 (0.26%) were not stated (Don’t know or Refused) in NSW. The indicator includes those who had symptoms of asthma or treatment for asthma in the last 12 months. The questions used to define the indicatorwere: Have you ever been told by a doctor or hospital you have asthma? and Have you had symptoms of asthma or treatment for asthma in the last12 months?
Source: New South Wales Population Health Survey 2006 (HOIST). Centre for Epidemiology and Research, NSW Department of Health.
205
WARNIN
G: Esti
mates o
ut of
date.
Please
chec
k Hea
lthStat
s NSW
for la
test e
stimate
s.

Asthma medications used in the last 12 months, persons who currently have asthma aged 16 years and over, NSW, 2006
020406080100 0 20 40 60 80 100
Males Females
Per cent Per cent
38.0 46.3Short-acting
bronchodilator
20.3 24.2
Combined inhaled steroid andlong-acting
bronchodilator
7.9 10.4Inhaled
corticosteroid
0.3 0.3Cromone
0.0 0.0Leukotriene receptor
antagonist
1.5 3.0Oral steroids
4.6 6.4Other
ResponseMales
(95% CI)Females(95% CI)
Persons(95% CI)
Short-acting bronchodilator 38.0 (32.7-43.3) 46.3 (42.1-50.5) 42.4 (39.0-45.7)
Combined inhaled steroid and long-acting bronchodilator 20.3 (15.8-24.8) 24.2 (20.8-27.7) 22.4 (19.6-25.2)
Inhaled corticosteroid 7.9 (4.9-10.8) 10.4 (7.9-13.0) 9.2 (7.2-11.1)
Cromone 0.3 (0.0-0.7) 0.3 (0.0-0.7) 0.3 (0.0-0.6)
Leukotriene receptor antagonist 0.0 (0.0-0.1) 0.0 (0.0-0.0) 0.0 (0.0-0.1)
Oral steroids 1.5 (0.3-2.7) 3.0 (1.5-4.5) 2.3 (1.3-3.3)
Other 4.6 (2.6-6.6) 6.4 (4.3-8.4) 5.5 (4.1-7.0)
Note: Estimates are based on 1,522 respondents in NSW. For this indicator 7 (0.46%) were not stated (Don’t know or Refused) in NSW. The questions used to define the indicator were: Have you ever been told by a doctor or hospital you have asthma?, Have you had symptoms ofasthma or treatment for asthma in the last 12 months?, What are the names or brands of all the medications you took for asthma in the last 12months? Respondents could mention more than one response. Percentages will total more than 100 per cent.
Source: New South Wales Population Health Survey 2006 (HOIST). Centre for Epidemiology and Research, NSW Department of Health.
206
WARNIN
G: Esti
mates o
ut of
date.
Please
chec
k Hea
lthStat
s NSW
for la
test e
stimate
s.
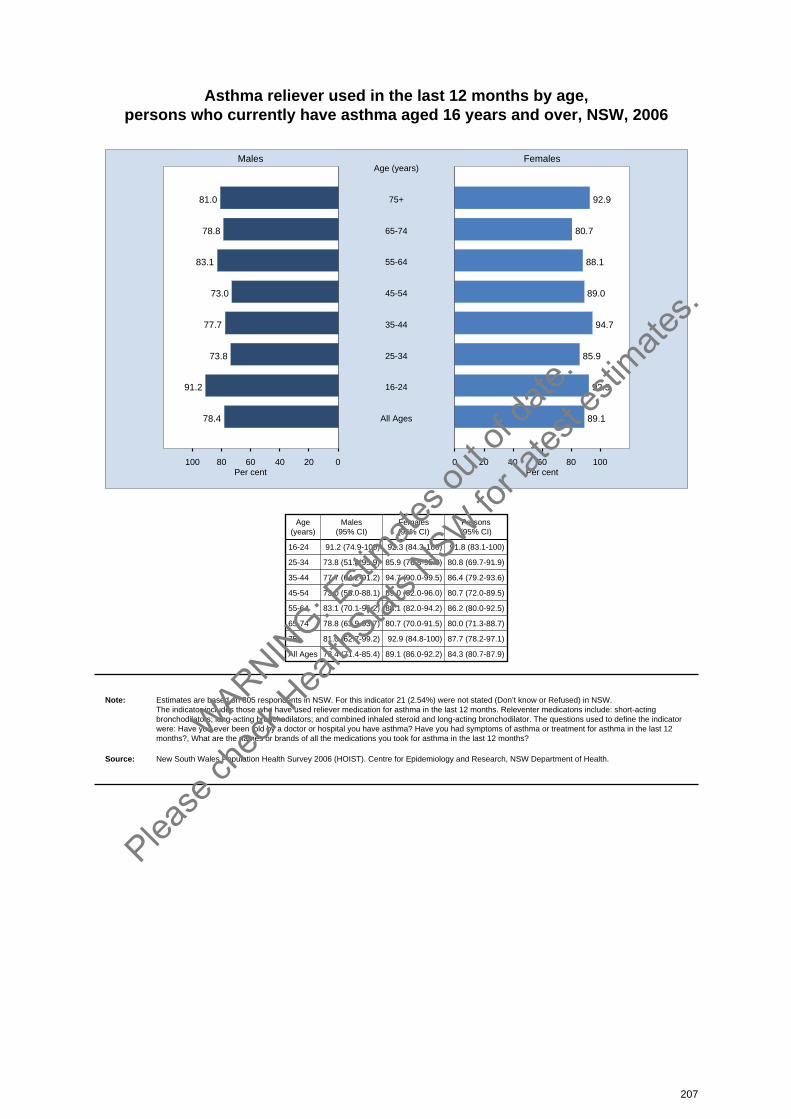
Asthma reliever used in the last 12 months by age, persons who currently have asthma aged 16 years and over, NSW, 2006
020406080100 0 20 40 60 80 100
Males Females
Per cent Per cent
81.0 92.975+
Age (years)
78.8 80.765-74
83.1 88.155-64
73.0 89.045-54
77.7 94.735-44
73.8 85.925-34
91.2 92.316-24
78.4 89.1All Ages
Age(years)
Males(95% CI)
Females(95% CI)
Persons(95% CI)
16-24 91.2 (74.9-100) 92.3 (84.3-100) 91.8 (83.1-100)
25-34 73.8 (51.8-95.9) 85.9 (76.8-95.0) 80.8 (69.7-91.9)
35-44 77.7 (64.2-91.2) 94.7 (90.0-99.5) 86.4 (79.2-93.6)
45-54 73.0 (58.0-88.1) 89.0 (82.0-96.0) 80.7 (72.0-89.5)
55-64 83.1 (70.1-96.2) 88.1 (82.0-94.2) 86.2 (80.0-92.5)
65-74 78.8 (63.9-93.7) 80.7 (70.0-91.5) 80.0 (71.3-88.7)
75+ 81.0 (62.7-99.2) 92.9 (84.8-100) 87.7 (78.2-97.1)
All Ages 78.4 (71.4-85.4) 89.1 (86.0-92.2) 84.3 (80.7-87.9)
Note: Estimates are based on 805 respondents in NSW. For this indicator 21 (2.54%) were not stated (Don’t know or Refused) in NSW. The indicator includes those who have used reliever medication for asthma in the last 12 months. Releventer medicatons include: short-actingbronchodilators; long-acting bronchodilators; and combined inhaled steroid and long-acting bronchodilator. The questions used to define the indicatorwere: Have you ever been told by a doctor or hospital you have asthma? Have you had symptoms of asthma or treatment for asthma in the last 12months?, What are the names or brands of all the medications you took for asthma in the last 12 months?
Source: New South Wales Population Health Survey 2006 (HOIST). Centre for Epidemiology and Research, NSW Department of Health.
207
WARNIN
G: Esti
mates o
ut of
date.
Please
chec
k Hea
lthStat
s NSW
for la
test e
stimate
s.
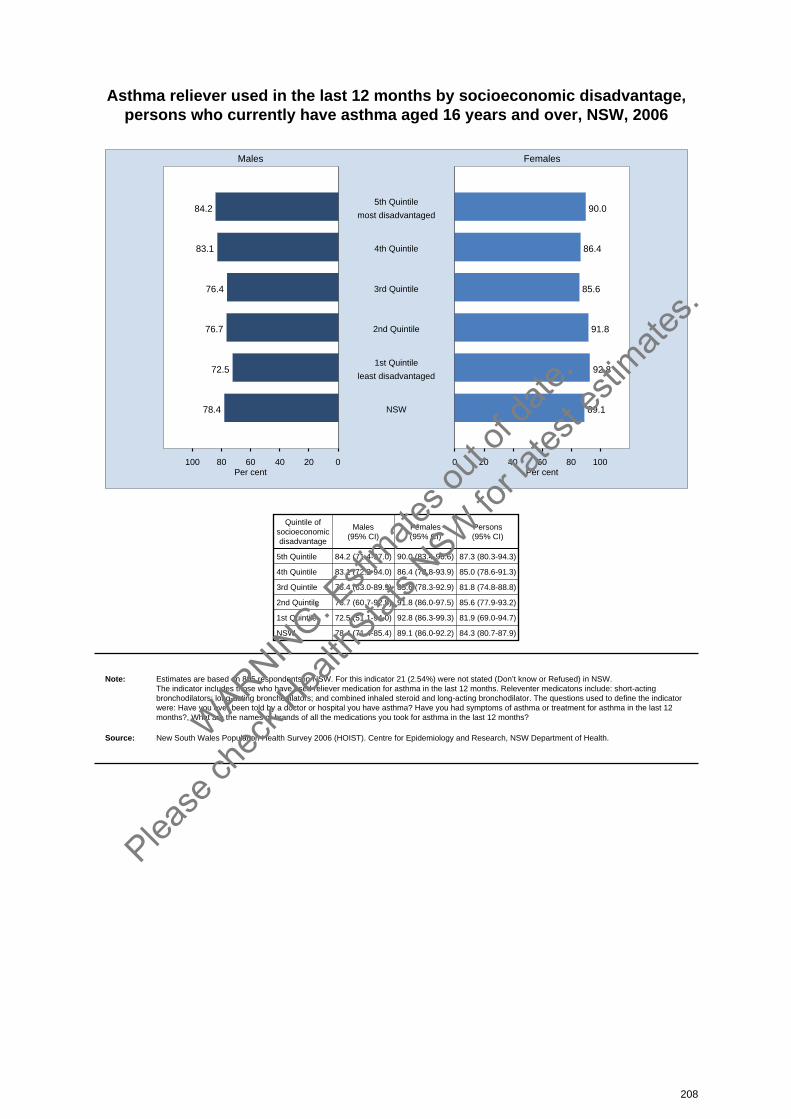
Asthma reliever used in the last 12 months by socioeconomic disadvantage, persons who currently have asthma aged 16 years and over, NSW, 2006
020406080100 0 20 40 60 80 100
Males Females
Per cent Per cent
84.2 90.05th Quintile
most disadvantaged
83.1 86.44th Quintile
76.4 85.63rd Quintile
76.7 91.82nd Quintile
72.5 92.81st Quintile
least disadvantaged
78.4 89.1NSW
Quintile ofsocioeconomicdisadvantage
Males(95% CI)
Females(95% CI)
Persons(95% CI)
5th Quintile 84.2 (71.4-97.0) 90.0 (83.4-96.6) 87.3 (80.3-94.3)
4th Quintile 83.1 (72.2-94.0) 86.4 (78.8-93.9) 85.0 (78.6-91.3)
3rd Quintile 76.4 (63.0-89.9) 85.6 (78.3-92.9) 81.8 (74.8-88.8)
2nd Quintile 76.7 (60.7-92.8) 91.8 (86.0-97.5) 85.6 (77.9-93.2)
1st Quintile 72.5 (51.1-94.0) 92.8 (86.3-99.3) 81.9 (69.0-94.7)
NSW 78.4 (71.4-85.4) 89.1 (86.0-92.2) 84.3 (80.7-87.9)
Note: Estimates are based on 805 respondents in NSW. For this indicator 21 (2.54%) were not stated (Don’t know or Refused) in NSW. The indicator includes those who have used reliever medication for asthma in the last 12 months. Releventer medicatons include: short-actingbronchodilators; long-acting bronchodilators; and combined inhaled steroid and long-acting bronchodilator. The questions used to define the indicatorwere: Have you ever been told by a doctor or hospital you have asthma? Have you had symptoms of asthma or treatment for asthma in the last 12months?, What are the names or brands of all the medications you took for asthma in the last 12 months?
Source: New South Wales Population Health Survey 2006 (HOIST). Centre for Epidemiology and Research, NSW Department of Health.
208
WARNIN
G: Esti
mates o
ut of
date.
Please
chec
k Hea
lthStat
s NSW
for la
test e
stimate
s.
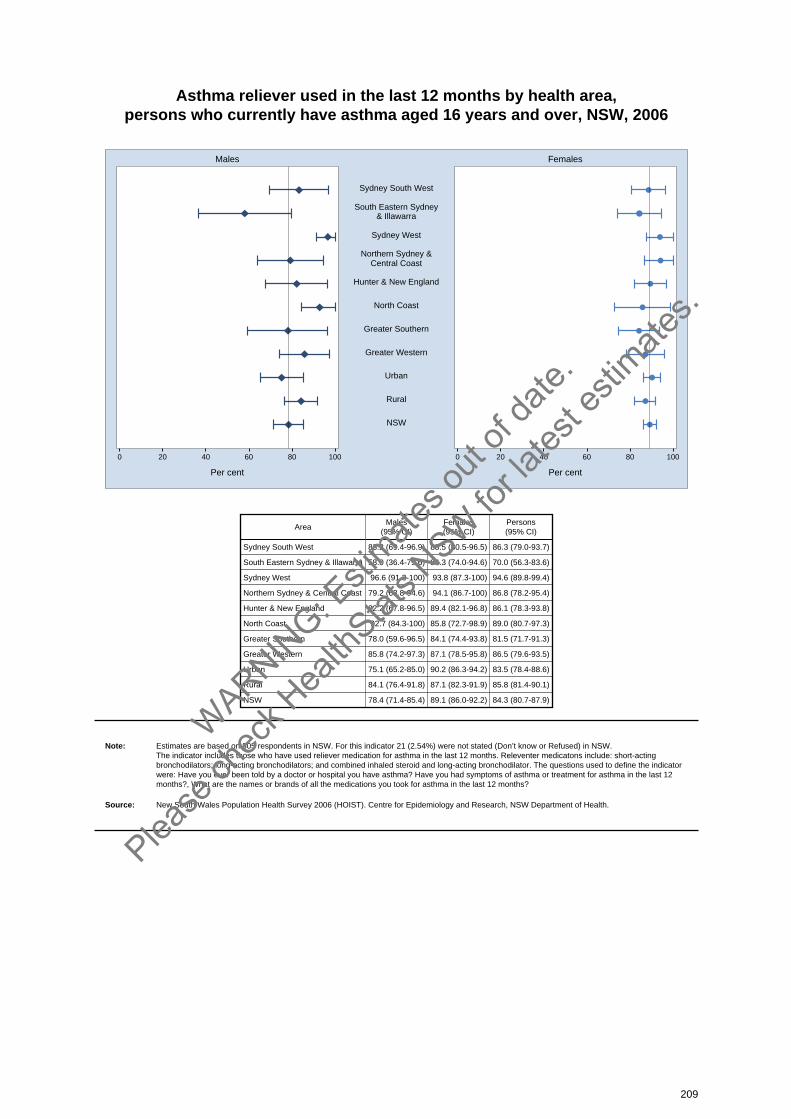
Asthma reliever used in the last 12 months by health area, persons who currently have asthma aged 16 years and over, NSW, 2006
0 20 40 60 80 100 0 20 40 60 80 100
Males Females
Per cent Per cent
Sydney South West
South Eastern Sydney& Illawarra
Sydney West
Northern Sydney &Central Coast
Hunter & New England
North Coast
Greater Southern
Greater Western
Urban
Rural
NSW
AreaMales
(95% CI)Females(95% CI)
Persons(95% CI)
Sydney South West 83.2 (69.4-96.9) 88.5 (80.5-96.5) 86.3 (79.0-93.7)
South Eastern Sydney & Illawarra 58.0 (36.4-79.6) 84.3 (74.0-94.6) 70.0 (56.3-83.6)
Sydney West 96.6 (91.3-100) 93.8 (87.3-100) 94.6 (89.8-99.4)
Northern Sydney & Central Coast 79.2 (63.8-94.6) 94.1 (86.7-100) 86.8 (78.2-95.4)
Hunter & New England 82.2 (67.8-96.5) 89.4 (82.1-96.8) 86.1 (78.3-93.8)
North Coast 92.7 (84.3-100) 85.8 (72.7-98.9) 89.0 (80.7-97.3)
Greater Southern 78.0 (59.6-96.5) 84.1 (74.4-93.8) 81.5 (71.7-91.3)
Greater Western 85.8 (74.2-97.3) 87.1 (78.5-95.8) 86.5 (79.6-93.5)
Urban 75.1 (65.2-85.0) 90.2 (86.3-94.2) 83.5 (78.4-88.6)
Rural 84.1 (76.4-91.8) 87.1 (82.3-91.9) 85.8 (81.4-90.1)
NSW 78.4 (71.4-85.4) 89.1 (86.0-92.2) 84.3 (80.7-87.9)
Note: Estimates are based on 805 respondents in NSW. For this indicator 21 (2.54%) were not stated (Don’t know or Refused) in NSW. The indicator includes those who have used reliever medication for asthma in the last 12 months. Releventer medicatons include: short-actingbronchodilators; long-acting bronchodilators; and combined inhaled steroid and long-acting bronchodilator. The questions used to define the indicatorwere: Have you ever been told by a doctor or hospital you have asthma? Have you had symptoms of asthma or treatment for asthma in the last 12months?, What are the names or brands of all the medications you took for asthma in the last 12 months?
Source: New South Wales Population Health Survey 2006 (HOIST). Centre for Epidemiology and Research, NSW Department of Health.
209
WARNIN
G: Esti
mates o
ut of
date.
Please
chec
k Hea
lthStat
s NSW
for la
test e
stimate
s.
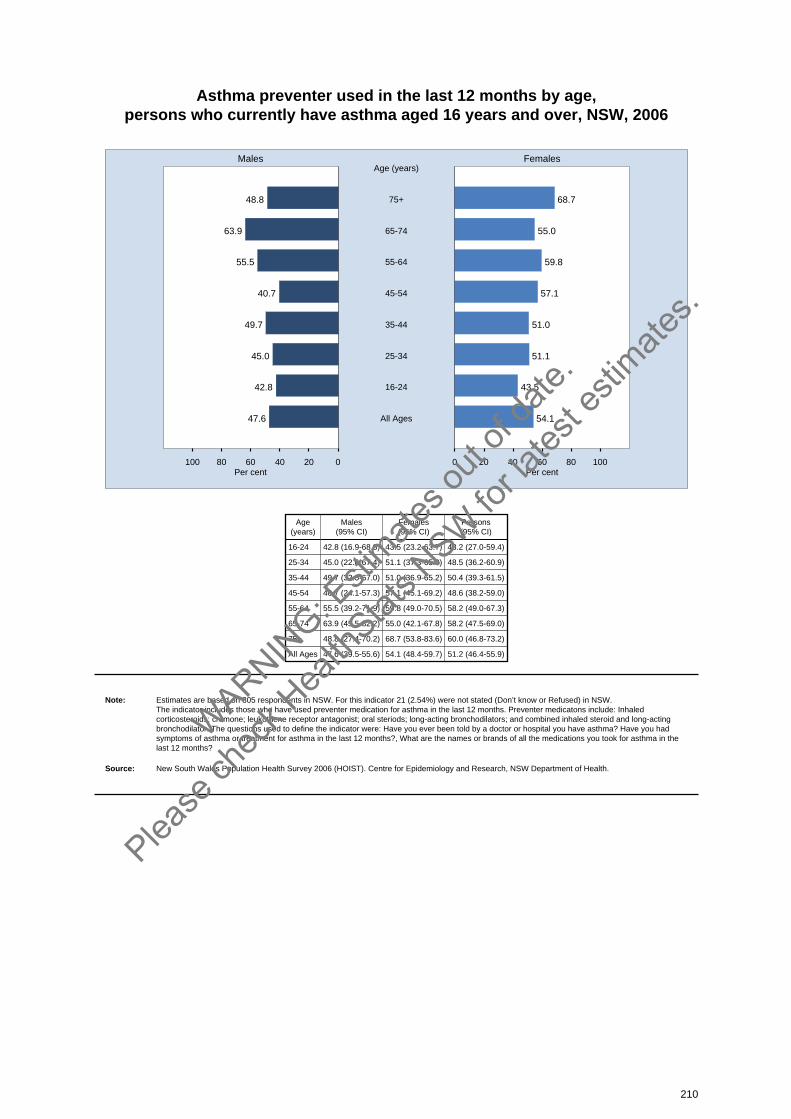
Asthma preventer used in the last 12 months by age, persons who currently have asthma aged 16 years and over, NSW, 2006
020406080100 0 20 40 60 80 100
Males Females
Per cent Per cent
48.8 68.775+
Age (years)
63.9 55.065-74
55.5 59.855-64
40.7 57.145-54
49.7 51.035-44
45.0 51.125-34
42.8 43.516-24
47.6 54.1All Ages
Age(years)
Males(95% CI)
Females(95% CI)
Persons(95% CI)
16-24 42.8 (16.9-68.8) 43.5 (23.2-63.7) 43.2 (27.0-59.4)
25-34 45.0 (22.6-67.4) 51.1 (37.3-65.0) 48.5 (36.2-60.9)
35-44 49.7 (32.5-67.0) 51.0 (36.9-65.2) 50.4 (39.3-61.5)
45-54 40.7 (24.1-57.3) 57.1 (45.1-69.2) 48.6 (38.2-59.0)
55-64 55.5 (39.2-71.9) 59.8 (49.0-70.5) 58.2 (49.0-67.3)
65-74 63.9 (45.5-82.2) 55.0 (42.1-67.8) 58.2 (47.5-69.0)
75+ 48.8 (27.4-70.2) 68.7 (53.8-83.6) 60.0 (46.8-73.2)
All Ages 47.6 (39.5-55.6) 54.1 (48.4-59.7) 51.2 (46.4-55.9)
Note: Estimates are based on 805 respondents in NSW. For this indicator 21 (2.54%) were not stated (Don’t know or Refused) in NSW. The indicator includes those who have used preventer medication for asthma in the last 12 months. Preventer medicatons include: Inhaledcorticosteroids; cromone; leukotriene receptor antagonist; oral steriods; long-acting bronchodilators; and combined inhaled steroid and long-actingbronchodilator. The questions used to define the indicator were: Have you ever been told by a doctor or hospital you have asthma? Have you hadsymptoms of asthma or treatment for asthma in the last 12 months?, What are the names or brands of all the medications you took for asthma in thelast 12 months?
Source: New South Wales Population Health Survey 2006 (HOIST). Centre for Epidemiology and Research, NSW Department of Health.
210
WARNIN
G: Esti
mates o
ut of
date.
Please
chec
k Hea
lthStat
s NSW
for la
test e
stimate
s.
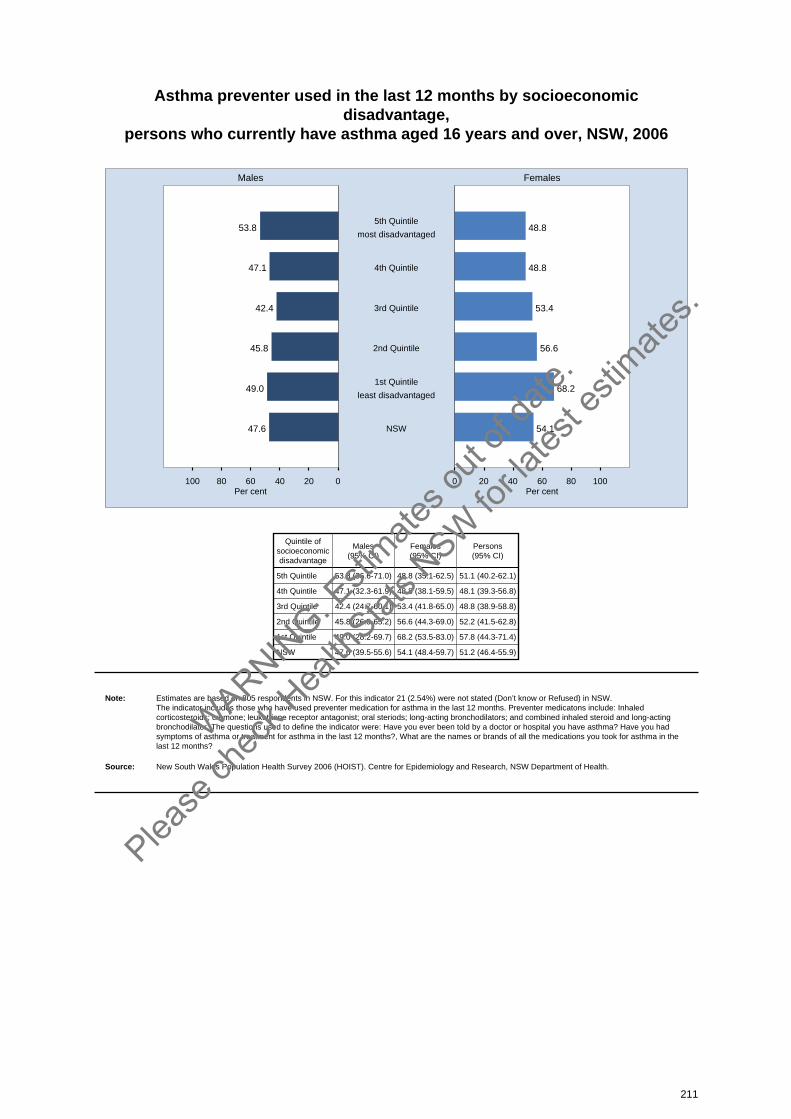
Asthma preventer used in the last 12 months by socioeconomicdisadvantage,
persons who currently have asthma aged 16 years and over, NSW, 2006
020406080100 0 20 40 60 80 100
Males Females
Per cent Per cent
53.8 48.85th Quintile
most disadvantaged
47.1 48.84th Quintile
42.4 53.43rd Quintile
45.8 56.62nd Quintile
49.0 68.21st Quintile
least disadvantaged
47.6 54.1NSW
Quintile ofsocioeconomicdisadvantage
Males(95% CI)
Females(95% CI)
Persons(95% CI)
5th Quintile 53.8 (36.6-71.0) 48.8 (35.1-62.5) 51.1 (40.2-62.1)
4th Quintile 47.1 (32.3-61.9) 48.8 (38.1-59.5) 48.1 (39.3-56.8)
3rd Quintile 42.4 (24.7-60.1) 53.4 (41.8-65.0) 48.8 (38.9-58.8)
2nd Quintile 45.8 (26.5-65.2) 56.6 (44.3-69.0) 52.2 (41.5-62.8)
1st Quintile 49.0 (28.2-69.7) 68.2 (53.5-83.0) 57.8 (44.3-71.4)
NSW 47.6 (39.5-55.6) 54.1 (48.4-59.7) 51.2 (46.4-55.9)
Note: Estimates are based on 805 respondents in NSW. For this indicator 21 (2.54%) were not stated (Don’t know or Refused) in NSW. The indicator includes those who have used preventer medication for asthma in the last 12 months. Preventer medicatons include: Inhaledcorticosteroids; cromone; leukotriene receptor antagonist; oral steriods; long-acting bronchodilators; and combined inhaled steroid and long-actingbronchodilator. The questions used to define the indicator were: Have you ever been told by a doctor or hospital you have asthma? Have you hadsymptoms of asthma or treatment for asthma in the last 12 months?, What are the names or brands of all the medications you took for asthma in thelast 12 months?
Source: New South Wales Population Health Survey 2006 (HOIST). Centre for Epidemiology and Research, NSW Department of Health.
211
WARNIN
G: Esti
mates o
ut of
date.
Please
chec
k Hea
lthStat
s NSW
for la
test e
stimate
s.
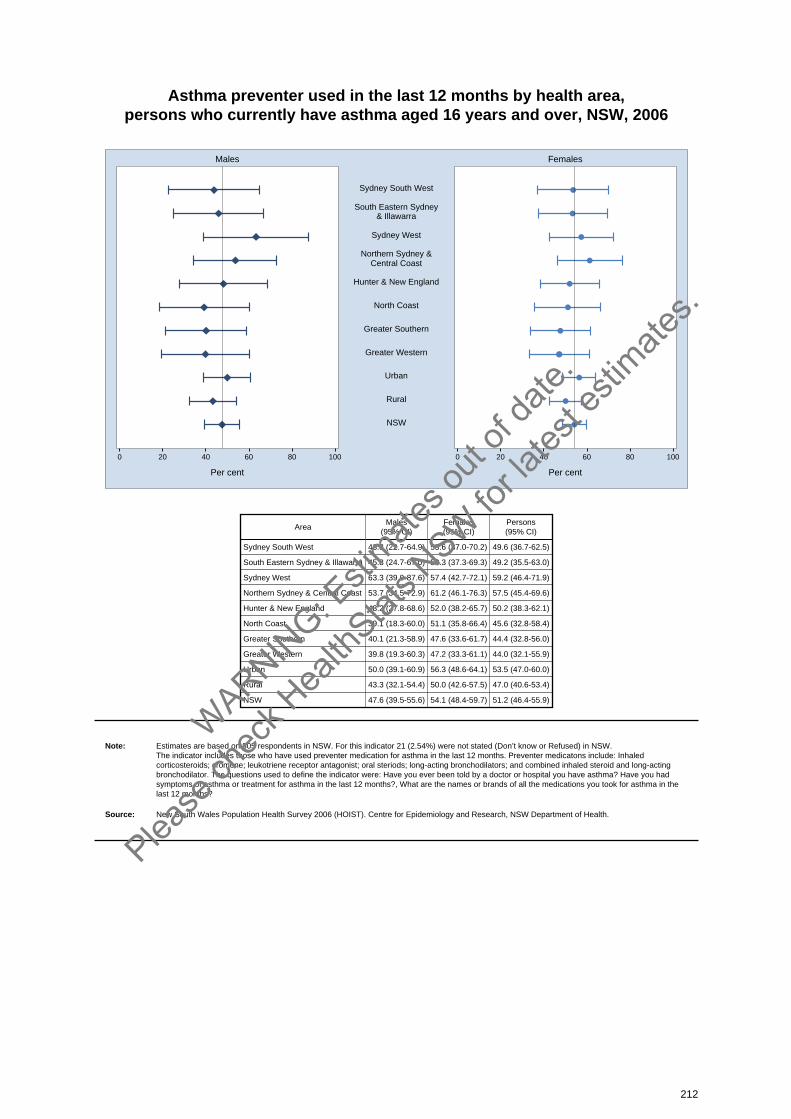
Asthma preventer used in the last 12 months by health area, persons who currently have asthma aged 16 years and over, NSW, 2006
0 20 40 60 80 100 0 20 40 60 80 100
Males Females
Per cent Per cent
Sydney South West
South Eastern Sydney& Illawarra
Sydney West
Northern Sydney &Central Coast
Hunter & New England
North Coast
Greater Southern
Greater Western
Urban
Rural
NSW
AreaMales
(95% CI)Females(95% CI)
Persons(95% CI)
Sydney South West 43.8 (22.7-64.9) 53.6 (37.0-70.2) 49.6 (36.7-62.5)
South Eastern Sydney & Illawarra 45.8 (24.7-67.0) 53.3 (37.3-69.3) 49.2 (35.5-63.0)
Sydney West 63.3 (39.0-87.6) 57.4 (42.7-72.1) 59.2 (46.4-71.9)
Northern Sydney & Central Coast 53.7 (34.5-72.9) 61.2 (46.1-76.3) 57.5 (45.4-69.6)
Hunter & New England 48.2 (27.8-68.6) 52.0 (38.2-65.7) 50.2 (38.3-62.1)
North Coast 39.1 (18.3-60.0) 51.1 (35.8-66.4) 45.6 (32.8-58.4)
Greater Southern 40.1 (21.3-58.9) 47.6 (33.6-61.7) 44.4 (32.8-56.0)
Greater Western 39.8 (19.3-60.3) 47.2 (33.3-61.1) 44.0 (32.1-55.9)
Urban 50.0 (39.1-60.9) 56.3 (48.6-64.1) 53.5 (47.0-60.0)
Rural 43.3 (32.1-54.4) 50.0 (42.6-57.5) 47.0 (40.6-53.4)
NSW 47.6 (39.5-55.6) 54.1 (48.4-59.7) 51.2 (46.4-55.9)
Note: Estimates are based on 805 respondents in NSW. For this indicator 21 (2.54%) were not stated (Don’t know or Refused) in NSW. The indicator includes those who have used preventer medication for asthma in the last 12 months. Preventer medicatons include: Inhaledcorticosteroids; cromone; leukotriene receptor antagonist; oral steriods; long-acting bronchodilators; and combined inhaled steroid and long-actingbronchodilator. The questions used to define the indicator were: Have you ever been told by a doctor or hospital you have asthma? Have you hadsymptoms of asthma or treatment for asthma in the last 12 months?, What are the names or brands of all the medications you took for asthma in thelast 12 months?
Source: New South Wales Population Health Survey 2006 (HOIST). Centre for Epidemiology and Research, NSW Department of Health.
212
WARNIN
G: Esti
mates o
ut of
date.
Please
chec
k Hea
lthStat
s NSW
for la
test e
stimate
s.
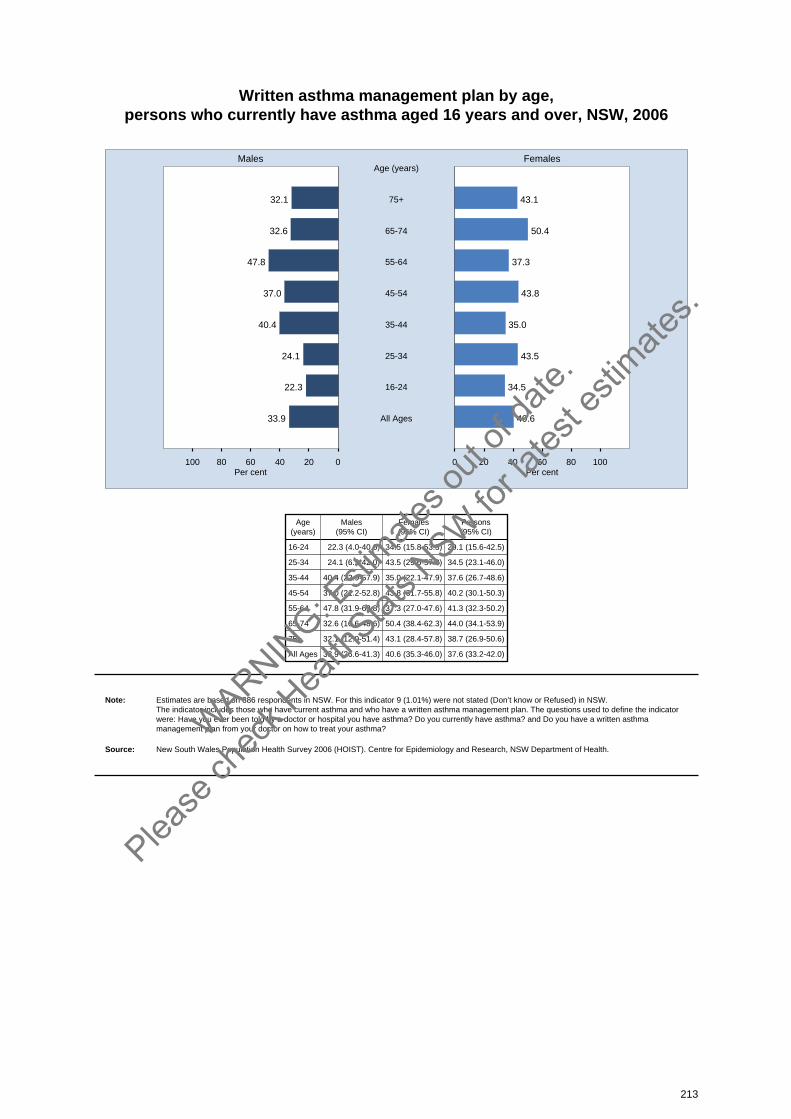
Written asthma management plan by age, persons who currently have asthma aged 16 years and over, NSW, 2006
020406080100 0 20 40 60 80 100
Males Females
Per cent Per cent
32.1 43.175+
Age (years)
32.6 50.465-74
47.8 37.355-64
37.0 43.845-54
40.4 35.035-44
24.1 43.525-34
22.3 34.516-24
33.9 40.6All Ages
Age(years)
Males(95% CI)
Females(95% CI)
Persons(95% CI)
16-24 22.3 (4.0-40.6) 34.5 (15.8-53.3) 29.1 (15.6-42.5)
25-34 24.1 (6.2-42.0) 43.5 (29.6-57.3) 34.5 (23.1-46.0)
35-44 40.4 (22.9-57.9) 35.0 (22.1-47.9) 37.6 (26.7-48.6)
45-54 37.0 (21.2-52.8) 43.8 (31.7-55.8) 40.2 (30.1-50.3)
55-64 47.8 (31.9-63.8) 37.3 (27.0-47.6) 41.3 (32.3-50.2)
65-74 32.6 (16.6-48.6) 50.4 (38.4-62.3) 44.0 (34.1-53.9)
75+ 32.1 (12.9-51.4) 43.1 (28.4-57.8) 38.7 (26.9-50.6)
All Ages 33.9 (26.6-41.3) 40.6 (35.3-46.0) 37.6 (33.2-42.0)
Note: Estimates are based on 886 respondents in NSW. For this indicator 9 (1.01%) were not stated (Don’t know or Refused) in NSW. The indicator includes those who have current asthma and who have a written asthma management plan. The questions used to define the indicatorwere: Have you ever been told by a doctor or hospital you have asthma? Do you currently have asthma? and Do you have a written asthmamanagement plan from your doctor on how to treat your asthma?
Source: New South Wales Population Health Survey 2006 (HOIST). Centre for Epidemiology and Research, NSW Department of Health.
213
WARNIN
G: Esti
mates o
ut of
date.
Please
chec
k Hea
lthStat
s NSW
for la
test e
stimate
s.
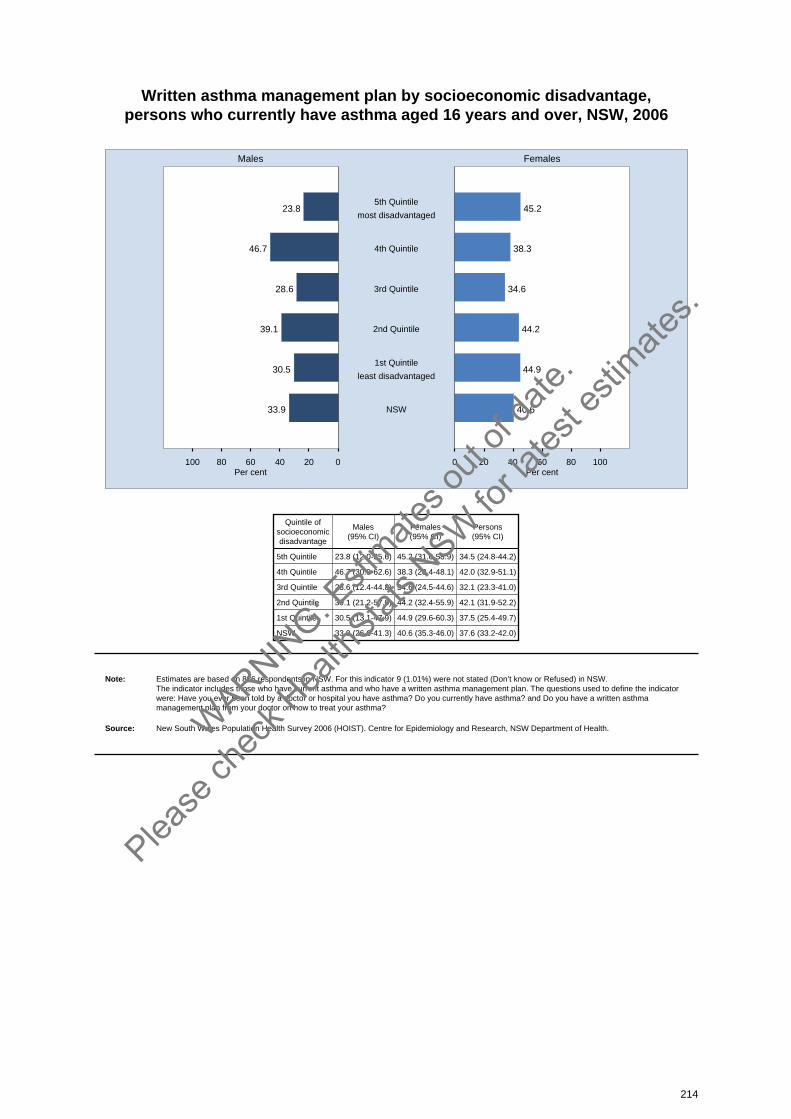
Written asthma management plan by socioeconomic disadvantage, persons who currently have asthma aged 16 years and over, NSW, 2006
020406080100 0 20 40 60 80 100
Males Females
Per cent Per cent
23.8 45.25th Quintile
most disadvantaged
46.7 38.34th Quintile
28.6 34.63rd Quintile
39.1 44.22nd Quintile
30.5 44.91st Quintile
least disadvantaged
33.9 40.6NSW
Quintile ofsocioeconomicdisadvantage
Males(95% CI)
Females(95% CI)
Persons(95% CI)
5th Quintile 23.8 (12.0-35.6) 45.2 (31.6-58.9) 34.5 (24.8-44.2)
4th Quintile 46.7 (30.9-62.6) 38.3 (28.4-48.1) 42.0 (32.9-51.1)
3rd Quintile 28.6 (12.4-44.8) 34.6 (24.5-44.6) 32.1 (23.3-41.0)
2nd Quintile 39.1 (21.2-57.0) 44.2 (32.4-55.9) 42.1 (31.9-52.2)
1st Quintile 30.5 (13.1-47.9) 44.9 (29.6-60.3) 37.5 (25.4-49.7)
NSW 33.9 (26.6-41.3) 40.6 (35.3-46.0) 37.6 (33.2-42.0)
Note: Estimates are based on 886 respondents in NSW. For this indicator 9 (1.01%) were not stated (Don’t know or Refused) in NSW. The indicator includes those who have current asthma and who have a written asthma management plan. The questions used to define the indicatorwere: Have you ever been told by a doctor or hospital you have asthma? Do you currently have asthma? and Do you have a written asthmamanagement plan from your doctor on how to treat your asthma?
Source: New South Wales Population Health Survey 2006 (HOIST). Centre for Epidemiology and Research, NSW Department of Health.
214
WARNIN
G: Esti
mates o
ut of
date.
Please
chec
k Hea
lthStat
s NSW
for la
test e
stimate
s.
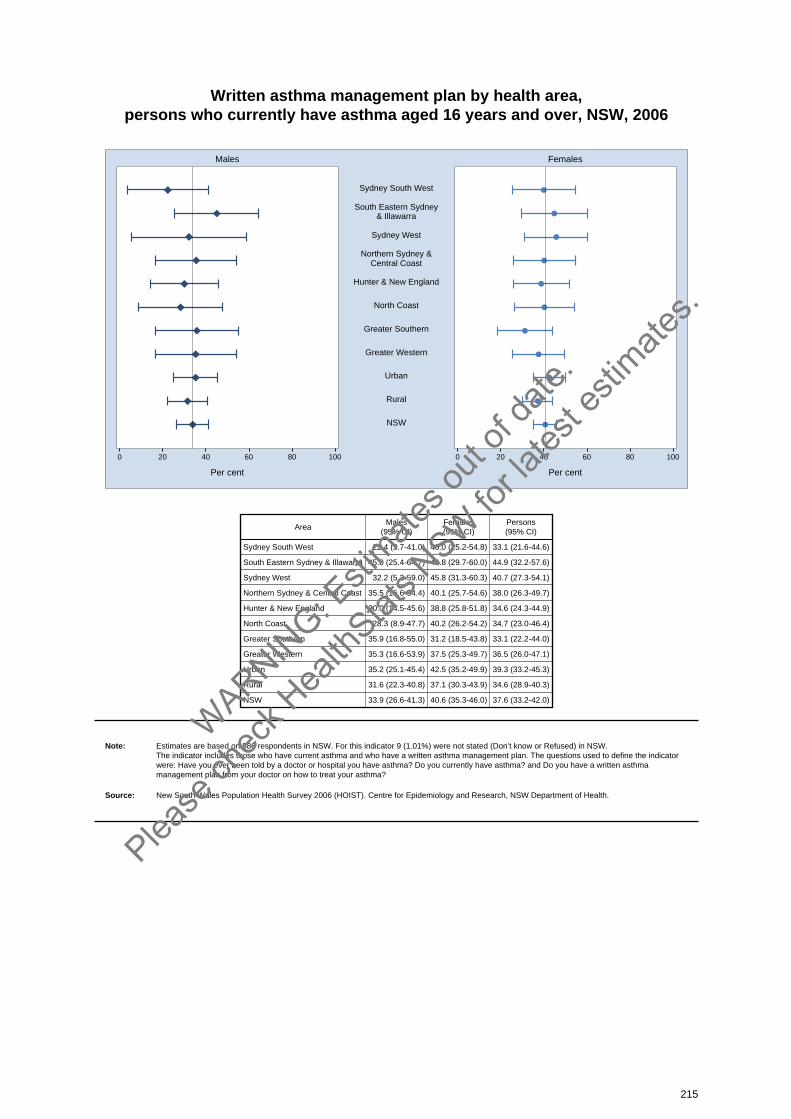
Written asthma management plan by health area, persons who currently have asthma aged 16 years and over, NSW, 2006
0 20 40 60 80 100 0 20 40 60 80 100
Males Females
Per cent Per cent
Sydney South West
South Eastern Sydney& Illawarra
Sydney West
Northern Sydney &Central Coast
Hunter & New England
North Coast
Greater Southern
Greater Western
Urban
Rural
NSW
AreaMales
(95% CI)Females(95% CI)
Persons(95% CI)
Sydney South West 22.4 (3.7-41.0) 40.0 (25.2-54.8) 33.1 (21.6-44.6)
South Eastern Sydney & Illawarra 45.0 (25.4-64.7) 44.8 (29.7-60.0) 44.9 (32.2-57.6)
Sydney West 32.2 (5.3-59.0) 45.8 (31.3-60.3) 40.7 (27.3-54.1)
Northern Sydney & Central Coast 35.5 (16.6-54.4) 40.1 (25.7-54.6) 38.0 (26.3-49.7)
Hunter & New England 30.0 (14.5-45.6) 38.8 (25.8-51.8) 34.6 (24.3-44.9)
North Coast 28.3 (8.9-47.7) 40.2 (26.2-54.2) 34.7 (23.0-46.4)
Greater Southern 35.9 (16.8-55.0) 31.2 (18.5-43.8) 33.1 (22.2-44.0)
Greater Western 35.3 (16.6-53.9) 37.5 (25.3-49.7) 36.5 (26.0-47.1)
Urban 35.2 (25.1-45.4) 42.5 (35.2-49.9) 39.3 (33.2-45.3)
Rural 31.6 (22.3-40.8) 37.1 (30.3-43.9) 34.6 (28.9-40.3)
NSW 33.9 (26.6-41.3) 40.6 (35.3-46.0) 37.6 (33.2-42.0)
Note: Estimates are based on 886 respondents in NSW. For this indicator 9 (1.01%) were not stated (Don’t know or Refused) in NSW. The indicator includes those who have current asthma and who have a written asthma management plan. The questions used to define the indicatorwere: Have you ever been told by a doctor or hospital you have asthma? Do you currently have asthma? and Do you have a written asthmamanagement plan from your doctor on how to treat your asthma?
Source: New South Wales Population Health Survey 2006 (HOIST). Centre for Epidemiology and Research, NSW Department of Health.
215
WARNIN
G: Esti
mates o
ut of
date.
Please
chec
k Hea
lthStat
s NSW
for la
test e
stimate
s.
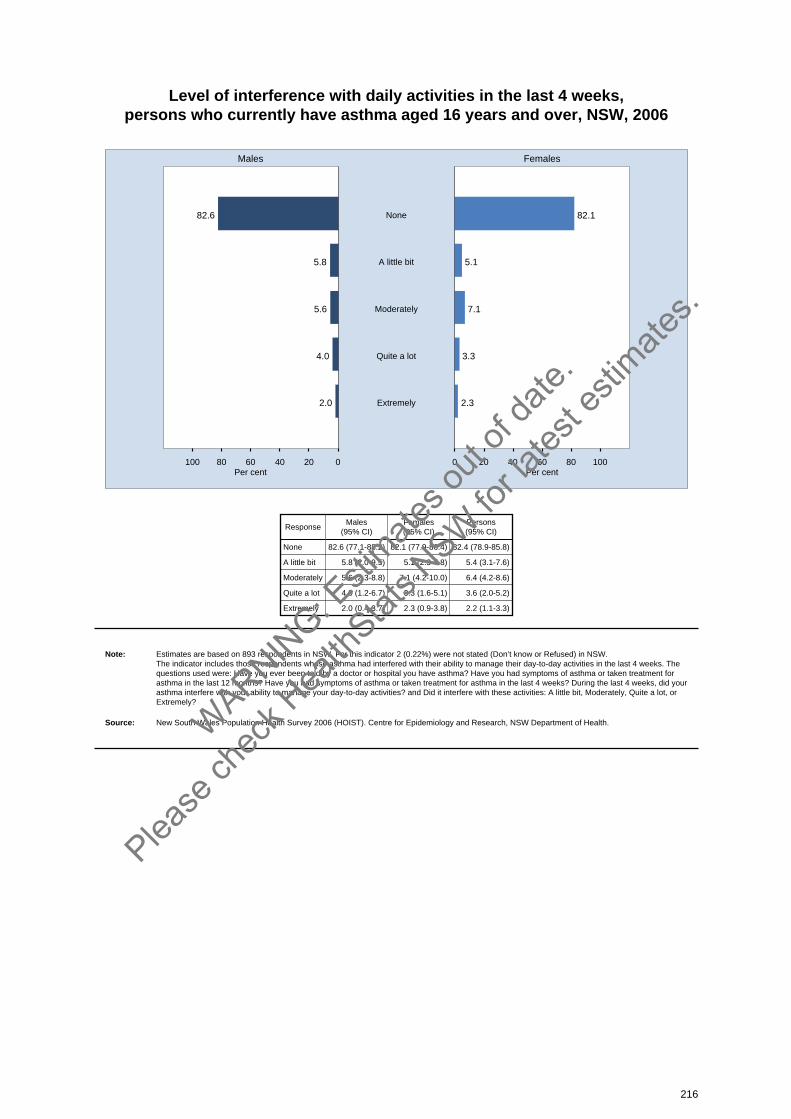
Level of interference with daily activities in the last 4 weeks, persons who currently have asthma aged 16 years and over, NSW, 2006
020406080100 0 20 40 60 80 100
Males Females
Per cent Per cent
82.6 82.1None
5.8 5.1A little bit
5.6 7.1Moderately
4.0 3.3Quite a lot
2.0 2.3Extremely
ResponseMales
(95% CI)Females(95% CI)
Persons(95% CI)
None 82.6 (77.1-88.2) 82.1 (77.9-86.4) 82.4 (78.9-85.8)
A little bit 5.8 (2.0-9.5) 5.1 (2.3-7.8) 5.4 (3.1-7.6)
Moderately 5.6 (2.3-8.8) 7.1 (4.2-10.0) 6.4 (4.2-8.6)
Quite a lot 4.0 (1.2-6.7) 3.3 (1.6-5.1) 3.6 (2.0-5.2)
Extremely 2.0 (0.4-3.7) 2.3 (0.9-3.8) 2.2 (1.1-3.3)
Note: Estimates are based on 893 respondents in NSW. For this indicator 2 (0.22%) were not stated (Don’t know or Refused) in NSW. The indicator includes those respondents whose asthma had interfered with their ability to manage their day-to-day activities in the last 4 weeks. Thequestions used were: Have you ever been told by a doctor or hospital you have asthma? Have you had symptoms of asthma or taken treatment forasthma in the last 12 months? Have you had symptoms of asthma or taken treatment for asthma in the last 4 weeks? During the last 4 weeks, did yourasthma interfere with your ability to manage your day-to-day activities? and Did it interfere with these activities: A little bit, Moderately, Quite a lot, or Extremely?
Source: New South Wales Population Health Survey 2006 (HOIST). Centre for Epidemiology and Research, NSW Department of Health.
216
WARNIN
G: Esti
mates o
ut of
date.
Please
chec
k Hea
lthStat
s NSW
for la
test e
stimate
s.
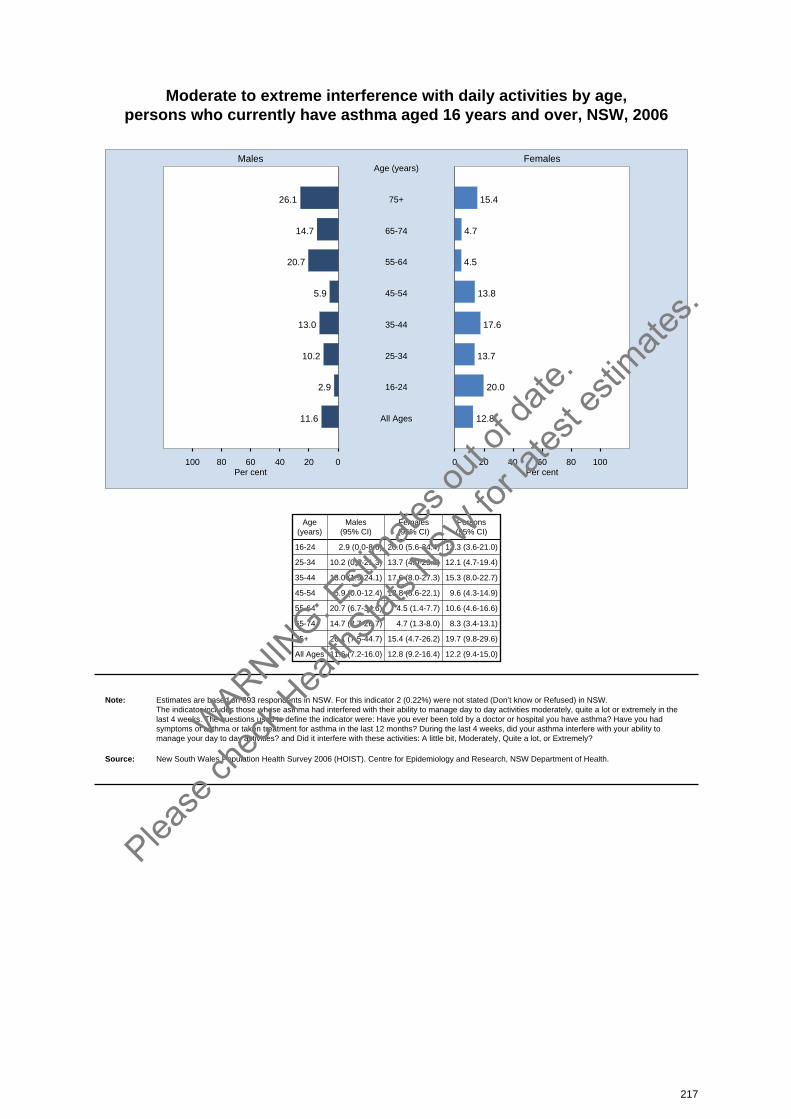
Moderate to extreme interference with daily activities by age, persons who currently have asthma aged 16 years and over, NSW, 2006
020406080100 0 20 40 60 80 100
Males Females
Per cent Per cent
26.1 15.475+
Age (years)
14.7 4.765-74
20.7 4.555-64
5.9 13.845-54
13.0 17.635-44
10.2 13.725-34
2.9 20.016-24
11.6 12.8All Ages
Age(years)
Males(95% CI)
Females(95% CI)
Persons(95% CI)
16-24 2.9 (0.0-8.6) 20.0 (5.6-34.4) 12.3 (3.6-21.0)
25-34 10.2 (0.0-21.3) 13.7 (4.0-23.3) 12.1 (4.7-19.4)
35-44 13.0 (1.9-24.1) 17.6 (8.0-27.3) 15.3 (8.0-22.7)
45-54 5.9 (0.0-12.4) 13.8 (5.6-22.1) 9.6 (4.3-14.9)
55-64 20.7 (6.7-34.6) 4.5 (1.4-7.7) 10.6 (4.6-16.6)
65-74 14.7 (2.7-26.7) 4.7 (1.3-8.0) 8.3 (3.4-13.1)
75+ 26.1 (7.5-44.7) 15.4 (4.7-26.2) 19.7 (9.8-29.6)
All Ages 11.6 (7.2-16.0) 12.8 (9.2-16.4) 12.2 (9.4-15.0)
Note: Estimates are based on 893 respondents in NSW. For this indicator 2 (0.22%) were not stated (Don’t know or Refused) in NSW. The indicator includes those whose asthma had interfered with their ability to manage day to day activities moderately, quite a lot or extremely in thelast 4 weeks. The questions used to define the indicator were: Have you ever been told by a doctor or hospital you have asthma? Have you hadsymptoms of asthma or taken treatment for asthma in the last 12 months? During the last 4 weeks, did your asthma interfere with your ability tomanage your day to day activities? and Did it interfere with these activities: A little bit, Moderately, Quite a lot, or Extremely?
Source: New South Wales Population Health Survey 2006 (HOIST). Centre for Epidemiology and Research, NSW Department of Health.
217
WARNIN
G: Esti
mates o
ut of
date.
Please
chec
k Hea
lthStat
s NSW
for la
test e
stimate
s.

Moderate to extreme interference with daily activities by socioeconomicdisadvantage,
persons who currently have asthma aged 16 years and over, NSW, 2006
020406080100 0 20 40 60 80 100
Males Females
Per cent Per cent
14.0 19.75th Quintile
most disadvantaged
13.4 10.84th Quintile
6.1 8.83rd Quintile
14.8 14.02nd Quintile
9.2 12.31st Quintile
least disadvantaged
11.6 12.8NSW
Quintile ofsocioeconomicdisadvantage
Males(95% CI)
Females(95% CI)
Persons(95% CI)
5th Quintile 14.0 (4.2-23.8) 19.7 (10.2-29.1) 16.9 (10.0-23.7)
4th Quintile 13.4 (4.3-22.5) 10.8 (3.0-18.6) 11.9 (6.0-17.8)
3rd Quintile 6.1 (0.0-12.9) 8.8 (2.9-14.8) 7.7 (3.2-12.2)
2nd Quintile 14.8 (3.5-26.2) 14.0 (5.8-22.2) 14.3 (7.7-21.0)
1st Quintile 9.2 (0.0-21.4) 12.3 (2.9-21.8) 10.7 (2.9-18.5)
NSW 11.6 (7.2-16.0) 12.8 (9.2-16.4) 12.2 (9.4-15.0)
Note: Estimates are based on 893 respondents in NSW. For this indicator 2 (0.22%) were not stated (Don’t know or Refused) in NSW. The indicator includes those whose asthma had interfered with their ability to manage day to day activities moderately, quite a lot or extremely in thelast 4 weeks. The questions used to define the indicator were: Have you ever been told by a doctor or hospital you have asthma? Have you hadsymptoms of asthma or taken treatment for asthma in the last 12 months? During the last 4 weeks, did your asthma interfere with your ability tomanage your day to day activities? and Did it interfere with these activities: A little bit, Moderately, Quite a lot, or Extremely?
Source: New South Wales Population Health Survey 2006 (HOIST). Centre for Epidemiology and Research, NSW Department of Health.
218
WARNIN
G: Esti
mates o
ut of
date.
Please
chec
k Hea
lthStat
s NSW
for la
test e
stimate
s.

Moderate to extreme interference with daily activities by health area, persons who currently have asthma aged 16 years and over, NSW, 2006
0 20 40 60 80 100 0 20 40 60 80 100
Males Females
Per cent Per cent
Sydney South West
South Eastern Sydney& Illawarra
Sydney West
Northern Sydney &Central Coast
Hunter & New England
North Coast
Greater Southern
Greater Western
Urban
Rural
NSW
AreaMales
(95% CI)Females(95% CI)
Persons(95% CI)
Sydney South West 12.0 (0.8-23.2) 13.6 (4.8-22.3) 13.0 (6.1-19.9)
South Eastern Sydney & Illawarra 8.7 (0.0-17.6) 13.7 (4.3-23.0) 11.0 (4.5-17.5)
Sydney West 2.3 (0.0-7.0) 12.0 (3.6-20.5) 8.4 (2.6-14.2)
Northern Sydney & Central Coast 25.0 (7.4-42.6) 18.9 (5.5-32.4) 21.8 (10.9-32.7)
Hunter & New England 5.4 (0.0-11.5) 10.6 (3.4-17.8) 8.1 (3.3-12.9)
North Coast 18.7 (3.6-33.9) 9.0 (2.1-16.0) 13.5 (5.5-21.5)
Greater Southern 12.7 (1.7-23.7) 10.5 (1.8-19.2) 11.4 (4.6-18.3)
Greater Western 6.1 (0.0-12.6) 6.2 (0.0-12.6) 6.2 (1.6-10.8)
Urban 12.5 (6.2-18.9) 14.5 (9.5-19.6) 13.6 (9.7-17.6)
Rural 9.9 (5.0-14.8) 9.5 (5.6-13.4) 9.7 (6.6-12.8)
NSW 11.6 (7.2-16.0) 12.8 (9.2-16.4) 12.2 (9.4-15.0)
Note: Estimates are based on 893 respondents in NSW. For this indicator 2 (0.22%) were not stated (Don’t know or Refused) in NSW. The indicator includes those whose asthma had interfered with their ability to manage day to day activities moderately, quite a lot or extremely in thelast 4 weeks. The questions used to define the indicator were: Have you ever been told by a doctor or hospital you have asthma? Have you hadsymptoms of asthma or taken treatment for asthma in the last 12 months? During the last 4 weeks, did your asthma interfere with your ability tomanage your day to day activities? and Did it interfere with these activities: A little bit, Moderately, Quite a lot, or Extremely?
Source: New South Wales Population Health Survey 2006 (HOIST). Centre for Epidemiology and Research, NSW Department of Health.
219
WARNIN
G: Esti
mates o
ut of
date.
Please
chec
k Hea
lthStat
s NSW
for la
test e
stimate
s.
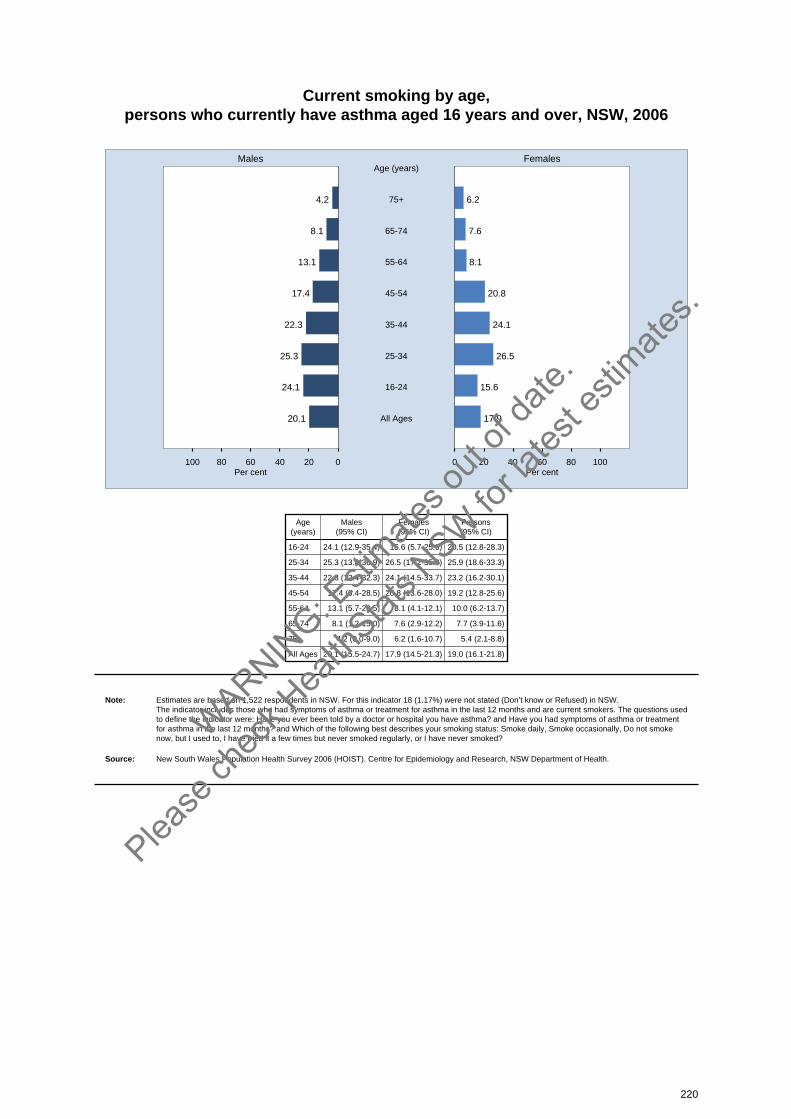
Current smoking by age, persons who currently have asthma aged 16 years and over, NSW, 2006
020406080100 0 20 40 60 80 100
Males Females
Per cent Per cent
4.2 6.275+
Age (years)
8.1 7.665-74
13.1 8.155-64
17.4 20.845-54
22.3 24.135-44
25.3 26.525-34
24.1 15.616-24
20.1 17.9All Ages
Age(years)
Males(95% CI)
Females(95% CI)
Persons(95% CI)
16-24 24.1 (12.9-35.4) 15.6 (5.7-25.6) 20.5 (12.8-28.3)
25-34 25.3 (13.8-36.9) 26.5 (17.2-35.8) 25.9 (18.6-33.3)
35-44 22.3 (12.4-32.3) 24.1 (14.5-33.7) 23.2 (16.2-30.1)
45-54 17.4 (6.4-28.5) 20.8 (13.6-28.0) 19.2 (12.8-25.6)
55-64 13.1 (5.7-20.5) 8.1 (4.1-12.1) 10.0 (6.2-13.7)
65-74 8.1 (1.2-15.0) 7.6 (2.9-12.2) 7.7 (3.9-11.6)
75+ 4.2 (0.0-9.0) 6.2 (1.6-10.7) 5.4 (2.1-8.8)
All Ages 20.1 (15.5-24.7) 17.9 (14.5-21.3) 19.0 (16.1-21.8)
Note: Estimates are based on 1,522 respondents in NSW. For this indicator 18 (1.17%) were not stated (Don’t know or Refused) in NSW. The indicator includes those who had symptoms of asthma or treatment for asthma in the last 12 months and are current smokers. The questions usedto define the indicator were: Have you ever been told by a doctor or hospital you have asthma? and Have you had symptoms of asthma or treatmentfor asthma in the last 12 months? and Which of the following best describes your smoking status: Smoke daily, Smoke occasionally, Do not smokenow, but I used to, I have tried it a few times but never smoked regularly, or I have never smoked?
Source: New South Wales Population Health Survey 2006 (HOIST). Centre for Epidemiology and Research, NSW Department of Health.
220
WARNIN
G: Esti
mates o
ut of
date.
Please
chec
k Hea
lthStat
s NSW
for la
test e
stimate
s.

Current smoking by socioeconomic disadvantage, persons who currently have asthma aged 16 years and over, NSW, 2006
020406080100 0 20 40 60 80 100
Males Females
Per cent Per cent
15.0 28.95th Quintile
most disadvantaged
28.5 15.44th Quintile
17.7 23.53rd Quintile
16.6 11.62nd Quintile
18.3 10.01st Quintile
least disadvantaged
20.1 17.9NSW
Quintile ofsocioeconomicdisadvantage
Males(95% CI)
Females(95% CI)
Persons(95% CI)
5th Quintile 15.0 (6.6-23.5) 28.9 (18.7-39.1) 21.7 (14.9-28.5)
4th Quintile 28.5 (16.7-40.4) 15.4 (9.6-21.3) 21.4 (14.9-27.9)
3rd Quintile 17.7 (7.5-27.9) 23.5 (15.3-31.7) 21.0 (14.6-27.5)
2nd Quintile 16.6 (7.2-26.0) 11.6 (6.5-16.8) 13.8 (8.7-19.0)
1st Quintile 18.3 (8.4-28.1) 10.0 (3.0-17.0) 14.4 (8.3-20.5)
NSW 20.1 (15.5-24.7) 17.9 (14.5-21.3) 19.0 (16.1-21.8)
Note: Estimates are based on 1,522 respondents in NSW. For this indicator 18 (1.17%) were not stated (Don’t know or Refused) in NSW. The indicator includes those who had symptoms of asthma or treatment for asthma in the last 12 months and are current smokers. The questions usedto define the indicator were: Have you ever been told by a doctor or hospital you have asthma? and Have you had symptoms of asthma or treatmentfor asthma in the last 12 months? and Which of the following best describes your smoking status: Smoke daily, Smoke occasionally, Do not smokenow, but I used to, I have tried it a few times but never smoked regularly, or I have never smoked?
Source: New South Wales Population Health Survey 2006 (HOIST). Centre for Epidemiology and Research, NSW Department of Health.
221
WARNIN
G: Esti
mates o
ut of
date.
Please
chec
k Hea
lthStat
s NSW
for la
test e
stimate
s.

Current smoking by health area, persons who currently have asthma aged 16 years and over, NSW, 2006
0 20 40 60 80 100 0 20 40 60 80 100
Males Females
Per cent Per cent
Sydney South West
South Eastern Sydney& Illawarra
Sydney West
Northern Sydney &Central Coast
Hunter & New England
North Coast
Greater Southern
Greater Western
Urban
Rural
NSW
AreaMales
(95% CI)Females(95% CI)
Persons(95% CI)
Sydney South West 19.6 (9.6-29.6) 20.0 (8.8-31.2) 19.8 (12.3-27.3)
South Eastern Sydney & Illawarra 17.5 (5.9-29.2) 14.1 (6.4-21.8) 15.8 (8.9-22.7)
Sydney West 27.5 (11.2-43.7) 19.1 (10.7-27.6) 22.5 (14.1-30.9)
Northern Sydney & Central Coast 20.8 (8.4-33.1) 12.9 (4.7-21.1) 16.9 (9.4-24.4)
Hunter & New England 15.4 (3.0-27.7) 17.3 (8.3-26.3) 16.3 (8.7-23.9)
North Coast 20.0 (8.3-31.7) 19.0 (10.3-27.7) 19.5 (12.2-26.8)
Greater Southern 20.6 (8.7-32.5) 23.0 (14.4-31.6) 21.9 (14.7-29.1)
Greater Western 23.8 (12.0-35.6) 25.0 (16.2-33.8) 24.5 (17.3-31.7)
Urban 20.8 (14.7-26.9) 16.7 (12.1-21.2) 18.6 (14.8-22.4)
Rural 18.8 (12.4-25.2) 20.4 (15.8-24.9) 19.6 (15.7-23.5)
NSW 20.1 (15.5-24.7) 17.9 (14.5-21.3) 19.0 (16.1-21.8)
Note: Estimates are based on 1,522 respondents in NSW. For this indicator 18 (1.17%) were not stated (Don’t know or Refused) in NSW. The indicator includes those who had symptoms of asthma or treatment for asthma in the last 12 months and are current smokers. The questions usedto define the indicator were: Have you ever been told by a doctor or hospital you have asthma? and Have you had symptoms of asthma or treatmentfor asthma in the last 12 months? and Which of the following best describes your smoking status: Smoke daily, Smoke occasionally, Do not smokenow, but I used to, I have tried it a few times but never smoked regularly, or I have never smoked?
Source: New South Wales Population Health Survey 2006 (HOIST). Centre for Epidemiology and Research, NSW Department of Health.
222
WARNIN
G: Esti
mates o
ut of
date.
Please
chec
k Hea
lthStat
s NSW
for la
test e
stimate
s.
Diabetes or high blood glucose
IntroductionDiabetes is a chronic disease characterised by high blood glucose levels, resulting from the bodyeither not producing insulin or not using insulin properly. Insulin is a hormone needed for glucose toenter the cells and be converted to energy.[1] Diabetes affects a person’s health in 2 ways: by directmetabolic complications, which can be immediately life threatening if not treated promptly; by longterm complications involving the eyes, kidneys, nerves, and major blood vessels including those in the heart.
There are 3 main forms of diabetes: type 1, or insulin dependent diabetes mellitus, which occurs whenthe pancreas no longer produces insulin; type 2, or non insulin dependent diabetes mellitus, whichoccurs when the pancreas is not producing enough insulin and the insulin it produces is not workingeffectively; and gestational diabetes, which occurs in pregnancy and should disappear after the birth.[1]The management of type 2, which is the most common form of diabetes, depends on careful control ofglucose levels, blood lipid levels (especially cholesterol levels), blood pressure, and regular screeningfor complications.[2-5]
Type 2 diabetes accounts for up to 90 per cent of all cases of diabetes. In 2004, diabetes was theprincipal cause of 2.2 per cent of deaths and a related cause of 5.2 per cent of deaths in New SouthWales. Between 1989-90 and 2004-05, diabetes related hospitalisations increased by 96 per cent inNew South Wales.[6]
In 2006, the New South Wales Population Health Survey asked respondents: Have you ever been toldby a doctor or hospital you have diabetes? Have you ever been told by a doctor or hospital you havehigh blood glucose? How old were you when first told you had diabetes or high blood glucose? Whatare you doing now to manage your diabetes or high blood glucose? If female, respondents were alsoasked: Were you pregnant when first told you had diabetes or high blood glucose? and, Have you everhad diabetes or high blood glucose apart from when you were pregnant?
ResultsIn 2006, 7.4 per cent of adults had diabetes or high blood glucose. A significantly lower proportion offemales (6.4 per cent) than males (8.5 per cent) had diabetes or high blood glucose. The prevalenceof diabetes or high blood glucose increased with age. Among males, a significantly lower proportion ofadults aged 16-24 years (1.4 per cent) and 25-34 years (2.6 per cent), and a significantly higherproportion of adults aged 55-64 years (15.9 per cent) and 65-74 years (20.1 per cent) and 75 yearsand over (17.7 per cent), had diabetes or high blood glucose, compared with the overall adult malepopulation. Among females, a significantly lower proportion of adults aged 16-24 years (1.7 per cent)and 25-34 years (2.2 per cent) and 35-44 years (3.0 per cent), and a significantly higher proportion ofadults aged 55-64 years (11.4 per cent) and 65-74 years (13.8 per cent) and 75 years and over (13.5per cent), had diabetes or high blood glucose, compared with the overall adult female population.
There was no significant variation between rural areas and urban areas, or among health areas. Alower proportion of adults in the least disadvantaged quintile (5.3 per cent), and a higher proportion ofadults in the most disadvantaged quintile (9.6 per cent, had diabetes or high blood glucose, comparedwith the overall adult population.
Overall, the prevalence of diabetes or high blood glucose increased significantly between 1997 (4.7per cent) and 2006 (7.4 per cent). The increase was significant in both males (5.2 per cent to 8.5 percent) and females (4.2 per cent to 6.4 per cent).
Among those with diabetes or high blood glucose, the following management strategies were reported:60.6 per cent followed a special diet, 43.2 per cent took medication or tablets, 30.7 per cent exercisedmost days, 11.2 per cent had insulin injections, 8.1 per cent lost weight, and 8.2 per cent did not do anything.
223
WARNIN
G: Esti
mates o
ut of
date.
Please
chec
k Hea
lthStat
s NSW
for la
test e
stimate
s.

References1. Diabetes Australia. What is Diabetes. Available online at
www.diabetesaustralia.com.au/_lib/doc_pdf/resources/factsheets/what_is_diabetes.pdf (accessed10 May 2007).
2. Australian Centre for Diabetes Strategies. National evidence based guidelines for themanagement of type 2 diabetes mellitus: Primary prevention and case detection and diagnosis.Sydney: Prince of Wales Hospital, 2001. Available online atwww.diabetes.net.au/evidence_based_healthcare/index.asp (accessed 10 May 2007).
3. Australian Centre for Diabetes Strategies. National evidence based guidelines for themanagement of type 2 diabetes mellitus: Blood pressure control. Sydney: Prince of WalesHospital, 2004. Available online at www.diabetes.net.au/evidence_based_healthcare/index.asp(accessed 10 May 2007).
4. Australian Centre for Diabetes Strategies. National evidence based guidelines for themanagement of type 2 diabetes mellitus: Prevention and detection of macrovascular disease.Sydney: Prince of Wales Hospital, 2004. Available online atwww.diabetes.net.au/evidence_based_healthcare/index.asp (accessed 10 May 2007).
5. Australian Centre for Diabetes Strategies. National evidence based guidelines for themanagement of type 2 diabetes mellitus: Lipid control. Sydney: Prince of Wales Hospital, 2004.Available online at www.diabetes.net.au/evidence_based_healthcare/index.asp (accessed 10May 2007).
6. Population Health Division. The health of the people of New South Wales: Report of the ChiefHealth Officer, 2006. Sydney: NSW Department of Health, 2006. Available online atwww.health.nsw.gov.au (accessed 10 May 2007).
224
WARNIN
G: Esti
mates o
ut of
date.
Please
chec
k Hea
lthStat
s NSW
for la
test e
stimate
s.

Diabetes or high blood glucose by age, persons aged 16 years and over, NSW, 2006
020406080100 0 20 40 60 80 100
Males Females
Per cent Per cent
17.7 13.575+
Age (years)
20.1 13.865-74
15.9 11.455-64
8.1 6.545-54
6.1 3.035-44
2.6 2.225-34
1.4 1.716-24
8.5 6.4All Ages
Age(years)
Males(95% CI)
Females(95% CI)
Persons(95% CI)
16-24 1.4 (0.0-3.1) 1.7 (0.0-3.4) 1.5 (0.3-2.7)
25-34 2.6 (0.5-4.7) 2.2 (0.3-4.1) 2.4 (1.0-3.8)
35-44 6.1 (3.2-9.1) 3.0 (1.6-4.5) 4.6 (2.9-6.2)
45-54 8.1 (5.3-10.9) 6.5 (4.4-8.6) 7.3 (5.5-9.1)
55-64 15.9 (12.4-19.4) 11.4 (9.0-13.8) 13.7 (11.6-15.8)
65-74 20.1 (16.0-24.2) 13.8 (10.9-16.6) 16.9 (14.4-19.3)
75+ 17.7 (13.6-21.9) 13.5 (10.4-16.6) 15.2 (12.8-17.7)
All Ages 8.5 (7.4-9.7) 6.4 (5.6-7.2) 7.4 (6.7-8.1)
Note: Estimates are based on 7,935 respondents in NSW. For this indicator 27 (0.34%) were not stated (Don’t know or Refused) in NSW. The indicator includes those who either had diabetes or high blood glucose but did not have gestational diabetes. The questions used to define theindicator were: Have you ever been told by a doctor or hospital you have diabetes?, Have you ever been told by a doctor or hospital you have highblood glucose?, and, if female, Were you pregnant when you were first told you had diabetes or high blood glucose?, and Have you ever had diabetesor high blood glucose apart from when you were pregnant?
Source: New South Wales Population Health Survey 2006 (HOIST). Centre for Epidemiology and Research, NSW Department of Health.
225
WARNIN
G: Esti
mates o
ut of
date.
Please
chec
k Hea
lthStat
s NSW
for la
test e
stimate
s.
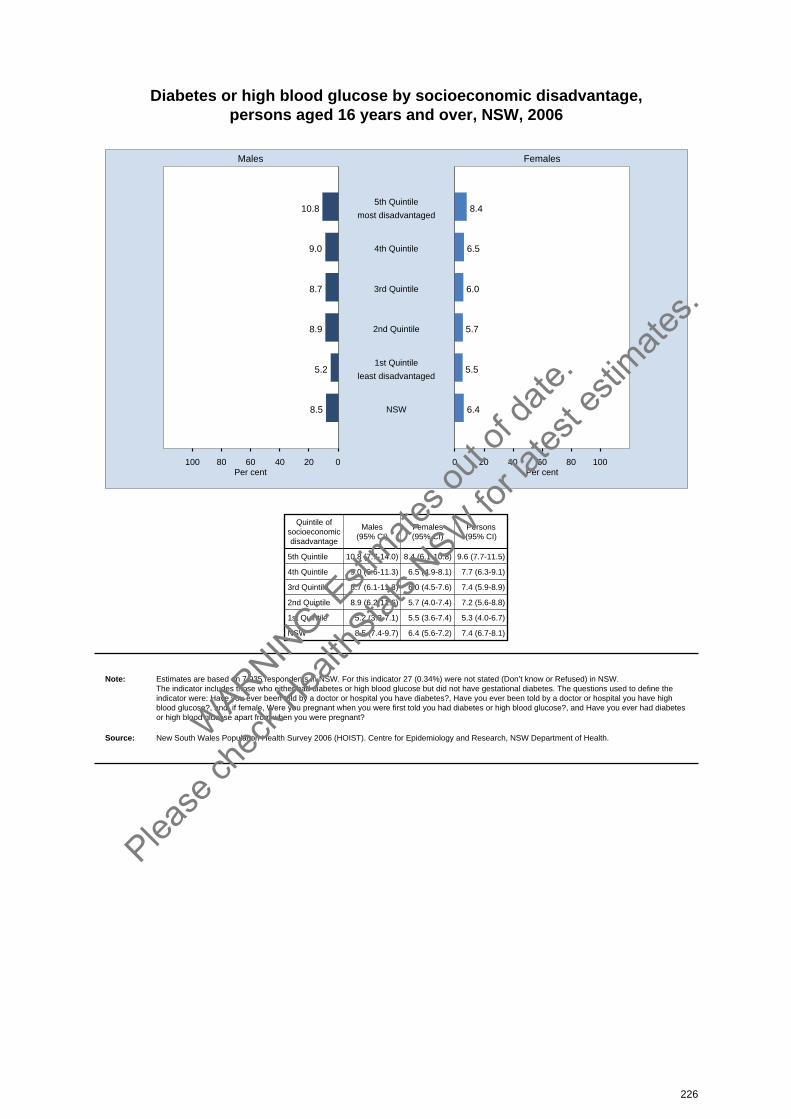
Diabetes or high blood glucose by socioeconomic disadvantage, persons aged 16 years and over, NSW, 2006
020406080100 0 20 40 60 80 100
Males Females
Per cent Per cent
10.8 8.45th Quintile
most disadvantaged
9.0 6.54th Quintile
8.7 6.03rd Quintile
8.9 5.72nd Quintile
5.2 5.51st Quintile
least disadvantaged
8.5 6.4NSW
Quintile ofsocioeconomicdisadvantage
Males(95% CI)
Females(95% CI)
Persons(95% CI)
5th Quintile 10.8 (7.7-14.0) 8.4 (6.1-10.8) 9.6 (7.7-11.5)
4th Quintile 9.0 (6.6-11.3) 6.5 (4.9-8.1) 7.7 (6.3-9.1)
3rd Quintile 8.7 (6.1-11.3) 6.0 (4.5-7.6) 7.4 (5.9-8.9)
2nd Quintile 8.9 (6.2-11.6) 5.7 (4.0-7.4) 7.2 (5.6-8.8)
1st Quintile 5.2 (3.3-7.1) 5.5 (3.6-7.4) 5.3 (4.0-6.7)
NSW 8.5 (7.4-9.7) 6.4 (5.6-7.2) 7.4 (6.7-8.1)
Note: Estimates are based on 7,935 respondents in NSW. For this indicator 27 (0.34%) were not stated (Don’t know or Refused) in NSW. The indicator includes those who either had diabetes or high blood glucose but did not have gestational diabetes. The questions used to define theindicator were: Have you ever been told by a doctor or hospital you have diabetes?, Have you ever been told by a doctor or hospital you have highblood glucose?, and, if female, Were you pregnant when you were first told you had diabetes or high blood glucose?, and Have you ever had diabetesor high blood glucose apart from when you were pregnant?
Source: New South Wales Population Health Survey 2006 (HOIST). Centre for Epidemiology and Research, NSW Department of Health.
226
WARNIN
G: Esti
mates o
ut of
date.
Please
chec
k Hea
lthStat
s NSW
for la
test e
stimate
s.

Diabetes or high blood glucose by health area, persons aged 16 years and over, NSW, 2006
0 20 40 60 80 100 0 20 40 60 80 100
Males Females
Per cent Per cent
Sydney South West
South Eastern Sydney& Illawarra
Sydney West
Northern Sydney &Central Coast
Hunter & New England
North Coast
Greater Southern
Greater Western
Urban
Rural
NSW
AreaMales
(95% CI)Females(95% CI)
Persons(95% CI)
Sydney South West 11.4 (7.7-15.0) 5.9 (3.7-8.1) 8.6 (6.5-10.7)
South Eastern Sydney & Illawarra 8.0 (5.2-10.7) 8.1 (5.8-10.4) 8.0 (6.3-9.8)
Sydney West 7.0 (4.5-9.6) 4.6 (3.0-6.2) 5.8 (4.3-7.3)
Northern Sydney & Central Coast 8.1 (5.3-10.9) 6.6 (4.3-8.8) 7.3 (5.5-9.1)
Hunter & New England 7.8 (5.2-10.3) 6.6 (4.6-8.5) 7.1 (5.5-8.8)
North Coast 9.4 (6.4-12.4) 6.0 (4.3-7.7) 7.7 (6.0-9.3)
Greater Southern 7.0 (4.7-9.3) 7.2 (5.1-9.3) 7.1 (5.5-8.6)
Greater Western 8.2 (5.4-11.1) 6.2 (4.4-8.0) 7.2 (5.5-8.9)
Urban 8.7 (7.2-10.3) 6.3 (5.3-7.4) 7.5 (6.6-8.5)
Rural 8.0 (6.6-9.4) 6.5 (5.5-7.5) 7.3 (6.4-8.1)
NSW 8.5 (7.4-9.7) 6.4 (5.6-7.2) 7.4 (6.7-8.1)
Note: Estimates are based on 7,935 respondents in NSW. For this indicator 27 (0.34%) were not stated (Don’t know or Refused) in NSW. The indicator includes those who either had diabetes or high blood glucose but did not have gestational diabetes. The questions used to define theindicator were: Have you ever been told by a doctor or hospital you have diabetes?, Have you ever been told by a doctor or hospital you have highblood glucose?, and, if female, Were you pregnant when you were first told you had diabetes or high blood glucose?, and Have you ever had diabetesor high blood glucose apart from when you were pregnant?
Source: New South Wales Population Health Survey 2006 (HOIST). Centre for Epidemiology and Research, NSW Department of Health.
227
WARNIN
G: Esti
mates o
ut of
date.
Please
chec
k Hea
lthStat
s NSW
for la
test e
stimate
s.

Action taken to manage diabetes or high blood glucose, persons who have diabetes or high blood glucose aged 16 years and over,
NSW, 2006
020406080100 0 20 40 60 80 100
Males Females
Per cent Per cent
11.5 11.0Having insulin
injections
48.4 37.7On tablets
64.9 56.3Following aspecial diet
8.5 7.7Losing weight
31.7 29.6Exercising most days
6.4 4.5Other
10.7 5.6Not doing anything
ResponseMales
(95% CI)Females(95% CI)
Persons(95% CI)
Having insulin injections 11.5 (6.7-16.4) 11.0 (7.2-14.7) 11.2 (8.2-14.3)
On tablets 48.4 (41.5-55.4) 37.7 (31.7-43.8) 43.2 (38.6-47.8)
Following a special diet 64.9 (58.3-71.4) 56.3 (49.7-62.9) 60.6 (55.9-65.4)
Losing weight 8.5 (4.8-12.2) 7.7 (4.4-11.0) 8.1 (5.6-10.6)
Exercising most days 31.7 (25.1-38.3) 29.6 (23.8-35.5) 30.7 (26.3-35.1)
Other 6.4 (3.5-9.3) 4.5 (2.4-6.6) 5.5 (3.7-7.3)
Not doing anything 10.7 (5.9-15.4) 5.6 (3.0-8.2) 8.2 (5.4-10.9)
Note: Estimates are based on 810 respondents in NSW. For this indicator 2 (0.25%) were not stated (Don’t know or Refused) in NSW. The questions used were: Have you ever been told by a doctor or hospital you have diabetes?, Have you ever been told by a doctor or hospital youhave high blood glucose? and What are you doing now to manage your diabetes or high blood glucose? Respondents could mention more than oneresponse. Percentages will total more than 100 per cent.
Source: New South Wales Population Health Survey 2006 (HOIST). Centre for Epidemiology and Research, NSW Department of Health.
228
WARNIN
G: Esti
mates o
ut of
date.
Please
chec
k Hea
lthStat
s NSW
for la
test e
stimate
s.
Incontinence
IntroductionUrinary incontinence imposes a considerable social, emotional, psychological, and financial burden onaffected individuals, carers and health services. The condition is not normal and is always a symptomof an underlying problem that can usually be cured or significantly improved if treated. Nearly one in10 people in Australia is affected by urinary incontinence. It has no boundary of ethnicity, sex, age orsocial class. In older age groups, incontinence tends to be both more common and more severe,occurring in up to 40 per cent of people over 75 years of age. Women are more at risk of incontinencethan men.[1]
In 2006, the New South Wales Population Health Survey asked respondents: In the last 4 weeks, howoften have you had a urine leak when you were physically active, exerted yourself, or coughed orsneezed during the day or night: Most of the time, Some of the time, None of the time?
ResultsOverall, in 2006, 20.7 per cent of people in NSW aged 40 years and over experienced urinaryincontinence some or most of the time during the last 4 weeks. A significantly higher proportion offemales (29.2 per cent) than males (11.9 per cent) experienced incontinence in the last 4 weeks.Among males, a significantly lower proportion of adults aged 40-44 years (7.5 per cent) and 45-49years (5.8 per cent) and 50-54 years (7.3 per cent), and a significantly higher proportion of adults aged70-74 years (20.3 per cent) and 75-79 years (24.8 per cent) and 80 years and over (24.7 per cent),experienced urinary incontinence some or most of the time during the last 4 weeks, compared with theoverall adult male population aged 40 years and over. Among females, a significantly lower proportionof adults aged 40-44 years (20.6 per cent), and a significantly higher proportion of adults aged 70-74years (37.7 per cent) and 80 years and over (35.9 per cent), experienced urinary incontinence some ormost of the time during the last 4 weeks, compared with the overall adult female population aged 40years and over.
There was no significant variation between urban areas and rural areas, or among health areas.Urinary incontinence increased with socioeconomic disadvantage. A higher proportion of adults 40years and over in the most disadvantaged quintile (25.2 per cent) experienced urinary incontinence inthe last 4 weeks, compared with the overall adult population aged 40 years and over. There are hasbeen no significant variation in the proportion of adults aged 40 years and over suffering urinaryincontinence between 2003 and 2006.
References1. Department of Health and Ageing. Continence. Available online at www.continence.health.gov.au
(accessed 8 June 2007).
229
WARNIN
G: Esti
mates o
ut of
date.
Please
chec
k Hea
lthStat
s NSW
for la
test e
stimate
s.
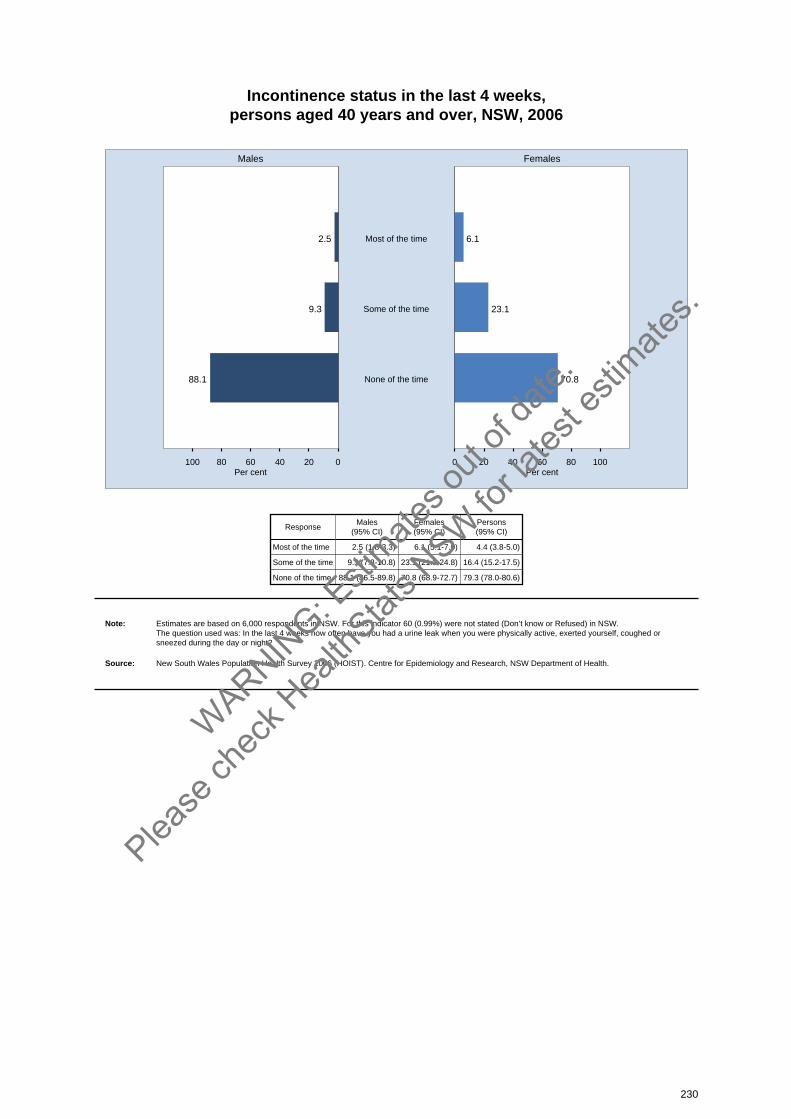
Incontinence status in the last 4 weeks, persons aged 40 years and over, NSW, 2006
020406080100 0 20 40 60 80 100
Males Females
Per cent Per cent
2.5 6.1Most of the time
9.3 23.1Some of the time
88.1 70.8None of the time
ResponseMales
(95% CI)Females(95% CI)
Persons(95% CI)
Most of the time 2.5 (1.8-3.3) 6.1 (5.1-7.0) 4.4 (3.8-5.0)
Some of the time 9.3 (7.8-10.8) 23.1 (21.3-24.8) 16.4 (15.2-17.5)
None of the time 88.1 (86.5-89.8) 70.8 (68.9-72.7) 79.3 (78.0-80.6)
Note: Estimates are based on 6,000 respondents in NSW. For this indicator 60 (0.99%) were not stated (Don’t know or Refused) in NSW. The question used was: In the last 4 weeks how often have you had a urine leak when you were physically active, exerted yourself, coughed orsneezed during the day or night?
Source: New South Wales Population Health Survey 2006 (HOIST). Centre for Epidemiology and Research, NSW Department of Health.
230
WARNIN
G: Esti
mates o
ut of
date.
Please
chec
k Hea
lthStat
s NSW
for la
test e
stimate
s.
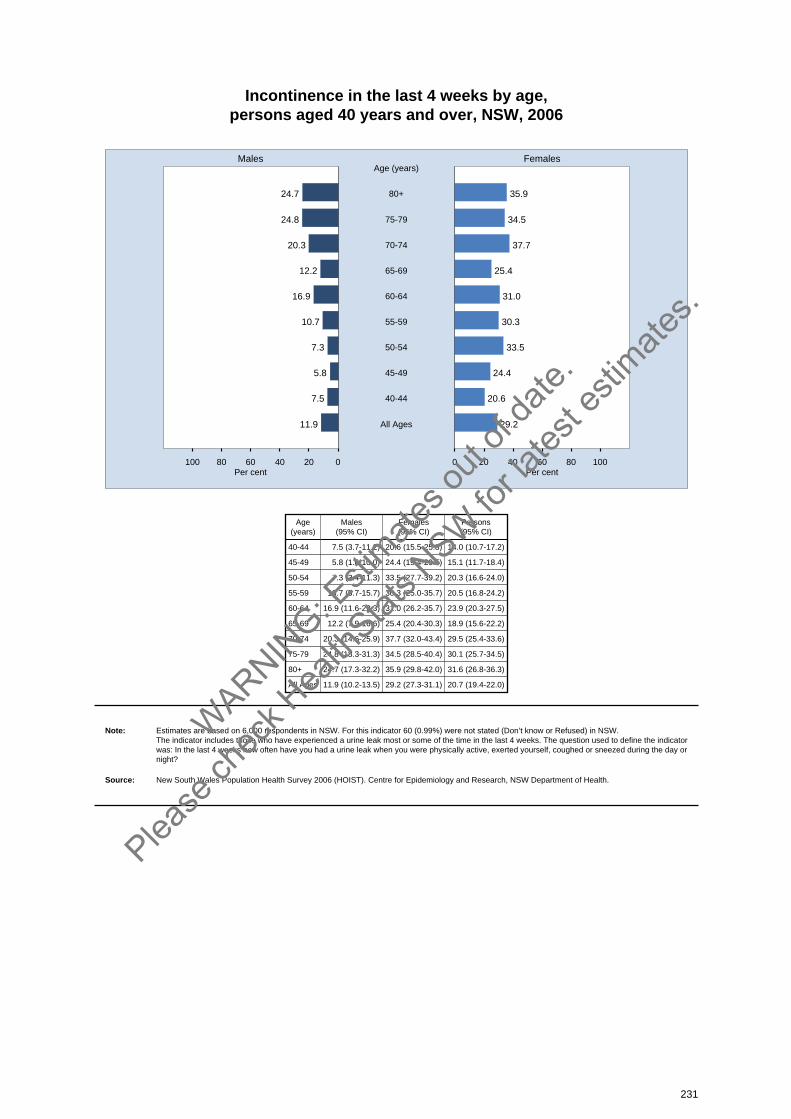
Incontinence in the last 4 weeks by age, persons aged 40 years and over, NSW, 2006
020406080100 0 20 40 60 80 100
Males Females
Per cent Per cent
24.7 35.980+
Age (years)
24.8 34.575-79
20.3 37.770-74
12.2 25.465-69
16.9 31.060-64
10.7 30.355-59
7.3 33.550-54
5.8 24.445-49
7.5 20.640-44
11.9 29.2All Ages
Age(years)
Males(95% CI)
Females(95% CI)
Persons(95% CI)
40-44 7.5 (3.7-11.2) 20.6 (15.5-25.8) 14.0 (10.7-17.2)
45-49 5.8 (1.6-10.0) 24.4 (19.4-29.5) 15.1 (11.7-18.4)
50-54 7.3 (3.4-11.3) 33.5 (27.7-39.2) 20.3 (16.6-24.0)
55-59 10.7 (5.7-15.7) 30.3 (25.0-35.7) 20.5 (16.8-24.2)
60-64 16.9 (11.6-22.3) 31.0 (26.2-35.7) 23.9 (20.3-27.5)
65-69 12.2 (7.9-16.6) 25.4 (20.4-30.3) 18.9 (15.6-22.2)
70-74 20.3 (14.6-25.9) 37.7 (32.0-43.4) 29.5 (25.4-33.6)
75-79 24.8 (18.3-31.3) 34.5 (28.5-40.4) 30.1 (25.7-34.5)
80+ 24.7 (17.3-32.2) 35.9 (29.8-42.0) 31.6 (26.8-36.3)
All Ages 11.9 (10.2-13.5) 29.2 (27.3-31.1) 20.7 (19.4-22.0)
Note: Estimates are based on 6,000 respondents in NSW. For this indicator 60 (0.99%) were not stated (Don’t know or Refused) in NSW. The indicator includes those who have experienced a urine leak most or some of the time in the last 4 weeks. The question used to define the indicatorwas: In the last 4 weeks how often have you had a urine leak when you were physically active, exerted yourself, coughed or sneezed during the day or night?
Source: New South Wales Population Health Survey 2006 (HOIST). Centre for Epidemiology and Research, NSW Department of Health.
231
WARNIN
G: Esti
mates o
ut of
date.
Please
chec
k Hea
lthStat
s NSW
for la
test e
stimate
s.

Incontinence in the last 4 weeks by socioeconomic disadvantage, persons aged 40 years and over, NSW, 2006
020406080100 0 20 40 60 80 100
Males Females
Per cent Per cent
18.2 31.75th Quintile
most disadvantaged
11.1 28.54th Quintile
9.9 31.33rd Quintile
10.6 27.72nd Quintile
8.7 27.31st Quintile
least disadvantaged
11.9 29.2NSW
Quintile ofsocioeconomicdisadvantage
Males(95% CI)
Females(95% CI)
Persons(95% CI)
5th Quintile 18.2 (13.0-23.3) 31.7 (27.1-36.2) 25.2 (21.7-28.6)
4th Quintile 11.1 (7.9-14.3) 28.5 (24.8-32.2) 20.2 (17.6-22.7)
3rd Quintile 9.9 (6.7-13.1) 31.3 (27.0-35.5) 20.2 (17.5-23.0)
2nd Quintile 10.6 (7.1-14.1) 27.7 (23.7-31.8) 19.6 (16.8-22.4)
1st Quintile 8.7 (5.6-11.7) 27.3 (22.7-31.9) 18.2 (15.3-21.1)
NSW 11.9 (10.2-13.5) 29.2 (27.3-31.1) 20.7 (19.4-22.0)
Note: Estimates are based on 6,000 respondents in NSW. For this indicator 60 (0.99%) were not stated (Don’t know or Refused) in NSW. The indicator includes those who have experienced a urine leak most or some of the time in the last 4 weeks. The question used to define the indicatorwas: In the last 4 weeks how often have you had a urine leak when you were physically active, exerted yourself, coughed or sneezed during the day or night?
Source: New South Wales Population Health Survey 2006 (HOIST). Centre for Epidemiology and Research, NSW Department of Health.
232
WARNIN
G: Esti
mates o
ut of
date.
Please
chec
k Hea
lthStat
s NSW
for la
test e
stimate
s.
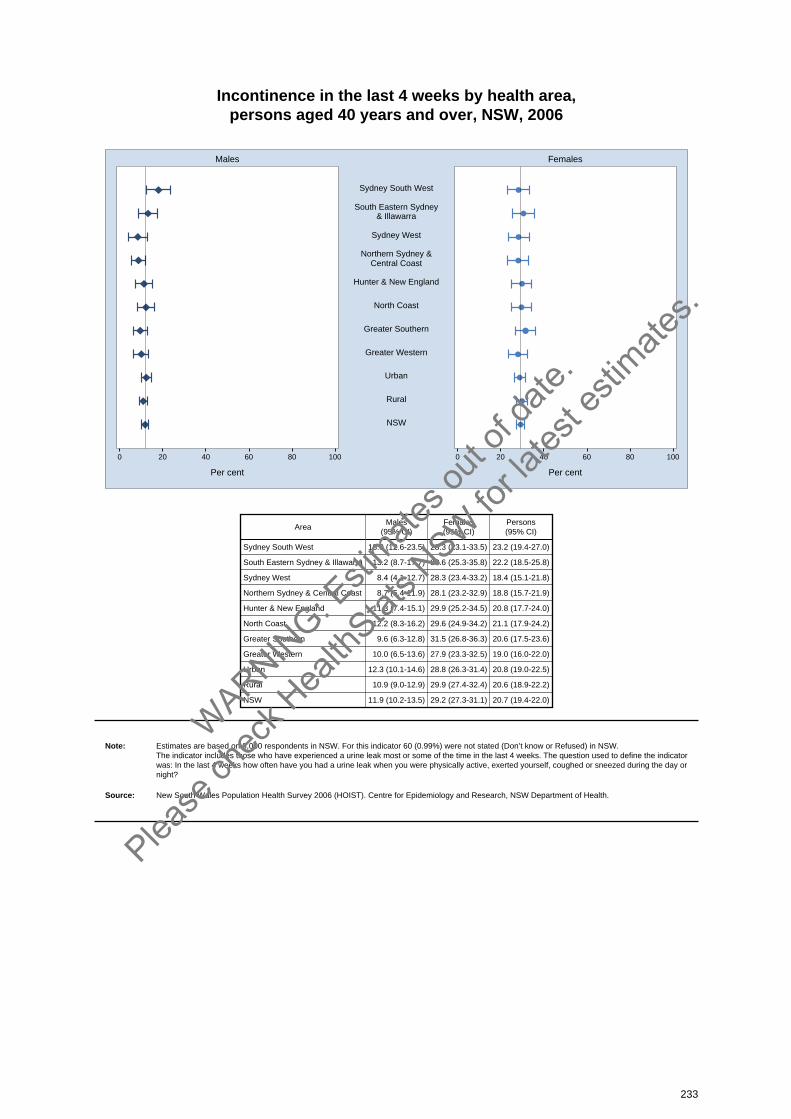
Incontinence in the last 4 weeks by health area, persons aged 40 years and over, NSW, 2006
0 20 40 60 80 100 0 20 40 60 80 100
Males Females
Per cent Per cent
Sydney South West
South Eastern Sydney& Illawarra
Sydney West
Northern Sydney &Central Coast
Hunter & New England
North Coast
Greater Southern
Greater Western
Urban
Rural
NSW
AreaMales
(95% CI)Females(95% CI)
Persons(95% CI)
Sydney South West 18.0 (12.6-23.5) 28.3 (23.1-33.5) 23.2 (19.4-27.0)
South Eastern Sydney & Illawarra 13.2 (8.7-17.7) 30.6 (25.3-35.8) 22.2 (18.5-25.8)
Sydney West 8.4 (4.1-12.7) 28.3 (23.4-33.2) 18.4 (15.1-21.8)
Northern Sydney & Central Coast 8.7 (5.4-11.9) 28.1 (23.2-32.9) 18.8 (15.7-21.9)
Hunter & New England 11.3 (7.4-15.1) 29.9 (25.2-34.5) 20.8 (17.7-24.0)
North Coast 12.2 (8.3-16.2) 29.6 (24.9-34.2) 21.1 (17.9-24.2)
Greater Southern 9.6 (6.3-12.8) 31.5 (26.8-36.3) 20.6 (17.5-23.6)
Greater Western 10.0 (6.5-13.6) 27.9 (23.3-32.5) 19.0 (16.0-22.0)
Urban 12.3 (10.1-14.6) 28.8 (26.3-31.4) 20.8 (19.0-22.5)
Rural 10.9 (9.0-12.9) 29.9 (27.4-32.4) 20.6 (18.9-22.2)
NSW 11.9 (10.2-13.5) 29.2 (27.3-31.1) 20.7 (19.4-22.0)
Note: Estimates are based on 6,000 respondents in NSW. For this indicator 60 (0.99%) were not stated (Don’t know or Refused) in NSW. The indicator includes those who have experienced a urine leak most or some of the time in the last 4 weeks. The question used to define the indicatorwas: In the last 4 weeks how often have you had a urine leak when you were physically active, exerted yourself, coughed or sneezed during the day or night?
Source: New South Wales Population Health Survey 2006 (HOIST). Centre for Epidemiology and Research, NSW Department of Health.
233
WARNIN
G: Esti
mates o
ut of
date.
Please
chec
k Hea
lthStat
s NSW
for la
test e
stimate
s.
Injury
IntroductionInjury is a major cause of preventable mortality and morbidity, first recognised as a national healthpriority in 1986. When compared with other health interventions, the lead-time between an interventionfor injury prevention and a result from that intervention is shorter. Injury, therefore, is an importantdemonstration area for population health, and ongoing monitoring of injury among the population isneeded to support intervention strategies.[1]
Since 1989, falls have been the leading cause of injury-related hospitalisation among males andfemales. Most falls occur among people aged 65 years and over, and the most common types of fallsare those that occur on the same level.[2] In New South Wales, no other single cause of injury,including road trauma, costs the health system more than fall-related injury.[3] In Australia, it has beenprojected that, because of the ageing of the population, the total health cost of fall-related injury willincrease threefold by 2051.[4]
In 2006, the New South Wales Population Health Survey asked respondents aged 65 years and over:In the last 12 months have you had a fall? Respondents who answered yes were then asked thefollowing questions: How many times did you fall in the last 12 months? In the last 12 months haveyou had a fall that required medical treatment for injuries? Were you admitted to hospital as a result ofany of your falls in the last 12 months? Have you made any changes to your home or lifestyle toprevent you from falling? Are you afraid of falling?
Results
Falls in the last 12 months
Overall, in 2006, 24.3 per cent of adults aged 65 years and over had a fall in the last 12 months. Asignificantly higher proportion of females (29.4 per cent) than males (18.1 per cent) had a fall in thelast 12 months. Among males, a significantly lower proportion of adults aged 65-69 years (10.9 percent), and a significantly higher proportion of adults aged 80 years and over (28.7 per cent), had a fallin the last 12 months, compared with the overall male population aged 65 years and over. Amongfemales, a significantly lower proportion of adults aged 65-69 years (23.4 per cent) had a fall in the last12 months, compared with the overall female population aged 65 years and over.
A significantly lower proportion of adults aged 65 years and over in rural areas (21.3 per cent) thanurban areas (26.0 per cent) had a fall in the last 12 months. A higher proportion of adults in the SouthEastern Sydney & Illawarra Health Area (30.9 per cent), and a lower proportion of adults in the NorthCoast Health Area (18.3 per cent), had a fall in the last 12 months, compared with the overall adultpopulation aged 65 years and over. There was no variation by level of socioeconomic disadvantage.There has been no significant variation in the proportion of adults aged 65 years and over who had afall in the last 12 months between 2003 and 2006.
Among those adults aged 65 years and over who had a fall in the last 12 months, 28.7 per centrequired medical treatment. A significantly higher proportion of females (31.8 per cent) than males(22.7 per cent) required medical treatment for a fall. There was no significant variation among agegroups, between rural areas and urban areas, or by level of socioeconomic disadvantage; however, alower proportion of adults aged 65 years and over in the North Coast Health Area (15.2 per cent)required medical treatment for a fall. There was no significant variation in the proportion of adultsrequiring medical treatment for a fall in the last 12 months, between 2003 and 2006.
Among those adults aged 65 years and over who had a fall in the last 12 months, 32.1 per centrequired hospitalisation. There was no significant variation between males and females, or among agegroups. A significantly higher proportion of adults aged 65 years and over in rural areas (45.5 per cent)than urban areas (26.2 per cent) required hospitalisation for a fall. A higher proportion of adults in theHunter & New England Health Area (60.8 per cent), and a lower proportion of adults in the NorthernSydney & Central Coast Health Area (13.5 per cent), required hospitalisation for a fall. A lower
234
WARNIN
G: Esti
mates o
ut of
date.
Please
chec
k Hea
lthStat
s NSW
for la
test e
stimate
s.
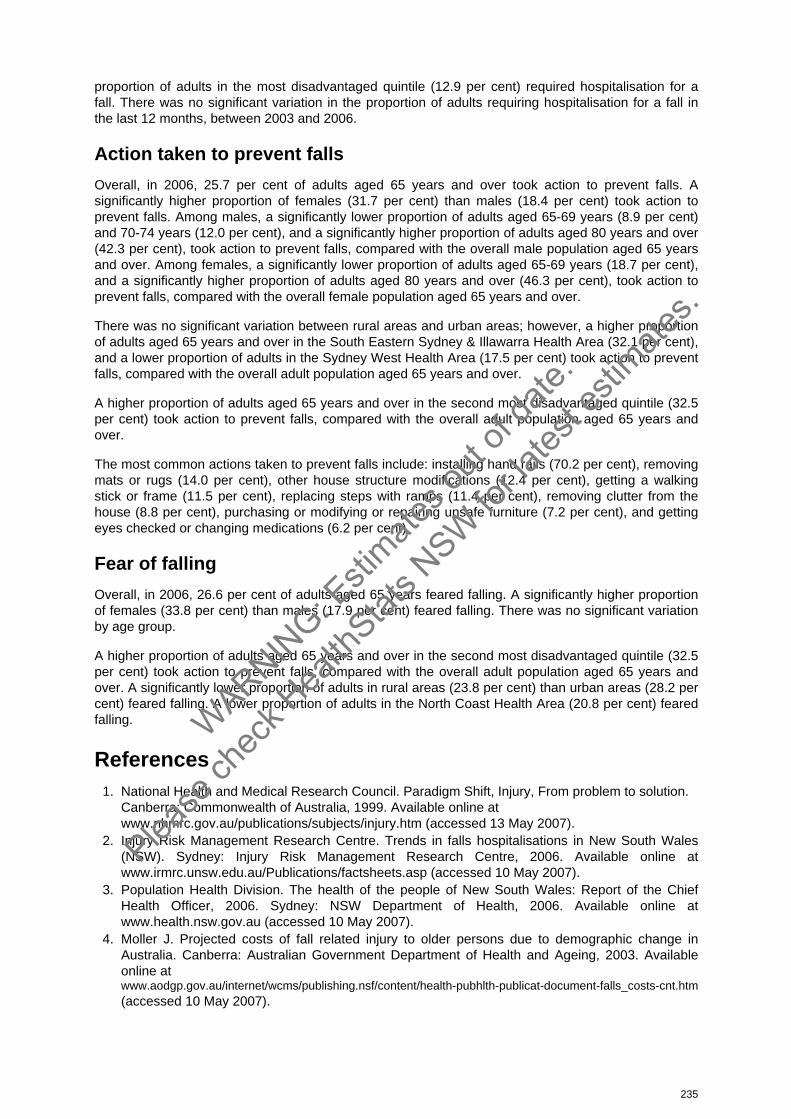
proportion of adults in the most disadvantaged quintile (12.9 per cent) required hospitalisation for afall. There was no significant variation in the proportion of adults requiring hospitalisation for a fall inthe last 12 months, between 2003 and 2006.
Action taken to prevent falls
Overall, in 2006, 25.7 per cent of adults aged 65 years and over took action to prevent falls. Asignificantly higher proportion of females (31.7 per cent) than males (18.4 per cent) took action toprevent falls. Among males, a significantly lower proportion of adults aged 65-69 years (8.9 per cent)and 70-74 years (12.0 per cent), and a significantly higher proportion of adults aged 80 years and over(42.3 per cent), took action to prevent falls, compared with the overall male population aged 65 yearsand over. Among females, a significantly lower proportion of adults aged 65-69 years (18.7 per cent),and a significantly higher proportion of adults aged 80 years and over (46.3 per cent), took action toprevent falls, compared with the overall female population aged 65 years and over.
There was no significant variation between rural areas and urban areas; however, a higher proportionof adults aged 65 years and over in the South Eastern Sydney & Illawarra Health Area (32.1 per cent),and a lower proportion of adults in the Sydney West Health Area (17.5 per cent) took action to preventfalls, compared with the overall adult population aged 65 years and over.
A higher proportion of adults aged 65 years and over in the second most disadvantaged quintile (32.5per cent) took action to prevent falls, compared with the overall adult population aged 65 years and over.
The most common actions taken to prevent falls include: installing hand rails (70.2 per cent), removingmats or rugs (14.0 per cent), other house structure modifications (12.4 per cent), getting a walkingstick or frame (11.5 per cent), replacing steps with ramps (11.4 per cent), removing clutter from thehouse (8.8 per cent), purchasing or modifying or repairing unsafe furniture (7.2 per cent), and gettingeyes checked or changing medications (6.2 per cent).
Fear of falling
Overall, in 2006, 26.6 per cent of adults aged 65 years feared falling. A significantly higher proportionof females (33.8 per cent) than males (17.9 per cent) feared falling. There was no significant variationby age group.
A higher proportion of adults aged 65 years and over in the second most disadvantaged quintile (32.5per cent) took action to prevent falls, compared with the overall adult population aged 65 years andover. A significantly lower proportion of adults in rural areas (23.8 per cent) than urban areas (28.2 percent) feared falling. A lower proportion of adults in the North Coast Health Area (20.8 per cent) feared falling.
References1. National Health and Medical Research Council. Paradigm Shift, Injury, From problem to solution.
Canberra: Commonwealth of Australia, 1999. Available online atwww.nhmrc.gov.au/publications/subjects/injury.htm (accessed 13 May 2007).
2. Injury Risk Management Research Centre. Trends in falls hospitalisations in New South Wales (NSW). Sydney: Injury Risk Management Research Centre, 2006. Available online atwww.irmrc.unsw.edu.au/Publications/factsheets.asp (accessed 10 May 2007).
3. Population Health Division. The health of the people of New South Wales: Report of the ChiefHealth Officer, 2006. Sydney: NSW Department of Health, 2006. Available online atwww.health.nsw.gov.au (accessed 10 May 2007).
4. Moller J. Projected costs of fall related injury to older persons due to demographic change in Australia. Canberra: Australian Government Department of Health and Ageing, 2003. Availableonline atwww.aodgp.gov.au/internet/wcms/publishing.nsf/content/health-pubhlth-publicat-document-falls_costs-cnt.htm(accessed 10 May 2007).
235
WARNIN
G: Esti
mates o
ut of
date.
Please
chec
k Hea
lthStat
s NSW
for la
test e
stimate
s.

Falls in the last 12 months by age, persons aged 65 years and over, NSW, 2006
020406080100 0 20 40 60 80 100
Males Females
Per cent Per cent
28.7 35.980+
Age (years)
22.3 34.775-79
14.7 23.970-74
10.9 23.465-69
18.1 29.4All Ages
Age(years)
Males(95% CI)
Females(95% CI)
Persons(95% CI)
65-69 10.9 (6.6-15.2) 23.4 (18.2-28.6) 17.2 (13.8-20.6)
70-74 14.7 (9.9-19.6) 23.9 (18.8-28.9) 19.5 (15.9-23.1)
75-79 22.3 (16.0-28.6) 34.7 (28.6-40.8) 29.1 (24.7-33.6)
80+ 28.7 (20.8-36.6) 35.9 (29.7-42.0) 33.1 (28.3-38.0)
All Ages 18.1 (15.2-21.0) 29.4 (26.6-32.3) 24.3 (22.2-26.3)
Note: Estimates are based on 2,381 respondents in NSW. For this indicator 7 (0.29%) were not stated (Don’t know or Refused) in NSW. The indicator includes those who had a fall in the last 12 months. The question used to define the indicator was: In the last 12 months have you had a fall?
Source: New South Wales Population Health Survey 2006 (HOIST). Centre for Epidemiology and Research, NSW Department of Health.
236
WARNIN
G: Esti
mates o
ut of
date.
Please
chec
k Hea
lthStat
s NSW
for la
test e
stimate
s.
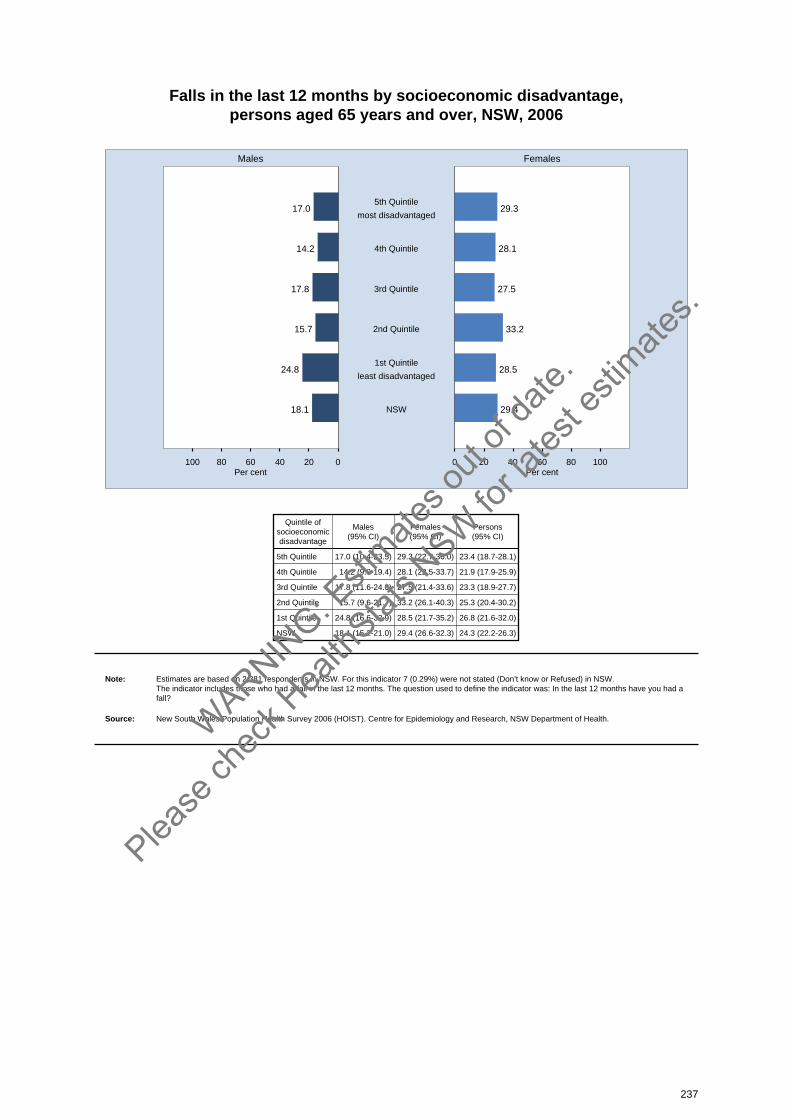
Falls in the last 12 months by socioeconomic disadvantage, persons aged 65 years and over, NSW, 2006
020406080100 0 20 40 60 80 100
Males Females
Per cent Per cent
17.0 29.35th Quintile
most disadvantaged
14.2 28.14th Quintile
17.8 27.53rd Quintile
15.7 33.22nd Quintile
24.8 28.51st Quintile
least disadvantaged
18.1 29.4NSW
Quintile ofsocioeconomicdisadvantage
Males(95% CI)
Females(95% CI)
Persons(95% CI)
5th Quintile 17.0 (10.4-23.5) 29.3 (22.7-36.0) 23.4 (18.7-28.1)
4th Quintile 14.2 (9.0-19.4) 28.1 (22.5-33.7) 21.9 (17.9-25.9)
3rd Quintile 17.8 (11.6-24.0) 27.5 (21.4-33.6) 23.3 (18.9-27.7)
2nd Quintile 15.7 (9.6-21.7) 33.2 (26.1-40.3) 25.3 (20.4-30.2)
1st Quintile 24.8 (16.6-32.9) 28.5 (21.7-35.2) 26.8 (21.6-32.0)
NSW 18.1 (15.2-21.0) 29.4 (26.6-32.3) 24.3 (22.2-26.3)
Note: Estimates are based on 2,381 respondents in NSW. For this indicator 7 (0.29%) were not stated (Don’t know or Refused) in NSW. The indicator includes those who had a fall in the last 12 months. The question used to define the indicator was: In the last 12 months have you had a fall?
Source: New South Wales Population Health Survey 2006 (HOIST). Centre for Epidemiology and Research, NSW Department of Health.
237
WARNIN
G: Esti
mates o
ut of
date.
Please
chec
k Hea
lthStat
s NSW
for la
test e
stimate
s.
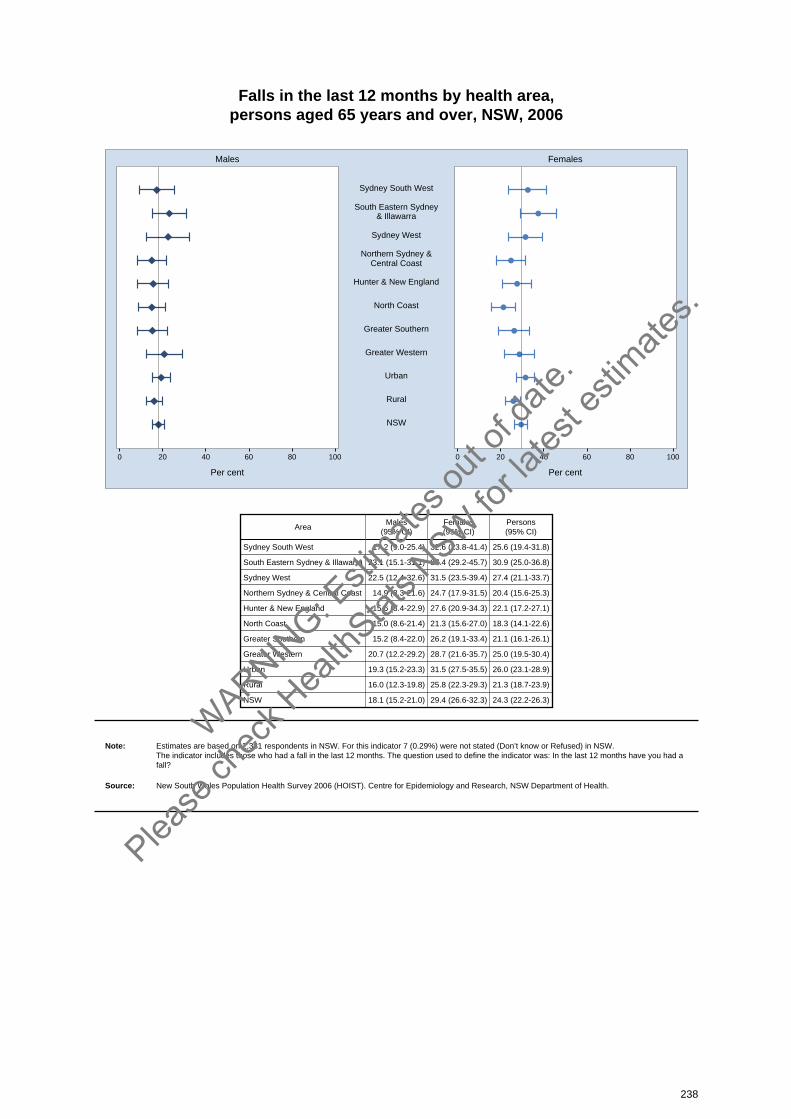
Falls in the last 12 months by health area, persons aged 65 years and over, NSW, 2006
0 20 40 60 80 100 0 20 40 60 80 100
Males Females
Per cent Per cent
Sydney South West
South Eastern Sydney& Illawarra
Sydney West
Northern Sydney &Central Coast
Hunter & New England
North Coast
Greater Southern
Greater Western
Urban
Rural
NSW
AreaMales
(95% CI)Females(95% CI)
Persons(95% CI)
Sydney South West 17.2 (9.0-25.4) 32.6 (23.8-41.4) 25.6 (19.4-31.8)
South Eastern Sydney & Illawarra 23.1 (15.1-31.1) 37.4 (29.2-45.7) 30.9 (25.0-36.8)
Sydney West 22.5 (12.4-32.6) 31.5 (23.5-39.4) 27.4 (21.1-33.7)
Northern Sydney & Central Coast 14.9 (8.3-21.6) 24.7 (17.9-31.5) 20.4 (15.6-25.3)
Hunter & New England 15.6 (8.4-22.9) 27.6 (20.9-34.3) 22.1 (17.2-27.1)
North Coast 15.0 (8.6-21.4) 21.3 (15.6-27.0) 18.3 (14.1-22.6)
Greater Southern 15.2 (8.4-22.0) 26.2 (19.1-33.4) 21.1 (16.1-26.1)
Greater Western 20.7 (12.2-29.2) 28.7 (21.6-35.7) 25.0 (19.5-30.4)
Urban 19.3 (15.2-23.3) 31.5 (27.5-35.5) 26.0 (23.1-28.9)
Rural 16.0 (12.3-19.8) 25.8 (22.3-29.3) 21.3 (18.7-23.9)
NSW 18.1 (15.2-21.0) 29.4 (26.6-32.3) 24.3 (22.2-26.3)
Note: Estimates are based on 2,381 respondents in NSW. For this indicator 7 (0.29%) were not stated (Don’t know or Refused) in NSW. The indicator includes those who had a fall in the last 12 months. The question used to define the indicator was: In the last 12 months have you had a fall?
Source: New South Wales Population Health Survey 2006 (HOIST). Centre for Epidemiology and Research, NSW Department of Health.
238
WARNIN
G: Esti
mates o
ut of
date.
Please
chec
k Hea
lthStat
s NSW
for la
test e
stimate
s.
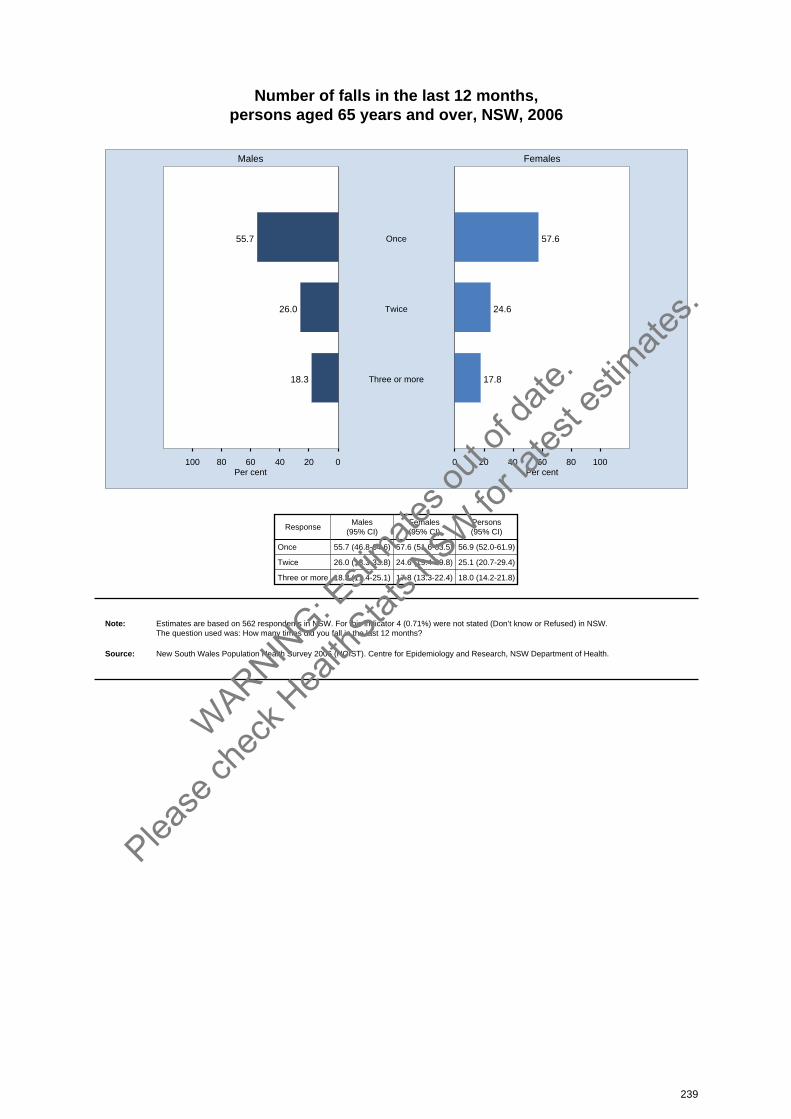
Number of falls in the last 12 months, persons aged 65 years and over, NSW, 2006
020406080100 0 20 40 60 80 100
Males Females
Per cent Per cent
55.7 57.6Once
26.0 24.6Twice
18.3 17.8Three or more
ResponseMales
(95% CI)Females(95% CI)
Persons(95% CI)
Once 55.7 (46.8-64.6) 57.6 (51.6-63.5) 56.9 (52.0-61.9)
Twice 26.0 (18.3-33.8) 24.6 (19.4-29.8) 25.1 (20.7-29.4)
Three or more 18.3 (11.4-25.1) 17.8 (13.3-22.4) 18.0 (14.2-21.8)
Note: Estimates are based on 562 respondents in NSW. For this indicator 4 (0.71%) were not stated (Don’t know or Refused) in NSW. The question used was: How many times did you fall in the last 12 months?
Source: New South Wales Population Health Survey 2006 (HOIST). Centre for Epidemiology and Research, NSW Department of Health.
239
WARNIN
G: Esti
mates o
ut of
date.
Please
chec
k Hea
lthStat
s NSW
for la
test e
stimate
s.
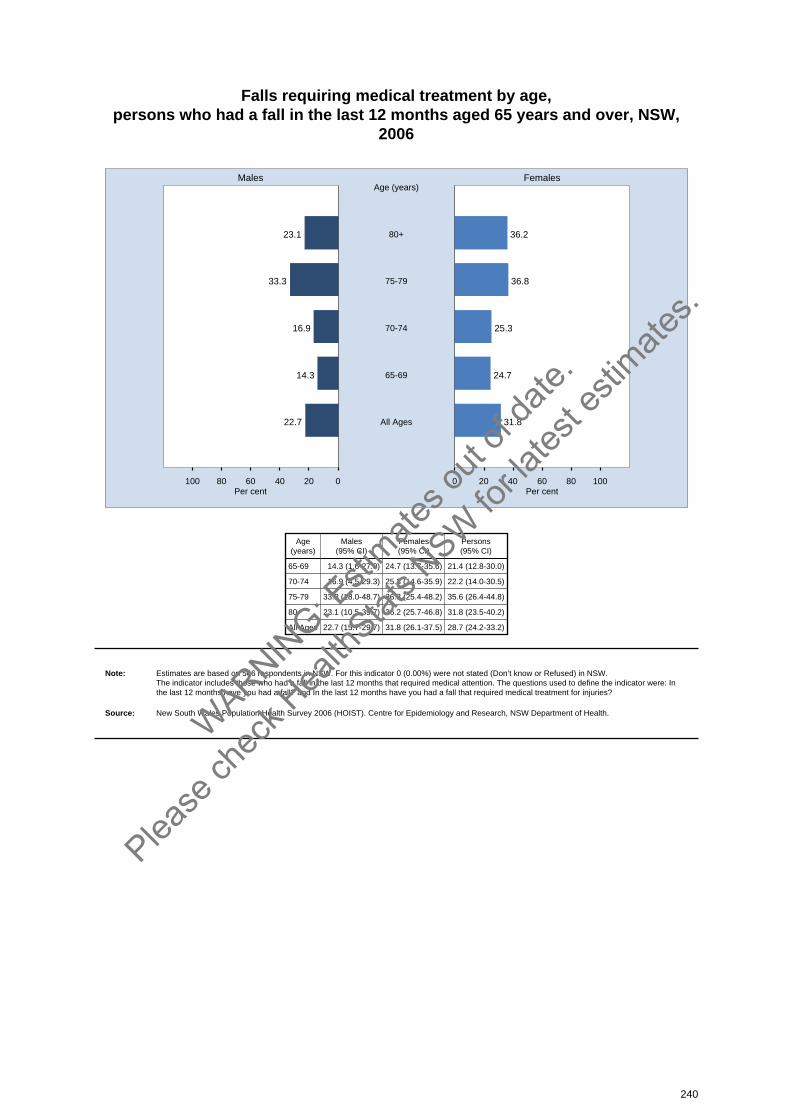
Falls requiring medical treatment by age, persons who had a fall in the last 12 months aged 65 years and over, NSW,
2006
020406080100 0 20 40 60 80 100
Males Females
Per cent Per cent
23.1 36.280+
Age (years)
33.3 36.875-79
16.9 25.370-74
14.3 24.765-69
22.7 31.8All Ages
Age(years)
Males(95% CI)
Females(95% CI)
Persons(95% CI)
65-69 14.3 (1.6-27.0) 24.7 (13.7-35.6) 21.4 (12.8-30.0)
70-74 16.9 (4.5-29.3) 25.3 (14.6-35.9) 22.2 (14.0-30.5)
75-79 33.3 (18.0-48.7) 36.8 (25.4-48.2) 35.6 (26.4-44.8)
80+ 23.1 (10.5-35.7) 36.2 (25.7-46.8) 31.8 (23.5-40.2)
All Ages 22.7 (15.7-29.7) 31.8 (26.1-37.5) 28.7 (24.2-33.2)
Note: Estimates are based on 566 respondents in NSW. For this indicator 0 (0.00%) were not stated (Don’t know or Refused) in NSW. The indicator includes those who had a fall in the last 12 months that required medical attention. The questions used to define the indicator were: Inthe last 12 months have you had a fall? and In the last 12 months have you had a fall that required medical treatment for injuries?
Source: New South Wales Population Health Survey 2006 (HOIST). Centre for Epidemiology and Research, NSW Department of Health.
240
WARNIN
G: Esti
mates o
ut of
date.
Please
chec
k Hea
lthStat
s NSW
for la
test e
stimate
s.
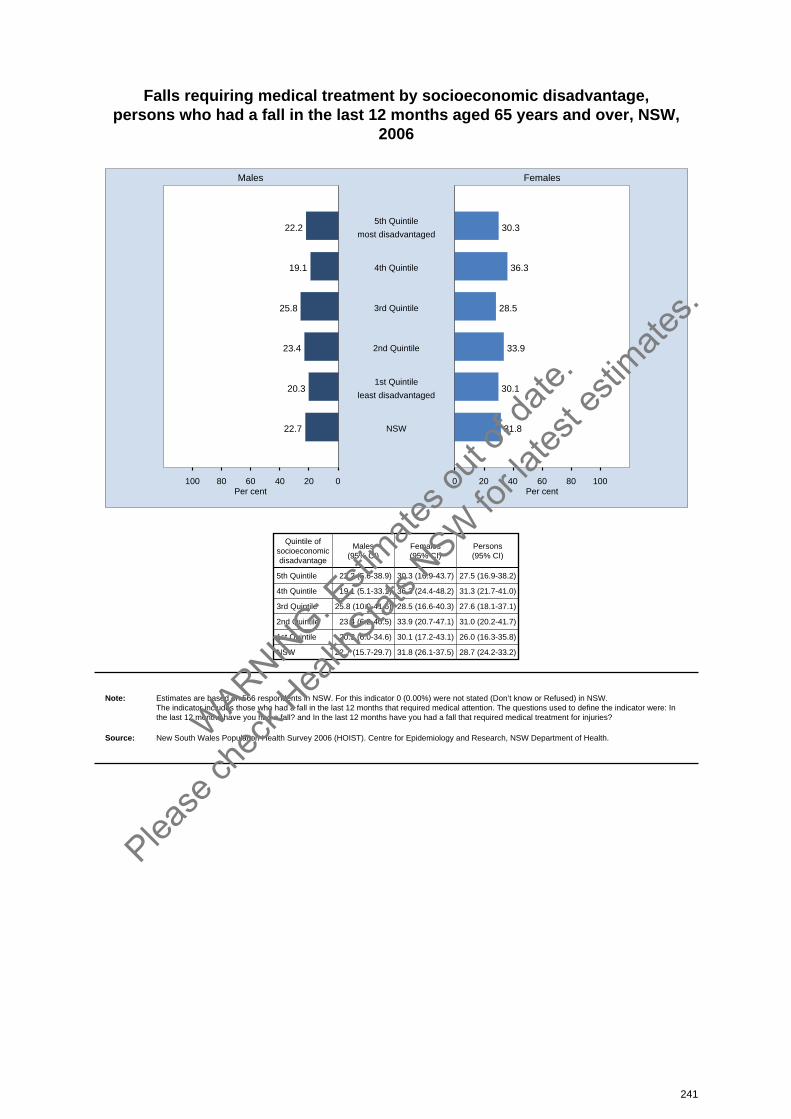
Falls requiring medical treatment by socioeconomic disadvantage, persons who had a fall in the last 12 months aged 65 years and over, NSW,
2006
020406080100 0 20 40 60 80 100
Males Females
Per cent Per cent
22.2 30.35th Quintile
most disadvantaged
19.1 36.34th Quintile
25.8 28.53rd Quintile
23.4 33.92nd Quintile
20.3 30.11st Quintile
least disadvantaged
22.7 31.8NSW
Quintile ofsocioeconomicdisadvantage
Males(95% CI)
Females(95% CI)
Persons(95% CI)
5th Quintile 22.2 (5.6-38.9) 30.3 (16.9-43.7) 27.5 (16.9-38.2)
4th Quintile 19.1 (5.1-33.1) 36.3 (24.4-48.2) 31.3 (21.7-41.0)
3rd Quintile 25.8 (10.0-41.6) 28.5 (16.6-40.3) 27.6 (18.1-37.1)
2nd Quintile 23.4 (6.2-40.5) 33.9 (20.7-47.1) 31.0 (20.2-41.7)
1st Quintile 20.3 (6.0-34.6) 30.1 (17.2-43.1) 26.0 (16.3-35.8)
NSW 22.7 (15.7-29.7) 31.8 (26.1-37.5) 28.7 (24.2-33.2)
Note: Estimates are based on 566 respondents in NSW. For this indicator 0 (0.00%) were not stated (Don’t know or Refused) in NSW. The indicator includes those who had a fall in the last 12 months that required medical attention. The questions used to define the indicator were: Inthe last 12 months have you had a fall? and In the last 12 months have you had a fall that required medical treatment for injuries?
Source: New South Wales Population Health Survey 2006 (HOIST). Centre for Epidemiology and Research, NSW Department of Health.
241
WARNIN
G: Esti
mates o
ut of
date.
Please
chec
k Hea
lthStat
s NSW
for la
test e
stimate
s.

Falls requiring medical treatment by health area, persons who had a fall in the last 12 months aged 65 years and over, NSW,
2006
0 20 40 60 80 100 0 20 40 60 80 100
Males Females
Per cent Per cent
Sydney South West
South Eastern Sydney& Illawarra
Sydney West
Northern Sydney &Central Coast
Hunter & New England
North Coast
Greater Southern
Greater Western
Urban
Rural
NSW
AreaMales
(95% CI)Females(95% CI)
Persons(95% CI)
Sydney South West 22.6 (1.1-44.1) 32.8 (15.9-49.6) 29.7 (16.1-43.3)
South Eastern Sydney & Illawarra 26.9 (9.8-44.0) 28.7 (15.2-42.2) 28.1 (17.4-38.7)
Sydney West 21.4 (3.7-39.2) 37.1 (22.3-52.0) 31.3 (19.4-43.2)
Northern Sydney & Central Coast 8.1 (0.0-19.4) 39.0 (22.9-55.1) 29.2 (16.8-41.6)
Hunter & New England 33.4 (10.4-56.3) 26.4 (13.5-39.3) 28.7 (17.3-40.1)
North Coast 6.5 (0.0-15.9) 20.5 (8.3-32.8) 15.2 (6.5-23.8)
Greater Southern 32.7 (8.2-57.2) 37.5 (21.9-53.0) 35.9 (22.7-49.0)
Greater Western 33.2 (10.4-56.0) 28.9 (15.6-42.3) 30.6 (18.5-42.7)
Urban 20.8 (11.9-29.6) 33.6 (26.0-41.2) 29.3 (23.3-35.3)
Rural 26.5 (15.5-37.5) 27.9 (20.8-35.0) 27.4 (21.4-33.4)
NSW 22.7 (15.7-29.7) 31.8 (26.1-37.5) 28.7 (24.2-33.2)
Note: Estimates are based on 566 respondents in NSW. For this indicator 0 (0.00%) were not stated (Don’t know or Refused) in NSW. The indicator includes those who had a fall in the last 12 months that required medical attention. The questions used to define the indicator were: Inthe last 12 months have you had a fall? and In the last 12 months have you had a fall that required medical treatment for injuries?
Source: New South Wales Population Health Survey 2006 (HOIST). Centre for Epidemiology and Research, NSW Department of Health.
242
WARNIN
G: Esti
mates o
ut of
date.
Please
chec
k Hea
lthStat
s NSW
for la
test e
stimate
s.
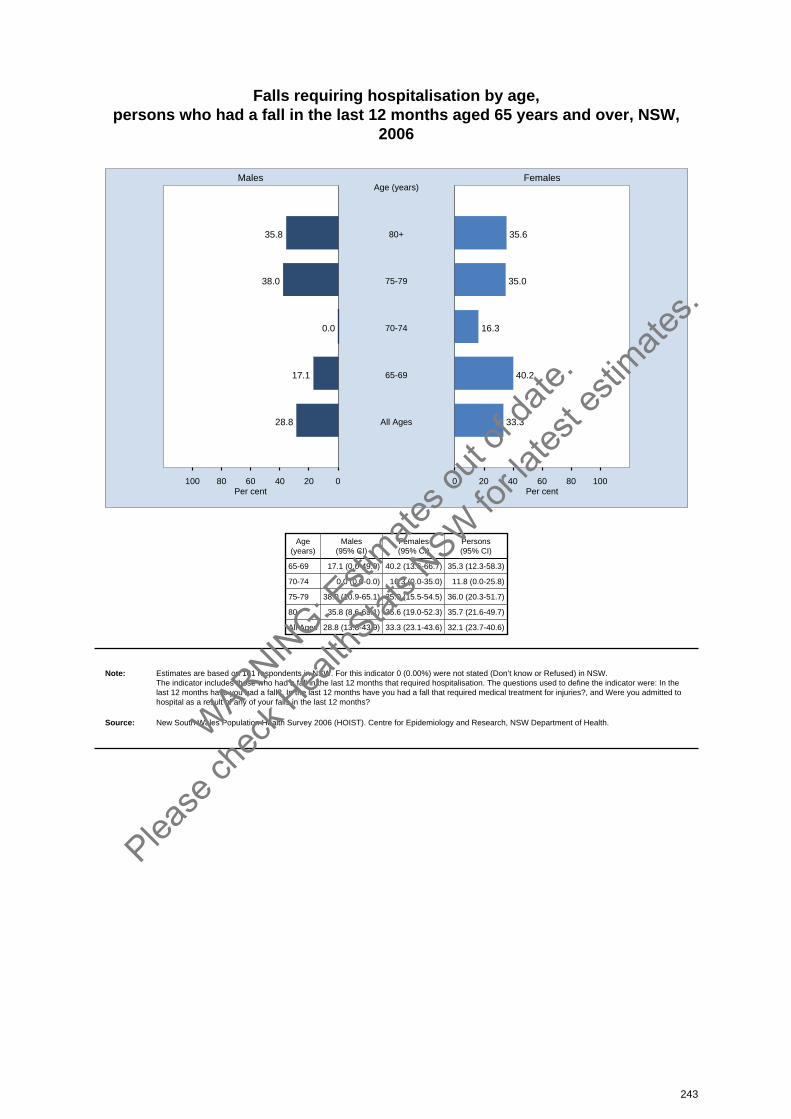
Falls requiring hospitalisation by age, persons who had a fall in the last 12 months aged 65 years and over, NSW,
2006
020406080100 0 20 40 60 80 100
Males Females
Per cent Per cent
35.8 35.680+
Age (years)
38.0 35.075-79
0.0 16.370-74
17.1 40.265-69
28.8 33.3All Ages
Age(years)
Males(95% CI)
Females(95% CI)
Persons(95% CI)
65-69 17.1 (0.0-49.0) 40.2 (13.6-66.7) 35.3 (12.3-58.3)
70-74 0.0 (0.0-0.0) 16.3 (0.0-35.0) 11.8 (0.0-25.8)
75-79 38.0 (10.9-65.1) 35.0 (15.5-54.5) 36.0 (20.3-51.7)
80+ 35.8 (8.6-63.1) 35.6 (19.0-52.3) 35.7 (21.6-49.7)
All Ages 28.8 (13.8-43.9) 33.3 (23.1-43.6) 32.1 (23.7-40.6)
Note: Estimates are based on 161 respondents in NSW. For this indicator 0 (0.00%) were not stated (Don’t know or Refused) in NSW. The indicator includes those who had a fall in the last 12 months that required hospitalisation. The questions used to define the indicator were: In thelast 12 months have you had a fall?, In the last 12 months have you had a fall that required medical treatment for injuries?, and Were you admitted tohospital as a result of any of your falls in the last 12 months?
Source: New South Wales Population Health Survey 2006 (HOIST). Centre for Epidemiology and Research, NSW Department of Health.
243
WARNIN
G: Esti
mates o
ut of
date.
Please
chec
k Hea
lthStat
s NSW
for la
test e
stimate
s.

Falls requiring hospitalisation by socioeconomic disadvantage, persons who had a fall in the last 12 months aged 65 years and over, NSW,
2006
020406080100 0 20 40 60 80 100
Males Females
Per cent Per cent
10.1 14.05th Quintile
most disadvantaged
25.3 35.74th Quintile
32.7 55.63rd Quintile
41.1 23.12nd Quintile
27.3 42.81st Quintile
least disadvantaged
28.8 33.3NSW
Quintile ofsocioeconomicdisadvantage
Males(95% CI)
Females(95% CI)
Persons(95% CI)
5th Quintile 10.1 (0.0-29.8) 14.0 (0.0-28.8) 12.9 (1.1-24.8)
4th Quintile 25.3 (0.0-66.0) 35.7 (16.8-54.7) 33.9 (17.1-50.7)
3rd Quintile 32.7 (0.7-64.6) 55.6 (31.5-79.8) 48.5 (28.3-68.6)
2nd Quintile 41.1 (2.0-80.1) 23.1 (1.1-45.0) 26.8 (7.6-46.1)
1st Quintile 27.3 (0.0-61.3) 42.8 (17.3-68.3) 37.7 (16.9-58.6)
NSW 28.8 (13.8-43.9) 33.3 (23.1-43.6) 32.1 (23.7-40.6)
Note: Estimates are based on 161 respondents in NSW. For this indicator 0 (0.00%) were not stated (Don’t know or Refused) in NSW. The indicator includes those who had a fall in the last 12 months that required hospitalisation. The questions used to define the indicator were: In thelast 12 months have you had a fall?, In the last 12 months have you had a fall that required medical treatment for injuries?, and Were you admitted tohospital as a result of any of your falls in the last 12 months?
Source: New South Wales Population Health Survey 2006 (HOIST). Centre for Epidemiology and Research, NSW Department of Health.
244
WARNIN
G: Esti
mates o
ut of
date.
Please
chec
k Hea
lthStat
s NSW
for la
test e
stimate
s.
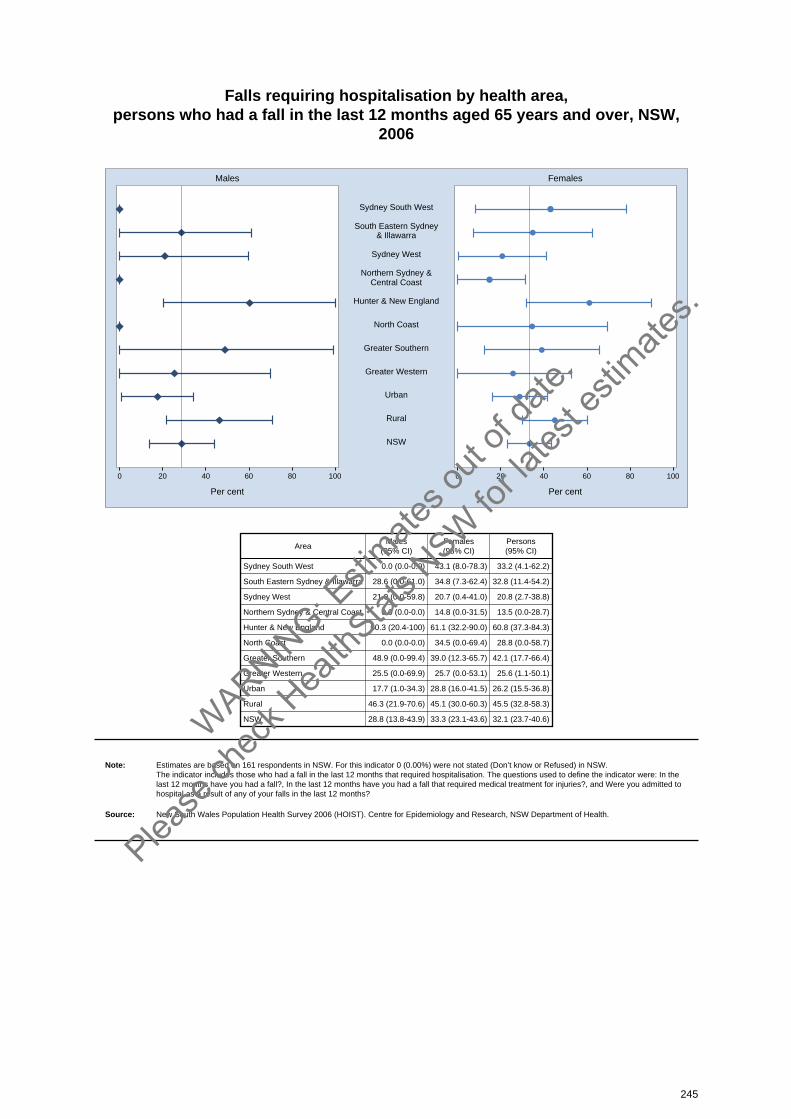
Falls requiring hospitalisation by health area, persons who had a fall in the last 12 months aged 65 years and over, NSW,
2006
0 20 40 60 80 100 0 20 40 60 80 100
Males Females
Per cent Per cent
Sydney South West
South Eastern Sydney& Illawarra
Sydney West
Northern Sydney &Central Coast
Hunter & New England
North Coast
Greater Southern
Greater Western
Urban
Rural
NSW
AreaMales
(95% CI)Females(95% CI)
Persons(95% CI)
Sydney South West 0.0 (0.0-0.0) 43.1 (8.0-78.3) 33.2 (4.1-62.2)
South Eastern Sydney & Illawarra 28.6 (0.0-61.0) 34.8 (7.3-62.4) 32.8 (11.4-54.2)
Sydney West 21.0 (0.0-59.8) 20.7 (0.4-41.0) 20.8 (2.7-38.8)
Northern Sydney & Central Coast 0.0 (0.0-0.0) 14.8 (0.0-31.5) 13.5 (0.0-28.7)
Hunter & New England 60.3 (20.4-100) 61.1 (32.2-90.0) 60.8 (37.3-84.3)
North Coast 0.0 (0.0-0.0) 34.5 (0.0-69.4) 28.8 (0.0-58.7)
Greater Southern 48.9 (0.0-99.4) 39.0 (12.3-65.7) 42.1 (17.7-66.4)
Greater Western 25.5 (0.0-69.9) 25.7 (0.0-53.1) 25.6 (1.1-50.1)
Urban 17.7 (1.0-34.3) 28.8 (16.0-41.5) 26.2 (15.5-36.8)
Rural 46.3 (21.9-70.6) 45.1 (30.0-60.3) 45.5 (32.8-58.3)
NSW 28.8 (13.8-43.9) 33.3 (23.1-43.6) 32.1 (23.7-40.6)
Note: Estimates are based on 161 respondents in NSW. For this indicator 0 (0.00%) were not stated (Don’t know or Refused) in NSW. The indicator includes those who had a fall in the last 12 months that required hospitalisation. The questions used to define the indicator were: In thelast 12 months have you had a fall?, In the last 12 months have you had a fall that required medical treatment for injuries?, and Were you admitted tohospital as a result of any of your falls in the last 12 months?
Source: New South Wales Population Health Survey 2006 (HOIST). Centre for Epidemiology and Research, NSW Department of Health.
245
WARNIN
G: Esti
mates o
ut of
date.
Please
chec
k Hea
lthStat
s NSW
for la
test e
stimate
s.

Any action taken to prevent falls by age, persons aged 65 years and over, NSW, 2006
020406080100 0 20 40 60 80 100
Males Females
Per cent Per cent
42.3 46.380+
Age (years)
16.6 34.375-79
12.0 26.670-74
8.9 18.765-69
18.4 31.7All Ages
Age(years)
Males(95% CI)
Females(95% CI)
Persons(95% CI)
65-69 8.9 (4.9-12.8) 18.7 (14.2-23.3) 13.9 (10.8-16.9)
70-74 12.0 (7.5-16.5) 26.6 (21.3-31.9) 19.7 (16.1-23.2)
75-79 16.6 (11.3-21.8) 34.3 (28.4-40.3) 26.2 (22.1-30.4)
80+ 42.3 (33.8-50.8) 46.3 (40.0-52.6) 44.8 (39.7-49.8)
All Ages 18.4 (15.5-21.4) 31.7 (28.8-34.6) 25.7 (23.6-27.7)
Note: Estimates are based on 2,384 respondents in NSW. For this indicator 4 (0.17%) were not stated (Don’t know or Refused) in NSW. The indicator includes those who have made any changes to his/her home or lifestyle to prevent from falling. The question used to define the indicatorwas: Have you made any changes to your home or lifestyle to prevent you from falling?
Source: New South Wales Population Health Survey 2006 (HOIST). Centre for Epidemiology and Research, NSW Department of Health.
246
WARNIN
G: Esti
mates o
ut of
date.
Please
chec
k Hea
lthStat
s NSW
for la
test e
stimate
s.
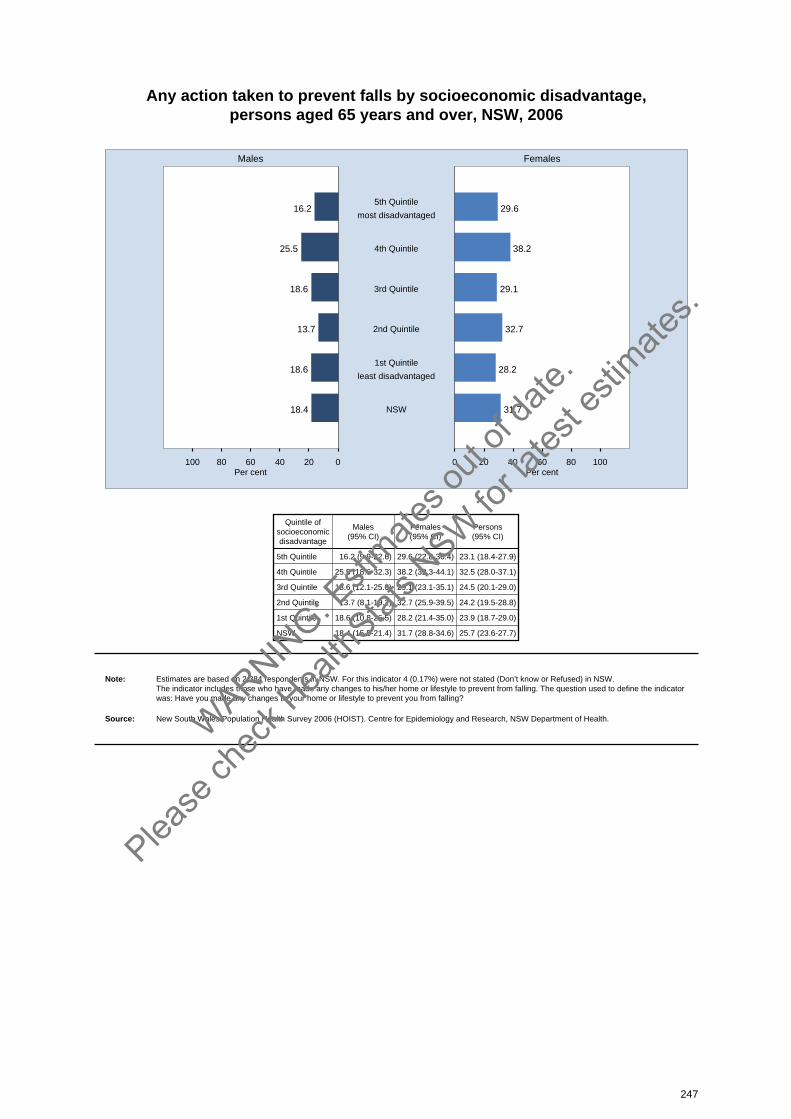
Any action taken to prevent falls by socioeconomic disadvantage, persons aged 65 years and over, NSW, 2006
020406080100 0 20 40 60 80 100
Males Females
Per cent Per cent
16.2 29.65th Quintile
most disadvantaged
25.5 38.24th Quintile
18.6 29.13rd Quintile
13.7 32.72nd Quintile
18.6 28.21st Quintile
least disadvantaged
18.4 31.7NSW
Quintile ofsocioeconomicdisadvantage
Males(95% CI)
Females(95% CI)
Persons(95% CI)
5th Quintile 16.2 (9.9-22.6) 29.6 (22.8-36.4) 23.1 (18.4-27.9)
4th Quintile 25.5 (18.6-32.3) 38.2 (32.3-44.1) 32.5 (28.0-37.1)
3rd Quintile 18.6 (12.1-25.0) 29.1 (23.1-35.1) 24.5 (20.1-29.0)
2nd Quintile 13.7 (8.1-19.2) 32.7 (25.9-39.5) 24.2 (19.5-28.8)
1st Quintile 18.6 (10.8-26.5) 28.2 (21.4-35.0) 23.9 (18.7-29.0)
NSW 18.4 (15.5-21.4) 31.7 (28.8-34.6) 25.7 (23.6-27.7)
Note: Estimates are based on 2,384 respondents in NSW. For this indicator 4 (0.17%) were not stated (Don’t know or Refused) in NSW. The indicator includes those who have made any changes to his/her home or lifestyle to prevent from falling. The question used to define the indicatorwas: Have you made any changes to your home or lifestyle to prevent you from falling?
Source: New South Wales Population Health Survey 2006 (HOIST). Centre for Epidemiology and Research, NSW Department of Health.
247
WARNIN
G: Esti
mates o
ut of
date.
Please
chec
k Hea
lthStat
s NSW
for la
test e
stimate
s.
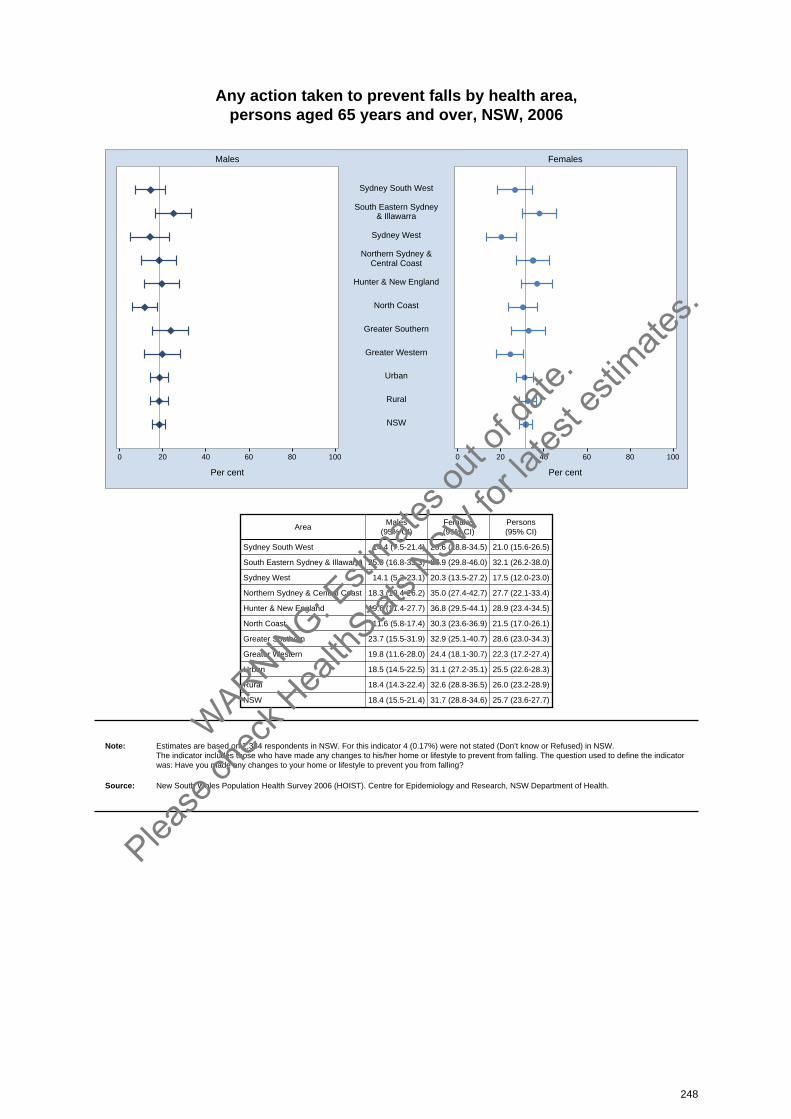
Any action taken to prevent falls by health area, persons aged 65 years and over, NSW, 2006
0 20 40 60 80 100 0 20 40 60 80 100
Males Females
Per cent Per cent
Sydney South West
South Eastern Sydney& Illawarra
Sydney West
Northern Sydney &Central Coast
Hunter & New England
North Coast
Greater Southern
Greater Western
Urban
Rural
NSW
AreaMales
(95% CI)Females(95% CI)
Persons(95% CI)
Sydney South West 14.4 (7.5-21.4) 26.6 (18.8-34.5) 21.0 (15.6-26.5)
South Eastern Sydney & Illawarra 25.0 (16.8-33.3) 37.9 (29.8-46.0) 32.1 (26.2-38.0)
Sydney West 14.1 (5.2-23.1) 20.3 (13.5-27.2) 17.5 (12.0-23.0)
Northern Sydney & Central Coast 18.3 (10.4-26.2) 35.0 (27.4-42.7) 27.7 (22.1-33.4)
Hunter & New England 19.6 (11.4-27.7) 36.8 (29.5-44.1) 28.9 (23.4-34.5)
North Coast 11.6 (5.8-17.4) 30.3 (23.6-36.9) 21.5 (17.0-26.1)
Greater Southern 23.7 (15.5-31.9) 32.9 (25.1-40.7) 28.6 (23.0-34.3)
Greater Western 19.8 (11.6-28.0) 24.4 (18.1-30.7) 22.3 (17.2-27.4)
Urban 18.5 (14.5-22.5) 31.1 (27.2-35.1) 25.5 (22.6-28.3)
Rural 18.4 (14.3-22.4) 32.6 (28.8-36.5) 26.0 (23.2-28.9)
NSW 18.4 (15.5-21.4) 31.7 (28.8-34.6) 25.7 (23.6-27.7)
Note: Estimates are based on 2,384 respondents in NSW. For this indicator 4 (0.17%) were not stated (Don’t know or Refused) in NSW. The indicator includes those who have made any changes to his/her home or lifestyle to prevent from falling. The question used to define the indicatorwas: Have you made any changes to your home or lifestyle to prevent you from falling?
Source: New South Wales Population Health Survey 2006 (HOIST). Centre for Epidemiology and Research, NSW Department of Health.
248
WARNIN
G: Esti
mates o
ut of
date.
Please
chec
k Hea
lthStat
s NSW
for la
test e
stimate
s.
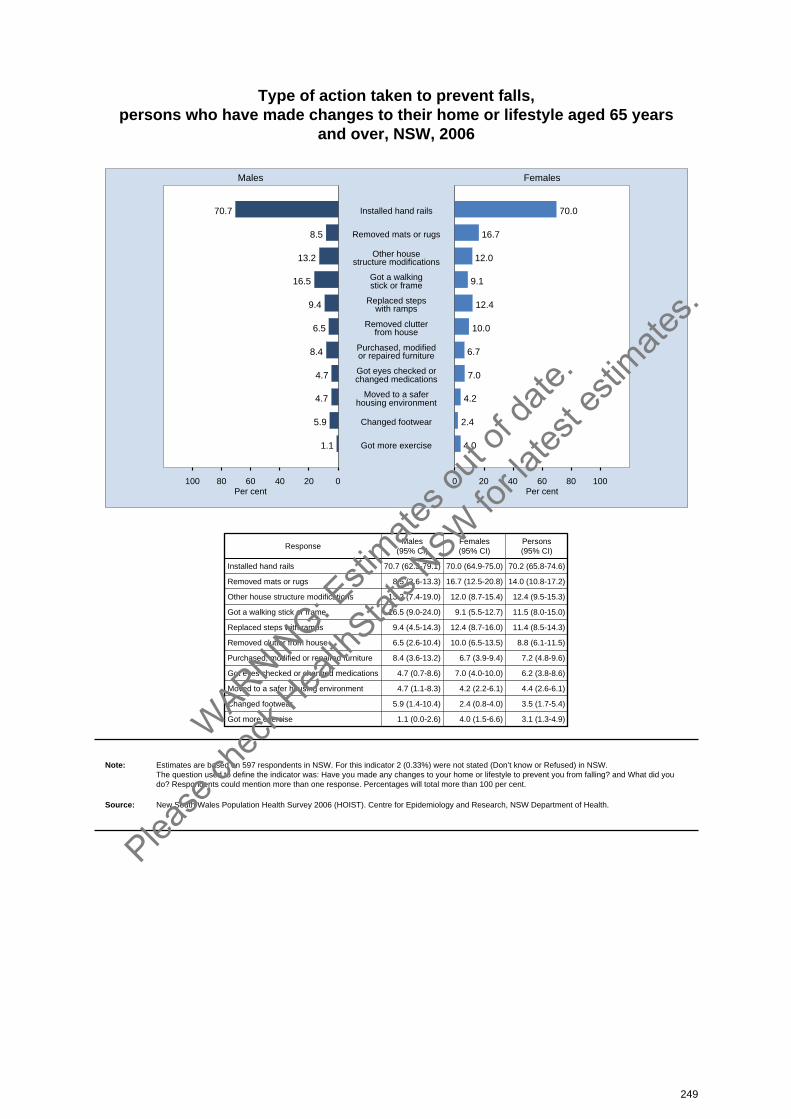
Type of action taken to prevent falls, persons who have made changes to their home or lifestyle aged 65 years
and over, NSW, 2006
020406080100 0 20 40 60 80 100
Males Females
Per cent Per cent
70.7 70.0Installed hand rails
8.5 16.7Removed mats or rugs
13.2 12.0Other housestructure modifications
16.5 9.1Got a walkingstick or frame
9.4 12.4Replaced stepswith ramps
6.5 10.0Removed clutterfrom house
8.4 6.7Purchased, modifiedor repaired furniture
4.7 7.0Got eyes checked orchanged medications
4.7 4.2Moved to a saferhousing environment
5.9 2.4Changed footwear
1.1 4.0Got more exercise
ResponseMales
(95% CI)Females(95% CI)
Persons(95% CI)
Installed hand rails 70.7 (62.3-79.1) 70.0 (64.9-75.0) 70.2 (65.8-74.6)
Removed mats or rugs 8.5 (3.6-13.3) 16.7 (12.5-20.8) 14.0 (10.8-17.2)
Other house structure modifications 13.2 (7.4-19.0) 12.0 (8.7-15.4) 12.4 (9.5-15.3)
Got a walking stick or frame 16.5 (9.0-24.0) 9.1 (5.5-12.7) 11.5 (8.0-15.0)
Replaced steps with ramps 9.4 (4.5-14.3) 12.4 (8.7-16.0) 11.4 (8.5-14.3)
Removed clutter from house 6.5 (2.6-10.4) 10.0 (6.5-13.5) 8.8 (6.1-11.5)
Purchased, modified or repaired furniture 8.4 (3.6-13.2) 6.7 (3.9-9.4) 7.2 (4.8-9.6)
Got eyes checked or changed medications 4.7 (0.7-8.6) 7.0 (4.0-10.0) 6.2 (3.8-8.6)
Moved to a safer housing environment 4.7 (1.1-8.3) 4.2 (2.2-6.1) 4.4 (2.6-6.1)
Changed footwear 5.9 (1.4-10.4) 2.4 (0.8-4.0) 3.5 (1.7-5.4)
Got more exercise 1.1 (0.0-2.6) 4.0 (1.5-6.6) 3.1 (1.3-4.9)
Note: Estimates are based on 597 respondents in NSW. For this indicator 2 (0.33%) were not stated (Don’t know or Refused) in NSW. The question used to define the indicator was: Have you made any changes to your home or lifestyle to prevent you from falling? and What did youdo? Respondents could mention more than one response. Percentages will total more than 100 per cent.
Source: New South Wales Population Health Survey 2006 (HOIST). Centre for Epidemiology and Research, NSW Department of Health.
249
WARNIN
G: Esti
mates o
ut of
date.
Please
chec
k Hea
lthStat
s NSW
for la
test e
stimate
s.

Fear of falling by age, persons aged 65 years and over, NSW, 2006
020406080100 0 20 40 60 80 100
Males Females
Per cent Per cent
19.2 38.880+
Age (years)
19.1 34.275-79
19.9 31.570-74
14.7 30.565-69
17.9 33.8All Ages
Age(years)
Males(95% CI)
Females(95% CI)
Persons(95% CI)
65-69 14.7 (10.0-19.4) 30.5 (25.0-35.9) 22.7 (19.0-26.4)
70-74 19.9 (13.6-26.1) 31.5 (25.9-37.0) 25.9 (21.8-30.1)
75-79 19.1 (13.3-24.8) 34.2 (28.4-40.0) 27.3 (23.1-31.4)
80+ 19.2 (12.5-25.8) 38.8 (32.5-45.0) 31.2 (26.4-35.9)
All Ages 17.9 (15.0-20.8) 33.8 (30.9-36.8) 26.6 (24.5-28.7)
Note: Estimates are based on 2,371 respondents in NSW. For this indicator 17 (0.71%) were not stated (Don’t know or Refused) in NSW. The indicator includes those respondents who are afraid of falling. The question used to define the indicator was: Are you afraid of falling?
Source: New South Wales Population Health Survey 2006 (HOIST). Centre for Epidemiology and Research, NSW Department of Health.
250
WARNIN
G: Esti
mates o
ut of
date.
Please
chec
k Hea
lthStat
s NSW
for la
test e
stimate
s.
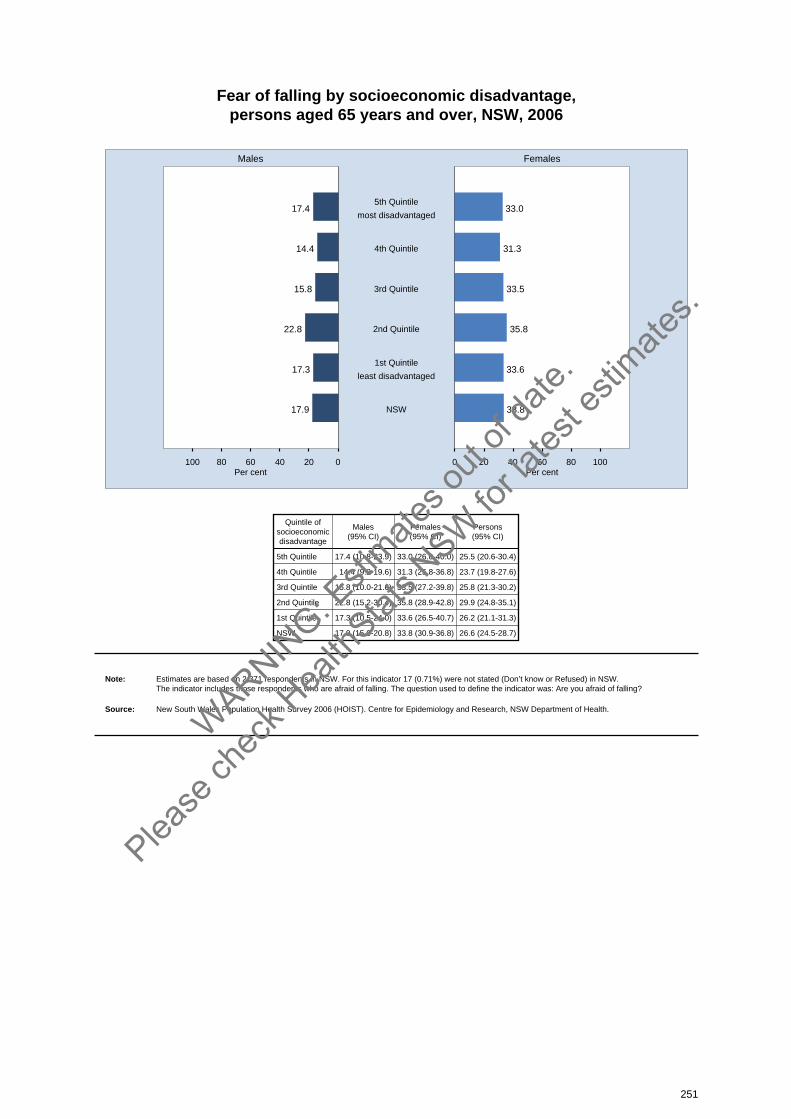
Fear of falling by socioeconomic disadvantage, persons aged 65 years and over, NSW, 2006
020406080100 0 20 40 60 80 100
Males Females
Per cent Per cent
17.4 33.05th Quintile
most disadvantaged
14.4 31.34th Quintile
15.8 33.53rd Quintile
22.8 35.82nd Quintile
17.3 33.61st Quintile
least disadvantaged
17.9 33.8NSW
Quintile ofsocioeconomicdisadvantage
Males(95% CI)
Females(95% CI)
Persons(95% CI)
5th Quintile 17.4 (10.8-23.9) 33.0 (26.0-40.0) 25.5 (20.6-30.4)
4th Quintile 14.4 (9.2-19.6) 31.3 (25.8-36.8) 23.7 (19.8-27.6)
3rd Quintile 15.8 (10.0-21.6) 33.5 (27.2-39.8) 25.8 (21.3-30.2)
2nd Quintile 22.8 (15.2-30.4) 35.8 (28.9-42.8) 29.9 (24.8-35.1)
1st Quintile 17.3 (10.5-24.0) 33.6 (26.5-40.7) 26.2 (21.1-31.3)
NSW 17.9 (15.0-20.8) 33.8 (30.9-36.8) 26.6 (24.5-28.7)
Note: Estimates are based on 2,371 respondents in NSW. For this indicator 17 (0.71%) were not stated (Don’t know or Refused) in NSW. The indicator includes those respondents who are afraid of falling. The question used to define the indicator was: Are you afraid of falling?
Source: New South Wales Population Health Survey 2006 (HOIST). Centre for Epidemiology and Research, NSW Department of Health.
251
WARNIN
G: Esti
mates o
ut of
date.
Please
chec
k Hea
lthStat
s NSW
for la
test e
stimate
s.
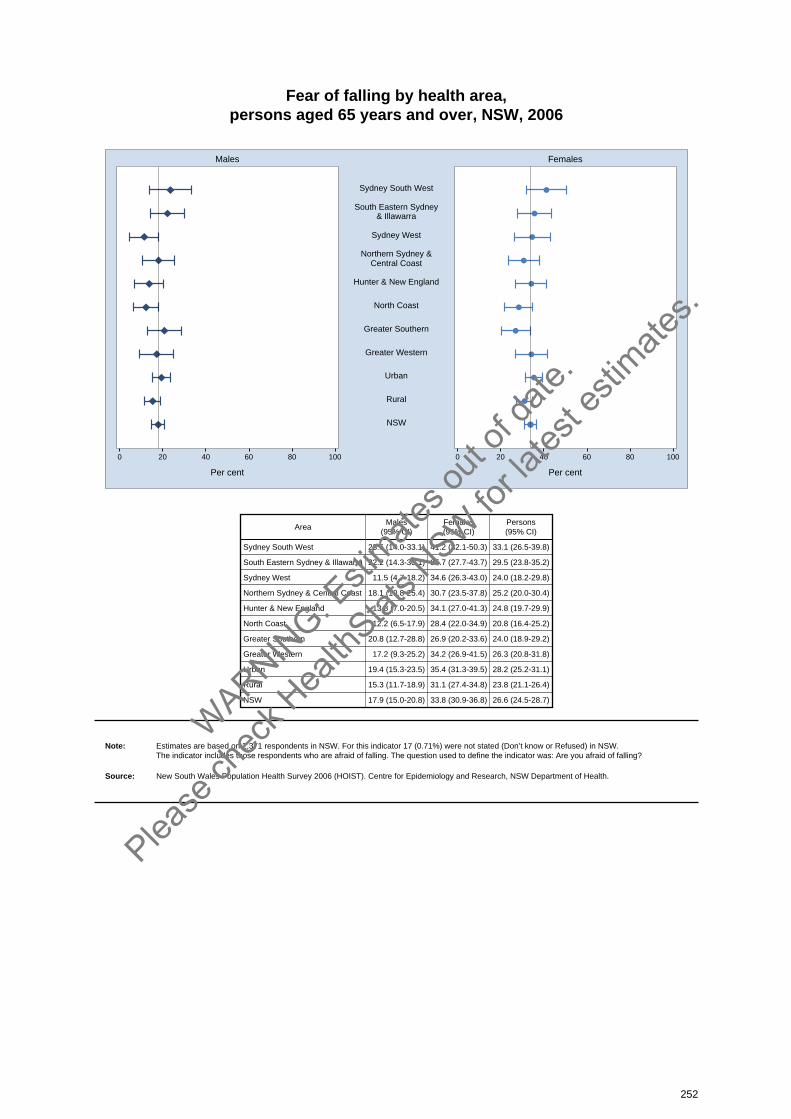
Fear of falling by health area, persons aged 65 years and over, NSW, 2006
0 20 40 60 80 100 0 20 40 60 80 100
Males Females
Per cent Per cent
Sydney South West
South Eastern Sydney& Illawarra
Sydney West
Northern Sydney &Central Coast
Hunter & New England
North Coast
Greater Southern
Greater Western
Urban
Rural
NSW
AreaMales
(95% CI)Females(95% CI)
Persons(95% CI)
Sydney South West 23.6 (14.0-33.1) 41.2 (32.1-50.3) 33.1 (26.5-39.8)
South Eastern Sydney & Illawarra 22.2 (14.3-30.1) 35.7 (27.7-43.7) 29.5 (23.8-35.2)
Sydney West 11.5 (4.7-18.2) 34.6 (26.3-43.0) 24.0 (18.2-29.8)
Northern Sydney & Central Coast 18.1 (10.8-25.4) 30.7 (23.5-37.8) 25.2 (20.0-30.4)
Hunter & New England 13.8 (7.0-20.5) 34.1 (27.0-41.3) 24.8 (19.7-29.9)
North Coast 12.2 (6.5-17.9) 28.4 (22.0-34.9) 20.8 (16.4-25.2)
Greater Southern 20.8 (12.7-28.8) 26.9 (20.2-33.6) 24.0 (18.9-29.2)
Greater Western 17.2 (9.3-25.2) 34.2 (26.9-41.5) 26.3 (20.8-31.8)
Urban 19.4 (15.3-23.5) 35.4 (31.3-39.5) 28.2 (25.2-31.1)
Rural 15.3 (11.7-18.9) 31.1 (27.4-34.8) 23.8 (21.1-26.4)
NSW 17.9 (15.0-20.8) 33.8 (30.9-36.8) 26.6 (24.5-28.7)
Note: Estimates are based on 2,371 respondents in NSW. For this indicator 17 (0.71%) were not stated (Don’t know or Refused) in NSW. The indicator includes those respondents who are afraid of falling. The question used to define the indicator was: Are you afraid of falling?
Source: New South Wales Population Health Survey 2006 (HOIST). Centre for Epidemiology and Research, NSW Department of Health.
252
WARNIN
G: Esti
mates o
ut of
date.
Please
chec
k Hea
lthStat
s NSW
for la
test e
stimate
s.
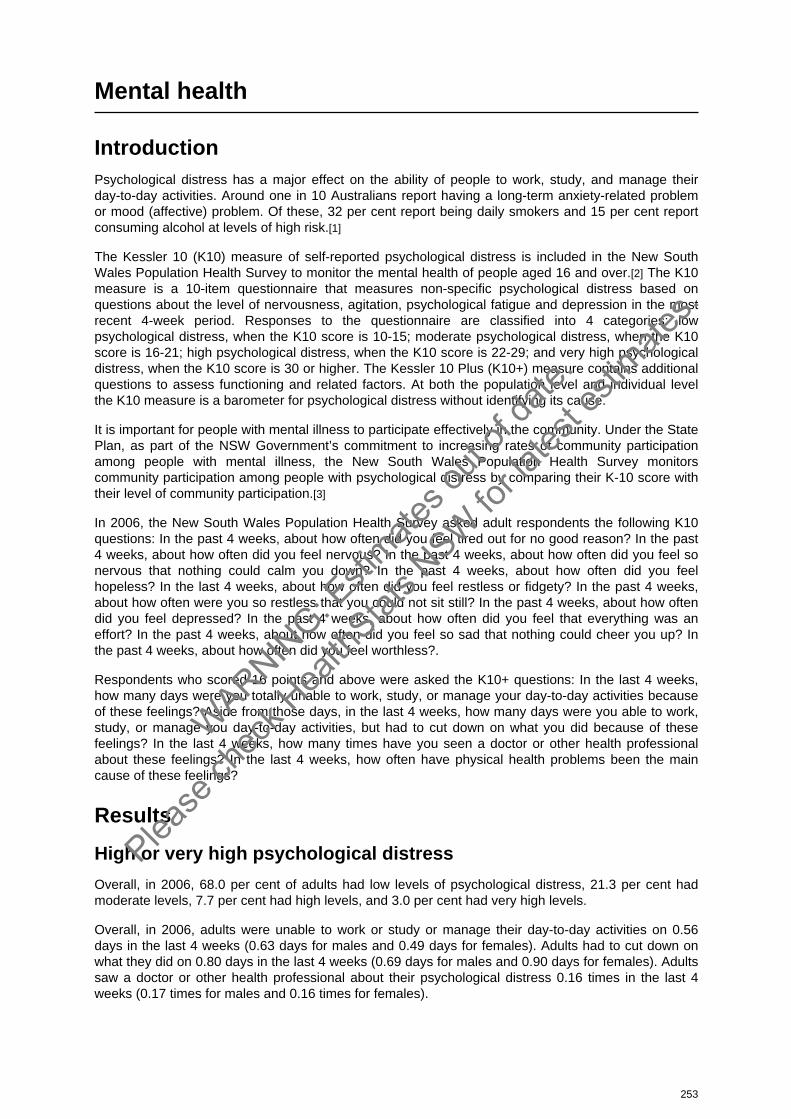
Mental health
IntroductionPsychological distress has a major effect on the ability of people to work, study, and manage theirday-to-day activities. Around one in 10 Australians report having a long-term anxiety-related problemor mood (affective) problem. Of these, 32 per cent report being daily smokers and 15 per cent reportconsuming alcohol at levels of high risk.[1]
The Kessler 10 (K10) measure of self-reported psychological distress is included in the New SouthWales Population Health Survey to monitor the mental health of people aged 16 and over.[2] The K10measure is a 10-item questionnaire that measures non-specific psychological distress based onquestions about the level of nervousness, agitation, psychological fatigue and depression in the mostrecent 4-week period. Responses to the questionnaire are classified into 4 categories: lowpsychological distress, when the K10 score is 10-15; moderate psychological distress, when the K10score is 16-21; high psychological distress, when the K10 score is 22-29; and very high psychologicaldistress, when the K10 score is 30 or higher. The Kessler 10 Plus (K10+) measure contains additionalquestions to assess functioning and related factors. At both the population level and individual levelthe K10 measure is a barometer for psychological distress without identifying its cause.
It is important for people with mental illness to participate effectively in the community. Under the StatePlan, as part of the NSW Government’s commitment to increasing rates of community participationamong people with mental illness, the New South Wales Population Health Survey monitorscommunity participation among people with psychological distress by comparing their K-10 score withtheir level of community participation.[3]
In 2006, the New South Wales Population Health Survey asked adult respondents the following K10questions: In the past 4 weeks, about how often did you feel tired out for no good reason? In the past4 weeks, about how often did you feel nervous? In the past 4 weeks, about how often did you feel sonervous that nothing could calm you down? In the past 4 weeks, about how often did you feelhopeless? In the last 4 weeks, about how often did you feel restless or fidgety? In the past 4 weeks,about how often were you so restless that you could not sit still? In the past 4 weeks, about how oftendid you feel depressed? In the past 4 weeks, about how often did you feel that everything was aneffort? In the past 4 weeks, about how often did you feel so sad that nothing could cheer you up? Inthe past 4 weeks, about how often did you feel worthless?.
Respondents who scored 16 points and above were asked the K10+ questions: In the last 4 weeks,how many days were you totally unable to work, study, or manage your day-to-day activities becauseof these feelings? Aside from those days, in the last 4 weeks, how many days were you able to work,study, or manage you day-to-day activities, but had to cut down on what you did because of thesefeelings? In the last 4 weeks, how many times have you seen a doctor or other health professionalabout these feelings? In the last 4 weeks, how often have physical health problems been the maincause of these feelings?
Results
High or very high psychological distress
Overall, in 2006, 68.0 per cent of adults had low levels of psychological distress, 21.3 per cent hadmoderate levels, 7.7 per cent had high levels, and 3.0 per cent had very high levels.
Overall, in 2006, adults were unable to work or study or manage their day-to-day activities on 0.56days in the last 4 weeks (0.63 days for males and 0.49 days for females). Adults had to cut down onwhat they did on 0.80 days in the last 4 weeks (0.69 days for males and 0.90 days for females). Adultssaw a doctor or other health professional about their psychological distress 0.16 times in the last 4weeks (0.17 times for males and 0.16 times for females).
253
WARNIN
G: Esti
mates o
ut of
date.
Please
chec
k Hea
lthStat
s NSW
for la
test e
stimate
s.
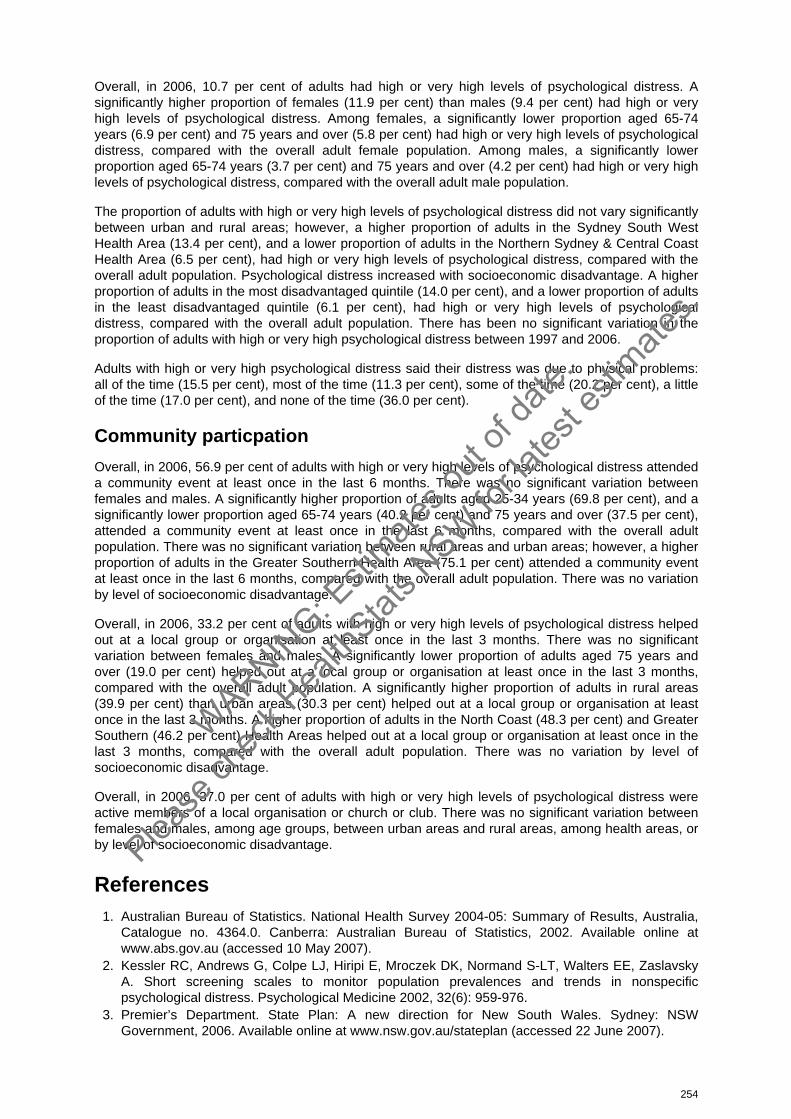
Overall, in 2006, 10.7 per cent of adults had high or very high levels of psychological distress. Asignificantly higher proportion of females (11.9 per cent) than males (9.4 per cent) had high or veryhigh levels of psychological distress. Among females, a significantly lower proportion aged 65-74years (6.9 per cent) and 75 years and over (5.8 per cent) had high or very high levels of psychologicaldistress, compared with the overall adult female population. Among males, a significantly lowerproportion aged 65-74 years (3.7 per cent) and 75 years and over (4.2 per cent) had high or very highlevels of psychological distress, compared with the overall adult male population.
The proportion of adults with high or very high levels of psychological distress did not vary significantlybetween urban and rural areas; however, a higher proportion of adults in the Sydney South WestHealth Area (13.4 per cent), and a lower proportion of adults in the Northern Sydney & Central CoastHealth Area (6.5 per cent), had high or very high levels of psychological distress, compared with theoverall adult population. Psychological distress increased with socioeconomic disadvantage. A higherproportion of adults in the most disadvantaged quintile (14.0 per cent), and a lower proportion of adultsin the least disadvantaged quintile (6.1 per cent), had high or very high levels of psychologicaldistress, compared with the overall adult population. There has been no significant variation in theproportion of adults with high or very high psychological distress between 1997 and 2006.
Adults with high or very high psychological distress said their distress was due to physical problems:all of the time (15.5 per cent), most of the time (11.3 per cent), some of the time (20.2 per cent), a littleof the time (17.0 per cent), and none of the time (36.0 per cent).
Community particpation
Overall, in 2006, 56.9 per cent of adults with high or very high levels of psychological distress attendeda community event at least once in the last 6 months. There was no significant variation betweenfemales and males. A significantly higher proportion of adults aged 25-34 years (69.8 per cent), and asignificantly lower proportion aged 65-74 years (40.2 per cent) and 75 years and over (37.5 per cent),attended a community event at least once in the last 6 months, compared with the overall adultpopulation. There was no significant variation between rural areas and urban areas; however, a higherproportion of adults in the Greater Southern Health Area (75.1 per cent) attended a community eventat least once in the last 6 months, compared with the overall adult population. There was no variationby level of socioeconomic disadvantage.
Overall, in 2006, 33.2 per cent of adults with high or very high levels of psychological distress helpedout at a local group or organisation at least once in the last 3 months. There was no significantvariation between females and males. A significantly lower proportion of adults aged 75 years andover (19.0 per cent) helped out at a local group or organisation at least once in the last 3 months,compared with the overall adult population. A significantly higher proportion of adults in rural areas(39.9 per cent) than urban areas (30.3 per cent) helped out at a local group or organisation at leastonce in the last 3 months. A higher proportion of adults in the North Coast (48.3 per cent) and GreaterSouthern (46.2 per cent) Health Areas helped out at a local group or organisation at least once in thelast 3 months, compared with the overall adult population. There was no variation by level ofsocioeconomic disadvantage.
Overall, in 2006, 37.0 per cent of adults with high or very high levels of psychological distress wereactive members of a local organisation or church or club. There was no significant variation betweenfemales and males, among age groups, between urban areas and rural areas, among health areas, orby level of socioeconomic disadvantage.
References1. Australian Bureau of Statistics. National Health Survey 2004-05: Summary of Results, Australia,
Catalogue no. 4364.0. Canberra: Australian Bureau of Statistics, 2002. Available online atwww.abs.gov.au (accessed 10 May 2007).
2. Kessler RC, Andrews G, Colpe LJ, Hiripi E, Mroczek DK, Normand S-LT, Walters EE, ZaslavskyA. Short screening scales to monitor population prevalences and trends in nonspecificpsychological distress. Psychological Medicine 2002, 32(6): 959-976.
3. Premier’s Department. State Plan: A new direction for New South Wales. Sydney: NSWGovernment, 2006. Available online at www.nsw.gov.au/stateplan (accessed 22 June 2007).
254
WARNIN
G: Esti
mates o
ut of
date.
Please
chec
k Hea
lthStat
s NSW
for la
test e
stimate
s.
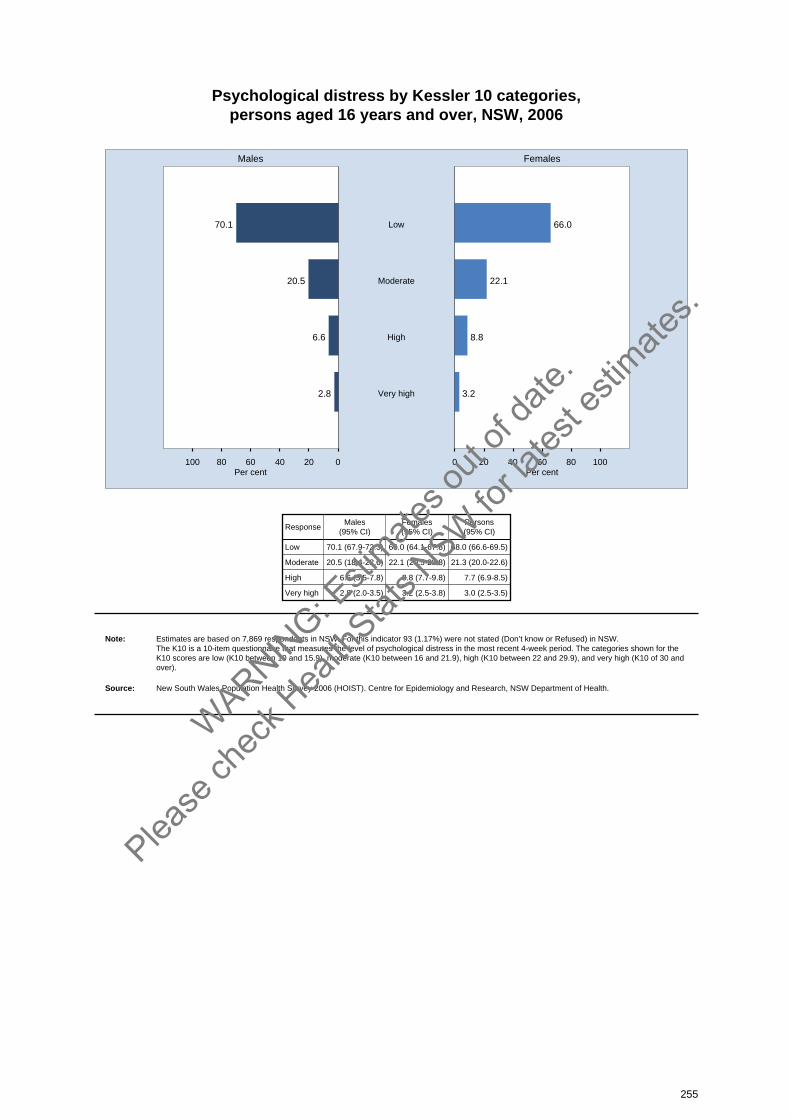
Psychological distress by Kessler 10 categories, persons aged 16 years and over, NSW, 2006
020406080100 0 20 40 60 80 100
Males Females
Per cent Per cent
70.1 66.0Low
20.5 22.1Moderate
6.6 8.8High
2.8 3.2Very high
ResponseMales
(95% CI)Females(95% CI)
Persons(95% CI)
Low 70.1 (67.9-72.3) 66.0 (64.1-67.8) 68.0 (66.6-69.5)
Moderate 20.5 (18.4-22.6) 22.1 (20.5-23.8) 21.3 (20.0-22.6)
High 6.6 (5.5-7.8) 8.8 (7.7-9.8) 7.7 (6.9-8.5)
Very high 2.8 (2.0-3.5) 3.2 (2.5-3.8) 3.0 (2.5-3.5)
Note: Estimates are based on 7,869 respondents in NSW. For this indicator 93 (1.17%) were not stated (Don’t know or Refused) in NSW. The K10 is a 10-item questionnaire that measures the level of psychological distress in the most recent 4-week period. The categories shown for theK10 scores are low (K10 between 10 and 15.9), moderate (K10 between 16 and 21.9), high (K10 between 22 and 29.9), and very high (K10 of 30 and over).
Source: New South Wales Population Health Survey 2006 (HOIST). Centre for Epidemiology and Research, NSW Department of Health.
255
WARNIN
G: Esti
mates o
ut of
date.
Please
chec
k Hea
lthStat
s NSW
for la
test e
stimate
s.
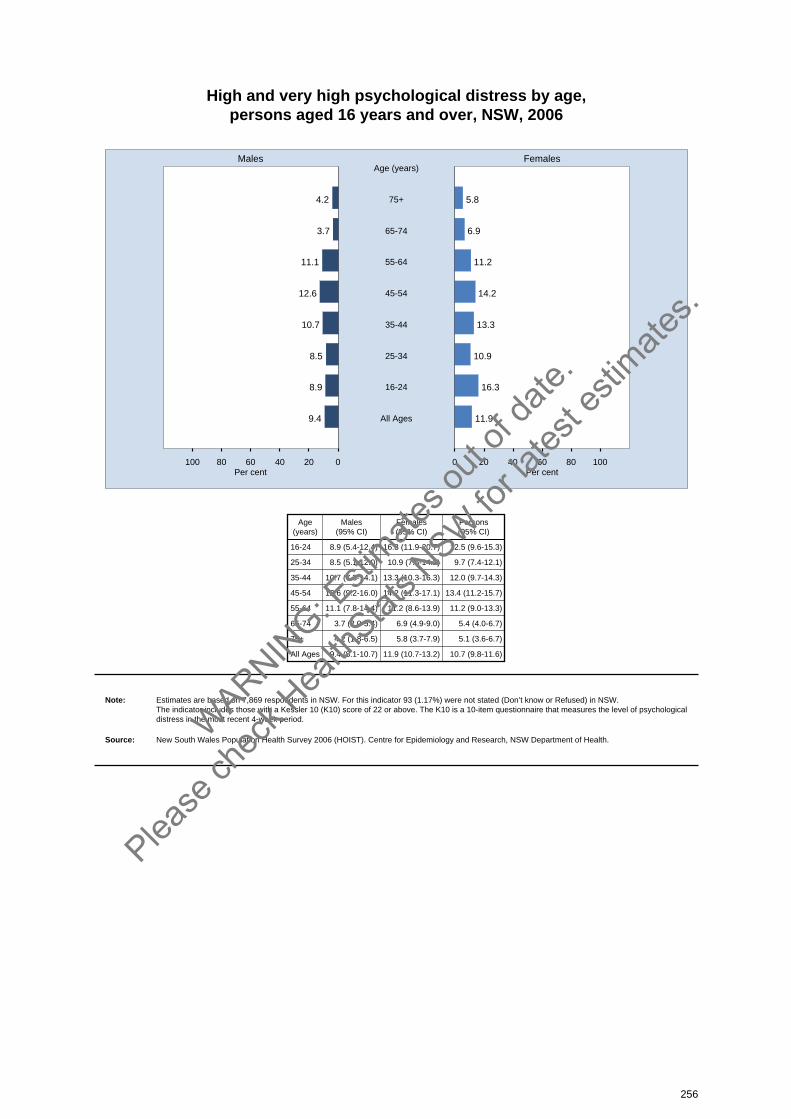
High and very high psychological distress by age, persons aged 16 years and over, NSW, 2006
020406080100 0 20 40 60 80 100
Males Females
Per cent Per cent
4.2 5.875+
Age (years)
3.7 6.965-74
11.1 11.255-64
12.6 14.245-54
10.7 13.335-44
8.5 10.925-34
8.9 16.316-24
9.4 11.9All Ages
Age(years)
Males(95% CI)
Females(95% CI)
Persons(95% CI)
16-24 8.9 (5.4-12.4) 16.3 (11.9-20.7) 12.5 (9.6-15.3)
25-34 8.5 (5.1-12.0) 10.9 (7.6-14.2) 9.7 (7.4-12.1)
35-44 10.7 (7.3-14.1) 13.3 (10.3-16.3) 12.0 (9.7-14.3)
45-54 12.6 (9.2-16.0) 14.2 (11.3-17.1) 13.4 (11.2-15.7)
55-64 11.1 (7.8-14.4) 11.2 (8.6-13.9) 11.2 (9.0-13.3)
65-74 3.7 (2.0-5.4) 6.9 (4.9-9.0) 5.4 (4.0-6.7)
75+ 4.2 (1.8-6.5) 5.8 (3.7-7.9) 5.1 (3.6-6.7)
All Ages 9.4 (8.1-10.7) 11.9 (10.7-13.2) 10.7 (9.8-11.6)
Note: Estimates are based on 7,869 respondents in NSW. For this indicator 93 (1.17%) were not stated (Don’t know or Refused) in NSW. The indicator includes those with a Kessler 10 (K10) score of 22 or above. The K10 is a 10-item questionnaire that measures the level of psychologicaldistress in the most recent 4-week period.
Source: New South Wales Population Health Survey 2006 (HOIST). Centre for Epidemiology and Research, NSW Department of Health.
256
WARNIN
G: Esti
mates o
ut of
date.
Please
chec
k Hea
lthStat
s NSW
for la
test e
stimate
s.

High and very high psychological distress by socioeconomic disadvantage, persons aged 16 years and over, NSW, 2006
020406080100 0 20 40 60 80 100
Males Females
Per cent Per cent
10.8 16.95th Quintile
most disadvantaged
12.7 9.44th Quintile
7.8 14.43rd Quintile
10.8 10.72nd Quintile
4.2 8.11st Quintile
least disadvantaged
9.4 11.9NSW
Quintile ofsocioeconomicdisadvantage
Males(95% CI)
Females(95% CI)
Persons(95% CI)
5th Quintile 10.8 (7.5-14.2) 16.9 (13.4-20.4) 14.0 (11.5-16.4)
4th Quintile 12.7 (9.3-16.1) 9.4 (7.2-11.6) 11.0 (8.9-13.0)
3rd Quintile 7.8 (5.4-10.1) 14.4 (11.4-17.4) 11.0 (9.1-13.0)
2nd Quintile 10.8 (7.4-14.1) 10.7 (8.3-13.2) 10.7 (8.7-12.8)
1st Quintile 4.2 (2.3-6.0) 8.1 (5.6-10.6) 6.1 (4.5-7.6)
NSW 9.4 (8.1-10.7) 11.9 (10.7-13.2) 10.7 (9.8-11.6)
Note: Estimates are based on 7,869 respondents in NSW. For this indicator 93 (1.17%) were not stated (Don’t know or Refused) in NSW. The indicator includes those with a Kessler 10 (K10) score of 22 or above. The K10 is a 10-item questionnaire that measures the level of psychologicaldistress in the most recent 4-week period.
Source: New South Wales Population Health Survey 2006 (HOIST). Centre for Epidemiology and Research, NSW Department of Health.
257
WARNIN
G: Esti
mates o
ut of
date.
Please
chec
k Hea
lthStat
s NSW
for la
test e
stimate
s.
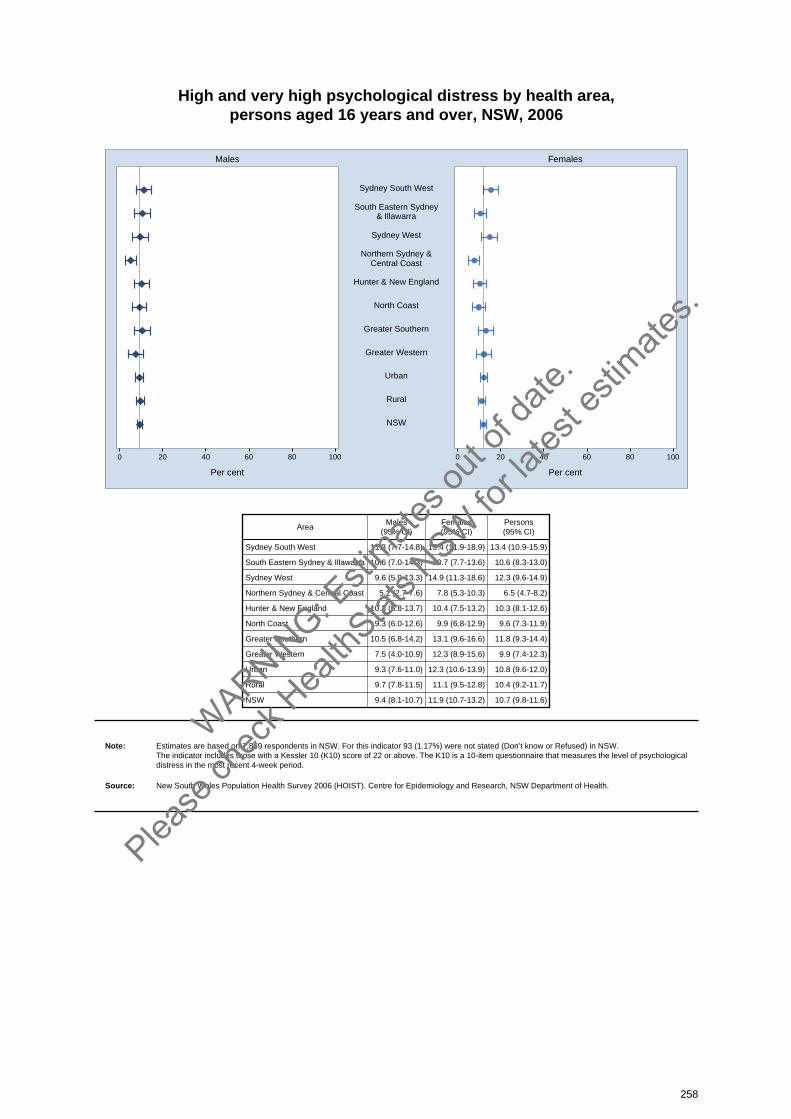
High and very high psychological distress by health area, persons aged 16 years and over, NSW, 2006
0 20 40 60 80 100 0 20 40 60 80 100
Males Females
Per cent Per cent
Sydney South West
South Eastern Sydney& Illawarra
Sydney West
Northern Sydney &Central Coast
Hunter & New England
North Coast
Greater Southern
Greater Western
Urban
Rural
NSW
AreaMales
(95% CI)Females(95% CI)
Persons(95% CI)
Sydney South West 11.3 (7.7-14.8) 15.4 (11.9-18.9) 13.4 (10.9-15.9)
South Eastern Sydney & Illawarra 10.6 (7.0-14.3) 10.7 (7.7-13.6) 10.6 (8.3-13.0)
Sydney West 9.6 (5.9-13.3) 14.9 (11.3-18.6) 12.3 (9.6-14.9)
Northern Sydney & Central Coast 5.2 (2.7-7.6) 7.8 (5.3-10.3) 6.5 (4.7-8.2)
Hunter & New England 10.3 (6.8-13.7) 10.4 (7.5-13.2) 10.3 (8.1-12.6)
North Coast 9.3 (6.0-12.6) 9.9 (6.8-12.9) 9.6 (7.3-11.9)
Greater Southern 10.5 (6.8-14.2) 13.1 (9.6-16.6) 11.8 (9.3-14.4)
Greater Western 7.5 (4.0-10.9) 12.3 (8.9-15.6) 9.9 (7.4-12.3)
Urban 9.3 (7.6-11.0) 12.3 (10.6-13.9) 10.8 (9.6-12.0)
Rural 9.7 (7.8-11.5) 11.1 (9.5-12.8) 10.4 (9.2-11.7)
NSW 9.4 (8.1-10.7) 11.9 (10.7-13.2) 10.7 (9.8-11.6)
Note: Estimates are based on 7,869 respondents in NSW. For this indicator 93 (1.17%) were not stated (Don’t know or Refused) in NSW. The indicator includes those with a Kessler 10 (K10) score of 22 or above. The K10 is a 10-item questionnaire that measures the level of psychologicaldistress in the most recent 4-week period.
Source: New South Wales Population Health Survey 2006 (HOIST). Centre for Epidemiology and Research, NSW Department of Health.
258
WARNIN
G: Esti
mates o
ut of
date.
Please
chec
k Hea
lthStat
s NSW
for la
test e
stimate
s.

Times that physical problems have been the cause of psychological distressin last 4 weeks,
persons with high or very high psychological distress aged 16 years andover, NSW, 2006
020406080100 0 20 40 60 80 100
Males Females
Per cent Per cent
19.0 12.7All of the
time
14.1 9.0Most of the
time
16.3 23.4Some of the
time
14.7 18.8A little of
the time
35.9 36.1None of the
time
ResponseMales
(95% CI)Females(95% CI)
Persons(95% CI)
All of the time 19.0 (13.5-24.4) 12.7 (8.5-16.8) 15.5 (12.2-18.9)
Most of the time 14.1 (8.3-19.9) 9.0 (5.9-12.1) 11.3 (8.2-14.4)
Some of the time 16.3 (10.7-21.8) 23.4 (18.4-28.3) 20.2 (16.5-23.9)
A little of the time 14.7 (8.9-20.6) 18.8 (13.9-23.8) 17.0 (13.2-20.8)
None of the time 35.9 (28.3-43.5) 36.1 (30.3-41.9) 36.0 (31.3-40.7)
Note: Estimates are based on 685 respondents in NSW. For this indicator 11 (1.58%) were not stated (Don’t know or Refused) in NSW. The question used was: In the last 4 weeks, how often have physical health problems been the main cause of these feelings? The Kessler10 tool wasalso used to define persons with a score of 22 or above. The k10 is a 10-item questionnaire that measures the level of psychological distress in the mostrecent 4-week period.
Effect of psychological stress on daily activities, persons aged 16 years andover, NSW, 2006
ResponseMales
(95% CI)Females(95% CI)
Persons(95% CI)
Days unable to manage daily activities 0.63 (0.49-0.78) 0.49 (0.40-0.58) 0.56 (0.48-0.65)
Days cut down on daily activities 0.69 (0.57-0.80) 0.90 (0.78-1.02) 0.80 (0.71-0.88)
Times saw a health professional 0.17 (0.11-0.22) 0.16 (0.13-0.18) 0.16 (0.13-0.19)
Note: The questions were only asked of people who scored 16 and above in the Kessler10 tool, people who scored less than 16 were allocated a value of zero.The k10 is a 10-item questionnaire that measures the level of psychological distress in the most recent 4-week period. The questions used were: In thelast 4 weeks, how many days were you totally unable to work, study or manage your day-to-day activities because of these feelings?, Aside from anydays that you were totally unable to work, study or manage your day-to-day activities, in the last 4 weeks, how many days were you able to work, studyor manage your day-to-day activities, but had to cut down on what you did because of these feelings?, In the last 4 weeks, how many times have youseen a doctor or other health professional about these feelings?
259
WARNIN
G: Esti
mates o
ut of
date.
Please
chec
k Hea
lthStat
s NSW
for la
test e
stimate
s.
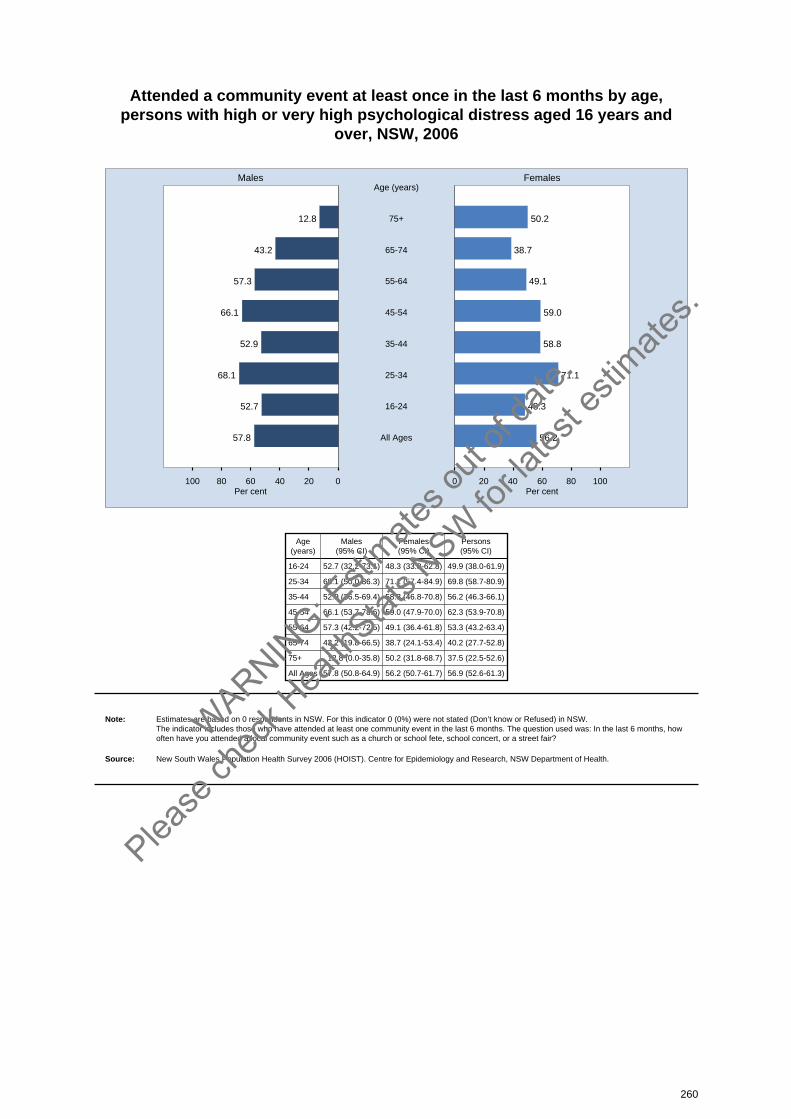
Attended a community event at least once in the last 6 months by age, persons with high or very high psychological distress aged 16 years and
over, NSW, 2006
020406080100 0 20 40 60 80 100
Males Females
Per cent Per cent
12.8 50.275+
Age (years)
43.2 38.765-74
57.3 49.155-64
66.1 59.045-54
52.9 58.835-44
68.1 71.125-34
52.7 48.316-24
57.8 56.2All Ages
Age(years)
Males(95% CI)
Females(95% CI)
Persons(95% CI)
16-24 52.7 (32.2-73.1) 48.3 (33.8-62.8) 49.9 (38.0-61.9)
25-34 68.1 (50.0-86.3) 71.1 (57.4-84.9) 69.8 (58.7-80.9)
35-44 52.9 (36.5-69.4) 58.8 (46.8-70.8) 56.2 (46.3-66.1)
45-54 66.1 (53.7-78.6) 59.0 (47.9-70.0) 62.3 (53.9-70.8)
55-64 57.3 (42.2-72.5) 49.1 (36.4-61.8) 53.3 (43.2-63.4)
65-74 43.2 (19.8-66.5) 38.7 (24.1-53.4) 40.2 (27.7-52.8)
75+ 12.8 (0.0-35.8) 50.2 (31.8-68.7) 37.5 (22.5-52.6)
All Ages 57.8 (50.8-64.9) 56.2 (50.7-61.7) 56.9 (52.6-61.3)
Note: Estimates are based on 0 respondents in NSW. For this indicator 0 (0%) were not stated (Don’t know or Refused) in NSW. The indicator includes those who have attended at least one community event in the last 6 months. The question used was: In the last 6 months, howoften have you attended a local community event such as a church or school fete, school concert, or a street fair?
Source: New South Wales Population Health Survey 2006 (HOIST). Centre for Epidemiology and Research, NSW Department of Health.
260
WARNIN
G: Esti
mates o
ut of
date.
Please
chec
k Hea
lthStat
s NSW
for la
test e
stimate
s.
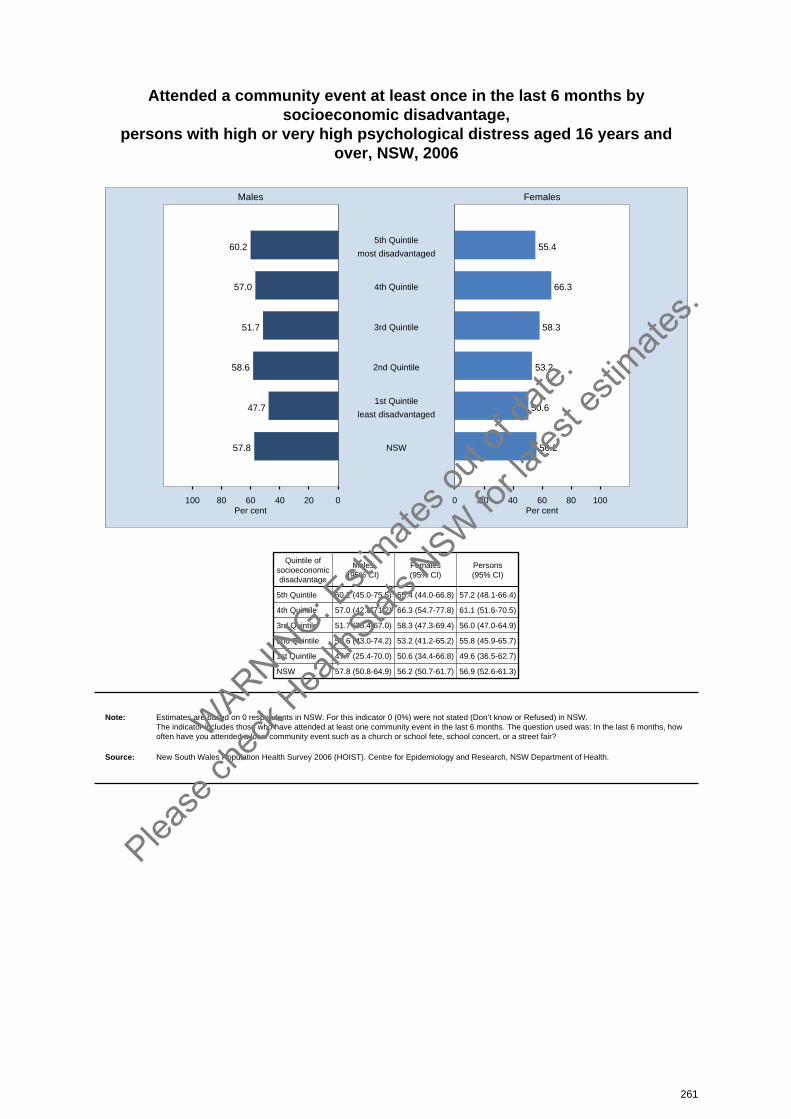
Attended a community event at least once in the last 6 months bysocioeconomic disadvantage,
persons with high or very high psychological distress aged 16 years andover, NSW, 2006
020406080100 0 20 40 60 80 100
Males Females
Per cent Per cent
60.2 55.45th Quintile
most disadvantaged
57.0 66.34th Quintile
51.7 58.33rd Quintile
58.6 53.22nd Quintile
47.7 50.61st Quintile
least disadvantaged
57.8 56.2NSW
Quintile ofsocioeconomicdisadvantage
Males(95% CI)
Females(95% CI)
Persons(95% CI)
5th Quintile 60.2 (45.0-75.5) 55.4 (44.0-66.8) 57.2 (48.1-66.4)
4th Quintile 57.0 (42.8-71.2) 66.3 (54.7-77.8) 61.1 (51.6-70.5)
3rd Quintile 51.7 (36.4-67.0) 58.3 (47.3-69.4) 56.0 (47.0-64.9)
2nd Quintile 58.6 (43.0-74.2) 53.2 (41.2-65.2) 55.8 (45.9-65.7)
1st Quintile 47.7 (25.4-70.0) 50.6 (34.4-66.8) 49.6 (36.5-62.7)
NSW 57.8 (50.8-64.9) 56.2 (50.7-61.7) 56.9 (52.6-61.3)
Note: Estimates are based on 0 respondents in NSW. For this indicator 0 (0%) were not stated (Don’t know or Refused) in NSW. The indicator includes those who have attended at least one community event in the last 6 months. The question used was: In the last 6 months, howoften have you attended a local community event such as a church or school fete, school concert, or a street fair?
Source: New South Wales Population Health Survey 2006 (HOIST). Centre for Epidemiology and Research, NSW Department of Health.
261
WARNIN
G: Esti
mates o
ut of
date.
Please
chec
k Hea
lthStat
s NSW
for la
test e
stimate
s.
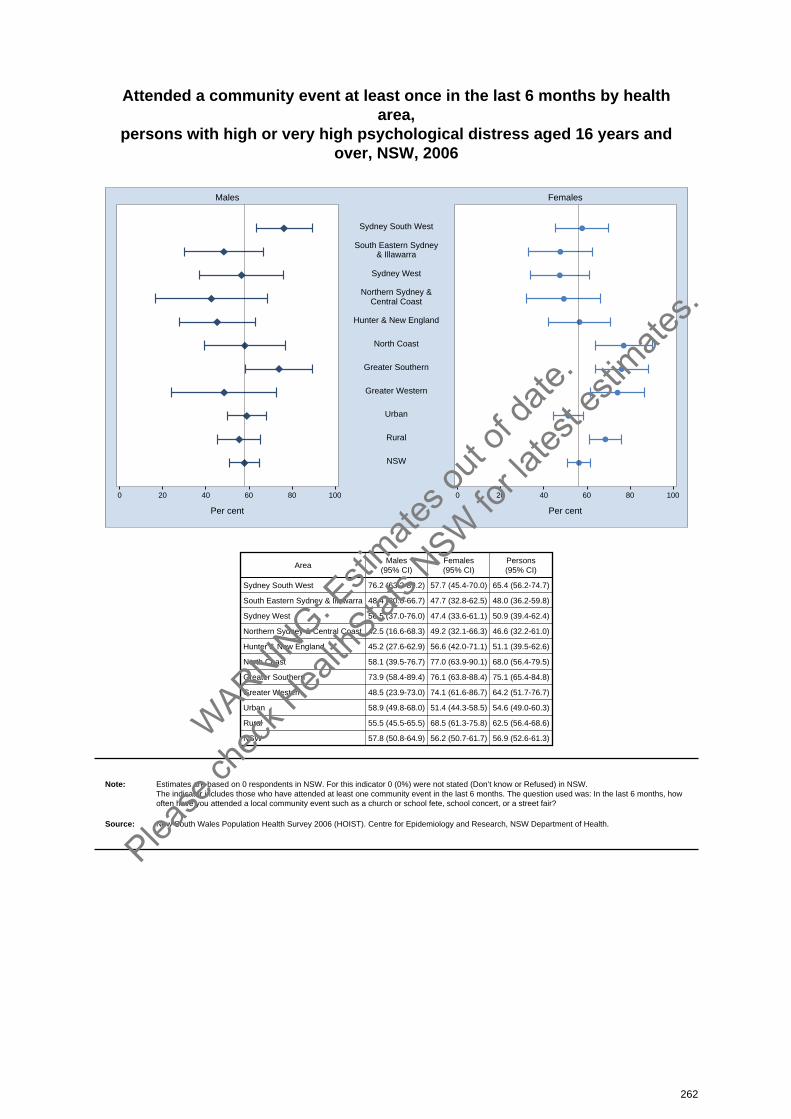
Attended a community event at least once in the last 6 months by healtharea,
persons with high or very high psychological distress aged 16 years andover, NSW, 2006
0 20 40 60 80 100 0 20 40 60 80 100
Males Females
Per cent Per cent
Sydney South West
South Eastern Sydney& Illawarra
Sydney West
Northern Sydney &Central Coast
Hunter & New England
North Coast
Greater Southern
Greater Western
Urban
Rural
NSW
AreaMales
(95% CI)Females(95% CI)
Persons(95% CI)
Sydney South West 76.2 (63.2-89.2) 57.7 (45.4-70.0) 65.4 (56.2-74.7)
South Eastern Sydney & Illawarra 48.4 (30.0-66.7) 47.7 (32.8-62.5) 48.0 (36.2-59.8)
Sydney West 56.5 (37.0-76.0) 47.4 (33.6-61.1) 50.9 (39.4-62.4)
Northern Sydney & Central Coast 42.5 (16.6-68.3) 49.2 (32.1-66.3) 46.6 (32.2-61.0)
Hunter & New England 45.2 (27.6-62.9) 56.6 (42.0-71.1) 51.1 (39.5-62.6)
North Coast 58.1 (39.5-76.7) 77.0 (63.9-90.1) 68.0 (56.4-79.5)
Greater Southern 73.9 (58.4-89.4) 76.1 (63.8-88.4) 75.1 (65.4-84.8)
Greater Western 48.5 (23.9-73.0) 74.1 (61.6-86.7) 64.2 (51.7-76.7)
Urban 58.9 (49.8-68.0) 51.4 (44.3-58.5) 54.6 (49.0-60.3)
Rural 55.5 (45.5-65.5) 68.5 (61.3-75.8) 62.5 (56.4-68.6)
NSW 57.8 (50.8-64.9) 56.2 (50.7-61.7) 56.9 (52.6-61.3)
Note: Estimates are based on 0 respondents in NSW. For this indicator 0 (0%) were not stated (Don’t know or Refused) in NSW. The indicator includes those who have attended at least one community event in the last 6 months. The question used was: In the last 6 months, howoften have you attended a local community event such as a church or school fete, school concert, or a street fair?
Source: New South Wales Population Health Survey 2006 (HOIST). Centre for Epidemiology and Research, NSW Department of Health.
262
WARNIN
G: Esti
mates o
ut of
date.
Please
chec
k Hea
lthStat
s NSW
for la
test e
stimate
s.

Helped out any local group or organisation at least once in the last 3 monthsby age,
persons with high or very high psychological distress aged 16 years andover, NSW, 2006
020406080100 0 20 40 60 80 100
Males Females
Per cent Per cent
9.0 24.175+
Age (years)
28.3 28.365-74
40.4 25.955-64
33.3 36.845-54
24.2 36.335-44
38.6 44.125-34
24.1 32.716-24
31.2 34.7All Ages
Age(years)
Males(95% CI)
Females(95% CI)
Persons(95% CI)
16-24 24.1 (8.7-39.4) 32.7 (18.5-46.9) 29.5 (18.7-40.3)
25-34 38.6 (18.9-58.3) 44.1 (28.2-60.0) 41.7 (29.2-54.1)
35-44 24.2 (10.2-38.3) 36.3 (24.6-48.0) 30.9 (21.8-40.0)
45-54 33.3 (19.7-46.9) 36.8 (25.9-47.7) 35.1 (26.5-43.8)
55-64 40.4 (23.8-57.0) 25.9 (15.7-36.1) 33.3 (22.9-43.6)
65-74 28.3 (5.3-51.4) 28.3 (14.8-41.8) 28.3 (16.4-40.2)
75+ 9.0 (0.0-21.6) 24.1 (8.3-40.0) 19.0 (7.3-30.7)
All Ages 31.2 (24.3-38.0) 34.7 (29.4-40.1) 33.2 (28.9-37.4)
Note: Estimates are based on 0 respondents in NSW. For this indicator 0 (0%) were not stated (Don’t know or Refused) in NSW. The indicator includes those who have helped out any local group or organisation at least once in the last 3 months. The question used was: In the last3 months, have you helped out any local group or organisation such as a school, scouts and brownies, a sporting club, or hospital, as a volunteer, orother organisation?
Source: New South Wales Population Health Survey 2006 (HOIST). Centre for Epidemiology and Research, NSW Department of Health.
263
WARNIN
G: Esti
mates o
ut of
date.
Please
chec
k Hea
lthStat
s NSW
for la
test e
stimate
s.
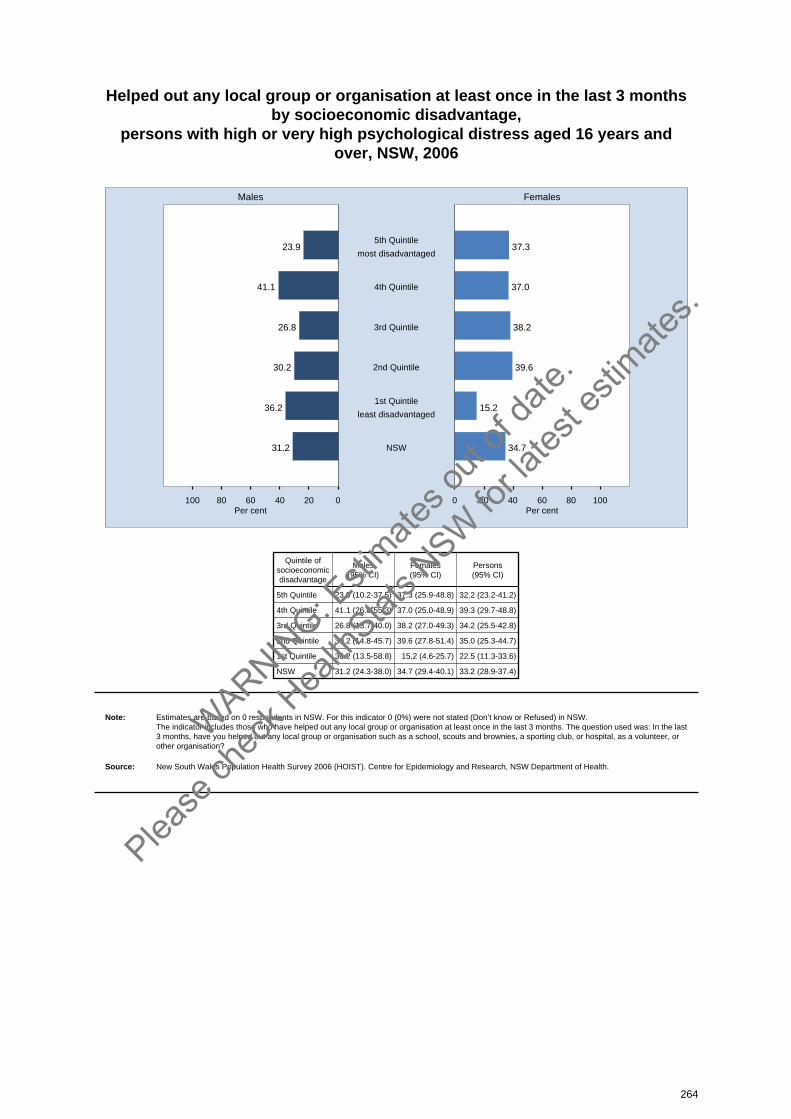
Helped out any local group or organisation at least once in the last 3 monthsby socioeconomic disadvantage,
persons with high or very high psychological distress aged 16 years andover, NSW, 2006
020406080100 0 20 40 60 80 100
Males Females
Per cent Per cent
23.9 37.35th Quintile
most disadvantaged
41.1 37.04th Quintile
26.8 38.23rd Quintile
30.2 39.62nd Quintile
36.2 15.21st Quintile
least disadvantaged
31.2 34.7NSW
Quintile ofsocioeconomicdisadvantage
Males(95% CI)
Females(95% CI)
Persons(95% CI)
5th Quintile 23.9 (10.2-37.5) 37.3 (25.9-48.8) 32.2 (23.2-41.2)
4th Quintile 41.1 (26.8-55.3) 37.0 (25.0-48.9) 39.3 (29.7-48.8)
3rd Quintile 26.8 (13.7-40.0) 38.2 (27.0-49.3) 34.2 (25.5-42.8)
2nd Quintile 30.2 (14.8-45.7) 39.6 (27.8-51.4) 35.0 (25.3-44.7)
1st Quintile 36.2 (13.5-58.8) 15.2 (4.6-25.7) 22.5 (11.3-33.6)
NSW 31.2 (24.3-38.0) 34.7 (29.4-40.1) 33.2 (28.9-37.4)
Note: Estimates are based on 0 respondents in NSW. For this indicator 0 (0%) were not stated (Don’t know or Refused) in NSW. The indicator includes those who have helped out any local group or organisation at least once in the last 3 months. The question used was: In the last3 months, have you helped out any local group or organisation such as a school, scouts and brownies, a sporting club, or hospital, as a volunteer, orother organisation?
Source: New South Wales Population Health Survey 2006 (HOIST). Centre for Epidemiology and Research, NSW Department of Health.
264
WARNIN
G: Esti
mates o
ut of
date.
Please
chec
k Hea
lthStat
s NSW
for la
test e
stimate
s.
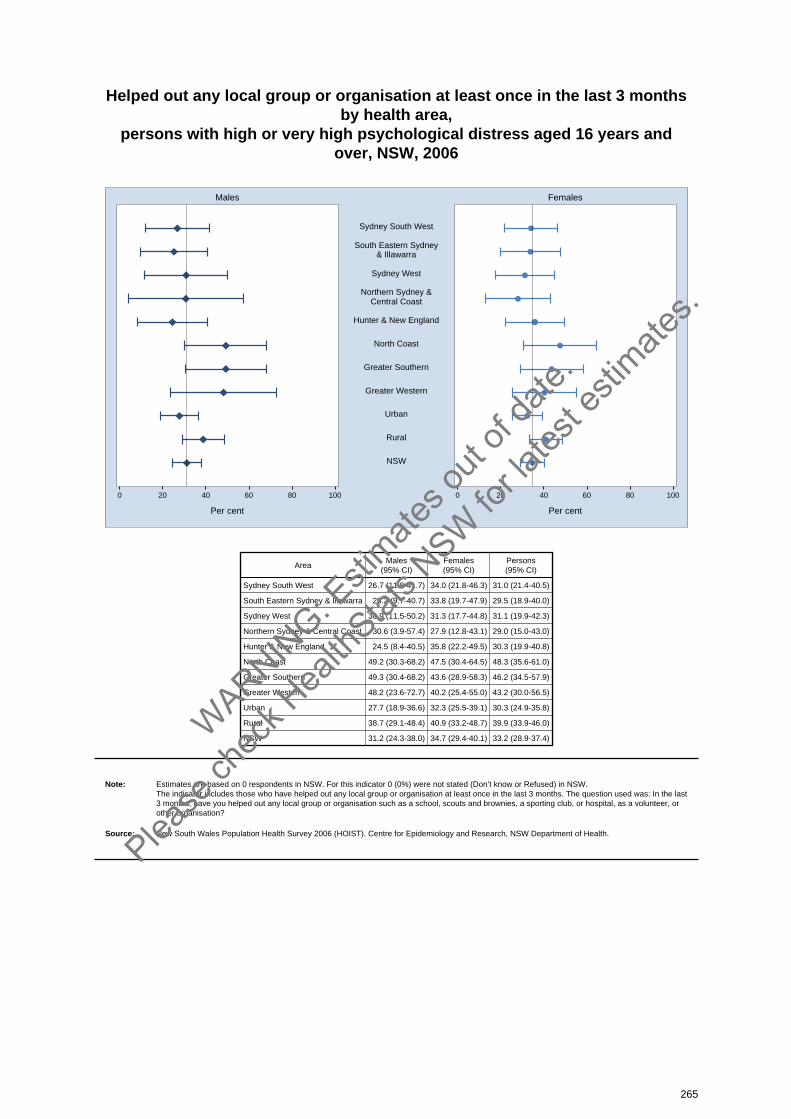
Helped out any local group or organisation at least once in the last 3 monthsby health area,
persons with high or very high psychological distress aged 16 years andover, NSW, 2006
0 20 40 60 80 100 0 20 40 60 80 100
Males Females
Per cent Per cent
Sydney South West
South Eastern Sydney& Illawarra
Sydney West
Northern Sydney &Central Coast
Hunter & New England
North Coast
Greater Southern
Greater Western
Urban
Rural
NSW
AreaMales
(95% CI)Females(95% CI)
Persons(95% CI)
Sydney South West 26.7 (11.8-41.7) 34.0 (21.8-46.3) 31.0 (21.4-40.5)
South Eastern Sydney & Illawarra 25.2 (9.7-40.7) 33.8 (19.7-47.9) 29.5 (18.9-40.0)
Sydney West 30.9 (11.5-50.2) 31.3 (17.7-44.8) 31.1 (19.9-42.3)
Northern Sydney & Central Coast 30.6 (3.9-57.4) 27.9 (12.8-43.1) 29.0 (15.0-43.0)
Hunter & New England 24.5 (8.4-40.5) 35.8 (22.2-49.5) 30.3 (19.9-40.8)
North Coast 49.2 (30.3-68.2) 47.5 (30.4-64.5) 48.3 (35.6-61.0)
Greater Southern 49.3 (30.4-68.2) 43.6 (28.9-58.3) 46.2 (34.5-57.9)
Greater Western 48.2 (23.6-72.7) 40.2 (25.4-55.0) 43.2 (30.0-56.5)
Urban 27.7 (18.9-36.6) 32.3 (25.5-39.1) 30.3 (24.9-35.8)
Rural 38.7 (29.1-48.4) 40.9 (33.2-48.7) 39.9 (33.9-46.0)
NSW 31.2 (24.3-38.0) 34.7 (29.4-40.1) 33.2 (28.9-37.4)
Note: Estimates are based on 0 respondents in NSW. For this indicator 0 (0%) were not stated (Don’t know or Refused) in NSW. The indicator includes those who have helped out any local group or organisation at least once in the last 3 months. The question used was: In the last3 months, have you helped out any local group or organisation such as a school, scouts and brownies, a sporting club, or hospital, as a volunteer, orother organisation?
Source: New South Wales Population Health Survey 2006 (HOIST). Centre for Epidemiology and Research, NSW Department of Health.
265
WARNIN
G: Esti
mates o
ut of
date.
Please
chec
k Hea
lthStat
s NSW
for la
test e
stimate
s.
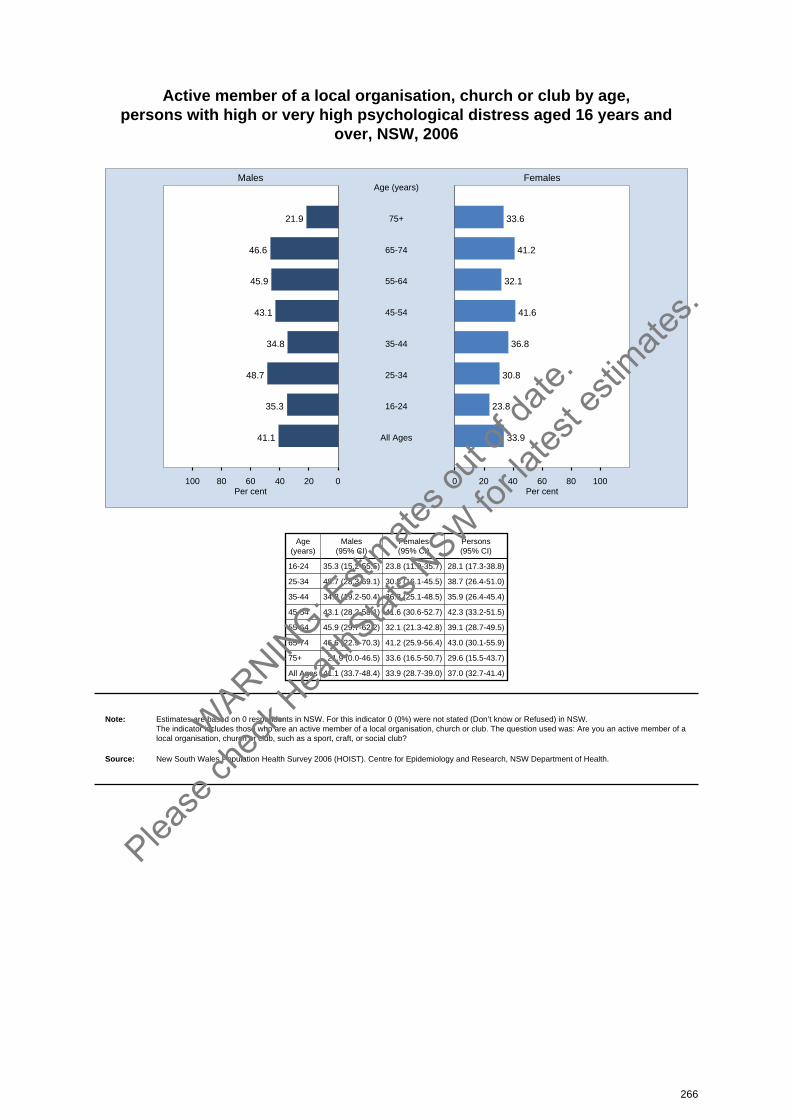
Active member of a local organisation, church or club by age, persons with high or very high psychological distress aged 16 years and
over, NSW, 2006
020406080100 0 20 40 60 80 100
Males Females
Per cent Per cent
21.9 33.675+
Age (years)
46.6 41.265-74
45.9 32.155-64
43.1 41.645-54
34.8 36.835-44
48.7 30.825-34
35.3 23.816-24
41.1 33.9All Ages
Age(years)
Males(95% CI)
Females(95% CI)
Persons(95% CI)
16-24 35.3 (15.2-55.5) 23.8 (11.9-35.7) 28.1 (17.3-38.8)
25-34 48.7 (28.3-69.1) 30.8 (16.1-45.5) 38.7 (26.4-51.0)
35-44 34.8 (19.2-50.4) 36.8 (25.1-48.5) 35.9 (26.4-45.4)
45-54 43.1 (28.2-58.1) 41.6 (30.6-52.7) 42.3 (33.2-51.5)
55-64 45.9 (29.7-62.2) 32.1 (21.3-42.8) 39.1 (28.7-49.5)
65-74 46.6 (22.9-70.3) 41.2 (25.9-56.4) 43.0 (30.1-55.9)
75+ 21.9 (0.0-46.5) 33.6 (16.5-50.7) 29.6 (15.5-43.7)
All Ages 41.1 (33.7-48.4) 33.9 (28.7-39.0) 37.0 (32.7-41.4)
Note: Estimates are based on 0 respondents in NSW. For this indicator 0 (0%) were not stated (Don’t know or Refused) in NSW. The indicator includes those who are an active member of a local organisation, church or club. The question used was: Are you an active member of alocal organisation, church or club, such as a sport, craft, or social club?
Source: New South Wales Population Health Survey 2006 (HOIST). Centre for Epidemiology and Research, NSW Department of Health.
266
WARNIN
G: Esti
mates o
ut of
date.
Please
chec
k Hea
lthStat
s NSW
for la
test e
stimate
s.
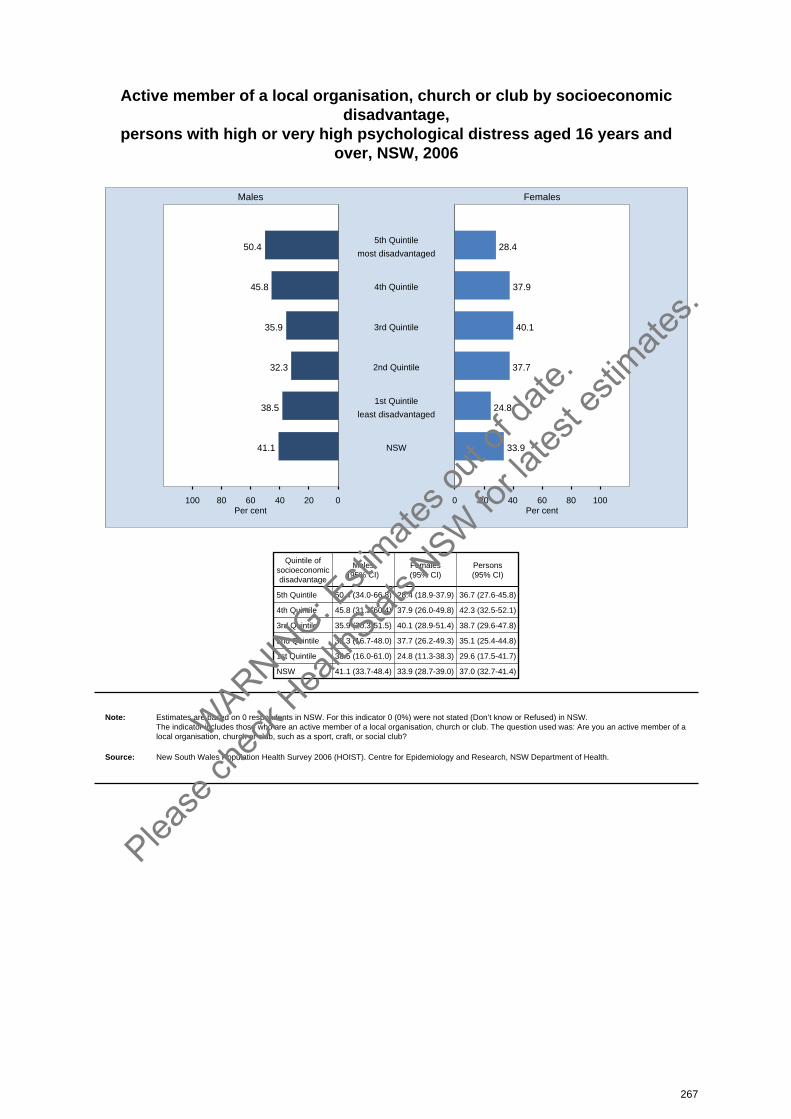
Active member of a local organisation, church or club by socioeconomicdisadvantage,
persons with high or very high psychological distress aged 16 years andover, NSW, 2006
020406080100 0 20 40 60 80 100
Males Females
Per cent Per cent
50.4 28.45th Quintile
most disadvantaged
45.8 37.94th Quintile
35.9 40.13rd Quintile
32.3 37.72nd Quintile
38.5 24.81st Quintile
least disadvantaged
41.1 33.9NSW
Quintile ofsocioeconomicdisadvantage
Males(95% CI)
Females(95% CI)
Persons(95% CI)
5th Quintile 50.4 (34.0-66.8) 28.4 (18.9-37.9) 36.7 (27.6-45.8)
4th Quintile 45.8 (31.2-60.4) 37.9 (26.0-49.8) 42.3 (32.5-52.1)
3rd Quintile 35.9 (20.3-51.5) 40.1 (28.9-51.4) 38.7 (29.6-47.8)
2nd Quintile 32.3 (16.7-48.0) 37.7 (26.2-49.3) 35.1 (25.4-44.8)
1st Quintile 38.5 (16.0-61.0) 24.8 (11.3-38.3) 29.6 (17.5-41.7)
NSW 41.1 (33.7-48.4) 33.9 (28.7-39.0) 37.0 (32.7-41.4)
Note: Estimates are based on 0 respondents in NSW. For this indicator 0 (0%) were not stated (Don’t know or Refused) in NSW. The indicator includes those who are an active member of a local organisation, church or club. The question used was: Are you an active member of alocal organisation, church or club, such as a sport, craft, or social club?
Source: New South Wales Population Health Survey 2006 (HOIST). Centre for Epidemiology and Research, NSW Department of Health.
267
WARNIN
G: Esti
mates o
ut of
date.
Please
chec
k Hea
lthStat
s NSW
for la
test e
stimate
s.
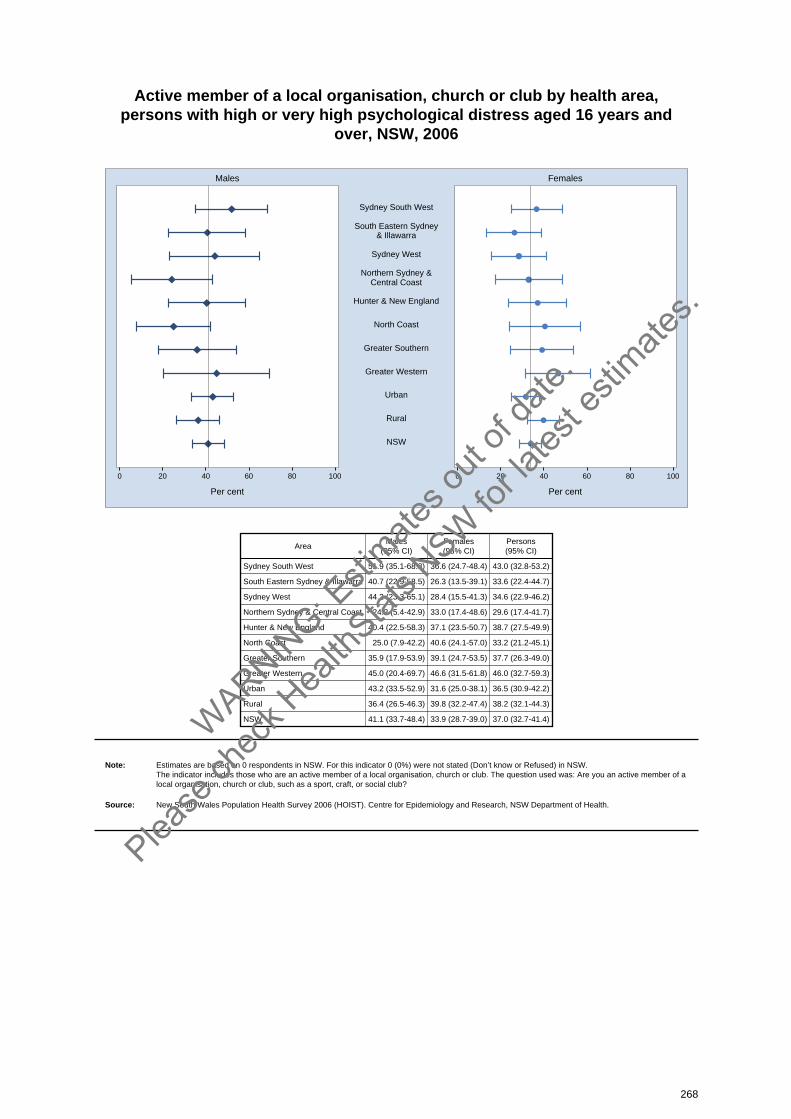
Active member of a local organisation, church or club by health area, persons with high or very high psychological distress aged 16 years and
over, NSW, 2006
0 20 40 60 80 100 0 20 40 60 80 100
Males Females
Per cent Per cent
Sydney South West
South Eastern Sydney& Illawarra
Sydney West
Northern Sydney &Central Coast
Hunter & New England
North Coast
Greater Southern
Greater Western
Urban
Rural
NSW
AreaMales
(95% CI)Females(95% CI)
Persons(95% CI)
Sydney South West 51.9 (35.1-68.8) 36.6 (24.7-48.4) 43.0 (32.8-53.2)
South Eastern Sydney & Illawarra 40.7 (22.9-58.5) 26.3 (13.5-39.1) 33.6 (22.4-44.7)
Sydney West 44.2 (23.3-65.1) 28.4 (15.5-41.3) 34.6 (22.9-46.2)
Northern Sydney & Central Coast 24.2 (5.4-42.9) 33.0 (17.4-48.6) 29.6 (17.4-41.7)
Hunter & New England 40.4 (22.5-58.3) 37.1 (23.5-50.7) 38.7 (27.5-49.9)
North Coast 25.0 (7.9-42.2) 40.6 (24.1-57.0) 33.2 (21.2-45.1)
Greater Southern 35.9 (17.9-53.9) 39.1 (24.7-53.5) 37.7 (26.3-49.0)
Greater Western 45.0 (20.4-69.7) 46.6 (31.5-61.8) 46.0 (32.7-59.3)
Urban 43.2 (33.5-52.9) 31.6 (25.0-38.1) 36.5 (30.9-42.2)
Rural 36.4 (26.5-46.3) 39.8 (32.2-47.4) 38.2 (32.1-44.3)
NSW 41.1 (33.7-48.4) 33.9 (28.7-39.0) 37.0 (32.7-41.4)
Note: Estimates are based on 0 respondents in NSW. For this indicator 0 (0%) were not stated (Don’t know or Refused) in NSW. The indicator includes those who are an active member of a local organisation, church or club. The question used was: Are you an active member of alocal organisation, church or club, such as a sport, craft, or social club?
Source: New South Wales Population Health Survey 2006 (HOIST). Centre for Epidemiology and Research, NSW Department of Health.
268
WARNIN
G: Esti
mates o
ut of
date.
Please
chec
k Hea
lthStat
s NSW
for la
test e
stimate
s.

Oral health
IntroductionAustralians enjoy a high standard of oral health. However, there are inequalities, with higher rates ofdental caries among people with higher levels of socioeconomic disadvantage, people living in ruraland remote areas, indigenous people, people born overseas, and people from older generations.There is also differential access to dental services according to country of birth, indigenous status,language spoken at home, health insurance status, socioeconomic status, and educational status.[1]
According to the 2004-06 National Survey of Adult Oral Health, there have been improvements in oralhealth, particularly among the ’fluoride generation’ born since 1970; however, there is a populationdivide in the pattern of dental care, between those who have regular visits to a dental professional andthose who visit a dental professional infrequently or only when they have an oral health problem. Thelatter group is worse off on almost all measures of oral health.[2]
Regular visits to a dental professional, at least once every 2 years, have a significant and positiveeffect on dental health. Those who visit a dental care professional regularly have significantly lessseverity and prevalence, and suffer fewer social and psychological effects, of dental health problems.[3,4]
Fluoridation of drinking water reduces dental caries. It is carried out under the provisions of theFluoridation of Public Water Supplies Regulation 2002 and the Fluoridation of Public Water SuppliesAct 1957. Under the Act, water supply authorities are responsible for fluoridating water, for dailytesting of fluoride concentration, and for submitting results of testing to the NSW Department of Health.[5,6]
In 2006, the New South Wales Population Health Survey asked respondents: Are any of your naturalteeth missing? Do you have dentures or false teeth? When did you last visit a dental professionalabout your teeth, dentures or gums? Respondents who had not seen a dental professional in the last12 months were asked: What are the main reasons for you not visiting the dentist in the last 12months? Respondents were also asked: Has fluoride been added to your water supply? Do you agreewith adding fluoride to your public water supply to try and prevent tooth decay? or, Would you be infavour of adding fluoride to your water supply to try and prevent tooth decay: In children, In adults, Inboth children and adults? Where have you received information on water fluoridation? and, Whoshould decide on the fluoridation of water supplies?
Results
Visits to dental professionals
Overall, in 2006, 58.1 per cent of adults visited a dental professional less than 12 months ago, 17.1per cent one to less than 2 years ago, 12.6 per cent 2 to less than 5 years ago, 5.8 per cent 5 to lessthan 10 years ago, 5.5 per cent 10 years ago or more, and 0.9 per cent had never visited a dental professional.
A significantly higher proportion of females (59.8 per cent) than males (56.4 per cent) visited a dentalprofessional less than 12 months ago. Among males, a significantly higher proportion of adults aged45-54 years (64.5 per cent), and a significantly lower proportion of adults aged 25-34 years (48.3 percent), visited a dental professional in the last 12 months, compared with the overall adult malepopulation. Among females, a significantly higher proportion of adults aged 45-54 years (67.5 percent), and a significantly lower proportion of adults aged 25-34 years (51.5 per cent) and 75 years andover (52.1 per cent), visited a dental professional in the last 12 months, compared with the overalladult female population.
A significantly lower proportion of adults in rural areas (53.0 per cent) than urban areas (60.3 per cent)visited a dental professional in the last 12 months. A higher proportion of adults in the NorthernSydney & Central Coast Health Area (67.0 per cent), and a lower proportion of adults in the GreaterSouthern (50.6 per cent) and Greater Western (46.7 per cent) Health Areas, visited a dental
269
WARNIN
G: Esti
mates o
ut of
date.
Please
chec
k Hea
lthStat
s NSW
for la
test e
stimate
s.
professional in the last 12 months.
Visits to a dental professional decreased with socioeconomic disadvantage. A higher proportion ofadults in the least disadvantaged quintile (68.3 per cent), and a lower proportion of adults in the 2 mostdisadvantaged quintiles (53.8 per cent and 48.6 per cent), visited a dental professional less than 12months ago. The proportion of adults who visited a dental professional in the last 12 months increasedsignificantly between 2002 (55.8 per cent) and 2006 (58.1 per cent).
The principle reasons for not visiting a dental professional in the last 12 months include: do not needto (48.0 per cent), too expensive (26.0 per cent), hard to find time (15.6 per cent), and worried or afraidof going (13.4 per cent).
Retention of natural teethOverall, in 2006, 4.8 per cent of adults had all their natural teeth missing. A significantly higherproportion of females (5.9 per cent) than males (3.7 per cent) had all their natural teeth missing, and inboth sexes the proportion increased significantly with age. The proportion of adults with all their naturalteeth missing was significantly higher in rural areas (7.1 per cent) than urban areas (3.8 per cent). Ahigher proportion of adults in the North Coast (6.8 per cent), Greater Southern (7.0 per cent), GreaterWestern (7.0 per cent), and Hunter & New England (7.3 per cent) Health Areas had all their naturalteeth missing, compared with the overall adult population. A lower proportion of adults in the NorthernSydney & Central Coast (3.1 per cent) and Sydney South West (3.5 per cent) Health Areas had alltheir natural teeth missing, compared with the overall adult population. The proportion of adults with alltheir natural teeth missing increased with socioeconomic disadvantage. A lower proportion of adults inthe least disadvantaged quintile (2.8 per cent), and a higher proportion of adults in the mostdisadvantaged quintile (6.1 per cent), had all their natural teeth missing, compared with the overalladult population.
The proportion of adults with all their natural teeth missing decreased significantly from 1998 (8.2 percent) to 2006 (4.8 per cent).
Attitude towards fluoridation of public water supplies
Overall, 79.5 per cent of adults said their public water supply had been fluoridated, and 86.1 per centof adults agreed with having their water supply fluoridated. There was no significant variation betweenmales and females. A significantly higher proportion of adults 65-74 years (88.7 per cent) and 75 yearsand over (88.7 per cent) agreed with having their water supply fluoridated. A significantly lowerproportion of adults in rural areas (80.1 per cent) than urban areas (88.8 per cent) agreed with havingtheir water supply fluoridated. A higher proportion of residents in the South Eastern Sydney & Illawarra(90.9 per cent) and Northern Sydney & Central Coast (89.0 per cent) Health Areas, agreed with havingtheir water supply fluoridated. A lower proportion of adults in North Coast (72.6 per cent) and GreaterSouthern (80.5 per cent) and Greater Western (77.7 per cent) Health Areas agreed with having theirwater supply fluoridated, compared with the overall adult population. A higher proportion of adults inthe least disadvantaged quintile (90.0 per cent) and a lower proportion of adults in the second mostdisadvantaged quintile (82.6 per cent) agreed with having their water supply fluoridated, comparedwith the overall adult population.
There was no significant variation in the proportion of adults who agreed with having their water supplyfluoridated between 2005 and 2006.
Information about water fluoridation came from a wide variety of sources: newspapers (23.1 per cent),television (16.8 per cent), health authorities (13.5 per cent), magazines (5.8 per cent), radio (5.5 percent), dentists (5.3 per cent), advertisements for dental products (1.4 per cent), and dental auxiliaries(8.3 per cent).
Adults felt that decisions on the fluoridation of water supplies should be made by: health authorities(31.3 per cent), the community (36.2 per cent), the state government (23.4 per cent), dentalassociations (16.8 per cent), and water boards (12.1 per cent).
270
WARNIN
G: Esti
mates o
ut of
date.
Please
chec
k Hea
lthStat
s NSW
for la
test e
stimate
s.

References1. Australian Institute of Health and Welfare Dental Statistics and Research Unit. Oral Health and
Access to Dental Care: 1994–1996 and 1999. Adelaide: Australian Institute of Health and WelfareDental Statistics and Research Unit, 2001.
2. Australian Institute of Health and Welfare Dental Statistics and Research Unit. Australia’s dentalgenerations: The National Survey of Adult Oral Health 2004-06. Adelaide: Australian Institute ofHealth and Welfare Dental Statistics and Research Unit, 2007. Available online atwww.adelaide.edu.au/spdent/dsru/pub_frame.html (accessed 10 May 2007).
3. Kay EJ. Do regular attenders have better oral health? Br Dent J 2002; 193(12): 697-702.Available online at www.nature.com/bdj/journal/v193/n12/full/4801663a.html (accessed 10 May2007).
4. Richards W and Ameen J. The impact of dental attendance on oral health in a general dentalpractice. Br Dent J 2002; 193(12): 697-702. Available online atwww.nature.com/bdj/journal/v193/n12/full/4801664a.html (accessed 10 May 2007).
5. National Health and Medical Research Council. 2004 Australian Drinking Water Guidelines.Canberra: NHMRC, 2004. Available online atwww.nhmrc.gov.au/publications/synopses/eh19syn.htm (accessed 10 May 2007).
6. The Sydney Water Corporation website at www.sydneywater.com.au (accessed 10 May 2007).
271
WARNIN
G: Esti
mates o
ut of
date.
Please
chec
k Hea
lthStat
s NSW
for la
test e
stimate
s.
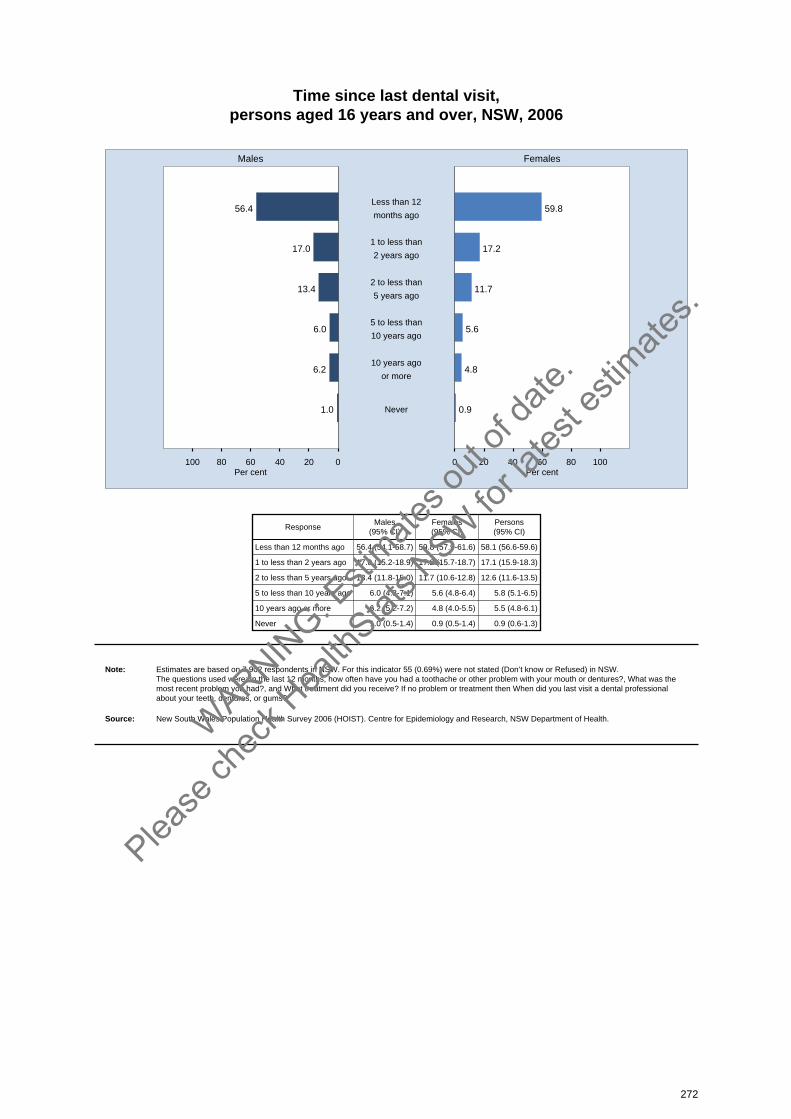
Time since last dental visit, persons aged 16 years and over, NSW, 2006
020406080100 0 20 40 60 80 100
Males Females
Per cent Per cent
56.4 59.8Less than 12
months ago
17.0 17.21 to less than
2 years ago
13.4 11.72 to less than
5 years ago
6.0 5.65 to less than
10 years ago
6.2 4.810 years ago
or more
1.0 0.9Never
ResponseMales
(95% CI)Females(95% CI)
Persons(95% CI)
Less than 12 months ago 56.4 (54.1-58.7) 59.8 (57.9-61.6) 58.1 (56.6-59.6)
1 to less than 2 years ago 17.0 (15.2-18.9) 17.2 (15.7-18.7) 17.1 (15.9-18.3)
2 to less than 5 years ago 13.4 (11.8-15.0) 11.7 (10.6-12.8) 12.6 (11.6-13.5)
5 to less than 10 years ago 6.0 (4.8-7.1) 5.6 (4.8-6.4) 5.8 (5.1-6.5)
10 years ago or more 6.2 (5.2-7.2) 4.8 (4.0-5.5) 5.5 (4.8-6.1)
Never 1.0 (0.5-1.4) 0.9 (0.5-1.4) 0.9 (0.6-1.3)
Note: Estimates are based on 7,902 respondents in NSW. For this indicator 55 (0.69%) were not stated (Don’t know or Refused) in NSW. The questions used were: In the last 12 months, how often have you had a toothache or other problem with your mouth or dentures?, What was themost recent problem you had?, and What treatment did you receive? If no problem or treatment then When did you last visit a dental professionalabout your teeth, dentures, or gums?
Source: New South Wales Population Health Survey 2006 (HOIST). Centre for Epidemiology and Research, NSW Department of Health.
272
WARNIN
G: Esti
mates o
ut of
date.
Please
chec
k Hea
lthStat
s NSW
for la
test e
stimate
s.
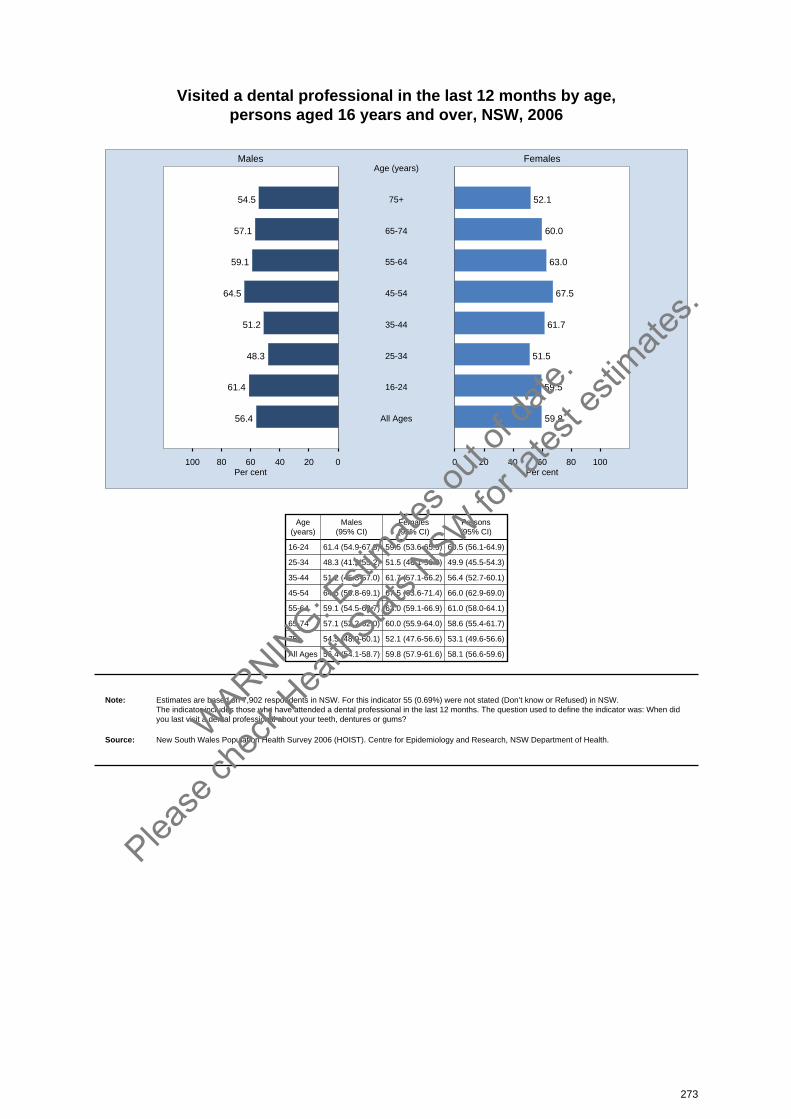
Visited a dental professional in the last 12 months by age, persons aged 16 years and over, NSW, 2006
020406080100 0 20 40 60 80 100
Males Females
Per cent Per cent
54.5 52.175+
Age (years)
57.1 60.065-74
59.1 63.055-64
64.5 67.545-54
51.2 61.735-44
48.3 51.525-34
61.4 59.516-24
56.4 59.8All Ages
Age(years)
Males(95% CI)
Females(95% CI)
Persons(95% CI)
16-24 61.4 (54.9-67.8) 59.5 (53.6-65.5) 60.5 (56.1-64.9)
25-34 48.3 (41.3-55.2) 51.5 (46.1-56.9) 49.9 (45.5-54.3)
35-44 51.2 (45.3-57.0) 61.7 (57.1-66.2) 56.4 (52.7-60.1)
45-54 64.5 (59.8-69.1) 67.5 (63.6-71.4) 66.0 (62.9-69.0)
55-64 59.1 (54.5-63.7) 63.0 (59.1-66.9) 61.0 (58.0-64.1)
65-74 57.1 (52.2-62.0) 60.0 (55.9-64.0) 58.6 (55.4-61.7)
75+ 54.5 (48.9-60.1) 52.1 (47.6-56.6) 53.1 (49.6-56.6)
All Ages 56.4 (54.1-58.7) 59.8 (57.9-61.6) 58.1 (56.6-59.6)
Note: Estimates are based on 7,902 respondents in NSW. For this indicator 55 (0.69%) were not stated (Don’t know or Refused) in NSW. The indicator includes those who have attended a dental professional in the last 12 months. The question used to define the indicator was: When didyou last visit a dental professional about your teeth, dentures or gums?
Source: New South Wales Population Health Survey 2006 (HOIST). Centre for Epidemiology and Research, NSW Department of Health.
273
WARNIN
G: Esti
mates o
ut of
date.
Please
chec
k Hea
lthStat
s NSW
for la
test e
stimate
s.

Visited a dental professional in the last 12 months by socioeconomicdisadvantage,
persons aged 16 years and over, NSW, 2006
020406080100 0 20 40 60 80 100
Males Females
Per cent Per cent
49.0 48.15th Quintile
most disadvantaged
50.1 57.24th Quintile
54.2 62.23rd Quintile
60.4 60.72nd Quintile
67.0 69.81st Quintile
least disadvantaged
56.4 59.8NSW
Quintile ofsocioeconomicdisadvantage
Males(95% CI)
Females(95% CI)
Persons(95% CI)
5th Quintile 49.0 (43.6-54.4) 48.1 (43.7-52.5) 48.6 (45.1-52.0)
4th Quintile 50.1 (45.2-55.1) 57.2 (53.3-61.1) 53.8 (50.6-56.9)
3rd Quintile 54.2 (49.2-59.1) 62.2 (58.1-66.3) 58.2 (54.9-61.4)
2nd Quintile 60.4 (55.5-65.3) 60.7 (56.6-64.7) 60.6 (57.4-63.7)
1st Quintile 67.0 (61.0-73.0) 69.8 (65.6-74.0) 68.3 (64.6-72.1)
NSW 56.4 (54.1-58.7) 59.8 (57.9-61.6) 58.1 (56.6-59.6)
Note: Estimates are based on 7,902 respondents in NSW. For this indicator 55 (0.69%) were not stated (Don’t know or Refused) in NSW. The indicator includes those who have attended a dental professional in the last 12 months. The question used to define the indicator was: When didyou last visit a dental professional about your teeth, dentures or gums?
Source: New South Wales Population Health Survey 2006 (HOIST). Centre for Epidemiology and Research, NSW Department of Health.
274
WARNIN
G: Esti
mates o
ut of
date.
Please
chec
k Hea
lthStat
s NSW
for la
test e
stimate
s.

Visited a dental professional in the last 12 months by health area, persons aged 16 years and over, NSW, 2006
0 20 40 60 80 100 0 20 40 60 80 100
Males Females
Per cent Per cent
Sydney South West
South Eastern Sydney& Illawarra
Sydney West
Northern Sydney &Central Coast
Hunter & New England
North Coast
Greater Southern
Greater Western
Urban
Rural
NSW
AreaMales
(95% CI)Females(95% CI)
Persons(95% CI)
Sydney South West 57.7 (52.1-63.2) 56.9 (52.0-61.8) 57.3 (53.6-61.0)
South Eastern Sydney & Illawarra 57.3 (50.7-63.9) 64.6 (59.8-69.3) 60.9 (56.8-65.1)
Sydney West 53.7 (47.3-60.2) 58.8 (54.0-63.6) 56.3 (52.3-60.3)
Northern Sydney & Central Coast 65.6 (60.1-71.1) 68.2 (63.6-72.8) 67.0 (63.4-70.5)
Hunter & New England 56.0 (50.1-61.9) 53.2 (48.5-57.8) 54.6 (50.8-58.3)
North Coast 55.1 (49.0-61.2) 57.9 (53.1-62.7) 56.6 (52.7-60.4)
Greater Southern 47.2 (41.1-53.3) 54.1 (49.0-59.2) 50.6 (46.6-54.6)
Greater Western 39.7 (33.7-45.6) 53.8 (48.9-58.7) 46.7 (42.7-50.6)
Urban 58.6 (55.5-61.6) 62.0 (59.6-64.4) 60.3 (58.4-62.2)
Rural 51.4 (48.2-54.7) 54.6 (52.0-57.1) 53.0 (51.0-55.1)
NSW 56.4 (54.1-58.7) 59.8 (57.9-61.6) 58.1 (56.6-59.6)
Note: Estimates are based on 7,902 respondents in NSW. For this indicator 55 (0.69%) were not stated (Don’t know or Refused) in NSW. The indicator includes those who have attended a dental professional in the last 12 months. The question used to define the indicator was: When didyou last visit a dental professional about your teeth, dentures or gums?
Source: New South Wales Population Health Survey 2006 (HOIST). Centre for Epidemiology and Research, NSW Department of Health.
275
WARNIN
G: Esti
mates o
ut of
date.
Please
chec
k Hea
lthStat
s NSW
for la
test e
stimate
s.
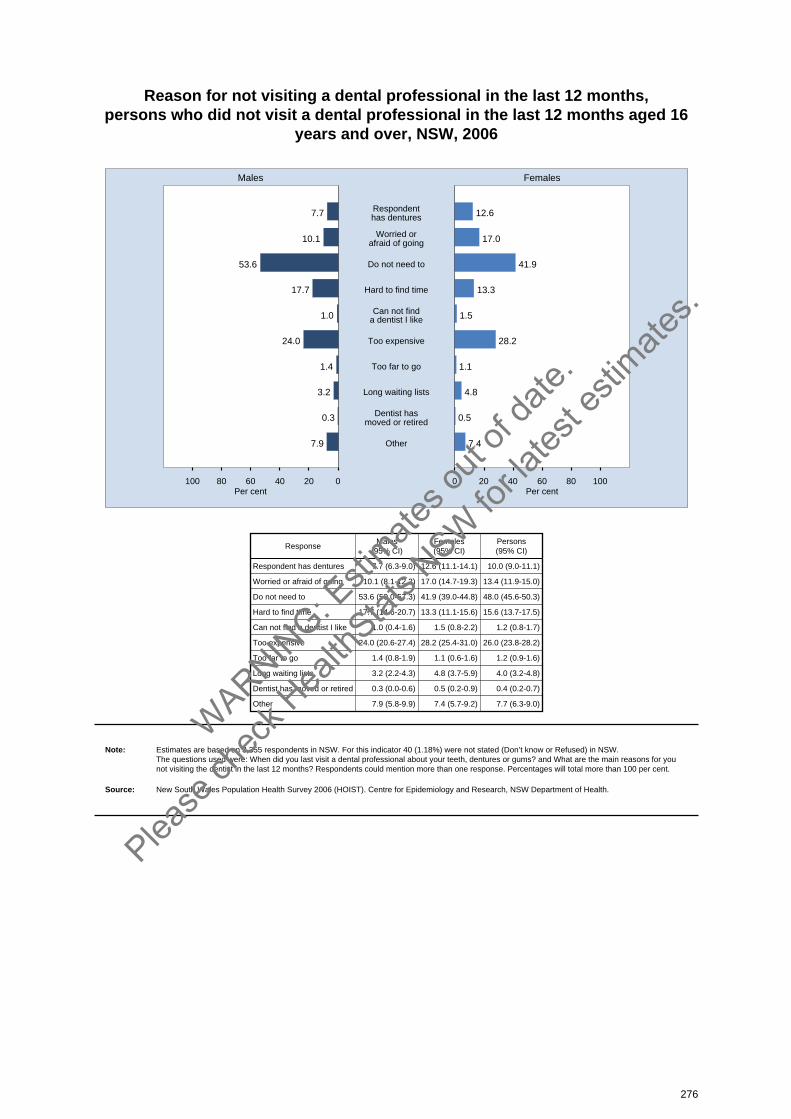
Reason for not visiting a dental professional in the last 12 months, persons who did not visit a dental professional in the last 12 months aged 16
years and over, NSW, 2006
020406080100 0 20 40 60 80 100
Males Females
Per cent Per cent
7.7 12.6Respondenthas dentures
10.1 17.0Worried orafraid of going
53.6 41.9Do not need to
17.7 13.3Hard to find time
1.0 1.5Can not finda dentist I like
24.0 28.2Too expensive
1.4 1.1Too far to go
3.2 4.8Long waiting lists
0.3 0.5Dentist hasmoved or retired
7.9 7.4Other
ResponseMales
(95% CI)Females(95% CI)
Persons(95% CI)
Respondent has dentures 7.7 (6.3-9.0) 12.6 (11.1-14.1) 10.0 (9.0-11.1)
Worried or afraid of going 10.1 (8.1-12.2) 17.0 (14.7-19.3) 13.4 (11.9-15.0)
Do not need to 53.6 (50.0-57.3) 41.9 (39.0-44.8) 48.0 (45.6-50.3)
Hard to find time 17.7 (14.6-20.7) 13.3 (11.1-15.6) 15.6 (13.7-17.5)
Can not find a dentist I like 1.0 (0.4-1.6) 1.5 (0.8-2.2) 1.2 (0.8-1.7)
Too expensive 24.0 (20.6-27.4) 28.2 (25.4-31.0) 26.0 (23.8-28.2)
Too far to go 1.4 (0.8-1.9) 1.1 (0.6-1.6) 1.2 (0.9-1.6)
Long waiting lists 3.2 (2.2-4.3) 4.8 (3.7-5.9) 4.0 (3.2-4.8)
Dentist has moved or retired 0.3 (0.0-0.6) 0.5 (0.2-0.9) 0.4 (0.2-0.7)
Other 7.9 (5.8-9.9) 7.4 (5.7-9.2) 7.7 (6.3-9.0)
Note: Estimates are based on 3,355 respondents in NSW. For this indicator 40 (1.18%) were not stated (Don’t know or Refused) in NSW. The questions used were: When did you last visit a dental professional about your teeth, dentures or gums? and What are the main reasons for younot visiting the dentist in the last 12 months? Respondents could mention more than one response. Percentages will total more than 100 per cent.
Source: New South Wales Population Health Survey 2006 (HOIST). Centre for Epidemiology and Research, NSW Department of Health.
276
WARNIN
G: Esti
mates o
ut of
date.
Please
chec
k Hea
lthStat
s NSW
for la
test e
stimate
s.
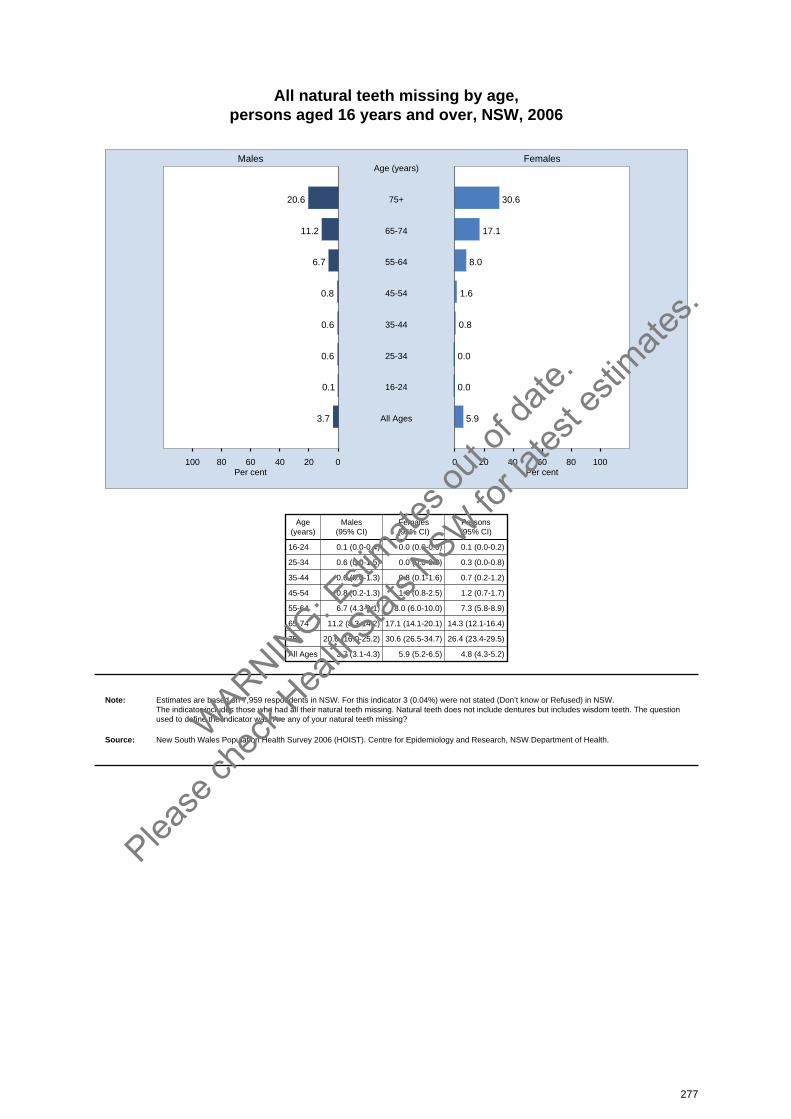
All natural teeth missing by age, persons aged 16 years and over, NSW, 2006
020406080100 0 20 40 60 80 100
Males Females
Per cent Per cent
20.6 30.675+
Age (years)
11.2 17.165-74
6.7 8.055-64
0.8 1.645-54
0.6 0.835-44
0.6 0.025-34
0.1 0.016-24
3.7 5.9All Ages
Age(years)
Males(95% CI)
Females(95% CI)
Persons(95% CI)
16-24 0.1 (0.0-0.4) 0.0 (0.0-0.0) 0.1 (0.0-0.2)
25-34 0.6 (0.0-1.5) 0.0 (0.0-0.0) 0.3 (0.0-0.8)
35-44 0.6 (0.0-1.3) 0.8 (0.1-1.6) 0.7 (0.2-1.2)
45-54 0.8 (0.2-1.3) 1.6 (0.8-2.5) 1.2 (0.7-1.7)
55-64 6.7 (4.3-9.1) 8.0 (6.0-10.0) 7.3 (5.8-8.9)
65-74 11.2 (8.3-14.2) 17.1 (14.1-20.1) 14.3 (12.1-16.4)
75+ 20.6 (16.0-25.2) 30.6 (26.5-34.7) 26.4 (23.4-29.5)
All Ages 3.7 (3.1-4.3) 5.9 (5.2-6.5) 4.8 (4.3-5.2)
Note: Estimates are based on 7,959 respondents in NSW. For this indicator 3 (0.04%) were not stated (Don’t know or Refused) in NSW. The indicator includes those who had all their natural teeth missing. Natural teeth does not include dentures but includes wisdom teeth. The questionused to define the indicator was: Are any of your natural teeth missing?
Source: New South Wales Population Health Survey 2006 (HOIST). Centre for Epidemiology and Research, NSW Department of Health.
277
WARNIN
G: Esti
mates o
ut of
date.
Please
chec
k Hea
lthStat
s NSW
for la
test e
stimate
s.
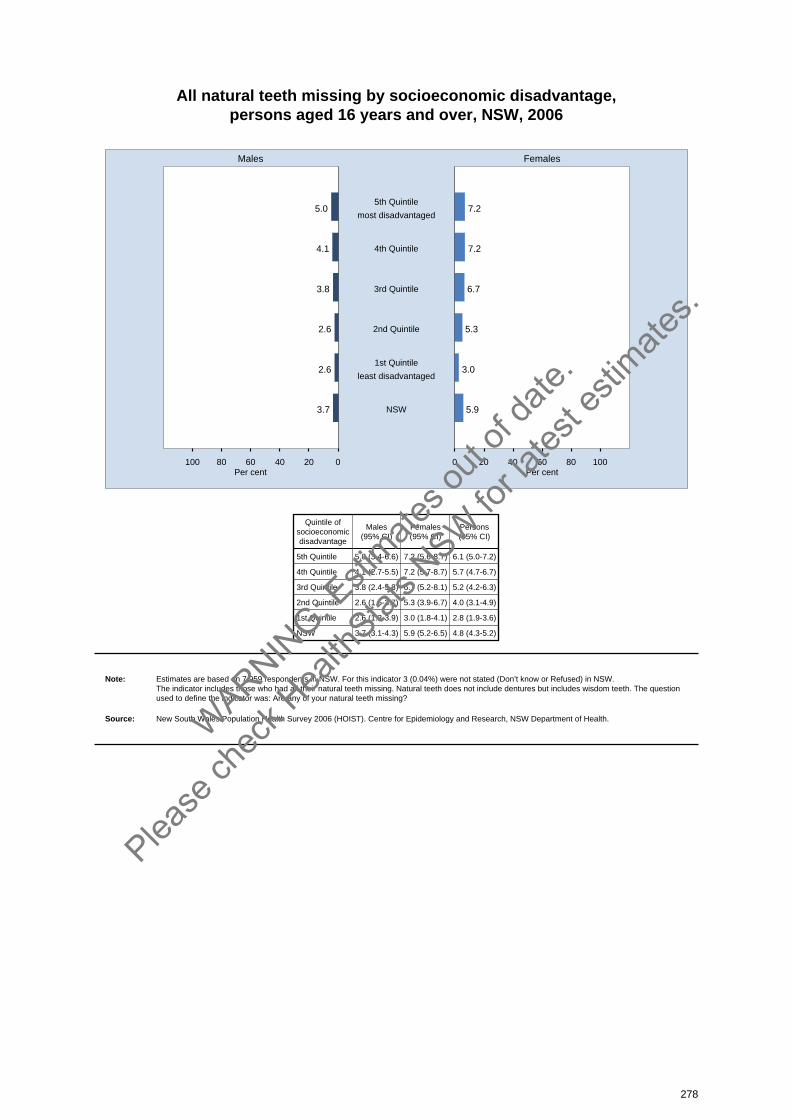
All natural teeth missing by socioeconomic disadvantage, persons aged 16 years and over, NSW, 2006
020406080100 0 20 40 60 80 100
Males Females
Per cent Per cent
5.0 7.25th Quintile
most disadvantaged
4.1 7.24th Quintile
3.8 6.73rd Quintile
2.6 5.32nd Quintile
2.6 3.01st Quintile
least disadvantaged
3.7 5.9NSW
Quintile ofsocioeconomicdisadvantage
Males(95% CI)
Females(95% CI)
Persons(95% CI)
5th Quintile 5.0 (3.4-6.6) 7.2 (5.6-8.7) 6.1 (5.0-7.2)
4th Quintile 4.1 (2.7-5.5) 7.2 (5.7-8.7) 5.7 (4.7-6.7)
3rd Quintile 3.8 (2.4-5.3) 6.7 (5.2-8.1) 5.2 (4.2-6.3)
2nd Quintile 2.6 (1.5-3.7) 5.3 (3.9-6.7) 4.0 (3.1-4.9)
1st Quintile 2.6 (1.2-3.9) 3.0 (1.8-4.1) 2.8 (1.9-3.6)
NSW 3.7 (3.1-4.3) 5.9 (5.2-6.5) 4.8 (4.3-5.2)
Note: Estimates are based on 7,959 respondents in NSW. For this indicator 3 (0.04%) were not stated (Don’t know or Refused) in NSW. The indicator includes those who had all their natural teeth missing. Natural teeth does not include dentures but includes wisdom teeth. The questionused to define the indicator was: Are any of your natural teeth missing?
Source: New South Wales Population Health Survey 2006 (HOIST). Centre for Epidemiology and Research, NSW Department of Health.
278
WARNIN
G: Esti
mates o
ut of
date.
Please
chec
k Hea
lthStat
s NSW
for la
test e
stimate
s.
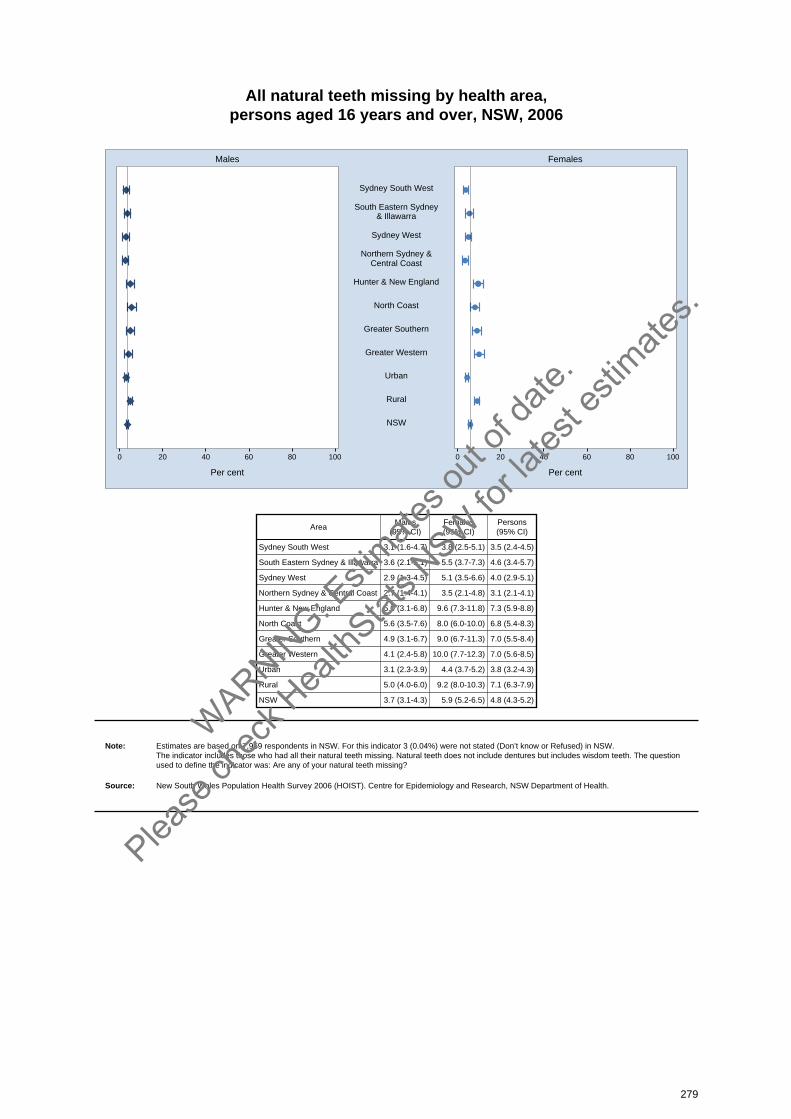
All natural teeth missing by health area, persons aged 16 years and over, NSW, 2006
0 20 40 60 80 100 0 20 40 60 80 100
Males Females
Per cent Per cent
Sydney South West
South Eastern Sydney& Illawarra
Sydney West
Northern Sydney &Central Coast
Hunter & New England
North Coast
Greater Southern
Greater Western
Urban
Rural
NSW
AreaMales
(95% CI)Females(95% CI)
Persons(95% CI)
Sydney South West 3.1 (1.6-4.7) 3.8 (2.5-5.1) 3.5 (2.4-4.5)
South Eastern Sydney & Illawarra 3.6 (2.1-5.1) 5.5 (3.7-7.3) 4.6 (3.4-5.7)
Sydney West 2.9 (1.3-4.5) 5.1 (3.5-6.6) 4.0 (2.9-5.1)
Northern Sydney & Central Coast 2.7 (1.4-4.1) 3.5 (2.1-4.8) 3.1 (2.1-4.1)
Hunter & New England 5.0 (3.1-6.8) 9.6 (7.3-11.8) 7.3 (5.9-8.8)
North Coast 5.6 (3.5-7.6) 8.0 (6.0-10.0) 6.8 (5.4-8.3)
Greater Southern 4.9 (3.1-6.7) 9.0 (6.7-11.3) 7.0 (5.5-8.4)
Greater Western 4.1 (2.4-5.8) 10.0 (7.7-12.3) 7.0 (5.6-8.5)
Urban 3.1 (2.3-3.9) 4.4 (3.7-5.2) 3.8 (3.2-4.3)
Rural 5.0 (4.0-6.0) 9.2 (8.0-10.3) 7.1 (6.3-7.9)
NSW 3.7 (3.1-4.3) 5.9 (5.2-6.5) 4.8 (4.3-5.2)
Note: Estimates are based on 7,959 respondents in NSW. For this indicator 3 (0.04%) were not stated (Don’t know or Refused) in NSW. The indicator includes those who had all their natural teeth missing. Natural teeth does not include dentures but includes wisdom teeth. The questionused to define the indicator was: Are any of your natural teeth missing?
Source: New South Wales Population Health Survey 2006 (HOIST). Centre for Epidemiology and Research, NSW Department of Health.
279
WARNIN
G: Esti
mates o
ut of
date.
Please
chec
k Hea
lthStat
s NSW
for la
test e
stimate
s.

Fluoride added to public water supply, persons aged 16 years and over, NSW, 2006
020406080100 0 20 40 60 80 100
Males Females
Per cent Per cent
80.2 78.9Yes
19.8 21.1No
ResponseMales
(95% CI)Females(95% CI)
Persons(95% CI)
Yes 80.2 (78.2-82.2) 78.9 (77.2-80.7) 79.6 (78.3-80.9)
No 19.8 (17.8-21.8) 21.1 (19.3-22.8) 20.4 (19.1-21.7)
Note: Estimates are based on 5,945 respondents in NSW. For this indicator 2,017 (25.33%) were not stated (Don’t know or Refused) in NSW. The question used was: Has fluoride been added to your public water supply?
Source: New South Wales Population Health Survey 2006 (HOIST). Centre for Epidemiology and Research, NSW Department of Health.
280
WARNIN
G: Esti
mates o
ut of
date.
Please
chec
k Hea
lthStat
s NSW
for la
test e
stimate
s.
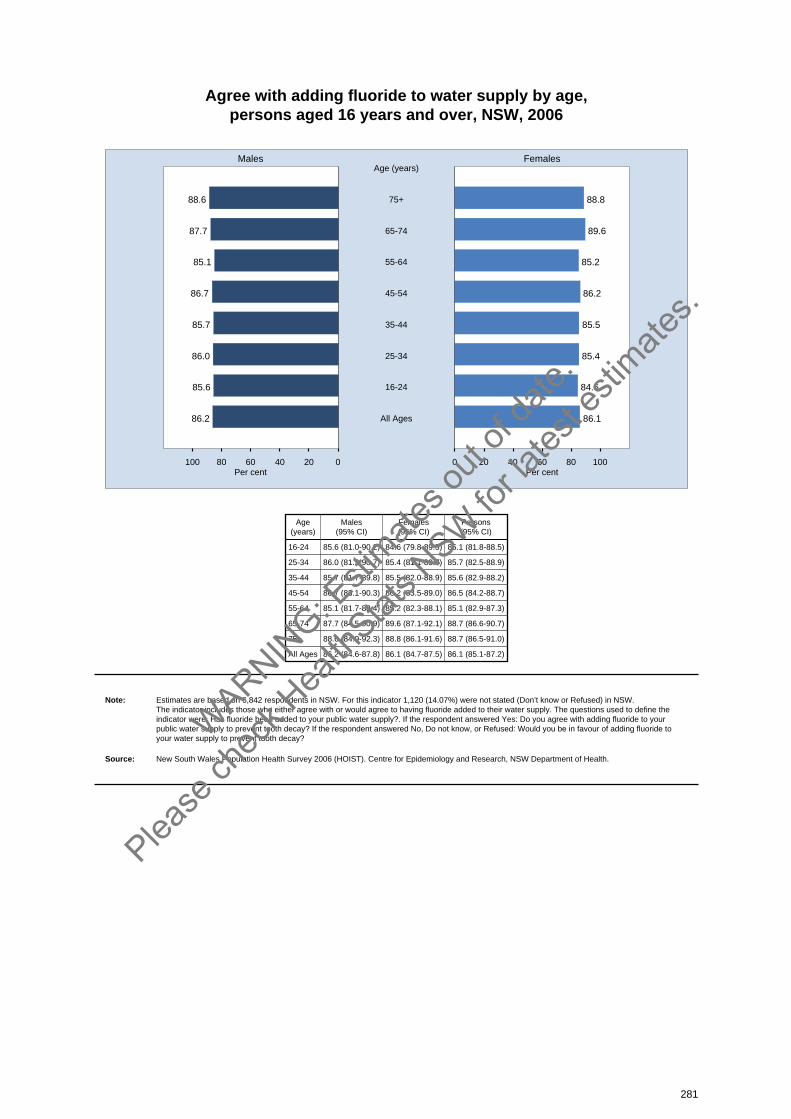
Agree with adding fluoride to water supply by age, persons aged 16 years and over, NSW, 2006
020406080100 0 20 40 60 80 100
Males Females
Per cent Per cent
88.6 88.875+
Age (years)
87.7 89.665-74
85.1 85.255-64
86.7 86.245-54
85.7 85.535-44
86.0 85.425-34
85.6 84.616-24
86.2 86.1All Ages
Age(years)
Males(95% CI)
Females(95% CI)
Persons(95% CI)
16-24 85.6 (81.0-90.2) 84.6 (79.8-89.5) 85.1 (81.8-88.5)
25-34 86.0 (81.3-90.7) 85.4 (81.1-89.7) 85.7 (82.5-88.9)
35-44 85.7 (81.7-89.8) 85.5 (82.0-88.9) 85.6 (82.9-88.2)
45-54 86.7 (83.1-90.3) 86.2 (83.5-89.0) 86.5 (84.2-88.7)
55-64 85.1 (81.7-88.4) 85.2 (82.3-88.1) 85.1 (82.9-87.3)
65-74 87.7 (84.5-90.9) 89.6 (87.1-92.1) 88.7 (86.6-90.7)
75+ 88.6 (84.9-92.3) 88.8 (86.1-91.6) 88.7 (86.5-91.0)
All Ages 86.2 (84.6-87.8) 86.1 (84.7-87.5) 86.1 (85.1-87.2)
Note: Estimates are based on 6,842 respondents in NSW. For this indicator 1,120 (14.07%) were not stated (Don’t know or Refused) in NSW. The indicator includes those who either agree with or would agree to having fluoride added to their water supply. The questions used to define theindicator were: Has fluoride been added to your public water supply?. If the respondent answered Yes: Do you agree with adding fluoride to yourpublic water supply to prevent tooth decay? If the respondent answered No, Do not know, or Refused: Would you be in favour of adding fluoride toyour water supply to prevent tooth decay?
Source: New South Wales Population Health Survey 2006 (HOIST). Centre for Epidemiology and Research, NSW Department of Health.
281
WARNIN
G: Esti
mates o
ut of
date.
Please
chec
k Hea
lthStat
s NSW
for la
test e
stimate
s.
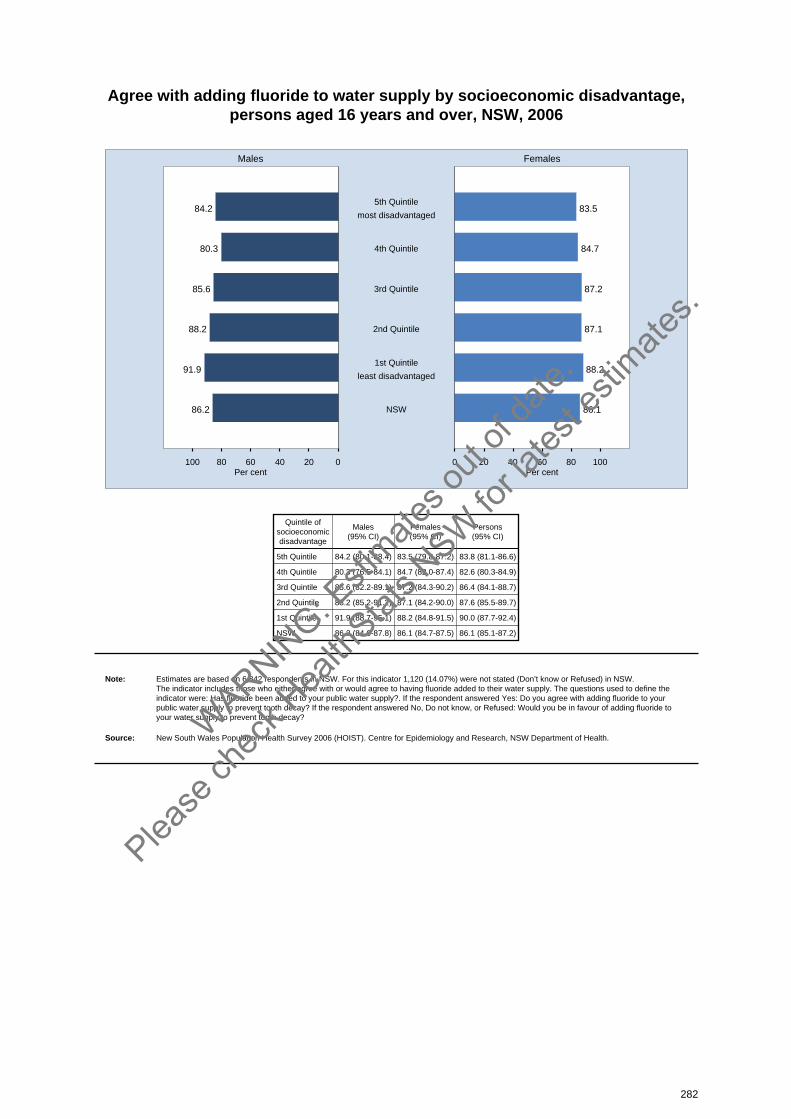
Agree with adding fluoride to water supply by socioeconomic disadvantage, persons aged 16 years and over, NSW, 2006
020406080100 0 20 40 60 80 100
Males Females
Per cent Per cent
84.2 83.55th Quintile
most disadvantaged
80.3 84.74th Quintile
85.6 87.23rd Quintile
88.2 87.12nd Quintile
91.9 88.21st Quintile
least disadvantaged
86.2 86.1NSW
Quintile ofsocioeconomicdisadvantage
Males(95% CI)
Females(95% CI)
Persons(95% CI)
5th Quintile 84.2 (80.1-88.4) 83.5 (79.8-87.2) 83.8 (81.1-86.6)
4th Quintile 80.3 (76.5-84.1) 84.7 (82.0-87.4) 82.6 (80.3-84.9)
3rd Quintile 85.6 (82.2-89.1) 87.2 (84.3-90.2) 86.4 (84.1-88.7)
2nd Quintile 88.2 (85.2-91.2) 87.1 (84.2-90.0) 87.6 (85.5-89.7)
1st Quintile 91.9 (88.7-95.1) 88.2 (84.8-91.5) 90.0 (87.7-92.4)
NSW 86.2 (84.6-87.8) 86.1 (84.7-87.5) 86.1 (85.1-87.2)
Note: Estimates are based on 6,842 respondents in NSW. For this indicator 1,120 (14.07%) were not stated (Don’t know or Refused) in NSW. The indicator includes those who either agree with or would agree to having fluoride added to their water supply. The questions used to define theindicator were: Has fluoride been added to your public water supply?. If the respondent answered Yes: Do you agree with adding fluoride to yourpublic water supply to prevent tooth decay? If the respondent answered No, Do not know, or Refused: Would you be in favour of adding fluoride toyour water supply to prevent tooth decay?
Source: New South Wales Population Health Survey 2006 (HOIST). Centre for Epidemiology and Research, NSW Department of Health.
282
WARNIN
G: Esti
mates o
ut of
date.
Please
chec
k Hea
lthStat
s NSW
for la
test e
stimate
s.
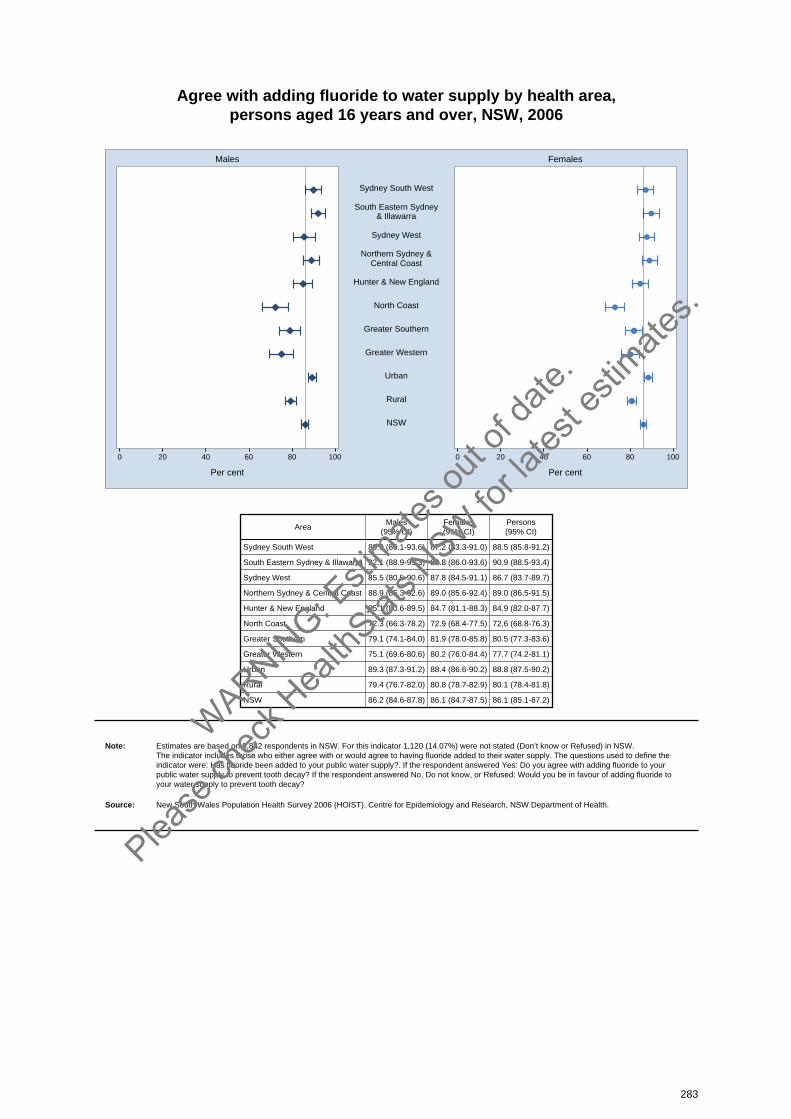
Agree with adding fluoride to water supply by health area, persons aged 16 years and over, NSW, 2006
0 20 40 60 80 100 0 20 40 60 80 100
Males Females
Per cent Per cent
Sydney South West
South Eastern Sydney& Illawarra
Sydney West
Northern Sydney &Central Coast
Hunter & New England
North Coast
Greater Southern
Greater Western
Urban
Rural
NSW
AreaMales
(95% CI)Females(95% CI)
Persons(95% CI)
Sydney South West 89.9 (86.1-93.6) 87.2 (83.3-91.0) 88.5 (85.8-91.2)
South Eastern Sydney & Illawarra 92.1 (88.9-95.3) 89.8 (86.0-93.6) 90.9 (88.5-93.4)
Sydney West 85.5 (80.5-90.6) 87.8 (84.5-91.1) 86.7 (83.7-89.7)
Northern Sydney & Central Coast 88.9 (85.3-92.6) 89.0 (85.6-92.4) 89.0 (86.5-91.5)
Hunter & New England 85.1 (80.6-89.5) 84.7 (81.1-88.3) 84.9 (82.0-87.7)
North Coast 72.3 (66.3-78.2) 72.9 (68.4-77.5) 72.6 (68.8-76.3)
Greater Southern 79.1 (74.1-84.0) 81.9 (78.0-85.8) 80.5 (77.3-83.6)
Greater Western 75.1 (69.6-80.6) 80.2 (76.0-84.4) 77.7 (74.2-81.1)
Urban 89.3 (87.3-91.2) 88.4 (86.6-90.2) 88.8 (87.5-90.2)
Rural 79.4 (76.7-82.0) 80.8 (78.7-82.9) 80.1 (78.4-81.8)
NSW 86.2 (84.6-87.8) 86.1 (84.7-87.5) 86.1 (85.1-87.2)
Note: Estimates are based on 6,842 respondents in NSW. For this indicator 1,120 (14.07%) were not stated (Don’t know or Refused) in NSW. The indicator includes those who either agree with or would agree to having fluoride added to their water supply. The questions used to define theindicator were: Has fluoride been added to your public water supply?. If the respondent answered Yes: Do you agree with adding fluoride to yourpublic water supply to prevent tooth decay? If the respondent answered No, Do not know, or Refused: Would you be in favour of adding fluoride toyour water supply to prevent tooth decay?
Source: New South Wales Population Health Survey 2006 (HOIST). Centre for Epidemiology and Research, NSW Department of Health.
283
WARNIN
G: Esti
mates o
ut of
date.
Please
chec
k Hea
lthStat
s NSW
for la
test e
stimate
s.
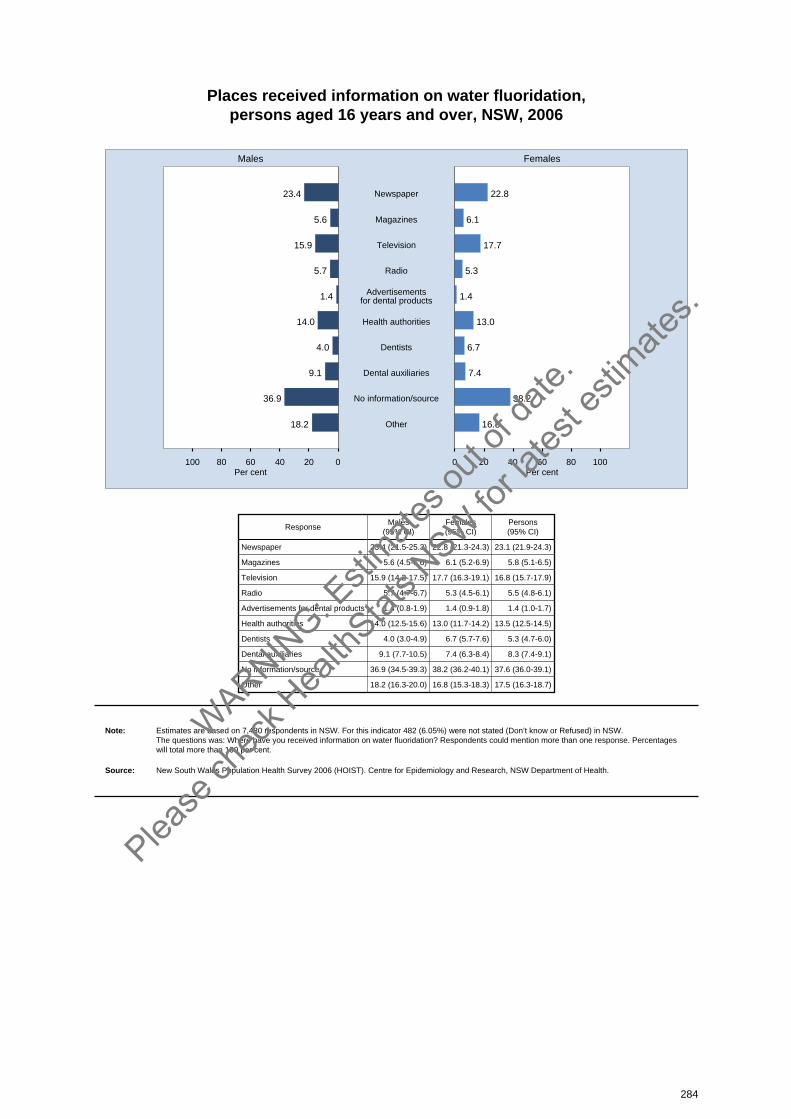
Places received information on water fluoridation, persons aged 16 years and over, NSW, 2006
020406080100 0 20 40 60 80 100
Males Females
Per cent Per cent
23.4 22.8Newspaper
5.6 6.1Magazines
15.9 17.7Television
5.7 5.3Radio
1.4 1.4Advertisementsfor dental products
14.0 13.0Health authorities
4.0 6.7Dentists
9.1 7.4Dental auxiliaries
36.9 38.2No information/source
18.2 16.8Other
ResponseMales
(95% CI)Females(95% CI)
Persons(95% CI)
Newspaper 23.4 (21.5-25.3) 22.8 (21.3-24.3) 23.1 (21.9-24.3)
Magazines 5.6 (4.5-6.6) 6.1 (5.2-6.9) 5.8 (5.1-6.5)
Television 15.9 (14.2-17.5) 17.7 (16.3-19.1) 16.8 (15.7-17.9)
Radio 5.7 (4.7-6.7) 5.3 (4.5-6.1) 5.5 (4.8-6.1)
Advertisements for dental products 1.4 (0.8-1.9) 1.4 (0.9-1.8) 1.4 (1.0-1.7)
Health authorities 14.0 (12.5-15.6) 13.0 (11.7-14.2) 13.5 (12.5-14.5)
Dentists 4.0 (3.0-4.9) 6.7 (5.7-7.6) 5.3 (4.7-6.0)
Dental auxiliaries 9.1 (7.7-10.5) 7.4 (6.3-8.4) 8.3 (7.4-9.1)
No information/source 36.9 (34.5-39.3) 38.2 (36.2-40.1) 37.6 (36.0-39.1)
Other 18.2 (16.3-20.0) 16.8 (15.3-18.3) 17.5 (16.3-18.7)
Note: Estimates are based on 7,480 respondents in NSW. For this indicator 482 (6.05%) were not stated (Don’t know or Refused) in NSW. The questions was: Where have you received information on water fluoridation? Respondents could mention more than one response. Percentageswill total more than 100 per cent.
Source: New South Wales Population Health Survey 2006 (HOIST). Centre for Epidemiology and Research, NSW Department of Health.
284
WARNIN
G: Esti
mates o
ut of
date.
Please
chec
k Hea
lthStat
s NSW
for la
test e
stimate
s.
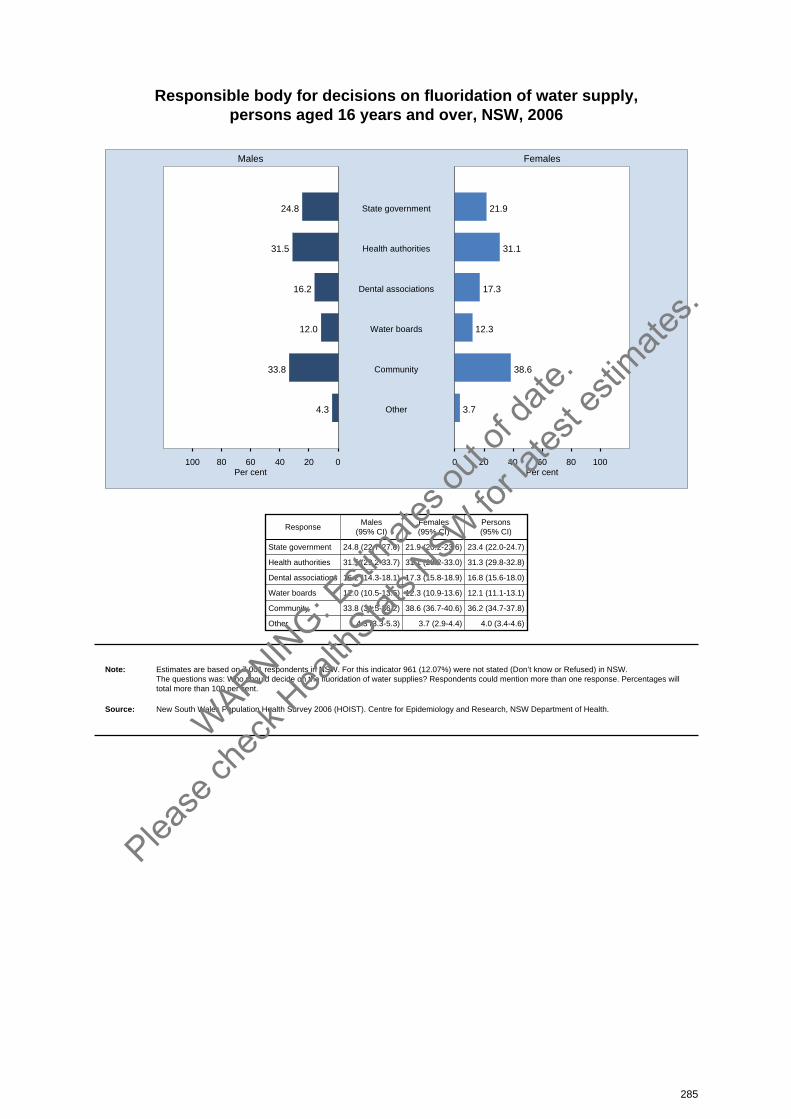
Responsible body for decisions on fluoridation of water supply, persons aged 16 years and over, NSW, 2006
020406080100 0 20 40 60 80 100
Males Females
Per cent Per cent
24.8 21.9State government
31.5 31.1Health authorities
16.2 17.3Dental associations
12.0 12.3Water boards
33.8 38.6Community
4.3 3.7Other
ResponseMales
(95% CI)Females(95% CI)
Persons(95% CI)
State government 24.8 (22.7-27.0) 21.9 (20.2-23.6) 23.4 (22.0-24.7)
Health authorities 31.5 (29.2-33.7) 31.1 (29.2-33.0) 31.3 (29.8-32.8)
Dental associations 16.2 (14.3-18.1) 17.3 (15.8-18.9) 16.8 (15.6-18.0)
Water boards 12.0 (10.5-13.5) 12.3 (10.9-13.6) 12.1 (11.1-13.1)
Community 33.8 (31.5-36.2) 38.6 (36.7-40.6) 36.2 (34.7-37.8)
Other 4.3 (3.3-5.3) 3.7 (2.9-4.4) 4.0 (3.4-4.6)
Note: Estimates are based on 7,001 respondents in NSW. For this indicator 961 (12.07%) were not stated (Don’t know or Refused) in NSW. The questions was: Who should decide on the fluoridation of water supplies? Respondents could mention more than one response. Percentages willtotal more than 100 per cent.
Source: New South Wales Population Health Survey 2006 (HOIST). Centre for Epidemiology and Research, NSW Department of Health.
285
WARNIN
G: Esti
mates o
ut of
date.
Please
chec
k Hea
lthStat
s NSW
for la
test e
stimate
s.

Overweight and obesity
IntroductionThroughout Australia, the prevalence of overweight and obesity is increasing. Being overweight orobese increases the risk of a wide range of health problems, including cardiovascular disease, type 2diabetes, breast cancer, gallstones, degenerative joint disease, obstructive sleep apnoea, andimpaired psychosocial functioning.[1] Overweight and obesity develop when the energy intake fromfood and drink exceeds energy expenditure from physical activity and other metabolic processes.
The prevalence of overweight and obesity is calculated using the Body Mass Index (BMI). BMI iscalculated by dividing a person’s weight (in kilograms) by their height (in metres squared). Theresulting BMI is then classified into 4 categories: underweight when the BMI is less than 18.5,acceptable or ideal weight when the BMI is greater than or equal to 18.5 and less than 25, overweightwhen the BMI is greater than or equal to 25 and less than 30, and obese when the BMI is greater thanor equal to 30.[2,3] Although studies have shown self-reported BMI results in an under-estimation ofmeasured BMI, it is still useful for ongoing surveillance of population health.
In 2006, the New South Wales Population Health Survey asked respondents: How tall are you withoutshoes? and, How much do you weigh without clothes or shoes? These answers were used to estimatebody mass index (BMI).
ResultsIn 2006, according to estimates of BMI based on self-reported height and weight, 2.6 per cent of adultswere underweight, 46.9 per cent were healthy weight, 32.7 per cent were overweight, and 17.7 percent were obese.
Overweight or obeseIn 2006, 50.4 per cent of adults were overweight or obese. A significantly higher proportion of males(57.4 per cent) than females (43.3 per cent) were overweight or obese. Among males, a significantlylower proportion of those aged 16-24 years (31.3 per cent) and 75 years and over (48.2 per cent), anda significantly higher proportion aged 45-54 years (66.2 per cent) and 55-64 years (69.5 per cent) and65-74 years (66.2 per cent), were overweight or obese, compared with the overall adult malepopulation. Among females, a significantly lower proportion of those aged 16-24 years (24.4 per cent),and a significantly higher proportion of those aged 55-64 years (57.2 per cent) and 65-74 years (56.4per cent), were overweight or obese, compared with the overall adult female population.
A significantly higher proportion of adults in rural areas (52.5 per cent) than urban areas (49.5 percent) were overweight or obese, compared with the overall adult population. A higher proportion ofadults in the Sydney West (55.7 per cent) and Greater Western (56.0 per cent) Health Areas wereoverweight or obese, compared with the overall adult population. A significantly lower proportion ofresidents in the Northern Sydney & Central Coast Health Area (44.1 per cent) were overweight orobese, compared with the overall adult population.
A lower proportion of adults in the least disadvantaged quintile (41.1 per cent), and a higher proportionof adults in the third most disadvantaged quintile (55.5 per cent) and most disadvantaged quintile (54.3per cent), were overweight or obese, compared with the overall adult population.
The proportion of adults who were overweight or obese has risen significantly from 1997 (41.8 percent) to 2006 (50.4 per cent). This significant increase has occurred in both males (49.3 per cent to57.4 per cent) and females (34.2 per cent to 43.3 per cent).
286
WARNIN
G: Esti
mates o
ut of
date.
Please
chec
k Hea
lthStat
s NSW
for la
test e
stimate
s.
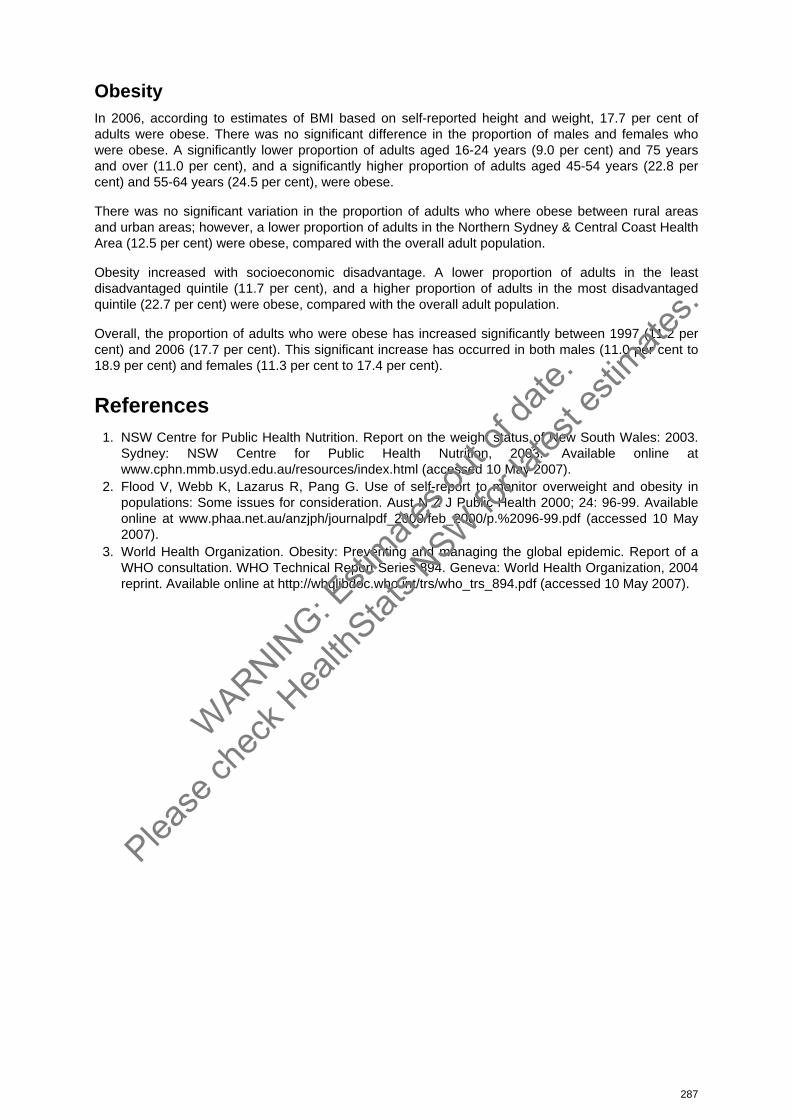
ObesityIn 2006, according to estimates of BMI based on self-reported height and weight, 17.7 per cent ofadults were obese. There was no significant difference in the proportion of males and females whowere obese. A significantly lower proportion of adults aged 16-24 years (9.0 per cent) and 75 yearsand over (11.0 per cent), and a significantly higher proportion of adults aged 45-54 years (22.8 percent) and 55-64 years (24.5 per cent), were obese.
There was no significant variation in the proportion of adults who where obese between rural areasand urban areas; however, a lower proportion of adults in the Northern Sydney & Central Coast HealthArea (12.5 per cent) were obese, compared with the overall adult population.
Obesity increased with socioeconomic disadvantage. A lower proportion of adults in the leastdisadvantaged quintile (11.7 per cent), and a higher proportion of adults in the most disadvantagedquintile (22.7 per cent) were obese, compared with the overall adult population.
Overall, the proportion of adults who were obese has increased significantly between 1997 (11.2 percent) and 2006 (17.7 per cent). This significant increase has occurred in both males (11.0 per cent to18.9 per cent) and females (11.3 per cent to 17.4 per cent).
References1. NSW Centre for Public Health Nutrition. Report on the weight status of New South Wales: 2003.
Sydney: NSW Centre for Public Health Nutrition, 2003. Available online atwww.cphn.mmb.usyd.edu.au/resources/index.html (accessed 10 May 2007).
2. Flood V, Webb K, Lazarus R, Pang G. Use of self-report to monitor overweight and obesity inpopulations: Some issues for consideration. Aust N Z J Public Health 2000; 24: 96-99. Availableonline at www.phaa.net.au/anzjph/journalpdf_2000/feb_2000/p.%2096-99.pdf (accessed 10 May2007).
3. World Health Organization. Obesity: Preventing and managing the global epidemic. Report of aWHO consultation. WHO Technical Report Series 894. Geneva: World Health Organization, 2004reprint. Available online at http://whqlibdoc.who.int/trs/who_trs_894.pdf (accessed 10 May 2007).
287
WARNIN
G: Esti
mates o
ut of
date.
Please
chec
k Hea
lthStat
s NSW
for la
test e
stimate
s.
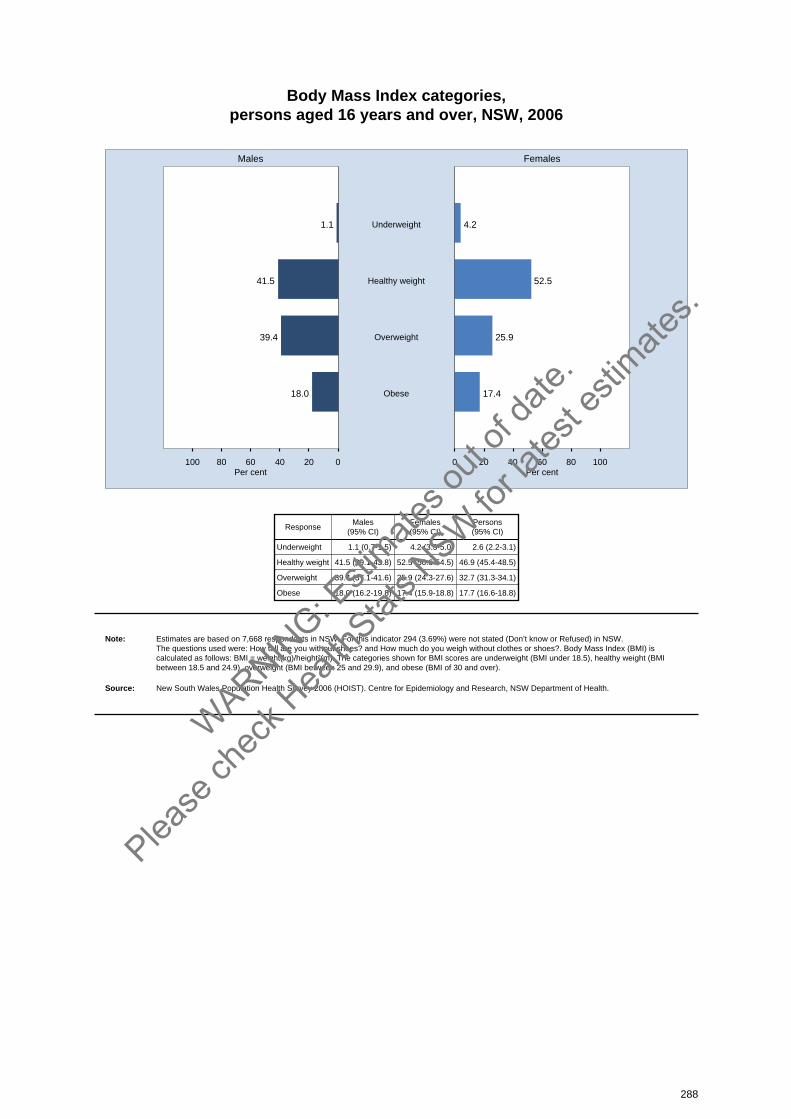
Body Mass Index categories, persons aged 16 years and over, NSW, 2006
020406080100 0 20 40 60 80 100
Males Females
Per cent Per cent
1.1 4.2Underweight
41.5 52.5Healthy weight
39.4 25.9Overweight
18.0 17.4Obese
ResponseMales
(95% CI)Females(95% CI)
Persons(95% CI)
Underweight 1.1 (0.7-1.5) 4.2 (3.3-5.0) 2.6 (2.2-3.1)
Healthy weight 41.5 (39.1-43.8) 52.5 (50.6-54.5) 46.9 (45.4-48.5)
Overweight 39.4 (37.1-41.6) 25.9 (24.3-27.6) 32.7 (31.3-34.1)
Obese 18.0 (16.2-19.8) 17.4 (15.9-18.8) 17.7 (16.6-18.8)
Note: Estimates are based on 7,668 respondents in NSW. For this indicator 294 (3.69%) were not stated (Don’t know or Refused) in NSW. The questions used were: How tall are you without shoes? and How much do you weigh without clothes or shoes?. Body Mass Index (BMI) iscalculated as follows: BMI = weight(kg)/height²(m). The categories shown for BMI scores are underweight (BMI under 18.5), healthy weight (BMIbetween 18.5 and 24.9), overweight (BMI between 25 and 29.9), and obese (BMI of 30 and over).
Source: New South Wales Population Health Survey 2006 (HOIST). Centre for Epidemiology and Research, NSW Department of Health.
288
WARNIN
G: Esti
mates o
ut of
date.
Please
chec
k Hea
lthStat
s NSW
for la
test e
stimate
s.
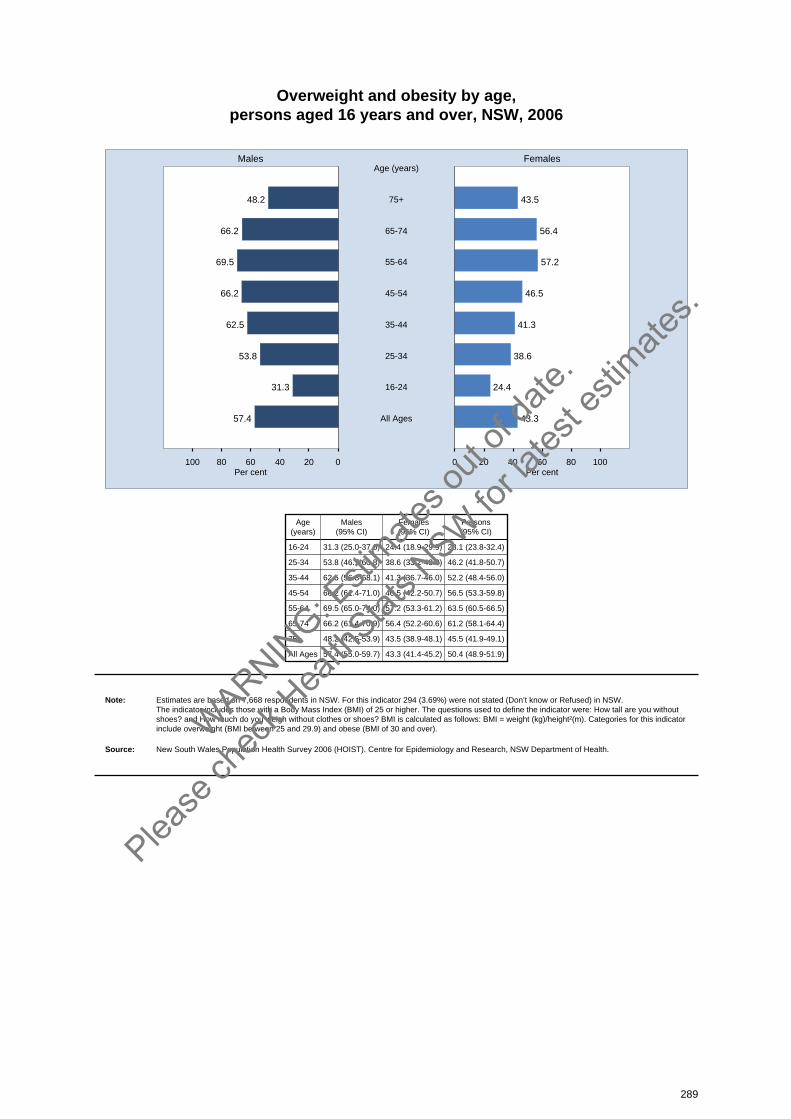
Overweight and obesity by age, persons aged 16 years and over, NSW, 2006
020406080100 0 20 40 60 80 100
Males Females
Per cent Per cent
48.2 43.575+
Age (years)
66.2 56.465-74
69.5 57.255-64
66.2 46.545-54
62.5 41.335-44
53.8 38.625-34
31.3 24.416-24
57.4 43.3All Ages
Age(years)
Males(95% CI)
Females(95% CI)
Persons(95% CI)
16-24 31.3 (25.0-37.6) 24.4 (18.9-29.9) 28.1 (23.8-32.4)
25-34 53.8 (46.7-60.8) 38.6 (33.2-43.9) 46.2 (41.8-50.7)
35-44 62.5 (56.8-68.1) 41.3 (36.7-46.0) 52.2 (48.4-56.0)
45-54 66.2 (61.4-71.0) 46.5 (42.2-50.7) 56.5 (53.3-59.8)
55-64 69.5 (65.0-74.0) 57.2 (53.3-61.2) 63.5 (60.5-66.5)
65-74 66.2 (61.4-70.9) 56.4 (52.2-60.6) 61.2 (58.1-64.4)
75+ 48.2 (42.5-53.9) 43.5 (38.9-48.1) 45.5 (41.9-49.1)
All Ages 57.4 (55.0-59.7) 43.3 (41.4-45.2) 50.4 (48.9-51.9)
Note: Estimates are based on 7,668 respondents in NSW. For this indicator 294 (3.69%) were not stated (Don’t know or Refused) in NSW. The indicator includes those with a Body Mass Index (BMI) of 25 or higher. The questions used to define the indicator were: How tall are you withoutshoes? and How much do you weigh without clothes or shoes? BMI is calculated as follows: BMI = weight (kg)/height²(m). Categories for this indicatorinclude overweight (BMI between 25 and 29.9) and obese (BMI of 30 and over).
Source: New South Wales Population Health Survey 2006 (HOIST). Centre for Epidemiology and Research, NSW Department of Health.
289
WARNIN
G: Esti
mates o
ut of
date.
Please
chec
k Hea
lthStat
s NSW
for la
test e
stimate
s.

Overweight and obesity by socioeconomic disadvantage, persons aged 16 years and over, NSW, 2006
020406080100 0 20 40 60 80 100
Males Females
Per cent Per cent
59.7 49.05th Quintile
most disadvantaged
59.3 46.84th Quintile
62.9 47.63rd Quintile
56.0 42.32nd Quintile
49.6 32.01st Quintile
least disadvantaged
57.4 43.3NSW
Quintile ofsocioeconomicdisadvantage
Males(95% CI)
Females(95% CI)
Persons(95% CI)
5th Quintile 59.7 (54.3-65.1) 49.0 (44.5-53.4) 54.3 (50.8-57.8)
4th Quintile 59.3 (54.5-64.2) 46.8 (42.8-50.7) 53.0 (49.8-56.1)
3rd Quintile 62.9 (58.1-67.7) 47.6 (43.2-51.9) 55.5 (52.2-58.8)
2nd Quintile 56.0 (50.9-61.1) 42.3 (38.2-46.5) 49.1 (45.8-52.4)
1st Quintile 49.6 (43.7-55.6) 32.0 (27.8-36.1) 41.1 (37.4-44.8)
NSW 57.4 (55.0-59.7) 43.3 (41.4-45.2) 50.4 (48.9-51.9)
Note: Estimates are based on 7,668 respondents in NSW. For this indicator 294 (3.69%) were not stated (Don’t know or Refused) in NSW. The indicator includes those with a Body Mass Index (BMI) of 25 or higher. The questions used to define the indicator were: How tall are you withoutshoes? and How much do you weigh without clothes or shoes? BMI is calculated as follows: BMI = weight (kg)/height²(m). Categories for this indicatorinclude overweight (BMI between 25 and 29.9) and obese (BMI of 30 and over).
Source: New South Wales Population Health Survey 2006 (HOIST). Centre for Epidemiology and Research, NSW Department of Health.
290
WARNIN
G: Esti
mates o
ut of
date.
Please
chec
k Hea
lthStat
s NSW
for la
test e
stimate
s.
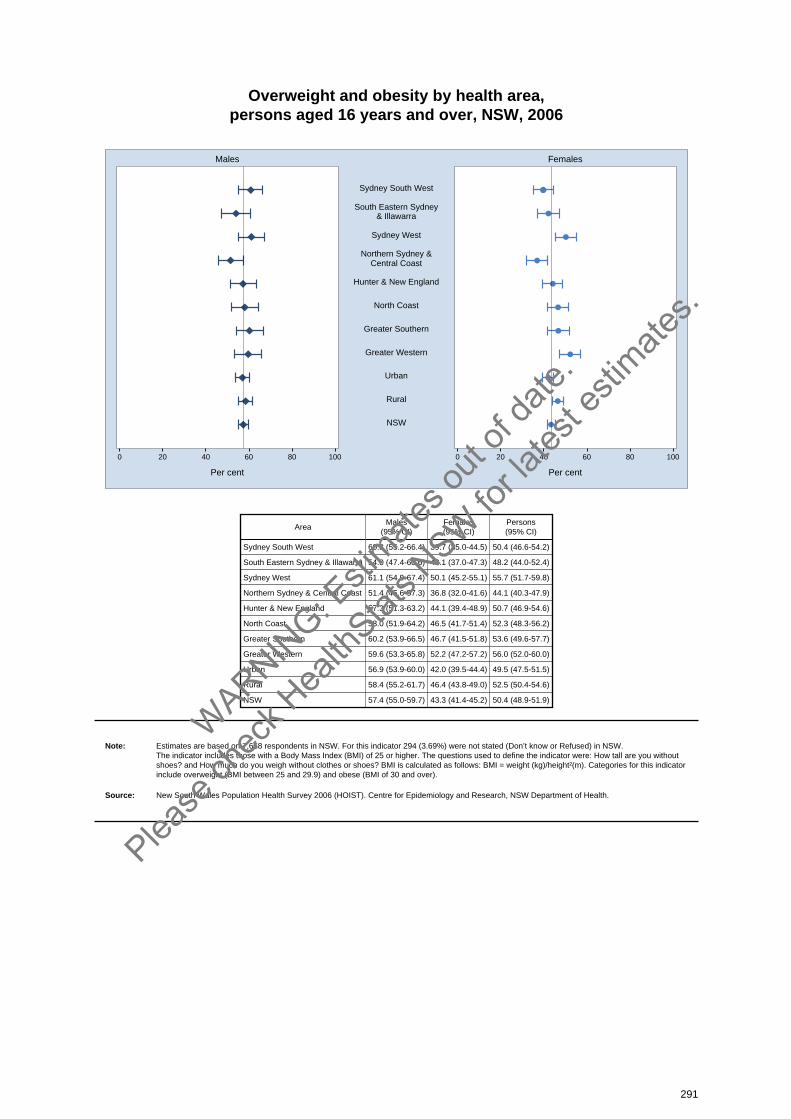
Overweight and obesity by health area, persons aged 16 years and over, NSW, 2006
0 20 40 60 80 100 0 20 40 60 80 100
Males Females
Per cent Per cent
Sydney South West
South Eastern Sydney& Illawarra
Sydney West
Northern Sydney &Central Coast
Hunter & New England
North Coast
Greater Southern
Greater Western
Urban
Rural
NSW
AreaMales
(95% CI)Females(95% CI)
Persons(95% CI)
Sydney South West 60.8 (55.2-66.4) 39.7 (35.0-44.5) 50.4 (46.6-54.2)
South Eastern Sydney & Illawarra 54.0 (47.4-60.6) 42.1 (37.0-47.3) 48.2 (44.0-52.4)
Sydney West 61.1 (54.9-67.4) 50.1 (45.2-55.1) 55.7 (51.7-59.8)
Northern Sydney & Central Coast 51.4 (45.6-57.3) 36.8 (32.0-41.6) 44.1 (40.3-47.9)
Hunter & New England 57.3 (51.3-63.2) 44.1 (39.4-48.9) 50.7 (46.9-54.6)
North Coast 58.0 (51.9-64.2) 46.5 (41.7-51.4) 52.3 (48.3-56.2)
Greater Southern 60.2 (53.9-66.5) 46.7 (41.5-51.8) 53.6 (49.6-57.7)
Greater Western 59.6 (53.3-65.8) 52.2 (47.2-57.2) 56.0 (52.0-60.0)
Urban 56.9 (53.9-60.0) 42.0 (39.5-44.4) 49.5 (47.5-51.5)
Rural 58.4 (55.2-61.7) 46.4 (43.8-49.0) 52.5 (50.4-54.6)
NSW 57.4 (55.0-59.7) 43.3 (41.4-45.2) 50.4 (48.9-51.9)
Note: Estimates are based on 7,668 respondents in NSW. For this indicator 294 (3.69%) were not stated (Don’t know or Refused) in NSW. The indicator includes those with a Body Mass Index (BMI) of 25 or higher. The questions used to define the indicator were: How tall are you withoutshoes? and How much do you weigh without clothes or shoes? BMI is calculated as follows: BMI = weight (kg)/height²(m). Categories for this indicatorinclude overweight (BMI between 25 and 29.9) and obese (BMI of 30 and over).
Source: New South Wales Population Health Survey 2006 (HOIST). Centre for Epidemiology and Research, NSW Department of Health.
291
WARNIN
G: Esti
mates o
ut of
date.
Please
chec
k Hea
lthStat
s NSW
for la
test e
stimate
s.
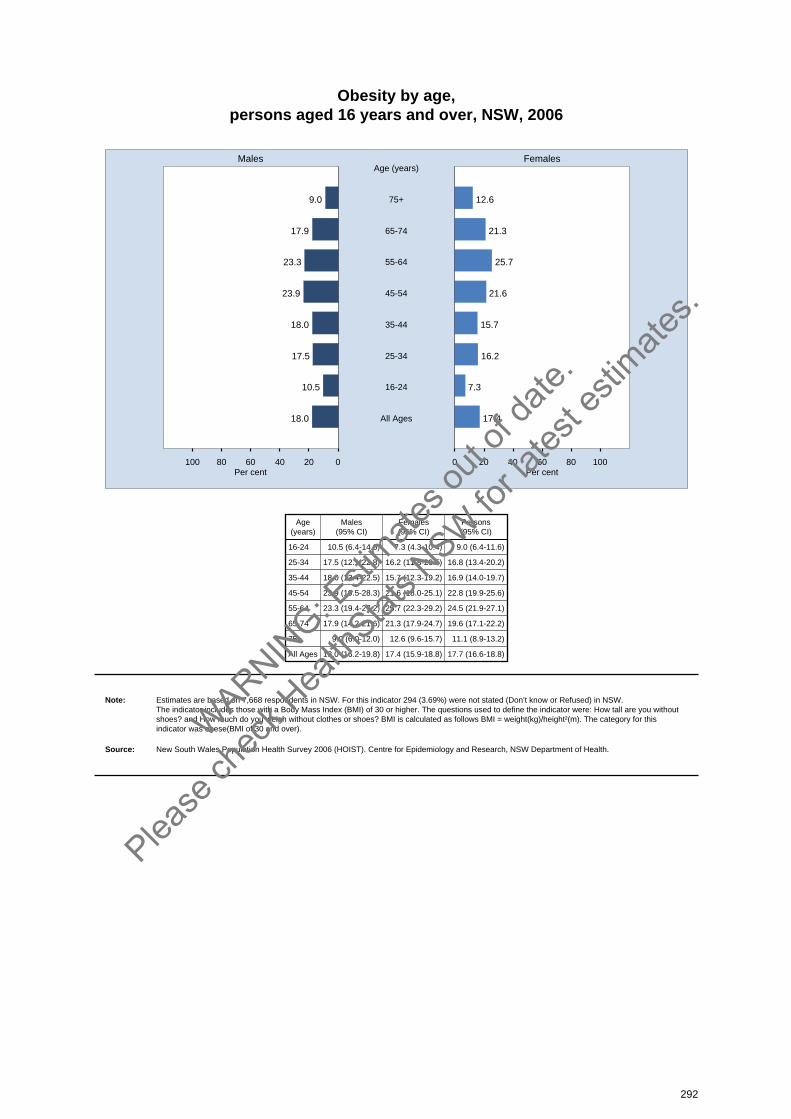
Obesity by age, persons aged 16 years and over, NSW, 2006
020406080100 0 20 40 60 80 100
Males Females
Per cent Per cent
9.0 12.675+
Age (years)
17.9 21.365-74
23.3 25.755-64
23.9 21.645-54
18.0 15.735-44
17.5 16.225-34
10.5 7.316-24
18.0 17.4All Ages
Age(years)
Males(95% CI)
Females(95% CI)
Persons(95% CI)
16-24 10.5 (6.4-14.6) 7.3 (4.3-10.4) 9.0 (6.4-11.6)
25-34 17.5 (12.1-22.8) 16.2 (11.8-20.5) 16.8 (13.4-20.2)
35-44 18.0 (13.4-22.5) 15.7 (12.3-19.2) 16.9 (14.0-19.7)
45-54 23.9 (19.5-28.3) 21.6 (18.0-25.1) 22.8 (19.9-25.6)
55-64 23.3 (19.4-27.2) 25.7 (22.3-29.2) 24.5 (21.9-27.1)
65-74 17.9 (14.2-21.6) 21.3 (17.9-24.7) 19.6 (17.1-22.2)
75+ 9.0 (6.0-12.0) 12.6 (9.6-15.7) 11.1 (8.9-13.2)
All Ages 18.0 (16.2-19.8) 17.4 (15.9-18.8) 17.7 (16.6-18.8)
Note: Estimates are based on 7,668 respondents in NSW. For this indicator 294 (3.69%) were not stated (Don’t know or Refused) in NSW. The indicator includes those with a Body Mass Index (BMI) of 30 or higher. The questions used to define the indicator were: How tall are you withoutshoes? and How much do you weigh without clothes or shoes? BMI is calculated as follows BMI = weight(kg)/height²(m). The category for thisindicator was obese(BMI of 30 and over).
Source: New South Wales Population Health Survey 2006 (HOIST). Centre for Epidemiology and Research, NSW Department of Health.
292
WARNIN
G: Esti
mates o
ut of
date.
Please
chec
k Hea
lthStat
s NSW
for la
test e
stimate
s.
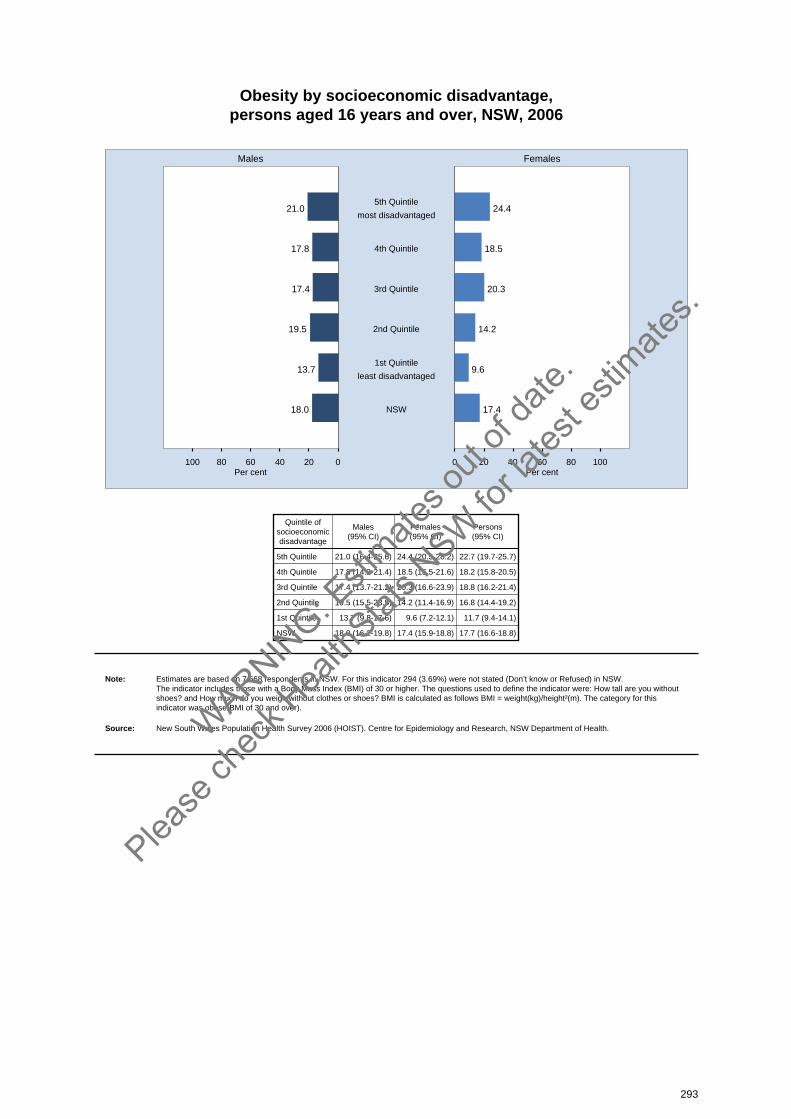
Obesity by socioeconomic disadvantage, persons aged 16 years and over, NSW, 2006
020406080100 0 20 40 60 80 100
Males Females
Per cent Per cent
21.0 24.45th Quintile
most disadvantaged
17.8 18.54th Quintile
17.4 20.33rd Quintile
19.5 14.22nd Quintile
13.7 9.61st Quintile
least disadvantaged
18.0 17.4NSW
Quintile ofsocioeconomicdisadvantage
Males(95% CI)
Females(95% CI)
Persons(95% CI)
5th Quintile 21.0 (16.4-25.6) 24.4 (20.5-28.2) 22.7 (19.7-25.7)
4th Quintile 17.8 (14.2-21.4) 18.5 (15.5-21.6) 18.2 (15.8-20.5)
3rd Quintile 17.4 (13.7-21.2) 20.3 (16.6-23.9) 18.8 (16.2-21.4)
2nd Quintile 19.5 (15.5-23.5) 14.2 (11.4-16.9) 16.8 (14.4-19.2)
1st Quintile 13.7 (9.8-17.6) 9.6 (7.2-12.1) 11.7 (9.4-14.1)
NSW 18.0 (16.2-19.8) 17.4 (15.9-18.8) 17.7 (16.6-18.8)
Note: Estimates are based on 7,668 respondents in NSW. For this indicator 294 (3.69%) were not stated (Don’t know or Refused) in NSW. The indicator includes those with a Body Mass Index (BMI) of 30 or higher. The questions used to define the indicator were: How tall are you withoutshoes? and How much do you weigh without clothes or shoes? BMI is calculated as follows BMI = weight(kg)/height²(m). The category for thisindicator was obese(BMI of 30 and over).
Source: New South Wales Population Health Survey 2006 (HOIST). Centre for Epidemiology and Research, NSW Department of Health.
293
WARNIN
G: Esti
mates o
ut of
date.
Please
chec
k Hea
lthStat
s NSW
for la
test e
stimate
s.
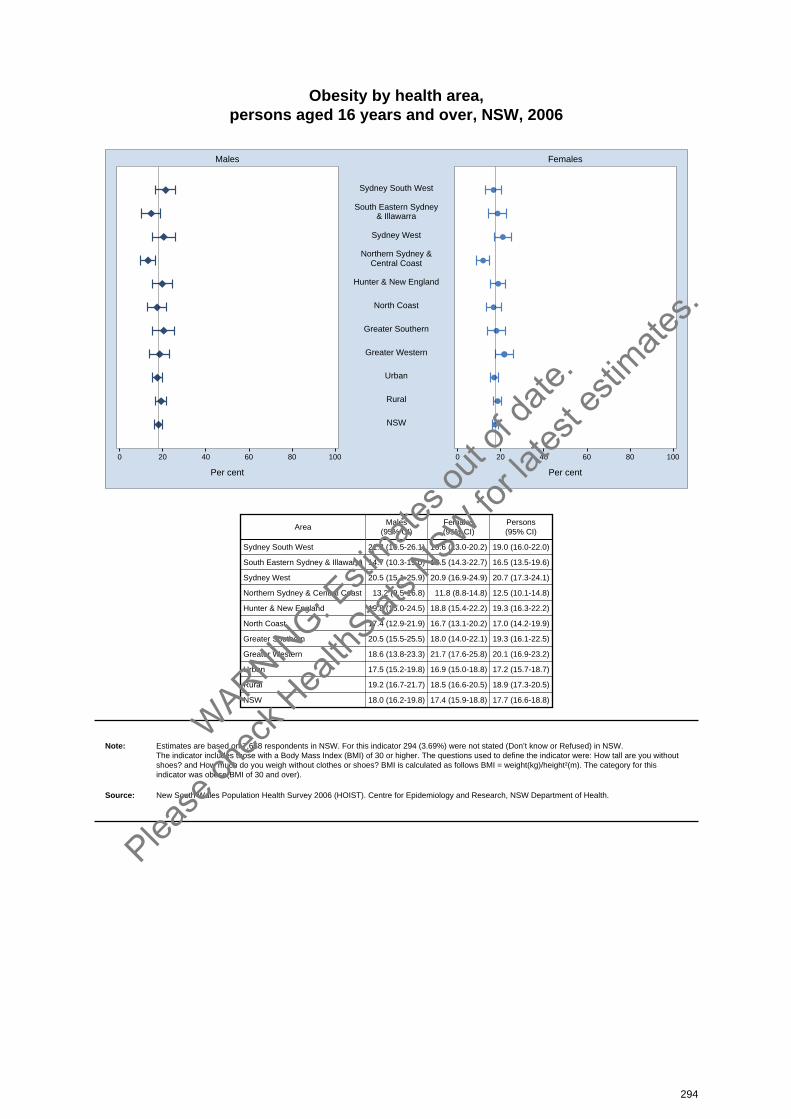
Obesity by health area, persons aged 16 years and over, NSW, 2006
0 20 40 60 80 100 0 20 40 60 80 100
Males Females
Per cent Per cent
Sydney South West
South Eastern Sydney& Illawarra
Sydney West
Northern Sydney &Central Coast
Hunter & New England
North Coast
Greater Southern
Greater Western
Urban
Rural
NSW
AreaMales
(95% CI)Females(95% CI)
Persons(95% CI)
Sydney South West 21.3 (16.5-26.1) 16.6 (13.0-20.2) 19.0 (16.0-22.0)
South Eastern Sydney & Illawarra 14.7 (10.3-19.0) 18.5 (14.3-22.7) 16.5 (13.5-19.6)
Sydney West 20.5 (15.1-25.9) 20.9 (16.9-24.9) 20.7 (17.3-24.1)
Northern Sydney & Central Coast 13.2 (9.5-16.8) 11.8 (8.8-14.8) 12.5 (10.1-14.8)
Hunter & New England 19.8 (15.0-24.5) 18.8 (15.4-22.2) 19.3 (16.3-22.2)
North Coast 17.4 (12.9-21.9) 16.7 (13.1-20.2) 17.0 (14.2-19.9)
Greater Southern 20.5 (15.5-25.5) 18.0 (14.0-22.1) 19.3 (16.1-22.5)
Greater Western 18.6 (13.8-23.3) 21.7 (17.6-25.8) 20.1 (16.9-23.2)
Urban 17.5 (15.2-19.8) 16.9 (15.0-18.8) 17.2 (15.7-18.7)
Rural 19.2 (16.7-21.7) 18.5 (16.6-20.5) 18.9 (17.3-20.5)
NSW 18.0 (16.2-19.8) 17.4 (15.9-18.8) 17.7 (16.6-18.8)
Note: Estimates are based on 7,668 respondents in NSW. For this indicator 294 (3.69%) were not stated (Don’t know or Refused) in NSW. The indicator includes those with a Body Mass Index (BMI) of 30 or higher. The questions used to define the indicator were: How tall are you withoutshoes? and How much do you weigh without clothes or shoes? BMI is calculated as follows BMI = weight(kg)/height²(m). The category for thisindicator was obese(BMI of 30 and over).
Source: New South Wales Population Health Survey 2006 (HOIST). Centre for Epidemiology and Research, NSW Department of Health.
294
WARNIN
G: Esti
mates o
ut of
date.
Please
chec
k Hea
lthStat
s NSW
for la
test e
stimate
s.

Self-rated health status
IntroductionSelf-rated health is among the most frequently assessed health perceptions in epidemiologicalresearch. A large number of empirical studies have demonstrated how a person’s appraisal of his orher general health is a powerful predictor of future morbidity and mortality, even after controlling for avariety of physical and psychosocial and socioeconomic factors.[1] Self-rated health is believed toprincipally reflect physical health problems (acute and chronic conditions and physical functioning)and, to a lesser extent, health behaviours and mental health problems.[2,3] Longitudinal studies showself-rated health is a strong and independent predictor of subsequent illness and premature death.[3,4]
In 2006, the New South Wales Population Health Survey asked respondents aged 16 years and over:Overall, how would you rate your health during the last 4 weeks: Was it Excellent, Very good, Good,Fair, Poor or Very poor?
Results
Self-rated health status
Overall, in 2006, 22.1 per cent of adults rated their health in the last 4 weeks excellent, 30.0 per centvery good, 28.1 per cent good, 13.7 per cent fair, 4.8 per cent poor, and 1.1 per cent very poor. Whenratings of excellent and very good and good were combined to give an overall positive rating, 80.3 percent of adults rated their health positively. A significantly lower proportion of females (78.1 per cent)than males (82.5 per cent) rated their health positively. Among males, a significantly higher proportionof adults aged 16-24 years (87.4 per cent) and 25-34 years (88.9 per cent), and a significantly lowerproportion of adults aged 65-74 years (77.4 per cent) and 75 years and over (64.9 per cent), ratedtheir health positively, compared with the overall adult male population. Among females, a significantlyhigher proportion of adults aged 35-44 years (82.4 per cent), and a significantly lower proportion ofadults aged 65-74 years (74.1 per cent) and 75 years and over (64.5 per cent), rated their healthpositively, compared with the overall adult female population.
The proportion of adults rating their health positively did not differ significantly between urban areasand rural areas; however, a lower proportion of adults in the Sydney South West Health Area (77.0 percent) rated their health positively, compared with the overall adult population.
A positive rating for self-rated health decreased with socioeconomic disadvantage. A higher proportionof adults in the least disadvantaged quintile (86.2 per cent), and a lower proportion of adults in themost disadvantaged quintile (74.9 per cent), rated their health positively, compared with the overalladult population.
The proportion of adults who rated their health positively decreased significantly from 1997 (85.0 percent) to 2006 (80.3 per cent). The significant decrease was observed in both males (85.0 per cent to82.5 per cent) and females (85.1 per cent to 78.1 per cent).
Chronic disease risk factors
An index of chronic disease risk factors was calculated using the following indicators: any alcohol riskdrinking, recommended daily fruit or vegetable intake, inadequate physical activity, current smoking,and obesity. Using the index 17.0 per cent of adults had no risk factors, 33.9 per cent had one riskfactor, 29.1 per cent had 2 risk factors, 15.5 per cent had 3 risk factors, 3.8 per cent had 4 risk factors,and 0.8 per cent had 5 risk factors.
Overall, in 2006, 20.1 per cent of adults had 3 or more chronic disease risk factors. A significantlylower proportion of females (16.8 per cent) than males (23.3 per cent) had 3 or more chronic diseaserisk factors. Among males, a significantly lower proportion of adults aged 65-74 years (18.5 per cent)and 75 years and over (12.5 per cent) had 3 or more chronic disease risk factors, compared with theoverall adult male population. Among females, a significantly higher proportion of adults aged 25-34
295
WARNIN
G: Esti
mates o
ut of
date.
Please
chec
k Hea
lthStat
s NSW
for la
test e
stimate
s.
years (21.8 per cent), and a significantly lower proportion of adults aged 65-74 years (10.1 per cent)and 75 years and over (9.7 per cent), had 3 or more chronic disease risk factors, compared with theoverall adult female population.
A significantly higher proportion of adults in rural areas (22.1 per cent) than urban areas (19.2 percent) had 3 or more chronic disease risk factors. A higher proportion of adults in the Greater Southern(25.0 per cent) and Greater Western (25.1 per cent) Health Areas had 3 or more chronic disease riskfactors, compared with the overall adult population.
The proportion of adults with 3 or more chronic disease risk factors increased with socioeconomicdisadvantage. A lower proportion of adults in the least disadvantaged quintile (15.8 per cent), and ahigher proportion of adults in the most disadvantaged quintile (23.8 per cent), had 3 or more chronicdisease risk factors, compared with the overall adult population.
The proportion of adults who had 3 or more chronic disease risk factors has decreased significantlybetween 2002 (34.9 per cent) to 2006 (20.1 per cent). The significant decrease was observed in bothmales (39.6 per cent to 23.3 per cent) and females (30.2 per cent to 16.8 per cent).
References1. Eriksson I, Unden A-L, and Elofsson S. Self-rated health. Comparisons between three different
measures. Results from a population study. Int J Epidemiol 2001; 30: 326-333. Abstract availableonline at http://ije.oxfordjournals.org/cgi/content/abstract/30/2/326 (accessed 10 May 2007).
2. Krause NM and Jay GM. What do global self-rated health items measure? J Med Care 1994; 32:930-942. Abstract available online atwww.ncbi.nlm.nih.gov/entrez/query.fcgi?cmd=Retrieve&db=PubMed&dopt=Abstract&list_uids=8090045(accessed 10 May 2007.
3. Cott CA, Gignac MA, Badley EM. Determinants of self rated health for Canadians with chronicdisease and disability. J Epidemiol Community Health 1999; 53: 731-736. Abstract availableonline at http://jech.bmj.com/cgi/content/abstract/53/11/731 (accessed 10 May 2007).
4. McCallum J, Shadbolt B, Wang D. Self-rated health and survival: A 7-year follow up study ofAustralian elderly. Am J Public Health 1994; 84: 1100-1105. Available online atwww.pubmedcentral.nih.gov/articlerender.fcgi?artid=1614762 (accessed 10 May 2007).
296
WARNIN
G: Esti
mates o
ut of
date.
Please
chec
k Hea
lthStat
s NSW
for la
test e
stimate
s.
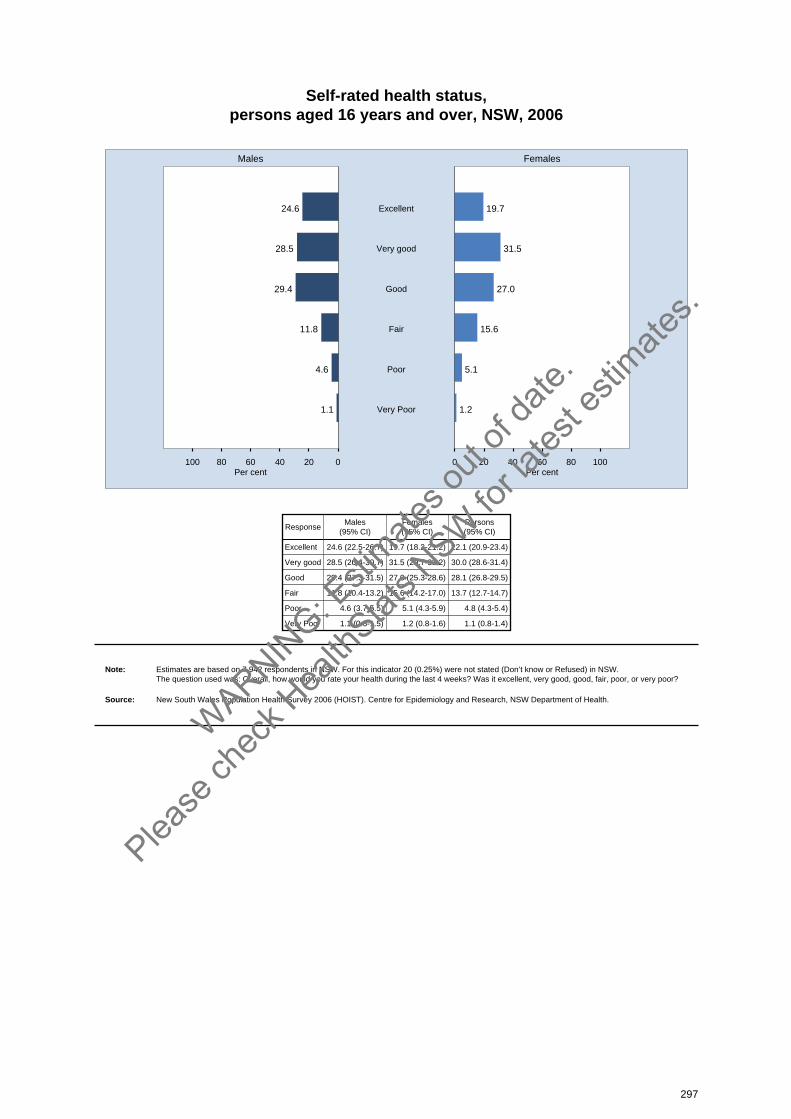
Self-rated health status, persons aged 16 years and over, NSW, 2006
020406080100 0 20 40 60 80 100
Males Females
Per cent Per cent
24.6 19.7Excellent
28.5 31.5Very good
29.4 27.0Good
11.8 15.6Fair
4.6 5.1Poor
1.1 1.2Very Poor
ResponseMales
(95% CI)Females(95% CI)
Persons(95% CI)
Excellent 24.6 (22.5-26.7) 19.7 (18.2-21.2) 22.1 (20.9-23.4)
Very good 28.5 (26.4-30.7) 31.5 (29.7-33.2) 30.0 (28.6-31.4)
Good 29.4 (27.3-31.5) 27.0 (25.3-28.6) 28.1 (26.8-29.5)
Fair 11.8 (10.4-13.2) 15.6 (14.2-17.0) 13.7 (12.7-14.7)
Poor 4.6 (3.7-5.5) 5.1 (4.3-5.9) 4.8 (4.3-5.4)
Very Poor 1.1 (0.6-1.5) 1.2 (0.8-1.6) 1.1 (0.8-1.4)
Note: Estimates are based on 7,942 respondents in NSW. For this indicator 20 (0.25%) were not stated (Don’t know or Refused) in NSW. The question used was: Overall, how would you rate your health during the last 4 weeks? Was it excellent, very good, good, fair, poor, or very poor?
Source: New South Wales Population Health Survey 2006 (HOIST). Centre for Epidemiology and Research, NSW Department of Health.
297
WARNIN
G: Esti
mates o
ut of
date.
Please
chec
k Hea
lthStat
s NSW
for la
test e
stimate
s.

Excellent, very good, or good self-rated health status by age, persons aged 16 years and over, NSW, 2006
020406080100 0 20 40 60 80 100
Males Females
Per cent Per cent
64.9 64.575+
Age (years)
77.4 74.165-74
78.9 76.855-64
80.1 80.145-54
85.8 82.435-44
88.9 80.025-34
87.4 80.116-24
82.5 78.1All Ages
Age(years)
Males(95% CI)
Females(95% CI)
Persons(95% CI)
16-24 87.4 (83.2-91.6) 80.1 (75.1-85.2) 83.9 (80.6-87.2)
25-34 88.9 (84.5-93.3) 80.0 (75.5-84.4) 84.4 (81.2-87.6)
35-44 85.8 (82.0-89.7) 82.4 (78.7-86.0) 84.1 (81.4-86.8)
45-54 80.1 (76.2-84.1) 80.1 (76.8-83.4) 80.1 (77.5-82.7)
55-64 78.9 (75.1-82.8) 76.8 (73.5-80.2) 77.9 (75.4-80.5)
65-74 77.4 (73.2-81.6) 74.1 (70.4-77.7) 75.7 (72.9-78.5)
75+ 64.9 (59.4-70.4) 64.5 (60.1-68.8) 64.6 (61.2-68.1)
All Ages 82.5 (80.9-84.2) 78.1 (76.6-79.7) 80.3 (79.2-81.4)
Note: Estimates are based on 7,942 respondents in NSW. For this indicator 20 (0.25%) were not stated (Don’t know or Refused) in NSW. The indicator includes those responding excellent, very good, or good to a global self-rated health status question. The question used to define theindicator was: Overall, how would you rate your health during the last 4 weeks? Was it excellent, very good, good, fair, poor, or very poor? Thequestion used to define the indicator in 1997 and 1998 was: In general would you say your health is excellent, very good, good, fair, or poor?
Source: New South Wales Population Health Survey 2006 (HOIST). Centre for Epidemiology and Research, NSW Department of Health.
298
WARNIN
G: Esti
mates o
ut of
date.
Please
chec
k Hea
lthStat
s NSW
for la
test e
stimate
s.
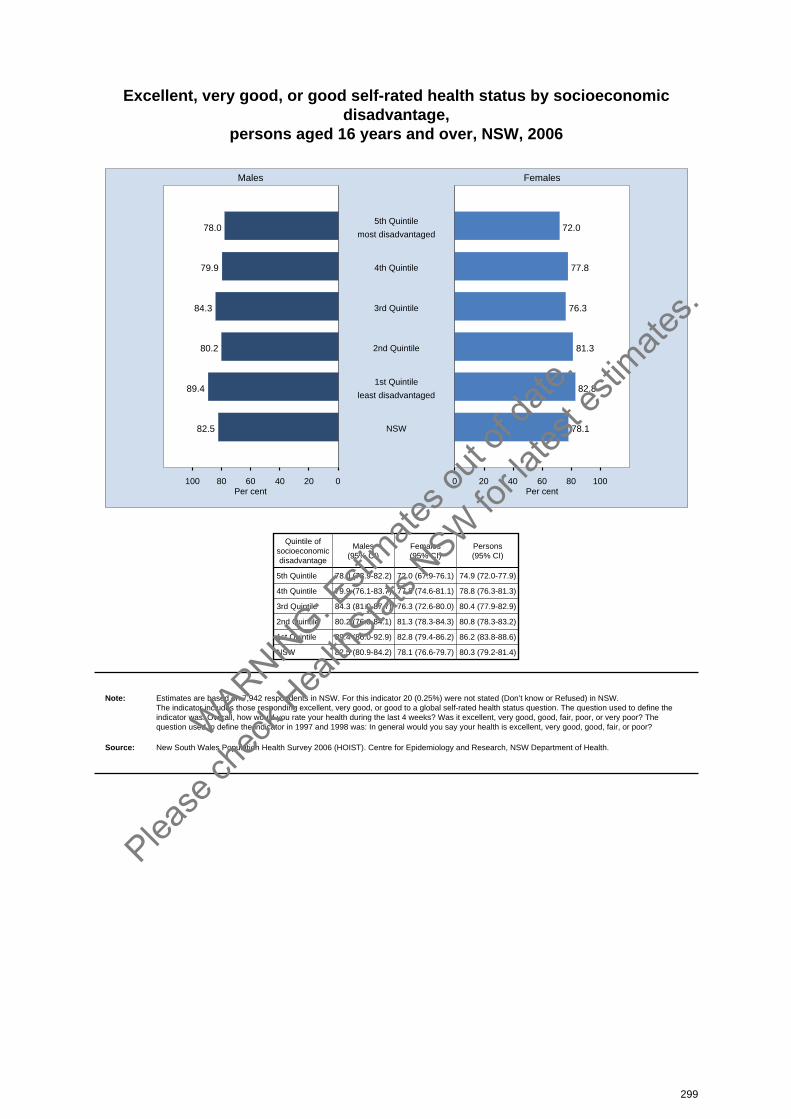
Excellent, very good, or good self-rated health status by socioeconomicdisadvantage,
persons aged 16 years and over, NSW, 2006
020406080100 0 20 40 60 80 100
Males Females
Per cent Per cent
78.0 72.05th Quintile
most disadvantaged
79.9 77.84th Quintile
84.3 76.33rd Quintile
80.2 81.32nd Quintile
89.4 82.81st Quintile
least disadvantaged
82.5 78.1NSW
Quintile ofsocioeconomicdisadvantage
Males(95% CI)
Females(95% CI)
Persons(95% CI)
5th Quintile 78.0 (73.9-82.2) 72.0 (67.9-76.1) 74.9 (72.0-77.9)
4th Quintile 79.9 (76.1-83.7) 77.8 (74.6-81.1) 78.8 (76.3-81.3)
3rd Quintile 84.3 (81.0-87.7) 76.3 (72.6-80.0) 80.4 (77.9-82.9)
2nd Quintile 80.2 (76.3-84.1) 81.3 (78.3-84.3) 80.8 (78.3-83.2)
1st Quintile 89.4 (86.0-92.9) 82.8 (79.4-86.2) 86.2 (83.8-88.6)
NSW 82.5 (80.9-84.2) 78.1 (76.6-79.7) 80.3 (79.2-81.4)
Note: Estimates are based on 7,942 respondents in NSW. For this indicator 20 (0.25%) were not stated (Don’t know or Refused) in NSW. The indicator includes those responding excellent, very good, or good to a global self-rated health status question. The question used to define theindicator was: Overall, how would you rate your health during the last 4 weeks? Was it excellent, very good, good, fair, poor, or very poor? Thequestion used to define the indicator in 1997 and 1998 was: In general would you say your health is excellent, very good, good, fair, or poor?
Source: New South Wales Population Health Survey 2006 (HOIST). Centre for Epidemiology and Research, NSW Department of Health.
299
WARNIN
G: Esti
mates o
ut of
date.
Please
chec
k Hea
lthStat
s NSW
for la
test e
stimate
s.

Excellent, very good, or good self-rated health status by health area, persons aged 16 years and over, NSW, 2006
0 20 40 60 80 100 0 20 40 60 80 100
Males Females
Per cent Per cent
Sydney South West
South Eastern Sydney& Illawarra
Sydney West
Northern Sydney &Central Coast
Hunter & New England
North Coast
Greater Southern
Greater Western
Urban
Rural
NSW
AreaMales
(95% CI)Females(95% CI)
Persons(95% CI)
Sydney South West 81.5 (77.3-85.7) 72.7 (68.3-77.0) 77.0 (74.0-80.1)
South Eastern Sydney & Illawarra 79.8 (74.9-84.6) 80.6 (76.6-84.5) 80.2 (77.0-83.3)
Sydney West 85.9 (82.0-89.8) 77.6 (73.5-81.8) 81.8 (78.9-84.7)
Northern Sydney & Central Coast 85.8 (82.0-89.5) 80.1 (76.3-84.0) 82.9 (80.2-85.6)
Hunter & New England 80.8 (76.3-85.3) 80.6 (77.3-84.0) 80.7 (77.9-83.5)
North Coast 80.4 (75.7-85.1) 81.1 (77.7-84.6) 80.8 (77.9-83.7)
Greater Southern 81.8 (77.2-86.4) 75.2 (70.8-79.6) 78.5 (75.3-81.7)
Greater Western 83.1 (78.7-87.6) 79.9 (76.0-83.9) 81.6 (78.6-84.5)
Urban 83.0 (80.9-85.2) 77.6 (75.5-79.6) 80.3 (78.8-81.8)
Rural 81.3 (78.9-83.7) 79.5 (77.5-81.4) 80.4 (78.8-81.9)
NSW 82.5 (80.9-84.2) 78.1 (76.6-79.7) 80.3 (79.2-81.4)
Note: Estimates are based on 7,942 respondents in NSW. For this indicator 20 (0.25%) were not stated (Don’t know or Refused) in NSW. The indicator includes those responding excellent, very good, or good to a global self-rated health status question. The question used to define theindicator was: Overall, how would you rate your health during the last 4 weeks? Was it excellent, very good, good, fair, poor, or very poor? Thequestion used to define the indicator in 1997 and 1998 was: In general would you say your health is excellent, very good, good, fair, or poor?
Source: New South Wales Population Health Survey 2006 (HOIST). Centre for Epidemiology and Research, NSW Department of Health.
300
WARNIN
G: Esti
mates o
ut of
date.
Please
chec
k Hea
lthStat
s NSW
for la
test e
stimate
s.

Chronic disease risk factors, persons aged 16 years and over, NSW, 2006
020406080100 0 20 40 60 80 100
Males Females
Per cent Per cent
15.6 18.4No risk factors
31.8 36.01 risk factor
29.4 28.72 risk factors
18.2 12.83 risk factors
4.3 3.34 risk factors
0.8 0.75 risk factors
ResponseMales
(95% CI)Females(95% CI)
Persons(95% CI)
No risk factors 15.6 (13.8-17.3) 18.4 (16.9-20.0) 17.0 (15.8-18.1)
1 risk factor 31.8 (29.5-34.1) 36.0 (34.1-37.9) 33.9 (32.4-35.4)
2 risk factors 29.4 (27.1-31.6) 28.7 (26.9-30.6) 29.1 (27.6-30.5)
3 risk factors 18.2 (16.3-20.1) 12.8 (11.5-14.1) 15.5 (14.4-16.7)
4 risk factors 4.3 (3.4-5.2) 3.3 (2.5-4.0) 3.8 (3.2-4.4)
5 risk factors 0.8 (0.3-1.3) 0.7 (0.4-1.1) 0.8 (0.4-1.1)
Note: Estimates are based on 7,132 respondents in NSW. For this indicator 720 (9.17%) were not stated (Don’t know or Refused) in NSW. The risk factors used in the index were any alcohol risk drinking behaviour, not meeting the recommended daily fruit or vegetable intake, currentsmoking, not undertaking adequate physical activity and being obese. Any alcohol risk drinking behaviour is defined as Guideline 1 of the NHMRCAustralian Alcohol Guidelines, as 1 or more of the following: consuming alcohol every day, consuming on average more than [4 if male/2 if female]standard drinks, consuming more than [6 if male/4 if female] on any 1 occasion or day. Not meeting the recommended daily fruit and vegetable intakeis defined as not eating 2 serves of fruit a day or 5 serves of vegetables a day. Current smoking is defined as smoking daily or occasionally. Notundertaking adequate physical activity is defined not undertaking a total of 150 minutes of exercise per week on 5 separate occasions. Being obese isdefined as having a BMI of 30 and over.
Source: New South Wales Population Health Survey 2006 (HOIST). Centre for Epidemiology and Research, NSW Department of Health.
301
WARNIN
G: Esti
mates o
ut of
date.
Please
chec
k Hea
lthStat
s NSW
for la
test e
stimate
s.
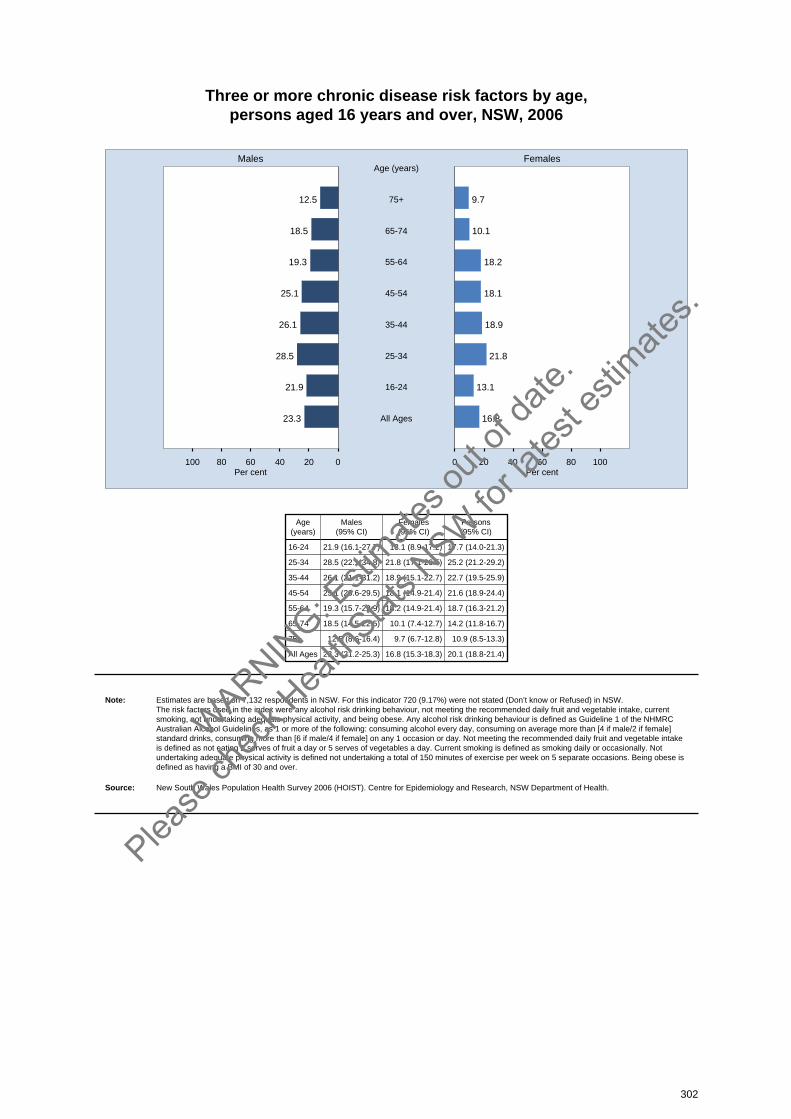
Three or more chronic disease risk factors by age, persons aged 16 years and over, NSW, 2006
020406080100 0 20 40 60 80 100
Males Females
Per cent Per cent
12.5 9.775+
Age (years)
18.5 10.165-74
19.3 18.255-64
25.1 18.145-54
26.1 18.935-44
28.5 21.825-34
21.9 13.116-24
23.3 16.8All Ages
Age(years)
Males(95% CI)
Females(95% CI)
Persons(95% CI)
16-24 21.9 (16.1-27.7) 13.1 (8.9-17.2) 17.7 (14.0-21.3)
25-34 28.5 (22.1-34.8) 21.8 (17.1-26.5) 25.2 (21.2-29.2)
35-44 26.1 (21.1-31.2) 18.9 (15.1-22.7) 22.7 (19.5-25.9)
45-54 25.1 (20.6-29.5) 18.1 (14.9-21.4) 21.6 (18.9-24.4)
55-64 19.3 (15.7-22.9) 18.2 (14.9-21.4) 18.7 (16.3-21.2)
65-74 18.5 (14.5-22.5) 10.1 (7.4-12.7) 14.2 (11.8-16.7)
75+ 12.5 (8.6-16.4) 9.7 (6.7-12.8) 10.9 (8.5-13.3)
All Ages 23.3 (21.2-25.3) 16.8 (15.3-18.3) 20.1 (18.8-21.4)
Note: Estimates are based on 7,132 respondents in NSW. For this indicator 720 (9.17%) were not stated (Don’t know or Refused) in NSW. The risk factors used in the index were any alcohol risk drinking behaviour, not meeting the recommended daily fruit and vegetable intake, currentsmoking, not undertaking adequate physical activity, and being obese. Any alcohol risk drinking behaviour is defined as Guideline 1 of the NHMRCAustralian Alcohol Guidelines, as 1 or more of the following: consuming alcohol every day, consuming on average more than [4 if male/2 if female]standard drinks, consuming more than [6 if male/4 if female] on any 1 occasion or day. Not meeting the recommended daily fruit and vegetable intakeis defined as not eating 2 serves of fruit a day or 5 serves of vegetables a day. Current smoking is defined as smoking daily or occasionally. Notundertaking adequate physical activity is defined not undertaking a total of 150 minutes of exercise per week on 5 separate occasions. Being obese isdefined as having a BMI of 30 and over.
Source: New South Wales Population Health Survey 2006 (HOIST). Centre for Epidemiology and Research, NSW Department of Health.
302
WARNIN
G: Esti
mates o
ut of
date.
Please
chec
k Hea
lthStat
s NSW
for la
test e
stimate
s.
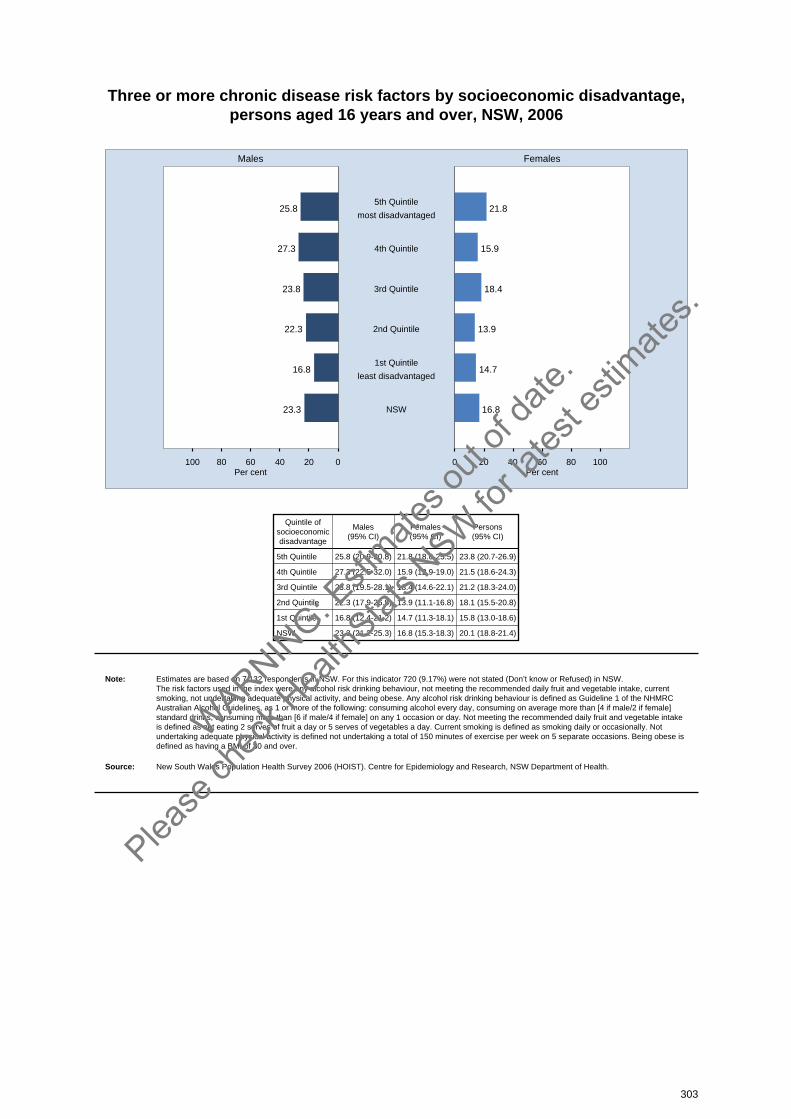
Three or more chronic disease risk factors by socioeconomic disadvantage, persons aged 16 years and over, NSW, 2006
020406080100 0 20 40 60 80 100
Males Females
Per cent Per cent
25.8 21.85th Quintile
most disadvantaged
27.3 15.94th Quintile
23.8 18.43rd Quintile
22.3 13.92nd Quintile
16.8 14.71st Quintile
least disadvantaged
23.3 16.8NSW
Quintile ofsocioeconomicdisadvantage
Males(95% CI)
Females(95% CI)
Persons(95% CI)
5th Quintile 25.8 (20.9-30.8) 21.8 (18.0-25.5) 23.8 (20.7-26.9)
4th Quintile 27.3 (22.5-32.0) 15.9 (12.9-19.0) 21.5 (18.6-24.3)
3rd Quintile 23.8 (19.5-28.1) 18.4 (14.6-22.1) 21.2 (18.3-24.0)
2nd Quintile 22.3 (17.9-26.8) 13.9 (11.1-16.8) 18.1 (15.5-20.8)
1st Quintile 16.8 (12.4-21.2) 14.7 (11.3-18.1) 15.8 (13.0-18.6)
NSW 23.3 (21.2-25.3) 16.8 (15.3-18.3) 20.1 (18.8-21.4)
Note: Estimates are based on 7,132 respondents in NSW. For this indicator 720 (9.17%) were not stated (Don’t know or Refused) in NSW. The risk factors used in the index were any alcohol risk drinking behaviour, not meeting the recommended daily fruit and vegetable intake, currentsmoking, not undertaking adequate physical activity, and being obese. Any alcohol risk drinking behaviour is defined as Guideline 1 of the NHMRCAustralian Alcohol Guidelines, as 1 or more of the following: consuming alcohol every day, consuming on average more than [4 if male/2 if female]standard drinks, consuming more than [6 if male/4 if female] on any 1 occasion or day. Not meeting the recommended daily fruit and vegetable intakeis defined as not eating 2 serves of fruit a day or 5 serves of vegetables a day. Current smoking is defined as smoking daily or occasionally. Notundertaking adequate physical activity is defined not undertaking a total of 150 minutes of exercise per week on 5 separate occasions. Being obese isdefined as having a BMI of 30 and over.
Source: New South Wales Population Health Survey 2006 (HOIST). Centre for Epidemiology and Research, NSW Department of Health.
303
WARNIN
G: Esti
mates o
ut of
date.
Please
chec
k Hea
lthStat
s NSW
for la
test e
stimate
s.
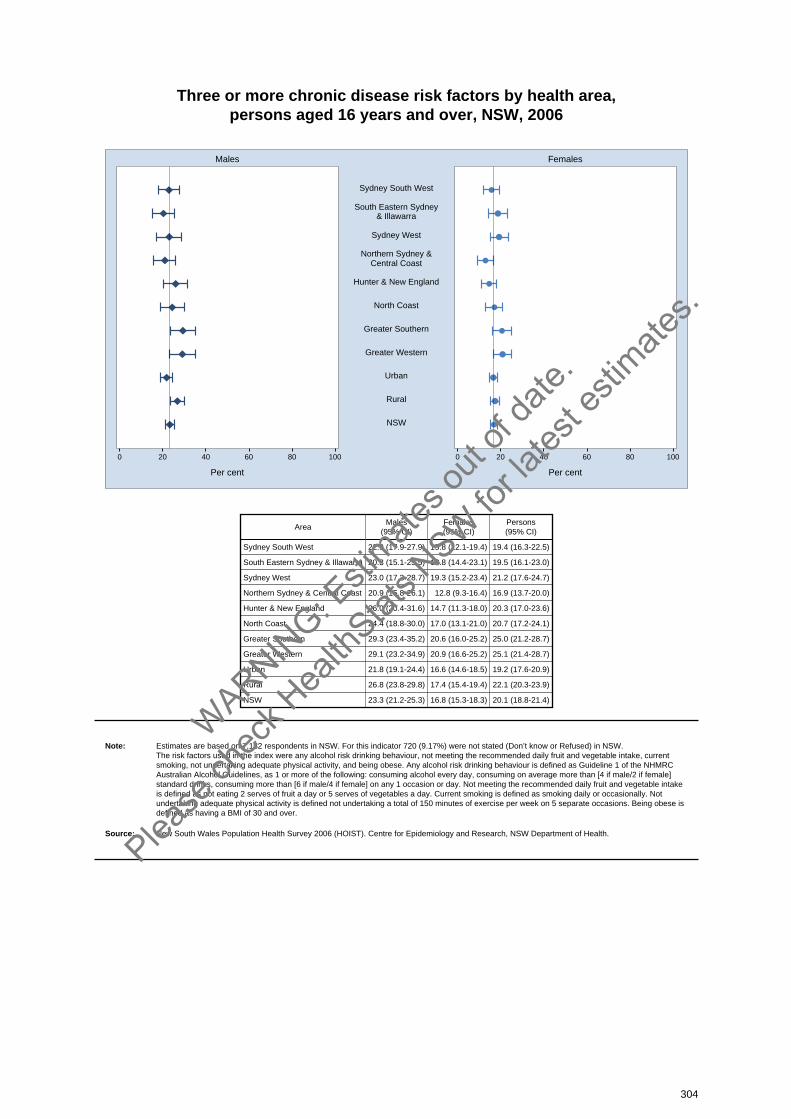
Three or more chronic disease risk factors by health area, persons aged 16 years and over, NSW, 2006
0 20 40 60 80 100 0 20 40 60 80 100
Males Females
Per cent Per cent
Sydney South West
South Eastern Sydney& Illawarra
Sydney West
Northern Sydney &Central Coast
Hunter & New England
North Coast
Greater Southern
Greater Western
Urban
Rural
NSW
AreaMales
(95% CI)Females(95% CI)
Persons(95% CI)
Sydney South West 22.9 (17.9-27.9) 15.8 (12.1-19.4) 19.4 (16.3-22.5)
South Eastern Sydney & Illawarra 20.3 (15.1-25.5) 18.8 (14.4-23.1) 19.5 (16.1-23.0)
Sydney West 23.0 (17.3-28.7) 19.3 (15.2-23.4) 21.2 (17.6-24.7)
Northern Sydney & Central Coast 20.9 (15.8-26.1) 12.8 (9.3-16.4) 16.9 (13.7-20.0)
Hunter & New England 26.0 (20.4-31.6) 14.7 (11.3-18.0) 20.3 (17.0-23.6)
North Coast 24.4 (18.8-30.0) 17.0 (13.1-21.0) 20.7 (17.2-24.1)
Greater Southern 29.3 (23.4-35.2) 20.6 (16.0-25.2) 25.0 (21.2-28.7)
Greater Western 29.1 (23.2-34.9) 20.9 (16.6-25.2) 25.1 (21.4-28.7)
Urban 21.8 (19.1-24.4) 16.6 (14.6-18.5) 19.2 (17.6-20.9)
Rural 26.8 (23.8-29.8) 17.4 (15.4-19.4) 22.1 (20.3-23.9)
NSW 23.3 (21.2-25.3) 16.8 (15.3-18.3) 20.1 (18.8-21.4)
Note: Estimates are based on 7,132 respondents in NSW. For this indicator 720 (9.17%) were not stated (Don’t know or Refused) in NSW. The risk factors used in the index were any alcohol risk drinking behaviour, not meeting the recommended daily fruit and vegetable intake, currentsmoking, not undertaking adequate physical activity, and being obese. Any alcohol risk drinking behaviour is defined as Guideline 1 of the NHMRCAustralian Alcohol Guidelines, as 1 or more of the following: consuming alcohol every day, consuming on average more than [4 if male/2 if female]standard drinks, consuming more than [6 if male/4 if female] on any 1 occasion or day. Not meeting the recommended daily fruit and vegetable intakeis defined as not eating 2 serves of fruit a day or 5 serves of vegetables a day. Current smoking is defined as smoking daily or occasionally. Notundertaking adequate physical activity is defined not undertaking a total of 150 minutes of exercise per week on 5 separate occasions. Being obese isdefined as having a BMI of 30 and over.
Source: New South Wales Population Health Survey 2006 (HOIST). Centre for Epidemiology and Research, NSW Department of Health.
304
WARNIN
G: Esti
mates o
ut of
date.
Please
chec
k Hea
lthStat
s NSW
for la
test e
stimate
s.
Health services
In 2006, the New South Wales Population Health Survey included questions to monitor access to, andsatisfaction with, health services. Questions focused on health service use and access, private healthinsurance, cost of medication and health care, difficulties getting health care, presentation at anemergency department, admission to hospital, and attendance at a community health centre and apublic dental service.
Health service use and access
In 2006, the New South Wales Population Health Survey included questions to monitor access to, andsatisfaction with, health services. To monitor the use of health services, respondents were asked: Inthe last 12 months, have you stayed at least one night in hospital, presented at an emergencydepartment, or attended a community health centre or public dental service? To monitor private healthinsurance, respondents were asked: Apart from Medicare, are you covered by private healthinsurance? To monitor the cost of medication, respondents were asked: Do you purchase yourprescription medicines using a health care card, seniors card, veterans card, or similar? In the last 12months have you had a medical problem but avoided seeing a doctor because of the cost of medicinethat may be prescribed? Have you ever not collected, stopped using, or cut down the dose of, amedicine prescribed by your doctor because of the cost? To monitor difficulties people experience ingetting health care (that is, any health service provided by general practitioners and specialists, publicand private hospitals and dental clinics, pharmacists, allied health services such as physiotherapy, andcommunity health services), respondents were asked: Do you have any difficulties getting health carewhen you need it? Those who responded Yes were then asked: Please describe the difficulties you have.
Results
Health service use
In 2006, 71.0 per cent of adults did not attend any health service, 14.1 per cent were admitted tohospital for at least one night, 14.0 per cent presented to an emergency department, 7.3 per centattended a community health centre, and 4.3 per cent attended a public dental service or hospital.
Private health insurance
In 2006, 54.6 per cent of adults were covered by private health insurance. There was no significantvariation between males and females. A significantly lower proportion of adults aged 16-24 years (45.3per cent) and 25-34 years (47.1 per cent) and 75 years and over (45.1 per cent), and a significantlyhigher proportion of adults aged 45-54 years (62.9 per cent) and 55-64 years (63.0 per cent), werecovered by private health insurance, compared with the overall adult population.
A significantly higher proportion of adults in urban areas (58.2 per cent) than rural areas (46.2 percent) were covered by private health insurance. A higher proportion of adults in the South EasternSydney & Illawarra (59.0 per cent) and Northern Sydney & Central Coast (68.7 per cent) Health Areas,and a lower proportion of adults in the North Coast (39.5 per cent) and Greater Southern (44.8 percent) and Greater Western (44.3 per cent) Health Areas, were covered by private health insurance,compared with the overall adult population.
Coverage decreased significantly with socioeconomic disadvantage, from 73.5 per cent and 63.1 percent in the 2 least disadvantaged quintiles to 43.3 per cent and 39.6 per cent in the 2 mostdisadvantaged quintiles.
Overall, there has been a significant increase in the proportion of adults covered by private healthinsurance between 1997 (42.0 per cent) and 2006 (54.6 per cent). This increase was significant inboth males (42.7 per cent to 53.2 per cent) and females (41.4 per cent to 55.9 per cent).
305
WARNIN
G: Esti
mates o
ut of
date.
Please
chec
k Hea
lthStat
s NSW
for la
test e
stimate
s.
Cost of medication and health care
In 2006, 35.8 per cent of adults used a concession card to purchase medication. A significantly higherproportion of females (38.0 per cent) than males (33.6 per cent) used a concession card to purchasemedication. Among males, a significantly higher proportion of adults aged 65-74 years (80.3 per cent)and 75 years and over (90.4 per cent), and a significantly lower proportion of adults aged 25-34 years(16.5 per cent) and 35-44 years (19.5 per cent) and 45-54 years (20.4 per cent), used a concessioncard to purchase medication, compared with the overall adult male population. Among females, asignificantly higher proportion of adults aged 65-74 years (85.8 per cent) and 75 years and over (88.6per cent), and a significantly lower proportion of adults aged 25-34 years (24.9 per cent) and 35-44years (21.2 per cent) and 45-54 years (21.5 per cent), used a concession card to purchasemedication, compared with the overall adult female population. A significantly higher proportion ofadults in rural areas (42.7 per cent) than urban areas (32.8 per cent) used a concession card topurchase medication. A higher proportion of adults in the Hunter & New England (41.3 per cent) andNorth Coast (50.0 per cent) and Greater Western (41.3 per cent) Health Areas, and a lower proportionof adults in the Sydney West (30.8 per cent) and Northern Sydney & Central Coast (31.0 per cent)Health Areas, used a concession card to purchase medication. Use of a concession card to purchasemedications increased with socioeconomic disadvantage, from 23.3 per cent in the leastdisadvantaged quintile to 49.0 per cent in the most disadvantaged quintile.
In 2006, 7.9 per cent of adults avoided seeing a doctor due to the cost of medication. There was nosignificant variation between males and females. A significantly higher proportion of adults aged 35-44years (10.8 per cent), and a significantly lower proportion of adults aged 55-64 years (5.6 per cent)and 65-74 years (2.6 per cent) and 75 years and over (1.6 per cent), avoided seeing a doctor due tothe cost of medication. There was no significant variation between rural areas and urban areas;however, a higher proportion of adults in the North Coast Health Area (10.8 per cent) avoided seeing adoctor due to the cost of medication. A lower proportion of adults in the least disadvantaged quintile(4.8 per cent) avoided seeing a doctor due to the cost of medication, compared with the overall adult population.
In 2006, 10.1 per cent of adults limited the use of prescription medication because of cost. There wasno significant variation between males and females. A significantly higher proportion of adults aged25-34 years (14.6 per cent) and 35-44 years (12.9 per cent), and a significantly lower proportion ofadults aged 65-74 years (3.4 per cent) and 75 years and over (1.9 per cent), limited the use ofprescription medication because of cost. There was no significant variation between rural areas andurban areas; however, a lower proportion of adults in the Greater Southern Health Area (7.9 per cent)limited the use of prescription medication because of cost. A lower proportion of adults in the leastdisadvantaged quintile (7.1 per cent) limited the use of prescription medication because of cost,compared with the overall adult population.
Difficulties getting health care
In 2006, excluding those who did not need health care, 13.2 per cent of adults had difficulties gettinghealth care. The main difficulties were: waiting time for an appointment with a general practitioner(36.3 per cent), difficulty in accessing specialists (14.3 per cent), cost of health services (10.7 percent), waiting time for dental services (10.1 per cent), shortage of general practitioners in area (9.3 percent), transport issues (8.8 per cent), quality of treatment (7.9 per cent), shortage of health services(7.8 per cent), and waiting time in emergency departments (7.4 per cent).
A significantly lower proportion of males (11.9 per cent) than females (14.6 per cent) had difficulties ingetting health care. Among males, a significantly lower proportion of adults aged 16-24 years (4.4 percent) and 75 years and over (8.0 per cent), and a significantly higher proportion of adults aged 45-54years (16.7 per cent), had difficulties getting health care, compared with the overall adult malepopulation. Among females, a significantly lower proportion of adults aged 16-24 years (7.7 per cent)and 75 years and over (6.6 per cent), and a significantly higher proportion of adults aged 35-44 years(18.8 per cent) and 45-54 years (18.5 per cent), had difficulties getting health care, compared with theoverall adult female population.
306
WARNIN
G: Esti
mates o
ut of
date.
Please
chec
k Hea
lthStat
s NSW
for la
test e
stimate
s.
A significantly higher proportion of adults in rural areas (21.9 per cent) than urban areas (9.5 per cent)had difficulties getting health care. A lower proportion of adults in the Sydney South West (9.9 percent), South Eastern Sydney & Illawarra (9.3 per cent), Sydney West (9.1 per cent), and NorthernSydney & Central Coast (9.7 per cent) Health Areas, had difficulties getting health care. A higherproportion of residents in the Greater Western (22.3 per cent), Greater Southern (25.3 per cent), NorthCoast (20.1 per cent), and Hunter & New England (20.8 per cent) Health Areas, had difficulties gettinghealth care.
Difficulties getting health care increased with socioeconomic disadvantage. A lower proportion ofadults in the least disadvantaged quintile (5.9 per cent), and a higher proportion of adults in thesecond most disadvantaged quintile (19.9 per cent), had difficulties in getting health care, comparedwith the overall adult population.
There has been a significant increase in the proportion of adults having difficulties getting health care,from 9.9 per cent in 1997 to 13.2 per cent in 2006. This increase was significant in both males (8.8 percent to 11.9 per cent) and females (11.0 per cent to 14.6 per cent).
307
WARNIN
G: Esti
mates o
ut of
date.
Please
chec
k Hea
lthStat
s NSW
for la
test e
stimate
s.
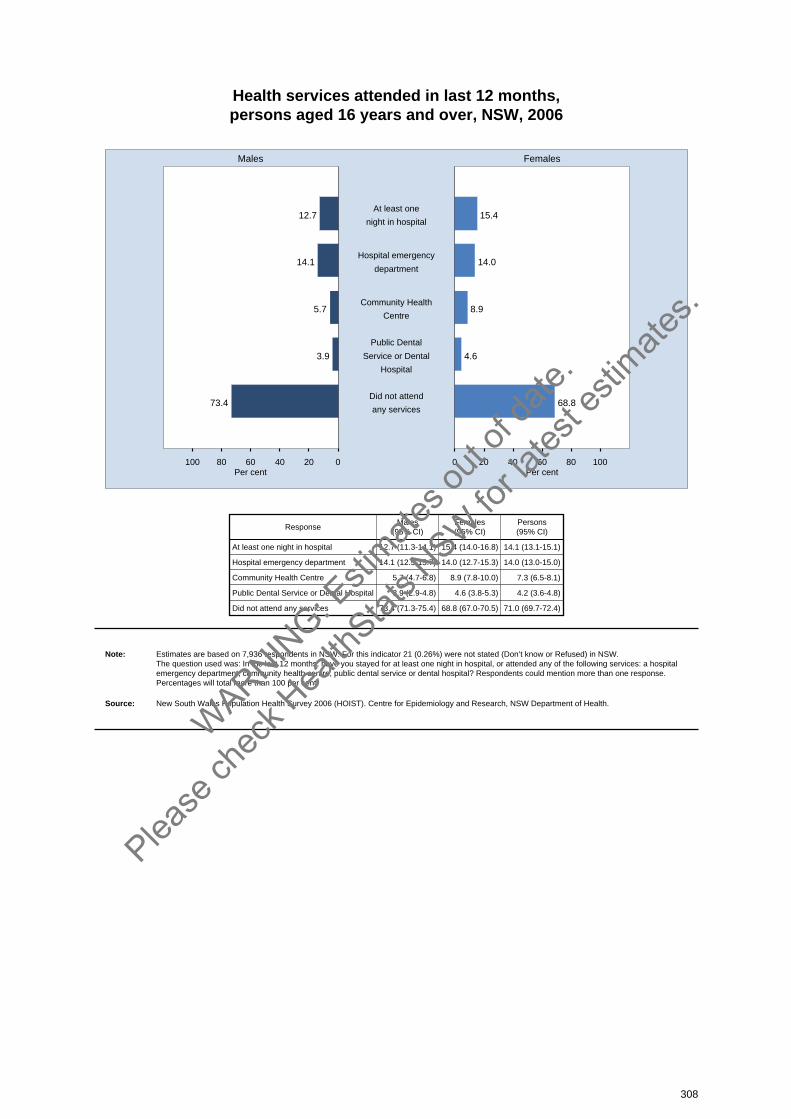
Health services attended in last 12 months, persons aged 16 years and over, NSW, 2006
020406080100 0 20 40 60 80 100
Males Females
Per cent Per cent
12.7 15.4At least one
night in hospital
14.1 14.0Hospital emergency
department
5.7 8.9Community Health
Centre
3.9 4.6
Public Dental
Service or Dental
Hospital
73.4 68.8Did not attend
any services
ResponseMales
(95% CI)Females(95% CI)
Persons(95% CI)
At least one night in hospital 12.7 (11.3-14.1) 15.4 (14.0-16.8) 14.1 (13.1-15.1)
Hospital emergency department 14.1 (12.5-15.7) 14.0 (12.7-15.3) 14.0 (13.0-15.0)
Community Health Centre 5.7 (4.7-6.8) 8.9 (7.8-10.0) 7.3 (6.5-8.1)
Public Dental Service or Dental Hospital 3.9 (2.9-4.8) 4.6 (3.8-5.3) 4.2 (3.6-4.8)
Did not attend any services 73.4 (71.3-75.4) 68.8 (67.0-70.5) 71.0 (69.7-72.4)
Note: Estimates are based on 7,936 respondents in NSW. For this indicator 21 (0.26%) were not stated (Don’t know or Refused) in NSW. The question used was: In the last 12 months, have you stayed for at least one night in hospital, or attended any of the following services: a hospitalemergency department, community health centre, public dental service or dental hospital? Respondents could mention more than one response.Percentages will total more than 100 per cent.
Source: New South Wales Population Health Survey 2006 (HOIST). Centre for Epidemiology and Research, NSW Department of Health.
308
WARNIN
G: Esti
mates o
ut of
date.
Please
chec
k Hea
lthStat
s NSW
for la
test e
stimate
s.
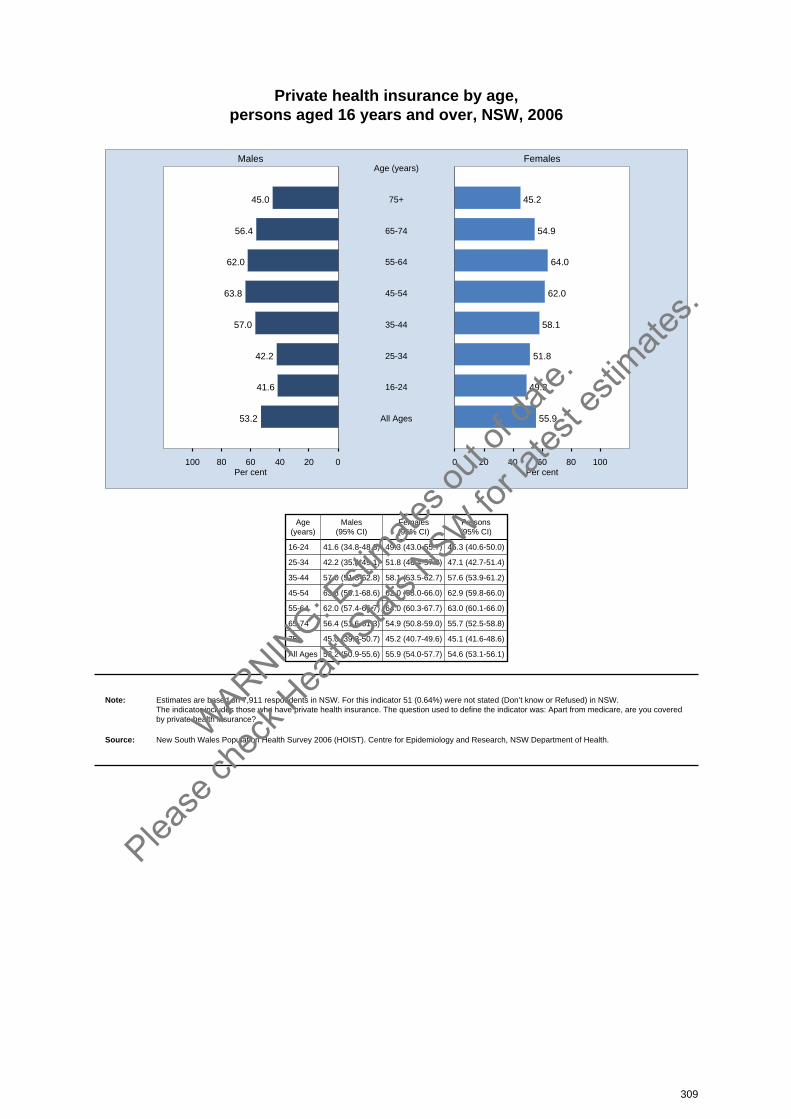
Private health insurance by age, persons aged 16 years and over, NSW, 2006
020406080100 0 20 40 60 80 100
Males Females
Per cent Per cent
45.0 45.275+
Age (years)
56.4 54.965-74
62.0 64.055-64
63.8 62.045-54
57.0 58.135-44
42.2 51.825-34
41.6 49.316-24
53.2 55.9All Ages
Age(years)
Males(95% CI)
Females(95% CI)
Persons(95% CI)
16-24 41.6 (34.8-48.3) 49.3 (43.0-55.7) 45.3 (40.6-50.0)
25-34 42.2 (35.4-49.1) 51.8 (46.4-57.2) 47.1 (42.7-51.4)
35-44 57.0 (51.3-62.8) 58.1 (53.5-62.7) 57.6 (53.9-61.2)
45-54 63.8 (59.1-68.6) 62.0 (58.0-66.0) 62.9 (59.8-66.0)
55-64 62.0 (57.4-66.7) 64.0 (60.3-67.7) 63.0 (60.1-66.0)
65-74 56.4 (51.6-61.3) 54.9 (50.8-59.0) 55.7 (52.5-58.8)
75+ 45.0 (39.3-50.7) 45.2 (40.7-49.6) 45.1 (41.6-48.6)
All Ages 53.2 (50.9-55.6) 55.9 (54.0-57.7) 54.6 (53.1-56.1)
Note: Estimates are based on 7,911 respondents in NSW. For this indicator 51 (0.64%) were not stated (Don’t know or Refused) in NSW. The indicator includes those who have private health insurance. The question used to define the indicator was: Apart from medicare, are you coveredby private health insurance?
Source: New South Wales Population Health Survey 2006 (HOIST). Centre for Epidemiology and Research, NSW Department of Health.
309
WARNIN
G: Esti
mates o
ut of
date.
Please
chec
k Hea
lthStat
s NSW
for la
test e
stimate
s.
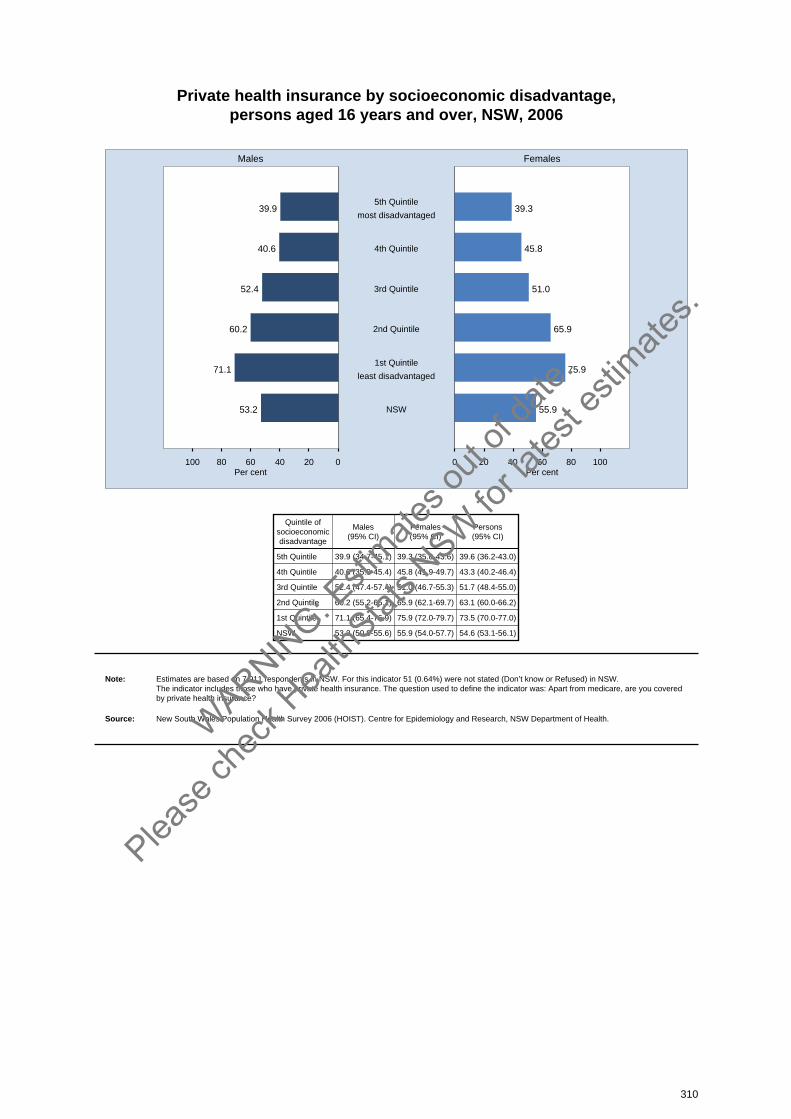
Private health insurance by socioeconomic disadvantage, persons aged 16 years and over, NSW, 2006
020406080100 0 20 40 60 80 100
Males Females
Per cent Per cent
39.9 39.35th Quintile
most disadvantaged
40.6 45.84th Quintile
52.4 51.03rd Quintile
60.2 65.92nd Quintile
71.1 75.91st Quintile
least disadvantaged
53.2 55.9NSW
Quintile ofsocioeconomicdisadvantage
Males(95% CI)
Females(95% CI)
Persons(95% CI)
5th Quintile 39.9 (34.7-45.1) 39.3 (35.0-43.6) 39.6 (36.2-43.0)
4th Quintile 40.6 (35.9-45.4) 45.8 (41.9-49.7) 43.3 (40.2-46.4)
3rd Quintile 52.4 (47.4-57.4) 51.0 (46.7-55.3) 51.7 (48.4-55.0)
2nd Quintile 60.2 (55.2-65.1) 65.9 (62.1-69.7) 63.1 (60.0-66.2)
1st Quintile 71.1 (65.4-76.9) 75.9 (72.0-79.7) 73.5 (70.0-77.0)
NSW 53.2 (50.9-55.6) 55.9 (54.0-57.7) 54.6 (53.1-56.1)
Note: Estimates are based on 7,911 respondents in NSW. For this indicator 51 (0.64%) were not stated (Don’t know or Refused) in NSW. The indicator includes those who have private health insurance. The question used to define the indicator was: Apart from medicare, are you coveredby private health insurance?
Source: New South Wales Population Health Survey 2006 (HOIST). Centre for Epidemiology and Research, NSW Department of Health.
310
WARNIN
G: Esti
mates o
ut of
date.
Please
chec
k Hea
lthStat
s NSW
for la
test e
stimate
s.

Private health insurance by health area, persons aged 16 years and over, NSW, 2006
0 20 40 60 80 100 0 20 40 60 80 100
Males Females
Per cent Per cent
Sydney South West
South Eastern Sydney& Illawarra
Sydney West
Northern Sydney &Central Coast
Hunter & New England
North Coast
Greater Southern
Greater Western
Urban
Rural
NSW
AreaMales
(95% CI)Females(95% CI)
Persons(95% CI)
Sydney South West 49.2 (43.6-54.9) 55.6 (50.8-60.5) 52.5 (48.7-56.2)
South Eastern Sydney & Illawarra 57.0 (50.6-63.5) 61.0 (56.1-66.0) 59.0 (54.9-63.1)
Sydney West 55.2 (48.7-61.7) 51.4 (46.5-56.3) 53.3 (49.3-57.4)
Northern Sydney & Central Coast 65.8 (60.2-71.4) 71.5 (67.1-76.0) 68.7 (65.2-72.3)
Hunter & New England 51.4 (45.4-57.4) 51.7 (47.0-56.3) 51.5 (47.7-55.3)
North Coast 40.1 (34.2-46.0) 39.0 (34.4-43.6) 39.5 (35.8-43.3)
Greater Southern 43.2 (37.3-49.1) 46.4 (41.4-51.4) 44.8 (40.9-48.7)
Greater Western 43.7 (37.6-49.8) 44.8 (40.0-49.6) 44.3 (40.3-48.2)
Urban 56.5 (53.4-59.5) 59.9 (57.5-62.3) 58.2 (56.3-60.1)
Rural 45.8 (42.6-49.0) 46.5 (44.0-49.1) 46.2 (44.2-48.2)
NSW 53.2 (50.9-55.6) 55.9 (54.0-57.7) 54.6 (53.1-56.1)
Note: Estimates are based on 7,911 respondents in NSW. For this indicator 51 (0.64%) were not stated (Don’t know or Refused) in NSW. The indicator includes those who have private health insurance. The question used to define the indicator was: Apart from medicare, are you coveredby private health insurance?
Source: New South Wales Population Health Survey 2006 (HOIST). Centre for Epidemiology and Research, NSW Department of Health.
311
WARNIN
G: Esti
mates o
ut of
date.
Please
chec
k Hea
lthStat
s NSW
for la
test e
stimate
s.
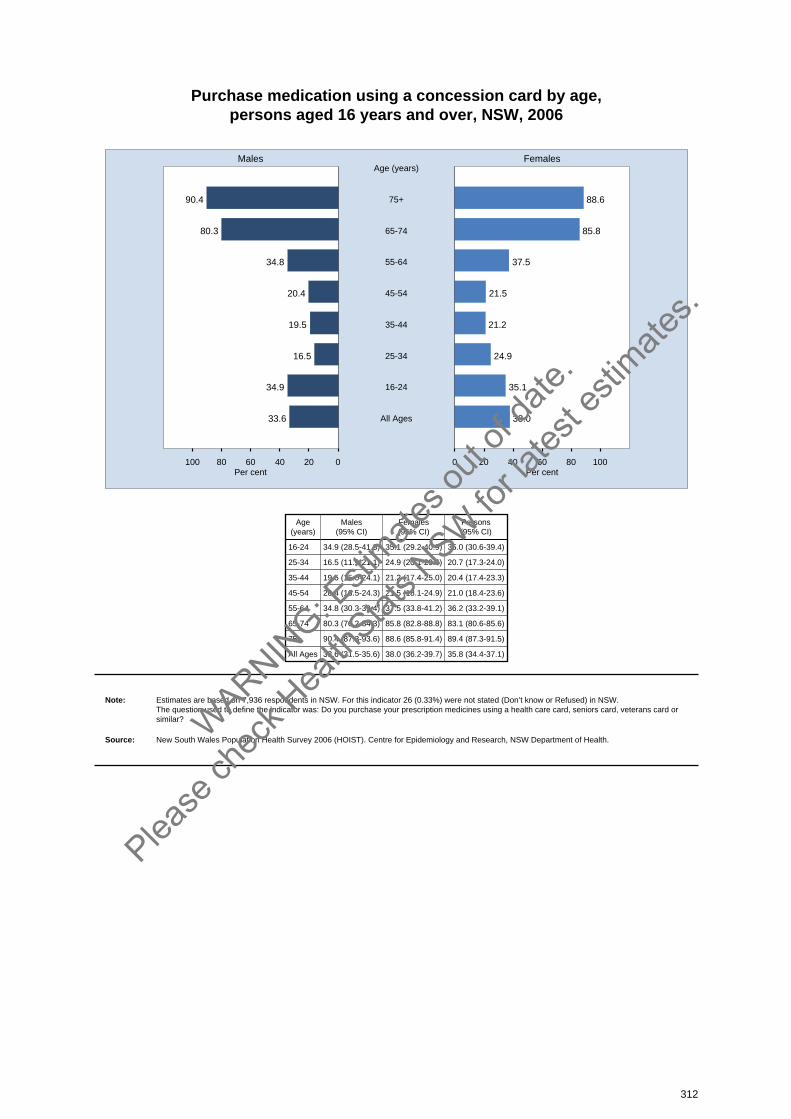
Purchase medication using a concession card by age, persons aged 16 years and over, NSW, 2006
020406080100 0 20 40 60 80 100
Males Females
Per cent Per cent
90.4 88.675+
Age (years)
80.3 85.865-74
34.8 37.555-64
20.4 21.545-54
19.5 21.235-44
16.5 24.925-34
34.9 35.116-24
33.6 38.0All Ages
Age(years)
Males(95% CI)
Females(95% CI)
Persons(95% CI)
16-24 34.9 (28.5-41.3) 35.1 (29.2-40.9) 35.0 (30.6-39.4)
25-34 16.5 (11.9-21.1) 24.9 (20.1-29.6) 20.7 (17.3-24.0)
35-44 19.5 (15.0-24.1) 21.2 (17.4-25.0) 20.4 (17.4-23.3)
45-54 20.4 (16.5-24.3) 21.5 (18.1-24.9) 21.0 (18.4-23.6)
55-64 34.8 (30.3-39.4) 37.5 (33.8-41.2) 36.2 (33.2-39.1)
65-74 80.3 (76.2-84.3) 85.8 (82.8-88.8) 83.1 (80.6-85.6)
75+ 90.4 (87.3-93.6) 88.6 (85.8-91.4) 89.4 (87.3-91.5)
All Ages 33.6 (31.5-35.6) 38.0 (36.2-39.7) 35.8 (34.4-37.1)
Note: Estimates are based on 7,936 respondents in NSW. For this indicator 26 (0.33%) were not stated (Don’t know or Refused) in NSW. The question used to define the indicator was: Do you purchase your prescription medicines using a health care card, seniors card, veterans card or similar?
Source: New South Wales Population Health Survey 2006 (HOIST). Centre for Epidemiology and Research, NSW Department of Health.
312
WARNIN
G: Esti
mates o
ut of
date.
Please
chec
k Hea
lthStat
s NSW
for la
test e
stimate
s.
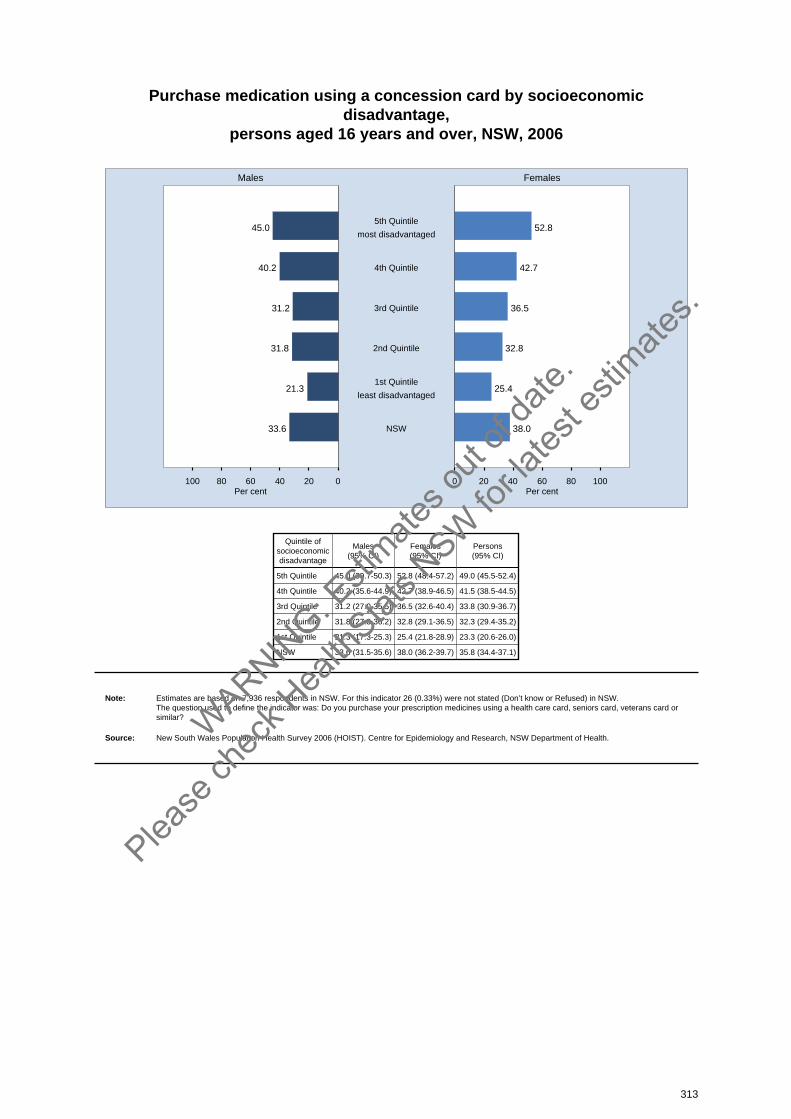
Purchase medication using a concession card by socioeconomicdisadvantage,
persons aged 16 years and over, NSW, 2006
020406080100 0 20 40 60 80 100
Males Females
Per cent Per cent
45.0 52.85th Quintile
most disadvantaged
40.2 42.74th Quintile
31.2 36.53rd Quintile
31.8 32.82nd Quintile
21.3 25.41st Quintile
least disadvantaged
33.6 38.0NSW
Quintile ofsocioeconomicdisadvantage
Males(95% CI)
Females(95% CI)
Persons(95% CI)
5th Quintile 45.0 (39.7-50.3) 52.8 (48.4-57.2) 49.0 (45.5-52.4)
4th Quintile 40.2 (35.6-44.9) 42.7 (38.9-46.5) 41.5 (38.5-44.5)
3rd Quintile 31.2 (27.0-35.5) 36.5 (32.6-40.4) 33.8 (30.9-36.7)
2nd Quintile 31.8 (27.3-36.2) 32.8 (29.1-36.5) 32.3 (29.4-35.2)
1st Quintile 21.3 (17.3-25.3) 25.4 (21.8-28.9) 23.3 (20.6-26.0)
NSW 33.6 (31.5-35.6) 38.0 (36.2-39.7) 35.8 (34.4-37.1)
Note: Estimates are based on 7,936 respondents in NSW. For this indicator 26 (0.33%) were not stated (Don’t know or Refused) in NSW. The question used to define the indicator was: Do you purchase your prescription medicines using a health care card, seniors card, veterans card or similar?
Source: New South Wales Population Health Survey 2006 (HOIST). Centre for Epidemiology and Research, NSW Department of Health.
313
WARNIN
G: Esti
mates o
ut of
date.
Please
chec
k Hea
lthStat
s NSW
for la
test e
stimate
s.
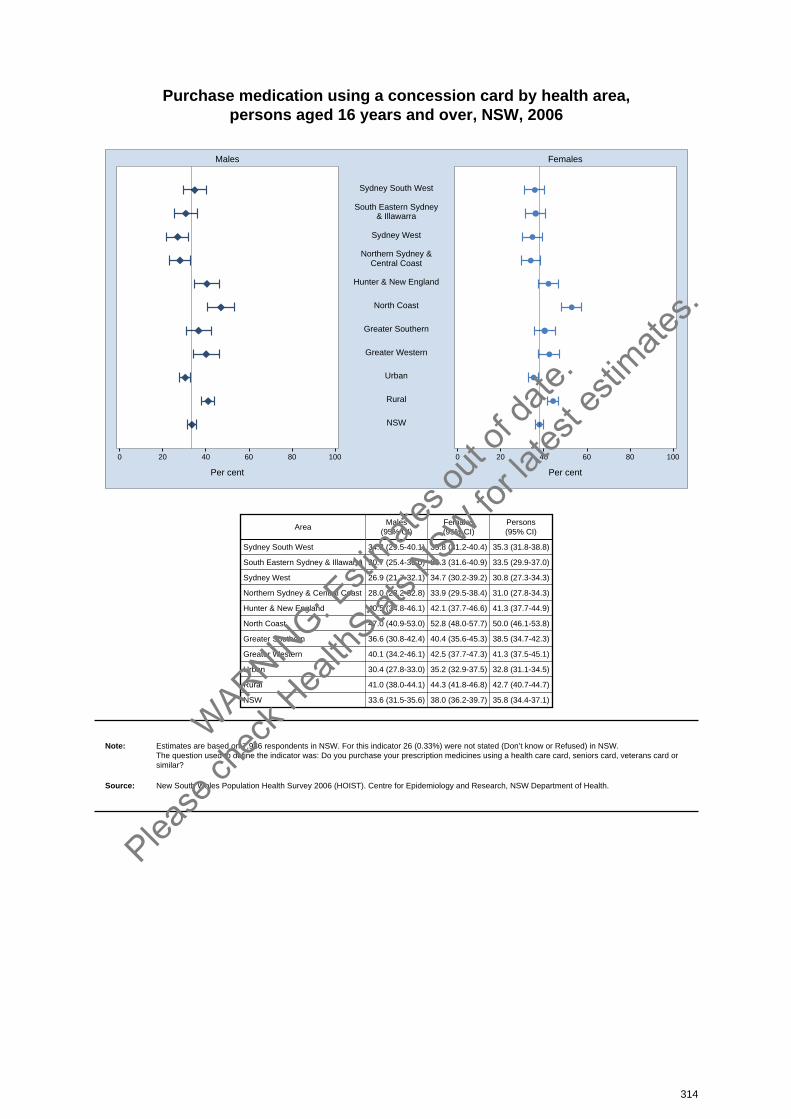
Purchase medication using a concession card by health area, persons aged 16 years and over, NSW, 2006
0 20 40 60 80 100 0 20 40 60 80 100
Males Females
Per cent Per cent
Sydney South West
South Eastern Sydney& Illawarra
Sydney West
Northern Sydney &Central Coast
Hunter & New England
North Coast
Greater Southern
Greater Western
Urban
Rural
NSW
AreaMales
(95% CI)Females(95% CI)
Persons(95% CI)
Sydney South West 34.8 (29.5-40.1) 35.8 (31.2-40.4) 35.3 (31.8-38.8)
South Eastern Sydney & Illawarra 30.7 (25.4-36.0) 36.3 (31.6-40.9) 33.5 (29.9-37.0)
Sydney West 26.9 (21.7-32.1) 34.7 (30.2-39.2) 30.8 (27.3-34.3)
Northern Sydney & Central Coast 28.0 (23.2-32.8) 33.9 (29.5-38.4) 31.0 (27.8-34.3)
Hunter & New England 40.5 (34.8-46.1) 42.1 (37.7-46.6) 41.3 (37.7-44.9)
North Coast 47.0 (40.9-53.0) 52.8 (48.0-57.7) 50.0 (46.1-53.8)
Greater Southern 36.6 (30.8-42.4) 40.4 (35.6-45.3) 38.5 (34.7-42.3)
Greater Western 40.1 (34.2-46.1) 42.5 (37.7-47.3) 41.3 (37.5-45.1)
Urban 30.4 (27.8-33.0) 35.2 (32.9-37.5) 32.8 (31.1-34.5)
Rural 41.0 (38.0-44.1) 44.3 (41.8-46.8) 42.7 (40.7-44.7)
NSW 33.6 (31.5-35.6) 38.0 (36.2-39.7) 35.8 (34.4-37.1)
Note: Estimates are based on 7,936 respondents in NSW. For this indicator 26 (0.33%) were not stated (Don’t know or Refused) in NSW. The question used to define the indicator was: Do you purchase your prescription medicines using a health care card, seniors card, veterans card or similar?
Source: New South Wales Population Health Survey 2006 (HOIST). Centre for Epidemiology and Research, NSW Department of Health.
314
WARNIN
G: Esti
mates o
ut of
date.
Please
chec
k Hea
lthStat
s NSW
for la
test e
stimate
s.
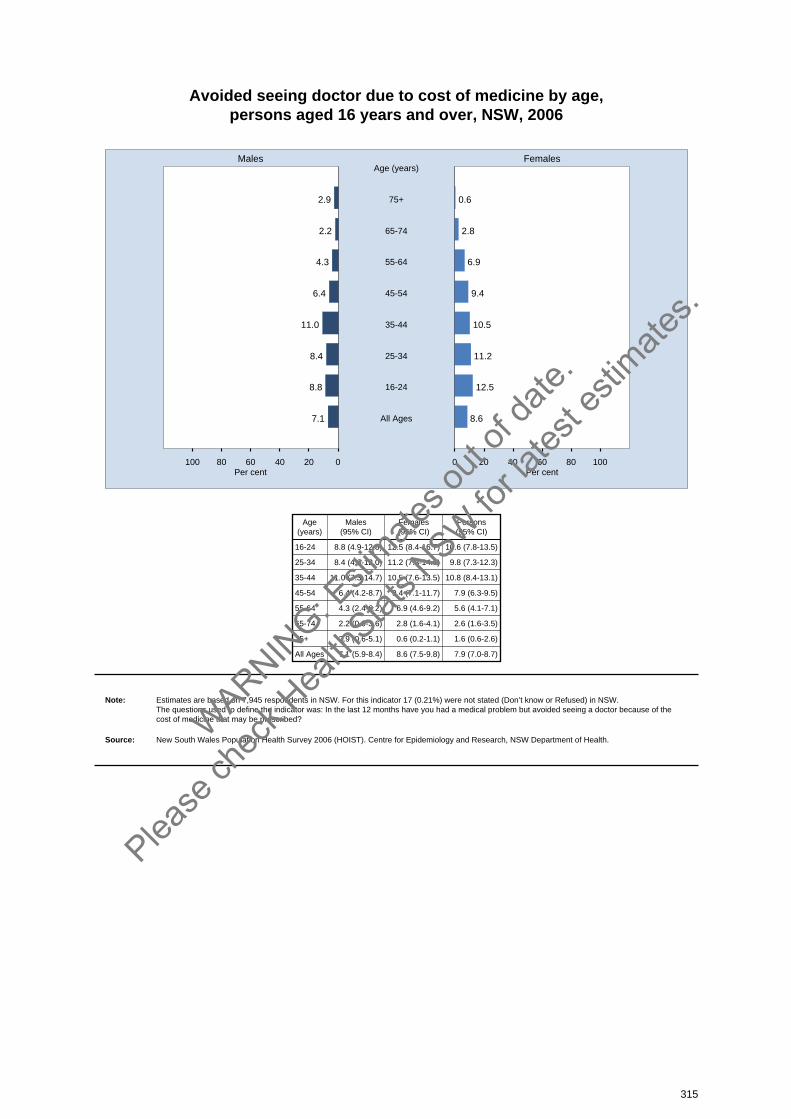
Avoided seeing doctor due to cost of medicine by age, persons aged 16 years and over, NSW, 2006
020406080100 0 20 40 60 80 100
Males Females
Per cent Per cent
2.9 0.675+
Age (years)
2.2 2.865-74
4.3 6.955-64
6.4 9.445-54
11.0 10.535-44
8.4 11.225-34
8.8 12.516-24
7.1 8.6All Ages
Age(years)
Males(95% CI)
Females(95% CI)
Persons(95% CI)
16-24 8.8 (4.9-12.8) 12.5 (8.4-16.7) 10.6 (7.8-13.5)
25-34 8.4 (4.8-12.0) 11.2 (7.8-14.6) 9.8 (7.3-12.3)
35-44 11.0 (7.3-14.7) 10.5 (7.6-13.5) 10.8 (8.4-13.1)
45-54 6.4 (4.2-8.7) 9.4 (7.1-11.7) 7.9 (6.3-9.5)
55-64 4.3 (2.4-6.2) 6.9 (4.6-9.2) 5.6 (4.1-7.1)
65-74 2.2 (0.9-3.6) 2.8 (1.6-4.1) 2.6 (1.6-3.5)
75+ 2.9 (0.6-5.1) 0.6 (0.2-1.1) 1.6 (0.6-2.6)
All Ages 7.1 (5.9-8.4) 8.6 (7.5-9.8) 7.9 (7.0-8.7)
Note: Estimates are based on 7,945 respondents in NSW. For this indicator 17 (0.21%) were not stated (Don’t know or Refused) in NSW. The questions used to define the indicator was: In the last 12 months have you had a medical problem but avoided seeing a doctor because of thecost of medicine that may be prescribed?
Source: New South Wales Population Health Survey 2006 (HOIST). Centre for Epidemiology and Research, NSW Department of Health.
315
WARNIN
G: Esti
mates o
ut of
date.
Please
chec
k Hea
lthStat
s NSW
for la
test e
stimate
s.

Avoided seeing doctor due to cost of medicine by socioeconomicdisadvantage,
persons aged 16 years and over, NSW, 2006
020406080100 0 20 40 60 80 100
Males Females
Per cent Per cent
9.0 10.35th Quintile
most disadvantaged
9.8 8.34th Quintile
6.3 11.43rd Quintile
7.0 6.62nd Quintile
3.3 6.41st Quintile
least disadvantaged
7.1 8.6NSW
Quintile ofsocioeconomicdisadvantage
Males(95% CI)
Females(95% CI)
Persons(95% CI)
5th Quintile 9.0 (5.7-12.3) 10.3 (7.3-13.2) 9.6 (7.5-11.8)
4th Quintile 9.8 (6.4-13.2) 8.3 (6.2-10.4) 9.0 (7.1-11.0)
3rd Quintile 6.3 (4.0-8.5) 11.4 (8.5-14.4) 8.8 (7.0-10.7)
2nd Quintile 7.0 (4.0-9.9) 6.6 (4.5-8.7) 6.8 (5.0-8.6)
1st Quintile 3.3 (1.4-5.2) 6.4 (4.0-8.8) 4.8 (3.3-6.4)
NSW 7.1 (5.9-8.4) 8.6 (7.5-9.8) 7.9 (7.0-8.7)
Note: Estimates are based on 7,945 respondents in NSW. For this indicator 17 (0.21%) were not stated (Don’t know or Refused) in NSW. The questions used to define the indicator was: In the last 12 months have you had a medical problem but avoided seeing a doctor because of thecost of medicine that may be prescribed?
Source: New South Wales Population Health Survey 2006 (HOIST). Centre for Epidemiology and Research, NSW Department of Health.
316
WARNIN
G: Esti
mates o
ut of
date.
Please
chec
k Hea
lthStat
s NSW
for la
test e
stimate
s.
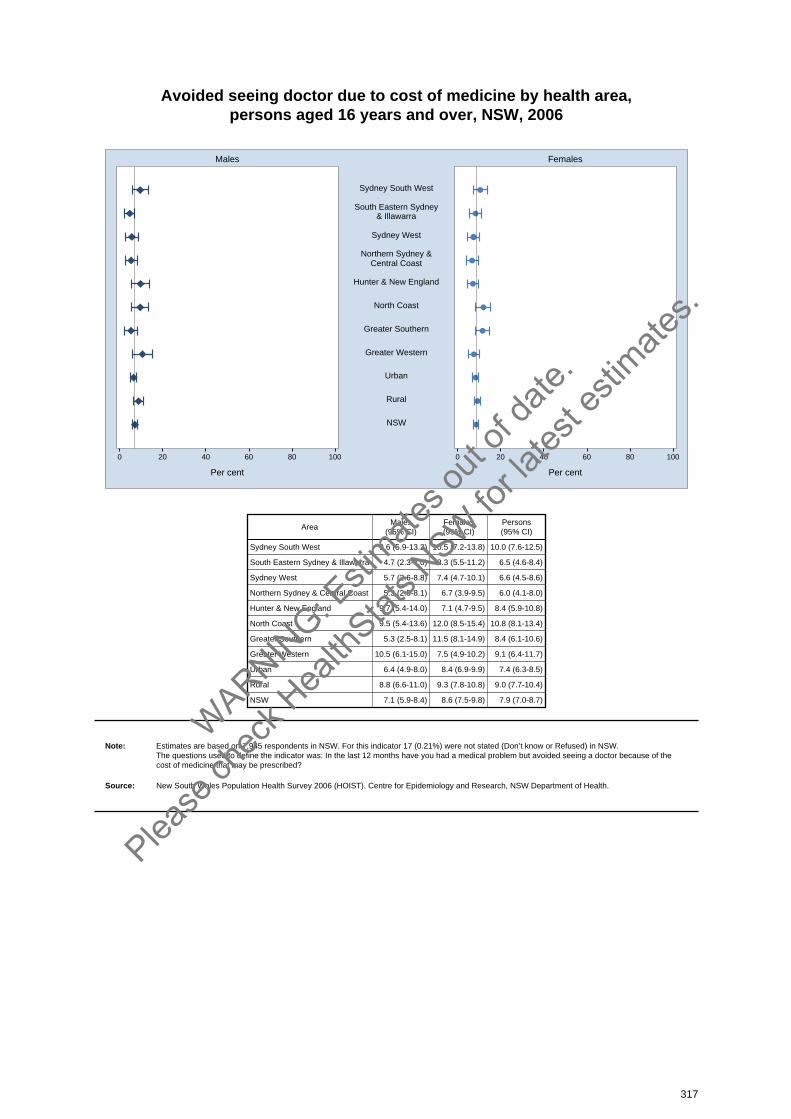
Avoided seeing doctor due to cost of medicine by health area, persons aged 16 years and over, NSW, 2006
0 20 40 60 80 100 0 20 40 60 80 100
Males Females
Per cent Per cent
Sydney South West
South Eastern Sydney& Illawarra
Sydney West
Northern Sydney &Central Coast
Hunter & New England
North Coast
Greater Southern
Greater Western
Urban
Rural
NSW
AreaMales
(95% CI)Females(95% CI)
Persons(95% CI)
Sydney South West 9.6 (5.9-13.2) 10.5 (7.2-13.8) 10.0 (7.6-12.5)
South Eastern Sydney & Illawarra 4.7 (2.3-7.0) 8.3 (5.5-11.2) 6.5 (4.6-8.4)
Sydney West 5.7 (2.6-8.8) 7.4 (4.7-10.1) 6.6 (4.5-8.6)
Northern Sydney & Central Coast 5.3 (2.5-8.1) 6.7 (3.9-9.5) 6.0 (4.1-8.0)
Hunter & New England 9.7 (5.4-14.0) 7.1 (4.7-9.5) 8.4 (5.9-10.8)
North Coast 9.5 (5.4-13.6) 12.0 (8.5-15.4) 10.8 (8.1-13.4)
Greater Southern 5.3 (2.5-8.1) 11.5 (8.1-14.9) 8.4 (6.1-10.6)
Greater Western 10.5 (6.1-15.0) 7.5 (4.9-10.2) 9.1 (6.4-11.7)
Urban 6.4 (4.9-8.0) 8.4 (6.9-9.9) 7.4 (6.3-8.5)
Rural 8.8 (6.6-11.0) 9.3 (7.8-10.8) 9.0 (7.7-10.4)
NSW 7.1 (5.9-8.4) 8.6 (7.5-9.8) 7.9 (7.0-8.7)
Note: Estimates are based on 7,945 respondents in NSW. For this indicator 17 (0.21%) were not stated (Don’t know or Refused) in NSW. The questions used to define the indicator was: In the last 12 months have you had a medical problem but avoided seeing a doctor because of thecost of medicine that may be prescribed?
Source: New South Wales Population Health Survey 2006 (HOIST). Centre for Epidemiology and Research, NSW Department of Health.
317
WARNIN
G: Esti
mates o
ut of
date.
Please
chec
k Hea
lthStat
s NSW
for la
test e
stimate
s.
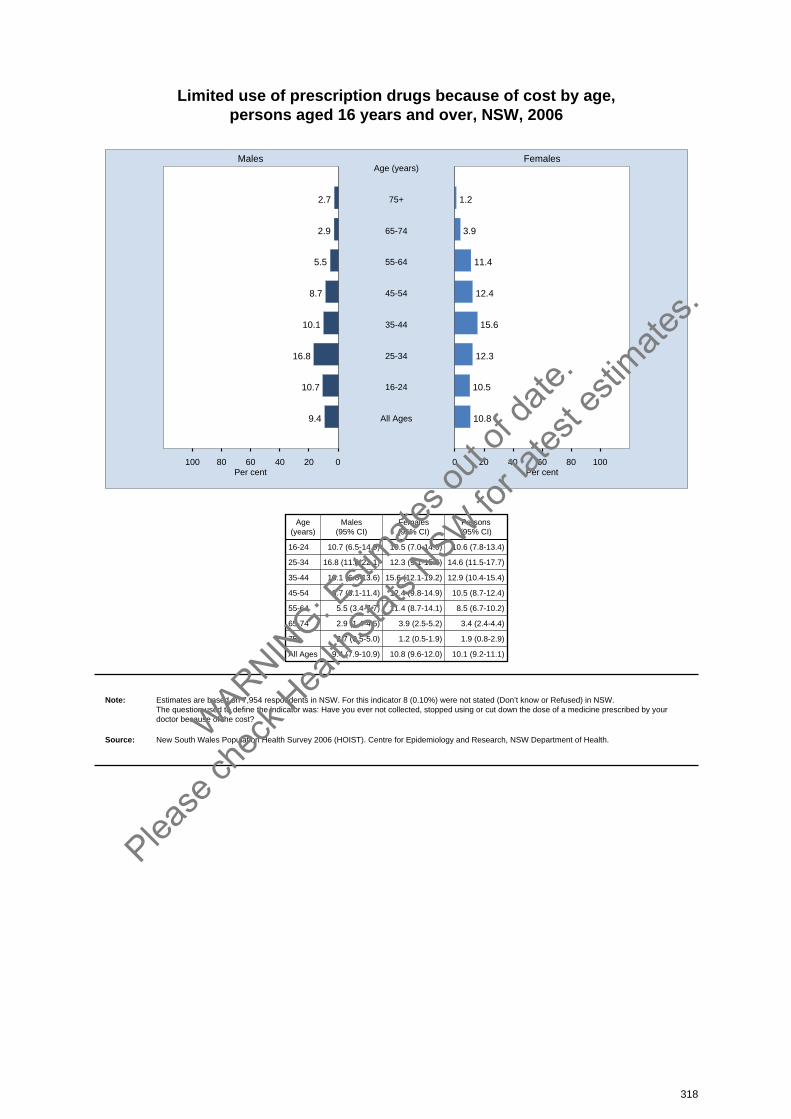
Limited use of prescription drugs because of cost by age, persons aged 16 years and over, NSW, 2006
020406080100 0 20 40 60 80 100
Males Females
Per cent Per cent
2.7 1.275+
Age (years)
2.9 3.965-74
5.5 11.455-64
8.7 12.445-54
10.1 15.635-44
16.8 12.325-34
10.7 10.516-24
9.4 10.8All Ages
Age(years)
Males(95% CI)
Females(95% CI)
Persons(95% CI)
16-24 10.7 (6.5-14.9) 10.5 (7.0-14.0) 10.6 (7.8-13.4)
25-34 16.8 (11.6-22.1) 12.3 (9.1-15.6) 14.6 (11.5-17.7)
35-44 10.1 (6.6-13.6) 15.6 (12.1-19.2) 12.9 (10.4-15.4)
45-54 8.7 (6.1-11.4) 12.4 (9.8-14.9) 10.5 (8.7-12.4)
55-64 5.5 (3.4-7.7) 11.4 (8.7-14.1) 8.5 (6.7-10.2)
65-74 2.9 (1.4-4.5) 3.9 (2.5-5.2) 3.4 (2.4-4.4)
75+ 2.7 (0.5-5.0) 1.2 (0.5-1.9) 1.9 (0.8-2.9)
All Ages 9.4 (7.9-10.9) 10.8 (9.6-12.0) 10.1 (9.2-11.1)
Note: Estimates are based on 7,954 respondents in NSW. For this indicator 8 (0.10%) were not stated (Don’t know or Refused) in NSW. The question used to define the indicator was: Have you ever not collected, stopped using or cut down the dose of a medicine prescribed by yourdoctor because of the cost?
Source: New South Wales Population Health Survey 2006 (HOIST). Centre for Epidemiology and Research, NSW Department of Health.
318
WARNIN
G: Esti
mates o
ut of
date.
Please
chec
k Hea
lthStat
s NSW
for la
test e
stimate
s.
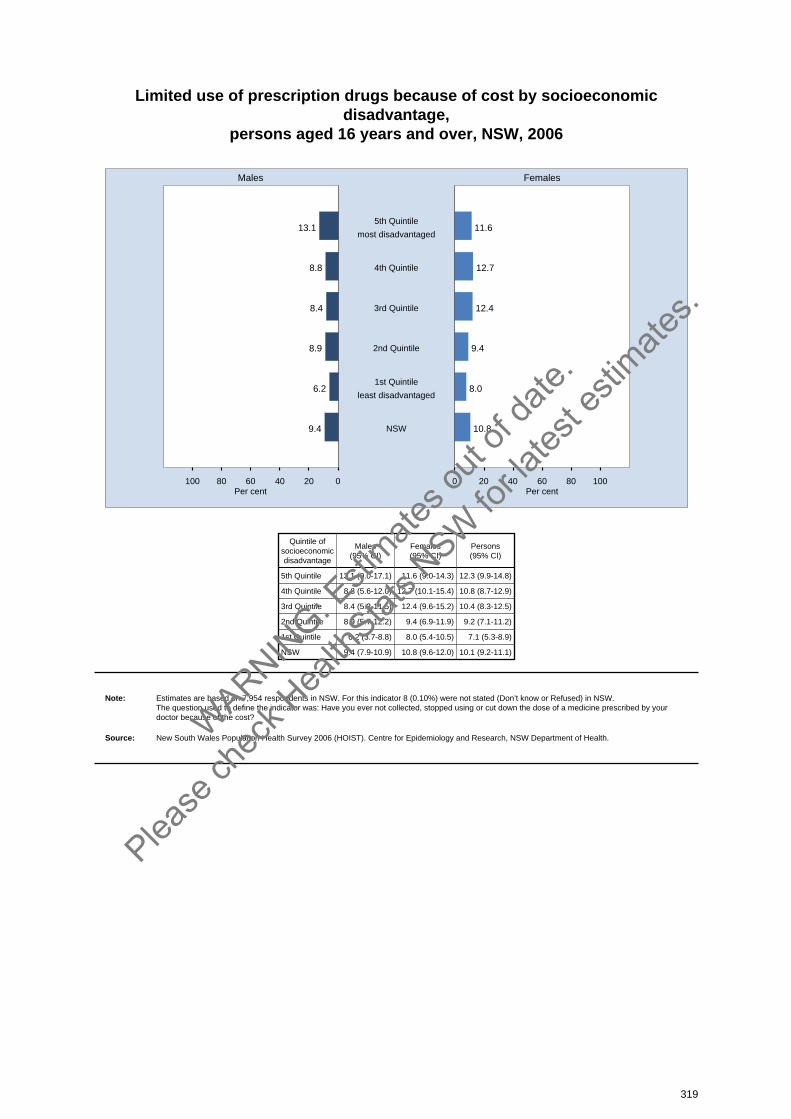
Limited use of prescription drugs because of cost by socioeconomicdisadvantage,
persons aged 16 years and over, NSW, 2006
020406080100 0 20 40 60 80 100
Males Females
Per cent Per cent
13.1 11.65th Quintile
most disadvantaged
8.8 12.74th Quintile
8.4 12.43rd Quintile
8.9 9.42nd Quintile
6.2 8.01st Quintile
least disadvantaged
9.4 10.8NSW
Quintile ofsocioeconomicdisadvantage
Males(95% CI)
Females(95% CI)
Persons(95% CI)
5th Quintile 13.1 (9.0-17.1) 11.6 (9.0-14.3) 12.3 (9.9-14.8)
4th Quintile 8.8 (5.6-12.0) 12.7 (10.1-15.4) 10.8 (8.7-12.9)
3rd Quintile 8.4 (5.3-11.5) 12.4 (9.6-15.2) 10.4 (8.3-12.5)
2nd Quintile 8.9 (5.7-12.2) 9.4 (6.9-11.9) 9.2 (7.1-11.2)
1st Quintile 6.2 (3.7-8.8) 8.0 (5.4-10.5) 7.1 (5.3-8.9)
NSW 9.4 (7.9-10.9) 10.8 (9.6-12.0) 10.1 (9.2-11.1)
Note: Estimates are based on 7,954 respondents in NSW. For this indicator 8 (0.10%) were not stated (Don’t know or Refused) in NSW. The question used to define the indicator was: Have you ever not collected, stopped using or cut down the dose of a medicine prescribed by yourdoctor because of the cost?
Source: New South Wales Population Health Survey 2006 (HOIST). Centre for Epidemiology and Research, NSW Department of Health.
319
WARNIN
G: Esti
mates o
ut of
date.
Please
chec
k Hea
lthStat
s NSW
for la
test e
stimate
s.

Limited use of prescription drugs because of cost by health area, persons aged 16 years and over, NSW, 2006
0 20 40 60 80 100 0 20 40 60 80 100
Males Females
Per cent Per cent
Sydney South West
South Eastern Sydney& Illawarra
Sydney West
Northern Sydney &Central Coast
Hunter & New England
North Coast
Greater Southern
Greater Western
Urban
Rural
NSW
AreaMales
(95% CI)Females(95% CI)
Persons(95% CI)
Sydney South West 10.8 (7.1-14.5) 12.2 (8.9-15.4) 11.5 (9.0-14.0)
South Eastern Sydney & Illawarra 9.0 (5.3-12.8) 10.3 (7.2-13.3) 9.6 (7.2-12.1)
Sydney West 11.2 (6.9-15.6) 10.0 (7.1-13.0) 10.6 (8.0-13.3)
Northern Sydney & Central Coast 9.3 (5.6-13.0) 8.0 (5.3-10.8) 8.7 (6.4-11.0)
Hunter & New England 9.6 (5.4-13.7) 9.8 (6.9-12.7) 9.7 (7.2-12.2)
North Coast 8.3 (4.9-11.6) 15.9 (12.1-19.6) 12.1 (9.6-14.7)
Greater Southern 4.5 (2.3-6.7) 11.3 (8.1-14.6) 7.9 (5.9-9.9)
Greater Western 7.4 (4.1-10.6) 14.6 (11.1-18.1) 11.0 (8.5-13.4)
Urban 10.1 (8.2-12.0) 10.2 (8.7-11.7) 10.2 (8.9-11.4)
Rural 7.8 (5.8-9.8) 12.2 (10.5-13.9) 10.0 (8.7-11.3)
NSW 9.4 (7.9-10.9) 10.8 (9.6-12.0) 10.1 (9.2-11.1)
Note: Estimates are based on 7,954 respondents in NSW. For this indicator 8 (0.10%) were not stated (Don’t know or Refused) in NSW. The question used to define the indicator was: Have you ever not collected, stopped using or cut down the dose of a medicine prescribed by yourdoctor because of the cost?
Source: New South Wales Population Health Survey 2006 (HOIST). Centre for Epidemiology and Research, NSW Department of Health.
320
WARNIN
G: Esti
mates o
ut of
date.
Please
chec
k Hea
lthStat
s NSW
for la
test e
stimate
s.
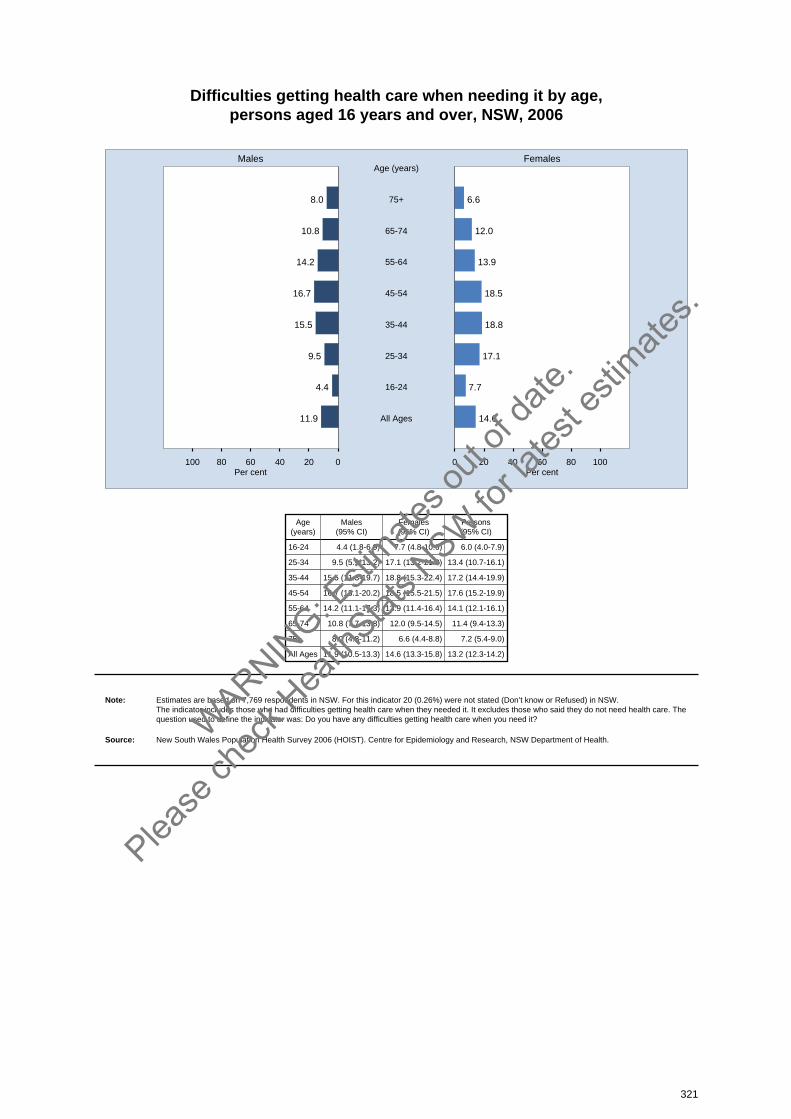
Difficulties getting health care when needing it by age, persons aged 16 years and over, NSW, 2006
020406080100 0 20 40 60 80 100
Males Females
Per cent Per cent
8.0 6.675+
Age (years)
10.8 12.065-74
14.2 13.955-64
16.7 18.545-54
15.5 18.835-44
9.5 17.125-34
4.4 7.716-24
11.9 14.6All Ages
Age(years)
Males(95% CI)
Females(95% CI)
Persons(95% CI)
16-24 4.4 (1.8-6.9) 7.7 (4.8-10.6) 6.0 (4.0-7.9)
25-34 9.5 (5.9-13.2) 17.1 (13.2-21.0) 13.4 (10.7-16.1)
35-44 15.5 (11.3-19.7) 18.8 (15.3-22.4) 17.2 (14.4-19.9)
45-54 16.7 (13.1-20.2) 18.5 (15.5-21.5) 17.6 (15.2-19.9)
55-64 14.2 (11.1-17.3) 13.9 (11.4-16.4) 14.1 (12.1-16.1)
65-74 10.8 (7.7-13.8) 12.0 (9.5-14.5) 11.4 (9.4-13.3)
75+ 8.0 (4.8-11.2) 6.6 (4.4-8.8) 7.2 (5.4-9.0)
All Ages 11.9 (10.5-13.3) 14.6 (13.3-15.8) 13.2 (12.3-14.2)
Note: Estimates are based on 7,769 respondents in NSW. For this indicator 20 (0.26%) were not stated (Don’t know or Refused) in NSW. The indicator includes those who had difficulties getting health care when they needed it. It excludes those who said they do not need health care. Thequestion used to define the indicator was: Do you have any difficulties getting health care when you need it?
Source: New South Wales Population Health Survey 2006 (HOIST). Centre for Epidemiology and Research, NSW Department of Health.
321
WARNIN
G: Esti
mates o
ut of
date.
Please
chec
k Hea
lthStat
s NSW
for la
test e
stimate
s.

Difficulties getting health care when needing it by socioeconomicdisadvantage,
persons aged 16 years and over, NSW, 2006
020406080100 0 20 40 60 80 100
Males Females
Per cent Per cent
15.0 15.65th Quintile
most disadvantaged
17.5 22.14th Quintile
12.6 15.53rd Quintile
9.8 13.42nd Quintile
4.7 7.11st Quintile
least disadvantaged
11.9 14.6NSW
Quintile ofsocioeconomicdisadvantage
Males(95% CI)
Females(95% CI)
Persons(95% CI)
5th Quintile 15.0 (11.1-18.8) 15.6 (12.6-18.6) 15.3 (12.9-17.7)
4th Quintile 17.5 (13.9-21.0) 22.1 (18.9-25.3) 19.9 (17.5-22.3)
3rd Quintile 12.6 (9.6-15.5) 15.5 (12.4-18.5) 14.0 (11.9-16.1)
2nd Quintile 9.8 (6.8-12.8) 13.4 (10.7-16.0) 11.6 (9.6-13.6)
1st Quintile 4.7 (2.5-7.0) 7.1 (4.8-9.4) 5.9 (4.3-7.5)
NSW 11.9 (10.5-13.3) 14.6 (13.3-15.8) 13.2 (12.3-14.2)
Note: Estimates are based on 7,769 respondents in NSW. For this indicator 20 (0.26%) were not stated (Don’t know or Refused) in NSW. The indicator includes those who had difficulties getting health care when they needed it. It excludes those who said they do not need health care. Thequestion used to define the indicator was: Do you have any difficulties getting health care when you need it?
Source: New South Wales Population Health Survey 2006 (HOIST). Centre for Epidemiology and Research, NSW Department of Health.
322
WARNIN
G: Esti
mates o
ut of
date.
Please
chec
k Hea
lthStat
s NSW
for la
test e
stimate
s.
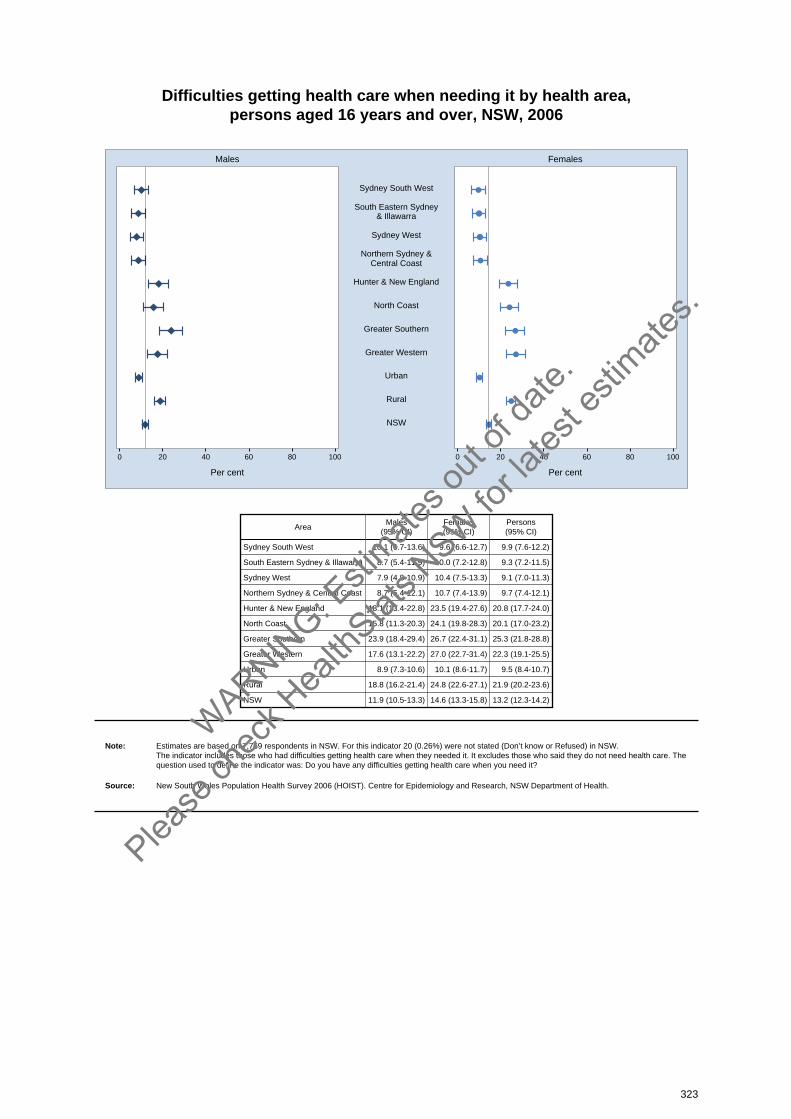
Difficulties getting health care when needing it by health area, persons aged 16 years and over, NSW, 2006
0 20 40 60 80 100 0 20 40 60 80 100
Males Females
Per cent Per cent
Sydney South West
South Eastern Sydney& Illawarra
Sydney West
Northern Sydney &Central Coast
Hunter & New England
North Coast
Greater Southern
Greater Western
Urban
Rural
NSW
AreaMales
(95% CI)Females(95% CI)
Persons(95% CI)
Sydney South West 10.1 (6.7-13.6) 9.6 (6.6-12.7) 9.9 (7.6-12.2)
South Eastern Sydney & Illawarra 8.7 (5.4-11.9) 10.0 (7.2-12.8) 9.3 (7.2-11.5)
Sydney West 7.9 (4.8-10.9) 10.4 (7.5-13.3) 9.1 (7.0-11.3)
Northern Sydney & Central Coast 8.7 (5.4-12.1) 10.7 (7.4-13.9) 9.7 (7.4-12.1)
Hunter & New England 18.1 (13.4-22.8) 23.5 (19.4-27.6) 20.8 (17.7-24.0)
North Coast 15.8 (11.3-20.3) 24.1 (19.8-28.3) 20.1 (17.0-23.2)
Greater Southern 23.9 (18.4-29.4) 26.7 (22.4-31.1) 25.3 (21.8-28.8)
Greater Western 17.6 (13.1-22.2) 27.0 (22.7-31.4) 22.3 (19.1-25.5)
Urban 8.9 (7.3-10.6) 10.1 (8.6-11.7) 9.5 (8.4-10.7)
Rural 18.8 (16.2-21.4) 24.8 (22.6-27.1) 21.9 (20.2-23.6)
NSW 11.9 (10.5-13.3) 14.6 (13.3-15.8) 13.2 (12.3-14.2)
Note: Estimates are based on 7,769 respondents in NSW. For this indicator 20 (0.26%) were not stated (Don’t know or Refused) in NSW. The indicator includes those who had difficulties getting health care when they needed it. It excludes those who said they do not need health care. Thequestion used to define the indicator was: Do you have any difficulties getting health care when you need it?
Source: New South Wales Population Health Survey 2006 (HOIST). Centre for Epidemiology and Research, NSW Department of Health.
323
WARNIN
G: Esti
mates o
ut of
date.
Please
chec
k Hea
lthStat
s NSW
for la
test e
stimate
s.
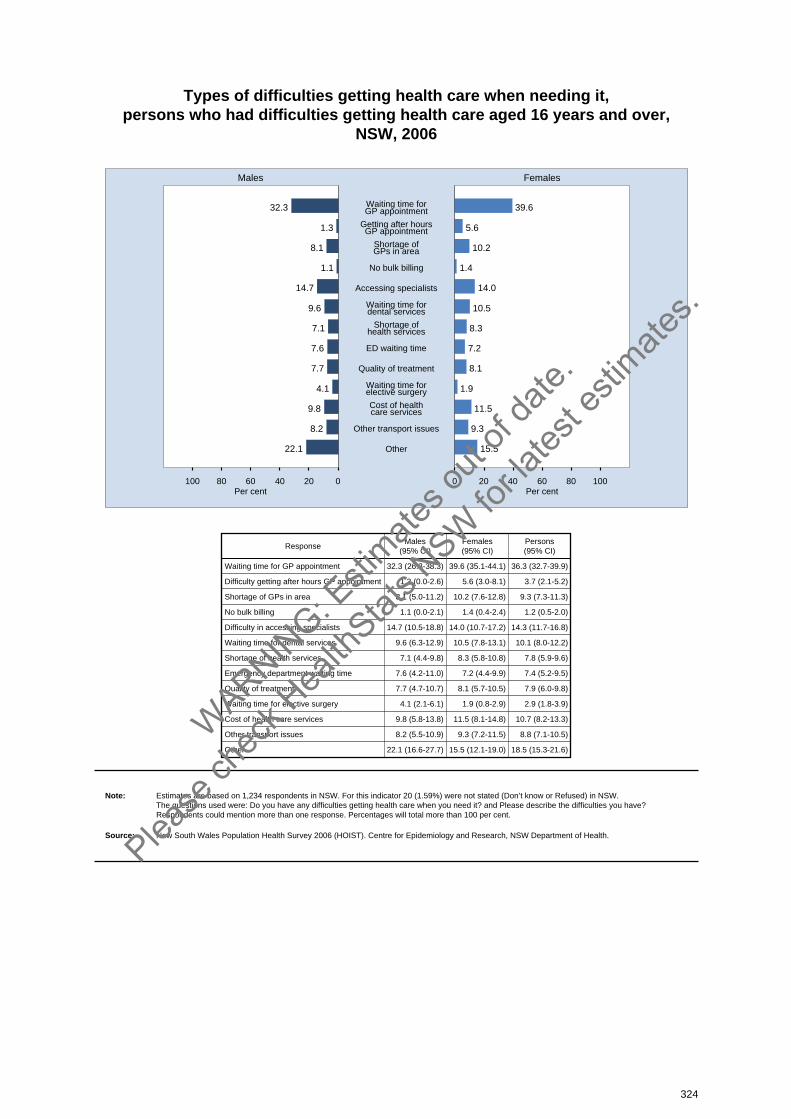
Types of difficulties getting health care when needing it, persons who had difficulties getting health care aged 16 years and over,
NSW, 2006
020406080100 0 20 40 60 80 100
Males Females
Per cent Per cent
32.3 39.6Waiting time forGP appointment
1.3 5.6Getting after hoursGP appointment
8.1 10.2Shortage ofGPs in area
1.1 1.4No bulk billing
14.7 14.0Accessing specialists
9.6 10.5Waiting time fordental services
7.1 8.3Shortage ofhealth services
7.6 7.2ED waiting time
7.7 8.1Quality of treatment
4.1 1.9Waiting time forelective surgery
9.8 11.5Cost of healthcare services
8.2 9.3Other transport issues
22.1 15.5Other
ResponseMales
(95% CI)Females(95% CI)
Persons(95% CI)
Waiting time for GP appointment 32.3 (26.3-38.3) 39.6 (35.1-44.1) 36.3 (32.7-39.9)
Difficulty getting after hours GP appointment 1.3 (0.0-2.6) 5.6 (3.0-8.1) 3.7 (2.1-5.2)
Shortage of GPs in area 8.1 (5.0-11.2) 10.2 (7.6-12.8) 9.3 (7.3-11.3)
No bulk billing 1.1 (0.0-2.1) 1.4 (0.4-2.4) 1.2 (0.5-2.0)
Difficulty in accessing specialists 14.7 (10.5-18.8) 14.0 (10.7-17.2) 14.3 (11.7-16.8)
Waiting time for dental services 9.6 (6.3-12.9) 10.5 (7.8-13.1) 10.1 (8.0-12.2)
Shortage of health services 7.1 (4.4-9.8) 8.3 (5.8-10.8) 7.8 (5.9-9.6)
Emergency department waiting time 7.6 (4.2-11.0) 7.2 (4.4-9.9) 7.4 (5.2-9.5)
Quality of treatment 7.7 (4.7-10.7) 8.1 (5.7-10.5) 7.9 (6.0-9.8)
Waiting time for elective surgery 4.1 (2.1-6.1) 1.9 (0.8-2.9) 2.9 (1.8-3.9)
Cost of health care services 9.8 (5.8-13.8) 11.5 (8.1-14.8) 10.7 (8.2-13.3)
Other transport issues 8.2 (5.5-10.9) 9.3 (7.2-11.5) 8.8 (7.1-10.5)
Other 22.1 (16.6-27.7) 15.5 (12.1-19.0) 18.5 (15.3-21.6)
Note: Estimates are based on 1,234 respondents in NSW. For this indicator 20 (1.59%) were not stated (Don’t know or Refused) in NSW. The questions used were: Do you have any difficulties getting health care when you need it? and Please describe the difficulties you have?Respondents could mention more than one response. Percentages will total more than 100 per cent.
Source: New South Wales Population Health Survey 2006 (HOIST). Centre for Epidemiology and Research, NSW Department of Health.
324
WARNIN
G: Esti
mates o
ut of
date.
Please
chec
k Hea
lthStat
s NSW
for la
test e
stimate
s.
Emergency department presentations
IntroductionIn 2006, among adults aged 16 years and over, there were approximately 1,374,000 presentations toemergency departments in New South Wales hospitals.[1] To monitor the quality of care received atemergency departments, in 2006 the New South Wales Population Health Survey asked respondents:In the last 12 months, have you attended a hospital emergency department (or casualty) for your ownmedical care? Overall, what do you think of the care you received at this emergency department? Ifcare was rated as Fair or Poor, respondents were also asked: Could you briefly describe why yourated the care you received as Fair or Poor?
Results
Presentations to emergency departments
In 2006, the New South Wales Population Health Survey estimated that approximately 14.1 per cent ofadults presented to an emergency department on one or more occasions in the previous 12 months.There was no significant variation between males and females. A significantly higher proportion ofadults aged 75 years and over (18.3 per cent) presented to an emergency department, compared withthe overall adult population.
A significantly higher proportion of adults in rural areas (17.8 per cent) than urban areas (12.4 percent) presented to an emergency department. A higher proportion of adults in the North Coast (20.6per cent) and Greater Western (20.0 per cent) Health Areas, and a lower proportion of adults in theSydney West Health Area (11.2 per cent), presented to an emergency department, compared with theoverall adult population.
There was no variation in the proportion of adults presenting to an emergency department by level ofsocioeconomic disadvantage.
Overall, emergency department presentations did not vary significantly between 1997 and 2006,although there was significant increase in females (12.0 per cent to 14.0 per cent).
Rating of emergency department care
Those who presented to an emergency department were asked to rate the care they received: 32.2per cent rated their care as excellent, 26.0 per cent as very good, 23.0 per cent as good, 9.4 per centas fair, and 9.5 per cent as poor. Responses of excellent, very good and good were combined into apositive rating of care.
Overall, 81.1 per cent of adults gave a positive rating to the care they received. There was nosignificant variation between males and females. A significantly higher proportion of adults aged 65-74years (92.9 per cent) and 75 years and over (91.3 per cent) rated their care positively, compared withthe overall adult population.
Overall, a significantly higher proportion of adults in rural areas (86.4 per cent) than urban areas (77.8per cent) rated their care positively. A higher proportion of adults in the Greater Southern Health Area(87.9 per cent) rated their care positively, compared with the overall adult population.
There was no variation in the proportion of adults who rated their care positively by level ofsocioeconomic disadvantage.
The proportion of adults who rated their care positively did not vary significantly between 1997 and 2006.
325
WARNIN
G: Esti
mates o
ut of
date.
Please
chec
k Hea
lthStat
s NSW
for la
test e
stimate
s.
The main reason for rating care as fair or poor was waiting time (65.0 per cent) followed by: poor orinadequate service (30.2 per cent), poor attitude of clinical staff (14.5 per cent), poor technical skill ofclinical staff (13.2 per cent), communication problems (12.9 per cent), not enough staff (12.8 per cent),inadequate medication or management (8.8 per cent), misdiagnosis or contradictory diagnosis (4.0 percent), sent home without treatment or follow-up (2.7 per cent), and poor accommodation quality (2.6per cent).
References1. NSW Emergency Department Data 2006 (HOIST). Centre for Epidemiology and Research, NSW
Department of Health.
326
WARNIN
G: Esti
mates o
ut of
date.
Please
chec
k Hea
lthStat
s NSW
for la
test e
stimate
s.
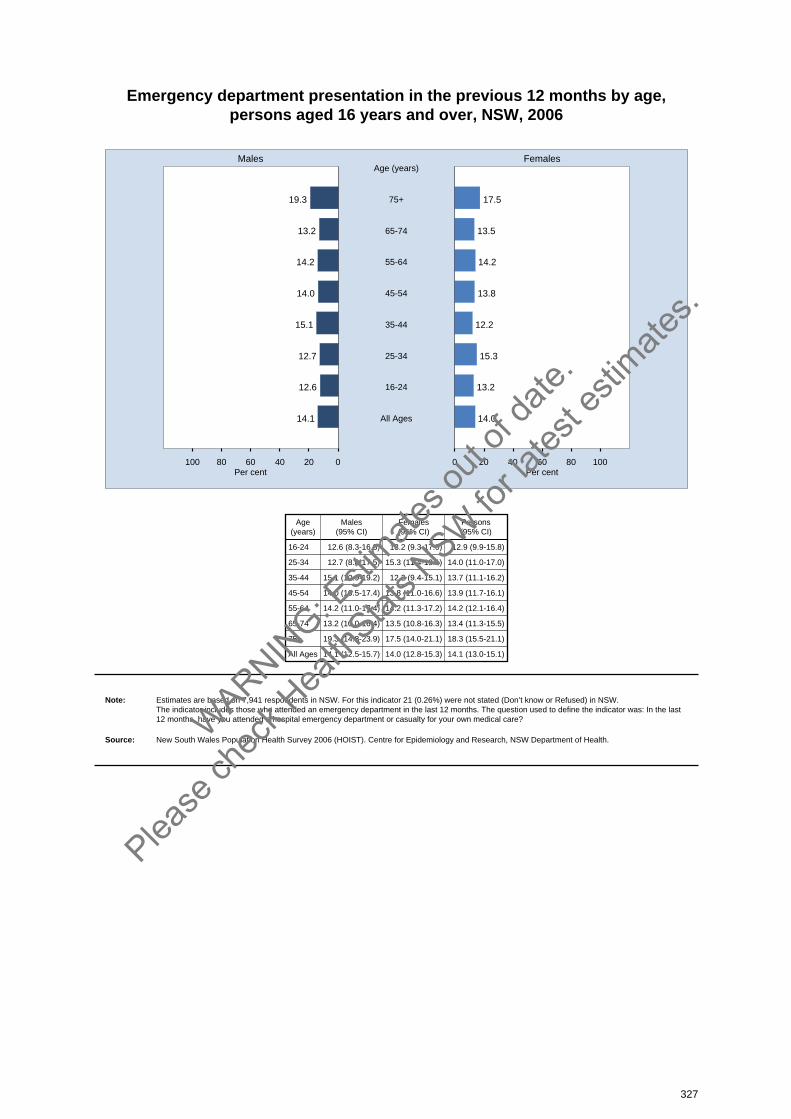
Emergency department presentation in the previous 12 months by age, persons aged 16 years and over, NSW, 2006
020406080100 0 20 40 60 80 100
Males Females
Per cent Per cent
19.3 17.575+
Age (years)
13.2 13.565-74
14.2 14.255-64
14.0 13.845-54
15.1 12.235-44
12.7 15.325-34
12.6 13.216-24
14.1 14.0All Ages
Age(years)
Males(95% CI)
Females(95% CI)
Persons(95% CI)
16-24 12.6 (8.3-16.8) 13.2 (9.3-17.0) 12.9 (9.9-15.8)
25-34 12.7 (8.0-17.5) 15.3 (11.4-19.1) 14.0 (11.0-17.0)
35-44 15.1 (10.9-19.2) 12.2 (9.4-15.1) 13.7 (11.1-16.2)
45-54 14.0 (10.5-17.4) 13.8 (11.0-16.6) 13.9 (11.7-16.1)
55-64 14.2 (11.0-17.4) 14.2 (11.3-17.2) 14.2 (12.1-16.4)
65-74 13.2 (10.0-16.4) 13.5 (10.8-16.3) 13.4 (11.3-15.5)
75+ 19.3 (14.8-23.9) 17.5 (14.0-21.1) 18.3 (15.5-21.1)
All Ages 14.1 (12.5-15.7) 14.0 (12.8-15.3) 14.1 (13.0-15.1)
Note: Estimates are based on 7,941 respondents in NSW. For this indicator 21 (0.26%) were not stated (Don’t know or Refused) in NSW. The indicator includes those who attended an emergency department in the last 12 months. The question used to define the indicator was: In the last12 months, have you attended a hospital emergency department or casualty for your own medical care?
Source: New South Wales Population Health Survey 2006 (HOIST). Centre for Epidemiology and Research, NSW Department of Health.
327
WARNIN
G: Esti
mates o
ut of
date.
Please
chec
k Hea
lthStat
s NSW
for la
test e
stimate
s.
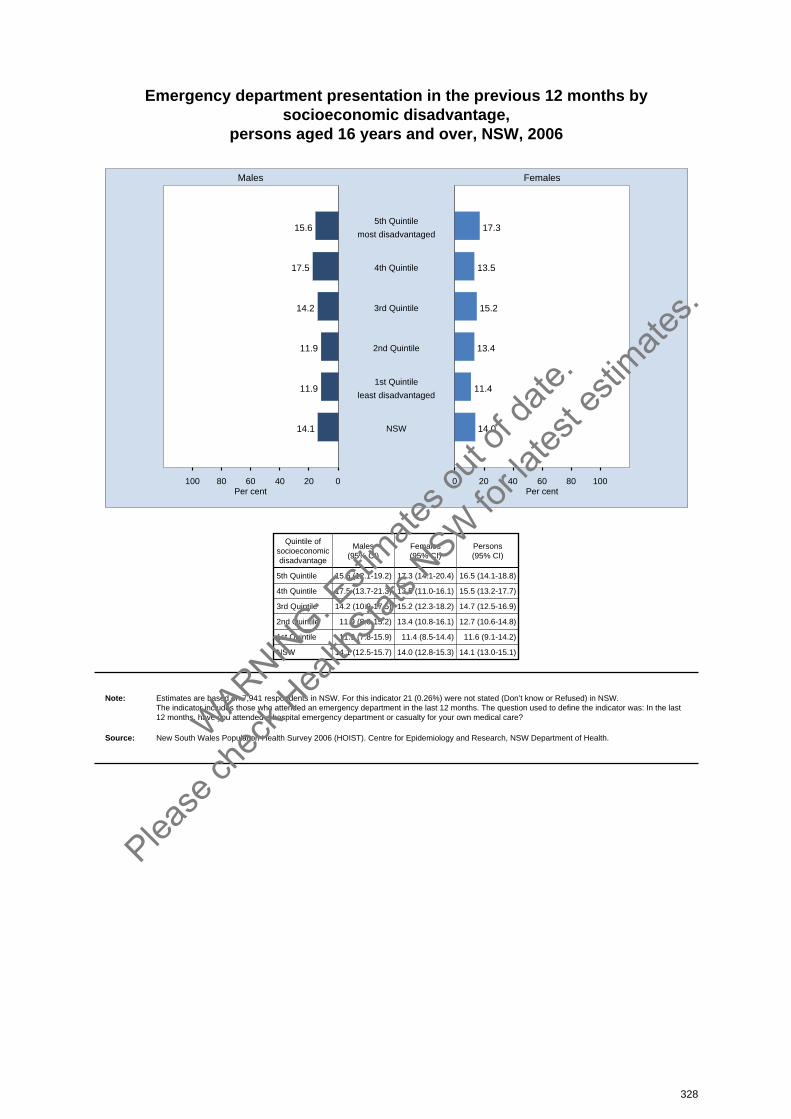
Emergency department presentation in the previous 12 months bysocioeconomic disadvantage,
persons aged 16 years and over, NSW, 2006
020406080100 0 20 40 60 80 100
Males Females
Per cent Per cent
15.6 17.35th Quintile
most disadvantaged
17.5 13.54th Quintile
14.2 15.23rd Quintile
11.9 13.42nd Quintile
11.9 11.41st Quintile
least disadvantaged
14.1 14.0NSW
Quintile ofsocioeconomicdisadvantage
Males(95% CI)
Females(95% CI)
Persons(95% CI)
5th Quintile 15.6 (12.1-19.2) 17.3 (14.1-20.4) 16.5 (14.1-18.8)
4th Quintile 17.5 (13.7-21.3) 13.5 (11.0-16.1) 15.5 (13.2-17.7)
3rd Quintile 14.2 (10.9-17.5) 15.2 (12.3-18.2) 14.7 (12.5-16.9)
2nd Quintile 11.9 (8.6-15.2) 13.4 (10.8-16.1) 12.7 (10.6-14.8)
1st Quintile 11.9 (7.8-15.9) 11.4 (8.5-14.4) 11.6 (9.1-14.2)
NSW 14.1 (12.5-15.7) 14.0 (12.8-15.3) 14.1 (13.0-15.1)
Note: Estimates are based on 7,941 respondents in NSW. For this indicator 21 (0.26%) were not stated (Don’t know or Refused) in NSW. The indicator includes those who attended an emergency department in the last 12 months. The question used to define the indicator was: In the last12 months, have you attended a hospital emergency department or casualty for your own medical care?
Source: New South Wales Population Health Survey 2006 (HOIST). Centre for Epidemiology and Research, NSW Department of Health.
328
WARNIN
G: Esti
mates o
ut of
date.
Please
chec
k Hea
lthStat
s NSW
for la
test e
stimate
s.
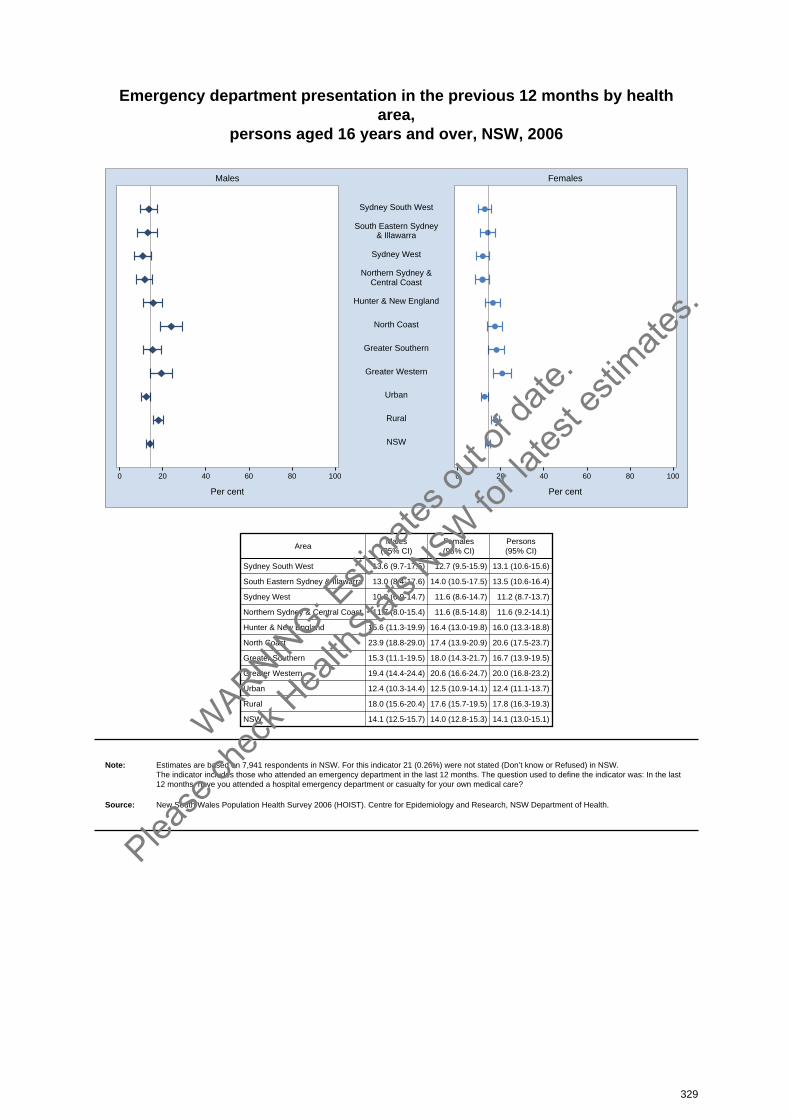
Emergency department presentation in the previous 12 months by healtharea,
persons aged 16 years and over, NSW, 2006
0 20 40 60 80 100 0 20 40 60 80 100
Males Females
Per cent Per cent
Sydney South West
South Eastern Sydney& Illawarra
Sydney West
Northern Sydney &Central Coast
Hunter & New England
North Coast
Greater Southern
Greater Western
Urban
Rural
NSW
AreaMales
(95% CI)Females(95% CI)
Persons(95% CI)
Sydney South West 13.6 (9.7-17.5) 12.7 (9.5-15.9) 13.1 (10.6-15.6)
South Eastern Sydney & Illawarra 13.0 (8.4-17.6) 14.0 (10.5-17.5) 13.5 (10.6-16.4)
Sydney West 10.8 (6.9-14.7) 11.6 (8.6-14.7) 11.2 (8.7-13.7)
Northern Sydney & Central Coast 11.7 (8.0-15.4) 11.6 (8.5-14.8) 11.6 (9.2-14.1)
Hunter & New England 15.6 (11.3-19.9) 16.4 (13.0-19.8) 16.0 (13.3-18.8)
North Coast 23.9 (18.8-29.0) 17.4 (13.9-20.9) 20.6 (17.5-23.7)
Greater Southern 15.3 (11.1-19.5) 18.0 (14.3-21.7) 16.7 (13.9-19.5)
Greater Western 19.4 (14.4-24.4) 20.6 (16.6-24.7) 20.0 (16.8-23.2)
Urban 12.4 (10.3-14.4) 12.5 (10.9-14.1) 12.4 (11.1-13.7)
Rural 18.0 (15.6-20.4) 17.6 (15.7-19.5) 17.8 (16.3-19.3)
NSW 14.1 (12.5-15.7) 14.0 (12.8-15.3) 14.1 (13.0-15.1)
Note: Estimates are based on 7,941 respondents in NSW. For this indicator 21 (0.26%) were not stated (Don’t know or Refused) in NSW. The indicator includes those who attended an emergency department in the last 12 months. The question used to define the indicator was: In the last12 months, have you attended a hospital emergency department or casualty for your own medical care?
Source: New South Wales Population Health Survey 2006 (HOIST). Centre for Epidemiology and Research, NSW Department of Health.
329
WARNIN
G: Esti
mates o
ut of
date.
Please
chec
k Hea
lthStat
s NSW
for la
test e
stimate
s.
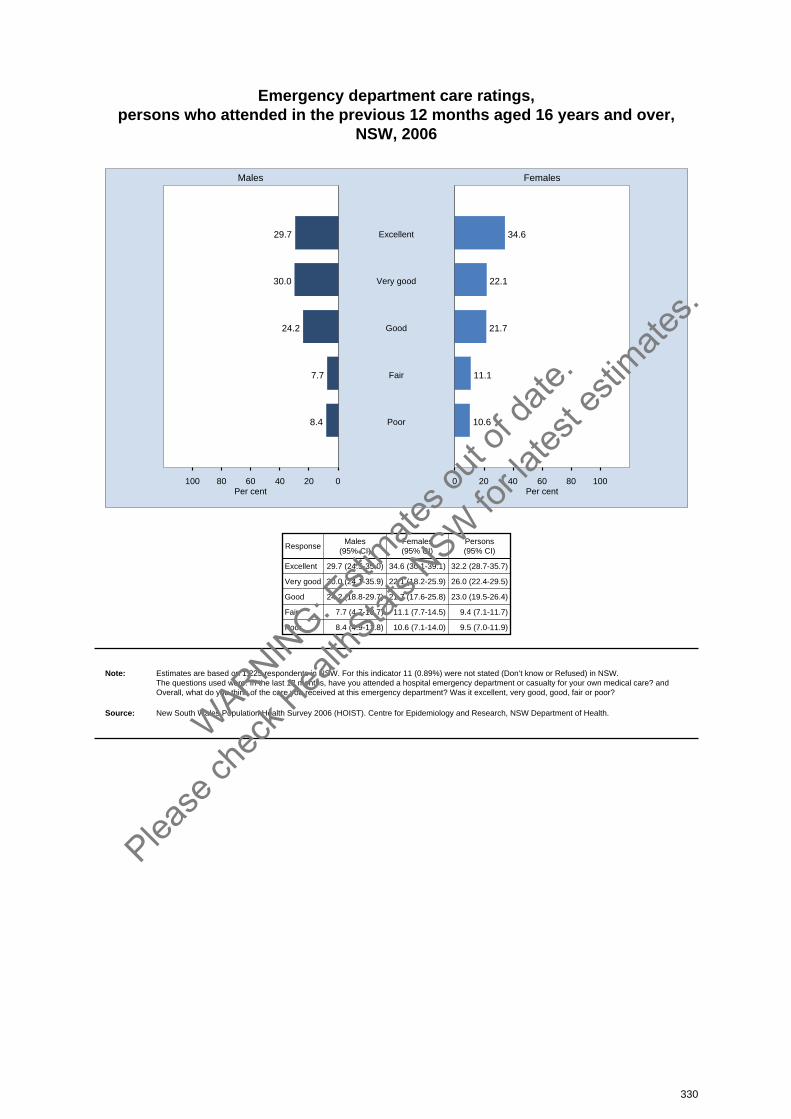
Emergency department care ratings, persons who attended in the previous 12 months aged 16 years and over,
NSW, 2006
020406080100 0 20 40 60 80 100
Males Females
Per cent Per cent
29.7 34.6Excellent
30.0 22.1Very good
24.2 21.7Good
7.7 11.1Fair
8.4 10.6Poor
ResponseMales
(95% CI)Females(95% CI)
Persons(95% CI)
Excellent 29.7 (24.5-35.0) 34.6 (30.1-39.1) 32.2 (28.7-35.7)
Very good 30.0 (24.1-35.9) 22.1 (18.2-25.9) 26.0 (22.4-29.5)
Good 24.2 (18.8-29.7) 21.7 (17.6-25.8) 23.0 (19.5-26.4)
Fair 7.7 (4.7-10.7) 11.1 (7.7-14.5) 9.4 (7.1-11.7)
Poor 8.4 (4.9-11.8) 10.6 (7.1-14.0) 9.5 (7.0-11.9)
Note: Estimates are based on 1,225 respondents in NSW. For this indicator 11 (0.89%) were not stated (Don’t know or Refused) in NSW. The questions used were: In the last 12 months, have you attended a hospital emergency department or casualty for your own medical care? andOverall, what do you think of the care you received at this emergency department? Was it excellent, very good, good, fair or poor?
Source: New South Wales Population Health Survey 2006 (HOIST). Centre for Epidemiology and Research, NSW Department of Health.
330
WARNIN
G: Esti
mates o
ut of
date.
Please
chec
k Hea
lthStat
s NSW
for la
test e
stimate
s.
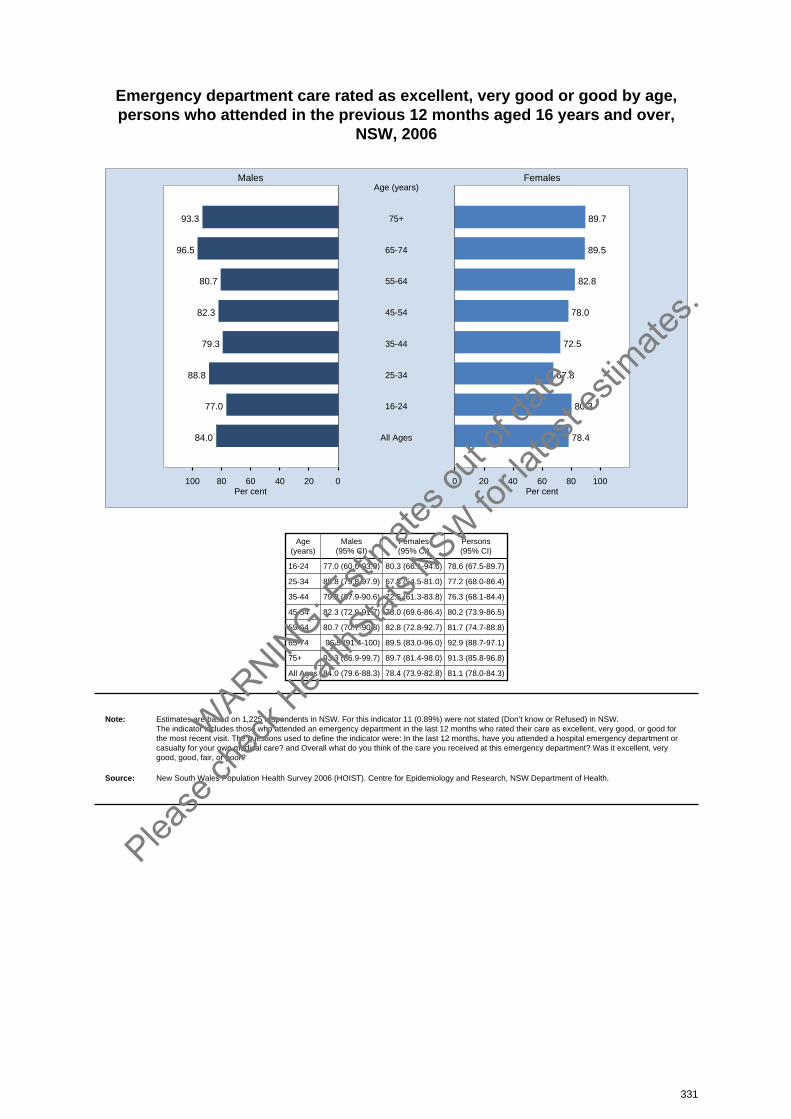
Emergency department care rated as excellent, very good or good by age, persons who attended in the previous 12 months aged 16 years and over,
NSW, 2006
020406080100 0 20 40 60 80 100
Males Females
Per cent Per cent
93.3 89.775+
Age (years)
96.5 89.565-74
80.7 82.855-64
82.3 78.045-54
79.3 72.535-44
88.8 67.825-34
77.0 80.316-24
84.0 78.4All Ages
Age(years)
Males(95% CI)
Females(95% CI)
Persons(95% CI)
16-24 77.0 (60.0-93.9) 80.3 (66.1-94.6) 78.6 (67.5-89.7)
25-34 88.8 (79.8-97.9) 67.8 (54.5-81.0) 77.2 (68.0-86.4)
35-44 79.3 (67.9-90.6) 72.5 (61.3-83.8) 76.3 (68.1-84.4)
45-54 82.3 (72.9-91.7) 78.0 (69.6-86.4) 80.2 (73.9-86.5)
55-64 80.7 (70.7-90.8) 82.8 (72.8-92.7) 81.7 (74.7-88.8)
65-74 96.5 (91.4-100) 89.5 (83.0-96.0) 92.9 (88.7-97.1)
75+ 93.3 (86.9-99.7) 89.7 (81.4-98.0) 91.3 (85.8-96.8)
All Ages 84.0 (79.6-88.3) 78.4 (73.9-82.8) 81.1 (78.0-84.3)
Note: Estimates are based on 1,225 respondents in NSW. For this indicator 11 (0.89%) were not stated (Don’t know or Refused) in NSW. The indicator includes those who attended an emergency department in the last 12 months who rated their care as excellent, very good, or good forthe most recent visit. The questions used to define the indicator were: In the last 12 months, have you attended a hospital emergency department orcasualty for your own medical care? and Overall what do you think of the care you received at this emergency department? Was it excellent, verygood, good, fair, or poor?
Source: New South Wales Population Health Survey 2006 (HOIST). Centre for Epidemiology and Research, NSW Department of Health.
331
WARNIN
G: Esti
mates o
ut of
date.
Please
chec
k Hea
lthStat
s NSW
for la
test e
stimate
s.
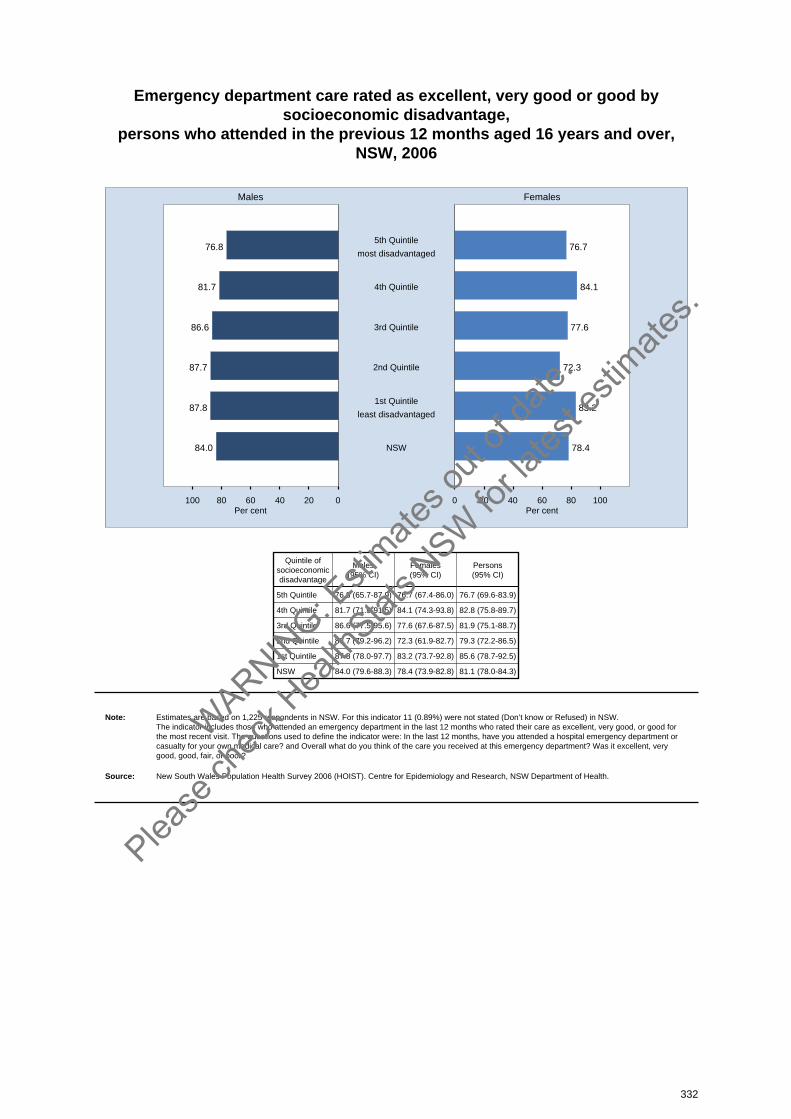
Emergency department care rated as excellent, very good or good bysocioeconomic disadvantage,
persons who attended in the previous 12 months aged 16 years and over,NSW, 2006
020406080100 0 20 40 60 80 100
Males Females
Per cent Per cent
76.8 76.75th Quintile
most disadvantaged
81.7 84.14th Quintile
86.6 77.63rd Quintile
87.7 72.32nd Quintile
87.8 83.21st Quintile
least disadvantaged
84.0 78.4NSW
Quintile ofsocioeconomicdisadvantage
Males(95% CI)
Females(95% CI)
Persons(95% CI)
5th Quintile 76.8 (65.7-87.9) 76.7 (67.4-86.0) 76.7 (69.6-83.9)
4th Quintile 81.7 (71.9-91.5) 84.1 (74.3-93.8) 82.8 (75.8-89.7)
3rd Quintile 86.6 (77.5-95.6) 77.6 (67.6-87.5) 81.9 (75.1-88.7)
2nd Quintile 87.7 (79.2-96.2) 72.3 (61.9-82.7) 79.3 (72.2-86.5)
1st Quintile 87.8 (78.0-97.7) 83.2 (73.7-92.8) 85.6 (78.7-92.5)
NSW 84.0 (79.6-88.3) 78.4 (73.9-82.8) 81.1 (78.0-84.3)
Note: Estimates are based on 1,225 respondents in NSW. For this indicator 11 (0.89%) were not stated (Don’t know or Refused) in NSW. The indicator includes those who attended an emergency department in the last 12 months who rated their care as excellent, very good, or good forthe most recent visit. The questions used to define the indicator were: In the last 12 months, have you attended a hospital emergency department orcasualty for your own medical care? and Overall what do you think of the care you received at this emergency department? Was it excellent, verygood, good, fair, or poor?
Source: New South Wales Population Health Survey 2006 (HOIST). Centre for Epidemiology and Research, NSW Department of Health.
332
WARNIN
G: Esti
mates o
ut of
date.
Please
chec
k Hea
lthStat
s NSW
for la
test e
stimate
s.

Emergency department care rated as excellent, very good or good by healtharea,
persons who attended in the previous 12 months aged 16 years and over,NSW, 2006
0 20 40 60 80 100 0 20 40 60 80 100
Males Females
Per cent Per cent
Sydney South West
South Eastern Sydney& Illawarra
Sydney West
Northern Sydney &Central Coast
Hunter & New England
North Coast
Greater Southern
Greater Western
Urban
Rural
NSW
AreaMales
(95% CI)Females(95% CI)
Persons(95% CI)
Sydney South West 69.6 (54.3-85.0) 74.0 (61.2-86.8) 71.8 (61.8-81.8)
South Eastern Sydney & Illawarra 88.8 (80.3-97.3) 69.4 (55.5-83.3) 78.9 (69.8-87.9)
Sydney West 88.2 (76.9-99.4) 75.5 (63.6-87.4) 81.6 (73.2-90.0)
Northern Sydney & Central Coast 84.9 (72.9-97.0) 77.8 (65.1-90.5) 81.2 (72.4-90.1)
Hunter & New England 92.4 (85.8-99.0) 82.2 (73.3-91.1) 87.1 (81.3-92.9)
North Coast 80.1 (70.6-89.6) 90.5 (84.7-96.3) 84.6 (78.5-90.6)
Greater Southern 92.5 (86.1-98.9) 83.9 (76.1-91.6) 87.9 (82.7-93.0)
Greater Western 82.6 (70.6-94.6) 89.6 (82.5-96.7) 86.2 (79.2-93.1)
Urban 82.0 (75.4-88.5) 73.9 (67.3-80.4) 77.8 (73.1-82.5)
Rural 87.1 (82.7-91.5) 85.7 (81.5-89.9) 86.4 (83.4-89.5)
NSW 84.0 (79.6-88.3) 78.4 (73.9-82.8) 81.1 (78.0-84.3)
Note: Estimates are based on 1,225 respondents in NSW. For this indicator 11 (0.89%) were not stated (Don’t know or Refused) in NSW. The indicator includes those who attended an emergency department in the last 12 months who rated their care as excellent, very good, or good forthe most recent visit. The questions used to define the indicator were: In the last 12 months, have you attended a hospital emergency department orcasualty for your own medical care? and Overall what do you think of the care you received at this emergency department? Was it excellent, verygood, good, fair, or poor?
Source: New South Wales Population Health Survey 2006 (HOIST). Centre for Epidemiology and Research, NSW Department of Health.
333
WARNIN
G: Esti
mates o
ut of
date.
Please
chec
k Hea
lthStat
s NSW
for la
test e
stimate
s.
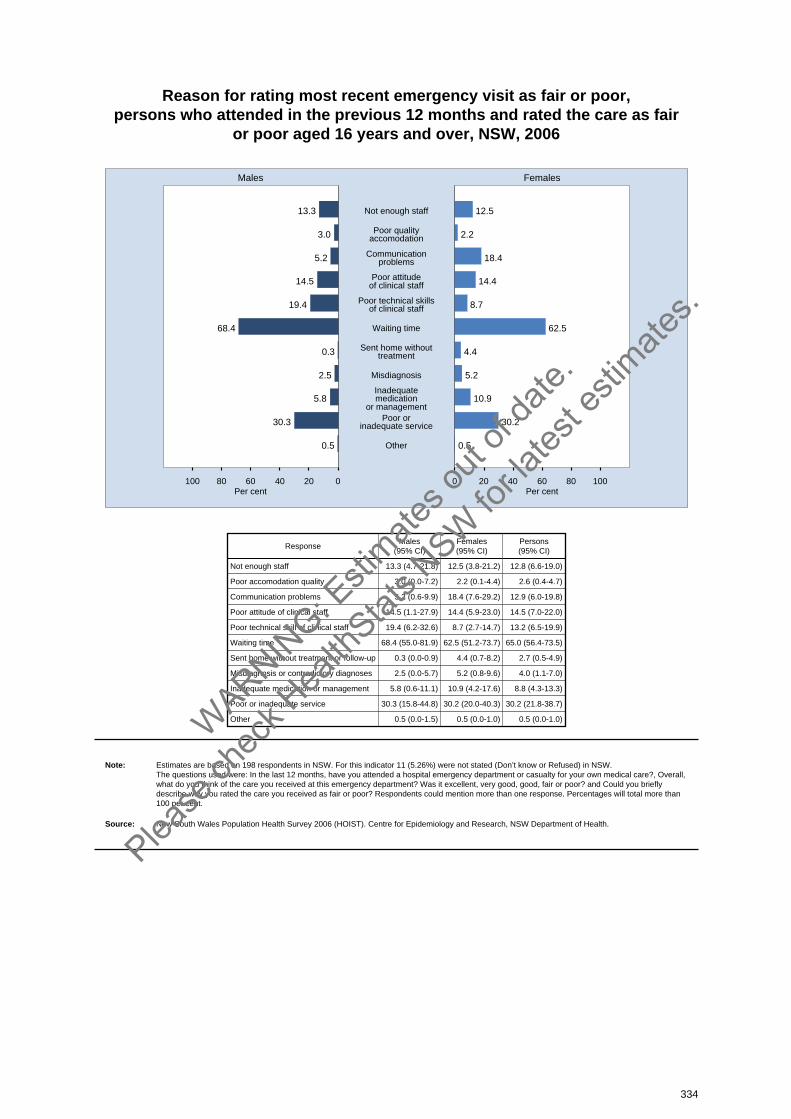
Reason for rating most recent emergency visit as fair or poor, persons who attended in the previous 12 months and rated the care as fair
or poor aged 16 years and over, NSW, 2006
020406080100 0 20 40 60 80 100
Males Females
Per cent Per cent
13.3 12.5Not enough staff
3.0 2.2Poor qualityaccomodation
5.2 18.4Communicationproblems
14.5 14.4Poor attitudeof clinical staff
19.4 8.7Poor technical skillsof clinical staff
68.4 62.5Waiting time
0.3 4.4Sent home withouttreatment
2.5 5.2Misdiagnosis
5.8 10.9Inadequatemedication
or management
30.3 30.2Poor orinadequate service
0.5 0.5Other
ResponseMales
(95% CI)Females(95% CI)
Persons(95% CI)
Not enough staff 13.3 (4.7-21.8) 12.5 (3.8-21.2) 12.8 (6.6-19.0)
Poor accomodation quality 3.0 (0.0-7.2) 2.2 (0.1-4.4) 2.6 (0.4-4.7)
Communication problems 5.2 (0.6-9.9) 18.4 (7.6-29.2) 12.9 (6.0-19.8)
Poor attitude of clinical staff 14.5 (1.1-27.9) 14.4 (5.9-23.0) 14.5 (7.0-22.0)
Poor technical skill of clinical staff 19.4 (6.2-32.6) 8.7 (2.7-14.7) 13.2 (6.5-19.9)
Waiting time 68.4 (55.0-81.9) 62.5 (51.2-73.7) 65.0 (56.4-73.5)
Sent home without treatment or follow-up 0.3 (0.0-0.9) 4.4 (0.7-8.2) 2.7 (0.5-4.9)
Misdiagnosis or contradictory diagnoses 2.5 (0.0-5.7) 5.2 (0.8-9.6) 4.0 (1.1-7.0)
Inadequate medication or management 5.8 (0.6-11.1) 10.9 (4.2-17.6) 8.8 (4.3-13.3)
Poor or inadequate service 30.3 (15.8-44.8) 30.2 (20.0-40.3) 30.2 (21.8-38.7)
Other 0.5 (0.0-1.5) 0.5 (0.0-1.0) 0.5 (0.0-1.0)
Note: Estimates are based on 198 respondents in NSW. For this indicator 11 (5.26%) were not stated (Don’t know or Refused) in NSW. The questions used were: In the last 12 months, have you attended a hospital emergency department or casualty for your own medical care?, Overall,what do you think of the care you received at this emergency department? Was it excellent, very good, good, fair or poor? and Could you brieflydescribe why you rated the care you received as fair or poor? Respondents could mention more than one response. Percentages will total more than100 per cent.
Source: New South Wales Population Health Survey 2006 (HOIST). Centre for Epidemiology and Research, NSW Department of Health.
334
WARNIN
G: Esti
mates o
ut of
date.
Please
chec
k Hea
lthStat
s NSW
for la
test e
stimate
s.
Hospital admissions
IntroductionIn the 2004-05 financial year there were approximately 1,998,000 admissions to New South Waleshospitals among adults aged 16 years and over.[1] To monitor the quality of care received in publichospitals, in 2006 the New South Wales Population Health Survey asked respondents: In the last 12months, have you stayed for at least one night in hospital? Overall, what do you think of the care youreceived at this hospital? If care was rated as Fair or Poor, respondents were also asked: Could youbriefly describe why you rated the care you received as Fair or Poor?
Results
Admissions to hospitals
In 2006, the New South Wales Population Health Survey estimated that about 14.1 per cent of adultswere admitted to hospital on one or more occasions in the previous 12 months. A significantly higherproportion of females (15.4 per cent) than males (12.7 per cent) were admitted to hospital. Amongmales, a significantly lower proportion of adults aged 16-24 years (5.5 per cent), and a significantlyhigher proportion of adults aged 65-74 years (19.7 per cent) and 75 years and over (32.6 per cent),were admitted to hospital, compared with the overall adult male population. Among females, asignificantly lower proportion of adults aged 16-24 years (8.3 per cent) and 45-54 years (11.7 percent), and a significantly higher proportion of adults aged 25-34 years (22.1 per cent) and 75 yearsand over (22.4 per cent), were admitted to hospital, compared with the overall adult female population.
There was no significant variation in hospital admissions between adults in rural areas and urbanareas, or by level of socioeconomic disadvantage. A higher proportion of adults in the Greater WesternHealth Area (18.5 per cent) were admitted to hospital, compared with the overall adult population.Rates of hospital admissions have not varied significantly between 1997 and 2006.
Rating of hospital care
Those who were admitted to hospital were asked to rate the care they received. Overall, 43.5 per centrated their care as excellent, 28.8 per cent as very good, 17.9 per cent as good, 5.9 per cent as fair,and 3.9 per cent as poor. Responses of excellent, very good, and good were combined into a positiverating of care.
Overall, 90.2 per cent of adults rated their care positively. There was no significant variation betweenmales and females. A significantly lower proportion of adults aged 16-24 years (73.9 per cent) ratedtheir care positively, compared with the overall adult population. There was no significant variation inratings of positive care between adults in rural areas and urban areas, or among health areas, or bylevel of socioeconomic disadvantage. Overall, the proportion of adults who rated their hospital carepositively has not varied significantly between 1997 and 2006.
The main reasons for rating care as fair or poor were: excessive waiting time for care (23.9 per cent),poor attitude of clinical staff (15.7 per cent), poor quality accommodation (15.0 per cent), not enoughstaff (11.3 per cent), poor technical skill of clinical staff (11.1 per cent), communication problems (8.1per cent), hospital could not offer required care (8.7 per cent), inadequate medication or management(4.6 per cent), and poor or inadequate food (1.1 per cent).
References1. Inpatient Statistics Collection 2005-06 (HOIST). Centre for Epidemiology and Research, NSW
Department of Health.
335
WARNIN
G: Esti
mates o
ut of
date.
Please
chec
k Hea
lthStat
s NSW
for la
test e
stimate
s.
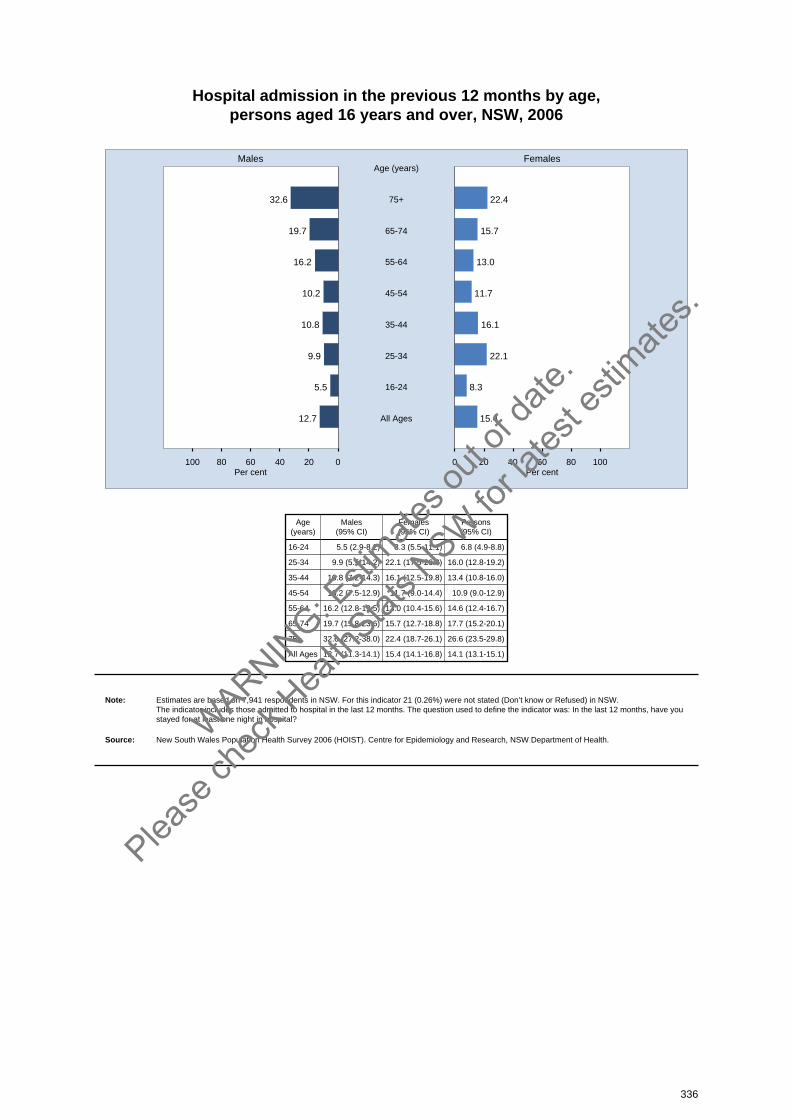
Hospital admission in the previous 12 months by age, persons aged 16 years and over, NSW, 2006
020406080100 0 20 40 60 80 100
Males Females
Per cent Per cent
32.6 22.475+
Age (years)
19.7 15.765-74
16.2 13.055-64
10.2 11.745-54
10.8 16.135-44
9.9 22.125-34
5.5 8.316-24
12.7 15.4All Ages
Age(years)
Males(95% CI)
Females(95% CI)
Persons(95% CI)
16-24 5.5 (2.9-8.2) 8.3 (5.5-11.1) 6.8 (4.9-8.8)
25-34 9.9 (5.5-14.2) 22.1 (17.5-26.8) 16.0 (12.8-19.2)
35-44 10.8 (7.2-14.3) 16.1 (12.5-19.8) 13.4 (10.8-16.0)
45-54 10.2 (7.5-12.9) 11.7 (9.0-14.4) 10.9 (9.0-12.9)
55-64 16.2 (12.8-19.5) 13.0 (10.4-15.6) 14.6 (12.4-16.7)
65-74 19.7 (15.8-23.6) 15.7 (12.7-18.8) 17.7 (15.2-20.1)
75+ 32.6 (27.2-38.0) 22.4 (18.7-26.1) 26.6 (23.5-29.8)
All Ages 12.7 (11.3-14.1) 15.4 (14.1-16.8) 14.1 (13.1-15.1)
Note: Estimates are based on 7,941 respondents in NSW. For this indicator 21 (0.26%) were not stated (Don’t know or Refused) in NSW. The indicator includes those admitted to hospital in the last 12 months. The question used to define the indicator was: In the last 12 months, have youstayed for at least one night in hospital?
Source: New South Wales Population Health Survey 2006 (HOIST). Centre for Epidemiology and Research, NSW Department of Health.
336
WARNIN
G: Esti
mates o
ut of
date.
Please
chec
k Hea
lthStat
s NSW
for la
test e
stimate
s.
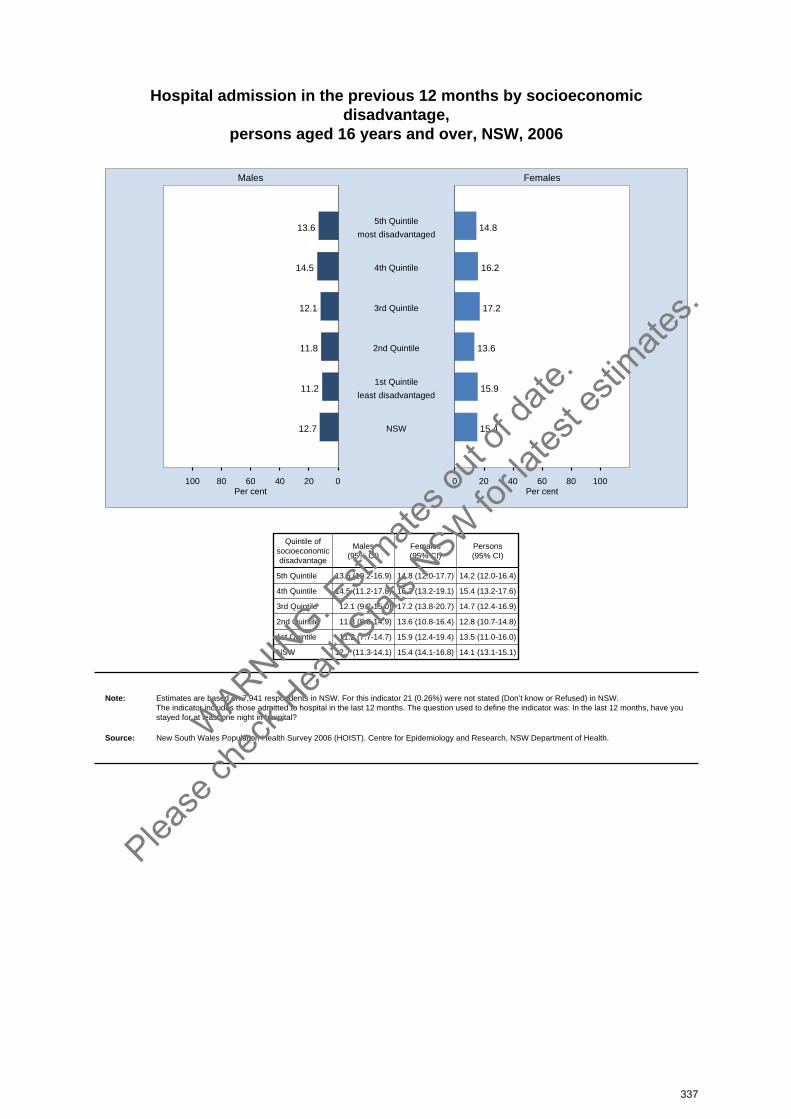
Hospital admission in the previous 12 months by socioeconomicdisadvantage,
persons aged 16 years and over, NSW, 2006
020406080100 0 20 40 60 80 100
Males Females
Per cent Per cent
13.6 14.85th Quintile
most disadvantaged
14.5 16.24th Quintile
12.1 17.23rd Quintile
11.8 13.62nd Quintile
11.2 15.91st Quintile
least disadvantaged
12.7 15.4NSW
Quintile ofsocioeconomicdisadvantage
Males(95% CI)
Females(95% CI)
Persons(95% CI)
5th Quintile 13.6 (10.2-16.9) 14.8 (12.0-17.7) 14.2 (12.0-16.4)
4th Quintile 14.5 (11.2-17.8) 16.2 (13.2-19.1) 15.4 (13.2-17.6)
3rd Quintile 12.1 (9.2-15.0) 17.2 (13.8-20.7) 14.7 (12.4-16.9)
2nd Quintile 11.8 (8.8-14.9) 13.6 (10.8-16.4) 12.8 (10.7-14.8)
1st Quintile 11.2 (7.7-14.7) 15.9 (12.4-19.4) 13.5 (11.0-16.0)
NSW 12.7 (11.3-14.1) 15.4 (14.1-16.8) 14.1 (13.1-15.1)
Note: Estimates are based on 7,941 respondents in NSW. For this indicator 21 (0.26%) were not stated (Don’t know or Refused) in NSW. The indicator includes those admitted to hospital in the last 12 months. The question used to define the indicator was: In the last 12 months, have youstayed for at least one night in hospital?
Source: New South Wales Population Health Survey 2006 (HOIST). Centre for Epidemiology and Research, NSW Department of Health.
337
WARNIN
G: Esti
mates o
ut of
date.
Please
chec
k Hea
lthStat
s NSW
for la
test e
stimate
s.
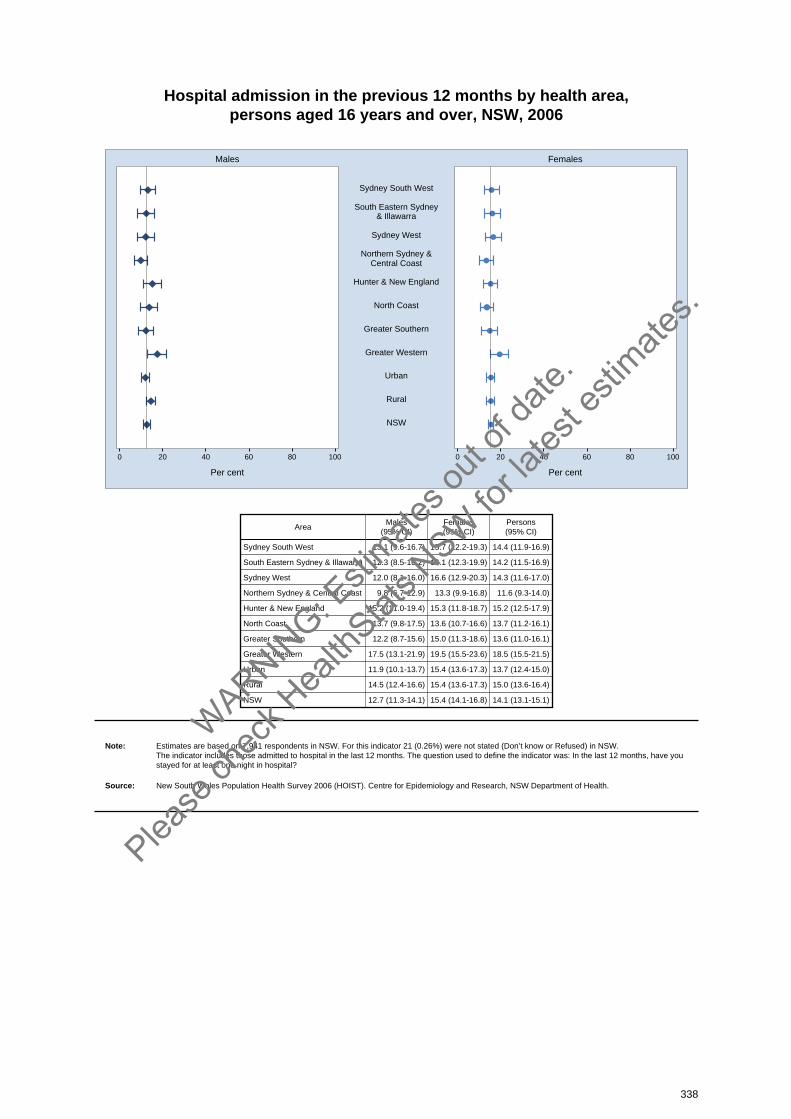
Hospital admission in the previous 12 months by health area, persons aged 16 years and over, NSW, 2006
0 20 40 60 80 100 0 20 40 60 80 100
Males Females
Per cent Per cent
Sydney South West
South Eastern Sydney& Illawarra
Sydney West
Northern Sydney &Central Coast
Hunter & New England
North Coast
Greater Southern
Greater Western
Urban
Rural
NSW
AreaMales
(95% CI)Females(95% CI)
Persons(95% CI)
Sydney South West 13.1 (9.6-16.7) 15.7 (12.2-19.3) 14.4 (11.9-16.9)
South Eastern Sydney & Illawarra 12.3 (8.5-16.2) 16.1 (12.3-19.9) 14.2 (11.5-16.9)
Sydney West 12.0 (8.1-16.0) 16.6 (12.9-20.3) 14.3 (11.6-17.0)
Northern Sydney & Central Coast 9.8 (6.7-12.9) 13.3 (9.9-16.8) 11.6 (9.3-14.0)
Hunter & New England 15.2 (11.0-19.4) 15.3 (11.8-18.7) 15.2 (12.5-17.9)
North Coast 13.7 (9.8-17.5) 13.6 (10.7-16.6) 13.7 (11.2-16.1)
Greater Southern 12.2 (8.7-15.6) 15.0 (11.3-18.6) 13.6 (11.0-16.1)
Greater Western 17.5 (13.1-21.9) 19.5 (15.5-23.6) 18.5 (15.5-21.5)
Urban 11.9 (10.1-13.7) 15.4 (13.6-17.3) 13.7 (12.4-15.0)
Rural 14.5 (12.4-16.6) 15.4 (13.6-17.3) 15.0 (13.6-16.4)
NSW 12.7 (11.3-14.1) 15.4 (14.1-16.8) 14.1 (13.1-15.1)
Note: Estimates are based on 7,941 respondents in NSW. For this indicator 21 (0.26%) were not stated (Don’t know or Refused) in NSW. The indicator includes those admitted to hospital in the last 12 months. The question used to define the indicator was: In the last 12 months, have youstayed for at least one night in hospital?
Source: New South Wales Population Health Survey 2006 (HOIST). Centre for Epidemiology and Research, NSW Department of Health.
338
WARNIN
G: Esti
mates o
ut of
date.
Please
chec
k Hea
lthStat
s NSW
for la
test e
stimate
s.
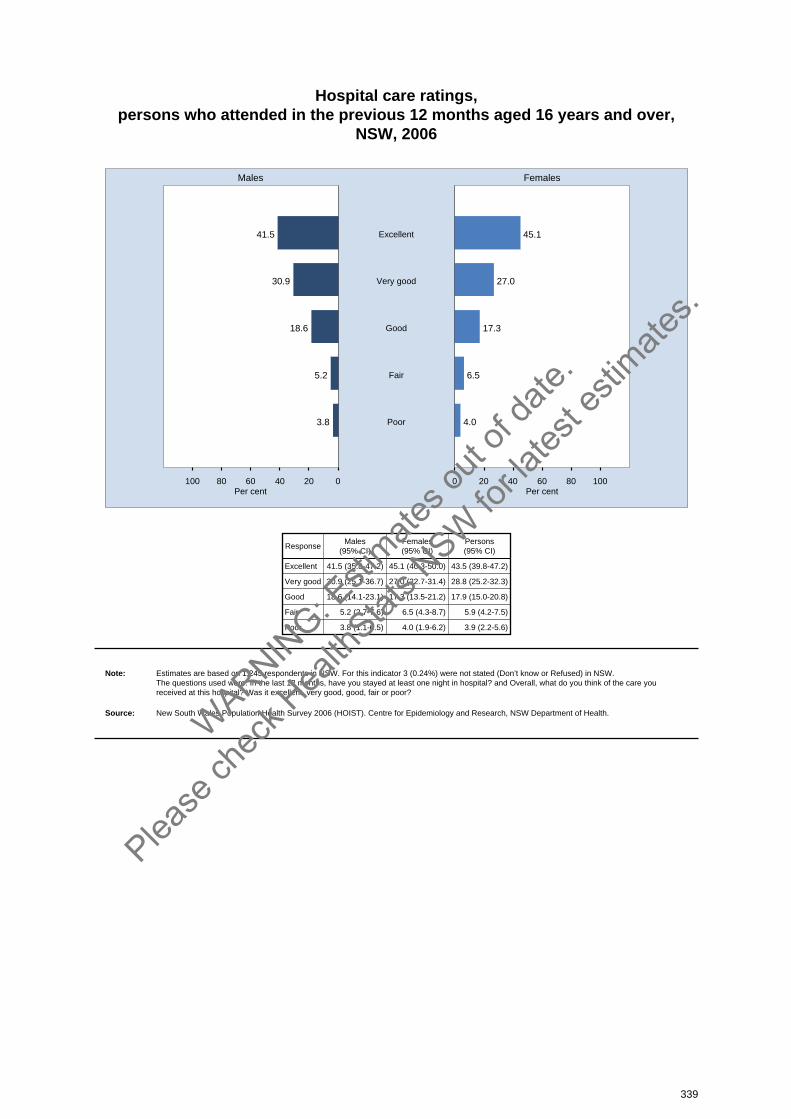
Hospital care ratings, persons who attended in the previous 12 months aged 16 years and over,
NSW, 2006
020406080100 0 20 40 60 80 100
Males Females
Per cent Per cent
41.5 45.1Excellent
30.9 27.0Very good
18.6 17.3Good
5.2 6.5Fair
3.8 4.0Poor
ResponseMales
(95% CI)Females(95% CI)
Persons(95% CI)
Excellent 41.5 (35.8-47.2) 45.1 (40.3-50.0) 43.5 (39.8-47.2)
Very good 30.9 (25.1-36.7) 27.0 (22.7-31.4) 28.8 (25.2-32.3)
Good 18.6 (14.1-23.1) 17.3 (13.5-21.2) 17.9 (15.0-20.8)
Fair 5.2 (2.7-7.6) 6.5 (4.3-8.7) 5.9 (4.2-7.5)
Poor 3.8 (1.1-6.5) 4.0 (1.9-6.2) 3.9 (2.2-5.6)
Note: Estimates are based on 1,245 respondents in NSW. For this indicator 3 (0.24%) were not stated (Don’t know or Refused) in NSW. The questions used were: In the last 12 months, have you stayed at least one night in hospital? and Overall, what do you think of the care youreceived at this hospital? Was it excellent, very good, good, fair or poor?
Source: New South Wales Population Health Survey 2006 (HOIST). Centre for Epidemiology and Research, NSW Department of Health.
339
WARNIN
G: Esti
mates o
ut of
date.
Please
chec
k Hea
lthStat
s NSW
for la
test e
stimate
s.
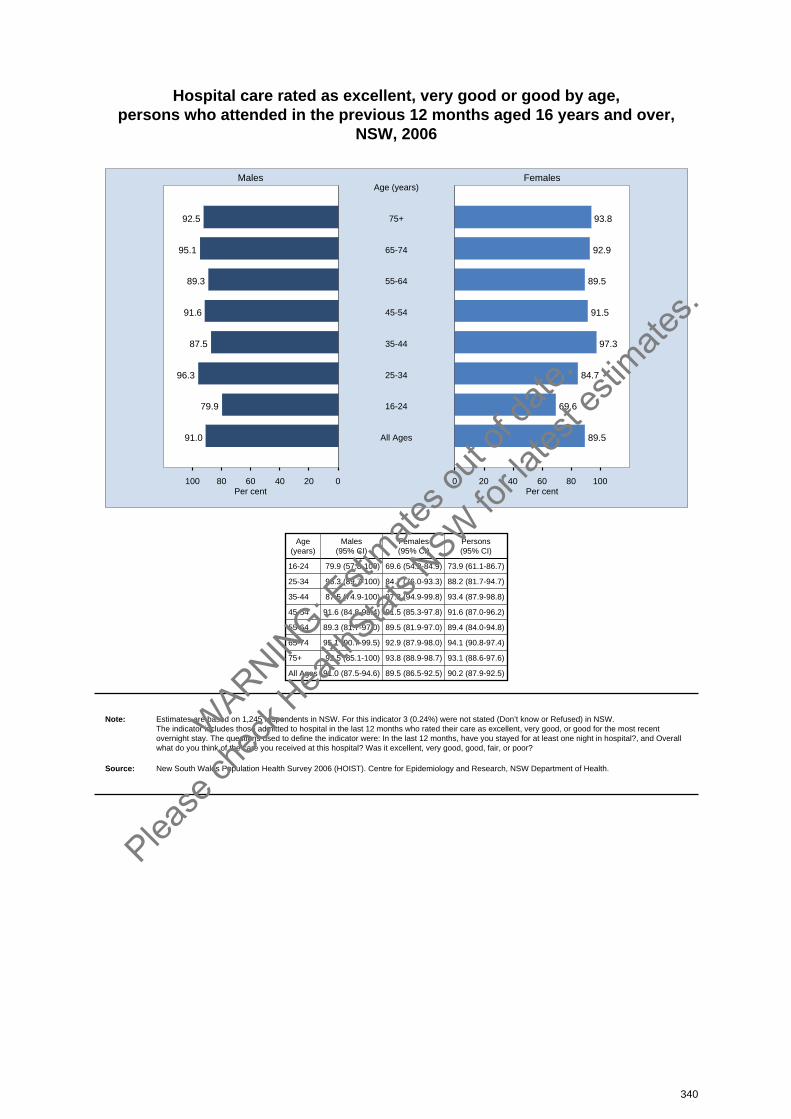
Hospital care rated as excellent, very good or good by age, persons who attended in the previous 12 months aged 16 years and over,
NSW, 2006
020406080100 0 20 40 60 80 100
Males Females
Per cent Per cent
92.5 93.875+
Age (years)
95.1 92.965-74
89.3 89.555-64
91.6 91.545-54
87.5 97.335-44
96.3 84.725-34
79.9 69.616-24
91.0 89.5All Ages
Age(years)
Males(95% CI)
Females(95% CI)
Persons(95% CI)
16-24 79.9 (57.8-100) 69.6 (54.2-84.9) 73.9 (61.1-86.7)
25-34 96.3 (89.7-100) 84.7 (76.0-93.3) 88.2 (81.7-94.7)
35-44 87.5 (74.9-100) 97.3 (94.9-99.8) 93.4 (87.9-98.8)
45-54 91.6 (84.8-98.4) 91.5 (85.3-97.8) 91.6 (87.0-96.2)
55-64 89.3 (81.7-97.0) 89.5 (81.9-97.0) 89.4 (84.0-94.8)
65-74 95.1 (90.7-99.5) 92.9 (87.9-98.0) 94.1 (90.8-97.4)
75+ 92.5 (85.1-100) 93.8 (88.9-98.7) 93.1 (88.6-97.6)
All Ages 91.0 (87.5-94.6) 89.5 (86.5-92.5) 90.2 (87.9-92.5)
Note: Estimates are based on 1,245 respondents in NSW. For this indicator 3 (0.24%) were not stated (Don’t know or Refused) in NSW. The indicator includes those admitted to hospital in the last 12 months who rated their care as excellent, very good, or good for the most recentovernight stay. The questions used to define the indicator were: In the last 12 months, have you stayed for at least one night in hospital?, and Overallwhat do you think of the care you received at this hospital? Was it excellent, very good, good, fair, or poor?
Source: New South Wales Population Health Survey 2006 (HOIST). Centre for Epidemiology and Research, NSW Department of Health.
340
WARNIN
G: Esti
mates o
ut of
date.
Please
chec
k Hea
lthStat
s NSW
for la
test e
stimate
s.
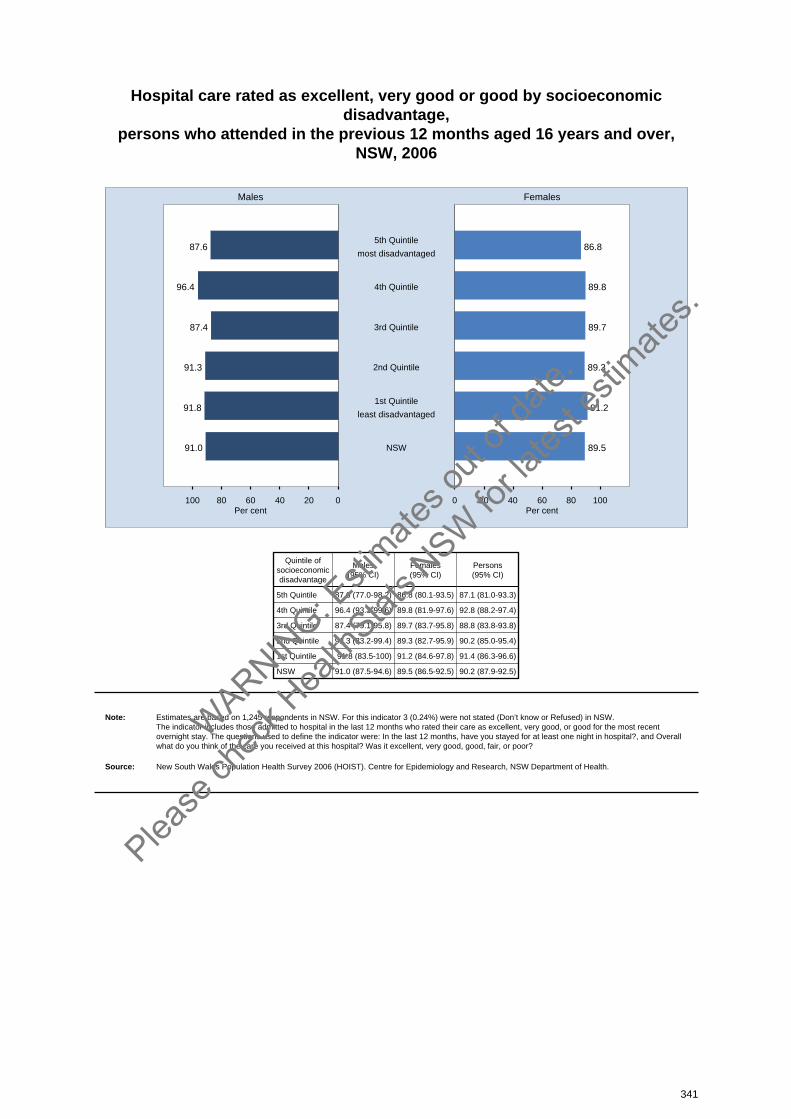
Hospital care rated as excellent, very good or good by socioeconomicdisadvantage,
persons who attended in the previous 12 months aged 16 years and over,NSW, 2006
020406080100 0 20 40 60 80 100
Males Females
Per cent Per cent
87.6 86.85th Quintile
most disadvantaged
96.4 89.84th Quintile
87.4 89.73rd Quintile
91.3 89.32nd Quintile
91.8 91.21st Quintile
least disadvantaged
91.0 89.5NSW
Quintile ofsocioeconomicdisadvantage
Males(95% CI)
Females(95% CI)
Persons(95% CI)
5th Quintile 87.6 (77.0-98.2) 86.8 (80.1-93.5) 87.1 (81.0-93.3)
4th Quintile 96.4 (93.3-99.6) 89.8 (81.9-97.6) 92.8 (88.2-97.4)
3rd Quintile 87.4 (79.1-95.8) 89.7 (83.7-95.8) 88.8 (83.8-93.8)
2nd Quintile 91.3 (83.2-99.4) 89.3 (82.7-95.9) 90.2 (85.0-95.4)
1st Quintile 91.8 (83.5-100) 91.2 (84.6-97.8) 91.4 (86.3-96.6)
NSW 91.0 (87.5-94.6) 89.5 (86.5-92.5) 90.2 (87.9-92.5)
Note: Estimates are based on 1,245 respondents in NSW. For this indicator 3 (0.24%) were not stated (Don’t know or Refused) in NSW. The indicator includes those admitted to hospital in the last 12 months who rated their care as excellent, very good, or good for the most recentovernight stay. The questions used to define the indicator were: In the last 12 months, have you stayed for at least one night in hospital?, and Overallwhat do you think of the care you received at this hospital? Was it excellent, very good, good, fair, or poor?
Source: New South Wales Population Health Survey 2006 (HOIST). Centre for Epidemiology and Research, NSW Department of Health.
341
WARNIN
G: Esti
mates o
ut of
date.
Please
chec
k Hea
lthStat
s NSW
for la
test e
stimate
s.
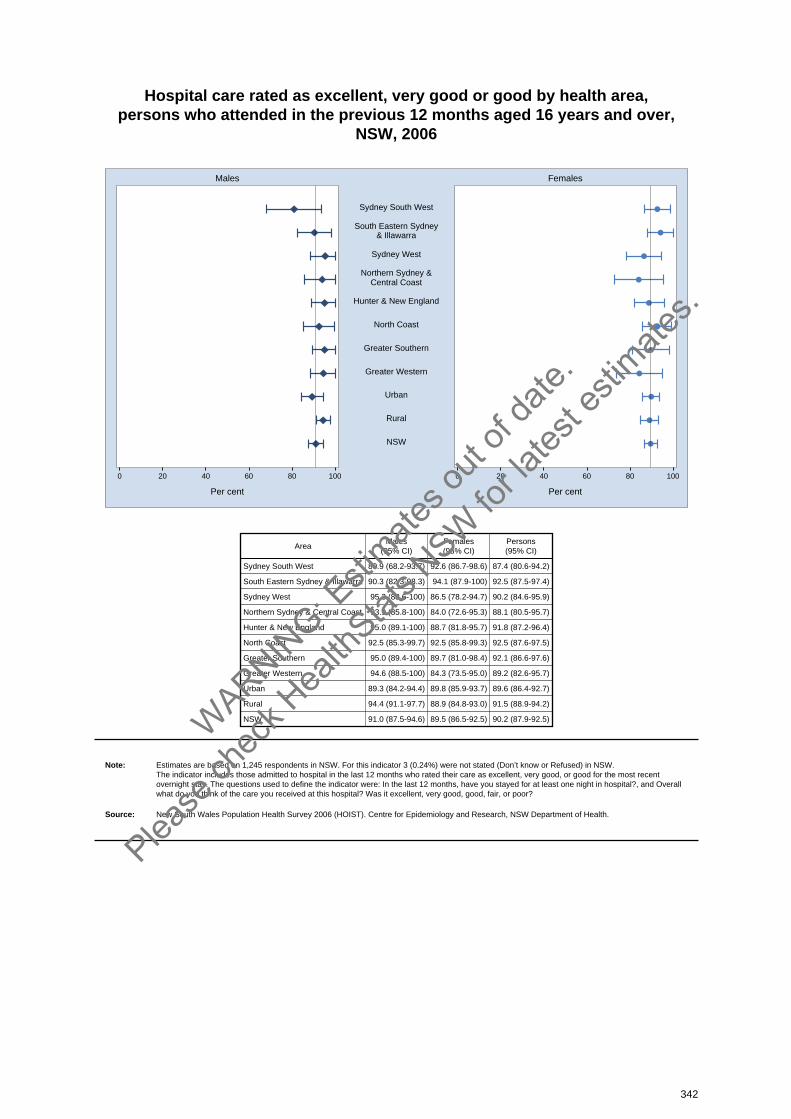
Hospital care rated as excellent, very good or good by health area, persons who attended in the previous 12 months aged 16 years and over,
NSW, 2006
0 20 40 60 80 100 0 20 40 60 80 100
Males Females
Per cent Per cent
Sydney South West
South Eastern Sydney& Illawarra
Sydney West
Northern Sydney &Central Coast
Hunter & New England
North Coast
Greater Southern
Greater Western
Urban
Rural
NSW
AreaMales
(95% CI)Females(95% CI)
Persons(95% CI)
Sydney South West 80.9 (68.2-93.7) 92.6 (86.7-98.6) 87.4 (80.6-94.2)
South Eastern Sydney & Illawarra 90.3 (82.3-98.3) 94.1 (87.9-100) 92.5 (87.5-97.4)
Sydney West 95.3 (88.6-100) 86.5 (78.2-94.7) 90.2 (84.6-95.9)
Northern Sydney & Central Coast 93.9 (85.8-100) 84.0 (72.6-95.3) 88.1 (80.5-95.7)
Hunter & New England 95.0 (89.1-100) 88.7 (81.8-95.7) 91.8 (87.2-96.4)
North Coast 92.5 (85.3-99.7) 92.5 (85.8-99.3) 92.5 (87.6-97.5)
Greater Southern 95.0 (89.4-100) 89.7 (81.0-98.4) 92.1 (86.6-97.6)
Greater Western 94.6 (88.5-100) 84.3 (73.5-95.0) 89.2 (82.6-95.7)
Urban 89.3 (84.2-94.4) 89.8 (85.9-93.7) 89.6 (86.4-92.7)
Rural 94.4 (91.1-97.7) 88.9 (84.8-93.0) 91.5 (88.9-94.2)
NSW 91.0 (87.5-94.6) 89.5 (86.5-92.5) 90.2 (87.9-92.5)
Note: Estimates are based on 1,245 respondents in NSW. For this indicator 3 (0.24%) were not stated (Don’t know or Refused) in NSW. The indicator includes those admitted to hospital in the last 12 months who rated their care as excellent, very good, or good for the most recentovernight stay. The questions used to define the indicator were: In the last 12 months, have you stayed for at least one night in hospital?, and Overallwhat do you think of the care you received at this hospital? Was it excellent, very good, good, fair, or poor?
Source: New South Wales Population Health Survey 2006 (HOIST). Centre for Epidemiology and Research, NSW Department of Health.
342
WARNIN
G: Esti
mates o
ut of
date.
Please
chec
k Hea
lthStat
s NSW
for la
test e
stimate
s.
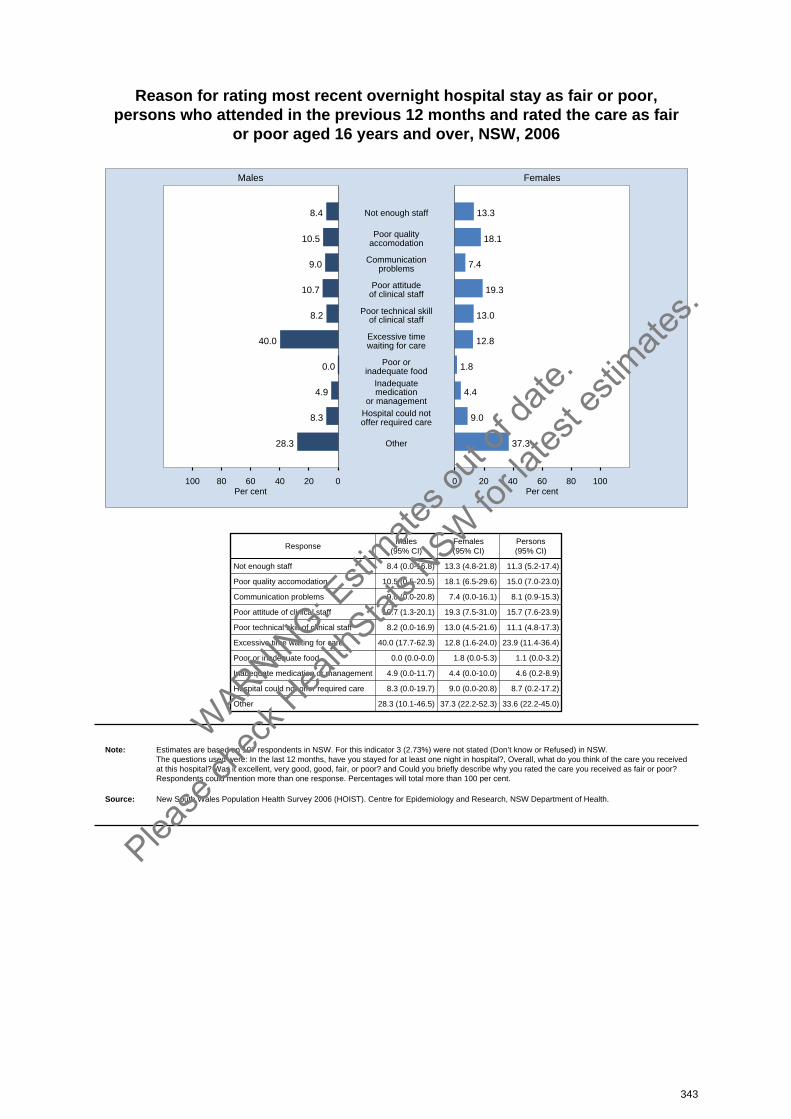
Reason for rating most recent overnight hospital stay as fair or poor, persons who attended in the previous 12 months and rated the care as fair
or poor aged 16 years and over, NSW, 2006
020406080100 0 20 40 60 80 100
Males Females
Per cent Per cent
8.4 13.3Not enough staff
10.5 18.1Poor qualityaccomodation
9.0 7.4Communicationproblems
10.7 19.3Poor attitudeof clinical staff
8.2 13.0Poor technical skillof clinical staff
40.0 12.8Excessive timewaiting for care
0.0 1.8Poor orinadequate food
4.9 4.4Inadequatemedication
or management
8.3 9.0Hospital could notoffer required care
28.3 37.3Other
ResponseMales
(95% CI)Females(95% CI)
Persons(95% CI)
Not enough staff 8.4 (0.0-16.8) 13.3 (4.8-21.8) 11.3 (5.2-17.4)
Poor quality accomodation 10.5 (0.5-20.5) 18.1 (6.5-29.6) 15.0 (7.0-23.0)
Communication problems 9.0 (0.0-20.8) 7.4 (0.0-16.1) 8.1 (0.9-15.3)
Poor attitude of clinical staff 10.7 (1.3-20.1) 19.3 (7.5-31.0) 15.7 (7.6-23.9)
Poor technical skill of clinical staff 8.2 (0.0-16.9) 13.0 (4.5-21.6) 11.1 (4.8-17.3)
Excessive time waiting for care 40.0 (17.7-62.3) 12.8 (1.6-24.0) 23.9 (11.4-36.4)
Poor or inadequate food 0.0 (0.0-0.0) 1.8 (0.0-5.3) 1.1 (0.0-3.2)
Inadequate medication or management 4.9 (0.0-11.7) 4.4 (0.0-10.0) 4.6 (0.2-8.9)
Hospital could not offer required care 8.3 (0.0-19.7) 9.0 (0.0-20.8) 8.7 (0.2-17.2)
Other 28.3 (10.1-46.5) 37.3 (22.2-52.3) 33.6 (22.2-45.0)
Note: Estimates are based on 107 respondents in NSW. For this indicator 3 (2.73%) were not stated (Don’t know or Refused) in NSW. The questions used were: In the last 12 months, have you stayed for at least one night in hospital?, Overall, what do you think of the care you receivedat this hospital? Was it excellent, very good, good, fair, or poor? and Could you briefly describe why you rated the care you received as fair or poor?Respondents could mention more than one response. Percentages will total more than 100 per cent.
Source: New South Wales Population Health Survey 2006 (HOIST). Centre for Epidemiology and Research, NSW Department of Health.
343
WARNIN
G: Esti
mates o
ut of
date.
Please
chec
k Hea
lthStat
s NSW
for la
test e
stimate
s.
Community health centres
IntroductionCommunity health centres have a particularly important role to play in providing information andsupport to people of all ages within the community. Services provided by community health centresinclude primary care, community health nursing, sexual health services, counselling, selected alliedhealth services, outreach clinics, child and family health services, day and respite care, healthpromotion, health education, community support, and group programs.
In 2006, the New South Wales Population Health Survey asked respondents: In the last 12 months,have you been to a government-run community health centre? Overall, what do you think of the careyou received at this community health centre? If care was rated as Fair or Poor, respondents werealso asked: Could you briefly describe why you rated the care you received as Fair or Poor?
Results
Attendance at a community health centre
In 2006, the New South Wales Population Health Survey estimated that 7.3 per cent of adultsattended a community health centre on one or more occasions in the previous 12 months.
A significantly higher proportion of females (8.8 per cent) than males (5.7 per cent) attended acommunity health centre. Among females, a significantly higher proportion of adults aged 25-34 years(15.5 per cent), and a significantly lower proportion of adults aged 45-54 years (6.0 per cent) and55-64 years (6.1 per cent) and 75 years and over (6.3 per cent), attended a community health centre,compared with the overall adult female population. There was no significant variation between adultsin urban areas and rural areas; however, a lower proportion of adults in the Sydney West Health Area(4.0 per cent), and a higher proportion of adults in the Greater Western Health Area (12.8 per cent),attended a community health centre. A lower proportion of adults in the least disadvantaged quintile(5.1 per cent) attended a community health centre, compared with the overall adult population.Between 2002 and 2006, there has been no significant change in the proportion of adults whoattended a community health centre.
Rating of community health centre care
Those who attended a community health centre were asked to rate the care they received. Overall,26.7 per cent rated their care as excellent, 35.8 per cent as very good, 28.9 per cent as good, 7.4 percent as fair, and 1.2 per cent as poor. Responses of excellent, very good, and good were combinedinto a positive rating of care.
Overall, 91.4 per cent of adults rated their care positively. There was no significant variation betweenmales and females. A significantly higher proportion of adults aged 65-74 years (97.1 per cent) and 75years and over (99.2 per cent) rated their care positively, compared with the overall adult population.There was no significant variation in ratings of positive care between adults in rural areas and urbanareas; however, a higher proportion of adults in the North Coast (96.8 per cent) and Greater Southern(98.5 per cent) Health Areas rated their care positively. A higher proportion of adults in the leastdisadvantaged quintile (96.9 per cent) rated their care positively. Overall, the proportion of adults whorated their community health centre care positively has not varied significantly between 2002 and 2006.
The main reasons for rating care as fair or poor were: waiting time (29.3 per cent), poor technical skillof staff (23.5 per cent), insufficient services or staff shortages (20.0 per cent), lack of confidentiality(12.2 per cent), poor attitude of staff (11.0 per cent), contradictory diagnosis between clinicians (8.2per cent), poor communication (4.8 per cent), and treatment not effective (4.0 per cent).
344
WARNIN
G: Esti
mates o
ut of
date.
Please
chec
k Hea
lthStat
s NSW
for la
test e
stimate
s.
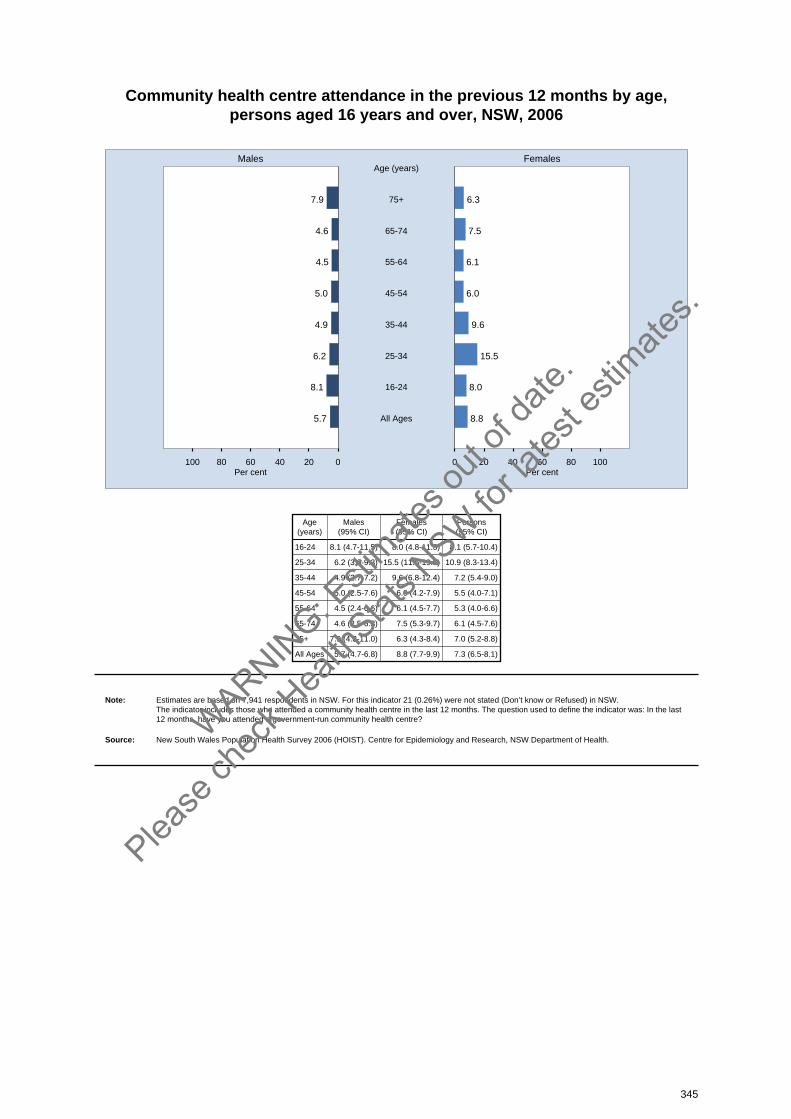
Community health centre attendance in the previous 12 months by age, persons aged 16 years and over, NSW, 2006
020406080100 0 20 40 60 80 100
Males Females
Per cent Per cent
7.9 6.375+
Age (years)
4.6 7.565-74
4.5 6.155-64
5.0 6.045-54
4.9 9.635-44
6.2 15.525-34
8.1 8.016-24
5.7 8.8All Ages
Age(years)
Males(95% CI)
Females(95% CI)
Persons(95% CI)
16-24 8.1 (4.7-11.5) 8.0 (4.8-11.3) 8.1 (5.7-10.4)
25-34 6.2 (3.0-9.3) 15.5 (11.6-19.5) 10.9 (8.3-13.4)
35-44 4.9 (2.7-7.2) 9.6 (6.8-12.4) 7.2 (5.4-9.0)
45-54 5.0 (2.5-7.6) 6.0 (4.2-7.9) 5.5 (4.0-7.1)
55-64 4.5 (2.4-6.6) 6.1 (4.5-7.7) 5.3 (4.0-6.6)
65-74 4.6 (2.5-6.8) 7.5 (5.3-9.7) 6.1 (4.5-7.6)
75+ 7.9 (4.8-11.0) 6.3 (4.3-8.4) 7.0 (5.2-8.8)
All Ages 5.7 (4.7-6.8) 8.8 (7.7-9.9) 7.3 (6.5-8.1)
Note: Estimates are based on 7,941 respondents in NSW. For this indicator 21 (0.26%) were not stated (Don’t know or Refused) in NSW. The indicator includes those who attended a community health centre in the last 12 months. The question used to define the indicator was: In the last12 months, have you attended a government-run community health centre?
Source: New South Wales Population Health Survey 2006 (HOIST). Centre for Epidemiology and Research, NSW Department of Health.
345
WARNIN
G: Esti
mates o
ut of
date.
Please
chec
k Hea
lthStat
s NSW
for la
test e
stimate
s.
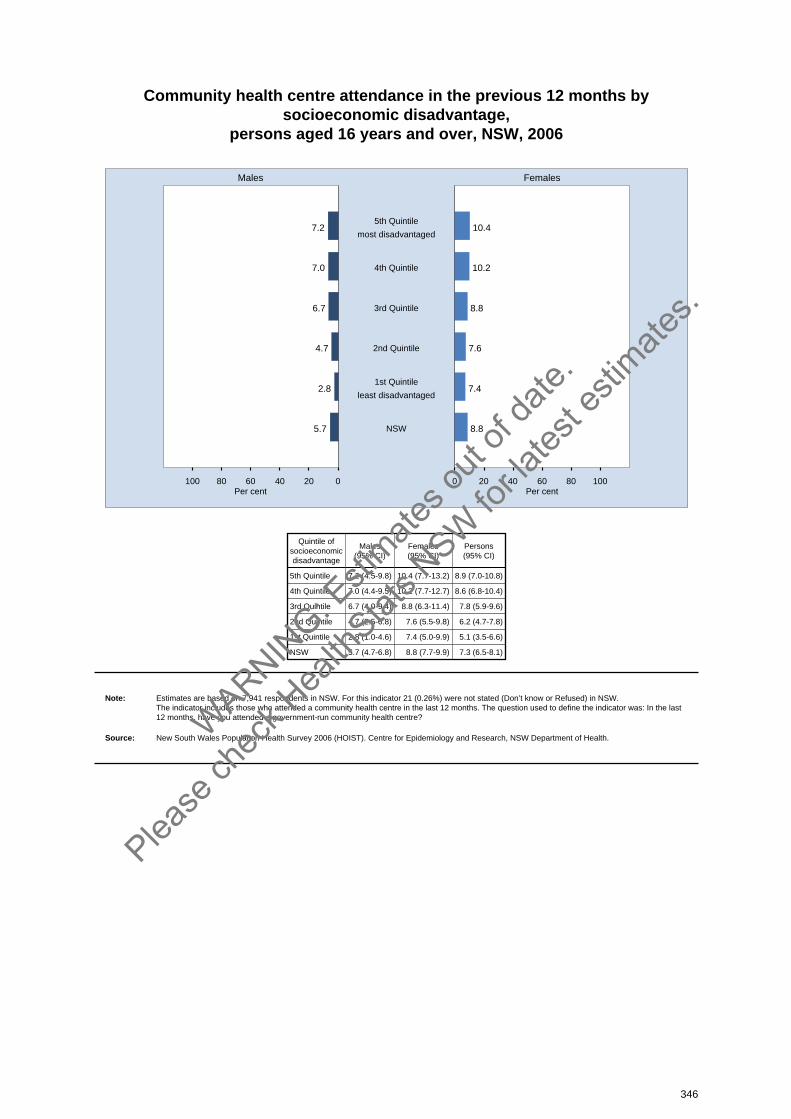
Community health centre attendance in the previous 12 months bysocioeconomic disadvantage,
persons aged 16 years and over, NSW, 2006
020406080100 0 20 40 60 80 100
Males Females
Per cent Per cent
7.2 10.45th Quintile
most disadvantaged
7.0 10.24th Quintile
6.7 8.83rd Quintile
4.7 7.62nd Quintile
2.8 7.41st Quintile
least disadvantaged
5.7 8.8NSW
Quintile ofsocioeconomicdisadvantage
Males(95% CI)
Females(95% CI)
Persons(95% CI)
5th Quintile 7.2 (4.5-9.8) 10.4 (7.7-13.2) 8.9 (7.0-10.8)
4th Quintile 7.0 (4.4-9.5) 10.2 (7.7-12.7) 8.6 (6.8-10.4)
3rd Quintile 6.7 (4.0-9.4) 8.8 (6.3-11.4) 7.8 (5.9-9.6)
2nd Quintile 4.7 (2.5-6.8) 7.6 (5.5-9.8) 6.2 (4.7-7.8)
1st Quintile 2.8 (1.0-4.6) 7.4 (5.0-9.9) 5.1 (3.5-6.6)
NSW 5.7 (4.7-6.8) 8.8 (7.7-9.9) 7.3 (6.5-8.1)
Note: Estimates are based on 7,941 respondents in NSW. For this indicator 21 (0.26%) were not stated (Don’t know or Refused) in NSW. The indicator includes those who attended a community health centre in the last 12 months. The question used to define the indicator was: In the last12 months, have you attended a government-run community health centre?
Source: New South Wales Population Health Survey 2006 (HOIST). Centre for Epidemiology and Research, NSW Department of Health.
346
WARNIN
G: Esti
mates o
ut of
date.
Please
chec
k Hea
lthStat
s NSW
for la
test e
stimate
s.
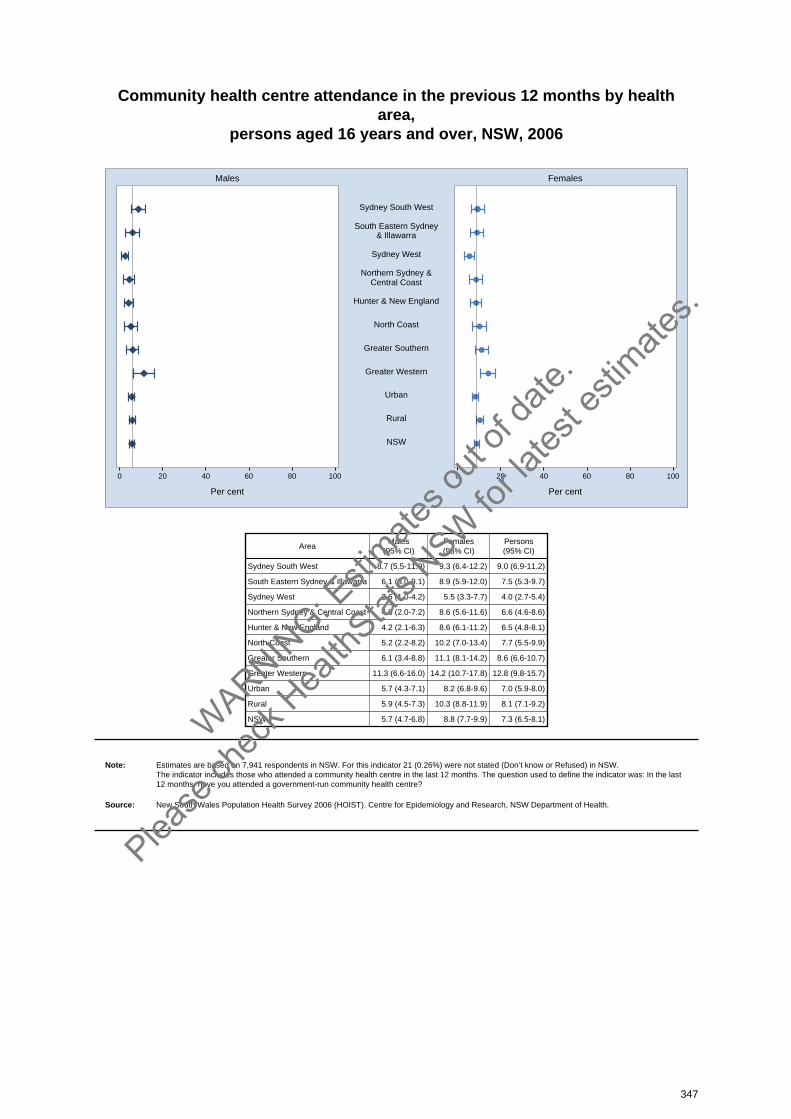
Community health centre attendance in the previous 12 months by healtharea,
persons aged 16 years and over, NSW, 2006
0 20 40 60 80 100 0 20 40 60 80 100
Males Females
Per cent Per cent
Sydney South West
South Eastern Sydney& Illawarra
Sydney West
Northern Sydney &Central Coast
Hunter & New England
North Coast
Greater Southern
Greater Western
Urban
Rural
NSW
AreaMales
(95% CI)Females(95% CI)
Persons(95% CI)
Sydney South West 8.7 (5.5-11.9) 9.3 (6.4-12.2) 9.0 (6.9-11.2)
South Eastern Sydney & Illawarra 6.1 (3.0-9.1) 8.9 (5.9-12.0) 7.5 (5.3-9.7)
Sydney West 2.6 (1.0-4.2) 5.5 (3.3-7.7) 4.0 (2.7-5.4)
Northern Sydney & Central Coast 4.6 (2.0-7.2) 8.6 (5.6-11.6) 6.6 (4.6-8.6)
Hunter & New England 4.2 (2.1-6.3) 8.6 (6.1-11.2) 6.5 (4.8-8.1)
North Coast 5.2 (2.2-8.2) 10.2 (7.0-13.4) 7.7 (5.5-9.9)
Greater Southern 6.1 (3.4-8.8) 11.1 (8.1-14.2) 8.6 (6.6-10.7)
Greater Western 11.3 (6.6-16.0) 14.2 (10.7-17.8) 12.8 (9.8-15.7)
Urban 5.7 (4.3-7.1) 8.2 (6.8-9.6) 7.0 (5.9-8.0)
Rural 5.9 (4.5-7.3) 10.3 (8.8-11.9) 8.1 (7.1-9.2)
NSW 5.7 (4.7-6.8) 8.8 (7.7-9.9) 7.3 (6.5-8.1)
Note: Estimates are based on 7,941 respondents in NSW. For this indicator 21 (0.26%) were not stated (Don’t know or Refused) in NSW. The indicator includes those who attended a community health centre in the last 12 months. The question used to define the indicator was: In the last12 months, have you attended a government-run community health centre?
Source: New South Wales Population Health Survey 2006 (HOIST). Centre for Epidemiology and Research, NSW Department of Health.
347
WARNIN
G: Esti
mates o
ut of
date.
Please
chec
k Hea
lthStat
s NSW
for la
test e
stimate
s.
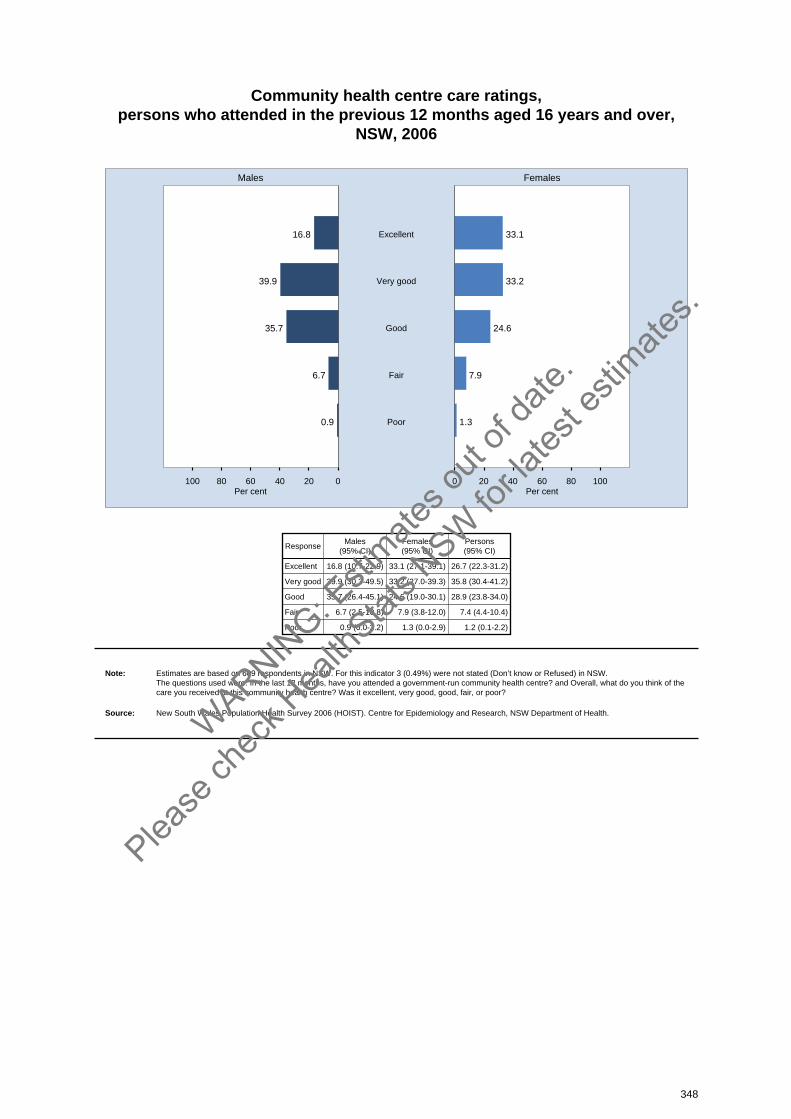
Community health centre care ratings, persons who attended in the previous 12 months aged 16 years and over,
NSW, 2006
020406080100 0 20 40 60 80 100
Males Females
Per cent Per cent
16.8 33.1Excellent
39.9 33.2Very good
35.7 24.6Good
6.7 7.9Fair
0.9 1.3Poor
ResponseMales
(95% CI)Females(95% CI)
Persons(95% CI)
Excellent 16.8 (10.7-22.9) 33.1 (27.1-39.1) 26.7 (22.3-31.2)
Very good 39.9 (30.3-49.5) 33.2 (27.0-39.3) 35.8 (30.4-41.2)
Good 35.7 (26.4-45.1) 24.6 (19.0-30.1) 28.9 (23.8-34.0)
Fair 6.7 (2.5-10.8) 7.9 (3.8-12.0) 7.4 (4.4-10.4)
Poor 0.9 (0.0-2.2) 1.3 (0.0-2.9) 1.2 (0.1-2.2)
Note: Estimates are based on 609 respondents in NSW. For this indicator 3 (0.49%) were not stated (Don’t know or Refused) in NSW. The questions used were: In the last 12 months, have you attended a government-run community health centre? and Overall, what do you think of thecare you received at this community health centre? Was it excellent, very good, good, fair, or poor?
Source: New South Wales Population Health Survey 2006 (HOIST). Centre for Epidemiology and Research, NSW Department of Health.
348
WARNIN
G: Esti
mates o
ut of
date.
Please
chec
k Hea
lthStat
s NSW
for la
test e
stimate
s.
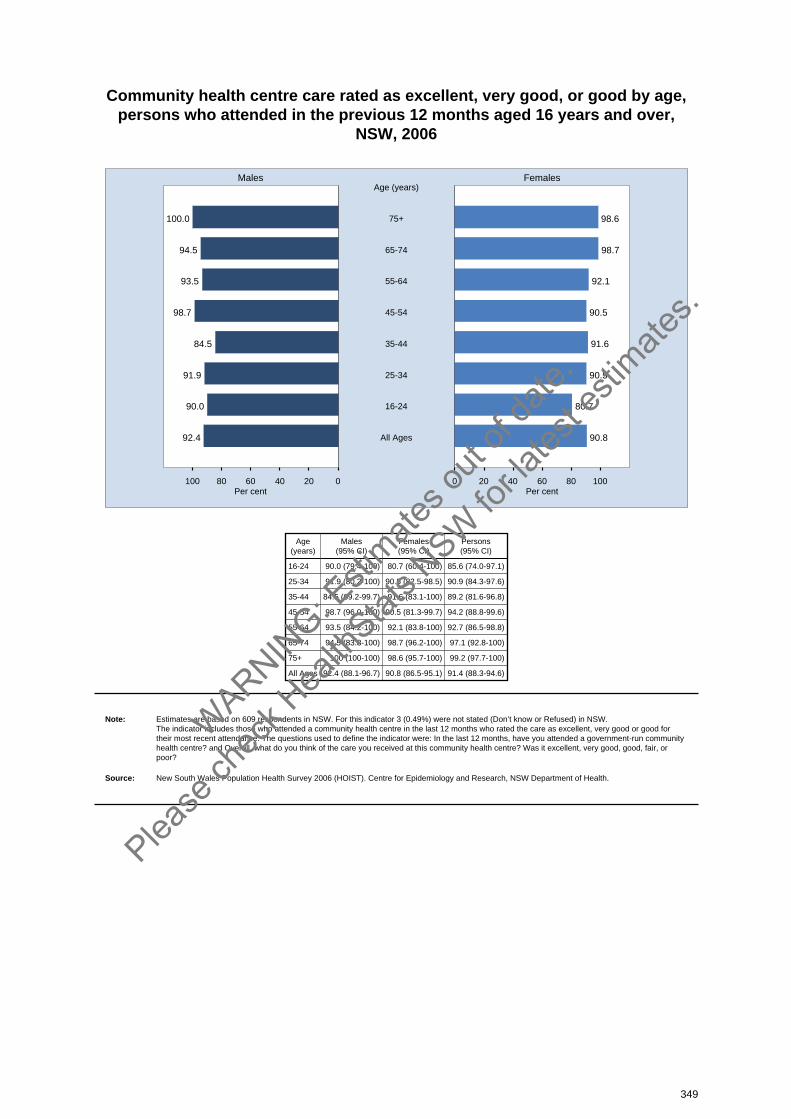
Community health centre care rated as excellent, very good, or good by age, persons who attended in the previous 12 months aged 16 years and over,
NSW, 2006
020406080100 0 20 40 60 80 100
Males Females
Per cent Per cent
100.0 98.675+
Age (years)
94.5 98.765-74
93.5 92.155-64
98.7 90.545-54
84.5 91.635-44
91.9 90.525-34
90.0 80.716-24
92.4 90.8All Ages
Age(years)
Males(95% CI)
Females(95% CI)
Persons(95% CI)
16-24 90.0 (79.4-100) 80.7 (60.4-100) 85.6 (74.0-97.1)
25-34 91.9 (80.2-100) 90.5 (82.5-98.5) 90.9 (84.3-97.6)
35-44 84.5 (69.2-99.7) 91.6 (83.1-100) 89.2 (81.6-96.8)
45-54 98.7 (96.0-100) 90.5 (81.3-99.7) 94.2 (88.8-99.6)
55-64 93.5 (84.2-100) 92.1 (83.8-100) 92.7 (86.5-98.8)
65-74 94.5 (83.8-100) 98.7 (96.2-100) 97.1 (92.8-100)
75+ 100 (100-100) 98.6 (95.7-100) 99.2 (97.7-100)
All Ages 92.4 (88.1-96.7) 90.8 (86.5-95.1) 91.4 (88.3-94.6)
Note: Estimates are based on 609 respondents in NSW. For this indicator 3 (0.49%) were not stated (Don’t know or Refused) in NSW. The indicator includes those who attended a community health centre in the last 12 months who rated the care as excellent, very good or good fortheir most recent attendance. The questions used to define the indicator were: In the last 12 months, have you attended a government-run communityhealth centre? and Overall, what do you think of the care you received at this community health centre? Was it excellent, very good, good, fair, or poor?
Source: New South Wales Population Health Survey 2006 (HOIST). Centre for Epidemiology and Research, NSW Department of Health.
349
WARNIN
G: Esti
mates o
ut of
date.
Please
chec
k Hea
lthStat
s NSW
for la
test e
stimate
s.
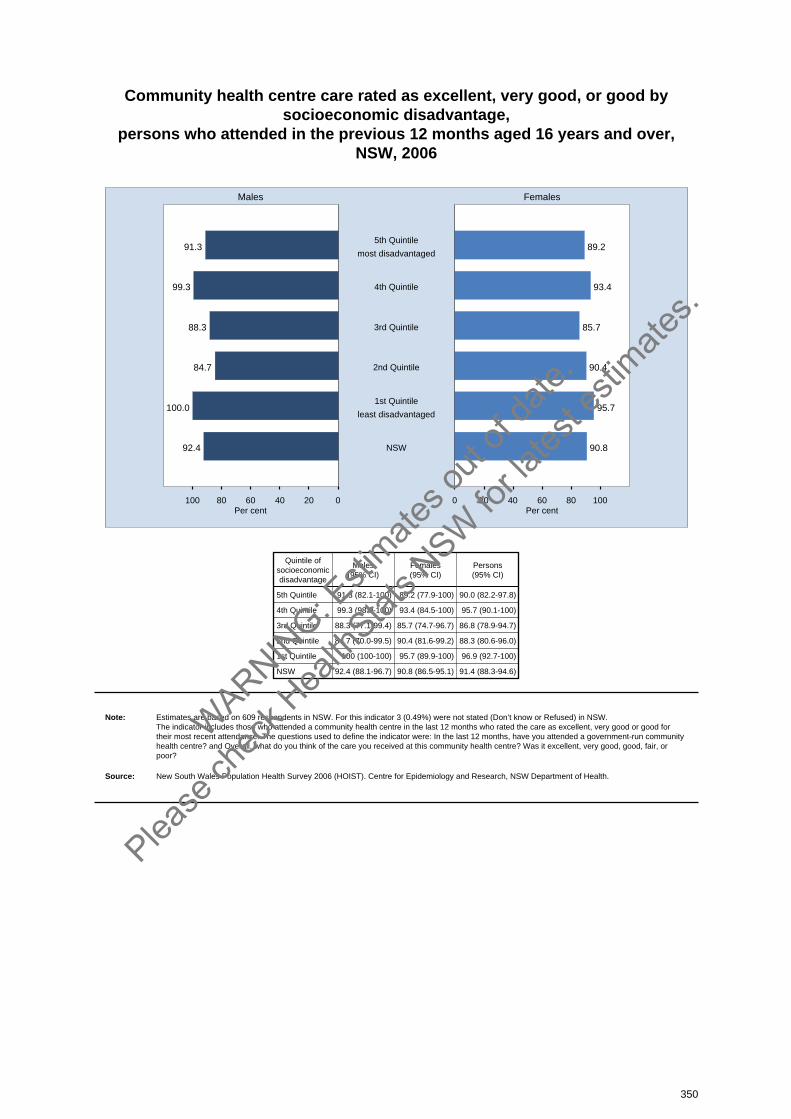
Community health centre care rated as excellent, very good, or good bysocioeconomic disadvantage,
persons who attended in the previous 12 months aged 16 years and over,NSW, 2006
020406080100 0 20 40 60 80 100
Males Females
Per cent Per cent
91.3 89.25th Quintile
most disadvantaged
99.3 93.44th Quintile
88.3 85.73rd Quintile
84.7 90.42nd Quintile
100.0 95.71st Quintile
least disadvantaged
92.4 90.8NSW
Quintile ofsocioeconomicdisadvantage
Males(95% CI)
Females(95% CI)
Persons(95% CI)
5th Quintile 91.3 (82.1-100) 89.2 (77.9-100) 90.0 (82.2-97.8)
4th Quintile 99.3 (98.0-100) 93.4 (84.5-100) 95.7 (90.1-100)
3rd Quintile 88.3 (77.1-99.4) 85.7 (74.7-96.7) 86.8 (78.9-94.7)
2nd Quintile 84.7 (70.0-99.5) 90.4 (81.6-99.2) 88.3 (80.6-96.0)
1st Quintile 100 (100-100) 95.7 (89.9-100) 96.9 (92.7-100)
NSW 92.4 (88.1-96.7) 90.8 (86.5-95.1) 91.4 (88.3-94.6)
Note: Estimates are based on 609 respondents in NSW. For this indicator 3 (0.49%) were not stated (Don’t know or Refused) in NSW. The indicator includes those who attended a community health centre in the last 12 months who rated the care as excellent, very good or good fortheir most recent attendance. The questions used to define the indicator were: In the last 12 months, have you attended a government-run communityhealth centre? and Overall, what do you think of the care you received at this community health centre? Was it excellent, very good, good, fair, or poor?
Source: New South Wales Population Health Survey 2006 (HOIST). Centre for Epidemiology and Research, NSW Department of Health.
350
WARNIN
G: Esti
mates o
ut of
date.
Please
chec
k Hea
lthStat
s NSW
for la
test e
stimate
s.
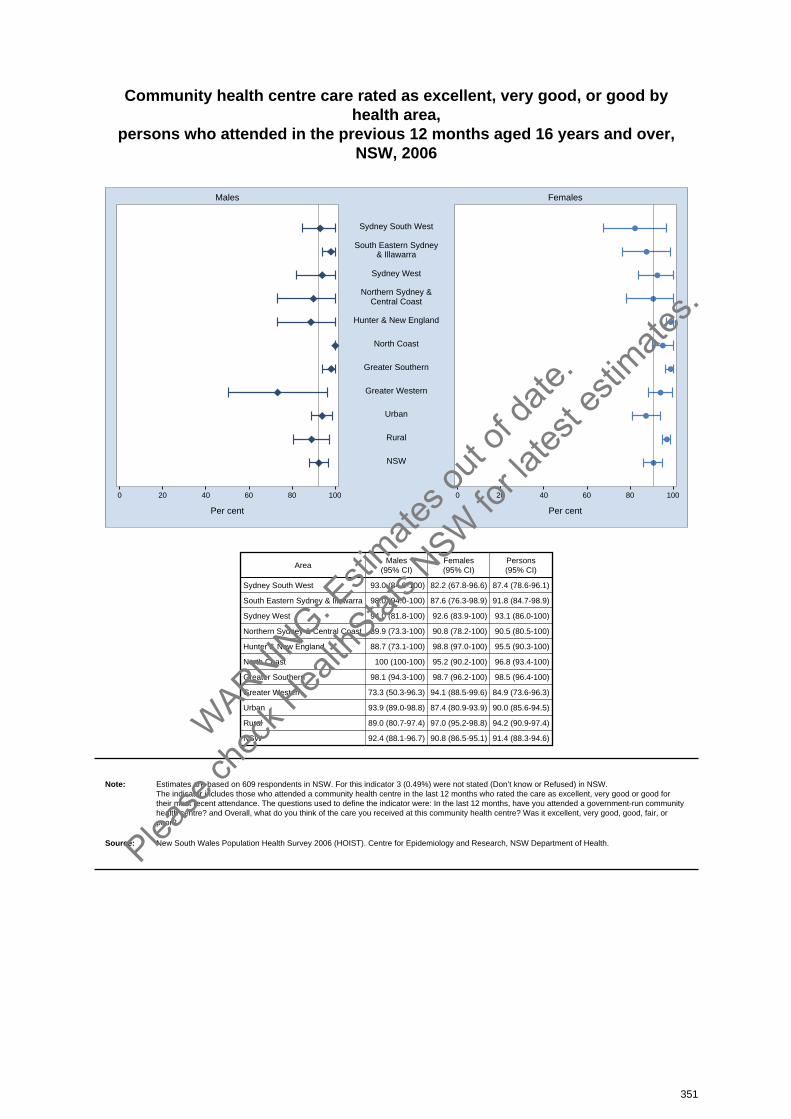
Community health centre care rated as excellent, very good, or good byhealth area,
persons who attended in the previous 12 months aged 16 years and over,NSW, 2006
0 20 40 60 80 100 0 20 40 60 80 100
Males Females
Per cent Per cent
Sydney South West
South Eastern Sydney& Illawarra
Sydney West
Northern Sydney &Central Coast
Hunter & New England
North Coast
Greater Southern
Greater Western
Urban
Rural
NSW
AreaMales
(95% CI)Females(95% CI)
Persons(95% CI)
Sydney South West 93.0 (84.9-100) 82.2 (67.8-96.6) 87.4 (78.6-96.1)
South Eastern Sydney & Illawarra 98.0 (94.0-100) 87.6 (76.3-98.9) 91.8 (84.7-98.9)
Sydney West 94.0 (81.8-100) 92.6 (83.9-100) 93.1 (86.0-100)
Northern Sydney & Central Coast 89.9 (73.3-100) 90.8 (78.2-100) 90.5 (80.5-100)
Hunter & New England 88.7 (73.1-100) 98.8 (97.0-100) 95.5 (90.3-100)
North Coast 100 (100-100) 95.2 (90.2-100) 96.8 (93.4-100)
Greater Southern 98.1 (94.3-100) 98.7 (96.2-100) 98.5 (96.4-100)
Greater Western 73.3 (50.3-96.3) 94.1 (88.5-99.6) 84.9 (73.6-96.3)
Urban 93.9 (89.0-98.8) 87.4 (80.9-93.9) 90.0 (85.6-94.5)
Rural 89.0 (80.7-97.4) 97.0 (95.2-98.8) 94.2 (90.9-97.4)
NSW 92.4 (88.1-96.7) 90.8 (86.5-95.1) 91.4 (88.3-94.6)
Note: Estimates are based on 609 respondents in NSW. For this indicator 3 (0.49%) were not stated (Don’t know or Refused) in NSW. The indicator includes those who attended a community health centre in the last 12 months who rated the care as excellent, very good or good fortheir most recent attendance. The questions used to define the indicator were: In the last 12 months, have you attended a government-run communityhealth centre? and Overall, what do you think of the care you received at this community health centre? Was it excellent, very good, good, fair, or poor?
Source: New South Wales Population Health Survey 2006 (HOIST). Centre for Epidemiology and Research, NSW Department of Health.
351
WARNIN
G: Esti
mates o
ut of
date.
Please
chec
k Hea
lthStat
s NSW
for la
test e
stimate
s.
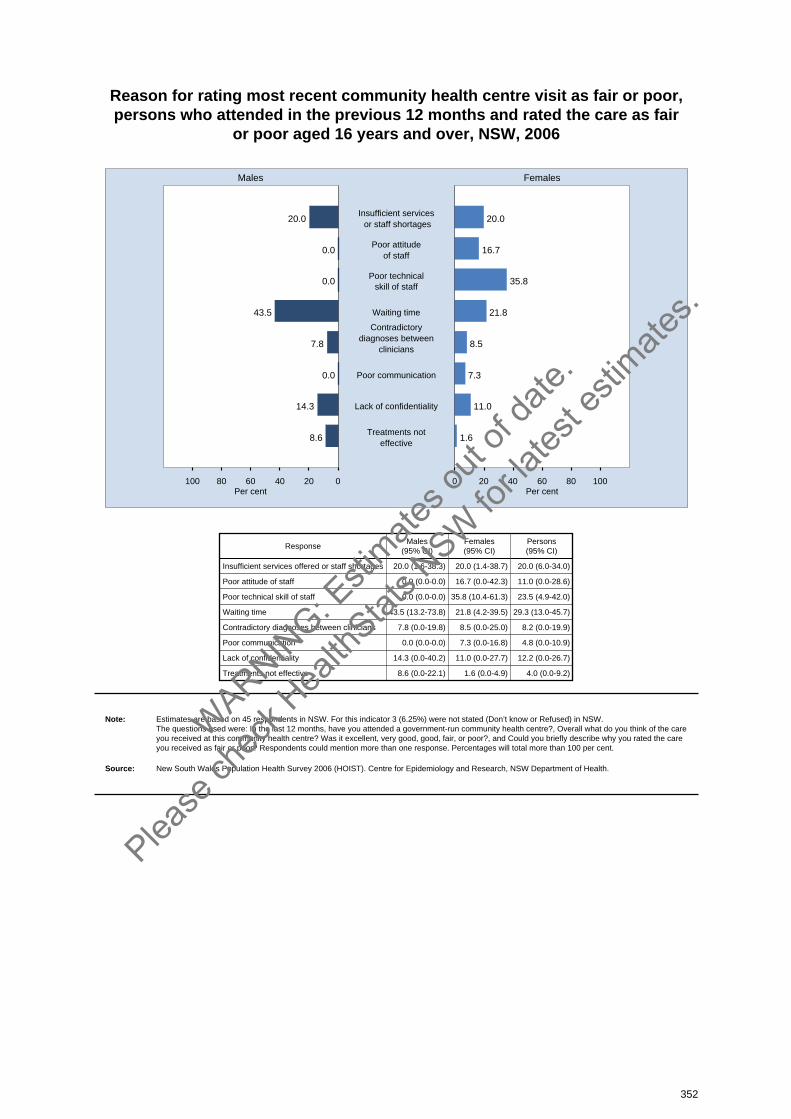
Reason for rating most recent community health centre visit as fair or poor, persons who attended in the previous 12 months and rated the care as fair
or poor aged 16 years and over, NSW, 2006
020406080100 0 20 40 60 80 100
Males Females
Per cent Per cent
20.0 20.0Insufficient services or staff shortages
0.0 16.7Poor attitude
of staff
0.0 35.8Poor technical
skill of staff
43.5 21.8Waiting time
7.8 8.5
Contradictorydiagnoses between
clinicians
0.0 7.3Poor communication
14.3 11.0Lack of confidentiality
8.6 1.6Treatments not
effective
ResponseMales
(95% CI)Females(95% CI)
Persons(95% CI)
Insufficient services offered or staff shortages 20.0 (1.6-38.3) 20.0 (1.4-38.7) 20.0 (6.0-34.0)
Poor attitude of staff 0.0 (0.0-0.0) 16.7 (0.0-42.3) 11.0 (0.0-28.6)
Poor technical skill of staff 0.0 (0.0-0.0) 35.8 (10.4-61.3) 23.5 (4.9-42.0)
Waiting time 43.5 (13.2-73.8) 21.8 (4.2-39.5) 29.3 (13.0-45.7)
Contradictory diagnoses between clinicians 7.8 (0.0-19.8) 8.5 (0.0-25.0) 8.2 (0.0-19.9)
Poor communication 0.0 (0.0-0.0) 7.3 (0.0-16.8) 4.8 (0.0-10.9)
Lack of confidentiality 14.3 (0.0-40.2) 11.0 (0.0-27.7) 12.2 (0.0-26.7)
Treatments not effective 8.6 (0.0-22.1) 1.6 (0.0-4.9) 4.0 (0.0-9.2)
Note: Estimates are based on 45 respondents in NSW. For this indicator 3 (6.25%) were not stated (Don’t know or Refused) in NSW. The questions used were: In the last 12 months, have you attended a government-run community health centre?, Overall what do you think of the careyou received at this community health centre? Was it excellent, very good, good, fair, or poor?, and Could you briefly describe why you rated the careyou received as fair or poor? Respondents could mention more than one response. Percentages will total more than 100 per cent.
Source: New South Wales Population Health Survey 2006 (HOIST). Centre for Epidemiology and Research, NSW Department of Health.
352
WARNIN
G: Esti
mates o
ut of
date.
Please
chec
k Hea
lthStat
s NSW
for la
test e
stimate
s.
Public dental services
IntroductionNew South Wales residents with a health care or pensioner concession card are eligible for publicdental care. In order to monitor the use of public dental services, in 2006 the New South WalesPopulation Health asked respondents: In the last 12 months, have you been to a government-runpublic dental service or dental hospital? Overall, what do you think of the care you received at thispublic dental service? If care was rated as Fair or Poor, respondents were also asked: Could youbriefly describe why you rated the care you received as Fair or Poor?
Results
Attendance at a public dental service
In 2006, the New South Wales Population Health Survey estimated that 4.2 per cent of adultsattended a public dental service in the previous 12 months.
There was no significant variation between females and males. A significantly higher proportion ofadults aged 16-24 years (6.7 per cent), and a significantly lower proportion of adults aged 35-44 years(2.9 per cent), attended a public dental service in the previous 12 months. There was no significantvariation between adults in urban areas and rural areas, or among health areas.
A lower proportion of adults in the 2 least disadvantaged quintiles (1.9 per cent and 3.0 per cent), anda higher proportion of adults in the most disadvantaged quintile (6.8 per cent), attended a public dental service.
There has been no significant variation in the proportion of adults attending a public dental servicebetween 1998 and 2006.
Rating of public dental service care
Those who attended a public dental service were asked to rate the care they received. Overall, 25.7per cent rated their care as excellent, 29.2 per cent as very good, 29.3 per cent as good, 10.0 per centas fair, and 5.8 per cent as poor. Responses of excellent, very good, and good were combined into apositive rating of care.
Overall, 84.2 per cent of adults rated their care positively. There was no significant variation betweenmales and females, or among age groups.
There was no significant variation between adults in rural areas and urban areas; however, a higherproportion of adults in the Northern Sydney & Central Coast Health Area (94.3 per cent) rated theircare positively.
There was no significant variation in ratings of positive care by level of socioeconomic disadvantage.
Overall, the proportion of adults who rated their public dental service care positively has not variedsignificantly between 2002 and 2006.
The main reasons for rating care as fair or poor were: insufficient services (43.5 per cent), poortechnical skill of clinical staff (24.9 per cent), waiting time for an appointment (21.0 per cent), and poorattitude of clinical staff (14.8 per cent).
353
WARNIN
G: Esti
mates o
ut of
date.
Please
chec
k Hea
lthStat
s NSW
for la
test e
stimate
s.
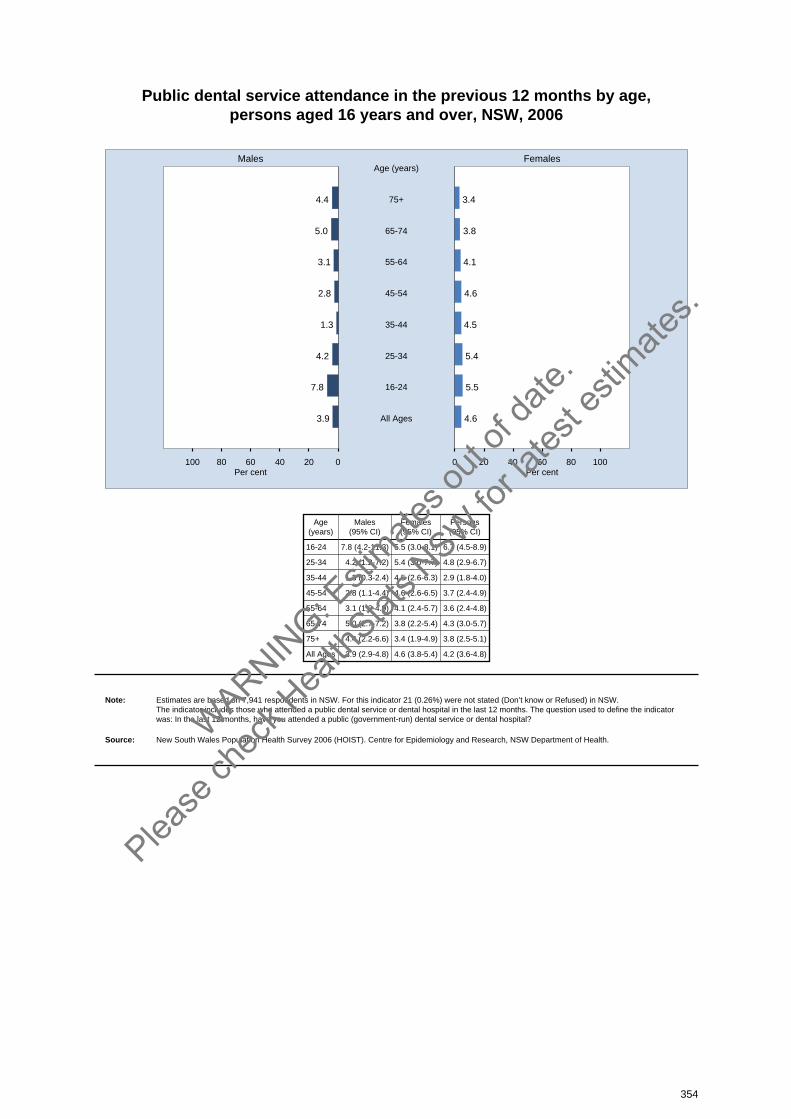
Public dental service attendance in the previous 12 months by age, persons aged 16 years and over, NSW, 2006
020406080100 0 20 40 60 80 100
Males Females
Per cent Per cent
4.4 3.475+
Age (years)
5.0 3.865-74
3.1 4.155-64
2.8 4.645-54
1.3 4.535-44
4.2 5.425-34
7.8 5.516-24
3.9 4.6All Ages
Age(years)
Males(95% CI)
Females(95% CI)
Persons(95% CI)
16-24 7.8 (4.2-11.3) 5.5 (3.0-8.1) 6.7 (4.5-8.9)
25-34 4.2 (1.2-7.2) 5.4 (3.0-7.7) 4.8 (2.9-6.7)
35-44 1.3 (0.3-2.4) 4.5 (2.6-6.3) 2.9 (1.8-4.0)
45-54 2.8 (1.1-4.4) 4.6 (2.6-6.5) 3.7 (2.4-4.9)
55-64 3.1 (1.3-4.9) 4.1 (2.4-5.7) 3.6 (2.4-4.8)
65-74 5.0 (2.7-7.2) 3.8 (2.2-5.4) 4.3 (3.0-5.7)
75+ 4.4 (2.2-6.6) 3.4 (1.9-4.9) 3.8 (2.5-5.1)
All Ages 3.9 (2.9-4.8) 4.6 (3.8-5.4) 4.2 (3.6-4.8)
Note: Estimates are based on 7,941 respondents in NSW. For this indicator 21 (0.26%) were not stated (Don’t know or Refused) in NSW. The indicator includes those who attended a public dental service or dental hospital in the last 12 months. The question used to define the indicatorwas: In the last 12 months, have you attended a public (government-run) dental service or dental hospital?
Source: New South Wales Population Health Survey 2006 (HOIST). Centre for Epidemiology and Research, NSW Department of Health.
354
WARNIN
G: Esti
mates o
ut of
date.
Please
chec
k Hea
lthStat
s NSW
for la
test e
stimate
s.
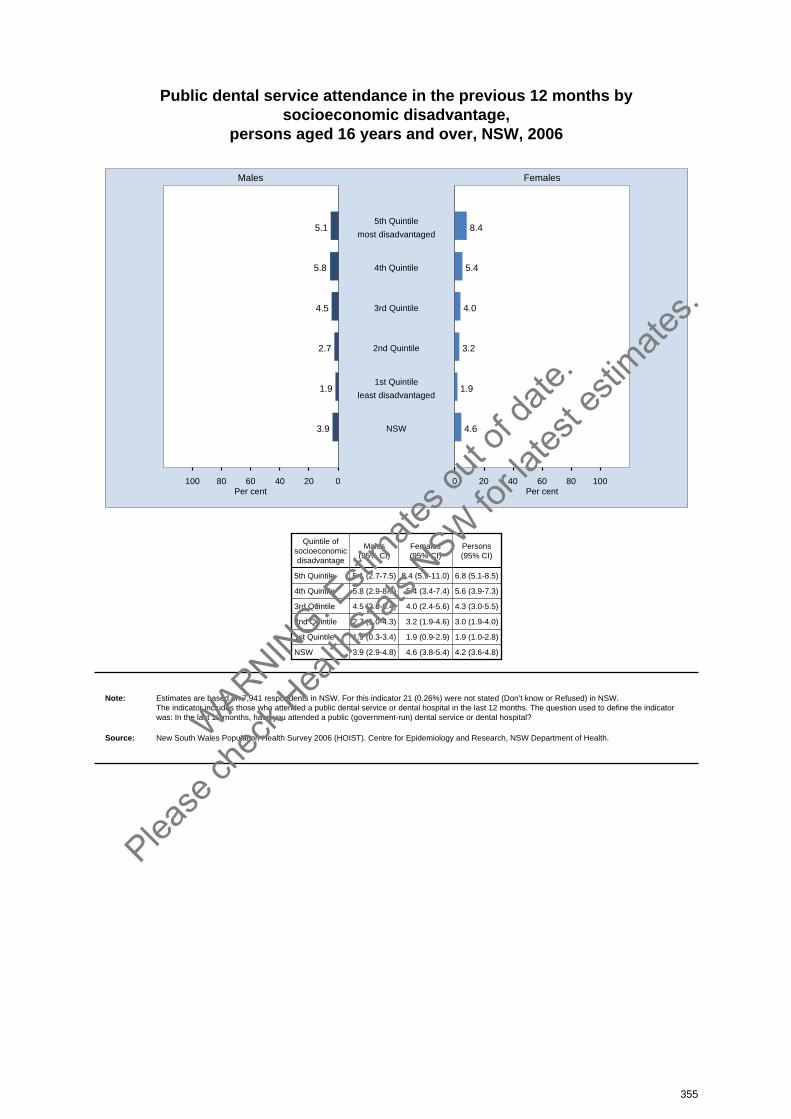
Public dental service attendance in the previous 12 months bysocioeconomic disadvantage,
persons aged 16 years and over, NSW, 2006
020406080100 0 20 40 60 80 100
Males Females
Per cent Per cent
5.1 8.45th Quintile
most disadvantaged
5.8 5.44th Quintile
4.5 4.03rd Quintile
2.7 3.22nd Quintile
1.9 1.91st Quintile
least disadvantaged
3.9 4.6NSW
Quintile ofsocioeconomicdisadvantage
Males(95% CI)
Females(95% CI)
Persons(95% CI)
5th Quintile 5.1 (2.7-7.5) 8.4 (5.9-11.0) 6.8 (5.1-8.5)
4th Quintile 5.8 (2.9-8.7) 5.4 (3.4-7.4) 5.6 (3.9-7.3)
3rd Quintile 4.5 (2.6-6.4) 4.0 (2.4-5.6) 4.3 (3.0-5.5)
2nd Quintile 2.7 (1.0-4.3) 3.2 (1.9-4.6) 3.0 (1.9-4.0)
1st Quintile 1.9 (0.3-3.4) 1.9 (0.9-2.9) 1.9 (1.0-2.8)
NSW 3.9 (2.9-4.8) 4.6 (3.8-5.4) 4.2 (3.6-4.8)
Note: Estimates are based on 7,941 respondents in NSW. For this indicator 21 (0.26%) were not stated (Don’t know or Refused) in NSW. The indicator includes those who attended a public dental service or dental hospital in the last 12 months. The question used to define the indicatorwas: In the last 12 months, have you attended a public (government-run) dental service or dental hospital?
Source: New South Wales Population Health Survey 2006 (HOIST). Centre for Epidemiology and Research, NSW Department of Health.
355
WARNIN
G: Esti
mates o
ut of
date.
Please
chec
k Hea
lthStat
s NSW
for la
test e
stimate
s.

Public dental service attendance in the previous 12 months by health area, persons aged 16 years and over, NSW, 2006
0 20 40 60 80 100 0 20 40 60 80 100
Males Females
Per cent Per cent
Sydney South West
South Eastern Sydney& Illawarra
Sydney West
Northern Sydney &Central Coast
Hunter & New England
North Coast
Greater Southern
Greater Western
Urban
Rural
NSW
AreaMales
(95% CI)Females(95% CI)
Persons(95% CI)
Sydney South West 4.4 (2.1-6.7) 6.8 (4.4-9.1) 5.6 (3.9-7.3)
South Eastern Sydney & Illawarra 3.3 (1.0-5.5) 4.0 (2.0-6.0) 3.7 (2.2-5.2)
Sydney West 2.8 (0.3-5.2) 5.0 (2.9-7.2) 3.9 (2.3-5.5)
Northern Sydney & Central Coast 3.1 (1.1-5.1) 2.7 (1.2-4.2) 2.9 (1.6-4.2)
Hunter & New England 5.4 (2.5-8.3) 3.0 (1.3-4.6) 4.2 (2.5-5.8)
North Coast 6.1 (2.5-9.7) 5.0 (2.9-7.1) 5.5 (3.5-7.6)
Greater Southern 3.1 (1.1-5.2) 5.2 (2.7-7.8) 4.2 (2.5-5.8)
Greater Western 3.8 (1.4-6.2) 5.3 (3.1-7.5) 4.5 (2.9-6.1)
Urban 3.4 (2.3-4.6) 4.7 (3.7-5.7) 4.1 (3.3-4.8)
Rural 4.8 (3.3-6.3) 4.3 (3.2-5.3) 4.5 (3.6-5.5)
NSW 3.9 (2.9-4.8) 4.6 (3.8-5.4) 4.2 (3.6-4.8)
Note: Estimates are based on 7,941 respondents in NSW. For this indicator 21 (0.26%) were not stated (Don’t know or Refused) in NSW. The indicator includes those who attended a public dental service or dental hospital in the last 12 months. The question used to define the indicatorwas: In the last 12 months, have you attended a public (government-run) dental service or dental hospital?
Source: New South Wales Population Health Survey 2006 (HOIST). Centre for Epidemiology and Research, NSW Department of Health.
356
WARNIN
G: Esti
mates o
ut of
date.
Please
chec
k Hea
lthStat
s NSW
for la
test e
stimate
s.
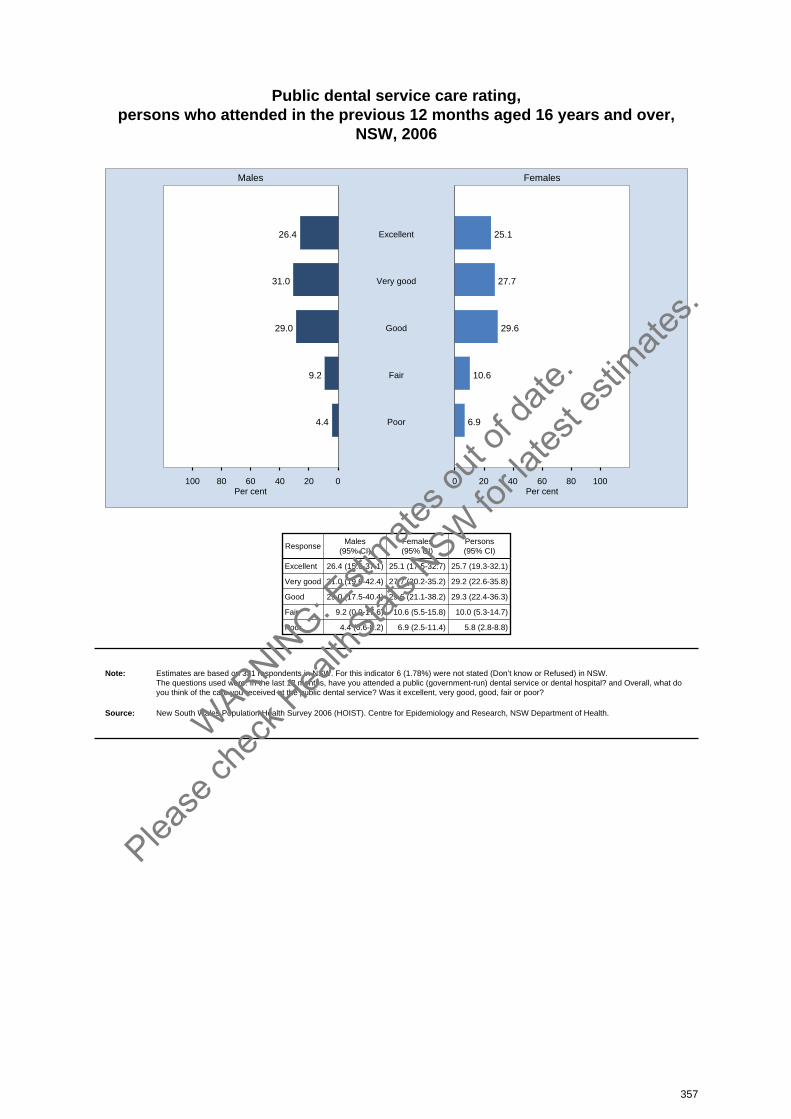
Public dental service care rating, persons who attended in the previous 12 months aged 16 years and over,
NSW, 2006
020406080100 0 20 40 60 80 100
Males Females
Per cent Per cent
26.4 25.1Excellent
31.0 27.7Very good
29.0 29.6Good
9.2 10.6Fair
4.4 6.9Poor
ResponseMales
(95% CI)Females(95% CI)
Persons(95% CI)
Excellent 26.4 (15.6-37.1) 25.1 (17.5-32.7) 25.7 (19.3-32.1)
Very good 31.0 (19.6-42.4) 27.7 (20.2-35.2) 29.2 (22.6-35.8)
Good 29.0 (17.5-40.4) 29.6 (21.1-38.2) 29.3 (22.4-36.3)
Fair 9.2 (0.9-17.6) 10.6 (5.5-15.8) 10.0 (5.3-14.7)
Poor 4.4 (0.6-8.2) 6.9 (2.5-11.4) 5.8 (2.8-8.8)
Note: Estimates are based on 331 respondents in NSW. For this indicator 6 (1.78%) were not stated (Don’t know or Refused) in NSW. The questions used were: In the last 12 months, have you attended a public (government-run) dental service or dental hospital? and Overall, what doyou think of the care you received at the public dental service? Was it excellent, very good, good, fair or poor?
Source: New South Wales Population Health Survey 2006 (HOIST). Centre for Epidemiology and Research, NSW Department of Health.
357
WARNIN
G: Esti
mates o
ut of
date.
Please
chec
k Hea
lthStat
s NSW
for la
test e
stimate
s.

Public dental service care rated as excellent, very good, or good by age, persons who attended in the previous 12 months aged 16 years and over,
NSW, 2006
020406080100 0 20 40 60 80 100
Males Females
Per cent Per cent
77.0 83.275+
Age (years)
88.6 83.665-74
85.6 74.655-64
91.8 90.845-54
100.0 69.935-44
81.7 84.925-34
85.6 89.116-24
86.4 82.4All Ages
Age(years)
Males(95% CI)
Females(95% CI)
Persons(95% CI)
16-24 85.6 (69.6-100) 89.1 (76.2-100) 87.0 (76.0-98.0)
25-34 81.7 (50.1-100) 84.9 (70.6-99.3) 83.5 (67.5-99.6)
35-44 100 (100-100) 69.9 (49.9-90.0) 76.8 (60.4-93.1)
45-54 91.8 (76.3-100) 90.8 (79.8-100) 91.2 (82.2-100)
55-64 85.6 (72.3-98.9) 74.6 (55.3-94.0) 79.7 (66.9-92.4)
65-74 88.6 (77.1-100) 83.6 (66.4-100) 86.3 (76.1-96.5)
75+ 77.0 (53.6-100) 83.2 (69.3-97.1) 80.4 (67.1-93.7)
All Ages 86.4 (77.5-95.2) 82.4 (76.1-88.8) 84.2 (78.9-89.6)
Note: Estimates are based on 331 respondents in NSW. For this indicator 6 (1.78%) were not stated (Don’t know or Refused) in NSW. The indicator includes those who attended a public dental service or dental hospital in the last 12 months who rated their care as excellent, very good,or good for the most recent attendance. The questions used to define the indicator were: In the last 12 months, have you attended a public(government-run) dental service or dental hospital? and Overall what do you think of the care you received? Was it excellent, very good, good, fair or poor?
Source: New South Wales Population Health Survey 2006 (HOIST). Centre for Epidemiology and Research, NSW Department of Health.
358
WARNIN
G: Esti
mates o
ut of
date.
Please
chec
k Hea
lthStat
s NSW
for la
test e
stimate
s.

Public dental service care rated as excellent, very good, or good bysocioeconomic disadvantage,
persons who attended in the previous 12 months aged 16 years and over,NSW, 2006
020406080100 0 20 40 60 80 100
Males Females
Per cent Per cent
92.7 86.45th Quintile
most disadvantaged
96.1 75.54th Quintile
85.3 69.73rd Quintile
63.1 94.02nd Quintile
85.0 84.01st Quintile
least disadvantaged
86.4 82.4NSW
Quintile ofsocioeconomicdisadvantage
Males(95% CI)
Females(95% CI)
Persons(95% CI)
5th Quintile 92.7 (79.9-100) 86.4 (76.9-95.8) 88.7 (81.0-96.3)
4th Quintile 96.1 (91.2-100) 75.5 (59.0-92.1) 85.9 (76.2-95.5)
3rd Quintile 85.3 (68.9-100) 69.7 (51.1-88.3) 78.0 (65.5-90.5)
2nd Quintile 63.1 (27.8-98.5) 94.0 (85.6-100) 80.7 (61.5-99.8)
1st Quintile 85.0 (62.3-100) 84.0 (60.2-100) 84.5 (68.0-100)
NSW 86.4 (77.5-95.2) 82.4 (76.1-88.8) 84.2 (78.9-89.6)
Note: Estimates are based on 331 respondents in NSW. For this indicator 6 (1.78%) were not stated (Don’t know or Refused) in NSW. The indicator includes those who attended a public dental service or dental hospital in the last 12 months who rated their care as excellent, very good,or good for the most recent attendance. The questions used to define the indicator were: In the last 12 months, have you attended a public(government-run) dental service or dental hospital? and Overall what do you think of the care you received? Was it excellent, very good, good, fair or poor?
Source: New South Wales Population Health Survey 2006 (HOIST). Centre for Epidemiology and Research, NSW Department of Health.
359
WARNIN
G: Esti
mates o
ut of
date.
Please
chec
k Hea
lthStat
s NSW
for la
test e
stimate
s.

Public dental service care rated as excellent, very good, or good by healtharea,
persons who attended in the previous 12 months aged 16 years and over,NSW, 2006
0 20 40 60 80 100 0 20 40 60 80 100
Males Females
Per cent Per cent
Sydney South West
South Eastern Sydney& Illawarra
Sydney West
Northern Sydney &Central Coast
Hunter & New England
North Coast
Greater Southern
Greater Western
Urban
Rural
NSW
AreaMales
(95% CI)Females(95% CI)
Persons(95% CI)
Sydney South West 75.1 (51.9-98.2) 97.7 (93.1-100) 88.9 (79.1-98.8)
South Eastern Sydney & Illawarra 76.6 (37.5-100) 68.3 (44.5-92.2) 72.0 (50.5-93.5)
Sydney West 87.9 (67.2-100) 69.1 (48.7-89.5) 75.8 (59.6-92.0)
Northern Sydney & Central Coast 93.4 (83.3-100) 95.4 (88.3-100) 94.3 (88.1-100)
Hunter & New England 97.3 (91.8-100) 63.0 (31.7-94.2) 84.9 (69.9-99.9)
North Coast 93.2 (84.0-100) 79.4 (63.4-95.4) 86.8 (77.4-96.3)
Greater Southern 100 (100-100) 90.0 (75.3-100) 93.5 (83.9-100)
Greater Western 77.4 (54.7-100) 83.2 (65.9-100) 80.8 (67.2-94.5)
Urban 81.7 (68.1-95.3) 84.1 (76.6-91.6) 83.1 (75.9-90.3)
Rural 94.2 (89.8-98.6) 78.2 (66.6-89.9) 86.6 (79.9-93.2)
NSW 86.4 (77.5-95.2) 82.4 (76.1-88.8) 84.2 (78.9-89.6)
Note: Estimates are based on 331 respondents in NSW. For this indicator 6 (1.78%) were not stated (Don’t know or Refused) in NSW. The indicator includes those who attended a public dental service or dental hospital in the last 12 months who rated their care as excellent, very good,or good for the most recent attendance. The questions used to define the indicator were: In the last 12 months, have you attended a public(government-run) dental service or dental hospital? and Overall what do you think of the care you received? Was it excellent, very good, good, fair or poor?
Source: New South Wales Population Health Survey 2006 (HOIST). Centre for Epidemiology and Research, NSW Department of Health.
360
WARNIN
G: Esti
mates o
ut of
date.
Please
chec
k Hea
lthStat
s NSW
for la
test e
stimate
s.
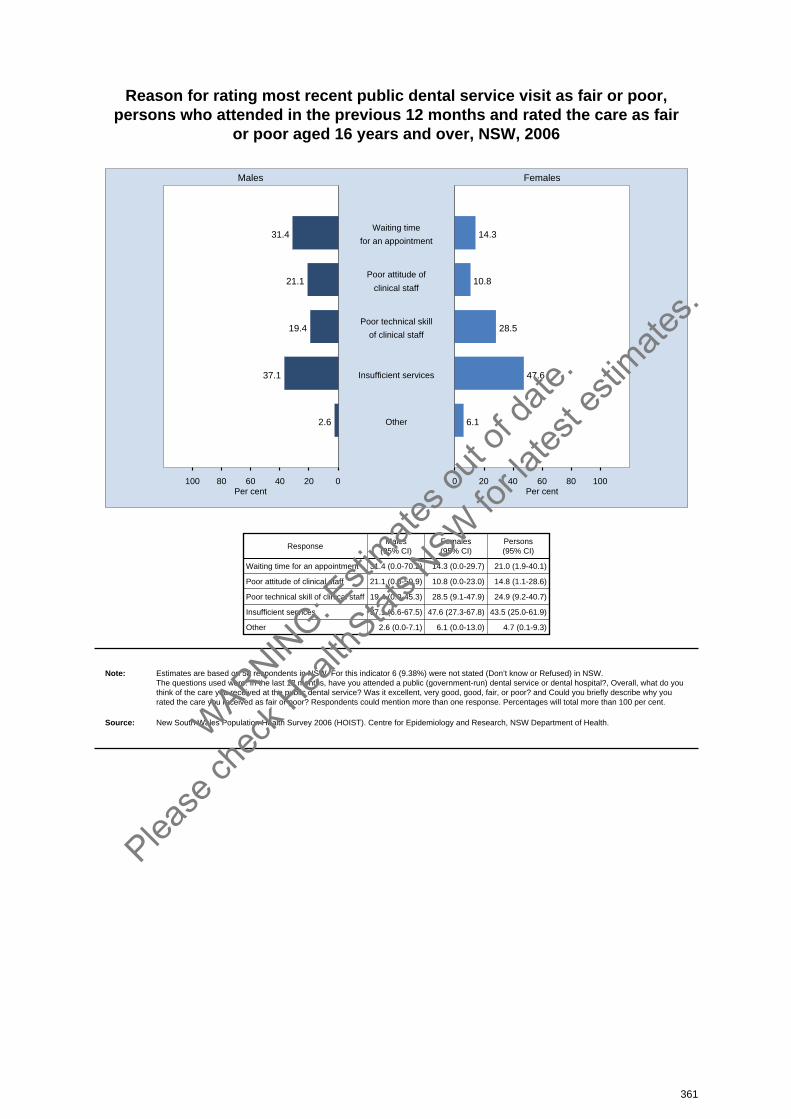
Reason for rating most recent public dental service visit as fair or poor, persons who attended in the previous 12 months and rated the care as fair
or poor aged 16 years and over, NSW, 2006
020406080100 0 20 40 60 80 100
Males Females
Per cent Per cent
31.4 14.3Waiting time
for an appointment
21.1 10.8Poor attitude of
clinical staff
19.4 28.5Poor technical skill
of clinical staff
37.1 47.6Insufficient services
2.6 6.1Other
ResponseMales
(95% CI)Females(95% CI)
Persons(95% CI)
Waiting time for an appointment 31.4 (0.0-70.2) 14.3 (0.0-29.7) 21.0 (1.9-40.1)
Poor attitude of clinical staff 21.1 (0.0-50.9) 10.8 (0.0-23.0) 14.8 (1.1-28.6)
Poor technical skill of clinical staff 19.4 (0.0-45.3) 28.5 (9.1-47.9) 24.9 (9.2-40.7)
Insufficient services 37.1 (6.6-67.5) 47.6 (27.3-67.8) 43.5 (25.0-61.9)
Other 2.6 (0.0-7.1) 6.1 (0.0-13.0) 4.7 (0.1-9.3)
Note: Estimates are based on 58 respondents in NSW. For this indicator 6 (9.38%) were not stated (Don’t know or Refused) in NSW. The questions used were: In the last 12 months, have you attended a public (government-run) dental service or dental hospital?, Overall, what do youthink of the care you received at the public dental service? Was it excellent, very good, good, fair, or poor? and Could you briefly describe why yourated the care you received as fair or poor? Respondents could mention more than one response. Percentages will total more than 100 per cent.
Source: New South Wales Population Health Survey 2006 (HOIST). Centre for Epidemiology and Research, NSW Department of Health.
361
WARNIN
G: Esti
mates o
ut of
date.
Please
chec
k Hea
lthStat
s NSW
for la
test e
stimate
s.
Social capital
IntroductionSocial capital is the raw material of civil society created from the interactions between people. It is notlocated within the person but the space between people. It is not the property of the organisation,market, or state, but all these can engage in its production. It originates with people forming socialconnections and networks based on trust, mutual reciprocity, and norms of action. It is referred to ascapital because that term invests it with the same status as other forms of capital: financial, physical,and human. The term capital is also appropriate because it can be measured and quantified in a waythat distributes its benefits and avoids its losses.[1,2]
In 2006, the New South Wales Population Health Survey asked respondents: In the last 6 months,how often have you attended a local community event such as a church or school fete, school concert,or street fair? In the last 3 months, how often have you helped out any local group or organisationsuch as a school, scouts and brownies, a sporting club, or hospital as a volunteer? Are you an activemember of a local organisation, church or club such as a sport, craft or social club? Do you agree ordisagree with the statement: Most people can be trusted? Do you agree or disagree with thestatement: I feel safe walking down my street after dark? Do you agree or disagree with the statement:My area has a reputation for being a safe place? How often have you visited someone in yourneighbourhood in the past week? When you go shopping in your local area how often are you likely torun into friends and acquaintances? and, Would you be sad if you had to leave this neighbourhood?Responses were grouped into positive and negative responses for each question.
Results
Participation in the local community
Overall, in 2006, 60.3 per cent of adults attended a community event in the last 6 months. Asignificantly higher proportion of females (63.6 per cent) than males (57.0 per cent) attended acommunity event. Among males, a significantly higher proportion of adults aged 35-44 years (67.5 percent) and 45-54 years (62.7 per cent), and a significantly lower proportion of adults aged 75 years andover (41.1 per cent), attended a community event, compared with the overall adult male population.Among females, a significantly higher proportion of adults aged 35-44 years (74.1 per cent), and asignificantly lower proportion of adults aged 16-24 years (57.0 per cent) and 75 years and over (51.6per cent), attended a community event, compared with the overall adult female population. Asignificantly higher proportion of adults in rural (65.4 per cent) than urban areas (58.2 per cent),attended a community event. A higher proportion of adults in the North Coast (66.8 per cent) andGreater Southern (67.4 per cent) and Greater Western (66.2 per cent) Health Areas attended acommunity event. There was no variation by socioeconomic disadvantage. The overall proportion hasincreased significantly between 2002 (57.1 per cent) and 2006 (60.3 per cent).
Overall, in 2006, 35.9 per cent of adults helped out at a local group or organisation in the last 3months. A significantly higher proportion of females (37.7 per cent) than males (34.1 per cent) helpedout at a local group or organisation. Among males, a significantly higher proportion of adults aged45-54 years (41.2 per cent), and a significantly lower proportion of adults aged 75 years and over(25.6 per cent), helped out at a local group or organisation, compared with the overall adult malepopulation. Among females, a significantly higher proportion of adults aged 35-44 years (45.4 percent), and a significantly lower proportion of adults aged 75 years and over (31.0 per cent), helped outat a local group or organisation, compared with the overall adult female population. A significantlyhigher proportion of adults in rural (44.4 per cent) than urban areas (32.3 per cent), helped out at alocal group or organisation. A higher proportion of adults in the Hunter & New England (41.3 per cent),North Coast (43.7 per cent), Greater Southern (50.1 per cent) and Greater Western (45.0 per cent)Health Areas helped out at a local group or organisation. A lower proportion of adults in the SydneySouth West (29.6 per cent) and South Eastern Sydney & Illawarra (30.2 per cent) Health Areas helpedout at a local group or organisation. A higher proportion of adults in the second most disadvantagedquintile (39.9 per cent) helped out at a local group or organisation. The overall proportion hasincreased significantly between 2002 (33.4 per cent) and 2006 (35.9 per cent).
362
WARNIN
G: Esti
mates o
ut of
date.
Please
chec
k Hea
lthStat
s NSW
for la
test e
stimate
s.
Overall, in 2006, 43.8 per cent of adults were an active member of a local organisation or church orclub. A significantly lower proportion of females (31.9 per cent) than males (45.7 per cent) were anactive member of a local organisation or church or club. Among males, a significantly higher proportionof adults aged 65-74 years (52.5 per cent), and a significantly lower proportion of adults aged 25-34years (36.1 per cent), were an active member of a local organisation or church or club, compared withthe overall adult male population. Among females, a significantly higher proportion of adults aged65-74 years (56.7 per cent) and 75 years and over (54.5 per cent), and a significantly lower proportionof adults aged 25-34 years (32.5 per cent), were an active member of a local organisation or church orclub, compared with the overall adult female population. A significantly higher proportion of adults inrural (48.7 per cent) than urban areas (41.7 per cent) were an active member of a local organisation orchurch or club. A higher proportion of adults in the Hunter & New England (48.3 per cent) and GreaterSouthern (50.5 per cent) and Greater Western (50.0 per cent) Health Areas, were an active member ofa local organisation or church or club. There was no variation by socioeconomic disadvantage. Theoverall proportion has not increased significantly between 2002 and 2006.
Trust and safety
Overall, in 2006, 73.5 per cent of adults strongly agreed or agreed that most people can be trusted.There was no significant variation in the proportion of males and females. A significantly higherproportion of adults aged 75 years and over (79.1 per cent), and a significantly lower proportion ofadults aged 25-34 years (67.5 per cent), strongly agreed or agreed that most people can be trusted,compared with the overall adult population. A significantly higher proportion of adults in rural areas(76.1 per cent) than urban areas (72.4 per cent) strongly agreed or agreed that most people can betrusted. A higher proportion of adults in the Northern Sydney & Central Coast (81.4 per cent) andNorth Coast (77.4 per cent) and Greater Southern (77.9 per cent) Health Areas, and a lowerproportion of adults in the Sydney South West (65.4 per cent) and Northern Sydney & Central Coast(81.4 per cent) Health Areas, strongly agreed or agreed that most people can be trusted. Trustdecreased with disadvantage. A higher proportion of adults in the 2 least disadvantaged quintiles (84.5per cent and 78.6 per cent), and a lower proportion of adults in the most disadvantaged quintile (59.9per cent), strongly agreed or agreed that most people can be trusted. The overall proportion hasincreased significantly between 2002 (65.7 per cent) and 2006 (73.5 per cent).
Overall, in 2006, 70.2 per cent of adults felt safe walking down their street after dark. A significantlyhigher proportion of males (82.4 per cent) than females (58.0 per cent) felt safe walking down theirstreet after dark. Among males, a significantly higher proportion of adults aged 35-44 years (89.8 percent), and a significantly lower proportion of adults aged 65-74 years (75.3 per cent) and 75 years andover (62.0 per cent), felt safe walking down their street after dark, compared with the overall adultmale population. Among females, a significantly higher proportion of adults aged 35-44 years (63.0 percent) and 45-54 years (67.2 per cent), and a significantly lower proportion of adults aged 65-74 years(46.6 per cent) and 75 years and over (29.8 per cent), felt safe walking down their street after dark,compared with the overall adult female population. There was no significant variation between adultsin rural areas and urban areas. A higher proportion of adults in the South Eastern Sydney & Illawarra(73.8 per cent) and Northern Sydney & Central Coast (78.6 per cent) and Greater Southern (73.9 percent) Health Areas, and a lower proportion of adults in the Sydney South West Health Area (61.4 percent), felt safe walking down their street after dark. Feelings of safety decreased with disadvantage. Ahigher proportion of adults in the 2 least disadvantaged quintiles (81.5 per cent and 75.1 per cent), anda lower proportion of adults in the most disadvantaged quintile (54.3 per cent), felt safe walking downtheir street after dark. The overall proportion has increased significantly between 2002 (67.4 per cent)and 2006 (70.2 per cent).
Overall, in 2006, 75.3 per cent of adults said their area had a reputation for being safe. There was nosignificant variation in the proportion of males and females. A significantly higher proportion of adultsaged 55-64 years (79.3 per cent) and 65-74 years (79.4 per cent) and 75 years and over (81.7 percent) said their area had a reputation for being safe, compared with the overall adult population. Asignificantly lower proportion of adults aged 16-24 years (68.9 per cent) and 25-34 years (70.4 percent) said their area had a reputation for being safe. A significantly higher proportion of adults in ruralareas (80.8 per cent) than urban areas (73.0 per cent) said their area had a reputation for being safe.A higher proportion of adults in the Northern Sydney & Central Coast (86.9 per cent), North Coast(83.1 per cent), Greater Southern (87.7 per cent), and Greater Western (80.2 per cent) Health Areassaid their area had a reputation for being safe. A lower proportion of adults in the Sydney South West
363
WARNIN
G: Esti
mates o
ut of
date.
Please
chec
k Hea
lthStat
s NSW
for la
test e
stimate
s.

(60.4 per cent) and Sydney West (68.4 per cent) Health Areas said their area had a reputation forbeing safe. A reputation for safety decreased with disadvantage. A higher proportion of adults in the 2least disadvantaged quintiles (90.4 per cent and 81.0 per cent), and a lower proportion of adults in themost disadvantaged quintile (54.3 per cent), said their area had a reputation for being safe. Theoverall proportion has increased significantly between 2002 (73.3 per cent) and 2006 (75.3 per cent).
Reciprocity and neighbourhood connection
Overall, in 2006, 66.7 per cent of adults visited neighbours. There was no significant variation betweenmales and females or among age groups. A significantly higher proportion of adults in rural areas(72.5 per cent) than urban areas (64.3 per cent) visited neighbours. A higher proportion of adults in theHunter & New England (73.6 per cent), North Coast (71.1 per cent), Greater Southern (70.8 per cent)and Greater Western (74.1 per cent) Health Areas visited neighbours. A lower proportion of adults inthe Sydney South West Health Area (61.6 per cent) visited neighbours. A higher proportion of adults inthe second most disadvantaged quintile (70.7 per cent) visited neighbours. Overall the proportion hasnot increased significantly between 2002 and 2006, however there was a significant increase infemales (63.6 per cent to 66.9 per cent).
Overall, in 2006, 80.8 per cent of adults ran into friends and acquaintances when shopping in theirlocal area. A significantly higher proportion of females (83.2 per cent) than males (78.2 per cent) raninto friends and acquaintances when shopping in their local area. Among females, a significantlyhigher proportion of adults aged 35-44 years (87.2 per cent) ran into friends and acquaintances whenshopping in their local area, compared with the overall adult female population. A significantly higherproportion of adults in rural areas (89.2 per cent) than urban areas (77.1 per cent) ran into friends andacquaintances when shopping in their local area. A higher proportion of adults in the Hunter & NewEngland (87.8 per cent), North Coast (89.1 per cent), Greater Southern (89.7 per cent) and GreaterWestern (92.9 per cent) Health Areas ran into friends and acquaintances when shopping in their localarea. A lower proportion of adults in the Sydney South West (75.0 per cent) and Sydney West (74.7per cent) Health Areas ran into friends and acquaintances when shopping in their local area. A higherproportion of adults in the second most disadvantaged quintile (85.3 per cent), and a lower proportionof adults in the second least disadvantaged quintile (77.6 per cent), ran into friends and acquaintanceswhen shopping in their local area. The overall proportion has decreased significantly between 2002(82.4 per cent) and 2006 (80.8 per cent).
Overall, in 2006, 73.0 per cent of adults would feel sad if they had to leave their neighbourhood. Asignificantly higher proportion of females (76.3 per cent) than males (69.5 per cent) would feel sad ifthey had to leave their neighbourhood. Among males, a significantly higher proportion of adults aged65-74 years (76.5 per cent) and 75 years and over (85.0 per cent), and a significantly lower proportionof adults aged 25-34 years (58.6 per cent), would feel sad if they had to leave their neighbourhood,compared with the overall adult male population. Among females, a significantly higher proportion ofadults aged 65-74 years (83.9 per cent) and 75 years and over (87.8 per cent), and a significantlylower proportion of adults aged 25-34 years (69.9 per cent), would feel sad if they had to leave theirneighbourhood, compared with the overall adult female population. There was no significant variationbetween adults in rural areas and urban areas. A higher proportion of adults in the Greater SouthernHealth Area (77.1 per cent), and a lower proportion of adults in the Sydney West Health Area (68.5 percent), would feel sad if they had to leave their neighbourhood. Feelings of sadness about leaving aneighbourhood decreased with disadvantage. A higher proportion of adults in the least disadvantagedquintile (77.5 per cent), and a lower proportion of adults in the most disadvantaged quintile (67.3 percent), would feel sad if they had to leave their neighbourhood. The overall proportion has notincreased significantly between 2002 and 2006.
References1. Management Alternatives Pty Ltd. What is social capital? Available online at
www.mapl.com.au/A2.htm (accessed 11 May 2007). 2. World Bank Social Capital Website. Social capital. Available online at
www1.worldbank.org/prem/poverty/scapital/home.htm (accessed 11 May 2007).
364
WARNIN
G: Esti
mates o
ut of
date.
Please
chec
k Hea
lthStat
s NSW
for la
test e
stimate
s.

Attended a community event at least once in the last 6 months by age, persons aged 16 years and over, NSW, 2006
020406080100 0 20 40 60 80 100
Males Females
Per cent Per cent
41.1 51.675+
Age (years)
52.1 64.265-74
54.3 60.255-64
62.7 63.945-54
67.5 74.135-44
55.2 65.525-34
51.2 57.016-24
57.0 63.6All Ages
Age(years)
Males(95% CI)
Females(95% CI)
Persons(95% CI)
16-24 51.2 (44.6-57.8) 57.0 (50.9-63.2) 54.0 (49.5-58.6)
25-34 55.2 (48.3-62.2) 65.5 (60.4-70.6) 60.4 (56.0-64.7)
35-44 67.5 (62.1-72.9) 74.1 (70.1-78.1) 70.8 (67.4-74.1)
45-54 62.7 (58.1-67.4) 63.9 (59.9-67.9) 63.3 (60.2-66.4)
55-64 54.3 (49.6-59.1) 60.2 (56.3-64.0) 57.2 (54.2-60.3)
65-74 52.1 (47.1-57.0) 64.2 (60.1-68.2) 58.3 (55.1-61.5)
75+ 41.1 (35.5-46.6) 51.6 (47.1-56.2) 47.2 (43.7-50.7)
All Ages 57.0 (54.7-59.4) 63.6 (61.8-65.4) 60.3 (58.9-61.8)
Note: Estimates are based on 7,934 respondents in NSW. For this indicator 28 (0.35%) were not stated (Don’t know or Refused) in NSW. The indicator includes those who have attended at least one community event in the last 6 months. The question used was: In the last 6 months, howoften have you attended a local community event such as a church or school fete, school concert, or a street fair?
Source: New South Wales Population Health Survey 2006 (HOIST). Centre for Epidemiology and Research, NSW Department of Health.
365
WARNIN
G: Esti
mates o
ut of
date.
Please
chec
k Hea
lthStat
s NSW
for la
test e
stimate
s.
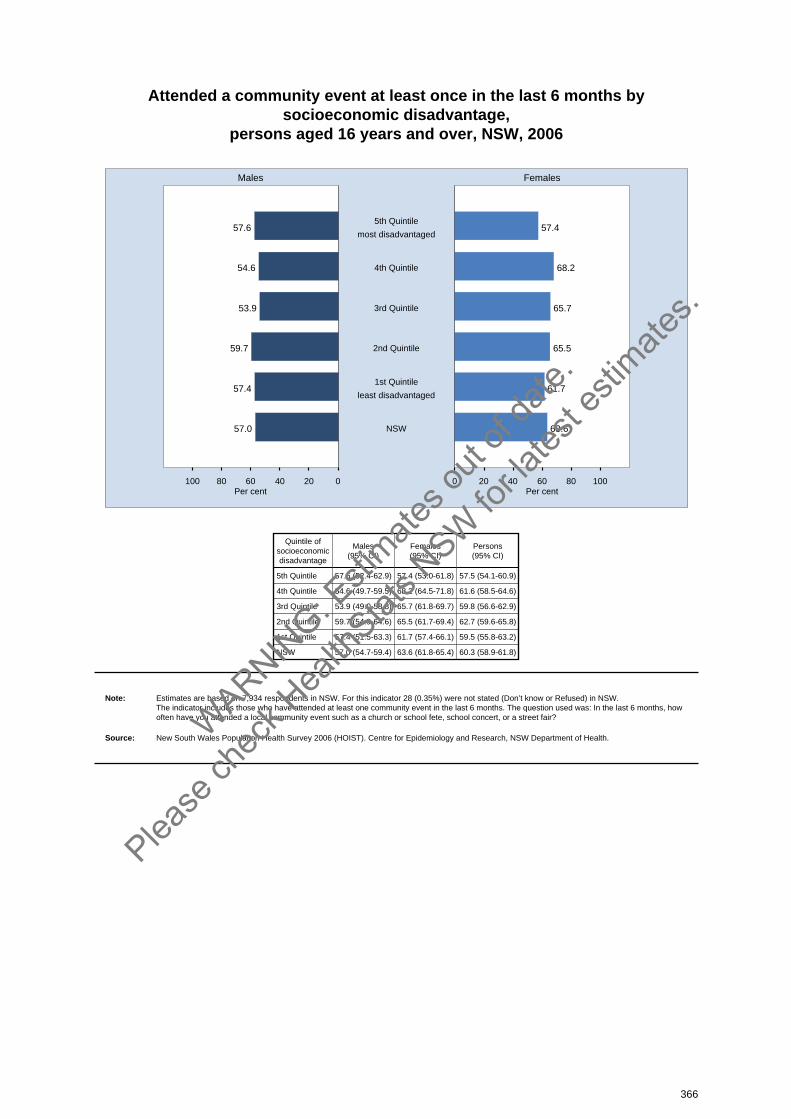
Attended a community event at least once in the last 6 months bysocioeconomic disadvantage,
persons aged 16 years and over, NSW, 2006
020406080100 0 20 40 60 80 100
Males Females
Per cent Per cent
57.6 57.45th Quintile
most disadvantaged
54.6 68.24th Quintile
53.9 65.73rd Quintile
59.7 65.52nd Quintile
57.4 61.71st Quintile
least disadvantaged
57.0 63.6NSW
Quintile ofsocioeconomicdisadvantage
Males(95% CI)
Females(95% CI)
Persons(95% CI)
5th Quintile 57.6 (52.4-62.9) 57.4 (53.0-61.8) 57.5 (54.1-60.9)
4th Quintile 54.6 (49.7-59.5) 68.2 (64.5-71.8) 61.6 (58.5-64.6)
3rd Quintile 53.9 (49.0-58.8) 65.7 (61.8-69.7) 59.8 (56.6-62.9)
2nd Quintile 59.7 (54.9-64.6) 65.5 (61.7-69.4) 62.7 (59.6-65.8)
1st Quintile 57.4 (51.5-63.3) 61.7 (57.4-66.1) 59.5 (55.8-63.2)
NSW 57.0 (54.7-59.4) 63.6 (61.8-65.4) 60.3 (58.9-61.8)
Note: Estimates are based on 7,934 respondents in NSW. For this indicator 28 (0.35%) were not stated (Don’t know or Refused) in NSW. The indicator includes those who have attended at least one community event in the last 6 months. The question used was: In the last 6 months, howoften have you attended a local community event such as a church or school fete, school concert, or a street fair?
Source: New South Wales Population Health Survey 2006 (HOIST). Centre for Epidemiology and Research, NSW Department of Health.
366
WARNIN
G: Esti
mates o
ut of
date.
Please
chec
k Hea
lthStat
s NSW
for la
test e
stimate
s.

Attended a community event at least once in the last 6 months by healtharea,
persons aged 16 years and over, NSW, 2006
0 20 40 60 80 100 0 20 40 60 80 100
Males Females
Per cent Per cent
Sydney South West
South Eastern Sydney& Illawarra
Sydney West
Northern Sydney &Central Coast
Hunter & New England
North Coast
Greater Southern
Greater Western
Urban
Rural
NSW
AreaMales
(95% CI)Females(95% CI)
Persons(95% CI)
Sydney South West 57.2 (51.6-62.7) 57.9 (53.1-62.7) 57.5 (53.9-61.2)
South Eastern Sydney & Illawarra 53.0 (46.6-59.5) 60.2 (55.2-65.1) 56.6 (52.5-60.7)
Sydney West 56.0 (49.7-62.3) 58.9 (54.2-63.6) 57.5 (53.5-61.4)
Northern Sydney & Central Coast 58.4 (52.8-64.0) 64.2 (59.6-68.8) 61.4 (57.7-65.0)
Hunter & New England 57.1 (51.2-62.9) 68.9 (64.7-73.2) 63.1 (59.5-66.7)
North Coast 61.3 (55.3-67.3) 72.0 (68.0-76.1) 66.8 (63.2-70.4)
Greater Southern 60.7 (54.7-66.7) 74.1 (69.7-78.5) 67.4 (63.6-71.1)
Greater Western 59.3 (53.2-65.5) 73.3 (69.3-77.3) 66.2 (62.5-70.0)
Urban 56.1 (53.1-59.1) 60.2 (57.8-62.6) 58.2 (56.3-60.1)
Rural 59.2 (56.0-62.4) 71.4 (69.2-73.7) 65.4 (63.4-67.3)
NSW 57.0 (54.7-59.4) 63.6 (61.8-65.4) 60.3 (58.9-61.8)
Note: Estimates are based on 7,934 respondents in NSW. For this indicator 28 (0.35%) were not stated (Don’t know or Refused) in NSW. The indicator includes those who have attended at least one community event in the last 6 months. The question used was: In the last 6 months, howoften have you attended a local community event such as a church or school fete, school concert, or a street fair?
Source: New South Wales Population Health Survey 2006 (HOIST). Centre for Epidemiology and Research, NSW Department of Health.
367
WARNIN
G: Esti
mates o
ut of
date.
Please
chec
k Hea
lthStat
s NSW
for la
test e
stimate
s.
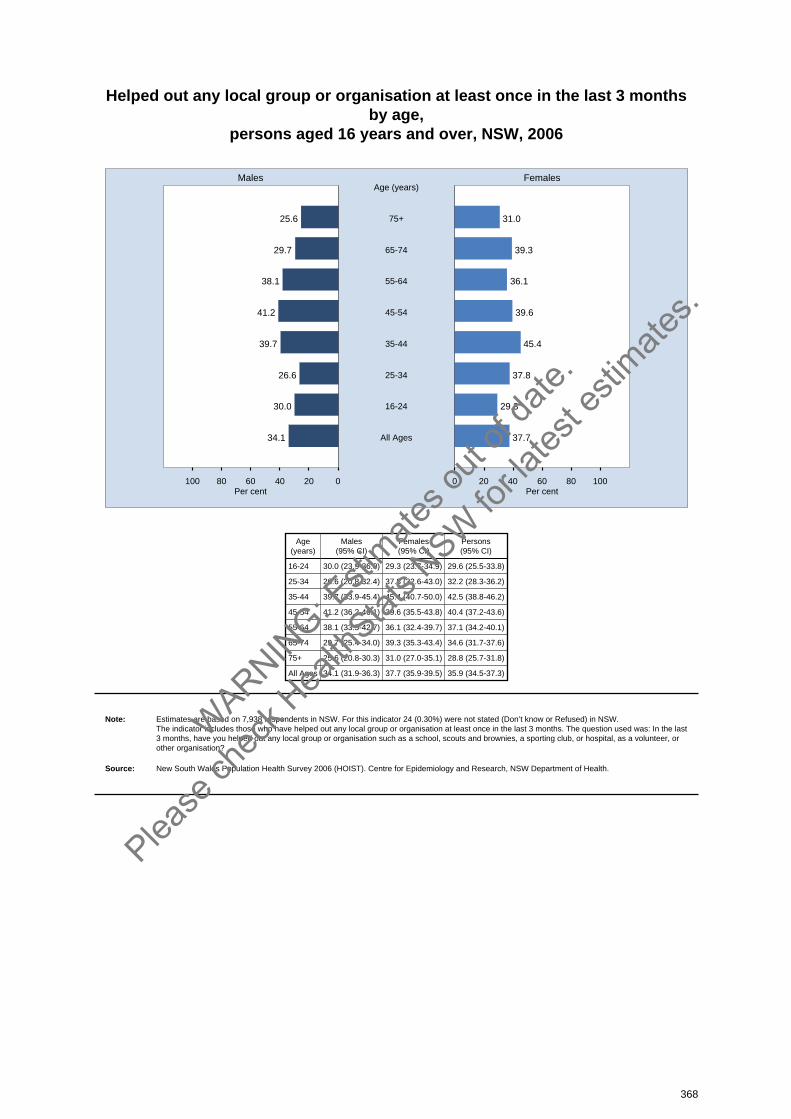
Helped out any local group or organisation at least once in the last 3 monthsby age,
persons aged 16 years and over, NSW, 2006
020406080100 0 20 40 60 80 100
Males Females
Per cent Per cent
25.6 31.075+
Age (years)
29.7 39.365-74
38.1 36.155-64
41.2 39.645-54
39.7 45.435-44
26.6 37.825-34
30.0 29.316-24
34.1 37.7All Ages
Age(years)
Males(95% CI)
Females(95% CI)
Persons(95% CI)
16-24 30.0 (23.9-36.0) 29.3 (23.7-34.9) 29.6 (25.5-33.8)
25-34 26.6 (20.8-32.4) 37.8 (32.6-43.0) 32.2 (28.3-36.2)
35-44 39.7 (33.9-45.4) 45.4 (40.7-50.0) 42.5 (38.8-46.2)
45-54 41.2 (36.2-46.1) 39.6 (35.5-43.8) 40.4 (37.2-43.6)
55-64 38.1 (33.5-42.7) 36.1 (32.4-39.7) 37.1 (34.2-40.1)
65-74 29.7 (25.4-34.0) 39.3 (35.3-43.4) 34.6 (31.7-37.6)
75+ 25.6 (20.8-30.3) 31.0 (27.0-35.1) 28.8 (25.7-31.8)
All Ages 34.1 (31.9-36.3) 37.7 (35.9-39.5) 35.9 (34.5-37.3)
Note: Estimates are based on 7,938 respondents in NSW. For this indicator 24 (0.30%) were not stated (Don’t know or Refused) in NSW. The indicator includes those who have helped out any local group or organisation at least once in the last 3 months. The question used was: In the last3 months, have you helped out any local group or organisation such as a school, scouts and brownies, a sporting club, or hospital, as a volunteer, orother organisation?
Source: New South Wales Population Health Survey 2006 (HOIST). Centre for Epidemiology and Research, NSW Department of Health.
368
WARNIN
G: Esti
mates o
ut of
date.
Please
chec
k Hea
lthStat
s NSW
for la
test e
stimate
s.
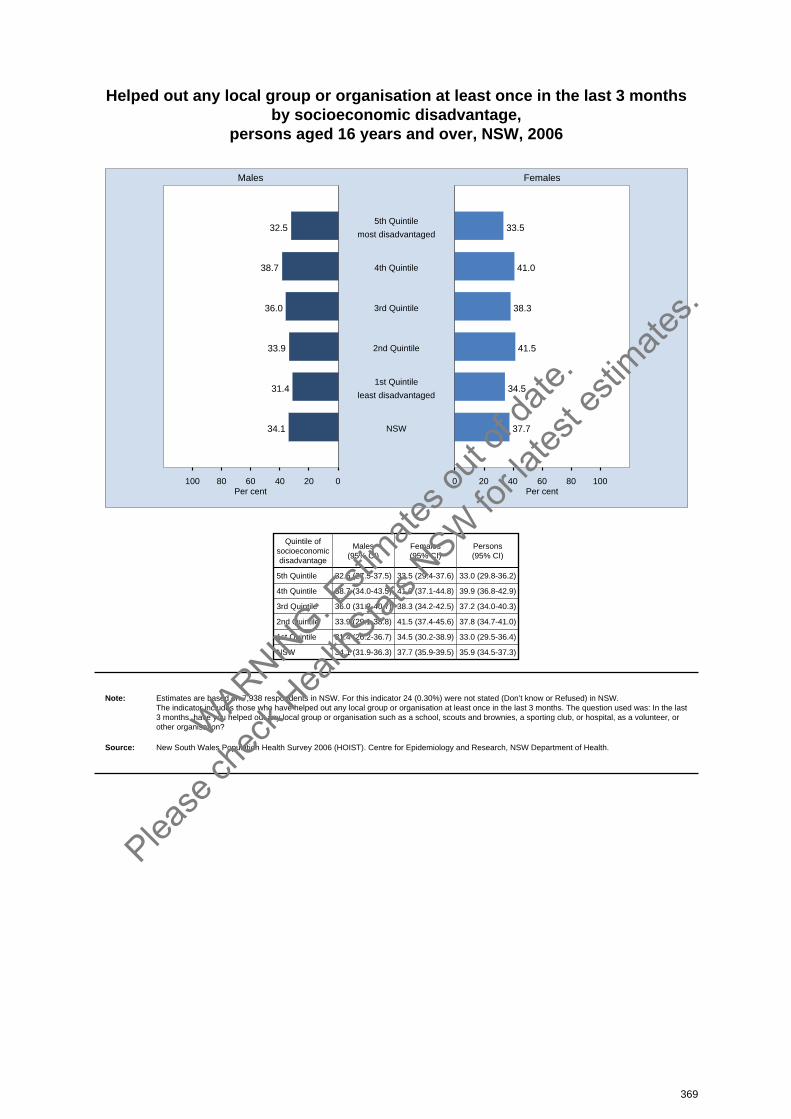
Helped out any local group or organisation at least once in the last 3 monthsby socioeconomic disadvantage,
persons aged 16 years and over, NSW, 2006
020406080100 0 20 40 60 80 100
Males Females
Per cent Per cent
32.5 33.55th Quintile
most disadvantaged
38.7 41.04th Quintile
36.0 38.33rd Quintile
33.9 41.52nd Quintile
31.4 34.51st Quintile
least disadvantaged
34.1 37.7NSW
Quintile ofsocioeconomicdisadvantage
Males(95% CI)
Females(95% CI)
Persons(95% CI)
5th Quintile 32.5 (27.5-37.5) 33.5 (29.4-37.6) 33.0 (29.8-36.2)
4th Quintile 38.7 (34.0-43.5) 41.0 (37.1-44.8) 39.9 (36.8-42.9)
3rd Quintile 36.0 (31.3-40.7) 38.3 (34.2-42.5) 37.2 (34.0-40.3)
2nd Quintile 33.9 (29.1-38.8) 41.5 (37.4-45.6) 37.8 (34.7-41.0)
1st Quintile 31.4 (26.2-36.7) 34.5 (30.2-38.9) 33.0 (29.5-36.4)
NSW 34.1 (31.9-36.3) 37.7 (35.9-39.5) 35.9 (34.5-37.3)
Note: Estimates are based on 7,938 respondents in NSW. For this indicator 24 (0.30%) were not stated (Don’t know or Refused) in NSW. The indicator includes those who have helped out any local group or organisation at least once in the last 3 months. The question used was: In the last3 months, have you helped out any local group or organisation such as a school, scouts and brownies, a sporting club, or hospital, as a volunteer, orother organisation?
Source: New South Wales Population Health Survey 2006 (HOIST). Centre for Epidemiology and Research, NSW Department of Health.
369
WARNIN
G: Esti
mates o
ut of
date.
Please
chec
k Hea
lthStat
s NSW
for la
test e
stimate
s.
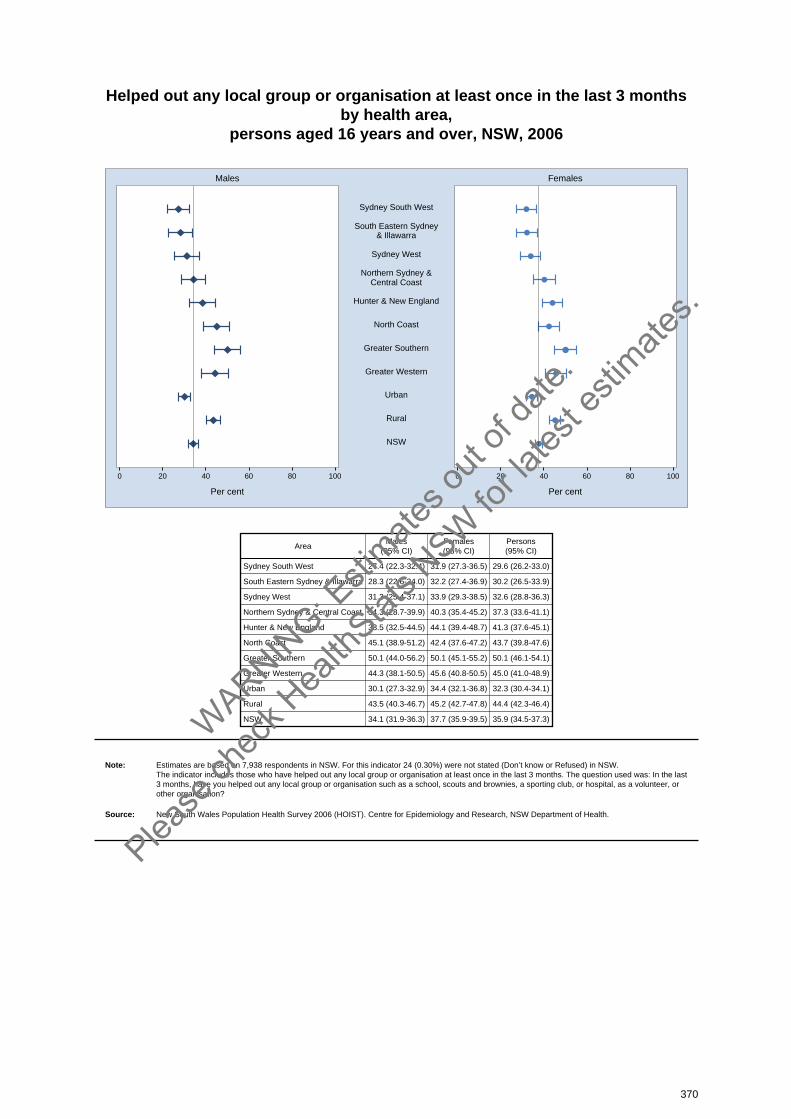
Helped out any local group or organisation at least once in the last 3 monthsby health area,
persons aged 16 years and over, NSW, 2006
0 20 40 60 80 100 0 20 40 60 80 100
Males Females
Per cent Per cent
Sydney South West
South Eastern Sydney& Illawarra
Sydney West
Northern Sydney &Central Coast
Hunter & New England
North Coast
Greater Southern
Greater Western
Urban
Rural
NSW
AreaMales
(95% CI)Females(95% CI)
Persons(95% CI)
Sydney South West 27.4 (22.3-32.4) 31.9 (27.3-36.5) 29.6 (26.2-33.0)
South Eastern Sydney & Illawarra 28.3 (22.6-34.0) 32.2 (27.4-36.9) 30.2 (26.5-33.9)
Sydney West 31.3 (25.4-37.1) 33.9 (29.3-38.5) 32.6 (28.8-36.3)
Northern Sydney & Central Coast 34.3 (28.7-39.9) 40.3 (35.4-45.2) 37.3 (33.6-41.1)
Hunter & New England 38.5 (32.5-44.5) 44.1 (39.4-48.7) 41.3 (37.6-45.1)
North Coast 45.1 (38.9-51.2) 42.4 (37.6-47.2) 43.7 (39.8-47.6)
Greater Southern 50.1 (44.0-56.2) 50.1 (45.1-55.2) 50.1 (46.1-54.1)
Greater Western 44.3 (38.1-50.5) 45.6 (40.8-50.5) 45.0 (41.0-48.9)
Urban 30.1 (27.3-32.9) 34.4 (32.1-36.8) 32.3 (30.4-34.1)
Rural 43.5 (40.3-46.7) 45.2 (42.7-47.8) 44.4 (42.3-46.4)
NSW 34.1 (31.9-36.3) 37.7 (35.9-39.5) 35.9 (34.5-37.3)
Note: Estimates are based on 7,938 respondents in NSW. For this indicator 24 (0.30%) were not stated (Don’t know or Refused) in NSW. The indicator includes those who have helped out any local group or organisation at least once in the last 3 months. The question used was: In the last3 months, have you helped out any local group or organisation such as a school, scouts and brownies, a sporting club, or hospital, as a volunteer, orother organisation?
Source: New South Wales Population Health Survey 2006 (HOIST). Centre for Epidemiology and Research, NSW Department of Health.
370
WARNIN
G: Esti
mates o
ut of
date.
Please
chec
k Hea
lthStat
s NSW
for la
test e
stimate
s.

Active member of a local organisation, church or club by age, persons aged 16 years and over, NSW, 2006
020406080100 0 20 40 60 80 100
Males Females
Per cent Per cent
51.7 54.575+
Age (years)
52.5 56.765-74
48.1 43.055-64
48.1 41.545-54
47.7 41.635-44
36.1 32.525-34
43.2 35.716-24
45.7 41.9All Ages
Age(years)
Males(95% CI)
Females(95% CI)
Persons(95% CI)
16-24 43.2 (36.6-49.8) 35.7 (29.7-41.7) 39.6 (35.1-44.1)
25-34 36.1 (29.5-42.7) 32.5 (27.6-37.5) 34.3 (30.2-38.4)
35-44 47.7 (41.8-53.5) 41.6 (37.0-46.2) 44.6 (40.9-48.4)
45-54 48.1 (43.1-53.1) 41.5 (37.4-45.7) 44.8 (41.5-48.1)
55-64 48.1 (43.4-52.9) 43.0 (39.2-46.8) 45.6 (42.5-48.7)
65-74 52.5 (47.6-57.5) 56.7 (52.5-60.8) 54.6 (51.4-57.9)
75+ 51.7 (46.1-57.4) 54.5 (50.0-59.0) 53.3 (49.8-56.9)
All Ages 45.7 (43.4-48.1) 41.9 (40.0-43.7) 43.8 (42.3-45.3)
Note: Estimates are based on 7,940 respondents in NSW. For this indicator 22 (0.28%) were not stated (Don’t know or Refused) in NSW. The indicator includes those who are an active member of a local organisation, church or club. The question used was: Are you an active member of alocal organisation, church or club, such as a sport, craft, or social club?
Source: New South Wales Population Health Survey 2006 (HOIST). Centre for Epidemiology and Research, NSW Department of Health.
371
WARNIN
G: Esti
mates o
ut of
date.
Please
chec
k Hea
lthStat
s NSW
for la
test e
stimate
s.
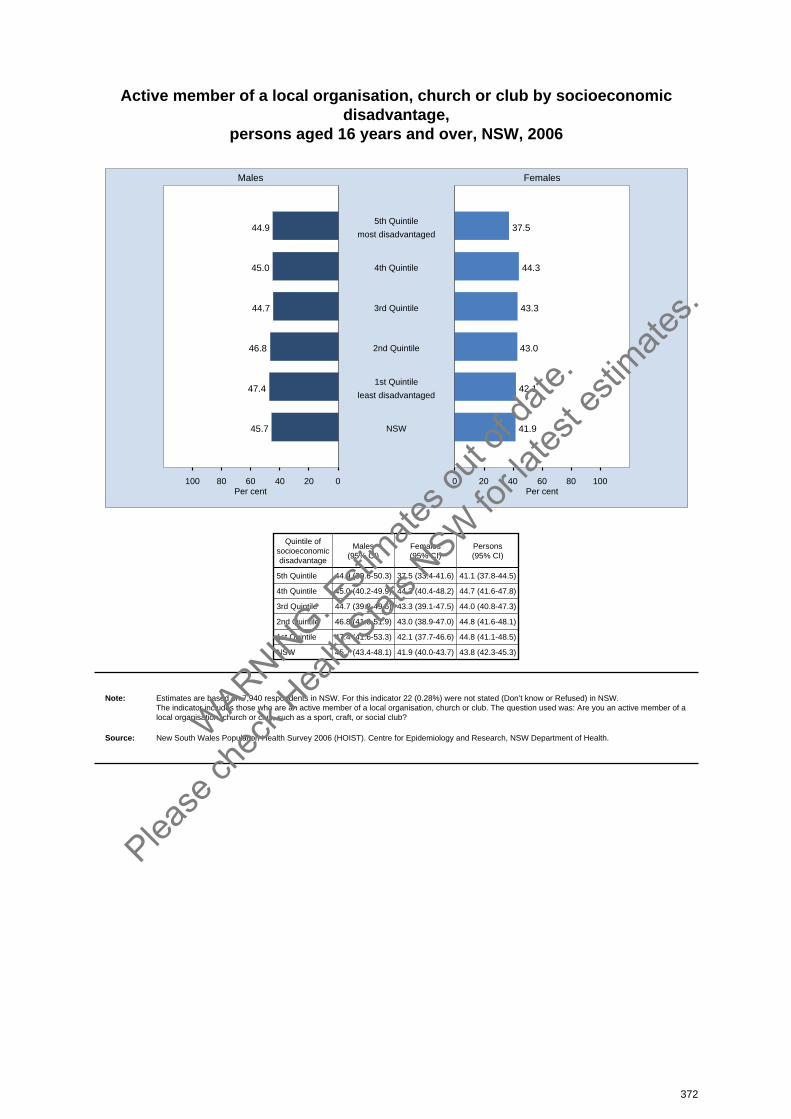
Active member of a local organisation, church or club by socioeconomicdisadvantage,
persons aged 16 years and over, NSW, 2006
020406080100 0 20 40 60 80 100
Males Females
Per cent Per cent
44.9 37.55th Quintile
most disadvantaged
45.0 44.34th Quintile
44.7 43.33rd Quintile
46.8 43.02nd Quintile
47.4 42.11st Quintile
least disadvantaged
45.7 41.9NSW
Quintile ofsocioeconomicdisadvantage
Males(95% CI)
Females(95% CI)
Persons(95% CI)
5th Quintile 44.9 (39.6-50.3) 37.5 (33.4-41.6) 41.1 (37.8-44.5)
4th Quintile 45.0 (40.2-49.9) 44.3 (40.4-48.2) 44.7 (41.6-47.8)
3rd Quintile 44.7 (39.8-49.6) 43.3 (39.1-47.5) 44.0 (40.8-47.3)
2nd Quintile 46.8 (41.8-51.9) 43.0 (38.9-47.0) 44.8 (41.6-48.1)
1st Quintile 47.4 (41.6-53.3) 42.1 (37.7-46.6) 44.8 (41.1-48.5)
NSW 45.7 (43.4-48.1) 41.9 (40.0-43.7) 43.8 (42.3-45.3)
Note: Estimates are based on 7,940 respondents in NSW. For this indicator 22 (0.28%) were not stated (Don’t know or Refused) in NSW. The indicator includes those who are an active member of a local organisation, church or club. The question used was: Are you an active member of alocal organisation, church or club, such as a sport, craft, or social club?
Source: New South Wales Population Health Survey 2006 (HOIST). Centre for Epidemiology and Research, NSW Department of Health.
372
WARNIN
G: Esti
mates o
ut of
date.
Please
chec
k Hea
lthStat
s NSW
for la
test e
stimate
s.
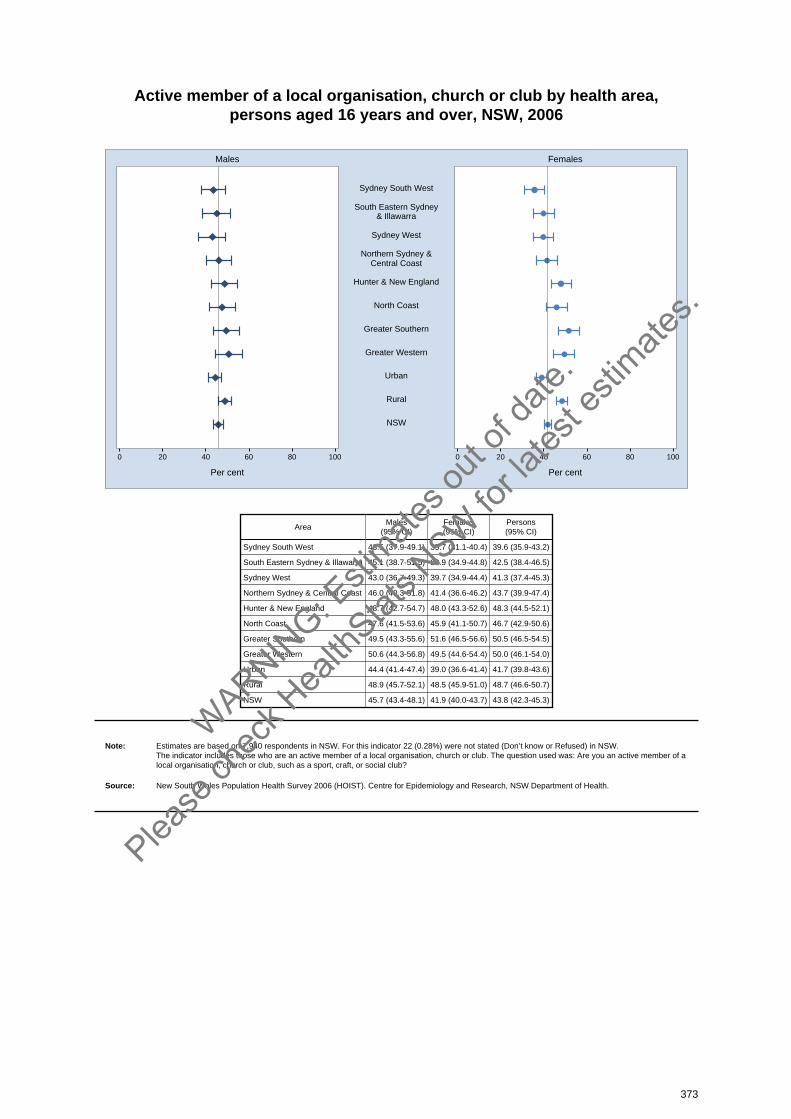
Active member of a local organisation, church or club by health area, persons aged 16 years and over, NSW, 2006
0 20 40 60 80 100 0 20 40 60 80 100
Males Females
Per cent Per cent
Sydney South West
South Eastern Sydney& Illawarra
Sydney West
Northern Sydney &Central Coast
Hunter & New England
North Coast
Greater Southern
Greater Western
Urban
Rural
NSW
AreaMales
(95% CI)Females(95% CI)
Persons(95% CI)
Sydney South West 43.5 (37.9-49.1) 35.7 (31.1-40.4) 39.6 (35.9-43.2)
South Eastern Sydney & Illawarra 45.1 (38.7-51.5) 39.9 (34.9-44.8) 42.5 (38.4-46.5)
Sydney West 43.0 (36.7-49.3) 39.7 (34.9-44.4) 41.3 (37.4-45.3)
Northern Sydney & Central Coast 46.0 (40.3-51.8) 41.4 (36.6-46.2) 43.7 (39.9-47.4)
Hunter & New England 48.7 (42.7-54.7) 48.0 (43.3-52.6) 48.3 (44.5-52.1)
North Coast 47.6 (41.5-53.6) 45.9 (41.1-50.7) 46.7 (42.9-50.6)
Greater Southern 49.5 (43.3-55.6) 51.6 (46.5-56.6) 50.5 (46.5-54.5)
Greater Western 50.6 (44.3-56.8) 49.5 (44.6-54.4) 50.0 (46.1-54.0)
Urban 44.4 (41.4-47.4) 39.0 (36.6-41.4) 41.7 (39.8-43.6)
Rural 48.9 (45.7-52.1) 48.5 (45.9-51.0) 48.7 (46.6-50.7)
NSW 45.7 (43.4-48.1) 41.9 (40.0-43.7) 43.8 (42.3-45.3)
Note: Estimates are based on 7,940 respondents in NSW. For this indicator 22 (0.28%) were not stated (Don’t know or Refused) in NSW. The indicator includes those who are an active member of a local organisation, church or club. The question used was: Are you an active member of alocal organisation, church or club, such as a sport, craft, or social club?
Source: New South Wales Population Health Survey 2006 (HOIST). Centre for Epidemiology and Research, NSW Department of Health.
373
WARNIN
G: Esti
mates o
ut of
date.
Please
chec
k Hea
lthStat
s NSW
for la
test e
stimate
s.
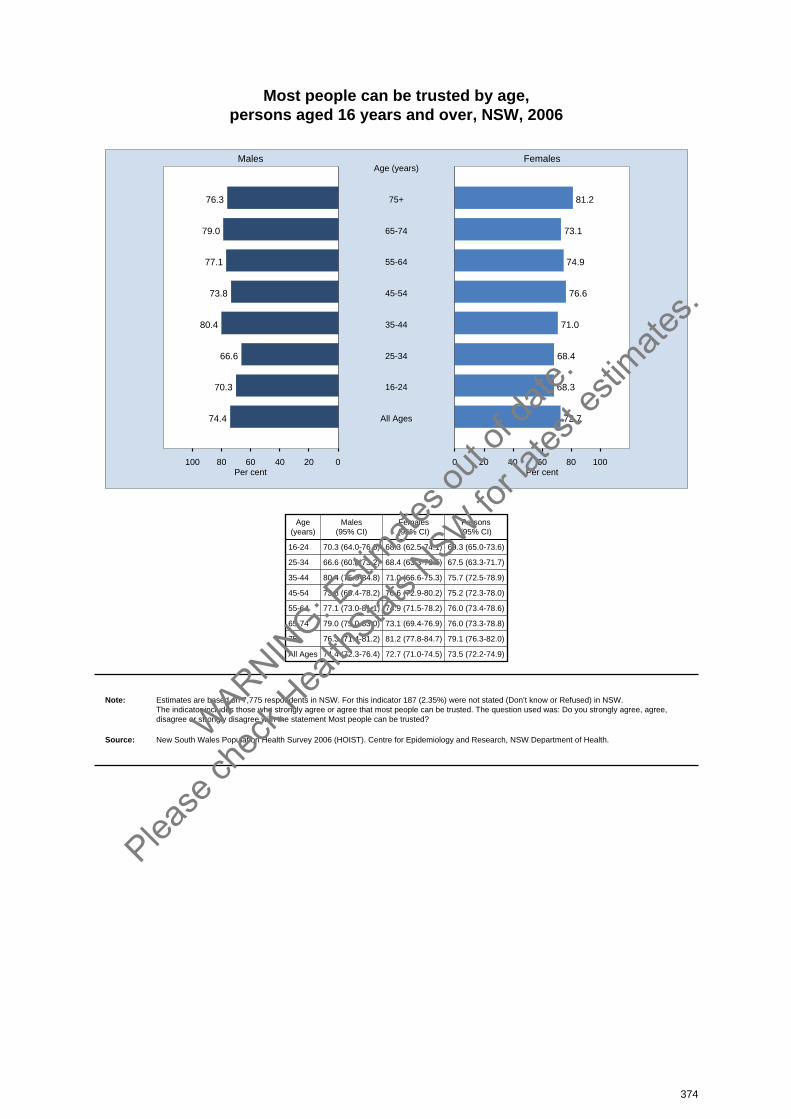
Most people can be trusted by age, persons aged 16 years and over, NSW, 2006
020406080100 0 20 40 60 80 100
Males Females
Per cent Per cent
76.3 81.275+
Age (years)
79.0 73.165-74
77.1 74.955-64
73.8 76.645-54
80.4 71.035-44
66.6 68.425-34
70.3 68.316-24
74.4 72.7All Ages
Age(years)
Males(95% CI)
Females(95% CI)
Persons(95% CI)
16-24 70.3 (64.0-76.6) 68.3 (62.5-74.1) 69.3 (65.0-73.6)
25-34 66.6 (60.0-73.2) 68.4 (63.3-73.5) 67.5 (63.3-71.7)
35-44 80.4 (75.9-84.8) 71.0 (66.6-75.3) 75.7 (72.5-78.9)
45-54 73.8 (69.4-78.2) 76.6 (72.9-80.2) 75.2 (72.3-78.0)
55-64 77.1 (73.0-81.1) 74.9 (71.5-78.2) 76.0 (73.4-78.6)
65-74 79.0 (75.0-83.0) 73.1 (69.4-76.9) 76.0 (73.3-78.8)
75+ 76.3 (71.4-81.2) 81.2 (77.8-84.7) 79.1 (76.3-82.0)
All Ages 74.4 (72.3-76.4) 72.7 (71.0-74.5) 73.5 (72.2-74.9)
Note: Estimates are based on 7,775 respondents in NSW. For this indicator 187 (2.35%) were not stated (Don’t know or Refused) in NSW. The indicator includes those who strongly agree or agree that most people can be trusted. The question used was: Do you strongly agree, agree,disagree or strongly disagree with the statement Most people can be trusted?
Source: New South Wales Population Health Survey 2006 (HOIST). Centre for Epidemiology and Research, NSW Department of Health.
374
WARNIN
G: Esti
mates o
ut of
date.
Please
chec
k Hea
lthStat
s NSW
for la
test e
stimate
s.
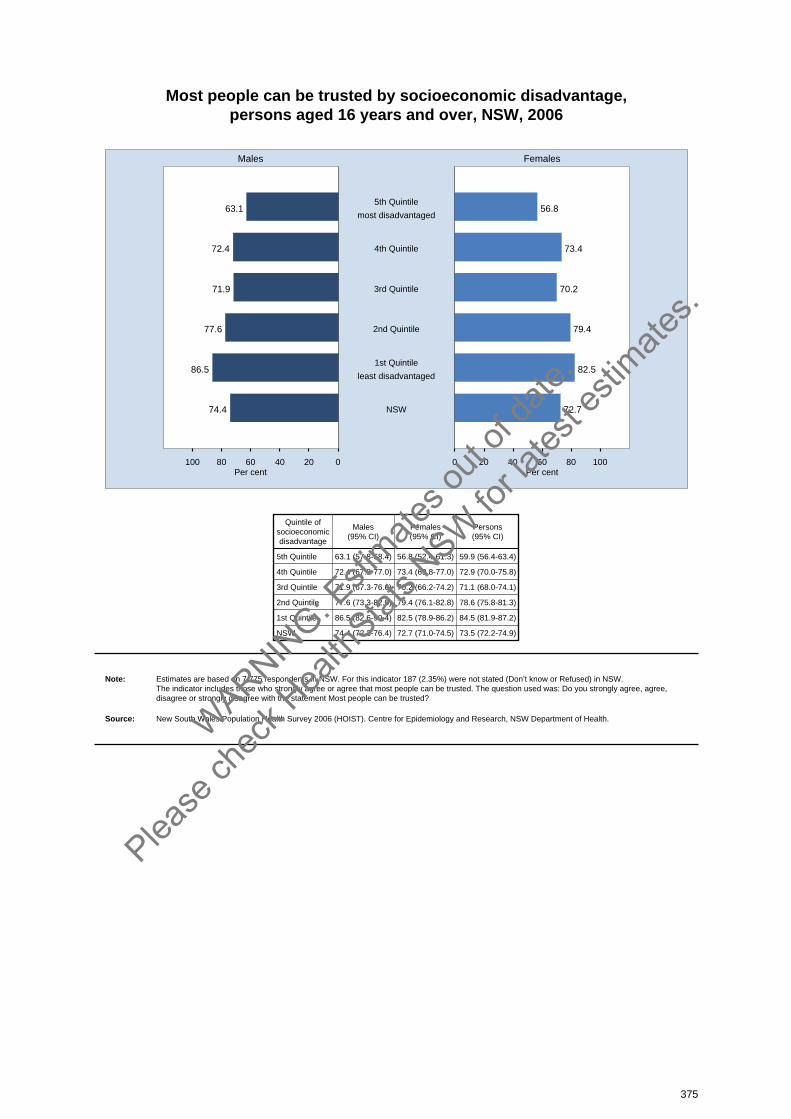
Most people can be trusted by socioeconomic disadvantage, persons aged 16 years and over, NSW, 2006
020406080100 0 20 40 60 80 100
Males Females
Per cent Per cent
63.1 56.85th Quintile
most disadvantaged
72.4 73.44th Quintile
71.9 70.23rd Quintile
77.6 79.42nd Quintile
86.5 82.51st Quintile
least disadvantaged
74.4 72.7NSW
Quintile ofsocioeconomicdisadvantage
Males(95% CI)
Females(95% CI)
Persons(95% CI)
5th Quintile 63.1 (57.8-68.4) 56.8 (52.4-61.3) 59.9 (56.4-63.4)
4th Quintile 72.4 (67.8-77.0) 73.4 (69.8-77.0) 72.9 (70.0-75.8)
3rd Quintile 71.9 (67.3-76.6) 70.2 (66.2-74.2) 71.1 (68.0-74.1)
2nd Quintile 77.6 (73.3-82.0) 79.4 (76.1-82.8) 78.6 (75.8-81.3)
1st Quintile 86.5 (82.6-90.4) 82.5 (78.9-86.2) 84.5 (81.9-87.2)
NSW 74.4 (72.3-76.4) 72.7 (71.0-74.5) 73.5 (72.2-74.9)
Note: Estimates are based on 7,775 respondents in NSW. For this indicator 187 (2.35%) were not stated (Don’t know or Refused) in NSW. The indicator includes those who strongly agree or agree that most people can be trusted. The question used was: Do you strongly agree, agree,disagree or strongly disagree with the statement Most people can be trusted?
Source: New South Wales Population Health Survey 2006 (HOIST). Centre for Epidemiology and Research, NSW Department of Health.
375
WARNIN
G: Esti
mates o
ut of
date.
Please
chec
k Hea
lthStat
s NSW
for la
test e
stimate
s.
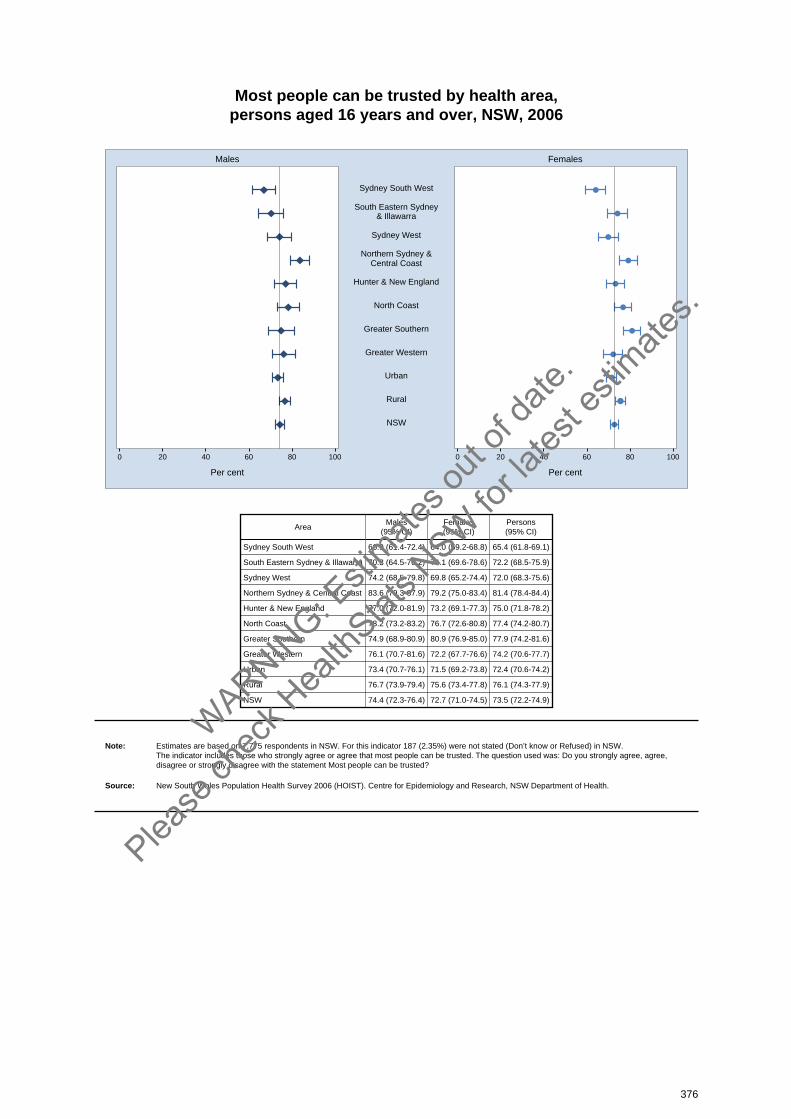
Most people can be trusted by health area, persons aged 16 years and over, NSW, 2006
0 20 40 60 80 100 0 20 40 60 80 100
Males Females
Per cent Per cent
Sydney South West
South Eastern Sydney& Illawarra
Sydney West
Northern Sydney &Central Coast
Hunter & New England
North Coast
Greater Southern
Greater Western
Urban
Rural
NSW
AreaMales
(95% CI)Females(95% CI)
Persons(95% CI)
Sydney South West 66.9 (61.4-72.4) 64.0 (59.2-68.8) 65.4 (61.8-69.1)
South Eastern Sydney & Illawarra 70.3 (64.5-76.2) 74.1 (69.6-78.6) 72.2 (68.5-75.9)
Sydney West 74.2 (68.5-79.8) 69.8 (65.2-74.4) 72.0 (68.3-75.6)
Northern Sydney & Central Coast 83.6 (79.3-87.9) 79.2 (75.0-83.4) 81.4 (78.4-84.4)
Hunter & New England 77.0 (72.0-81.9) 73.2 (69.1-77.3) 75.0 (71.8-78.2)
North Coast 78.2 (73.2-83.2) 76.7 (72.6-80.8) 77.4 (74.2-80.7)
Greater Southern 74.9 (68.9-80.9) 80.9 (76.9-85.0) 77.9 (74.2-81.6)
Greater Western 76.1 (70.7-81.6) 72.2 (67.7-76.6) 74.2 (70.6-77.7)
Urban 73.4 (70.7-76.1) 71.5 (69.2-73.8) 72.4 (70.6-74.2)
Rural 76.7 (73.9-79.4) 75.6 (73.4-77.8) 76.1 (74.3-77.9)
NSW 74.4 (72.3-76.4) 72.7 (71.0-74.5) 73.5 (72.2-74.9)
Note: Estimates are based on 7,775 respondents in NSW. For this indicator 187 (2.35%) were not stated (Don’t know or Refused) in NSW. The indicator includes those who strongly agree or agree that most people can be trusted. The question used was: Do you strongly agree, agree,disagree or strongly disagree with the statement Most people can be trusted?
Source: New South Wales Population Health Survey 2006 (HOIST). Centre for Epidemiology and Research, NSW Department of Health.
376
WARNIN
G: Esti
mates o
ut of
date.
Please
chec
k Hea
lthStat
s NSW
for la
test e
stimate
s.
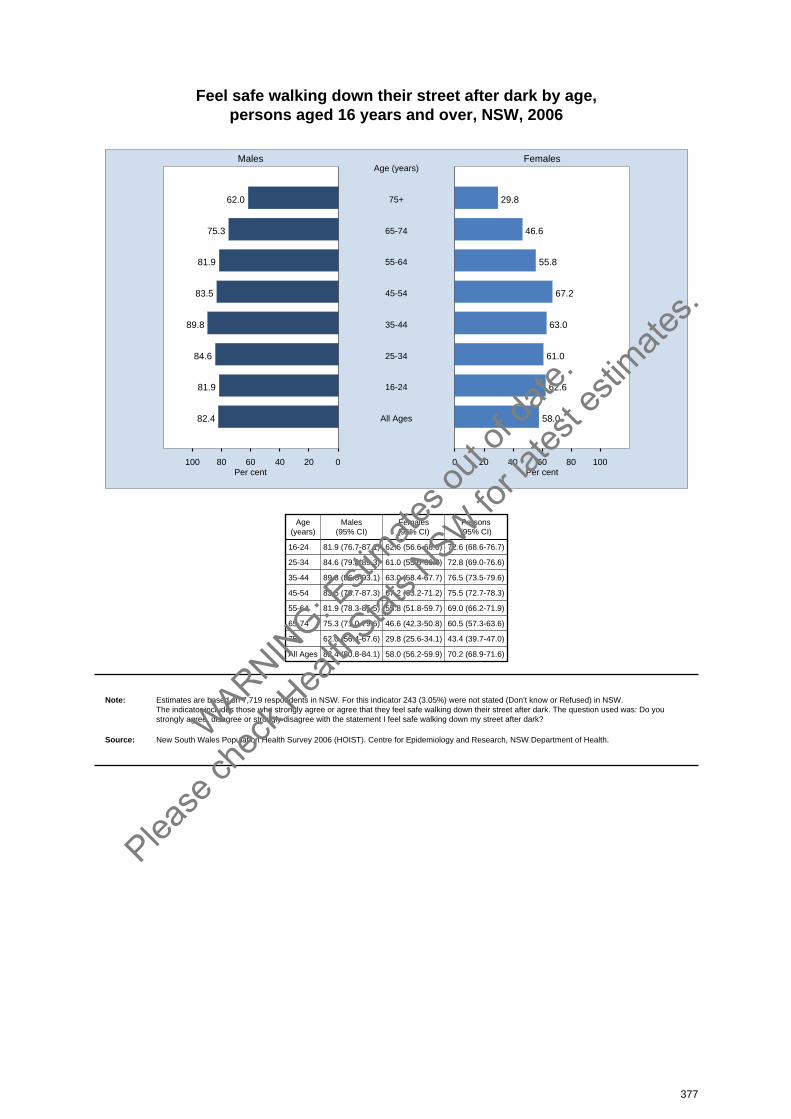
Feel safe walking down their street after dark by age, persons aged 16 years and over, NSW, 2006
020406080100 0 20 40 60 80 100
Males Females
Per cent Per cent
62.0 29.875+
Age (years)
75.3 46.665-74
81.9 55.855-64
83.5 67.245-54
89.8 63.035-44
84.6 61.025-34
81.9 62.616-24
82.4 58.0All Ages
Age(years)
Males(95% CI)
Females(95% CI)
Persons(95% CI)
16-24 81.9 (76.7-87.1) 62.6 (56.6-68.6) 72.6 (68.6-76.7)
25-34 84.6 (79.8-89.3) 61.0 (55.6-66.3) 72.8 (69.0-76.6)
35-44 89.8 (86.5-93.1) 63.0 (58.4-67.7) 76.5 (73.5-79.6)
45-54 83.5 (79.7-87.3) 67.2 (63.2-71.2) 75.5 (72.7-78.3)
55-64 81.9 (78.3-85.5) 55.8 (51.8-59.7) 69.0 (66.2-71.9)
65-74 75.3 (71.0-79.6) 46.6 (42.3-50.8) 60.5 (57.3-63.6)
75+ 62.0 (56.4-67.6) 29.8 (25.6-34.1) 43.4 (39.7-47.0)
All Ages 82.4 (80.8-84.1) 58.0 (56.2-59.9) 70.2 (68.9-71.6)
Note: Estimates are based on 7,719 respondents in NSW. For this indicator 243 (3.05%) were not stated (Don’t know or Refused) in NSW. The indicator includes those who strongly agree or agree that they feel safe walking down their street after dark. The question used was: Do youstrongly agree, disagree or strongly disagree with the statement I feel safe walking down my street after dark?
Source: New South Wales Population Health Survey 2006 (HOIST). Centre for Epidemiology and Research, NSW Department of Health.
377
WARNIN
G: Esti
mates o
ut of
date.
Please
chec
k Hea
lthStat
s NSW
for la
test e
stimate
s.
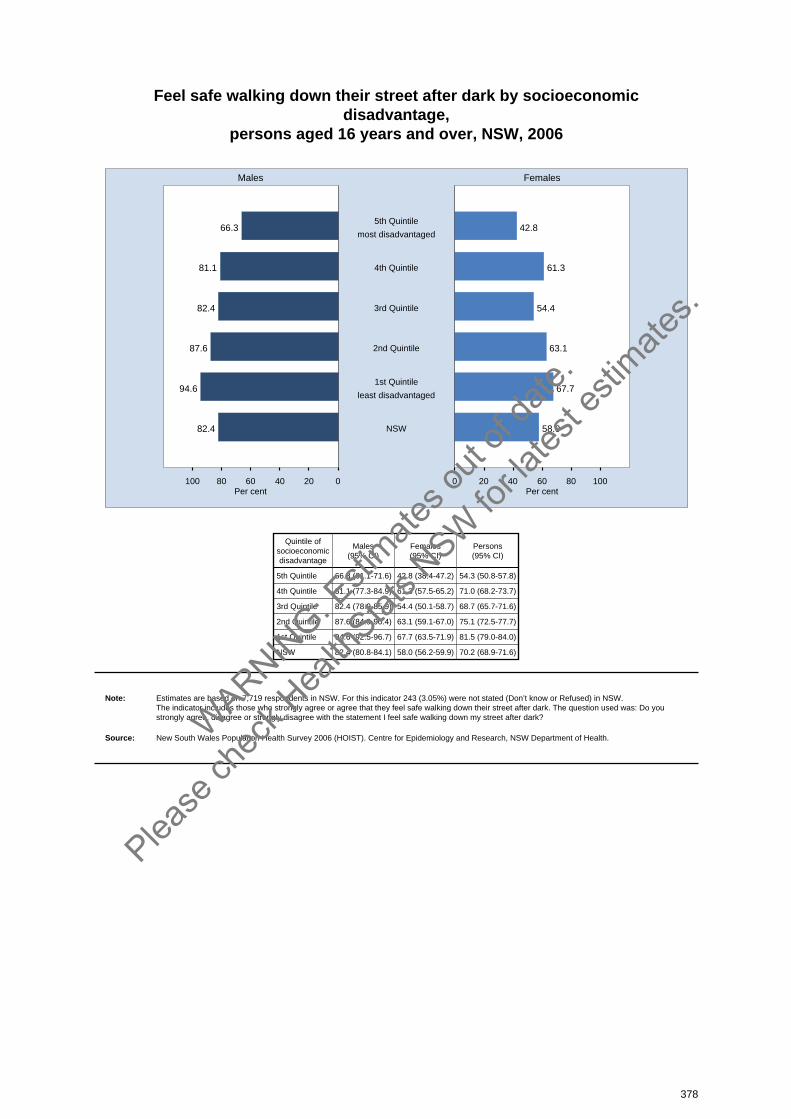
Feel safe walking down their street after dark by socioeconomicdisadvantage,
persons aged 16 years and over, NSW, 2006
020406080100 0 20 40 60 80 100
Males Females
Per cent Per cent
66.3 42.85th Quintile
most disadvantaged
81.1 61.34th Quintile
82.4 54.43rd Quintile
87.6 63.12nd Quintile
94.6 67.71st Quintile
least disadvantaged
82.4 58.0NSW
Quintile ofsocioeconomicdisadvantage
Males(95% CI)
Females(95% CI)
Persons(95% CI)
5th Quintile 66.3 (61.1-71.6) 42.8 (38.4-47.2) 54.3 (50.8-57.8)
4th Quintile 81.1 (77.3-84.9) 61.3 (57.5-65.2) 71.0 (68.2-73.7)
3rd Quintile 82.4 (78.9-85.9) 54.4 (50.1-58.7) 68.7 (65.7-71.6)
2nd Quintile 87.6 (84.9-90.4) 63.1 (59.1-67.0) 75.1 (72.5-77.7)
1st Quintile 94.6 (92.5-96.7) 67.7 (63.5-71.9) 81.5 (79.0-84.0)
NSW 82.4 (80.8-84.1) 58.0 (56.2-59.9) 70.2 (68.9-71.6)
Note: Estimates are based on 7,719 respondents in NSW. For this indicator 243 (3.05%) were not stated (Don’t know or Refused) in NSW. The indicator includes those who strongly agree or agree that they feel safe walking down their street after dark. The question used was: Do youstrongly agree, disagree or strongly disagree with the statement I feel safe walking down my street after dark?
Source: New South Wales Population Health Survey 2006 (HOIST). Centre for Epidemiology and Research, NSW Department of Health.
378
WARNIN
G: Esti
mates o
ut of
date.
Please
chec
k Hea
lthStat
s NSW
for la
test e
stimate
s.
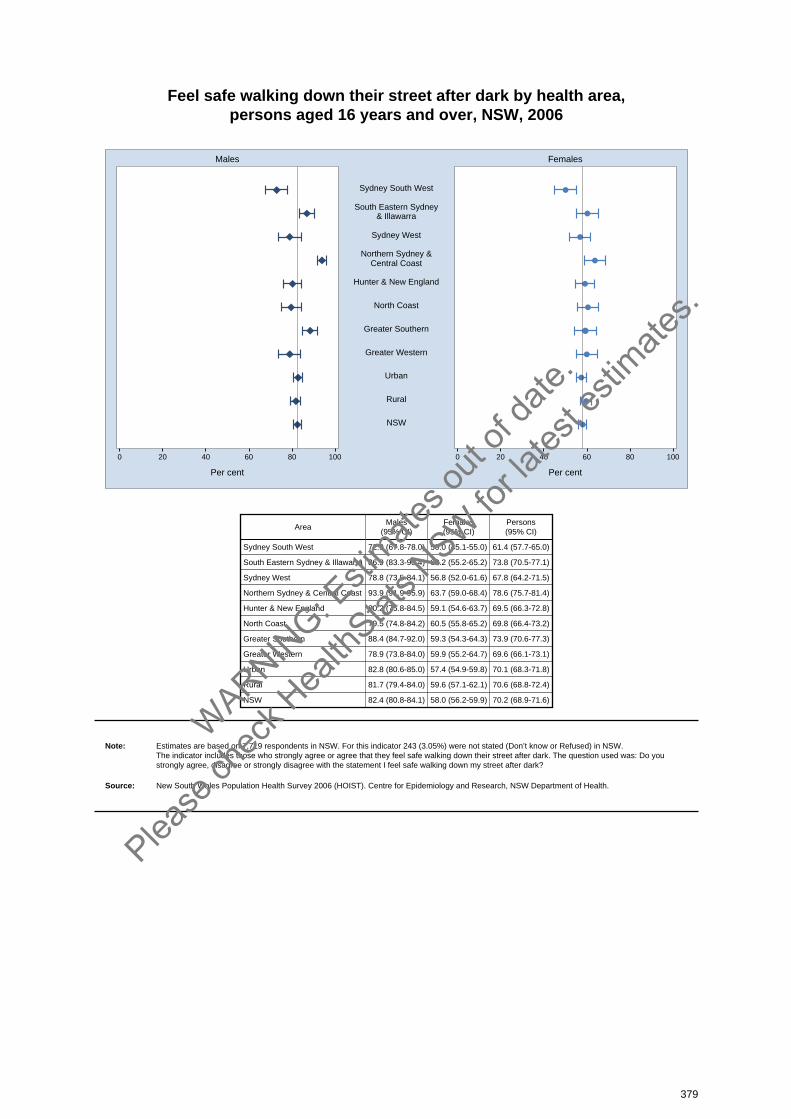
Feel safe walking down their street after dark by health area, persons aged 16 years and over, NSW, 2006
0 20 40 60 80 100 0 20 40 60 80 100
Males Females
Per cent Per cent
Sydney South West
South Eastern Sydney& Illawarra
Sydney West
Northern Sydney &Central Coast
Hunter & New England
North Coast
Greater Southern
Greater Western
Urban
Rural
NSW
AreaMales
(95% CI)Females(95% CI)
Persons(95% CI)
Sydney South West 72.9 (67.8-78.0) 50.0 (45.1-55.0) 61.4 (57.7-65.0)
South Eastern Sydney & Illawarra 86.9 (83.3-90.4) 60.2 (55.2-65.2) 73.8 (70.5-77.1)
Sydney West 78.8 (73.5-84.1) 56.8 (52.0-61.6) 67.8 (64.2-71.5)
Northern Sydney & Central Coast 93.9 (91.9-95.9) 63.7 (59.0-68.4) 78.6 (75.7-81.4)
Hunter & New England 80.2 (75.8-84.5) 59.1 (54.6-63.7) 69.5 (66.3-72.8)
North Coast 79.5 (74.8-84.2) 60.5 (55.8-65.2) 69.8 (66.4-73.2)
Greater Southern 88.4 (84.7-92.0) 59.3 (54.3-64.3) 73.9 (70.6-77.3)
Greater Western 78.9 (73.8-84.0) 59.9 (55.2-64.7) 69.6 (66.1-73.1)
Urban 82.8 (80.6-85.0) 57.4 (54.9-59.8) 70.1 (68.3-71.8)
Rural 81.7 (79.4-84.0) 59.6 (57.1-62.1) 70.6 (68.8-72.4)
NSW 82.4 (80.8-84.1) 58.0 (56.2-59.9) 70.2 (68.9-71.6)
Note: Estimates are based on 7,719 respondents in NSW. For this indicator 243 (3.05%) were not stated (Don’t know or Refused) in NSW. The indicator includes those who strongly agree or agree that they feel safe walking down their street after dark. The question used was: Do youstrongly agree, disagree or strongly disagree with the statement I feel safe walking down my street after dark?
Source: New South Wales Population Health Survey 2006 (HOIST). Centre for Epidemiology and Research, NSW Department of Health.
379
WARNIN
G: Esti
mates o
ut of
date.
Please
chec
k Hea
lthStat
s NSW
for la
test e
stimate
s.
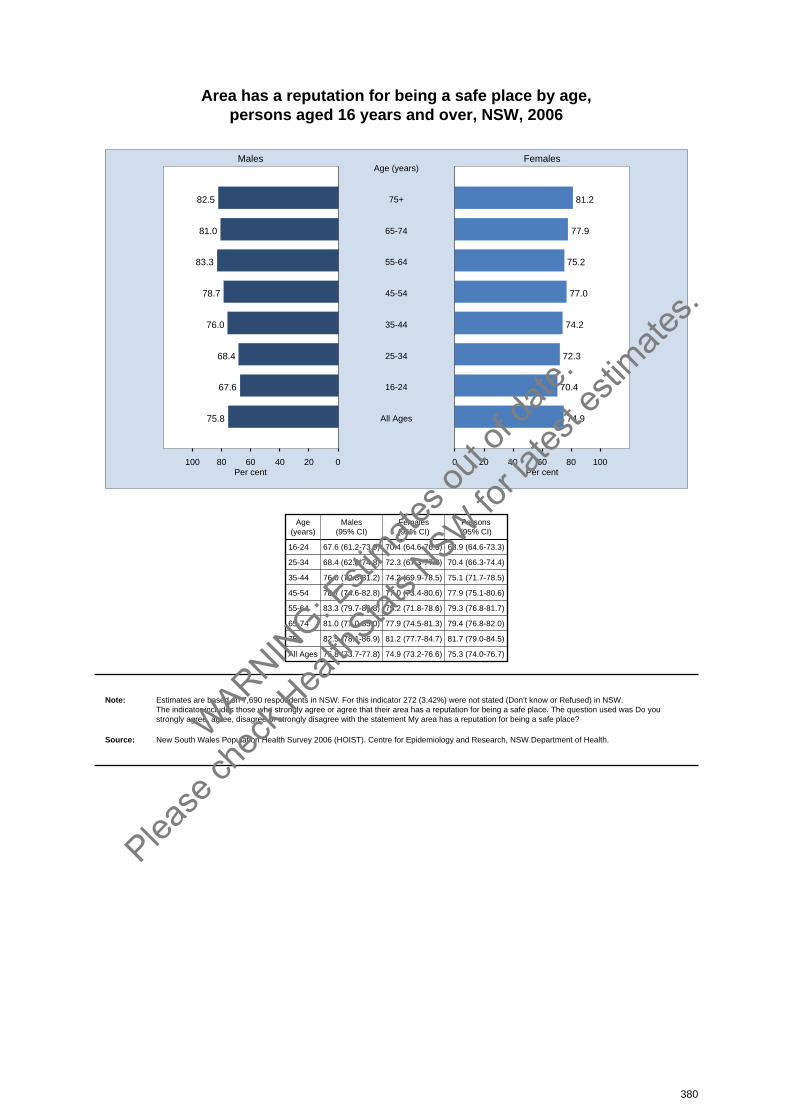
Area has a reputation for being a safe place by age, persons aged 16 years and over, NSW, 2006
020406080100 0 20 40 60 80 100
Males Females
Per cent Per cent
82.5 81.275+
Age (years)
81.0 77.965-74
83.3 75.255-64
78.7 77.045-54
76.0 74.235-44
68.4 72.325-34
67.6 70.416-24
75.8 74.9All Ages
Age(years)
Males(95% CI)
Females(95% CI)
Persons(95% CI)
16-24 67.6 (61.2-73.9) 70.4 (64.6-76.3) 68.9 (64.6-73.3)
25-34 68.4 (62.0-74.8) 72.3 (67.3-77.3) 70.4 (66.3-74.4)
35-44 76.0 (70.8-81.2) 74.2 (69.9-78.5) 75.1 (71.7-78.5)
45-54 78.7 (74.6-82.8) 77.0 (73.4-80.6) 77.9 (75.1-80.6)
55-64 83.3 (79.7-86.8) 75.2 (71.8-78.6) 79.3 (76.8-81.7)
65-74 81.0 (77.0-85.0) 77.9 (74.5-81.3) 79.4 (76.8-82.0)
75+ 82.5 (78.1-86.9) 81.2 (77.7-84.7) 81.7 (79.0-84.5)
All Ages 75.8 (73.7-77.8) 74.9 (73.2-76.6) 75.3 (74.0-76.7)
Note: Estimates are based on 7,690 respondents in NSW. For this indicator 272 (3.42%) were not stated (Don’t know or Refused) in NSW. The indicator includes those who strongly agree or agree that their area has a reputation for being a safe place. The question used was Do youstrongly agree, agree, disagree or strongly disagree with the statement My area has a reputation for being a safe place?
Source: New South Wales Population Health Survey 2006 (HOIST). Centre for Epidemiology and Research, NSW Department of Health.
380
WARNIN
G: Esti
mates o
ut of
date.
Please
chec
k Hea
lthStat
s NSW
for la
test e
stimate
s.
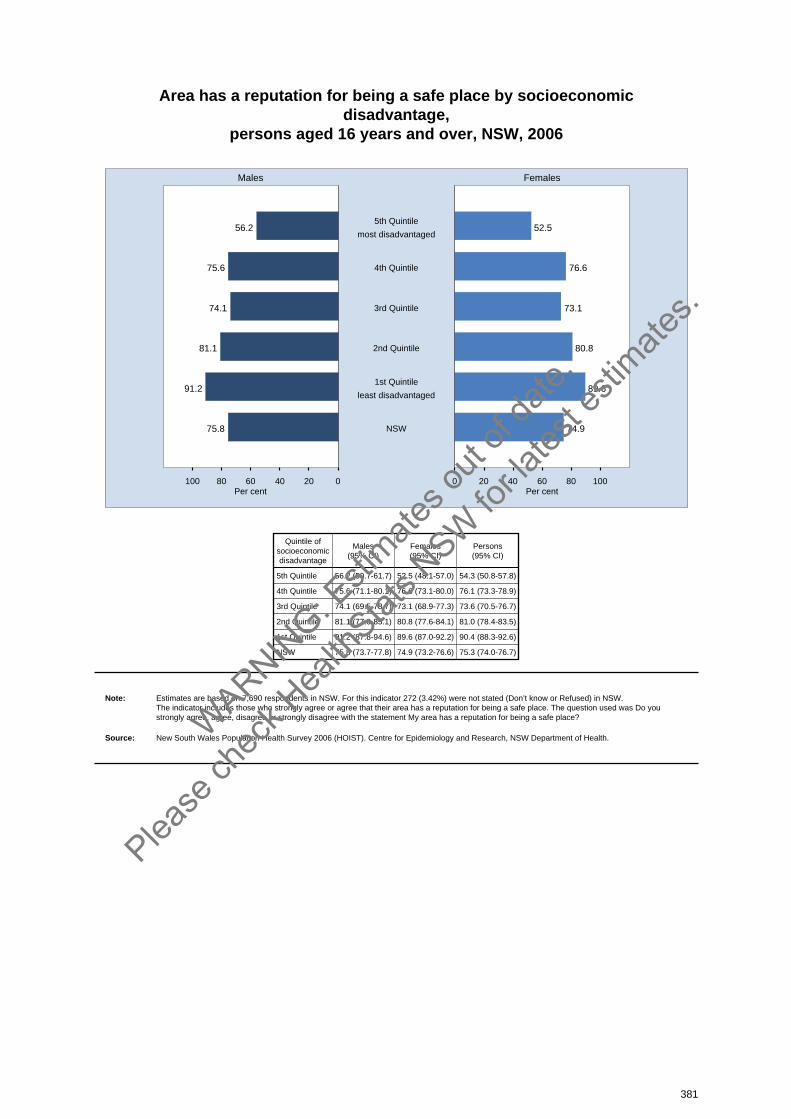
Area has a reputation for being a safe place by socioeconomicdisadvantage,
persons aged 16 years and over, NSW, 2006
020406080100 0 20 40 60 80 100
Males Females
Per cent Per cent
56.2 52.55th Quintile
most disadvantaged
75.6 76.64th Quintile
74.1 73.13rd Quintile
81.1 80.82nd Quintile
91.2 89.61st Quintile
least disadvantaged
75.8 74.9NSW
Quintile ofsocioeconomicdisadvantage
Males(95% CI)
Females(95% CI)
Persons(95% CI)
5th Quintile 56.2 (50.7-61.7) 52.5 (48.1-57.0) 54.3 (50.8-57.8)
4th Quintile 75.6 (71.1-80.1) 76.6 (73.1-80.0) 76.1 (73.3-78.9)
3rd Quintile 74.1 (69.5-78.7) 73.1 (68.9-77.3) 73.6 (70.5-76.7)
2nd Quintile 81.1 (77.0-85.1) 80.8 (77.6-84.1) 81.0 (78.4-83.5)
1st Quintile 91.2 (87.8-94.6) 89.6 (87.0-92.2) 90.4 (88.3-92.6)
NSW 75.8 (73.7-77.8) 74.9 (73.2-76.6) 75.3 (74.0-76.7)
Note: Estimates are based on 7,690 respondents in NSW. For this indicator 272 (3.42%) were not stated (Don’t know or Refused) in NSW. The indicator includes those who strongly agree or agree that their area has a reputation for being a safe place. The question used was Do youstrongly agree, agree, disagree or strongly disagree with the statement My area has a reputation for being a safe place?
Source: New South Wales Population Health Survey 2006 (HOIST). Centre for Epidemiology and Research, NSW Department of Health.
381
WARNIN
G: Esti
mates o
ut of
date.
Please
chec
k Hea
lthStat
s NSW
for la
test e
stimate
s.
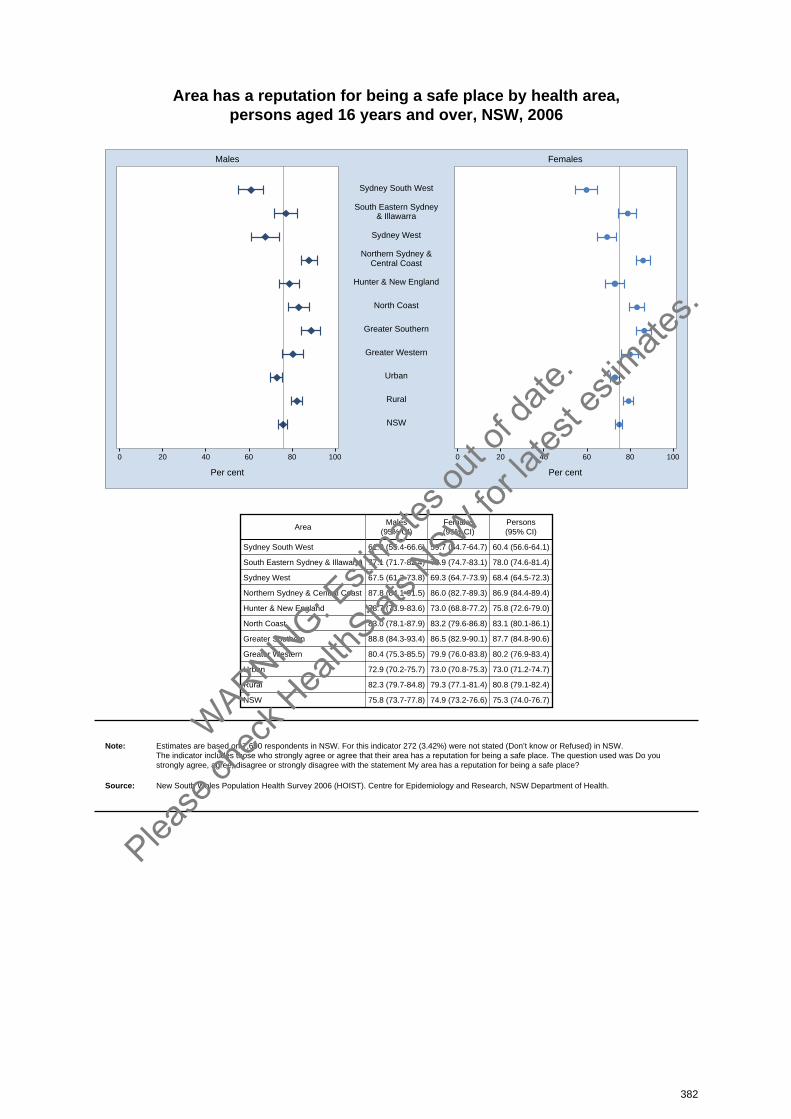
Area has a reputation for being a safe place by health area, persons aged 16 years and over, NSW, 2006
0 20 40 60 80 100 0 20 40 60 80 100
Males Females
Per cent Per cent
Sydney South West
South Eastern Sydney& Illawarra
Sydney West
Northern Sydney &Central Coast
Hunter & New England
North Coast
Greater Southern
Greater Western
Urban
Rural
NSW
AreaMales
(95% CI)Females(95% CI)
Persons(95% CI)
Sydney South West 61.0 (55.4-66.6) 59.7 (54.7-64.7) 60.4 (56.6-64.1)
South Eastern Sydney & Illawarra 77.1 (71.7-82.4) 78.9 (74.7-83.1) 78.0 (74.6-81.4)
Sydney West 67.5 (61.2-73.8) 69.3 (64.7-73.9) 68.4 (64.5-72.3)
Northern Sydney & Central Coast 87.8 (84.1-91.5) 86.0 (82.7-89.3) 86.9 (84.4-89.4)
Hunter & New England 78.7 (73.9-83.6) 73.0 (68.8-77.2) 75.8 (72.6-79.0)
North Coast 83.0 (78.1-87.9) 83.2 (79.6-86.8) 83.1 (80.1-86.1)
Greater Southern 88.8 (84.3-93.4) 86.5 (82.9-90.1) 87.7 (84.8-90.6)
Greater Western 80.4 (75.3-85.5) 79.9 (76.0-83.8) 80.2 (76.9-83.4)
Urban 72.9 (70.2-75.7) 73.0 (70.8-75.3) 73.0 (71.2-74.7)
Rural 82.3 (79.7-84.8) 79.3 (77.1-81.4) 80.8 (79.1-82.4)
NSW 75.8 (73.7-77.8) 74.9 (73.2-76.6) 75.3 (74.0-76.7)
Note: Estimates are based on 7,690 respondents in NSW. For this indicator 272 (3.42%) were not stated (Don’t know or Refused) in NSW. The indicator includes those who strongly agree or agree that their area has a reputation for being a safe place. The question used was Do youstrongly agree, agree, disagree or strongly disagree with the statement My area has a reputation for being a safe place?
Source: New South Wales Population Health Survey 2006 (HOIST). Centre for Epidemiology and Research, NSW Department of Health.
382
WARNIN
G: Esti
mates o
ut of
date.
Please
chec
k Hea
lthStat
s NSW
for la
test e
stimate
s.
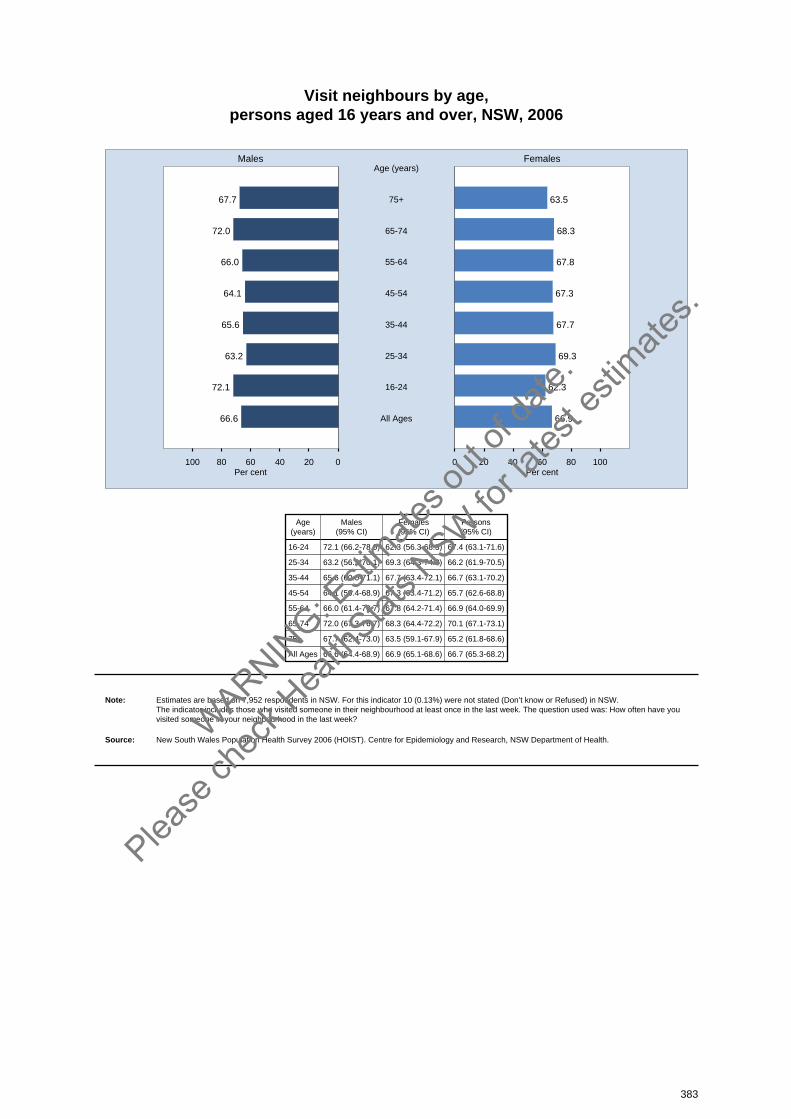
Visit neighbours by age, persons aged 16 years and over, NSW, 2006
020406080100 0 20 40 60 80 100
Males Females
Per cent Per cent
67.7 63.575+
Age (years)
72.0 68.365-74
66.0 67.855-64
64.1 67.345-54
65.6 67.735-44
63.2 69.325-34
72.1 62.316-24
66.6 66.9All Ages
Age(years)
Males(95% CI)
Females(95% CI)
Persons(95% CI)
16-24 72.1 (66.2-78.0) 62.3 (56.3-68.3) 67.4 (63.1-71.6)
25-34 63.2 (56.2-70.1) 69.3 (64.3-74.3) 66.2 (61.9-70.5)
35-44 65.6 (60.0-71.1) 67.7 (63.4-72.1) 66.7 (63.1-70.2)
45-54 64.1 (59.4-68.9) 67.3 (63.4-71.2) 65.7 (62.6-68.8)
55-64 66.0 (61.4-70.7) 67.8 (64.2-71.4) 66.9 (64.0-69.9)
65-74 72.0 (67.3-76.7) 68.3 (64.4-72.2) 70.1 (67.1-73.1)
75+ 67.7 (62.4-73.0) 63.5 (59.1-67.9) 65.2 (61.8-68.6)
All Ages 66.6 (64.4-68.9) 66.9 (65.1-68.6) 66.7 (65.3-68.2)
Note: Estimates are based on 7,952 respondents in NSW. For this indicator 10 (0.13%) were not stated (Don’t know or Refused) in NSW. The indicator includes those who visited someone in their neighbourhood at least once in the last week. The question used was: How often have youvisited someone in your neighbourhood in the last week?
Source: New South Wales Population Health Survey 2006 (HOIST). Centre for Epidemiology and Research, NSW Department of Health.
383
WARNIN
G: Esti
mates o
ut of
date.
Please
chec
k Hea
lthStat
s NSW
for la
test e
stimate
s.
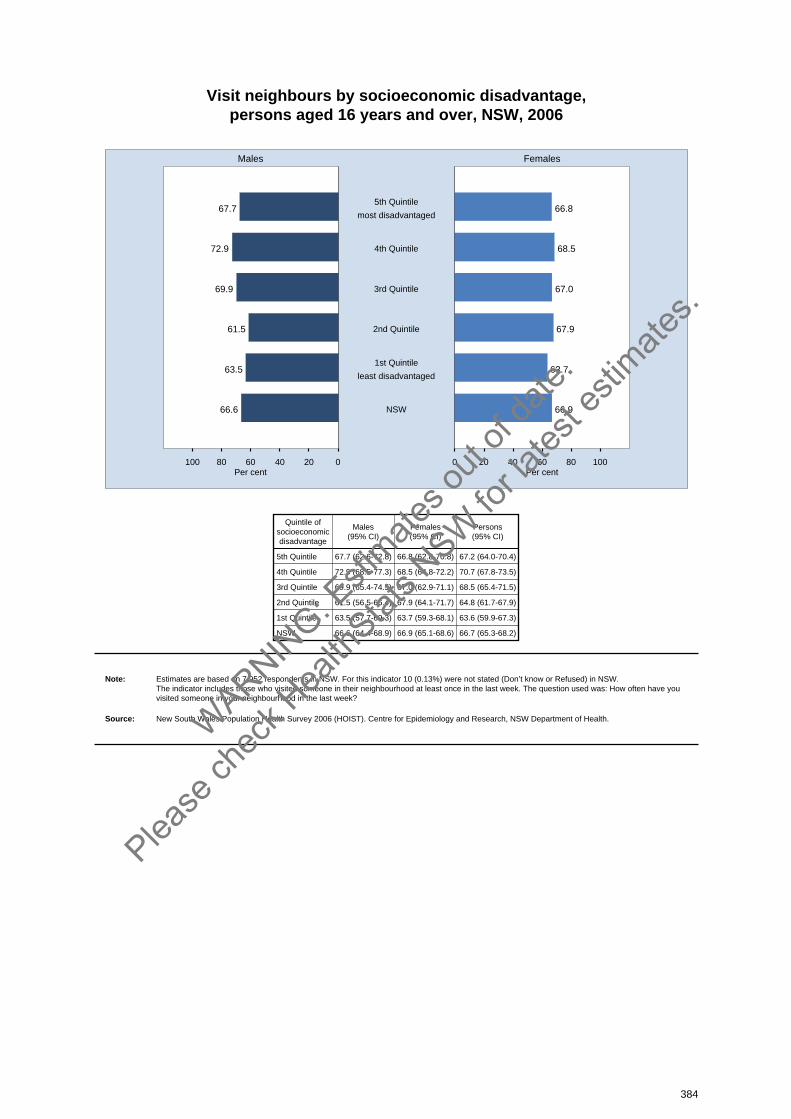
Visit neighbours by socioeconomic disadvantage, persons aged 16 years and over, NSW, 2006
020406080100 0 20 40 60 80 100
Males Females
Per cent Per cent
67.7 66.85th Quintile
most disadvantaged
72.9 68.54th Quintile
69.9 67.03rd Quintile
61.5 67.92nd Quintile
63.5 63.71st Quintile
least disadvantaged
66.6 66.9NSW
Quintile ofsocioeconomicdisadvantage
Males(95% CI)
Females(95% CI)
Persons(95% CI)
5th Quintile 67.7 (62.6-72.8) 66.8 (62.8-70.8) 67.2 (64.0-70.4)
4th Quintile 72.9 (68.5-77.3) 68.5 (64.8-72.2) 70.7 (67.8-73.5)
3rd Quintile 69.9 (65.4-74.5) 67.0 (62.9-71.1) 68.5 (65.4-71.5)
2nd Quintile 61.5 (56.5-66.4) 67.9 (64.1-71.7) 64.8 (61.7-67.9)
1st Quintile 63.5 (57.7-69.3) 63.7 (59.3-68.1) 63.6 (59.9-67.3)
NSW 66.6 (64.4-68.9) 66.9 (65.1-68.6) 66.7 (65.3-68.2)
Note: Estimates are based on 7,952 respondents in NSW. For this indicator 10 (0.13%) were not stated (Don’t know or Refused) in NSW. The indicator includes those who visited someone in their neighbourhood at least once in the last week. The question used was: How often have youvisited someone in your neighbourhood in the last week?
Source: New South Wales Population Health Survey 2006 (HOIST). Centre for Epidemiology and Research, NSW Department of Health.
384
WARNIN
G: Esti
mates o
ut of
date.
Please
chec
k Hea
lthStat
s NSW
for la
test e
stimate
s.

Visit neighbours by health area, persons aged 16 years and over, NSW, 2006
0 20 40 60 80 100 0 20 40 60 80 100
Males Females
Per cent Per cent
Sydney South West
South Eastern Sydney& Illawarra
Sydney West
Northern Sydney &Central Coast
Hunter & New England
North Coast
Greater Southern
Greater Western
Urban
Rural
NSW
AreaMales
(95% CI)Females(95% CI)
Persons(95% CI)
Sydney South West 60.4 (54.8-65.9) 62.8 (58.2-67.4) 61.6 (58.0-65.2)
South Eastern Sydney & Illawarra 63.9 (57.6-70.2) 65.6 (60.7-70.5) 64.7 (60.7-68.7)
Sydney West 61.6 (55.3-67.8) 68.7 (64.3-73.0) 65.1 (61.2-69.0)
Northern Sydney & Central Coast 66.9 (61.5-72.4) 65.5 (60.7-70.2) 66.2 (62.6-69.8)
Hunter & New England 76.2 (71.4-81.1) 71.1 (67.0-75.3) 73.6 (70.4-76.8)
North Coast 75.1 (69.5-80.7) 67.3 (62.8-71.9) 71.1 (67.5-74.7)
Greater Southern 72.0 (66.8-77.2) 69.5 (65.0-74.0) 70.8 (67.3-74.2)
Greater Western 75.2 (69.9-80.5) 73.0 (68.8-77.3) 74.1 (70.7-77.6)
Urban 63.1 (60.1-66.0) 65.5 (63.1-67.8) 64.3 (62.4-66.2)
Rural 74.9 (72.1-77.6) 70.1 (67.8-72.4) 72.5 (70.7-74.3)
NSW 66.6 (64.4-68.9) 66.9 (65.1-68.6) 66.7 (65.3-68.2)
Note: Estimates are based on 7,952 respondents in NSW. For this indicator 10 (0.13%) were not stated (Don’t know or Refused) in NSW. The indicator includes those who visited someone in their neighbourhood at least once in the last week. The question used was: How often have youvisited someone in your neighbourhood in the last week?
Source: New South Wales Population Health Survey 2006 (HOIST). Centre for Epidemiology and Research, NSW Department of Health.
385
WARNIN
G: Esti
mates o
ut of
date.
Please
chec
k Hea
lthStat
s NSW
for la
test e
stimate
s.
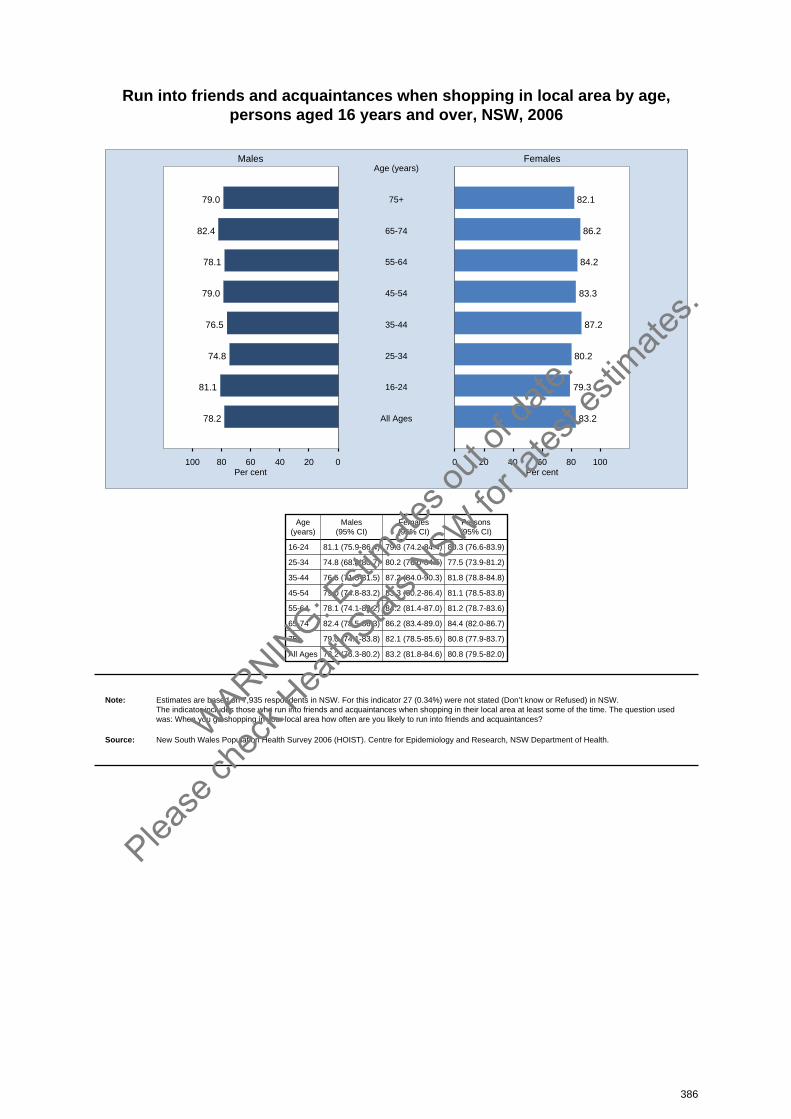
Run into friends and acquaintances when shopping in local area by age, persons aged 16 years and over, NSW, 2006
020406080100 0 20 40 60 80 100
Males Females
Per cent Per cent
79.0 82.175+
Age (years)
82.4 86.265-74
78.1 84.255-64
79.0 83.345-54
76.5 87.235-44
74.8 80.225-34
81.1 79.316-24
78.2 83.2All Ages
Age(years)
Males(95% CI)
Females(95% CI)
Persons(95% CI)
16-24 81.1 (75.9-86.4) 79.3 (74.2-84.4) 80.3 (76.6-83.9)
25-34 74.8 (68.8-80.7) 80.2 (76.0-84.5) 77.5 (73.9-81.2)
35-44 76.5 (71.5-81.5) 87.2 (84.0-90.3) 81.8 (78.8-84.8)
45-54 79.0 (74.8-83.2) 83.3 (80.2-86.4) 81.1 (78.5-83.8)
55-64 78.1 (74.1-82.2) 84.2 (81.4-87.0) 81.2 (78.7-83.6)
65-74 82.4 (78.5-86.3) 86.2 (83.4-89.0) 84.4 (82.0-86.7)
75+ 79.0 (74.1-83.8) 82.1 (78.5-85.6) 80.8 (77.9-83.7)
All Ages 78.2 (76.3-80.2) 83.2 (81.8-84.6) 80.8 (79.5-82.0)
Note: Estimates are based on 7,935 respondents in NSW. For this indicator 27 (0.34%) were not stated (Don’t know or Refused) in NSW. The indicator includes those who run into friends and acquaintances when shopping in their local area at least some of the time. The question usedwas: When you go shopping in your local area how often are you likely to run into friends and acquaintances?
Source: New South Wales Population Health Survey 2006 (HOIST). Centre for Epidemiology and Research, NSW Department of Health.
386
WARNIN
G: Esti
mates o
ut of
date.
Please
chec
k Hea
lthStat
s NSW
for la
test e
stimate
s.
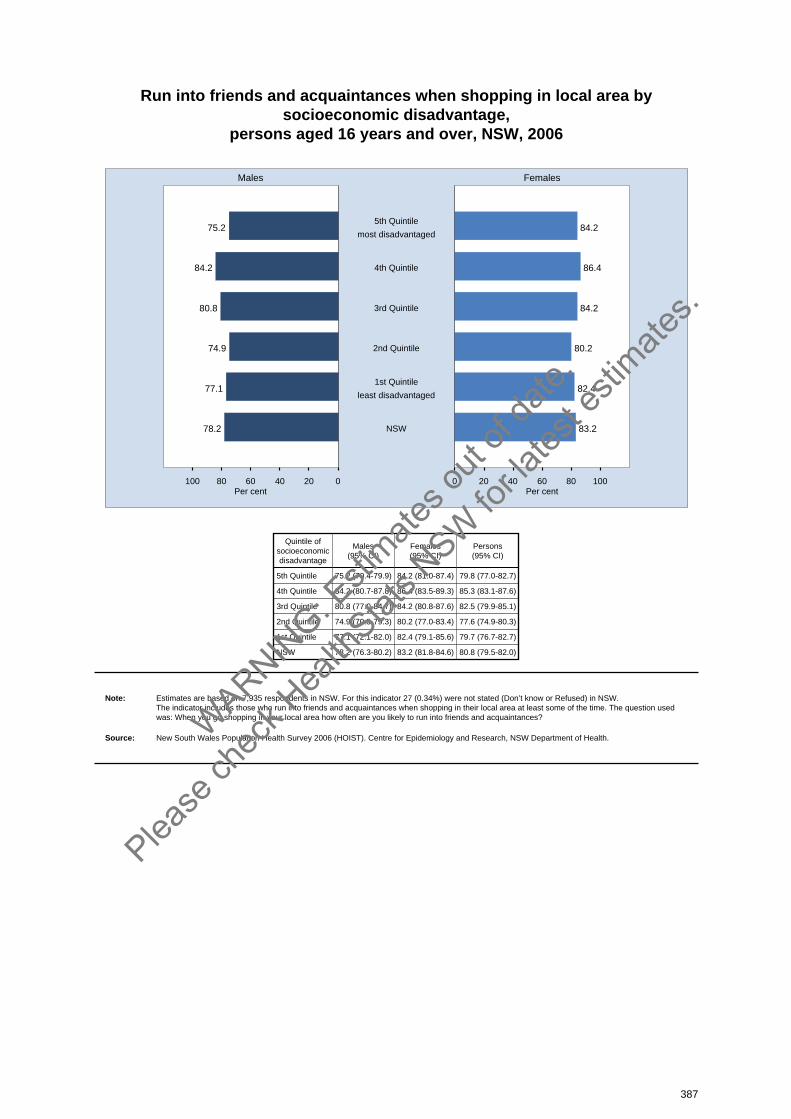
Run into friends and acquaintances when shopping in local area bysocioeconomic disadvantage,
persons aged 16 years and over, NSW, 2006
020406080100 0 20 40 60 80 100
Males Females
Per cent Per cent
75.2 84.25th Quintile
most disadvantaged
84.2 86.44th Quintile
80.8 84.23rd Quintile
74.9 80.22nd Quintile
77.1 82.41st Quintile
least disadvantaged
78.2 83.2NSW
Quintile ofsocioeconomicdisadvantage
Males(95% CI)
Females(95% CI)
Persons(95% CI)
5th Quintile 75.2 (70.4-79.9) 84.2 (81.0-87.4) 79.8 (77.0-82.7)
4th Quintile 84.2 (80.7-87.8) 86.4 (83.5-89.3) 85.3 (83.1-87.6)
3rd Quintile 80.8 (77.0-84.7) 84.2 (80.8-87.6) 82.5 (79.9-85.1)
2nd Quintile 74.9 (70.5-79.3) 80.2 (77.0-83.4) 77.6 (74.9-80.3)
1st Quintile 77.1 (72.1-82.0) 82.4 (79.1-85.6) 79.7 (76.7-82.7)
NSW 78.2 (76.3-80.2) 83.2 (81.8-84.6) 80.8 (79.5-82.0)
Note: Estimates are based on 7,935 respondents in NSW. For this indicator 27 (0.34%) were not stated (Don’t know or Refused) in NSW. The indicator includes those who run into friends and acquaintances when shopping in their local area at least some of the time. The question usedwas: When you go shopping in your local area how often are you likely to run into friends and acquaintances?
Source: New South Wales Population Health Survey 2006 (HOIST). Centre for Epidemiology and Research, NSW Department of Health.
387
WARNIN
G: Esti
mates o
ut of
date.
Please
chec
k Hea
lthStat
s NSW
for la
test e
stimate
s.
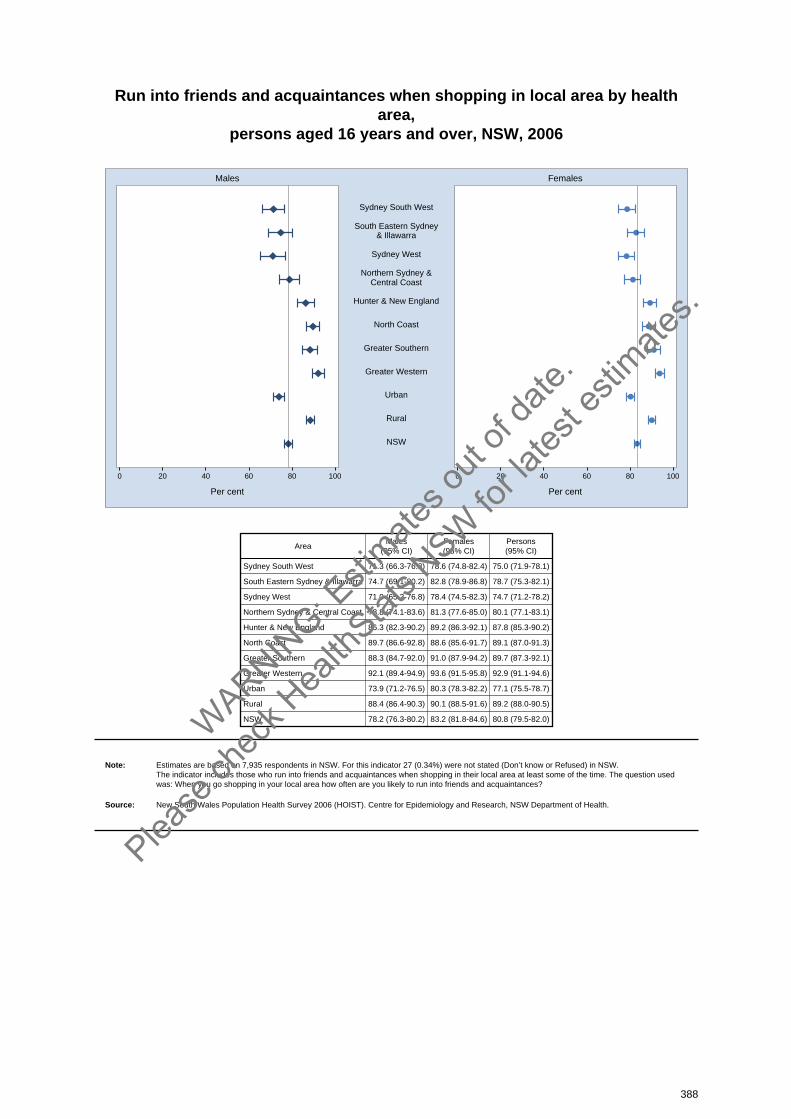
Run into friends and acquaintances when shopping in local area by healtharea,
persons aged 16 years and over, NSW, 2006
0 20 40 60 80 100 0 20 40 60 80 100
Males Females
Per cent Per cent
Sydney South West
South Eastern Sydney& Illawarra
Sydney West
Northern Sydney &Central Coast
Hunter & New England
North Coast
Greater Southern
Greater Western
Urban
Rural
NSW
AreaMales
(95% CI)Females(95% CI)
Persons(95% CI)
Sydney South West 71.3 (66.3-76.3) 78.6 (74.8-82.4) 75.0 (71.9-78.1)
South Eastern Sydney & Illawarra 74.7 (69.1-80.2) 82.8 (78.9-86.8) 78.7 (75.3-82.1)
Sydney West 71.0 (65.2-76.8) 78.4 (74.5-82.3) 74.7 (71.2-78.2)
Northern Sydney & Central Coast 78.8 (74.1-83.6) 81.3 (77.6-85.0) 80.1 (77.1-83.1)
Hunter & New England 86.3 (82.3-90.2) 89.2 (86.3-92.1) 87.8 (85.3-90.2)
North Coast 89.7 (86.6-92.8) 88.6 (85.6-91.7) 89.1 (87.0-91.3)
Greater Southern 88.3 (84.7-92.0) 91.0 (87.9-94.2) 89.7 (87.3-92.1)
Greater Western 92.1 (89.4-94.9) 93.6 (91.5-95.8) 92.9 (91.1-94.6)
Urban 73.9 (71.2-76.5) 80.3 (78.3-82.2) 77.1 (75.5-78.7)
Rural 88.4 (86.4-90.3) 90.1 (88.5-91.6) 89.2 (88.0-90.5)
NSW 78.2 (76.3-80.2) 83.2 (81.8-84.6) 80.8 (79.5-82.0)
Note: Estimates are based on 7,935 respondents in NSW. For this indicator 27 (0.34%) were not stated (Don’t know or Refused) in NSW. The indicator includes those who run into friends and acquaintances when shopping in their local area at least some of the time. The question usedwas: When you go shopping in your local area how often are you likely to run into friends and acquaintances?
Source: New South Wales Population Health Survey 2006 (HOIST). Centre for Epidemiology and Research, NSW Department of Health.
388
WARNIN
G: Esti
mates o
ut of
date.
Please
chec
k Hea
lthStat
s NSW
for la
test e
stimate
s.
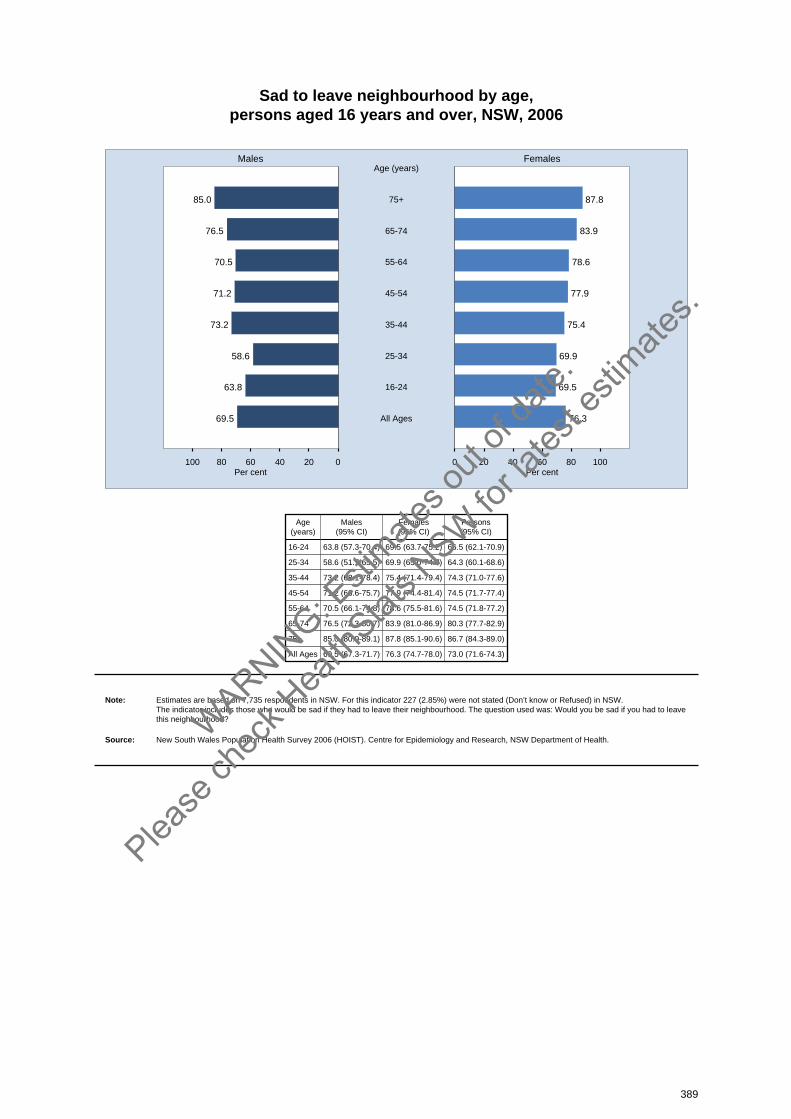
Sad to leave neighbourhood by age, persons aged 16 years and over, NSW, 2006
020406080100 0 20 40 60 80 100
Males Females
Per cent Per cent
85.0 87.875+
Age (years)
76.5 83.965-74
70.5 78.655-64
71.2 77.945-54
73.2 75.435-44
58.6 69.925-34
63.8 69.516-24
69.5 76.3All Ages
Age(years)
Males(95% CI)
Females(95% CI)
Persons(95% CI)
16-24 63.8 (57.3-70.4) 69.5 (63.7-75.2) 66.5 (62.1-70.9)
25-34 58.6 (51.7-65.5) 69.9 (65.0-74.7) 64.3 (60.1-68.6)
35-44 73.2 (68.1-78.4) 75.4 (71.4-79.4) 74.3 (71.0-77.6)
45-54 71.2 (66.6-75.7) 77.9 (74.4-81.4) 74.5 (71.7-77.4)
55-64 70.5 (66.1-74.8) 78.6 (75.5-81.6) 74.5 (71.8-77.2)
65-74 76.5 (72.3-80.7) 83.9 (81.0-86.9) 80.3 (77.7-82.9)
75+ 85.0 (80.9-89.1) 87.8 (85.1-90.6) 86.7 (84.3-89.0)
All Ages 69.5 (67.3-71.7) 76.3 (74.7-78.0) 73.0 (71.6-74.3)
Note: Estimates are based on 7,735 respondents in NSW. For this indicator 227 (2.85%) were not stated (Don’t know or Refused) in NSW. The indicator includes those who would be sad if they had to leave their neighbourhood. The question used was: Would you be sad if you had to leavethis neighbourhood?
Source: New South Wales Population Health Survey 2006 (HOIST). Centre for Epidemiology and Research, NSW Department of Health.
389
WARNIN
G: Esti
mates o
ut of
date.
Please
chec
k Hea
lthStat
s NSW
for la
test e
stimate
s.

Sad to leave neighbourhood by socioeconomic disadvantage, persons aged 16 years and over, NSW, 2006
020406080100 0 20 40 60 80 100
Males Females
Per cent Per cent
62.0 72.35th Quintile
most disadvantaged
72.2 76.04th Quintile
69.3 74.93rd Quintile
71.1 79.22nd Quintile
75.2 79.81st Quintile
least disadvantaged
69.5 76.3NSW
Quintile ofsocioeconomicdisadvantage
Males(95% CI)
Females(95% CI)
Persons(95% CI)
5th Quintile 62.0 (56.6-67.4) 72.3 (68.3-76.3) 67.3 (63.9-70.6)
4th Quintile 72.2 (67.5-76.9) 76.0 (72.5-79.6) 74.2 (71.3-77.1)
3rd Quintile 69.3 (64.6-74.0) 74.9 (71.1-78.7) 72.1 (69.1-75.2)
2nd Quintile 71.1 (66.5-75.7) 79.2 (75.9-82.5) 75.3 (72.5-78.1)
1st Quintile 75.2 (70.1-80.2) 79.8 (76.1-83.6) 77.5 (74.3-80.6)
NSW 69.5 (67.3-71.7) 76.3 (74.7-78.0) 73.0 (71.6-74.3)
Note: Estimates are based on 7,735 respondents in NSW. For this indicator 227 (2.85%) were not stated (Don’t know or Refused) in NSW. The indicator includes those who would be sad if they had to leave their neighbourhood. The question used was: Would you be sad if you had to leavethis neighbourhood?
Source: New South Wales Population Health Survey 2006 (HOIST). Centre for Epidemiology and Research, NSW Department of Health.
390
WARNIN
G: Esti
mates o
ut of
date.
Please
chec
k Hea
lthStat
s NSW
for la
test e
stimate
s.
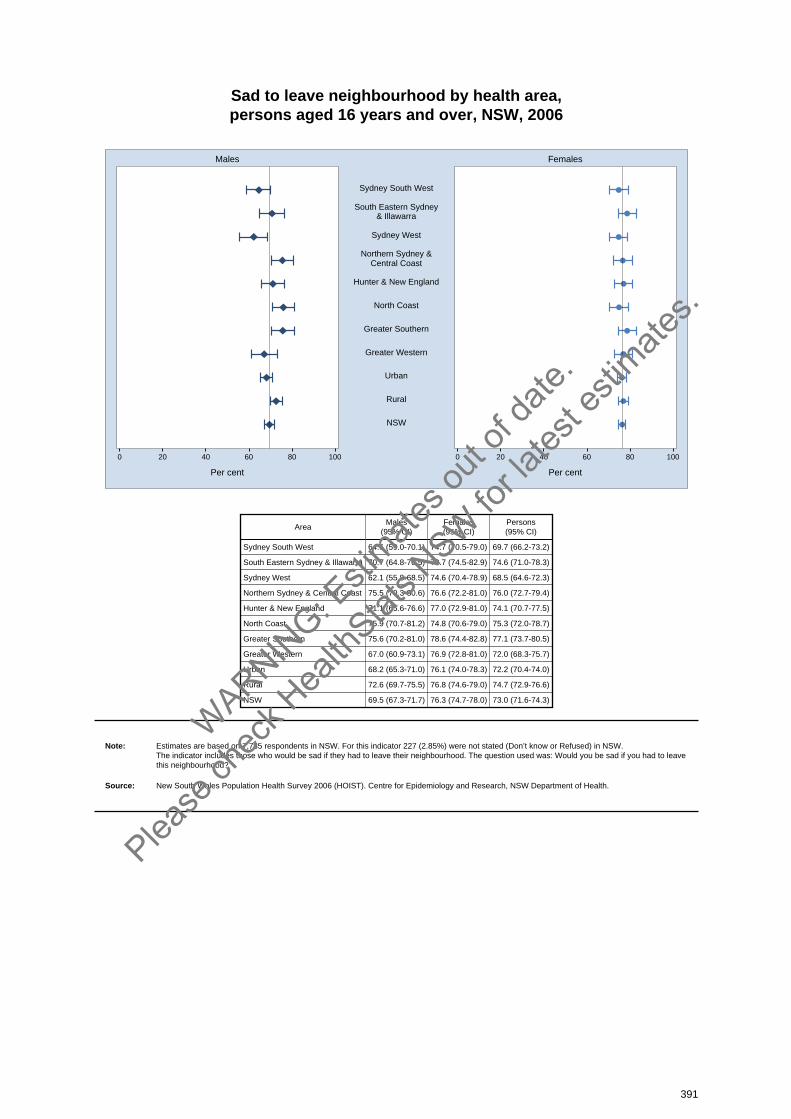
Sad to leave neighbourhood by health area, persons aged 16 years and over, NSW, 2006
0 20 40 60 80 100 0 20 40 60 80 100
Males Females
Per cent Per cent
Sydney South West
South Eastern Sydney& Illawarra
Sydney West
Northern Sydney &Central Coast
Hunter & New England
North Coast
Greater Southern
Greater Western
Urban
Rural
NSW
AreaMales
(95% CI)Females(95% CI)
Persons(95% CI)
Sydney South West 64.6 (59.0-70.1) 74.7 (70.5-79.0) 69.7 (66.2-73.2)
South Eastern Sydney & Illawarra 70.7 (64.8-76.5) 78.7 (74.5-82.9) 74.6 (71.0-78.3)
Sydney West 62.1 (55.8-68.5) 74.6 (70.4-78.9) 68.5 (64.6-72.3)
Northern Sydney & Central Coast 75.5 (70.3-80.6) 76.6 (72.2-81.0) 76.0 (72.7-79.4)
Hunter & New England 71.1 (65.6-76.6) 77.0 (72.9-81.0) 74.1 (70.7-77.5)
North Coast 75.9 (70.7-81.2) 74.8 (70.6-79.0) 75.3 (72.0-78.7)
Greater Southern 75.6 (70.2-81.0) 78.6 (74.4-82.8) 77.1 (73.7-80.5)
Greater Western 67.0 (60.9-73.1) 76.9 (72.8-81.0) 72.0 (68.3-75.7)
Urban 68.2 (65.3-71.0) 76.1 (74.0-78.3) 72.2 (70.4-74.0)
Rural 72.6 (69.7-75.5) 76.8 (74.6-79.0) 74.7 (72.9-76.6)
NSW 69.5 (67.3-71.7) 76.3 (74.7-78.0) 73.0 (71.6-74.3)
Note: Estimates are based on 7,735 respondents in NSW. For this indicator 227 (2.85%) were not stated (Don’t know or Refused) in NSW. The indicator includes those who would be sad if they had to leave their neighbourhood. The question used was: Would you be sad if you had to leavethis neighbourhood?
Source: New South Wales Population Health Survey 2006 (HOIST). Centre for Epidemiology and Research, NSW Department of Health.
391
WARNIN
G: Esti
mates o
ut of
date.
Please
chec
k Hea
lthStat
s NSW
for la
test e
stimate
s.
Conclusion
The New South Wales Population Health Survey began as a continuous survey in 2002, followingadult health surveys in 1997 and 1998. Most indicators are collected and reported annually but someare collected and reported biennially and triennially. In 2006, data were collected on demographics,health behaviours, health status, use of and satisfaction with health services, and social capital. Someof these indicators are highlighted below.
Health behavioursHealth behaviours influence health and wellbeing. There have been significant changes in someindicators of health behaviour, while other indicators have not changed significantly.
There have been significant increases in hand washing when preparing raw meat, vaccination againstinfluenza, vaccination against pneumococcal pneumonia, vaccination against meningococcal disease,homes with a smoke alarm or detector, recommended daily fruit consumption, use of low fat orreduced fat or skim milk, adequate physical activity, smoke-free homes, smoke-free cars, and theproportion of adults who would be more likely to attend pubs or clubs if smoking was banned.
There have been significant decreases in any alcohol risk drinking, high risk alcohol drinking, Paptests within the last 2 years, exposure to unflued heating in living areas, fires in the home thatactivitated smoke alarms, current smoking, daily smoking, and in the proportion of adults who wouldbe less likely to attend pubs or clubs if smoking was banned.
The proportion of screening mammograms in the last 2 years, hysterectomy, use of the public watersupply for drinking water, recommended vegetable consumption, food insecurity in the last 12 months,and doctor’s advice to quit smoking, have not changed significantly.
In 2006, 8 new indicators were collected for health behaviours: swimming, fishing, rock fishing,snorkelling or scuba diving in the last 4 weeks; swimming ability among those who swam, fished, rockfished, snorkelled or scuba dived in the last 4 weeks; knowledge of recommended fruit serves;knowledge of recommended vegetable serves; daily consumption of 3 or more serves of vegetables;weekly or more use of neighbourhood facilities; more likely to attend outdoor dining areas if smokingwas banned; and less likely to attend outdoor dining areas if smoking was banned.
Health statusMonitoring the health status of a population helps detect emerging patterns of illness and disease andprovides information to inform health policy and planning of health services. There have beensignificant changes in some indicators of health status, while other indicators have not changed significantly.
There have been increases in the proportion of adults ever diagnosed with asthma, who have diabetesor high blood glucose, who have visited a dental professional in the last 12 months, who areoverweight or obese, and who are obese.
There have been decreases in the proportion of adults who have experienced moderate to extremeinterference with daily activities due to asthma, who have all their natural teeth missing, and who haverated their health as excellent or very good or good.
The proportion of adults with current asthma, with a written asthma management plan, whoexperienced urinary incontinence in the last 4 weeks, who had a fall in the last 12 months, who had afall requiring medical treatment, who had a fall requiring hospitalisation, and who agree with addingfluoride to the public water supply, have not changed significantly.
In 2006, 9 new indicators were collected for health status: asthma reliever medication used in the last12 months, asthma preventer medication used in the last 12 months, current smoking among thosewith current asthma, any action taken to prevent falls, fear of falling, those with high or very highpsychological distress who attended a community event in the last 6 months, those with high or very
392
WARNIN
G: Esti
mates o
ut of
date.
Please
chec
k Hea
lthStat
s NSW
for la
test e
stimate
s.

high psychological distress who helped out at a local group or organisation in the last 3 months, thosewith high or very high psychological distress who were active members of a local organisation orchurch or club, and those with 3 or more chronic disease risk factors.
Health servicesInformation about the use of and satisfaction with health services assists in formulating health policyand health service planning. There have been significant changes in some health service indicators,while other indicators have not changed significantly.
Between 1997 and 2005, in both males and females, there have been increases in: the proportion ofadults with private health insurance; and the proportion of adults with difficulties getting health carewhen needing it.
There has been no significant change in: emergency department presentations in the last 12 monthsor the overall rating of emergency department care as excellent, very good or good. There has beenno significant change in hospital admissions in the last 12 months or in the overall rating of hospitalcare as excellent, very good or good. There has been no significant change in the proportion of visitsto community health centres or public dental services.
Social capitalSocial capital is created from the everyday interactions between people. It is called capital because itcan be measured and quantified in a way that can distribute its benefits and avoid its losses. Therehave been significant changes in some indicators of social capital, while other indicators have notchanged significantly.
Between 2002 and 2005, in both males and females, there have been increases in the proportion ofadults who: attended a community event at least once in the last 6 months, said most people can betrusted, who felt safe walking down their street after dark, said their local area has a reputation forbeing a safe place.
Between 2002 and 2005, in both males and females, there have been decreases in the proportion ofadults who: visited neighbours, and felt able to ask for neighbourhood help to care for a child.
There has been no significant change in the proportion of adults who: helped out at any local group ororganisation at least once in the last 3 months; were active members of a local organisation or churchor club; ran into friends and acquaintances when shopping in their local area; or would feel sad if theyhad to leave their neighbourhood.
The futureThe collection and reporting plan for the New South Wales Population Health Survey to 2012 can befound at www.health.nsw.gov.au/public-health/survey/hsurvey.html. The continued monitoring ofindicators via the Survey will provide information to assist health professionals, health service plannersand those involved in development of health policy.
393
WARNIN
G: Esti
mates o
ut of
date.
Please
chec
k Hea
lthStat
s NSW
for la
test e
stimate
s.
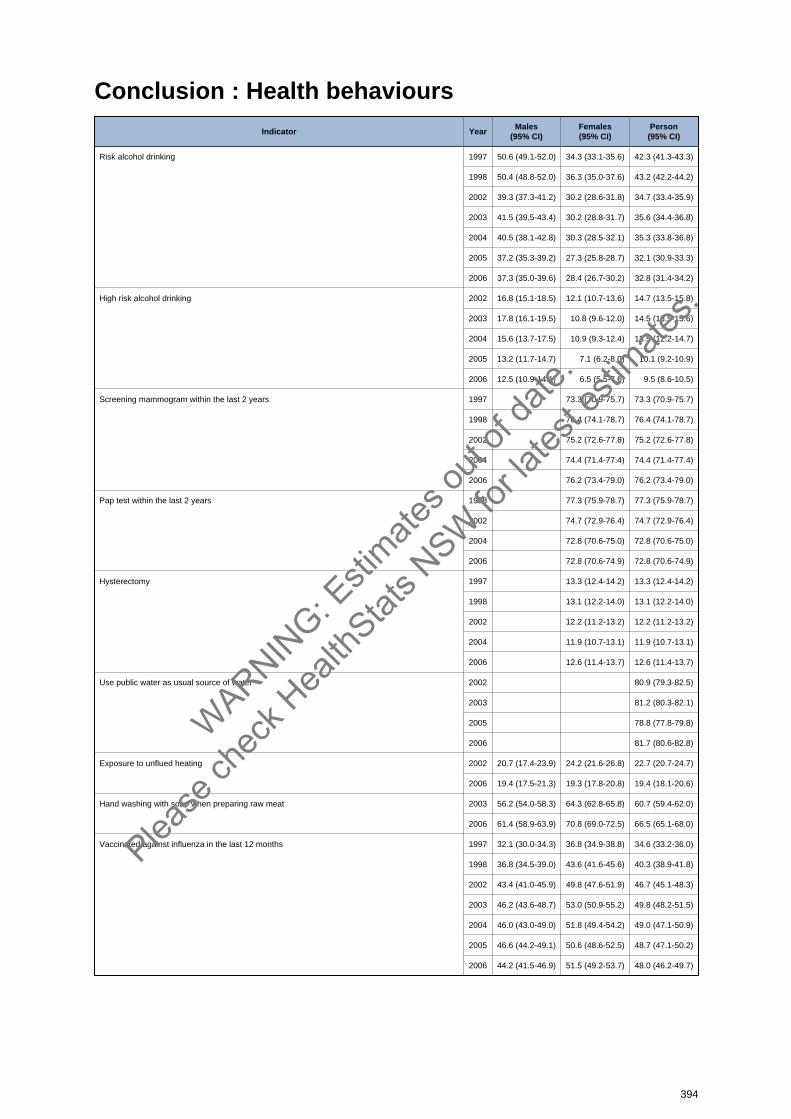
Conclusion : Health behavioursIndicator Year
Males(95% CI)
Females(95% CI)
Person(95% CI)
Risk alcohol drinking 1997 50.6 (49.1-52.0) 34.3 (33.1-35.6) 42.3 (41.3-43.3)
1998 50.4 (48.8-52.0) 36.3 (35.0-37.6) 43.2 (42.2-44.2)
2002 39.3 (37.3-41.2) 30.2 (28.6-31.8) 34.7 (33.4-35.9)
2003 41.5 (39.5-43.4) 30.2 (28.8-31.7) 35.6 (34.4-36.8)
2004 40.5 (38.1-42.8) 30.3 (28.5-32.1) 35.3 (33.8-36.8)
2005 37.2 (35.3-39.2) 27.3 (25.8-28.7) 32.1 (30.9-33.3)
2006 37.3 (35.0-39.6) 28.4 (26.7-30.2) 32.8 (31.4-34.2)
High risk alcohol drinking 2002 16.8 (15.1-18.5) 12.1 (10.7-13.6) 14.7 (13.5-15.8)
2003 17.8 (16.1-19.5) 10.8 (9.6-12.0) 14.5 (13.5-15.6)
2004 15.6 (13.7-17.5) 10.9 (9.3-12.4) 13.5 (12.2-14.7)
2005 13.2 (11.7-14.7) 7.1 (6.2-8.0) 10.1 (9.2-10.9)
2006 12.5 (10.9-14.1) 6.5 (5.5-7.6) 9.5 (8.6-10.5)
Screening mammogram within the last 2 years 1997 73.3 (70.9-75.7) 73.3 (70.9-75.7)
1998 76.4 (74.1-78.7) 76.4 (74.1-78.7)
2002 75.2 (72.6-77.8) 75.2 (72.6-77.8)
2004 74.4 (71.4-77.4) 74.4 (71.4-77.4)
2006 76.2 (73.4-79.0) 76.2 (73.4-79.0)
Pap test within the last 2 years 1998 77.3 (75.9-78.7) 77.3 (75.9-78.7)
2002 74.7 (72.9-76.4) 74.7 (72.9-76.4)
2004 72.8 (70.6-75.0) 72.8 (70.6-75.0)
2006 72.8 (70.6-74.9) 72.8 (70.6-74.9)
Hysterectomy 1997 13.3 (12.4-14.2) 13.3 (12.4-14.2)
1998 13.1 (12.2-14.0) 13.1 (12.2-14.0)
2002 12.2 (11.2-13.2) 12.2 (11.2-13.2)
2004 11.9 (10.7-13.1) 11.9 (10.7-13.1)
2006 12.6 (11.4-13.7) 12.6 (11.4-13.7)
Use public water as usual source of water 2002 80.9 (79.3-82.5)
2003 81.2 (80.3-82.1)
2005 78.8 (77.8-79.8)
2006 81.7 (80.6-82.8)
Exposure to unflued heating 2002 20.7 (17.4-23.9) 24.2 (21.6-26.8) 22.7 (20.7-24.7)
2006 19.4 (17.5-21.3) 19.3 (17.8-20.8) 19.4 (18.1-20.6)
Hand washing with soap when preparing raw meat 2003 56.2 (54.0-58.3) 64.3 (62.8-65.8) 60.7 (59.4-62.0)
2006 61.4 (58.9-63.9) 70.8 (69.0-72.5) 66.5 (65.1-68.0)
Vaccinated against influenza in the last 12 months 1997 32.1 (30.0-34.3) 36.8 (34.9-38.8) 34.6 (33.2-36.0)
1998 36.8 (34.5-39.0) 43.6 (41.6-45.6) 40.3 (38.9-41.8)
2002 43.4 (41.0-45.9) 49.8 (47.6-51.9) 46.7 (45.1-48.3)
2003 46.2 (43.6-48.7) 53.0 (50.9-55.2) 49.8 (48.2-51.5)
2004 46.0 (43.0-49.0) 51.8 (49.4-54.2) 49.0 (47.1-50.9)
2005 46.6 (44.2-49.1) 50.6 (48.6-52.5) 48.7 (47.1-50.2)
2006 44.2 (41.5-46.9) 51.5 (49.2-53.7) 48.0 (46.2-49.7)
394
WARNIN
G: Esti
mates o
ut of
date.
Please
chec
k Hea
lthStat
s NSW
for la
test e
stimate
s.
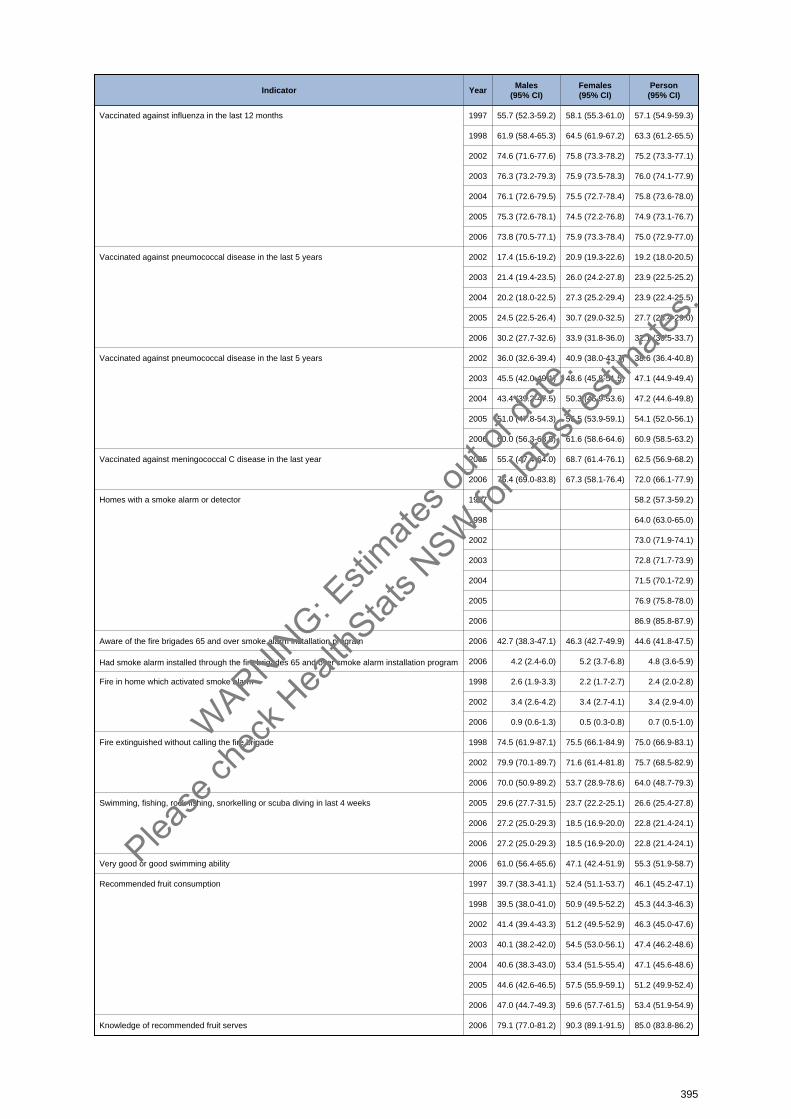
Indicator YearMales
(95% CI)Females(95% CI)
Person(95% CI)
Vaccinated against influenza in the last 12 months 1997 55.7 (52.3-59.2) 58.1 (55.3-61.0) 57.1 (54.9-59.3)
1998 61.9 (58.4-65.3) 64.5 (61.9-67.2) 63.3 (61.2-65.5)
2002 74.6 (71.6-77.6) 75.8 (73.3-78.2) 75.2 (73.3-77.1)
2003 76.3 (73.2-79.3) 75.9 (73.5-78.3) 76.0 (74.1-77.9)
2004 76.1 (72.6-79.5) 75.5 (72.7-78.4) 75.8 (73.6-78.0)
2005 75.3 (72.6-78.1) 74.5 (72.2-76.8) 74.9 (73.1-76.7)
2006 73.8 (70.5-77.1) 75.9 (73.3-78.4) 75.0 (72.9-77.0)
Vaccinated against pneumococcal disease in the last 5 years 2002 17.4 (15.6-19.2) 20.9 (19.3-22.6) 19.2 (18.0-20.5)
2003 21.4 (19.4-23.5) 26.0 (24.2-27.8) 23.9 (22.5-25.2)
2004 20.2 (18.0-22.5) 27.3 (25.2-29.4) 23.9 (22.4-25.5)
2005 24.5 (22.5-26.4) 30.7 (29.0-32.5) 27.7 (26.4-29.0)
2006 30.2 (27.7-32.6) 33.9 (31.8-36.0) 32.1 (30.5-33.7)
Vaccinated against pneumococcal disease in the last 5 years 2002 36.0 (32.6-39.4) 40.9 (38.0-43.7) 38.6 (36.4-40.8)
2003 45.5 (42.0-49.1) 48.6 (45.8-51.5) 47.1 (44.9-49.4)
2004 43.4 (39.2-47.5) 50.3 (46.9-53.6) 47.2 (44.6-49.8)
2005 51.0 (47.8-54.3) 56.5 (53.9-59.1) 54.1 (52.0-56.1)
2006 60.0 (56.3-63.8) 61.6 (58.6-64.6) 60.9 (58.5-63.2)
Vaccinated against meningococcal C disease in the last year 2005 55.7 (47.4-64.0) 68.7 (61.4-76.1) 62.5 (56.9-68.2)
2006 76.4 (69.0-83.8) 67.3 (58.1-76.4) 72.0 (66.1-77.9)
Homes with a smoke alarm or detector 1997 58.2 (57.3-59.2)
1998 64.0 (63.0-65.0)
2002 73.0 (71.9-74.1)
2003 72.8 (71.7-73.9)
2004 71.5 (70.1-72.9)
2005 76.9 (75.8-78.0)
2006 86.9 (85.8-87.9)
Aware of the fire brigades 65 and over smoke alarm installation program 2006 42.7 (38.3-47.1) 46.3 (42.7-49.9) 44.6 (41.8-47.5)
Had smoke alarm installed through the fire brigades 65 and over smoke alarm installation program 2006 4.2 (2.4-6.0) 5.2 (3.7-6.8) 4.8 (3.6-5.9)
Fire in home which activated smoke alarm 1998 2.6 (1.9-3.3) 2.2 (1.7-2.7) 2.4 (2.0-2.8)
2002 3.4 (2.6-4.2) 3.4 (2.7-4.1) 3.4 (2.9-4.0)
2006 0.9 (0.6-1.3) 0.5 (0.3-0.8) 0.7 (0.5-1.0)
Fire extinguished without calling the fire brigade 1998 74.5 (61.9-87.1) 75.5 (66.1-84.9) 75.0 (66.9-83.1)
2002 79.9 (70.1-89.7) 71.6 (61.4-81.8) 75.7 (68.5-82.9)
2006 70.0 (50.9-89.2) 53.7 (28.9-78.6) 64.0 (48.7-79.3)
Swimming, fishing, rock fishing, snorkelling or scuba diving in last 4 weeks 2005 29.6 (27.7-31.5) 23.7 (22.2-25.1) 26.6 (25.4-27.8)
2006 27.2 (25.0-29.3) 18.5 (16.9-20.0) 22.8 (21.4-24.1)
2006 27.2 (25.0-29.3) 18.5 (16.9-20.0) 22.8 (21.4-24.1)
Very good or good swimming ability 2006 61.0 (56.4-65.6) 47.1 (42.4-51.9) 55.3 (51.9-58.7)
Recommended fruit consumption 1997 39.7 (38.3-41.1) 52.4 (51.1-53.7) 46.1 (45.2-47.1)
1998 39.5 (38.0-41.0) 50.9 (49.5-52.2) 45.3 (44.3-46.3)
2002 41.4 (39.4-43.3) 51.2 (49.5-52.9) 46.3 (45.0-47.6)
2003 40.1 (38.2-42.0) 54.5 (53.0-56.1) 47.4 (46.2-48.6)
2004 40.6 (38.3-43.0) 53.4 (51.5-55.4) 47.1 (45.6-48.6)
2005 44.6 (42.6-46.5) 57.5 (55.9-59.1) 51.2 (49.9-52.4)
2006 47.0 (44.7-49.3) 59.6 (57.7-61.5) 53.4 (51.9-54.9)
Knowledge of recommended fruit serves 2006 79.1 (77.0-81.2) 90.3 (89.1-91.5) 85.0 (83.8-86.2)
395
WARNIN
G: Esti
mates o
ut of
date.
Please
chec
k Hea
lthStat
s NSW
for la
test e
stimate
s.
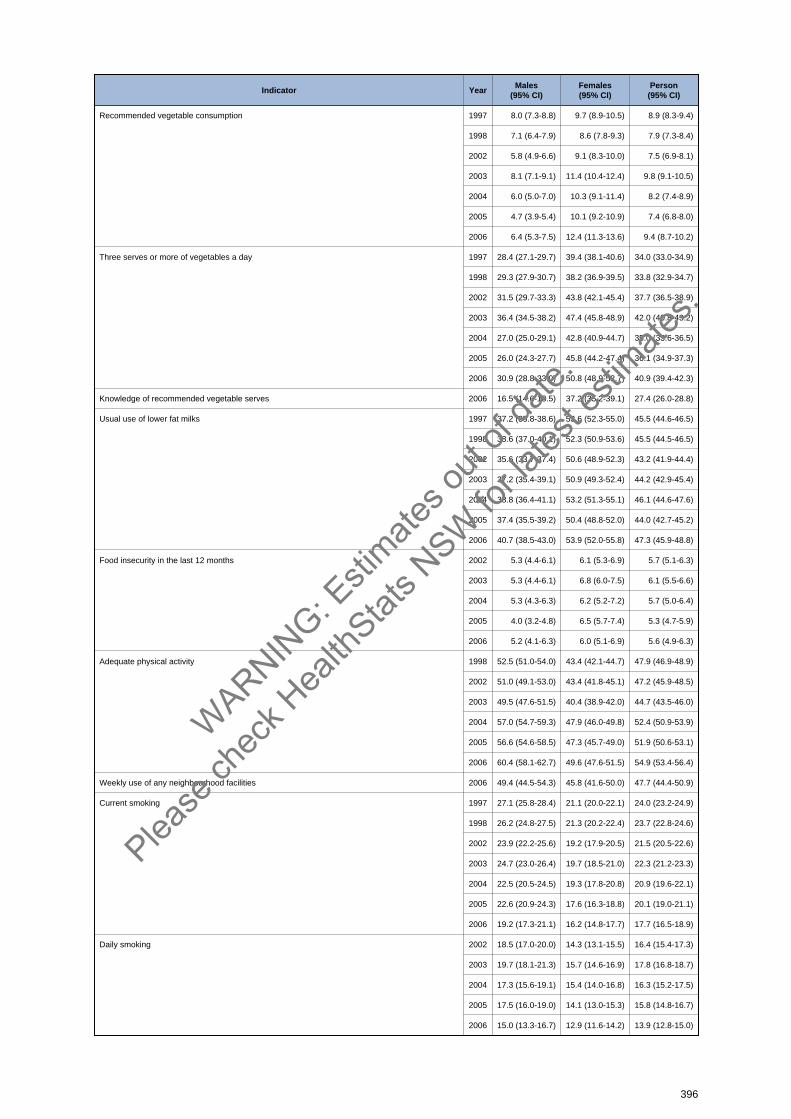
Indicator YearMales
(95% CI)Females(95% CI)
Person(95% CI)
Recommended vegetable consumption 1997 8.0 (7.3-8.8) 9.7 (8.9-10.5) 8.9 (8.3-9.4)
1998 7.1 (6.4-7.9) 8.6 (7.8-9.3) 7.9 (7.3-8.4)
2002 5.8 (4.9-6.6) 9.1 (8.3-10.0) 7.5 (6.9-8.1)
2003 8.1 (7.1-9.1) 11.4 (10.4-12.4) 9.8 (9.1-10.5)
2004 6.0 (5.0-7.0) 10.3 (9.1-11.4) 8.2 (7.4-8.9)
2005 4.7 (3.9-5.4) 10.1 (9.2-10.9) 7.4 (6.8-8.0)
2006 6.4 (5.3-7.5) 12.4 (11.3-13.6) 9.4 (8.7-10.2)
Three serves or more of vegetables a day 1997 28.4 (27.1-29.7) 39.4 (38.1-40.6) 34.0 (33.0-34.9)
1998 29.3 (27.9-30.7) 38.2 (36.9-39.5) 33.8 (32.9-34.7)
2002 31.5 (29.7-33.3) 43.8 (42.1-45.4) 37.7 (36.5-38.9)
2003 36.4 (34.5-38.2) 47.4 (45.8-48.9) 42.0 (40.8-43.2)
2004 27.0 (25.0-29.1) 42.8 (40.9-44.7) 35.0 (33.6-36.5)
2005 26.0 (24.3-27.7) 45.8 (44.2-47.4) 36.1 (34.9-37.3)
2006 30.9 (28.8-33.0) 50.8 (48.9-52.7) 40.9 (39.4-42.3)
Knowledge of recommended vegetable serves 2006 16.5 (14.6-18.5) 37.2 (35.2-39.1) 27.4 (26.0-28.8)
Usual use of lower fat milks 1997 37.2 (35.8-38.6) 53.6 (52.3-55.0) 45.5 (44.6-46.5)
1998 38.6 (37.0-40.1) 52.3 (50.9-53.6) 45.5 (44.5-46.5)
2002 35.6 (33.7-37.4) 50.6 (48.9-52.3) 43.2 (41.9-44.4)
2003 37.2 (35.4-39.1) 50.9 (49.3-52.4) 44.2 (42.9-45.4)
2004 38.8 (36.4-41.1) 53.2 (51.3-55.1) 46.1 (44.6-47.6)
2005 37.4 (35.5-39.2) 50.4 (48.8-52.0) 44.0 (42.7-45.2)
2006 40.7 (38.5-43.0) 53.9 (52.0-55.8) 47.3 (45.9-48.8)
Food insecurity in the last 12 months 2002 5.3 (4.4-6.1) 6.1 (5.3-6.9) 5.7 (5.1-6.3)
2003 5.3 (4.4-6.1) 6.8 (6.0-7.5) 6.1 (5.5-6.6)
2004 5.3 (4.3-6.3) 6.2 (5.2-7.2) 5.7 (5.0-6.4)
2005 4.0 (3.2-4.8) 6.5 (5.7-7.4) 5.3 (4.7-5.9)
2006 5.2 (4.1-6.3) 6.0 (5.1-6.9) 5.6 (4.9-6.3)
Adequate physical activity 1998 52.5 (51.0-54.0) 43.4 (42.1-44.7) 47.9 (46.9-48.9)
2002 51.0 (49.1-53.0) 43.4 (41.8-45.1) 47.2 (45.9-48.5)
2003 49.5 (47.6-51.5) 40.4 (38.9-42.0) 44.7 (43.5-46.0)
2004 57.0 (54.7-59.3) 47.9 (46.0-49.8) 52.4 (50.9-53.9)
2005 56.6 (54.6-58.5) 47.3 (45.7-49.0) 51.9 (50.6-53.1)
2006 60.4 (58.1-62.7) 49.6 (47.6-51.5) 54.9 (53.4-56.4)
Weekly use of any neighbourhood facilities 2006 49.4 (44.5-54.3) 45.8 (41.6-50.0) 47.7 (44.4-50.9)
Current smoking 1997 27.1 (25.8-28.4) 21.1 (20.0-22.1) 24.0 (23.2-24.9)
1998 26.2 (24.8-27.5) 21.3 (20.2-22.4) 23.7 (22.8-24.6)
2002 23.9 (22.2-25.6) 19.2 (17.9-20.5) 21.5 (20.5-22.6)
2003 24.7 (23.0-26.4) 19.7 (18.5-21.0) 22.3 (21.2-23.3)
2004 22.5 (20.5-24.5) 19.3 (17.8-20.8) 20.9 (19.6-22.1)
2005 22.6 (20.9-24.3) 17.6 (16.3-18.8) 20.1 (19.0-21.1)
2006 19.2 (17.3-21.1) 16.2 (14.8-17.7) 17.7 (16.5-18.9)
Daily smoking 2002 18.5 (17.0-20.0) 14.3 (13.1-15.5) 16.4 (15.4-17.3)
2003 19.7 (18.1-21.3) 15.7 (14.6-16.9) 17.8 (16.8-18.7)
2004 17.3 (15.6-19.1) 15.4 (14.0-16.8) 16.3 (15.2-17.5)
2005 17.5 (16.0-19.0) 14.1 (13.0-15.3) 15.8 (14.8-16.7)
2006 15.0 (13.3-16.7) 12.9 (11.6-14.2) 13.9 (12.8-15.0)
396
WARNIN
G: Esti
mates o
ut of
date.
Please
chec
k Hea
lthStat
s NSW
for la
test e
stimate
s.
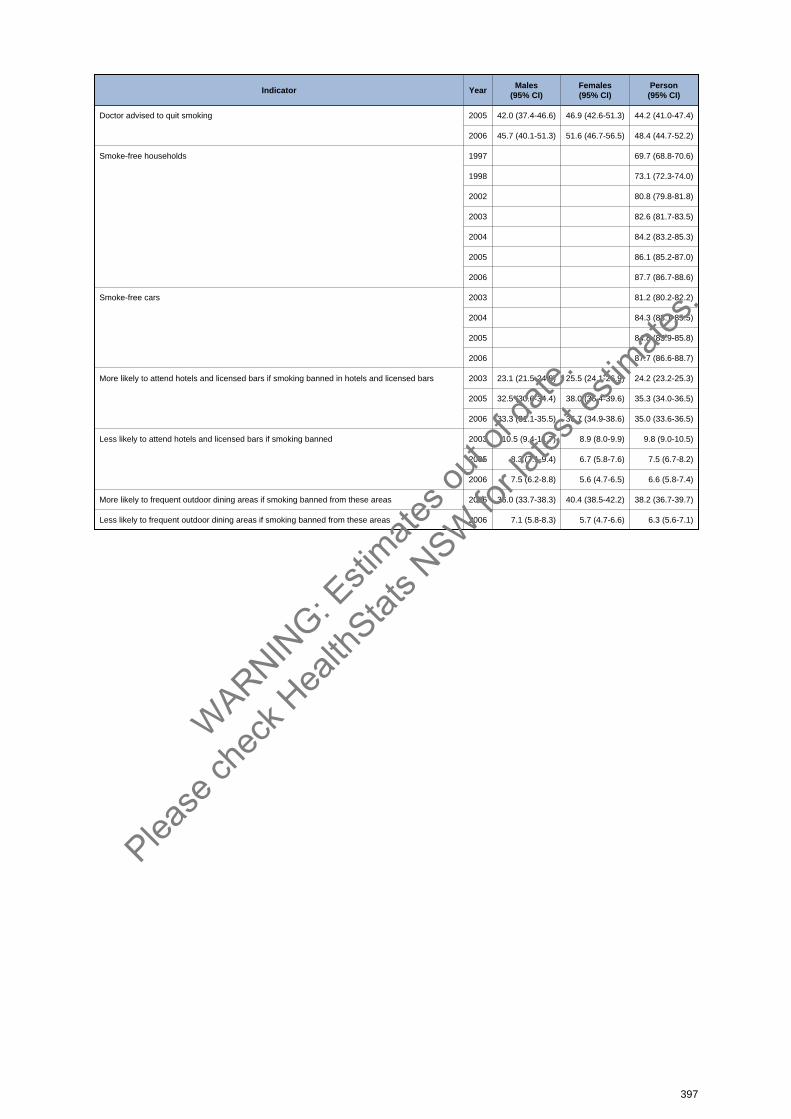
Indicator YearMales
(95% CI)Females(95% CI)
Person(95% CI)
Doctor advised to quit smoking 2005 42.0 (37.4-46.6) 46.9 (42.6-51.3) 44.2 (41.0-47.4)
2006 45.7 (40.1-51.3) 51.6 (46.7-56.5) 48.4 (44.7-52.2)
Smoke-free households 1997 69.7 (68.8-70.6)
1998 73.1 (72.3-74.0)
2002 80.8 (79.8-81.8)
2003 82.6 (81.7-83.5)
2004 84.2 (83.2-85.3)
2005 86.1 (85.2-87.0)
2006 87.7 (86.7-88.6)
Smoke-free cars 2003 81.2 (80.2-82.2)
2004 84.3 (83.1-85.5)
2005 84.8 (83.9-85.8)
2006 87.7 (86.6-88.7)
More likely to attend hotels and licensed bars if smoking banned in hotels and licensed bars 2003 23.1 (21.5-24.8) 25.5 (24.1-26.9) 24.2 (23.2-25.3)
2005 32.5 (30.6-34.4) 38.0 (36.4-39.6) 35.3 (34.0-36.5)
2006 33.3 (31.1-35.5) 36.7 (34.9-38.6) 35.0 (33.6-36.5)
Less likely to attend hotels and licensed bars if smoking banned 2003 10.5 (9.4-11.7) 8.9 (8.0-9.9) 9.8 (9.0-10.5)
2005 8.3 (7.1-9.4) 6.7 (5.8-7.6) 7.5 (6.7-8.2)
2006 7.5 (6.2-8.8) 5.6 (4.7-6.5) 6.6 (5.8-7.4)
More likely to frequent outdoor dining areas if smoking banned from these areas 2006 36.0 (33.7-38.3) 40.4 (38.5-42.2) 38.2 (36.7-39.7)
Less likely to frequent outdoor dining areas if smoking banned from these areas 2006 7.1 (5.8-8.3) 5.7 (4.7-6.6) 6.3 (5.6-7.1)
397
WARNIN
G: Esti
mates o
ut of
date.
Please
chec
k Hea
lthStat
s NSW
for la
test e
stimate
s.
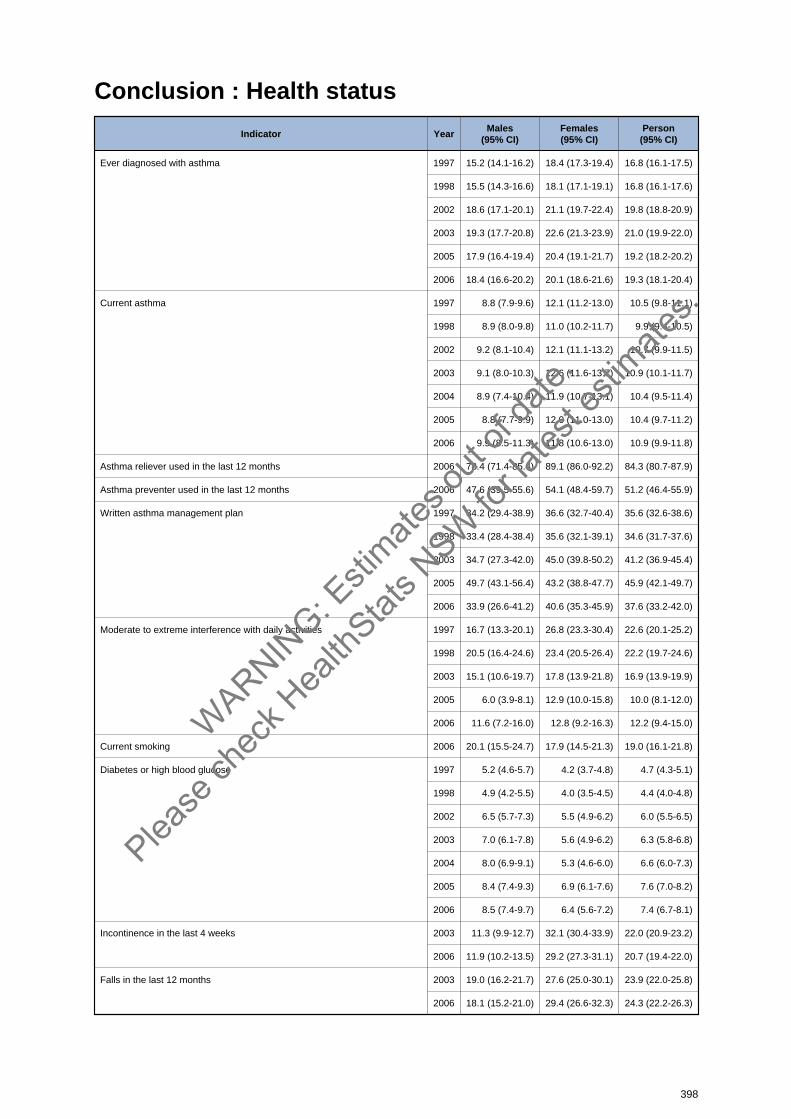
Conclusion : Health status
Indicator YearMales
(95% CI)Females(95% CI)
Person(95% CI)
Ever diagnosed with asthma 1997 15.2 (14.1-16.2) 18.4 (17.3-19.4) 16.8 (16.1-17.5)
1998 15.5 (14.3-16.6) 18.1 (17.1-19.1) 16.8 (16.1-17.6)
2002 18.6 (17.1-20.1) 21.1 (19.7-22.4) 19.8 (18.8-20.9)
2003 19.3 (17.7-20.8) 22.6 (21.3-23.9) 21.0 (19.9-22.0)
2005 17.9 (16.4-19.4) 20.4 (19.1-21.7) 19.2 (18.2-20.2)
2006 18.4 (16.6-20.2) 20.1 (18.6-21.6) 19.3 (18.1-20.4)
Current asthma 1997 8.8 (7.9-9.6) 12.1 (11.2-13.0) 10.5 (9.8-11.1)
1998 8.9 (8.0-9.8) 11.0 (10.2-11.7) 9.9 (9.4-10.5)
2002 9.2 (8.1-10.4) 12.1 (11.1-13.2) 10.7 (9.9-11.5)
2003 9.1 (8.0-10.3) 12.6 (11.6-13.7) 10.9 (10.1-11.7)
2004 8.9 (7.4-10.4) 11.9 (10.7-13.1) 10.4 (9.5-11.4)
2005 8.8 (7.7-9.9) 12.0 (11.0-13.0) 10.4 (9.7-11.2)
2006 9.9 (8.5-11.3) 11.8 (10.6-13.0) 10.9 (9.9-11.8)
Asthma reliever used in the last 12 months 2006 78.4 (71.4-85.4) 89.1 (86.0-92.2) 84.3 (80.7-87.9)
Asthma preventer used in the last 12 months 2006 47.6 (39.5-55.6) 54.1 (48.4-59.7) 51.2 (46.4-55.9)
Written asthma management plan 1997 34.2 (29.4-38.9) 36.6 (32.7-40.4) 35.6 (32.6-38.6)
1998 33.4 (28.4-38.4) 35.6 (32.1-39.1) 34.6 (31.7-37.6)
2003 34.7 (27.3-42.0) 45.0 (39.8-50.2) 41.2 (36.9-45.4)
2005 49.7 (43.1-56.4) 43.2 (38.8-47.7) 45.9 (42.1-49.7)
2006 33.9 (26.6-41.2) 40.6 (35.3-45.9) 37.6 (33.2-42.0)
Moderate to extreme interference with daily activities 1997 16.7 (13.3-20.1) 26.8 (23.3-30.4) 22.6 (20.1-25.2)
1998 20.5 (16.4-24.6) 23.4 (20.5-26.4) 22.2 (19.7-24.6)
2003 15.1 (10.6-19.7) 17.8 (13.9-21.8) 16.9 (13.9-19.9)
2005 6.0 (3.9-8.1) 12.9 (10.0-15.8) 10.0 (8.1-12.0)
2006 11.6 (7.2-16.0) 12.8 (9.2-16.3) 12.2 (9.4-15.0)
Current smoking 2006 20.1 (15.5-24.7) 17.9 (14.5-21.3) 19.0 (16.1-21.8)
Diabetes or high blood glucose 1997 5.2 (4.6-5.7) 4.2 (3.7-4.8) 4.7 (4.3-5.1)
1998 4.9 (4.2-5.5) 4.0 (3.5-4.5) 4.4 (4.0-4.8)
2002 6.5 (5.7-7.3) 5.5 (4.9-6.2) 6.0 (5.5-6.5)
2003 7.0 (6.1-7.8) 5.6 (4.9-6.2) 6.3 (5.8-6.8)
2004 8.0 (6.9-9.1) 5.3 (4.6-6.0) 6.6 (6.0-7.3)
2005 8.4 (7.4-9.3) 6.9 (6.1-7.6) 7.6 (7.0-8.2)
2006 8.5 (7.4-9.7) 6.4 (5.6-7.2) 7.4 (6.7-8.1)
Incontinence in the last 4 weeks 2003 11.3 (9.9-12.7) 32.1 (30.4-33.9) 22.0 (20.9-23.2)
2006 11.9 (10.2-13.5) 29.2 (27.3-31.1) 20.7 (19.4-22.0)
Falls in the last 12 months 2003 19.0 (16.2-21.7) 27.6 (25.0-30.1) 23.9 (22.0-25.8)
2006 18.1 (15.2-21.0) 29.4 (26.6-32.3) 24.3 (22.2-26.3)
398
WARNIN
G: Esti
mates o
ut of
date.
Please
chec
k Hea
lthStat
s NSW
for la
test e
stimate
s.
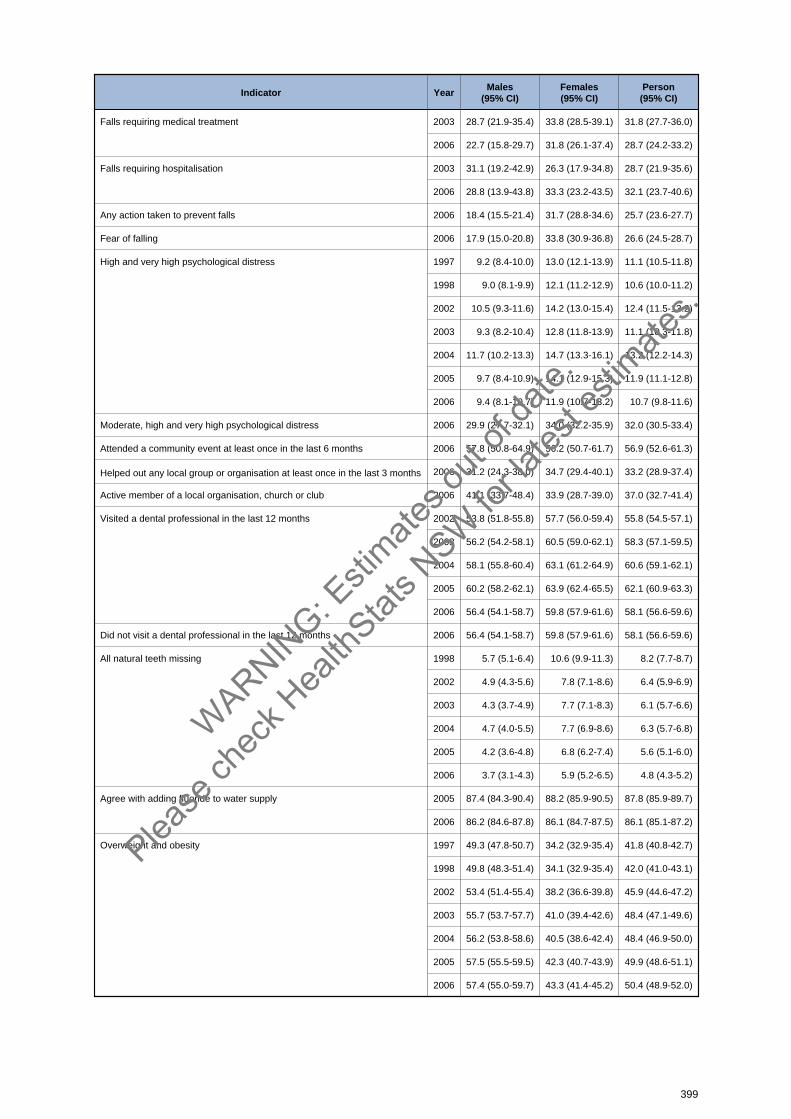
Indicator YearMales
(95% CI)Females(95% CI)
Person(95% CI)
Falls requiring medical treatment 2003 28.7 (21.9-35.4) 33.8 (28.5-39.1) 31.8 (27.7-36.0)
2006 22.7 (15.8-29.7) 31.8 (26.1-37.4) 28.7 (24.2-33.2)
Falls requiring hospitalisation 2003 31.1 (19.2-42.9) 26.3 (17.9-34.8) 28.7 (21.9-35.6)
2006 28.8 (13.9-43.8) 33.3 (23.2-43.5) 32.1 (23.7-40.6)
Any action taken to prevent falls 2006 18.4 (15.5-21.4) 31.7 (28.8-34.6) 25.7 (23.6-27.7)
Fear of falling 2006 17.9 (15.0-20.8) 33.8 (30.9-36.8) 26.6 (24.5-28.7)
High and very high psychological distress 1997 9.2 (8.4-10.0) 13.0 (12.1-13.9) 11.1 (10.5-11.8)
1998 9.0 (8.1-9.9) 12.1 (11.2-12.9) 10.6 (10.0-11.2)
2002 10.5 (9.3-11.6) 14.2 (13.0-15.4) 12.4 (11.5-13.2)
2003 9.3 (8.2-10.4) 12.8 (11.8-13.9) 11.1 (10.3-11.8)
2004 11.7 (10.2-13.3) 14.7 (13.3-16.1) 13.2 (12.2-14.3)
2005 9.7 (8.4-10.9) 14.1 (12.9-15.3) 11.9 (11.1-12.8)
2006 9.4 (8.1-10.7) 11.9 (10.7-13.2) 10.7 (9.8-11.6)
Moderate, high and very high psychological distress 2006 29.9 (27.7-32.1) 34.0 (32.2-35.9) 32.0 (30.5-33.4)
Attended a community event at least once in the last 6 months 2006 57.8 (50.8-64.9) 56.2 (50.7-61.7) 56.9 (52.6-61.3)
Helped out any local group or organisation at least once in the last 3 months 2006 31.2 (24.3-38.0) 34.7 (29.4-40.1) 33.2 (28.9-37.4)
Active member of a local organisation, church or club 2006 41.1 (33.7-48.4) 33.9 (28.7-39.0) 37.0 (32.7-41.4)
Visited a dental professional in the last 12 months 2002 53.8 (51.8-55.8) 57.7 (56.0-59.4) 55.8 (54.5-57.1)
2003 56.2 (54.2-58.1) 60.5 (59.0-62.1) 58.3 (57.1-59.5)
2004 58.1 (55.8-60.4) 63.1 (61.2-64.9) 60.6 (59.1-62.1)
2005 60.2 (58.2-62.1) 63.9 (62.4-65.5) 62.1 (60.9-63.3)
2006 56.4 (54.1-58.7) 59.8 (57.9-61.6) 58.1 (56.6-59.6)
Did not visit a dental professional in the last 12 months 2006 56.4 (54.1-58.7) 59.8 (57.9-61.6) 58.1 (56.6-59.6)
All natural teeth missing 1998 5.7 (5.1-6.4) 10.6 (9.9-11.3) 8.2 (7.7-8.7)
2002 4.9 (4.3-5.6) 7.8 (7.1-8.6) 6.4 (5.9-6.9)
2003 4.3 (3.7-4.9) 7.7 (7.1-8.3) 6.1 (5.7-6.6)
2004 4.7 (4.0-5.5) 7.7 (6.9-8.6) 6.3 (5.7-6.8)
2005 4.2 (3.6-4.8) 6.8 (6.2-7.4) 5.6 (5.1-6.0)
2006 3.7 (3.1-4.3) 5.9 (5.2-6.5) 4.8 (4.3-5.2)
Agree with adding fluoride to water supply 2005 87.4 (84.3-90.4) 88.2 (85.9-90.5) 87.8 (85.9-89.7)
2006 86.2 (84.6-87.8) 86.1 (84.7-87.5) 86.1 (85.1-87.2)
Overweight and obesity 1997 49.3 (47.8-50.7) 34.2 (32.9-35.4) 41.8 (40.8-42.7)
1998 49.8 (48.3-51.4) 34.1 (32.9-35.4) 42.0 (41.0-43.1)
2002 53.4 (51.4-55.4) 38.2 (36.6-39.8) 45.9 (44.6-47.2)
2003 55.7 (53.7-57.7) 41.0 (39.4-42.6) 48.4 (47.1-49.6)
2004 56.2 (53.8-58.6) 40.5 (38.6-42.4) 48.4 (46.9-50.0)
2005 57.5 (55.5-59.5) 42.3 (40.7-43.9) 49.9 (48.6-51.1)
2006 57.4 (55.0-59.7) 43.3 (41.4-45.2) 50.4 (48.9-52.0)
399
WARNIN
G: Esti
mates o
ut of
date.
Please
chec
k Hea
lthStat
s NSW
for la
test e
stimate
s.
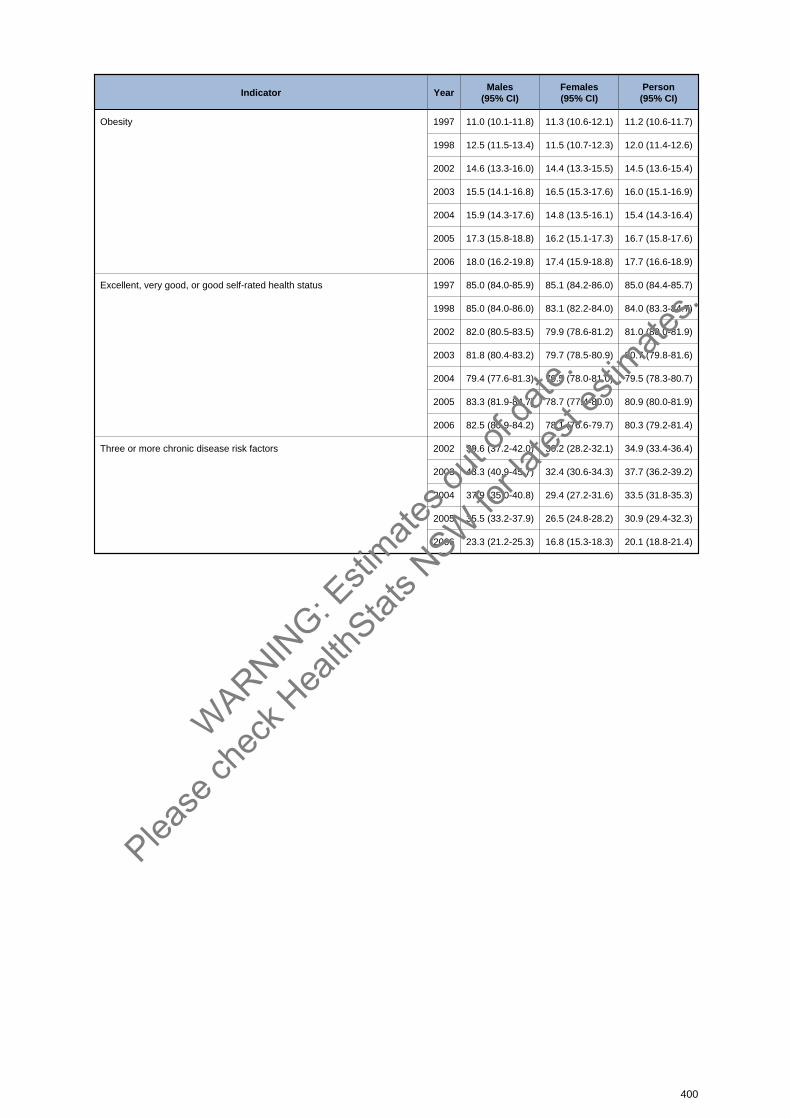
Indicator YearMales
(95% CI)Females(95% CI)
Person(95% CI)
Obesity 1997 11.0 (10.1-11.8) 11.3 (10.6-12.1) 11.2 (10.6-11.7)
1998 12.5 (11.5-13.4) 11.5 (10.7-12.3) 12.0 (11.4-12.6)
2002 14.6 (13.3-16.0) 14.4 (13.3-15.5) 14.5 (13.6-15.4)
2003 15.5 (14.1-16.8) 16.5 (15.3-17.6) 16.0 (15.1-16.9)
2004 15.9 (14.3-17.6) 14.8 (13.5-16.1) 15.4 (14.3-16.4)
2005 17.3 (15.8-18.8) 16.2 (15.1-17.3) 16.7 (15.8-17.6)
2006 18.0 (16.2-19.8) 17.4 (15.9-18.8) 17.7 (16.6-18.9)
Excellent, very good, or good self-rated health status 1997 85.0 (84.0-85.9) 85.1 (84.2-86.0) 85.0 (84.4-85.7)
1998 85.0 (84.0-86.0) 83.1 (82.2-84.0) 84.0 (83.3-84.7)
2002 82.0 (80.5-83.5) 79.9 (78.6-81.2) 81.0 (80.0-81.9)
2003 81.8 (80.4-83.2) 79.7 (78.5-80.9) 80.7 (79.8-81.6)
2004 79.4 (77.6-81.3) 79.5 (78.0-81.0) 79.5 (78.3-80.7)
2005 83.3 (81.9-84.7) 78.7 (77.4-80.0) 80.9 (80.0-81.9)
2006 82.5 (80.9-84.2) 78.1 (76.6-79.7) 80.3 (79.2-81.4)
Three or more chronic disease risk factors 2002 39.6 (37.2-42.0) 30.2 (28.2-32.1) 34.9 (33.4-36.4)
2003 43.3 (40.9-45.7) 32.4 (30.6-34.3) 37.7 (36.2-39.2)
2004 37.9 (35.0-40.8) 29.4 (27.2-31.6) 33.5 (31.8-35.3)
2005 35.5 (33.2-37.9) 26.5 (24.8-28.2) 30.9 (29.4-32.3)
2006 23.3 (21.2-25.3) 16.8 (15.3-18.3) 20.1 (18.8-21.4)
400
WARNIN
G: Esti
mates o
ut of
date.
Please
chec
k Hea
lthStat
s NSW
for la
test e
stimate
s.
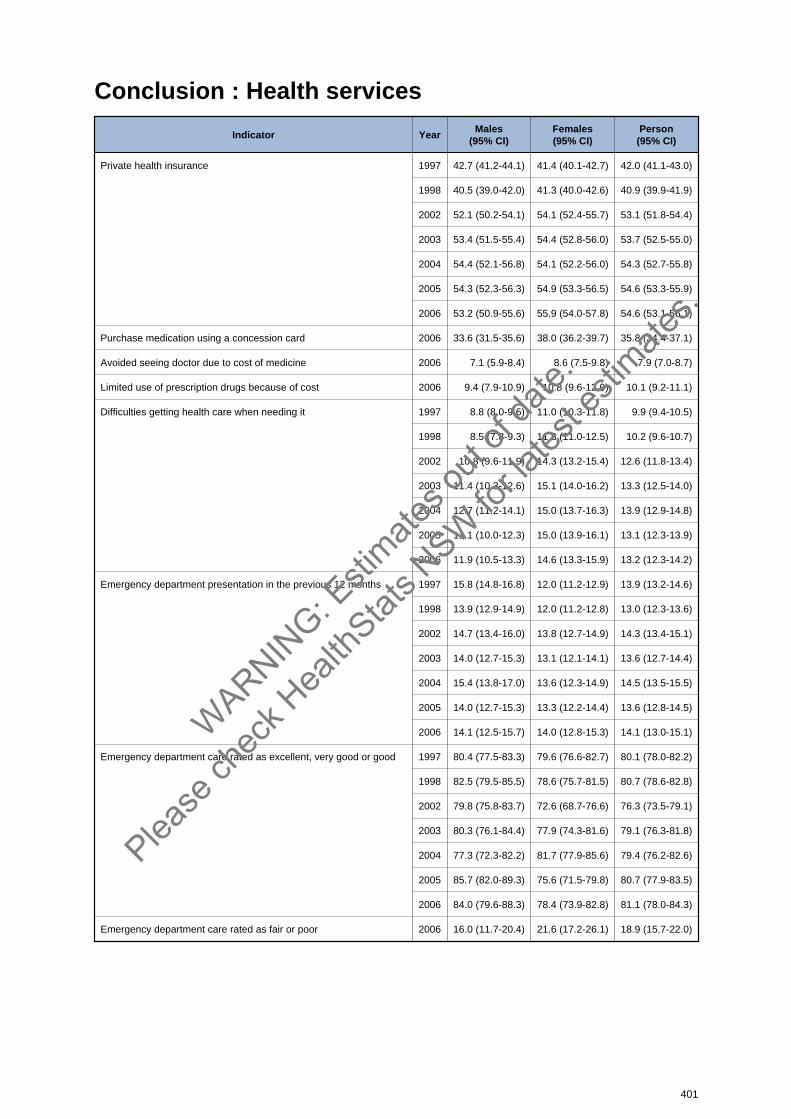
Conclusion : Health services
Indicator YearMales
(95% CI)Females(95% CI)
Person(95% CI)
Private health insurance 1997 42.7 (41.2-44.1) 41.4 (40.1-42.7) 42.0 (41.1-43.0)
1998 40.5 (39.0-42.0) 41.3 (40.0-42.6) 40.9 (39.9-41.9)
2002 52.1 (50.2-54.1) 54.1 (52.4-55.7) 53.1 (51.8-54.4)
2003 53.4 (51.5-55.4) 54.4 (52.8-56.0) 53.7 (52.5-55.0)
2004 54.4 (52.1-56.8) 54.1 (52.2-56.0) 54.3 (52.7-55.8)
2005 54.3 (52.3-56.3) 54.9 (53.3-56.5) 54.6 (53.3-55.9)
2006 53.2 (50.9-55.6) 55.9 (54.0-57.8) 54.6 (53.1-56.1)
Purchase medication using a concession card 2006 33.6 (31.5-35.6) 38.0 (36.2-39.7) 35.8 (34.4-37.1)
Avoided seeing doctor due to cost of medicine 2006 7.1 (5.9-8.4) 8.6 (7.5-9.8) 7.9 (7.0-8.7)
Limited use of prescription drugs because of cost 2006 9.4 (7.9-10.9) 10.8 (9.6-12.0) 10.1 (9.2-11.1)
Difficulties getting health care when needing it 1997 8.8 (8.0-9.6) 11.0 (10.3-11.8) 9.9 (9.4-10.5)
1998 8.5 (7.8-9.3) 11.8 (11.0-12.5) 10.2 (9.6-10.7)
2002 10.8 (9.6-11.9) 14.3 (13.2-15.4) 12.6 (11.8-13.4)
2003 11.4 (10.3-12.6) 15.1 (14.0-16.2) 13.3 (12.5-14.0)
2004 12.7 (11.2-14.1) 15.0 (13.7-16.3) 13.9 (12.9-14.8)
2005 11.1 (10.0-12.3) 15.0 (13.9-16.1) 13.1 (12.3-13.9)
2006 11.9 (10.5-13.3) 14.6 (13.3-15.9) 13.2 (12.3-14.2)
Emergency department presentation in the previous 12 months 1997 15.8 (14.8-16.8) 12.0 (11.2-12.9) 13.9 (13.2-14.6)
1998 13.9 (12.9-14.9) 12.0 (11.2-12.8) 13.0 (12.3-13.6)
2002 14.7 (13.4-16.0) 13.8 (12.7-14.9) 14.3 (13.4-15.1)
2003 14.0 (12.7-15.3) 13.1 (12.1-14.1) 13.6 (12.7-14.4)
2004 15.4 (13.8-17.0) 13.6 (12.3-14.9) 14.5 (13.5-15.5)
2005 14.0 (12.7-15.3) 13.3 (12.2-14.4) 13.6 (12.8-14.5)
2006 14.1 (12.5-15.7) 14.0 (12.8-15.3) 14.1 (13.0-15.1)
Emergency department care rated as excellent, very good or good 1997 80.4 (77.5-83.3) 79.6 (76.6-82.7) 80.1 (78.0-82.2)
1998 82.5 (79.5-85.5) 78.6 (75.7-81.5) 80.7 (78.6-82.8)
2002 79.8 (75.8-83.7) 72.6 (68.7-76.6) 76.3 (73.5-79.1)
2003 80.3 (76.1-84.4) 77.9 (74.3-81.6) 79.1 (76.3-81.8)
2004 77.3 (72.3-82.2) 81.7 (77.9-85.6) 79.4 (76.2-82.6)
2005 85.7 (82.0-89.3) 75.6 (71.5-79.8) 80.7 (77.9-83.5)
2006 84.0 (79.6-88.3) 78.4 (73.9-82.8) 81.1 (78.0-84.3)
Emergency department care rated as fair or poor 2006 16.0 (11.7-20.4) 21.6 (17.2-26.1) 18.9 (15.7-22.0)
401
WARNIN
G: Esti
mates o
ut of
date.
Please
chec
k Hea
lthStat
s NSW
for la
test e
stimate
s.
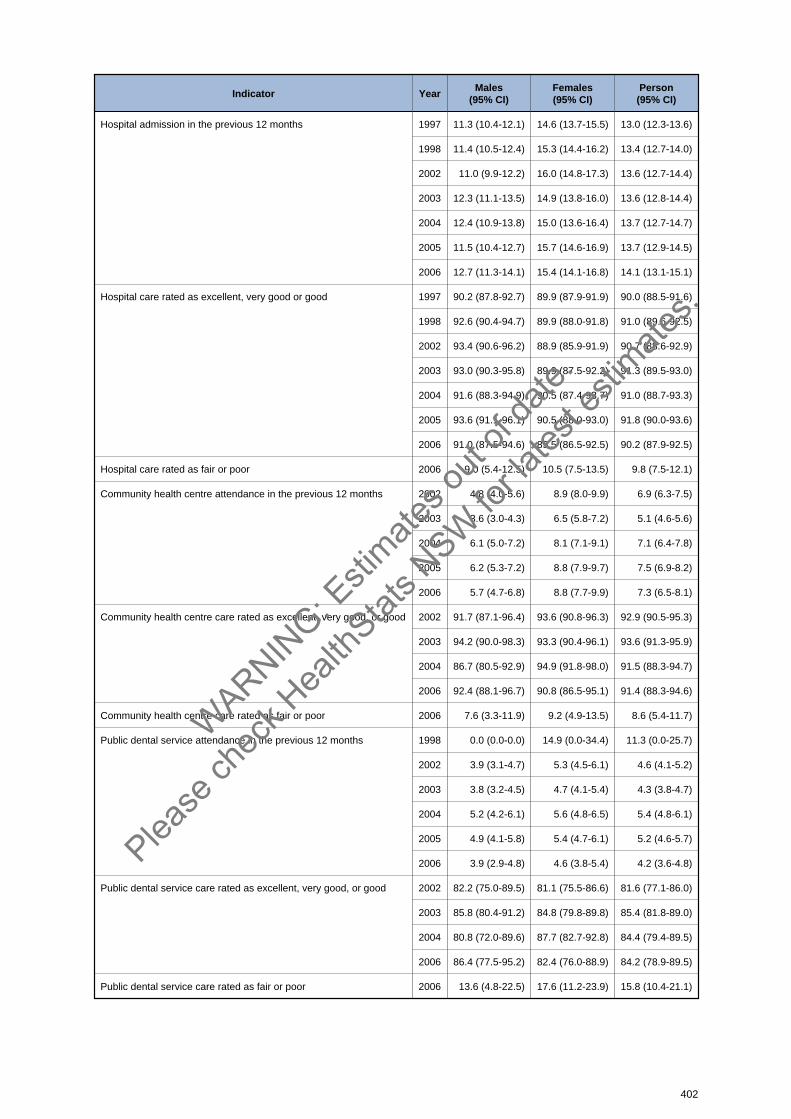
Indicator YearMales
(95% CI)Females(95% CI)
Person(95% CI)
Hospital admission in the previous 12 months 1997 11.3 (10.4-12.1) 14.6 (13.7-15.5) 13.0 (12.3-13.6)
1998 11.4 (10.5-12.4) 15.3 (14.4-16.2) 13.4 (12.7-14.0)
2002 11.0 (9.9-12.2) 16.0 (14.8-17.3) 13.6 (12.7-14.4)
2003 12.3 (11.1-13.5) 14.9 (13.8-16.0) 13.6 (12.8-14.4)
2004 12.4 (10.9-13.8) 15.0 (13.6-16.4) 13.7 (12.7-14.7)
2005 11.5 (10.4-12.7) 15.7 (14.6-16.9) 13.7 (12.9-14.5)
2006 12.7 (11.3-14.1) 15.4 (14.1-16.8) 14.1 (13.1-15.1)
Hospital care rated as excellent, very good or good 1997 90.2 (87.8-92.7) 89.9 (87.9-91.9) 90.0 (88.5-91.6)
1998 92.6 (90.4-94.7) 89.9 (88.0-91.8) 91.0 (89.6-92.5)
2002 93.4 (90.6-96.2) 88.9 (85.9-91.9) 90.7 (88.6-92.9)
2003 93.0 (90.3-95.8) 89.9 (87.5-92.2) 91.3 (89.5-93.0)
2004 91.6 (88.3-94.9) 90.5 (87.4-93.7) 91.0 (88.7-93.3)
2005 93.6 (91.1-96.1) 90.5 (88.0-93.0) 91.8 (90.0-93.6)
2006 91.0 (87.5-94.6) 89.5 (86.5-92.5) 90.2 (87.9-92.5)
Hospital care rated as fair or poor 2006 9.0 (5.4-12.5) 10.5 (7.5-13.5) 9.8 (7.5-12.1)
Community health centre attendance in the previous 12 months 2002 4.8 (4.0-5.6) 8.9 (8.0-9.9) 6.9 (6.3-7.5)
2003 3.6 (3.0-4.3) 6.5 (5.8-7.2) 5.1 (4.6-5.6)
2004 6.1 (5.0-7.2) 8.1 (7.1-9.1) 7.1 (6.4-7.8)
2005 6.2 (5.3-7.2) 8.8 (7.9-9.7) 7.5 (6.9-8.2)
2006 5.7 (4.7-6.8) 8.8 (7.7-9.9) 7.3 (6.5-8.1)
Community health centre care rated as excellent, very good, or good 2002 91.7 (87.1-96.4) 93.6 (90.8-96.3) 92.9 (90.5-95.3)
2003 94.2 (90.0-98.3) 93.3 (90.4-96.1) 93.6 (91.3-95.9)
2004 86.7 (80.5-92.9) 94.9 (91.8-98.0) 91.5 (88.3-94.7)
2006 92.4 (88.1-96.7) 90.8 (86.5-95.1) 91.4 (88.3-94.6)
Community health centre care rated as fair or poor 2006 7.6 (3.3-11.9) 9.2 (4.9-13.5) 8.6 (5.4-11.7)
Public dental service attendance in the previous 12 months 1998 0.0 (0.0-0.0) 14.9 (0.0-34.4) 11.3 (0.0-25.7)
2002 3.9 (3.1-4.7) 5.3 (4.5-6.1) 4.6 (4.1-5.2)
2003 3.8 (3.2-4.5) 4.7 (4.1-5.4) 4.3 (3.8-4.7)
2004 5.2 (4.2-6.1) 5.6 (4.8-6.5) 5.4 (4.8-6.1)
2005 4.9 (4.1-5.8) 5.4 (4.7-6.1) 5.2 (4.6-5.7)
2006 3.9 (2.9-4.8) 4.6 (3.8-5.4) 4.2 (3.6-4.8)
Public dental service care rated as excellent, very good, or good 2002 82.2 (75.0-89.5) 81.1 (75.5-86.6) 81.6 (77.1-86.0)
2003 85.8 (80.4-91.2) 84.8 (79.8-89.8) 85.4 (81.8-89.0)
2004 80.8 (72.0-89.6) 87.7 (82.7-92.8) 84.4 (79.4-89.5)
2006 86.4 (77.5-95.2) 82.4 (76.0-88.9) 84.2 (78.9-89.5)
Public dental service care rated as fair or poor 2006 13.6 (4.8-22.5) 17.6 (11.2-23.9) 15.8 (10.4-21.1)
402
WARNIN
G: Esti
mates o
ut of
date.
Please
chec
k Hea
lthStat
s NSW
for la
test e
stimate
s.

Conclusion : Social capital
Indicator YearMales
(95% CI)Females(95% CI)
Person(95% CI)
Attended a community event at least once in the last 6 months 2002 53.2 (51.3-55.2) 60.9 (59.3-62.5) 57.1 (55.8-58.4)
2003 54.4 (52.5-56.4) 62.0 (60.5-63.6) 58.0 (56.8-59.2)
2005 56.4 (54.4-58.4) 63.7 (62.2-65.3) 60.1 (58.9-61.4)
2006 57.0 (54.7-59.4) 63.6 (61.8-65.4) 60.3 (58.9-61.8)
Helped out any local group or organisation at least once in the last 3 months 2002 30.7 (28.9-32.4) 36.0 (34.4-37.6) 33.4 (32.2-34.5)
2003 31.4 (29.6-33.2) 33.1 (31.6-34.6) 32.1 (30.9-33.2)
2005 32.2 (30.3-34.0) 38.6 (37.0-40.2) 35.4 (34.2-36.6)
2006 34.1 (31.9-36.3) 37.7 (35.9-39.5) 35.9 (34.5-37.3)
2006 31.2 (24.3-38.0) 34.7 (29.4-40.1) 33.2 (28.9-37.4)
Active member of a local organisation, church or club 2002 45.6 (43.6-47.5) 42.1 (40.4-43.7) 43.8 (42.5-45.1)
2003 45.6 (43.7-47.6) 42.0 (40.4-43.5) 43.7 (42.4-44.9)
2005 44.0 (42.0-46.0) 41.3 (39.8-42.9) 42.6 (41.4-43.9)
2006 45.7 (43.4-48.1) 41.9 (40.0-43.7) 43.8 (42.3-45.3)
2006 41.1 (33.7-48.4) 33.9 (28.7-39.0) 37.0 (32.7-41.4)
Most people can be trusted 2002 68.9 (67.1-70.7) 62.6 (60.9-64.3) 65.7 (64.5-67.0)
2003 71.6 (69.9-73.4) 68.1 (66.6-69.6) 69.7 (68.6-70.9)
2005 74.2 (72.4-76.0) 72.5 (71.0-74.0) 73.3 (72.2-74.5)
2006 74.4 (72.3-76.4) 72.7 (71.0-74.5) 73.5 (72.2-74.9)
Feel safe walking down their street after dark 2002 78.4 (76.8-80.0) 56.5 (54.9-58.2) 67.4 (66.3-68.6)
2003 80.2 (78.7-81.7) 56.4 (54.8-58.0) 68.0 (66.9-69.1)
2005 82.9 (81.4-84.3) 59.9 (58.4-61.5) 71.3 (70.2-72.4)
2006 82.4 (80.8-84.1) 58.0 (56.2-59.9) 70.2 (68.9-71.6)
Area has a reputation for being a safe place 2002 75.2 (73.5-76.9) 71.4 (69.9-73.0) 73.3 (72.2-74.4)
2003 76.4 (74.8-78.1) 73.3 (71.9-74.7) 74.9 (73.8-75.9)
2005 78.6 (77.0-80.3) 77.5 (76.1-78.9) 78.1 (77.0-79.1)
2006 75.8 (73.7-77.8) 74.9 (73.2-76.6) 75.3 (74.0-76.7)
Visit neighbours 2002 69.1 (67.3-70.9) 63.6 (62.0-65.2) 66.3 (65.1-67.5)
2003 67.0 (65.1-68.8) 64.0 (62.4-65.5) 65.4 (64.2-66.6)
2005 66.4 (64.5-68.3) 60.6 (59.0-62.2) 63.4 (62.2-64.7)
2006 66.6 (64.4-68.9) 66.9 (65.1-68.6) 66.7 (65.3-68.2)
Run into friends and acquaintances when shopping in local area 2002 80.7 (79.2-82.3) 84.0 (82.8-85.2) 82.4 (81.4-83.4)
2003 80.5 (78.9-82.0) 82.9 (81.7-84.1) 81.6 (80.6-82.6)
2005 79.4 (77.7-81.1) 83.0 (81.8-84.2) 81.2 (80.2-82.3)
2006 78.2 (76.3-80.2) 83.2 (81.8-84.6) 80.8 (79.5-82.0)
Sad to leave neighbourhood 2002 71.1 (69.3-72.9) 75.5 (74.0-76.9) 73.3 (72.1-74.5)
2003 69.4 (67.6-71.2) 77.0 (75.6-78.3) 73.3 (72.2-74.4)
2005 67.3 (65.4-69.3) 75.8 (74.4-77.2) 71.7 (70.5-72.9)
2006 69.5 (67.3-71.7) 76.3 (74.7-78.0) 73.0 (71.6-74.3)
403
WARNIN
G: Esti
mates o
ut of
date.
Please
chec
k Hea
lthStat
s NSW
for la
test e
stimate
s.
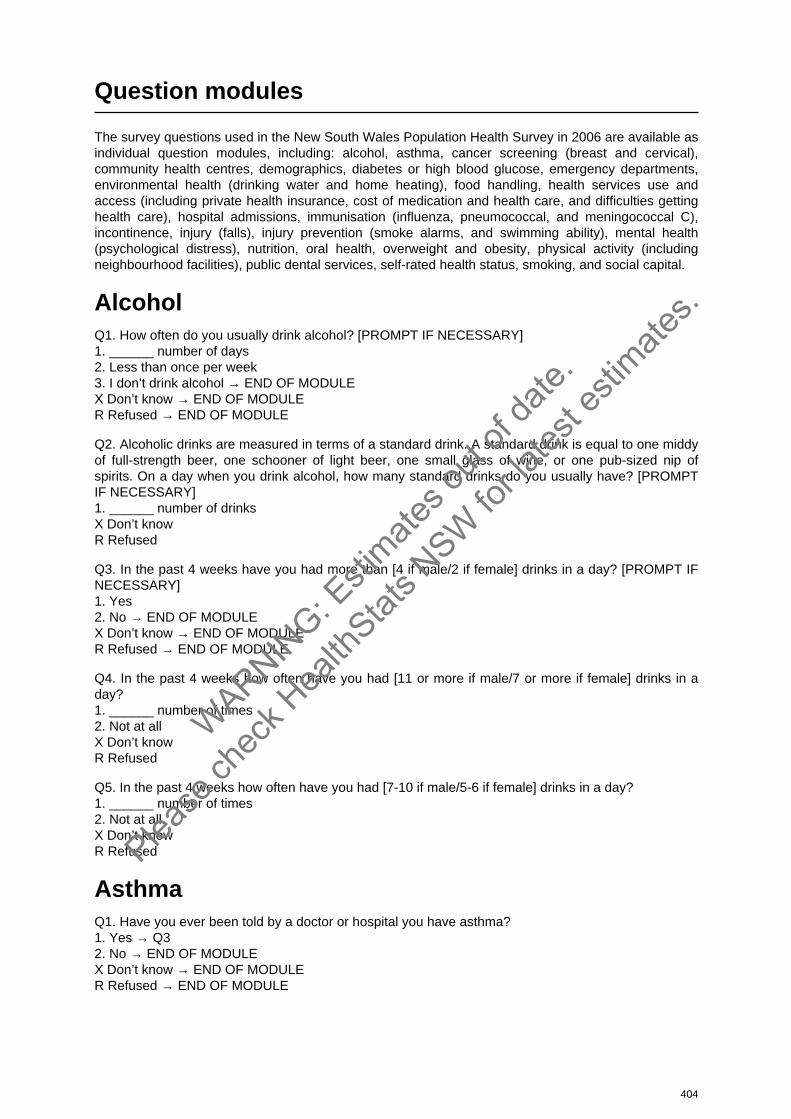
Question modules
The survey questions used in the New South Wales Population Health Survey in 2006 are available asindividual question modules, including: alcohol, asthma, cancer screening (breast and cervical),community health centres, demographics, diabetes or high blood glucose, emergency departments,environmental health (drinking water and home heating), food handling, health services use andaccess (including private health insurance, cost of medication and health care, and difficulties gettinghealth care), hospital admissions, immunisation (influenza, pneumococcal, and meningococcal C),incontinence, injury (falls), injury prevention (smoke alarms, and swimming ability), mental health(psychological distress), nutrition, oral health, overweight and obesity, physical activity (includingneighbourhood facilities), public dental services, self-rated health status, smoking, and social capital.
AlcoholQ1. How often do you usually drink alcohol? [PROMPT IF NECESSARY]1. ______ number of days2. Less than once per week3. I don’t drink alcohol → END OF MODULEX Don’t know → END OF MODULER Refused → END OF MODULE
Q2. Alcoholic drinks are measured in terms of a standard drink. A standard drink is equal to one middyof full-strength beer, one schooner of light beer, one small glass of wine, or one pub-sized nip ofspirits. On a day when you drink alcohol, how many standard drinks do you usually have? [PROMPTIF NECESSARY]1. ______ number of drinksX Don’t knowR Refused
Q3. In the past 4 weeks have you had more than [4 if male/2 if female] drinks in a day? [PROMPT IF NECESSARY]1. Yes2. No → END OF MODULEX Don’t know → END OF MODULER Refused → END OF MODULE
Q4. In the past 4 weeks how often have you had [11 or more if male/7 or more if female] drinks in a day?1. ______ number of times2. Not at allX Don’t knowR Refused
Q5. In the past 4 weeks how often have you had [7-10 if male/5-6 if female] drinks in a day?1. ______ number of times2. Not at allX Don’t knowR Refused
AsthmaQ1. Have you ever been told by a doctor or hospital you have asthma?1. Yes → Q32. No → END OF MODULEX Don’t know → END OF MODULER Refused → END OF MODULE
404
WARNIN
G: Esti
mates o
ut of
date.
Please
chec
k Hea
lthStat
s NSW
for la
test e
stimate
s.
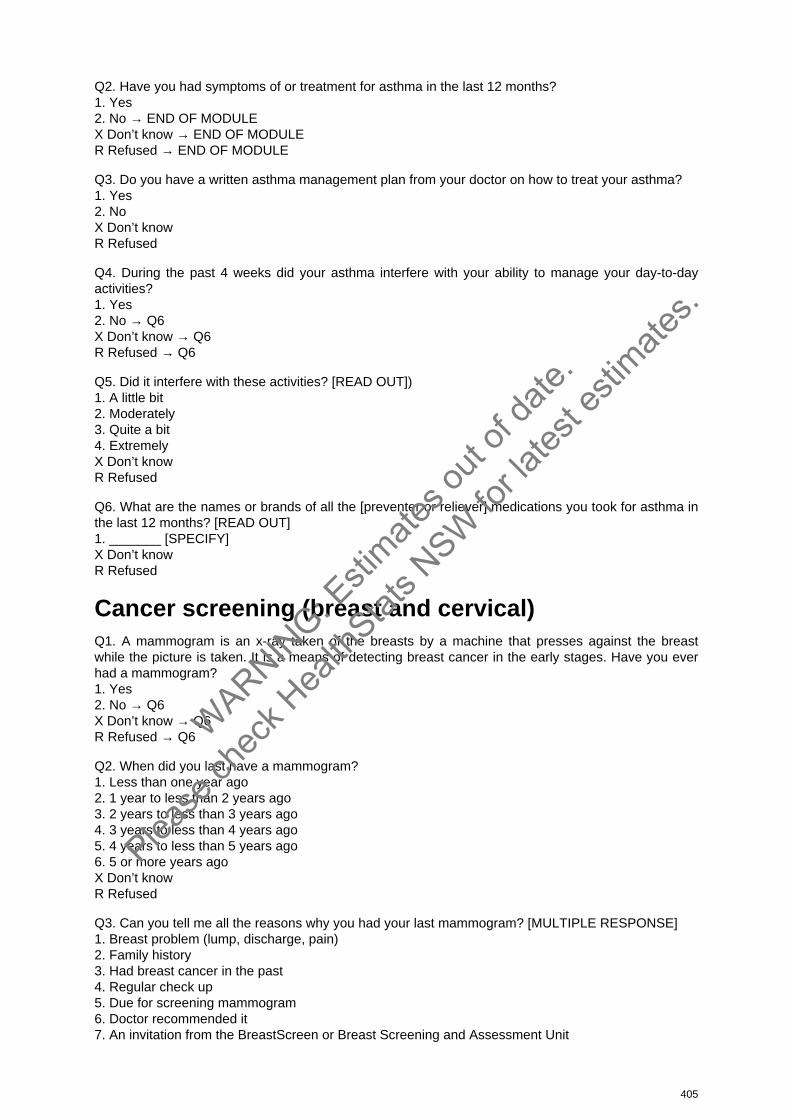
Q2. Have you had symptoms of or treatment for asthma in the last 12 months?1. Yes2. No → END OF MODULEX Don’t know → END OF MODULER Refused → END OF MODULE
Q3. Do you have a written asthma management plan from your doctor on how to treat your asthma?1. Yes2. NoX Don’t know R Refused
Q4. During the past 4 weeks did your asthma interfere with your ability to manage your day-to-day activities?1. Yes2. No → Q6X Don’t know → Q6R Refused → Q6
Q5. Did it interfere with these activities? [READ OUT])1. A little bit2. Moderately3. Quite a bit4. ExtremelyX Don’t knowR Refused
Q6. What are the names or brands of all the [preventer or reliever] medications you took for asthma inthe last 12 months? [READ OUT]1. _______ [SPECIFY]X Don’t knowR Refused
Cancer screening (breast and cervical)Q1. A mammogram is an x-ray taken of the breasts by a machine that presses against the breastwhile the picture is taken. It is a means of detecting breast cancer in the early stages. Have you everhad a mammogram?1. Yes2. No → Q6X Don’t know → Q6R Refused → Q6
Q2. When did you last have a mammogram?1. Less than one year ago2. 1 year to less than 2 years ago3. 2 years to less than 3 years ago4. 3 years to less than 4 years ago5. 4 years to less than 5 years ago6. 5 or more years agoX Don’t knowR Refused
Q3. Can you tell me all the reasons why you had your last mammogram? [MULTIPLE RESPONSE]1. Breast problem (lump, discharge, pain)2. Family history3. Had breast cancer in the past4. Regular check up5. Due for screening mammogram6. Doctor recommended it7. An invitation from the BreastScreen or Breast Screening and Assessment Unit
405
WARNIN
G: Esti
mates o
ut of
date.
Please
chec
k Hea
lthStat
s NSW
for la
test e
stimate
s.

8. Publicity about breast cancer and screening9. Urged by a friend or relative to go10. Other [SPECIFY]X Don’t knowR Refused
Q4. Do you have mammograms regularly?1. Yes2. No → Q6X Don’t know → Q6R Refused → Q6
Q5. What is the usual time period between your mammograms?1. ______ number of years2. Only had oneX Don’t knowR Refused
Q6. A Pap test is a routine test carried out by a doctor. It is recommended for all women for earlydetection of cancer of the cervix. Have you ever had a Pap test?1. Yes2. No → Q10X Don’t know → Q10R Refused → Q10
Q7. When did you last have a Pap test?1. Less than one year ago2. 1 year to less than 2 years ago3. 2 years to less than 3 years ago4. 3 years to less than 4 years ago5. 4 years to less than 5 years ago6. 5 or more years agoX Don’t knowR Refused
Q8. Do you have a Pap test regularly?1. Yes2. No → Q10X Don’t know → Q10R Refused → Q10
Q9. What is the usual time period between your Pap tests?1. Only had one Pap test2. Less than one year ago3. ______ number of yearsX Don’t knowR Refused
Q10. Have you ever had a hysterectomy?1. Yes2. NoX Don’t knowR Refused
Community health centresQ1. In the last 12 months, have you attended a government-run community health centre?1. Yes2. No → END OF MODULEX Dont know → END OF MODULER Refused → END OF MODULE
406
WARNIN
G: Esti
mates o
ut of
date.
Please
chec
k Hea
lthStat
s NSW
for la
test e
stimate
s.
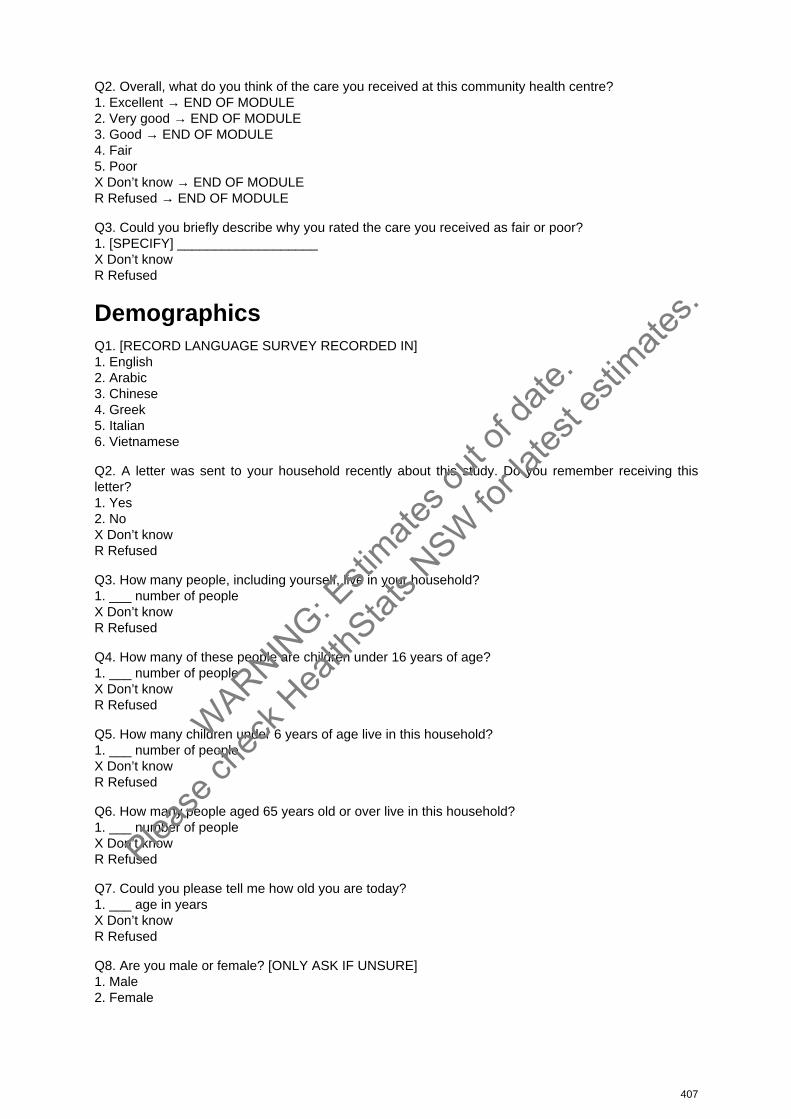
Q2. Overall, what do you think of the care you received at this community health centre?1. Excellent → END OF MODULE2. Very good → END OF MODULE3. Good → END OF MODULE4. Fair5. PoorX Don’t know → END OF MODULER Refused → END OF MODULE
Q3. Could you briefly describe why you rated the care you received as fair or poor?1. [SPECIFY] ___________________X Don’t knowR Refused
DemographicsQ1. [RECORD LANGUAGE SURVEY RECORDED IN]1. English2. Arabic3. Chinese4. Greek5. Italian6. Vietnamese
Q2. A letter was sent to your household recently about this study. Do you remember receiving this letter?1. Yes2. NoX Don’t knowR Refused
Q3. How many people, including yourself, live in your household?1. ___ number of peopleX Don’t knowR Refused
Q4. How many of these people are children under 16 years of age?1. ___ number of peopleX Don’t knowR Refused
Q5. How many children under 6 years of age live in this household?1. ___ number of peopleX Don’t knowR Refused
Q6. How many people aged 65 years old or over live in this household?1. ___ number of peopleX Don’t knowR Refused
Q7. Could you please tell me how old you are today?1. ___ age in yearsX Don’t knowR Refused
Q8. Are you male or female? [ONLY ASK IF UNSURE]1. Male2. Female
407
WARNIN
G: Esti
mates o
ut of
date.
Please
chec
k Hea
lthStat
s NSW
for la
test e
stimate
s.
Q9. Besides yourself, who else lives in your household? [MULTIPLE RESPONSE]1. No one else: lives alone2. Mother3. Father4. Respondent’s partner5. Stepmother6. Stepfather7. Grandparents8. Sons or daughters9. Brothers or sisters10. Stepbrothers or stepsisters11. Other relatives12. Non-family members13. Other [SPECIFY] ___________X Don’t knowR Refused
Q10. What is your current formal marital status?1. Married2. Widowed3. Separated but not divorced4. Divorced5. Never marriedX Don’t knowR Refused
Q11. In which country were you born?1. Australia2. Other country [SPECIFY] _________ X Don’t knowR Refused
Q12. Do you usually speak a language other than English at home?1. Yes → Q132. NoX Don’t knowR Refused
Q13. What language do you usually speak at home?1. Language [SPECIFY] _________X Don’t knowR Refused
Q14. What is the highest level of primary or secondary schooling you have completed? [PROMPT IF NECESSARY]1. Never attended school2. Currently still at school3. Year 8 or below4. Year 9 or equivalent5. Year 10 or equivalent6. Year 11 or equivalent7. Year 12 or equivalent (Matriculation or Leaving)X Don’t knowR Refused
Q15. What is the level of the highest qualification you have completed?1. Completed School Certificate or Intermediate or Year 10 or 4th Form2. Completed Higher School Certificate or Leaving or Year 12 or 6th Form3. TAFE certificate or diploma4. University, College of Advanced Education, or some other tertiary institute degree or higher5. Other [SPECIFY]______________________
408
WARNIN
G: Esti
mates o
ut of
date.
Please
chec
k Hea
lthStat
s NSW
for la
test e
stimate
s.
6. Completed primary school7. Completed Years 7 to 9X Don’t knowR Refused
Q16. In the last week, which of the following best describes your employment status?[READ OUT]1. Worked for payment or profit → Q182. Worked for payment or profit, but absent on paid leave, holidays, on strike or stood down → Q183. Unpaid work in a family business → Q184. Other unpaid work5. Did not have a jobX Don’t know → Q21R Refused → Q21
Q17. Were you actively looking for work in the last week?1. Yes: looked for full-time work → Q212. Yes: looked for part-time work → Q213. No: did not look for work → Q21X Don’t know → Q21R Refused → Q21
Q18. In the main job held in the last week, were you:1. A wage or salary earner2. Conducting own business with employees3. Conducting own business without employees4. A helper not receiving wagesX Don’t knowR Refused
Q19. In the last week, how many hours did you work in all jobs?1. No. of hours [SPECIFY] _________X Don’t knowR Refused
Q20. Do you currently receive a government pension, allowance or benefit? [ONLY ASKED OF 65AND OVER]1. Yes2. NoX Don’t knowR Refused
Q21. Apart from Medicare, are you currently covered by private health insurance?1. Yes2. NoX Don’t knowR Refused
Q22. I would now like to ask you about your household’s income. What is your annual householdincome before tax? Would it be:1. Less than $20,0002. $20,000 to $40,0003. $40,000 to $60,0004. $60,000 to $80,0005. More than $80,000X Don’t knowR Refused
Q23. How long have you lived in your local area?1. ____ yearsX Don’t knowR Refused
409
WARNIN
G: Esti
mates o
ut of
date.
Please
chec
k Hea
lthStat
s NSW
for la
test e
stimate
s.
Q24. What is the name of your local council or shire?1. _______________ X Don’t knowR Refused
Q25. What is the name of the town or suburb where you live?1. _______________ X Don’t knowR Refused
Q26. Could you tell me your postcode?1. ____X Don’t knowR Refused
Q27. Do you have more than one telephone number in your household?1. Yes2. No → END OF MODULEX Don’t know → END OF MODULER Refused → END OF MODULE
Q28. How many residential telephone numbers do you have? Do not include mobile phone numbers,dedicated fax numbers or modems. 1. _____ number of phone numbersX Don’t knowR Refused
DiabetesQ1. Have you ever been told by a doctor or hospital you have diabetes?1. Yes [IF FEMALE → Q3; IF MALE → Q5]2. No3. Only during pregnancy → END OF MODULEX Don’t knowR Refused
Q2. Have you ever been told by a doctor or hospital you have high blood glucose?1. Yes [IF FEMALE → Q3; IF MALE → Q6]2. No → END OF MODULE3. Borderline → [IF FEMALE → Q3; IF MALE → Q6]4. Only during pregnancy → END OF MODULEX Don’t know → END OF MODULER Refused → END OF MODULE
Q3. Were you pregnant when you were told you had diabetes or high blood glucose?1. Yes2. No → Q5X Don’t know → Q5R Refused → Q5
Q4. Have you ever had diabetes or high blood glucose apart from when you were pregnant?1. Yes2. No → END OF MODULEX Don’t knowR Refused
Q5. How old were you when you were first told you had diabetes or high blood glucose? [If ongoingdiabetes since pregnancy, then age of diagnosis during pregnancy]1. _______ yearsX Don’t knowR Refused
410
WARNIN
G: Esti
mates o
ut of
date.
Please
chec
k Hea
lthStat
s NSW
for la
test e
stimate
s.
Q6. What are you doing now to manage your diabetes or high blood glucose? [MULTIPLE RESPONSE]1. Having insulin injections 2. On tablets for diabetes or high blood glucose3. Following a special diet4. Losing weight5. Exercising most days6. Other [SPECIFY] _________7. Not doing anythingX Don’t knowR Refused
Emergency department presentationsQ1. In the last 12 months, have you attended a hospital emergency department (or casualty) for yourown medical care?1. Yes2. No → END OF MODULEX Don’t know → END OF MODULER Refused → END OF MODULE
Q2. Overall, what do you think of the care you received at this emergency department?1. Excellent → END OF MODULE2. Very good → END OF MODULE3. Good → END OF MODULE4. Fair5. PoorX Don’t know → END OF MODULER Refused → END OF MODULE
Q3. Could you briefly describe why you rated the care you received as fair or poor?1. [SPECIFY] ___________________X Don’t knowR Refused
Environmental healthQ1. What is your normal source of drinking water?1. Public water supply2. Bottled water3. Rainwater4. Private bore, spring, or well5. Other private supply [for example, creek or farm dam]6. Combination of different water sources7. Other [SPECIFY] ___________________X Don’t knowR Refused
Q2. Do you treat your water before drinking? [IF YES, HOW?]1. No2. Sometimes3. Yes: boiling4. Yes: filtering5. Yes: boil and filter6. Yes: other [SPECIFY] ______________X Don’t knowR Refused
411
WARNIN
G: Esti
mates o
ut of
date.
Please
chec
k Hea
lthStat
s NSW
for la
test e
stimate
s.
Q3. What is the usual way you heat the living areas of your home [READ OUT]?1. A gas heater with flue (a pipe or vent to the outside)2. A gas heater without a flue3. An electric space heater (this includes oil column heaters)4. Reverse cycle air conditioning5. Slow burning combustion heater6. An open fireplace7. A kerosene heater8. Other [SPECIFY] ___________________X Don’t knowR Refused
Food handlingQ1. Thinking about the last time you prepared raw meat or chicken when cooking, after preparing it didyou [READ OUT]1. Wipe your hands or rinse them WITHOUT using soap2. Wash your hands with soap3. Continue cooking without cleaning your hands4. Don’t handle raw meat or don’t cookX Don’t knowR Refused
Health service use and accessQ1. In the last 12 months have you attended any of the following services? [MULTIPLE RESPONSE]1. Stayed at least one night in hospital2. A hospital emergency department3. A government run community health centre4. A government run public dental service or dental hospital5. Did not attend any of these servicesX Don’t knowR Refused
Q2. Do you have any difficulties getting health care when you need it?1. Yes2. No → Q43. Don’t need health care → Q4X Don’t know → Q4R Refused → Q4
Q3. Please describe the difficulties you have.1. Comments __________________________
Q4. Do you have any comments on the health services in your local area?1. Comments __________________________
Q5. Apart from Medicare, are you covered by private health insurance?1. Yes2. NoX Don’t knowR Refused
Q6. In the last 12 months have you had a medical problem but avoided seeing a doctor because of thecost of medicine that may be prescribed?1. Yes2. NoX Don’t knowR Refused
412
WARNIN
G: Esti
mates o
ut of
date.
Please
chec
k Hea
lthStat
s NSW
for la
test e
stimate
s.
Q7. Have you ever not collected, stopped using, or cut down the dose of, a medicine prescribed byyour doctor because of the cost?1. Yes2. NoX Don’t knowR Refused
Q8. Do you purchase your prescription medicines using a health care card, seniors card, veteranscard, or similar?1. Yes2. NoX Don’t knowR Refused
Hospital admissionsQ1. In the last 12 months, have you stayed for at least one night in hospital?1. Yes2. No → END OF MODULEX Dont know → END OF MODULER Refused → END OF MODULE
Q2. Overall, what do you think of the care you received at this hospital? [READ OUT]1. Excellent → END OF MODULE2. Very good → END OF MODULE3. Good → END OF MODULE4. Fair5. PoorX Don’t know → END OF MODULER Refused → END OF MODULE
Q3. Could you briefly describe why you rated the care you received as fair or poor?1. [SPECIFY] ___________________X Don’t knowR Refused
ImmunisationQ1. Were you vaccinated against flu in the past 12 months? [ASK IF OVER 50 YEARS]1. Yes 2. No X Don’t knowR Refused
Q2. When were you last vaccinated against pneumonia? [ASK IF OVER 50 YEARS]1. Within the last 12 months2. 12 months to 5 years ago3. More than 5 years ago4. Never vaccinated → END OF MODULEX Don’t know → END OF MODULER Refused → END OF MODULE
Q3. Since January 2005 have you been vaccinated against meningococcal C disease? [ASK IF 16-19 YEARS]1. Yes2. No → END OF MODULEX Don’t know → END OF MODULER Refused → END OF MODULE
413
WARNIN
G: Esti
mates o
ut of
date.
Please
chec
k Hea
lthStat
s NSW
for la
test e
stimate
s.

Q4. Where did you receive the vaccination? [ASK IF 16-19 YEARS]1. General practitioner2. Local council3. Community health centre4. School clinic5. Other [SPECIFY] _____________X Don’t knowR Refused
IncontinenceQ1. In the last 4 weeks, how often have you had a urine leak when you were physically active, exertedyourself, or coughed or sneezed during the day or night? [READ OUT]1. Most of the time2. Some of the time3. None of the timeX Don’t knowR Refused
InjuryQ1. In the last 12 months have you had a fall?1. Yes2. No → Q5X Don’t know → Q5R Refused → Q5
Q2. How many times did you fall in the last 12 months? 1. [SPECIFY] ________________________X Don’t know R Refused
Q3. In the last 12 months have you had a fall that required medical treatment for injuries?1. Yes2. No → Q5X Don’t know → Q5R Refused → Q5
Q4. Were you admitted to hospital as a result of any of your falls in the last 12 months?1. Yes2. No → Q5X Don’t know → Q5R Refused → Q5
Q5. Have you made any changes to your home or lifestyle to prevent you from falling?1. Yes2. NoX Don’t knowR Refused
Q6. What did you do? [MULTIPLE RESPONSE]1. Got more exercise2. Had eyes checked3. Changed my footwear4. Changed my medications5. Installed handrails6. Replaced steps with ramps7. Removed clutter from my house8. Removed mats or rugs9. Removed loose cords or appliance leads
414
WARNIN
G: Esti
mates o
ut of
date.
Please
chec
k Hea
lthStat
s NSW
for la
test e
stimate
s.
10. Got a personal alarm11. Improved the lighting12. Repaired unsafe or unsteady furniture13. Other _______________________[SPECIFY]X Don’t knowR Refused
Q7. Are you afraid of falling?1. Yes2. NoX Don’t knowR Refused
Injury preventionQ1. Do you have smoke alarms installed in your home?1. Yes2. No → Q8X Don’t know → Q8R Refused → Q8
Q2. Are they hard wired or battery operated?1. Hard wired2. Battery operated3. Hard wired and battery operatedX Don’t knowR Refused
Q3. When did you last test the battery operated smoke alarms? [READ OUT]1. Within the last month2. More than a month but less than 6 months ago3. Six months to a year ago4. More than a year ago5. Never tested6. No battery currently in alarmX Don’t knowR Refused
Q4. When did you last change the battery in your smoke alarms?1. Within the last 3 months2. More than 3 months but less than a year ago3. More than a year ago4. Never changed the batteryX Don’t knowR Refused
Q5. When did you last test the hard wired smoke alarms?1. Within the last month2. More than a month but less than 6 months ago3. Six months to a year ago4. More than a year ago5. Never testedX Don’t knowR Refused
Q6. How many battery operated smoke alarms do you have?1. ______ [SPECIFY]X Don’t knowR Refused
415
WARNIN
G: Esti
mates o
ut of
date.
Please
chec
k Hea
lthStat
s NSW
for la
test e
stimate
s.

Q7. How many hard wired smoke alarms do you have?1. ______ [SPECIFY]X Don’t knowR Refused
Q8. Have you had a fire in your home in the last 12 months? 1. Yes2. No → Q13X Don’t know → Q13R Refused → Q13
Q9. Does your household have a written home escape plan?1. Yes2. Have a plan but it’s not written down3. No → Q10X Don’t know → Q10R Refused → Q10
Q10. When did your household last practice your home escape plan? 1. Within the last month2. More than a month but less than 6 months ago3. Six months to a year ago4. More than a year ago5. Never practiced the planX Don’t knowR Refused
Q11. Have you been in or on the water, at a swimming pool, beach, lake, river, creek, stream or damin the last 4 weeks? This includes fishing.1. Yes 2. No → END OF MODULEX Don’t know → END OF MODULER Refused → END OF MODULE
Q12. Did this include swimming, fishing, rock fishing, snorkelling or scuba diving?1. Yes, swimming2. Yes, fishing3. Yes, rock fishing4. Yes, snorkelling5. Yes, scuba diving6. Yes, other7. NoX Don’t know> R Refused
Q13. How would you rate your swimming ability?1. Very strong swimmer2. Good swimmer3. Average swimmer4. Poor swimmer5. Can’t swimX Don’t knowR Refused
Mental healthQ1. In the past 4 weeks, about how often did you feel tired out for no good reason? [READ OUT]1. All of the time2. Most of the time3. Some of the time4. A little of the time
416
WARNIN
G: Esti
mates o
ut of
date.
Please
chec
k Hea
lthStat
s NSW
for la
test e
stimate
s.
5. None of the timeX Don’t knowR Refused
Q2. In the past 4 weeks, about how often did you feel nervous? [READ OUT]1. All of the time2. Most of the time3. Some of the time4. A little of the time5. None of the time → Q4X Don’t know → Q4R Refused → Q4
Q3. In the past 4 weeks, about how often did you feel so nervous that nothing could calm you down?[READ OUT]1. All of the time2. Most of the time3. Some of the time4. A little of the time5. None of the timeX Don’t knowR Refused
Q4. In the past 4 weeks, about how often did you feel hopeless? [READ OUT]1. All of the time2. Most of the time3. Some of the time4. A little of the time5. None of the timeX Don’t knowR Refused
Q5. In the past 4 weeks, about how often did you feel restless or fidgety? [READ OUT]1. All of the time2. Most of the time3. Some of the time4. A little of the time5. None of the time → Q7X Don’t know → Q7R Refused → Q7
Q6. In the past 4 weeks, about how often did you feel so restless you could not sit still? [READ OUT]1. All of the time2. Most of the time3. Some of the time4. A little of the time5. None of the timeX Don’t knowR Refused
Q7. In the past 4 weeks, about how often did you feel depressed? [READ OUT]1. All of the time2. Most of the time3. Some of the time4. A little of the time5. None of the timeX Don’t knowR Refused
417
WARNIN
G: Esti
mates o
ut of
date.
Please
chec
k Hea
lthStat
s NSW
for la
test e
stimate
s.
Q8. In the past 4 weeks, about how often did you feel that everything was an effort? [READ OUT]1. All of the time2. Most of the time3. Some of the time4. A little of the time5. None of the timeX Don’t knowR Refused
Q9. In the past 4 weeks, about how often did you feel so sad that nothing could cheer you up? [READ OUT]1. All of the time2. Most of the time3. Some of the time4. A little of the time5. None of the timeX Don’t knowR Refused
Q10. In the past 4 weeks, about how often did you feel worthless? [READ OUT]1. All of the time2. Most of the time3. Some of the time4. A little of the time5. None of the timeX Don’t knowR Refused
Q11. In the last 4 weeks, how many days were you totally unable to work, study or manage yourday-to-day activities because of these feelings?1. ________ number of daysX Don’t knowR Refused
Q12. Aside from [that day–those days], in the last 4 weeks, how many days were you able to work,study or manage your day-to-day activities, but had to cut down on what you did because of these feelings?1. ________ number of daysX Don’t knowR Refused
Q13. In the last 4 weeks, how many times have you seen a doctor or other health professional aboutthese feelings?1. ________ number of consultationsX Don’t knowR Refused
Q14. In the last 4 weeks, how often have physical health problems been the main cause of thesefeelings? [READ OUT]1. All of the time2. Most of the time3. Some of the time4. A little of the time5. None of the timeX Don’t knowR Refused
418
WARNIN
G: Esti
mates o
ut of
date.
Please
chec
k Hea
lthStat
s NSW
for la
test e
stimate
s.
Nutrition Q1. How many serves of fruit do you usually eat each day? [one serve = one medium piece or 2 smallpieces of fruit or one cup of diced pieces]1. ________ serves per day2. ________ serves per week3. Don’t eat fruitX Don’t know R Refused
Q2. How many serves of fruit do you think you should eat each day to be healthy?1. ________ serves per dayX Don’t know R Refused
Q3. How many serves of vegetables do you usually eat each day? [one serve = 1/2 cup cooked or onecup of salad vegetables]1. ________ serves per day2. ________ serves per week3. Don’t eat vegetablesX Don’t know R Refused
Q4. How many serves of vegetables do you think you should eat each day to be healthy?1. ________ serves per dayX Don’t know R Refused
Q5. How often do you usually eat bread? [Include bread rolls, flat breads, crumpets, bagels, English orbread-type muffins.]1. ________ times per day2. ________ times per week3. ________ times per month4. Rarely or neverX Don’t know R Refused
Q6. How often do you usually eat breakfast cereal? [Ready made, home made or cooked]1. ________ times per day2. ________ times per week3. ________ times per month4. Rarely or neverX Don’t know R Refused
Q7. How often do you eat pasta, rice, noodles or other cooked cereals (not including cooked breakfast cereals)?1. ________ times per day2. ________ times per week3. ________ times per month4. Rarely or neverX Don’t know R Refused
Q8. What type of milk do you usually have?1. Regular milk (whole or full cream)2. Low- or reduced-fat milk3. Skim milk4. Evaporated or sweetened milk5. Other [SPECIFY] ________6. Don’t have milkX Don’t knowR Refused
419
WARNIN
G: Esti
mates o
ut of
date.
Please
chec
k Hea
lthStat
s NSW
for la
test e
stimate
s.
Q9. How often do you eat processed meat products such as sausages, frankfurts, devon, salami, meatpies, bacon or ham?1. ________ times per day2. ________ times per week3. ________ times per month4. Rarely or neverX Don’t knowR Refused
Q10. How often do you eat hot chips, french fries, wedges, or fried potatoes?1. ________ times per day2. ________ times per week3. ________ times per month4. Rarely or neverX Don’t knowR Refused
Q11. How often do you eat potato crisps or other salty snacks (such as twisties or corn chips)?1. ________ times per day2. ________ times per week3. ________ times per month4. Rarely or neverX Don’t knowR Refused
Q12. How many cups of soft drink, cordials or sports drink do you usually drink in a day?1. ________ cups per day2. ________ cups per week3. Doesn’t drink soft drinkX Don’t know R Refused
Q13. How often do you have meals or snacks such as burgers, pizza, chicken or chips from take-away places?1. ________ times per week2. ________ times per month3. Rarely or neverX Don’t know R Refused
Q14. In the last 12 months, were there any times that you ran out of food and couldn’t afford to buy more?1. Yes2. NoX Don’t knowR Refused
Oral healthQ1. Are any of your natural teeth missing?1. Yes: have some natural teeth missing2. Yes: have all natural teeth missing3. No: have no natural teeth missing → Q3X Don’t know → Q3R Refused → Q3
Q2. Do you have dentures or false teeth?1. Yes2. NoX Don’t knowR Refused
420
WARNIN
G: Esti
mates o
ut of
date.
Please
chec
k Hea
lthStat
s NSW
for la
test e
stimate
s.
Q3. When did you last visit a dental professional about your teeth, dentures or gums? [A dentalprofessional includes dentist, dental specialist, dental hygienist, dental technician, dental mechanic,denturist or dental therapist.] [READ OUT]1. Less than 12 months ago 2. One year to less than 2 years ago → Q43. Two to less than 5 years ago → Q44. Five to less than 10 years ago → Q45. Ten years ago or more → Q46. Never → Q4X Don’t know → Q4R Refused → Q4
Q4. What are the main reasons for you not visiting the dentist in the last 12 months? [MULTIPLE RESPONSE]1. Respondent has dentures2. Worried or afraid of going; don’t like going3. Don’t need to4. Hard to find time5. Can’t find a dentist I like6. Too expensive7. Too far to go8. Long waiting lists9. Dentist has moved or retired10. Other [SPECIFY] _______________X Don’t knowR Refused
Q5. Has fluoride been added to your public water supply?1. Yes2. NoX Don’t knowR Refused
Q6. Do you agree with adding fluoride to your public water supply to prevent tooth decay?1. Yes2. NoX Don’t knowR Refused
Q7. Would you be in favour of adding fluoride to your public water supply to prevent tooth decay?[READ OUT]1. In children2. In adults3. Both adults and children4. NeitherX Don’t know R Refused
Q8. Where have you received information about water fluoridation? [READ OUT]1. Newspapers2. Magazines3. Television4. Radio5. Advertisements for dental products6. Health authorities7. Dentists8. Dental auxiliaries9. Have not received information about water fluoridation10. Other [SPECIFY] _______________X Don’t know R Refused
421
WARNIN
G: Esti
mates o
ut of
date.
Please
chec
k Hea
lthStat
s NSW
for la
test e
stimate
s.
Q9. Who should decide on the fluoridation of water supplies? [READ OUT]1. State government2. Health authorities3. Dental associations4. Water boards5. Community6. Other [SPECIFY] _______________X Don’t know R Refused
Overweight and obesityQ1. How tall are you without shoes?1. ________ centimetresX Don’t know R Refused
[OR]
1. ________ feet ________ inchesX Don’t know R Refused
Q2. How much do you weigh without clothes or shoes?1. ________ kilogramsX Don’t know R Refused
[OR]
1. ________ stones ________ lbsX Don’t know R Refused
Physical activityQ1. In the last week, how many times have you walked continuously for at least 10 minutes forrecreation or exercise or to get to or from places?1. _______ number of times [If = 0 → Q3]X Don’t know → Q3R Refused → Q3
Q2. What do you estimate was the total time you spent walking in this way in the last week? [In hoursand minutes]1. ________ hours ________ minutesX Don’t knowR Refused
Q3. The next question excludes household chores or gardening. In the last week, how many times didyou do any vigorous physical activity which made you breathe harder or puff and pant?1. ________ number of times [If = 0 → Q5]X Don’t know → Q5R Refused → Q5
Q4. What do you estimate was the total time you spent doing this vigorous physical activity in the lastweek? [In hours and minutes]1. ________ hours ________ minutesX Don’t knowR Refused
422
WARNIN
G: Esti
mates o
ut of
date.
Please
chec
k Hea
lthStat
s NSW
for la
test e
stimate
s.
Q5. This next question does not include household chores or gardening. In the last week, how manytimes did you do any other more moderate physical activity that you haven’t already mentioned?1. ________ number of times [If = 0 → Q7]X Don’t know → Q7R Refused → Q7
Q6. What do you estimate was the total time that you spent doing these activities in the last week? [Inhours and minutes]1. ________ hours ________ minutes X Don’t knowR Refused
Q7. How do you usually get to work?1. Train2. Bicycle3. Walk only4. Walk part of the way5. Bus6. Ferry7. Train8. Tram (including light rail)9. Taxi10. Car (as driver)11. Car (as passenger)12. Truck13. Motor bike or motor scooter14. OtherX Don’t knowR Refused
Q8. Does your neighbourhood have any of the following facilities:1. Sporting fields2. Public swimming pools3. Parks or reserves4. Footpaths5. Bike paths6. OtherX Don’t knowR Refused
Q9. How often do you use these facilities [ask for each facility]?1. ________ times per day2. ________ times per week3. ________ times per month4. Rarely or neverX Don’t knowR Refused
Public dental servicesQ1. In the last 12 months have you attended a public (government-run) dental service or dental hospital?1. Yes2. NoX Dont knowR Refused
Q2. Overall, what do you think of the care you received at this public dental service or dental hospital?1. Excellent → END OF MODULE2. Very good → END OF MODULE3. Good → END OF MODULE
423
WARNIN
G: Esti
mates o
ut of
date.
Please
chec
k Hea
lthStat
s NSW
for la
test e
stimate
s.
4. Fair5. PoorX Don’t know → END OF MODULER Refused → END OF MODULE
Q3. Could you briefly describe why you rated the care you received as fair or poor?1. [SPECIFY] ___________________X Don’t knowR Refused
Self-rated health statusQ1. Overall, how would you rate your health during the past 4 weeks? [READ OUT]1. Excellent2. Very good3. Good4. Fair5. Poor6. Very poorX Don’t knowR Refused
SmokingQ1. Which of the following best describes your smoking status? This includes cigarettes, cigars andpipes. [READ OUT]1. I smoke daily2. I smoke occasionally3. I don’t smoke now, but I used to → Q34. I’ve tried it a few times but never smoked regularly → Q35. I’ve never smoked → Q3X Don’t know → Q3R Refused → Q3
Q2. The last time you went to your general practitioner, did the doctor discuss your smoking andadvise you to quit smoking?1. Yes2. NoX Don’t knowR Refused
Q3. Which of the following best describes your home situation? [READ OUT]1. My home is smoke-free (includes smoking is allowed outside only)2. People occasionally smoke in the house3. People frequently smoke in the houseX Don’t knowR Refused
Q4. Are people allowed to smoke in your car?1. Yes2. No3. Don’t have a carX Don’t knowR Refused
Q5. If there was a total ban on smoking in hotels and licensed bars, would you be likely to go there:[READ OUT]1. More often?2. Less often?3. It would make no difference
424
WARNIN
G: Esti
mates o
ut of
date.
Please
chec
k Hea
lthStat
s NSW
for la
test e
stimate
s.

X Don’t knowR Refused
Q6. If there was a total ban on smoking in outdoor dining areas, would you be likely to go there:[READ OUT]1. More often?2. Less often?3. It would make no differenceX Don’t knowR Refused
Social capitalQ1. In the past 3 months, how often have you helped out any local group or organisation such as aschool, scouts and brownies, a sporting club, or hospital as a volunteer, or other organisation? [READ OUT]1. About once a week2. Once every 2 to 3 weeks3. Once a month4. Not at allX Don’t knowR Refused
Q2. In the past 6 months, how often have you attended a local community event such as a church orschool fete, school concert, or a street fair? [READ OUT]1. Three times or more2. Twice3. Once4. NeverX Don’t knowR Refused
Q3. Are you an active member of a local organisation, church or club, such as a sport, craft, or socialclub? [READ OUT]1. Yes: very active2. Yes: somewhat active3. Yes: a little active4. No: not an active memberX Don’t knowR Refused
Q4. How often have you visited someone in your neighbourhood in the past week? [READ OUT]1. Frequently2. A few times3. At least once4. Never (in the last week)X Don’t knowR Refused
Q5. When you go shopping in your local area how often are you likely to run into friends andacquaintances? [READ OUT]1. Nearly always2. Most of the time3. Some of the time4. Rarely or neverX Don’t knowR Refused
Q6. Would you be sad if you had to leave this neighbourhood?1. Yes2. No
425
WARNIN
G: Esti
mates o
ut of
date.
Please
chec
k Hea
lthStat
s NSW
for la
test e
stimate
s.
X Don’t knowR Refused
Q7. Most people can be trusted. Do you agree or disagree?1. Strongly agree2. Agree3. Disagree4. Strongly disagreeX Don’t knowR Refused
Q8. Can you please tell me if you agree or disagree with these statements. I feel safe walking downmy street after dark. Do you agree or disagree?1. Strongly agree2. Agree3. Disagree4. Strongly disagreeX Don’t knowR Refused
Q9. My area has a reputation for being a safe place. Do you agree or disagree?1. Strongly agree2. Agree3. Disagree4. Strongly disagreeX Don’t knowR Refused
426
WARNIN
G: Esti
mates o
ut of
date.
Please
chec
k Hea
lthStat
s NSW
for la
test e
stimate
s.