Embed Size (px)
Citation preview
– 95 –
Japan Hardcopy 2005
Introduction
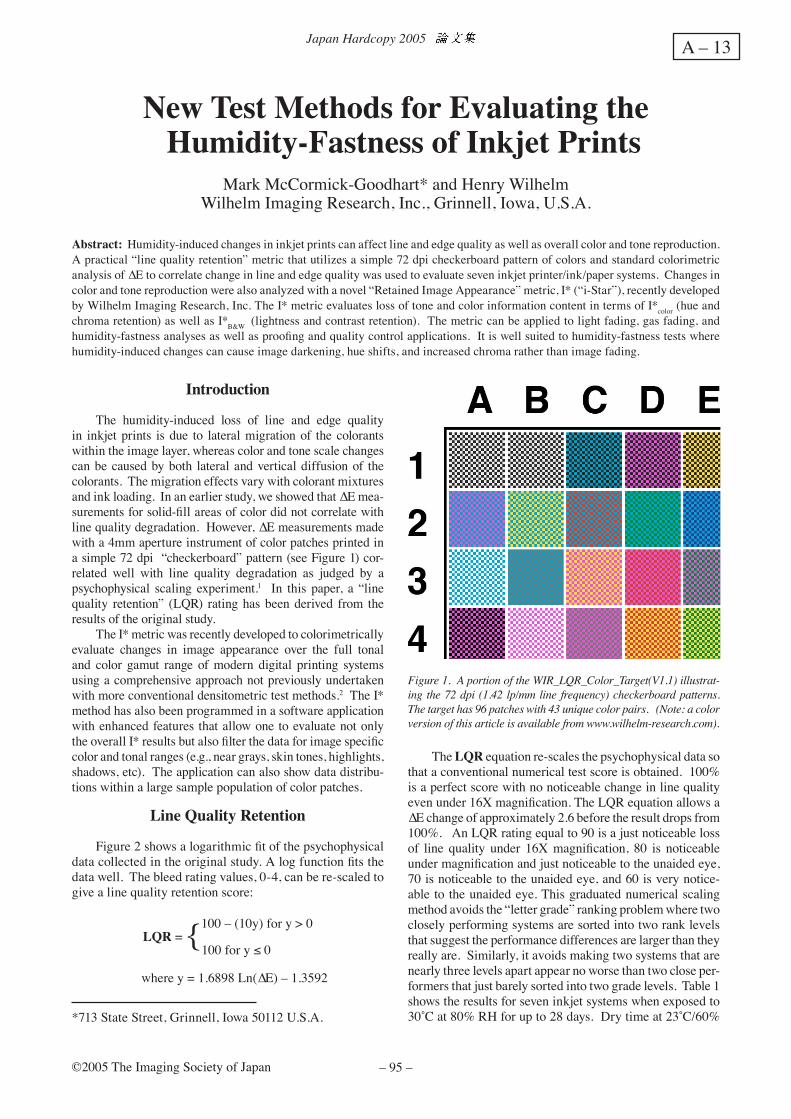
The humidity-induced loss of line and edge quality in inkjet prints is due to lateral migration of the colorants within the image layer, whereas color and tone scale changes can be caused by both lateral and vertical diffusion of the colorants. The migration effects vary with colorant mixtures and ink loading. In an earlier study, we showed that ∆E mea-surements for solid-fill areas of color did not correlate with line quality degradation. However, ∆E measurements made with a 4mm aperture instrument of color patches printed in a simple 72 dpi “checkerboard” pattern (see Figure 1) cor-related well with line quality degradation as judged by a psychophysical scaling experiment.1 In this paper, a “line quality retention” (LQR) rating has been derived from the results of the original study. The I* metric was recently developed to colorimetrically evaluate changes in image appearance over the full tonal and color gamut range of modern digital printing systems using a comprehensive approach not previously undertaken with more conventional densitometric test methods.2 The I* method has also been programmed in a software application with enhanced features that allow one to evaluate not only the overall I* results but also filter the data for image specific color and tonal ranges (e.g., near grays, skin tones, highlights, shadows, etc). The application can also show data distribu-tions within a large sample population of color patches.
Line Quality Retention
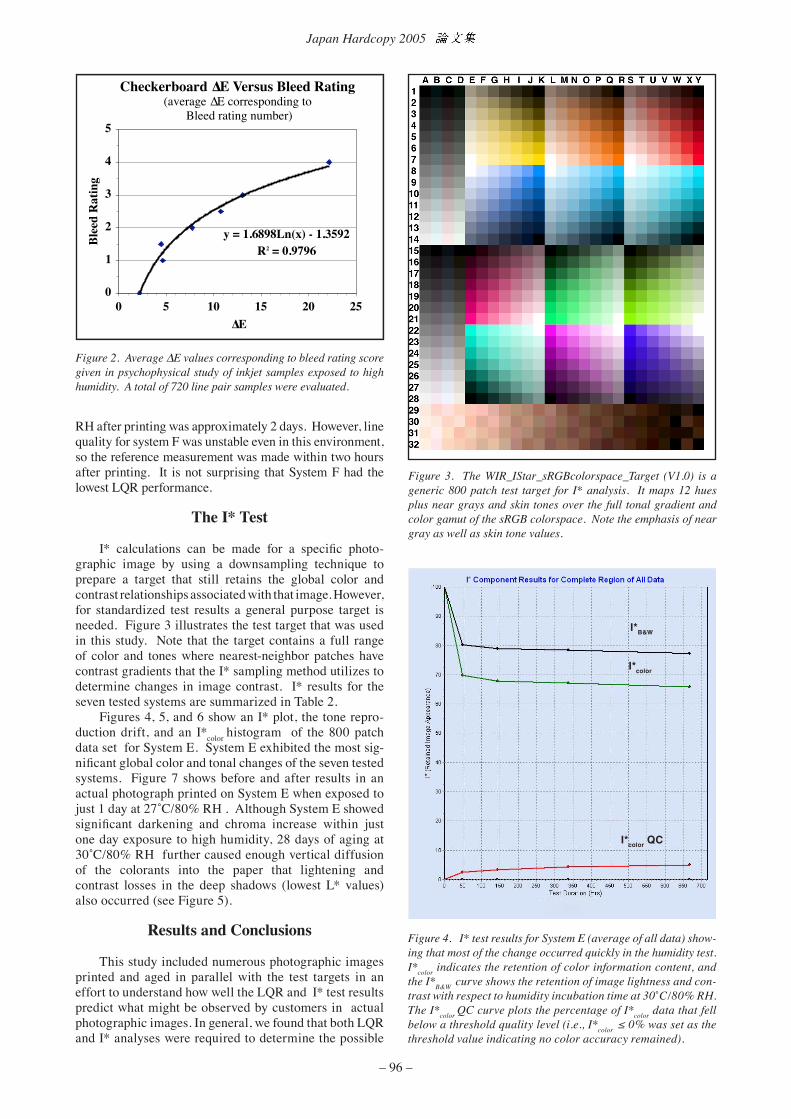
Figure 2 shows a logarithmic fit of the psychophysical data collected in the original study. A log function fits the data well. The bleed rating values, 0-4, can be re-scaled to give a line quality retention score:
New Test Methods for Evaluating the Humidity-Fastness of Inkjet Prints
Mark McCormick-Goodhart* and Henry WilhelmWilhelm Imaging Research, Inc., Grinnell, Iowa, U.S.A.
The LQR equation re-scales the psychophysical data so that a conventional numerical test score is obtained. 100% is a perfect score with no noticeable change in line quality even under 16X magnification. The LQR equation allows a ∆E change of approximately 2.6 before the result drops from 100%. An LQR rating equal to 90 is a just noticeable loss of line quality under 16X magnification, 80 is noticeable under magnification and just noticeable to the unaided eye, 70 is noticeable to the unaided eye, and 60 is very notice-able to the unaided eye. This graduated numerical scaling method avoids the “letter grade” ranking problem where two closely performing systems are sorted into two rank levels that suggest the performance differences are larger than they really are. Similarly, it avoids making two systems that are nearly three levels apart appear no worse than two close per-formers that just barely sorted into two grade levels. Table 1 shows the results for seven inkjet systems when exposed to 30˚C at 80% RH for up to 28 days. Dry time at 23˚C/60%
Figure 1. A portion of the WIR_LQR_Color_Target(V1.1) illustrat-ing the 72 dpi (1.42 lp/mm line frequency) checkerboard patterns. The target has 96 patches with 43 unique color pairs. (Note: a color version of this article is available from www.wilhelm-research.com).
Abstract: Humidity-induced changes in inkjet prints can affect line and edge quality as well as overall color and tone reproduction. A practical “line quality retention” metric that utilizes a simple 72 dpi checkerboard pattern of colors and standard colorimetric analysis of ∆E to correlate change in line and edge quality was used to evaluate seven inkjet printer/ink/paper systems. Changes in color and tone reproduction were also analyzed with a novel “Retained Image Appearance” metric, I* (“i-Star”), recently developed by Wilhelm Imaging Research, Inc. The I* metric evaluates loss of tone and color information content in terms of I*color (hue and chroma retention) as well as I*B&W (lightness and contrast retention). The metric can be applied to light fading, gas fading, and humidity-fastness analyses as well as proofing and quality control applications. It is well suited to humidity-fastness tests where humidity-induced changes can cause image darkening, hue shifts, and increased chroma rather than image fading.
*713 State Street, Grinnell, Iowa 50112 U.S.A.
LQR = {100 – (10y) for y > 0
100 for y ≤ 0
where y = 1.6898 Ln(∆E) – 1.3592
©2005 The Imaging Society of Japan
A – 13
– 96 –
Japan Hardcopy 2005
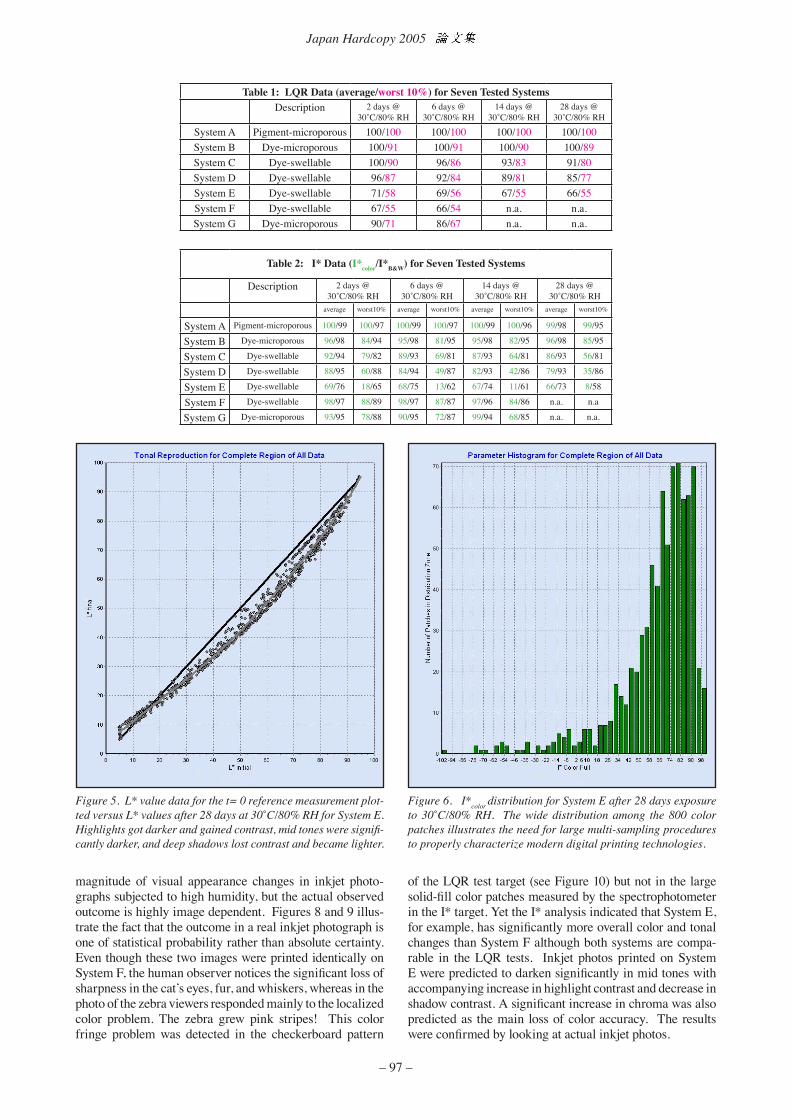
Figure 3. The WIR_IStar_sRGBcolorspace_Target (V1.0) is a generic 800 patch test target for I* analysis. It maps 12 hues plus near grays and skin tones over the full tonal gradient and color gamut of the sRGB colorspace. Note the emphasis of near gray as well as skin tone values.
RH after printing was approximately 2 days. However, line quality for system F was unstable even in this environment, so the reference measurement was made within two hours after printing. It is not surprising that System F had the lowest LQR performance.
The I* Test
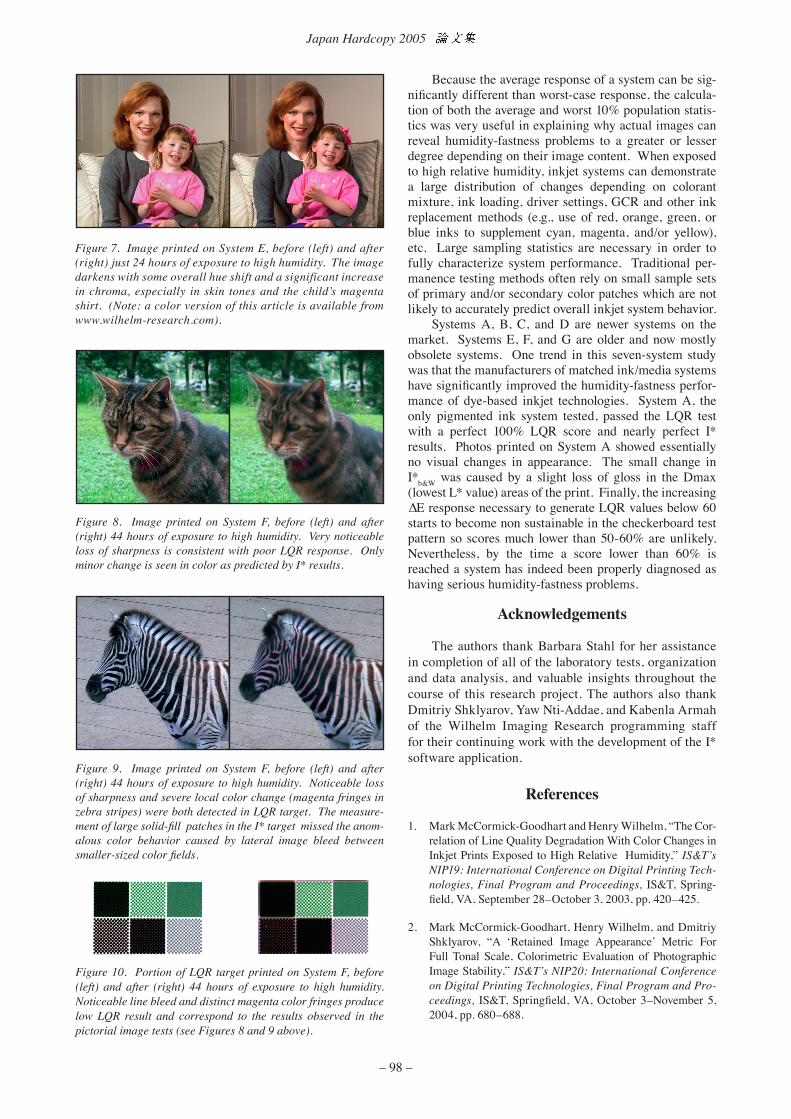
I* calculations can be made for a specific photo-graphic image by using a downsampling technique to prepare a target that still retains the global color and contrast relationships associated with that image. However, for standardized test results a general purpose target is needed. Figure 3 illustrates the test target that was used in this study. Note that the target contains a full range of color and tones where nearest-neighbor patches have contrast gradients that the I* sampling method utilizes to determine changes in image contrast. I* results for the seven tested systems are summarized in Table 2. Figures 4, 5, and 6 show an I* plot, the tone repro-duction drift, and an I*color histogram of the 800 patch data set for System E. System E exhibited the most sig-nificant global color and tonal changes of the seven tested systems. Figure 7 shows before and after results in an actual photograph printed on System E when exposed to just 1 day at 27˚C/80% RH . Although System E showed significant darkening and chroma increase within just one day exposure to high humidity, 28 days of aging at 30˚C/80% RH further caused enough vertical diffusion of the colorants into the paper that lightening and contrast losses in the deep shadows (lowest L* values) also occurred (see Figure 5).
Results and Conclusions
This study included numerous photographic images printed and aged in parallel with the test targets in an effort to understand how well the LQR and I* test results predict what might be observed by customers in actual photographic images. In general, we found that both LQR and I* analyses were required to determine the possible
Figure 4. I* test results for System E (average of all data) show-ing that most of the change occurred quickly in the humidity test. I*color indicates the retention of color information content, and the I*B&W curve shows the retention of image lightness and con-trast with respect to humidity incubation time at 30˚C/80% RH. The I*color QC curve plots the percentage of I*color data that fell below a threshold quality level (i.e., I*color ≤ 0% was set as the threshold value indicating no color accuracy remained).
������������ �� ��������������������������� �������������������
���������������������
������������������������
�����������
�
�
�
�
�
�
� � �� �� �� ��
��
���
����
���
��
Figure 2. Average ∆E values corresponding to bleed rating score given in psychophysical study of inkjet samples exposed to high humidity. A total of 720 line pair samples were evaluated.
I*B&W
I*color
I*color QC
– 97 –
Japan Hardcopy 2005
Table 1: LQR Data (average/worst 10%) for Seven Tested SystemsDescription 2 days @
30˚C/80% RH6 days @
30˚C/80% RH14 days @
30˚C/80% RH28 days @
30˚C/80% RH
System A Pigment-microporous 100/100 100/100 100/100 100/100System B Dye-microporous 100/91 100/91 100/90 100/89System C Dye-swellable 100/90 96/86 93/83 91/80System D Dye-swellable 96/87 92/84 89/81 85/77System E Dye-swellable 71/58 69/56 67/55 66/55System F Dye-swellable 67/55 66/54 n.a. n.a.System G Dye-microporous 90/71 86/67 n.a. n.a.
Table 2: I* Data (I*color/I*B&W) for Seven Tested Systems
Description 2 days @ 30˚C/80% RH
6 days @ 30˚C/80% RH
14 days @ 30˚C/80% RH
28 days @ 30˚C/80% RH
average worst10% average worst10% average worst10% average worst10%
System A Pigment-microporous 100/99 100/97 100/99 100/97 100/99 100/96 99/98 99/95
System B Dye-microporous 96/98 84/94 95/98 81/95 95/98 82/95 96/98 85/95
System C Dye-swellable 92/94 79/82 89/93 69/81 87/93 64/81 86/93 56/81
System D Dye-swellable 88/95 60/88 84/94 49/87 82/93 42/86 79/93 35/86
System E Dye-swellable 69/76 18/65 68/75 13/62 67/74 11/61 66/73 8/58
System F Dye-swellable 98/97 88/89 98/97 87/87 97/96 84/86 n.a. n.a
System G Dye-microporous 93/95 78/88 90/95 72/87 99/94 68/85 n.a. n.a.
Figure 5. L* value data for the t= 0 reference measurement plot-ted versus L* values after 28 days at 30˚C/80% RH for System E. Highlights got darker and gained contrast, mid tones were signifi-cantly darker, and deep shadows lost contrast and became lighter.
Figure 6. I*color distribution for System E after 28 days exposure to 30˚C/80% RH. The wide distribution among the 800 color patches illustrates the need for large multi-sampling procedures to properly characterize modern digital printing technologies.
of the LQR test target (see Figure 10) but not in the large solid-fill color patches measured by the spectrophotometer in the I* target. Yet the I* analysis indicated that System E, for example, has significantly more overall color and tonal changes than System F although both systems are compa-rable in the LQR tests. Inkjet photos printed on System E were predicted to darken significantly in mid tones with accompanying increase in highlight contrast and decrease in shadow contrast. A significant increase in chroma was also predicted as the main loss of color accuracy. The results were confirmed by looking at actual inkjet photos.
magnitude of visual appearance changes in inkjet photo-graphs subjected to high humidity, but the actual observed outcome is highly image dependent. Figures 8 and 9 illus-trate the fact that the outcome in a real inkjet photograph is one of statistical probability rather than absolute certainty. Even though these two images were printed identically on System F, the human observer notices the significant loss of sharpness in the cat’s eyes, fur, and whiskers, whereas in the photo of the zebra viewers responded mainly to the localized color problem. The zebra grew pink stripes! This color fringe problem was detected in the checkerboard pattern
– 98 –
Japan Hardcopy 2005
Figure 8. Image printed on System F, before (left) and after (right) 44 hours of exposure to high humidity. Very noticeable loss of sharpness is consistent with poor LQR response. Only minor change is seen in color as predicted by I* results.
Figure 9. Image printed on System F, before (left) and after (right) 44 hours of exposure to high humidity. Noticeable loss of sharpness and severe local color change (magenta fringes in zebra stripes) were both detected in LQR target. The measure-ment of large solid-fill patches in the I* target missed the anom-alous color behavior caused by lateral image bleed between smaller-sized color fields.
Figure 10. Portion of LQR target printed on System F, before (left) and after (right) 44 hours of exposure to high humidity. Noticeable line bleed and distinct magenta color fringes produce low LQR result and correspond to the results observed in the pictorial image tests (see Figures 8 and 9 above).
Because the average response of a system can be sig-nificantly different than worst-case response, the calcula-tion of both the average and worst 10% population statis-tics was very useful in explaining why actual images can reveal humidity-fastness problems to a greater or lesser degree depending on their image content. When exposed to high relative humidity, inkjet systems can demonstrate a large distribution of changes depending on colorant mixture, ink loading, driver settings, GCR and other ink replacement methods (e.g., use of red, orange, green, or blue inks to supplement cyan, magenta, and/or yellow), etc. Large sampling statistics are necessary in order to fully characterize system performance. Traditional per-manence testing methods often rely on small sample sets of primary and/or secondary color patches which are not likely to accurately predict overall inkjet system behavior. Systems A, B, C, and D are newer systems on the market. Systems E, F, and G are older and now mostly obsolete systems. One trend in this seven-system study was that the manufacturers of matched ink/media systems have significantly improved the humidity-fastness perfor-mance of dye-based inkjet technologies. System A, the only pigmented ink system tested, passed the LQR test with a perfect 100% LQR score and nearly perfect I* results. Photos printed on System A showed essentially no visual changes in appearance. The small change in I*b&W was caused by a slight loss of gloss in the Dmax (lowest L* value) areas of the print. Finally, the increasing ∆E response necessary to generate LQR values below 60 starts to become non sustainable in the checkerboard test pattern so scores much lower than 50-60% are unlikely. Nevertheless, by the time a score lower than 60% is reached a system has indeed been properly diagnosed as having serious humidity-fastness problems.
Acknowledgements
The authors thank Barbara Stahl for her assistance in completion of all of the laboratory tests, organization and data analysis, and valuable insights throughout the course of this research project. The authors also thank Dmitriy Shklyarov, Yaw Nti-Addae, and Kabenla Armah of the Wilhelm Imaging Research programming staff for their continuing work with the development of the I* software application.
References
1. Mark McCormick-Goodhart and Henry Wilhelm, “The Cor-relation of Line Quality Degradation With Color Changes in Inkjet Prints Exposed to High Relative Humidity,” IS&T’s NIP19: International Conference on Digital Printing Tech-nologies, Final Program and Proceedings, IS&T, Spring-field, VA, September 28–October 3, 2003, pp. 420–425.
2. Mark McCormick-Goodhart, Henry Wilhelm, and Dmitriy Shklyarov, “A ‘Retained Image Appearance’ Metric For Full Tonal Scale, Colorimetric Evaluation of Photographic Image Stability,” IS&T’s NIP20: International Conference on Digital Printing Technologies, Final Program and Pro-ceedings, IS&T, Springfield, VA, October 3–November 5, 2004, pp. 680–688.
Figure 7. Image printed on System E, before (left) and after (right) just 24 hours of exposure to high humidity. The image darkens with some overall hue shift and a significant increase in chroma, especially in skin tones and the child’s magenta shirt. (Note: a color version of this article is available from www.wilhelm-research.com).
Paper by Mark McCormick-Goodhart and Henry Wilhelm
(Wilhelm Imaging Research, Inc.) entitled:
New Test Methods for Evaluating theHumidity-Fastness of Inkjet Prints
Paper presented on June 9, 2005
Paper (monochrome, with no color) published on pages 95–98 in:
Proceedings
“Japan Hardcopy 2005”The Annual Conference of
the Imaging Society of Japan
ISSNN: 0916-8087
©2005 The Imaging Society of Japan
June 8–10, 2005Kokuyo HallTokyo, Japan
Published by:
The Imaging Society of JapanThe Secretariat
Tokyo Institute of Polytechnics2-9-5, Honcho, Nakano-ku, Tokyo 164-8678
JapanFax: +81-3-3372-4414
http://psi.mls.eng.osaka-u.ac.jp/~isj/isj(e).html
This
doc
umen
t orig
inat
ed a
t <w
ww
.wilh
elm
-res
earc
h.co
m>
File
nam
e: <
WIR
_Jap
anH
ardc
opy2
005M
MG
_HW
>


![Untitled-1 [qualitychem.tradeindia.com]...Reactive "VS" Dyes (Vinyl Sulphone Base Dyes) Fastness x-12 100 M 4 4-5 Washing Mercerising Fastness Fastness ISO. ISO-105-C03 Staining 4](https://img.pdfslide.net/doc/110x75/5f864a06c51aa21ad02aa61a/untitled-1-reactive-vs-dyes-vinyl-sulphone-base-dyes-fastness.jpg)