Embed Size (px)
Citation preview
Ambiente & Água - An Interdisciplinary Journal of Applied Science
ISSN 1980-993X – doi:10.4136/1980-993X
www.ambi-agua.net
E-mail: [email protected]
This is an Open Access article distributed under the terms of the Creative Commons
Attribution License, which permits unrestricted use, distribution, and reproduction in any
medium, provided the original work is properly cited.
New Water and Biotic Quality Assessment Indices for a tropical
reservoir based on fuzzy logic
ARTICLES doi:10.4136/ambi-agua.2597
Received: 14 Jun. 2020; Accepted: 06 Aug. 2020
Andres Paladines Andrade1 ; Marley Vellasco1* ; Karla Figueiredo2 ;
Francisco Gerson Araújo3 ; Christina Wyss Castelo Branco4
1Departamento de Energia Elétrica. Centro Técnico Científico. Pontifícia Universidade Católica do Rio de
Janeiro (PUC-Rio), Rua Marquês de São Vicente, n° 225, CEP: 22451-900, Gávea, RJ, Brazil.
E-mail: [email protected] 2Departamento de Ciência da Computação. Instituto de Matemática e Estatística. Universidade do Estado do Rio
de Janeiro (UERJ), Rua São Francisco Xavier, n° 524, CEP: 20550-900, Maracanã, RJ, Brazil.
E-mail: [email protected] 3Departamento de Biologia Animal. Laboratório de Ecologia de Peixes. Universidade Federal Rural do Rio de
Janeiro (UFRRJ), BR 465, km 7, CEP: 23897-030, Seropédica, RJ, Brazil.
E-mail: [email protected] 4Departamento de Zoologia. Instituto de Biociências. Universidade Federal do Estado do Rio de Janeiro
(UNIRIO), Avenida Pasteur, n° 458, CEP: 22290-240, Rio de Janeiro, RJ, Brazil.
E-mail: [email protected] *Corresponding author. E-mail: [email protected]
ABSTRACT The complexity of evaluating the quality of an aquatic environment with its numerous
variables has resulted in several quality indexes to synthesize all information in a single value.
However, most of these indexes are based on few environmental variables, losing information
from other relevant variables. This article presents a new model capable of representing the
quality level of a tropical oligo-mesotrophic reservoir on a numerical scale, considering the
subjectivity implicit in the concept of quality, and involving several physical, chemical and
biological variables. The proposed model, called "Fuzzy Indices for Water Quality Assessment
and Biotics" (FUZZY-WBQAI), is based on fuzzy inference systems, providing a way to deal
with the uncertainty between the quality categories. A computational tool was developed, which
automatically assesses the quality of water, considering different methodologies that depend on
the stratification conditions and the longitudinal zone of the reservoir. The model calculates
two indices: one for water quality and one biotic that uses metrics from the fish assembly. The
model was effective in revealing the decrease in water quality in summer months with higher
temperature and precipitation. The effect of the mixture of the stratified reservoir in winter in
decreasing the water quality in an area of fish cultivation was highlighted. The biotic index was
sensitive to spatial changes in the environmental quality of the reservoir. The results were
considered satisfactory, in agreement with the specialized knowledge, and can provide a rapid
diagnosis of water conditions in oligo-mesotrophic reservoirs in the tropics.
Keywords: environmental index, fuzzy inference system, FUZZY-WBQAI model, hydropower
reservoir, tropical reservoir, water quality index.
Rev. Ambient. Água vol. 15 n. 5, e2597 - Taubaté 2020
2 Andres Paladines Andrade et al.
Novos índices de avaliação da qualidade da água e biótica de um
reservatório tropical baseado em Lógica Fuzzy
RESUMO A complexidade de avaliar a qualidade de um ambiente aquático com suas inúmeras
variáveis resultou na criação de vários índices de qualidade para sintetizar todas as informações
em um único valor. No entanto, a maioria desses índices é baseada em poucas variáveis,
perdendo informações de outras variáveis relevantes. Este artigo apresenta um novo modelo
capaz de representar o nível de qualidade de um reservatório oligo-mesotrófico tropical em
escala numérica, considerando a subjetividade implícita no conceito de qualidade e envolvendo
diversas variáveis físicas, químicas e biológicas. O modelo proposto, denominado "Índices
Fuzzy de Avaliação da Qualidade da Água e Biótica" (FUZZY-WBQAI), é baseado em
sistemas de inferência fuzzy, fornecendo uma forma de lidar com a incerteza entre as categorias
de qualidade. Uma ferramenta computacional foi elaborada, a qual avalia automaticamente a
qualidade da água, considerando diferentes metodologias que dependem das condições de
estratificação e zona longitudinal do reservatório. O modelo calcula dois índices: um de
qualidade da água e um biótico que utiliza métricas da assembleia de peixes. O modelo foi
eficaz ao revelar a diminuição da qualidade da água nos meses de verão com temperatura e
precipitação mais elevadas. Destacou-se o efeito da mistura do reservatório estratificado no
inverno sobre a diminuição da qualidade da água em área de cultivo de peixes. O índice biótico
foi sensível a mudanças espaciais na qualidade ambiental do reservatório. Os resultados foram
considerados satisfatórios, concordando com o conhecimento especializado, e podem propiciar
diagnósticos rápidos das condições da água em reservatórios oligo-mesotróficos nos trópicos.
Palavras-chave: índice ambiental, índice de qualidade da água, modelo FUZZY-WBQAI, reservatório
de hidrelétrica, reservatório tropical, sistema de inferência fuzzy.
1. INTRODUCTION
Water is an indispensable natural resource for human survival, and is used in many human
activities, including irrigation, food production, industrial processes, generation of energy,
navigation, and landscaping. Hence, numerous countries have laws that specify strict limits for
any water use, as well as treatment requirements according to the type of water use (Vargas et
al., 2018). In Brazil, resolution 357/2005 of the National Environment Council (CONAMA,
2005) addresses the classification of water bodies, establishes environmental guidelines and
sets the conditions and patterns for the discharge of effluents.
Therefore, for efficient management and control of water resources, it is imperative to
continuously monitor water quality, in order to supply the information required for proper
management of surface waters (Branco et al., 2019; Rocha et al., 2019) and groundwater
(Gholami et al., 2015; 2020). A standard method for estimating water quality is to analyse
features of several physical, chemical, and biological variables. Nevertheless, water quality
indices are the preferred solution for integrated management, since they incorporate a large
number of variables in a single value that can be easily understood. Current literature offers
several quality indices for aquatic environments.
In 1965, Horton (1965) formulated the first water quality index based on a numerical scale
to represent grades of water quality. Brown et al. (1970) developed a water quality index that
is similar in structure to the Horton index, but substantially more rigorous in the selection of
variables and the attribution of weights for the development of a common scale. Based on the
research by Brown et al. (1970), the São Paulo State Environmental Company (Companhia de
Tecnologia e Saneamento Ambiental - CETESB) in Brazil adapted and developed their own
3 New Water and Biotic Quality Assessment Indices …
Rev. Ambient. Água vol. 15 n. 5, e2597 - Taubaté 2020
Water Quality Index (Índice de Qualidade das Águas-IQA) (CETESB, 2006). This index was
specifically designed for public water supply and incorporates nine variables considered
relevant for water quality evaluations. Recently, Garcia et al. (2018) presented a review of water
quality indices, discussing their evolution and future perspectives.
Most indices available in the literature, however, are formulated for running waters, having
little to no applicability in lentic environments. Lakes and reservoirs are usually classified by
trophic state, based on biomass of phytoplankton and on the content of total phosphorus, water
transparency, and chlorophyll-a (Cunha et al., 2013; Klippel et al., 2020).
The assessment of the water quality conditions in Brazilian reservoirs has been of
paramount importance for establishing management strategies for stakeholders. The increase in
efficiency and speed in environmental evaluation is crucial, since around 64% of the energy
used in Brazil comes from hydroelectric power plants with reservoirs (ANEEL, 2020). Besides
power generation, the waters of Brazilian reservoirs are used for domestic and industrial supply,
recreation, fishing and agriculture. Considering this scenario, new and more efficient
approaches using artificial intelligence techniques for environmental evaluation of these
systems, are clearly welcome. Although trophic state indices have been used as a base for
comparison of water quality in Brazilian reservoirs (Cunha et al., 2013; Klippel et al., 2020),
most of them are based on few environmental variables and may lose important information
related to other monitored variables. Furthermore, they do not reflect the subjective aspects
inherent to their qualitative counterparts, being less representative than quality indices.
The term quality implies a subjective judgment that is best kept separate from the concept
of a trophic state. "The definition of trophic state and its index should remain neutral to such
subjective judgments, remaining a framework within which various evaluations of water quality
can be made" (Carlson, 1977). Therefore, to provide a quality index that naturally incorporates
subjective aspects of environmental aspects, new indices should be developed considering the
diversity of existing aquatic systems, which is a challenge especially for the tropical regions.
The natural environment must be analyzed as a complex system, and an integrated vision
can promote a good understanding of the impacts occurring in water bodies, regarding the
distinct nature of the factors and environmental quality legislation (Santos et al., 2019; Gholami
et al., 2020). Under this perspective, fuzzy logic allows a flexible and realistic modeling system,
and consists of a set of methods based on the concept of fuzzy sets and fuzzy operations (Salski,
2007). Recent studies have shown that fuzzy logic systems are universal surrogates for general
non-linear functional relationships, to any degree of accuracy, making them a powerful tool for
exploring complex, non-linear biological problems such as estimating and forecasting (Soyupak
and Chen, 2004). The use of fuzzy logic as an environmental evaluation method began in the
1990s and has been used broadly for determining trophic status and water quality indices in
rivers (Lee and Chang, 2005; Chang, 2008; Lermontov et al., 2009; Semiromi et al., 2011;
Ocampo-Duque et al., 2006; 2013; Mourhir et al., 2014), natural lakes (Chen and Mynett, 2003;
Icaga, 2007), reservoirs (Lu et al., 1999; Soyupak and Chen, 2004; Liou and Lo, 2005;
Taheriyoun et al., 2010) and in evaluation of groundwater quality (Gholami et al., 2017); but
none of these uses involved tropical regions. The fuzzy approach has also been used in water
quality and watershed evaluations combined with other techniques, such as self-organizing
maps (Lu and Lo, 2002), and geographic information system (GIS) (Pinto et al., 2016; Gholami
et al., 2017).
This research presents the proposal of a new intelligent model capable of representing the
quality level of a tropical oligo-mesotrophic reservoir in a numerical scale, considering the
implicit subjectivity in the concept of quality. The proposed model, named "Fuzzy Water and
Biotic Quality Assessment Indices" (FUZZY-WBQAI), evaluates water and biotic quality of
the reservoir based on fuzzy inference systems, providing a natural way to deal with uncertainty
among quality categories. Fuzzy logic is conceptually simple, but the real power of the
Rev. Ambient. Água vol. 15 n. 5, e2597 - Taubaté 2020
4 Andres Paladines Andrade et al.
methodology comes from the ability to integrate different kinds of observations in a way that
permits a balance between favourable and unfavourable observations, the information with
more flexibility than discrete measures to ordinary sets, such as "acceptable versus
unacceptable" (Silvert, 2000; Icaga, 2007). The proposed fuzzy model is capable of
representing, in a more efficient form, the limits of the intervals of several quality variables,
such as pH or dissolved oxygen. The range of the intervals for the variables was established
based on water quality standards for Class 1, which according to resolution CONAMA
357/2005 (CONAMA, 2005) are waters that can be used as supply for human consumption,
after simplified treatment, for primary contact recreation, such as swimming, water skiing,
diving, and for the protection of aquatic communities. Additionally, the FUZZY-WBQAI
provides a fish assemblage index in a set of subjective categories, e.g., low or poor, when those
limits are imprecise or not well defined. The proposed FUZZY-WBQAI model is based on two
hierarchical fuzzy inference systems developed for water and biotic quality assessment,
respectively. A user-friendly computational tool was designed to easily evaluate the water and
biotic quality of tropical reservoirs and can be very useful for hydroelectric power companies
with the generator matrix supported by reservoirs.
2. MATERIALS AND METHODS
2.1. Study Area
The Lajes Reservoir was built in 1905 to generate hydroelectric power and belongs to a
system of reservoirs operated by the Light Energy SA Company since 1940, which generates
612 MW of electricity and provided 96% of the water consumed by the municipalities of Rio
de Janeiro (Guarino et al., 2005; Soares et al., 2008; Branco et al., 2009). Currently, the Lajes
Reservoir alone provides the domestic water supply for approximately one million people. The
reservoir is also used for sports fishing and, recently, for fish farming in net-tanks in one of its
bays.
The Lajes Reservoir (22°43’ S to 22°46’ S and 44°30’ W to 44°60’ W) is situated between
the hills of Serra das Araras, in a protected area with tropical forests. The Lajes Reservoir is
located 415 m above sea level, and has a surface area of 38.9 km2, a maximum depth of 40 m,
a mean depth of 15 m, and an accumulated volume of 450 x 106 m3 (Soares et al., 2008). The
climate in the region of Lajes Reservoir is subtropical humid with rainfall between 1000 and
1700mm per year and presents two well-defined periods: a rainy season (November to March)
and a dry season (April to October).
The reservoir has been considered as an oligo-mesotrophic system (Klippel et al., 2020).
Nevertheless, the low values of chlorophyll-a, picocyanobacteria accounts for most of the
phytoplankton abundance in this reservoir (Recknagel et al., 2015). Regardless of phosphorus
limiting conditions, picocyanobacteria can be influenced by water column stability and
electrical conductivity (Rocha et al., 2019). Because of its high retention time of 300 days, the
reservoir is considered vulnerable to eutrophication (Guarino et al., 2005). Recent human
activity, such as fish farming, can accelerate the growth of nutrient inputs in the reservoir, which
has not occurred for decades.
According to Branco et al. (2009), the Lajes Reservoir is a monomictic reservoir with a
tendency to mix the water column in the winter depending on the weather conditions. The
prolonged stratification period leads to an anoxic hypolimnion that is rich in nutrients, which
causes the reservoir to present poor water quality in its deepest part.
Two databases were used as sources of analytical information about the Lajes Reservoir.
The first database (655 water samples from February 2000 to December 2009) is from Federal
University of Rio de Janeiro State (UNIRIO). The second database (417 fish samplings from
January 1994 to August 2012) is from Federal Rural University of Rio de Janeiro (UFRRJ). For
5 New Water and Biotic Quality Assessment Indices …
Rev. Ambient. Água vol. 15 n. 5, e2597 - Taubaté 2020
the physical and chemical variables, the data were extracted from five sampling locations. For
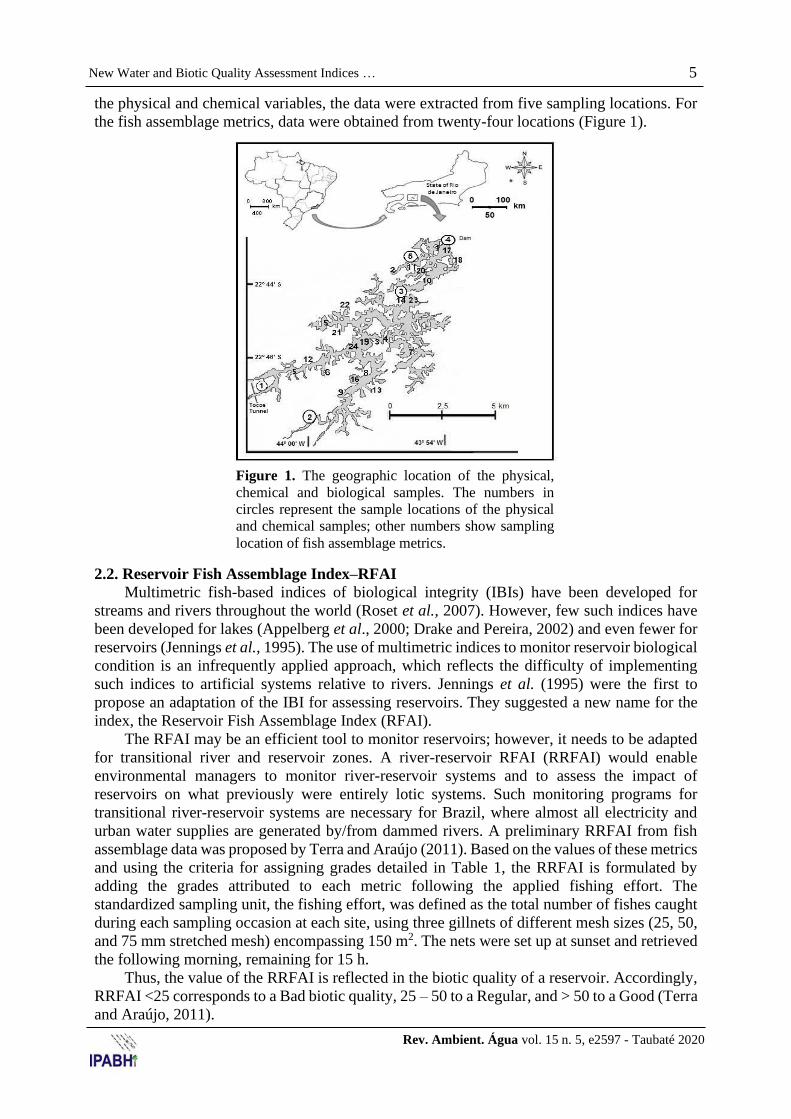
the fish assemblage metrics, data were obtained from twenty-four locations (Figure 1).
Figure 1. The geographic location of the physical,
chemical and biological samples. The numbers in
circles represent the sample locations of the physical
and chemical samples; other numbers show sampling
location of fish assemblage metrics.
2.2. Reservoir Fish Assemblage Index–RFAI
Multimetric fish-based indices of biological integrity (IBIs) have been developed for
streams and rivers throughout the world (Roset et al., 2007). However, few such indices have
been developed for lakes (Appelberg et al., 2000; Drake and Pereira, 2002) and even fewer for
reservoirs (Jennings et al., 1995). The use of multimetric indices to monitor reservoir biological
condition is an infrequently applied approach, which reflects the difficulty of implementing
such indices to artificial systems relative to rivers. Jennings et al. (1995) were the first to
propose an adaptation of the IBI for assessing reservoirs. They suggested a new name for the
index, the Reservoir Fish Assemblage Index (RFAI).
The RFAI may be an efficient tool to monitor reservoirs; however, it needs to be adapted
for transitional river and reservoir zones. A river-reservoir RFAI (RRFAI) would enable
environmental managers to monitor river-reservoir systems and to assess the impact of
reservoirs on what previously were entirely lotic systems. Such monitoring programs for
transitional river-reservoir systems are necessary for Brazil, where almost all electricity and
urban water supplies are generated by/from dammed rivers. A preliminary RRFAI from fish
assemblage data was proposed by Terra and Araújo (2011). Based on the values of these metrics
and using the criteria for assigning grades detailed in Table 1, the RRFAI is formulated by
adding the grades attributed to each metric following the applied fishing effort. The
standardized sampling unit, the fishing effort, was defined as the total number of fishes caught
during each sampling occasion at each site, using three gillnets of different mesh sizes (25, 50,
and 75 mm stretched mesh) encompassing 150 m2. The nets were set up at sunset and retrieved
the following morning, remaining for 15 h.
Thus, the value of the RRFAI is reflected in the biotic quality of a reservoir. Accordingly,
RRFAI <25 corresponds to a Bad biotic quality, 25 – 50 to a Regular, and > 50 to a Good (Terra
and Araújo, 2011).
Rev. Ambient. Água vol. 15 n. 5, e2597 - Taubaté 2020
6 Andres Paladines Andrade et al.
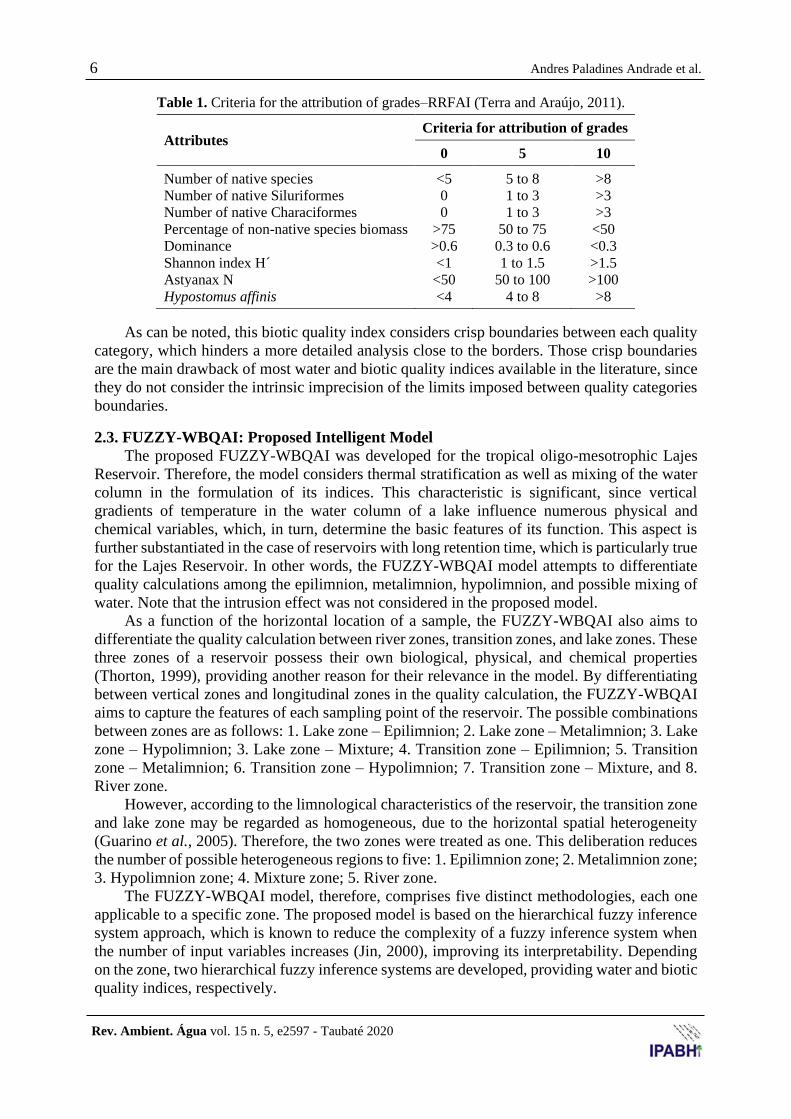
Table 1. Criteria for the attribution of grades–RRFAI (Terra and Araújo, 2011).
Attributes Criteria for attribution of grades
0 5 10
Number of native species <5 5 to 8 >8
Number of native Siluriformes 0 1 to 3 >3
Number of native Characiformes 0 1 to 3 >3
Percentage of non-native species biomass >75 50 to 75 <50
Dominance >0.6 0.3 to 0.6 <0.3
Shannon index H´ <1 1 to 1.5 >1.5
Astyanax N <50 50 to 100 >100
Hypostomus affinis <4 4 to 8 >8
As can be noted, this biotic quality index considers crisp boundaries between each quality
category, which hinders a more detailed analysis close to the borders. Those crisp boundaries
are the main drawback of most water and biotic quality indices available in the literature, since
they do not consider the intrinsic imprecision of the limits imposed between quality categories
boundaries.
2.3. FUZZY-WBQAI: Proposed Intelligent Model
The proposed FUZZY-WBQAI was developed for the tropical oligo-mesotrophic Lajes
Reservoir. Therefore, the model considers thermal stratification as well as mixing of the water
column in the formulation of its indices. This characteristic is significant, since vertical
gradients of temperature in the water column of a lake influence numerous physical and
chemical variables, which, in turn, determine the basic features of its function. This aspect is
further substantiated in the case of reservoirs with long retention time, which is particularly true
for the Lajes Reservoir. In other words, the FUZZY-WBQAI model attempts to differentiate
quality calculations among the epilimnion, metalimnion, hypolimnion, and possible mixing of
water. Note that the intrusion effect was not considered in the proposed model.
As a function of the horizontal location of a sample, the FUZZY-WBQAI also aims to
differentiate the quality calculation between river zones, transition zones, and lake zones. These
three zones of a reservoir possess their own biological, physical, and chemical properties
(Thorton, 1999), providing another reason for their relevance in the model. By differentiating
between vertical zones and longitudinal zones in the quality calculation, the FUZZY-WBQAI
aims to capture the features of each sampling point of the reservoir. The possible combinations
between zones are as follows: 1. Lake zone – Epilimnion; 2. Lake zone – Metalimnion; 3. Lake
zone – Hypolimnion; 3. Lake zone – Mixture; 4. Transition zone – Epilimnion; 5. Transition
zone – Metalimnion; 6. Transition zone – Hypolimnion; 7. Transition zone – Mixture, and 8.
River zone.
However, according to the limnological characteristics of the reservoir, the transition zone
and lake zone may be regarded as homogeneous, due to the horizontal spatial heterogeneity
(Guarino et al., 2005). Therefore, the two zones were treated as one. This deliberation reduces
the number of possible heterogeneous regions to five: 1. Epilimnion zone; 2. Metalimnion zone;
3. Hypolimnion zone; 4. Mixture zone; 5. River zone.
The FUZZY-WBQAI model, therefore, comprises five distinct methodologies, each one
applicable to a specific zone. The proposed model is based on the hierarchical fuzzy inference
system approach, which is known to reduce the complexity of a fuzzy inference system when
the number of input variables increases (Jin, 2000), improving its interpretability. Depending
on the zone, two hierarchical fuzzy inference systems are developed, providing water and biotic
quality indices, respectively.
7 New Water and Biotic Quality Assessment Indices …
Rev. Ambient. Água vol. 15 n. 5, e2597 - Taubaté 2020
All fuzzy inference systems were developed using the following steps:
• Choice of input variables for each index: first, the quality indicators and metrics
considered decisive in the implementation of each index were selected;
• Definition of the universes of the discourse of each input variable: then, the universes
of discourse (range of possible values) were specified for each input variable, i.e., quality
indicators and fish assemblage metrics;
• Definition of the membership functions: the membership functions of each fuzzy set,
with their respective linguistic labels, for each input variable, were defined;
• Determining the sub-indices: the hierarchical nature of the fuzzy inference systems
proposed in this work produces intermediate results, or quality sub-indices. So, the most
suitable sub-indices for the water quality index and biotic index, their universes of discourse,
and their membership functions must be determined;
• Construction of the rule bases: finally, the fuzzy rule base, with their antecedents and
consequents, for each sub-index and for the final indices must be established.
The five methodologies (one for each considered reservoir region) use the same selection
of input variables and the same structure of sub-indices. However, the universes of discourse
for each variable, their membership functions and their associate rule base are specific for each
methodology.
The FUZZY-WBQAI model was developed based on the knowledge of specialists from
the Laboratory of Limnology of the UNIRIO and from the Animal Biology Department of the
UFRRJ that, for several years, have been conducting research in the Lajes Reservoir.
Additionally, the limits for each variable established by the resolution CONAMA 357/2005
(CONAMA, 2005) for waters of Class 1 were considered. Therefore, all steps were developed
through discussions with those specialists in water and environmental quality and were based
on the notion that "expert judgment is the key for any environmental assessment, evaluation, or
diagnosis" (Scardi et al., 2008). The selection of relevant environmental variables is a common
problem in ecological modelling, and the selection by expert decreases model complexity and
the amount of data required to estimate model parameters efficiently (D'heygere et al., 2003;
Forio et al., 2017).
2.3.1. General View of the Indices Calculation Methodology
In evaluating the water and biotic quality of a reservoir, the proposed model considers the
following:
• Ten environmental indicators (or physical, chemical and biological indicators) for water
quality calculation: water temperature, dissolved oxygen, pH, chlorophyll-a, nitrate, total
phosphorus, nitrite, ammonium, conductivity, and turbidity;
• Eight metrics of fish community assemblies for the calculation of biotic quality: number
of native species, number of native Siluriformes, number of native Characiformes, percentage
of non-native species biomass, dominance (D), Shannon index (H), number of Astyanax fish
(N), and number of Hypostomus affinis;
• Stratification and possible mixing of the water column;
• Horizontal location of the sample: river zone, transition, or lake;
• Vertical location of the sample;
• Date of sampling.
Rev. Ambient. Água vol. 15 n. 5, e2597 - Taubaté 2020
8 Andres Paladines Andrade et al.
The model evaluates the water and biotic quality of a sample according to its horizontal
and vertical locations in the reservoir, and considers possible thermal stratification at the
sampling time. The ten water quality indicators and eight fish assemblage metrics are
considered inputs to the system.
Since the reservoir used as the basis for the design of the proposed model is the Lajes
Reservoir, the entire process of designing and programming this tool considered limnological
information obtained from previous studies of the reservoir. The proposed model is based on
the limnological characteristics described in Guarino et al. (2005), Soares et al. (2008) and
Branco et al. (2009). Other environmental variables included were shown as important for
phytoplankton increases in this aquatic ecosystem, such as nitrogen and phosphate compounds
(Recknagel et al., 2015), water column stability and electrical conductivity (Rocha et al., 2019).
It must be emphasized, however, that although the proposed FUZZY-WBQAI model was
developed using Lajes Reservoir as the basis, it can be applied to any other tropical oligo-
mesotrophic reservoir with similar limnological characteristics.
First, the model locates the sample longitudinally in the reservoir using Cartesian
coordinates in degrees, minutes, and seconds. The tool identifies whether the sample is located
in the river, transition, or lake zone. According to the limnological characteristics of the
reservoir, the transition zone and lake zone may be considered homogenous because of their
horizontal spatial homogeneity (Busch and Sly, 1992). Therefore, the quality calculation
methodology for those zones in the Lajes Reservoir is the same.
If the sample is located in the transition or the lake zone, the model will determine whether
there is any presence of stratification or mixture. If there is stratification, the computational tool
then identifies the stratification layer to which the sample belongs. The model analyses the
presence of stratification or mixture using a temperature vs. depth curve based on the
temperature and depth of the water column. Once the sample is located, and horizontal zone
and layer (epilimnion, metalimnion or hypolimnion) to which it belongs are identified, the
model uses one of the available calculation methodologies to evaluate the water quality.
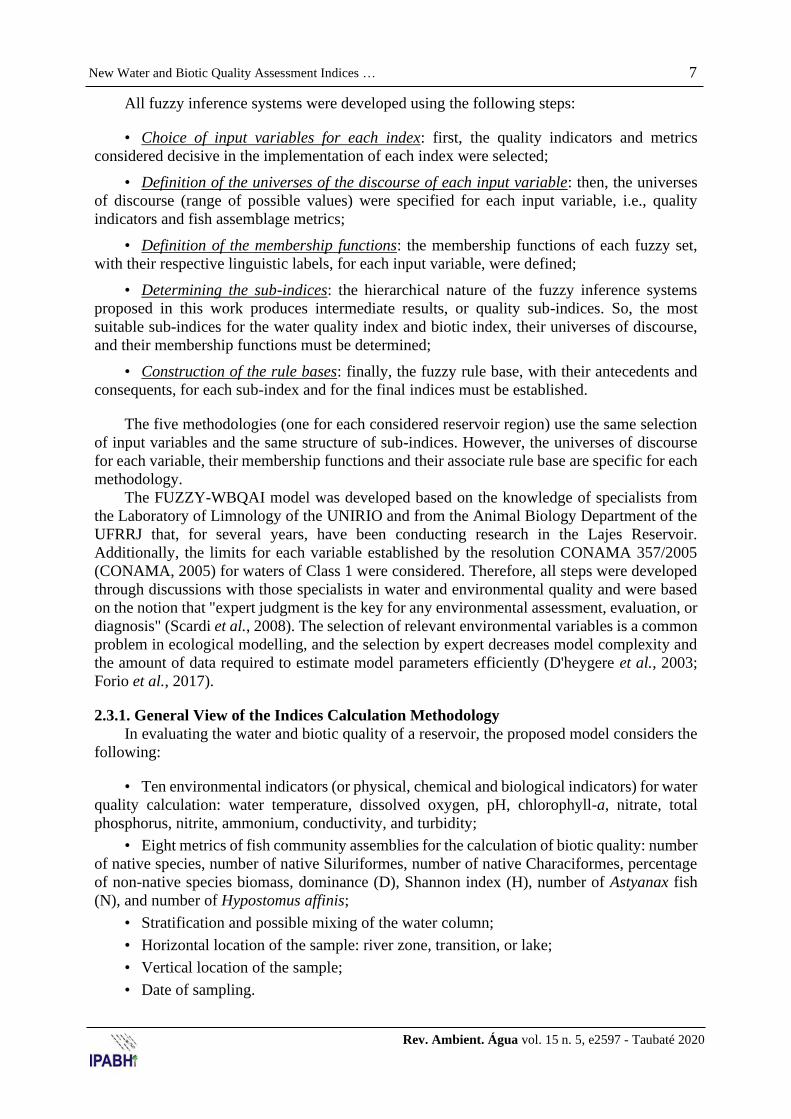
As previously explained, five calculation methodologies were created: one methodology
for the river zone and four methodologies for the transition and lake zones. These
methodologies correspond to the stratification layers of the epilimnion, metalimnion,
hypolimnion, and a possible mixture of water. Figure 2 shows the flowchart for selecting the
appropriate calculation methodology. If the sample is located in the epilimnion or river zone
(methodologies #1 and #2), the model calculates two indices: a water quality index, and a biotic
index that utilizes the fish assemblage metrics. In the metalimnion and hypolimnion zones, only
the water quality index is calculated, as the number of fish collected in these layers is limited.
Figure 2. Selection of the calculation methodology for
the evaluation of the water and biotic quality. Source: authors.
9 New Water and Biotic Quality Assessment Indices …
Rev. Ambient. Água vol. 15 n. 5, e2597 - Taubaté 2020
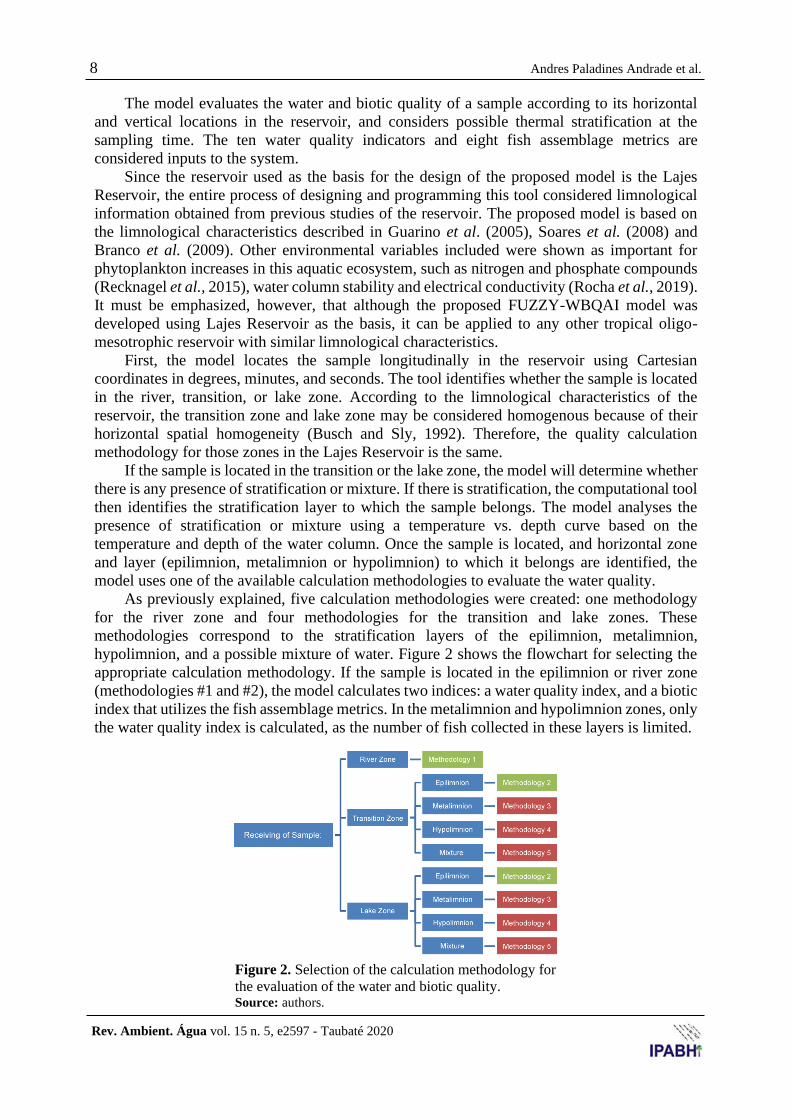
2.3.2. Hierarchical Fuzzy Inference System: Quality Sub-indices
The development of fuzzy inference systems with more than four input variables becomes
a significant challenge, with the exponential growth of the number of rules and interpretability
reduction (Gonçalves et al., 2006). Thus, input variables are usually divided into intermediate
fuzzy systems, where their outputs are used as inputs to the final system. In the proposed
FUZZY-WBQAI model, the ten water quality variables and eight biotic quality variables are
divided into groups of two, originating quality sub-indices, which in turn are used as inputs to
the final indices (Figure 3).
(A)
(B)
Figure 3. a) Flowchart of the sub-indices that compose the Water Quality
Index; b) Flowchart of the sub-indices that compose the Biotic Quality Index.
Rev. Ambient. Água vol. 15 n. 5, e2597 - Taubaté 2020
10 Andres Paladines Andrade et al.
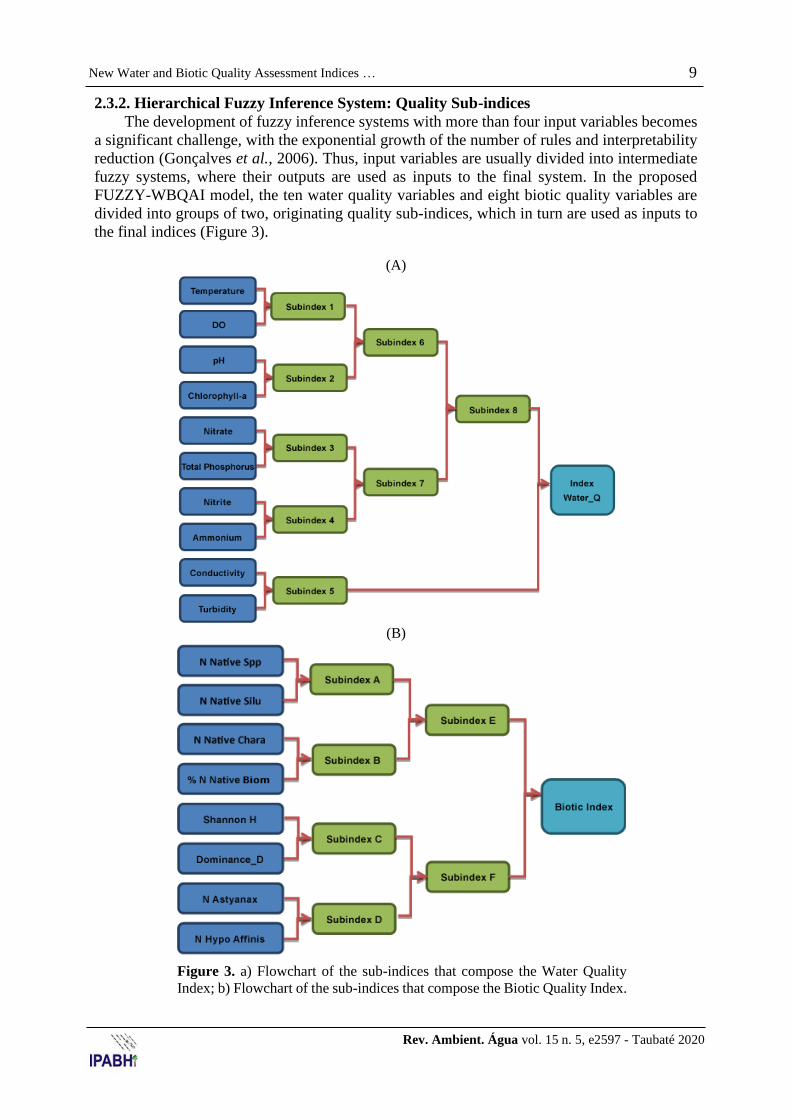
2.3.2.1. Fuzzy Sets Definition
The universe of discourse for each variable and the support of each fuzzy set were defined
by limnology specialists (co-authors of this study) and adjusted during the evaluation of the
proposed model. All input variables were partitioned into five fuzzy sets: Low, Average-Low,
Average, Average-High and High. Figure 4 presents an example of the fuzzy sets of the
linguistic variables used in water and biotic quality indices, respectively, for temperature,
dissolved oxygen, pH and chlorophyll-a in Methodology #2 (Epilimnion region).
Sub-indices and indices’ variables were also partitioned into five fuzzy sets, with the
following labels: Poor, Average-Poor, Average, Average-Good and Good, as shown in
Figure 4. The same fuzzy partitioning is used in all methodologies (Epilimnion, Metalimnion
and Hypolimnion).
Figure 4. Example of fuzzy sets of water quality index for the variables water temperature, dissolved
oxygen, pH and chlorophyll-a.
2.3.2.2. Rule Bases
The fuzzy rule bases for all sub-indices and final indices were provided by the specialists
mentioned above. It is important to emphasize that the rule bases are dependent on the
characteristics of the body of water for which the system is originally designed or on limits
recommended in the legislation for that class of water. Thus, the rule base can only be extended
to other reservoirs that share similar limnological characteristics or are included in the same
type of water. The features of a reservoir act directly on the vertical and horizontal structures
of the lake, which in turn directly influence the water quality. Consequently, when considering
the use of the proposed model for the evaluation of a reservoir other than the Lajes Reservoir,
the following limnological characteristics must be similar to those of the Lajes Reservoir:
• Reservoir size, geographic region, and climate
• Hydrographical characteristics
• Water retention time
• Class type of water (according to the legislation CONAMA 357/2005)
For reservoirs that significantly differ from the Lajes Reservoir, in addition to altering the
rule base, the calculation methodologies might also require modification.
The fuzzy rule bases for all methodologies (epilimnion, metalimnion and hypolimnion), as
11 New Water and Biotic Quality Assessment Indices …
Rev. Ambient. Água vol. 15 n. 5, e2597 - Taubaté 2020
well as for all sub-indices related to each methodology, can be found in Andrade (2013). Each
fuzzy inference system is developed using the Mamdani inference system (Jang and Sun, 1995).
The intersection and implication operators can be configured by the user (min or prod), so as
the defuzzification method, as described in the next section.
The values of all sub-indices, as well as the final FUZZ-WBQAI index, vary between 0
and 100.
2.3.3. FUZZY-WBQAI: The computational Tool
The proposed FUZZ-WBQAI model was implemented in a user-friendly computational
tool, programmed using C# programming language together with Microsoft Visual Studio and
Microsoft Excel. The final tool was developed as a Windows application for ease of use and
then synchronized with an Excel file. To further simplify the application, the tool's
configuration, processing control and results presentation are configured through the software
interface. On the other hand, to facilitate data entry, the complete database is provided through
an Excel file, containing the required information for tool operation, i.e., the values of all input
variables: sample depth; sample geographic coordinates; rule bases and membership functions
of each methodology; and temperature vs. local water column depth. According to the
description of the model, to determine the calculation methodology, the application imports and
analyses all the required information from the Excel file before proceeding with the calculation
of the sub-indices and indices.
3. RESULTS AND DISCUSSION
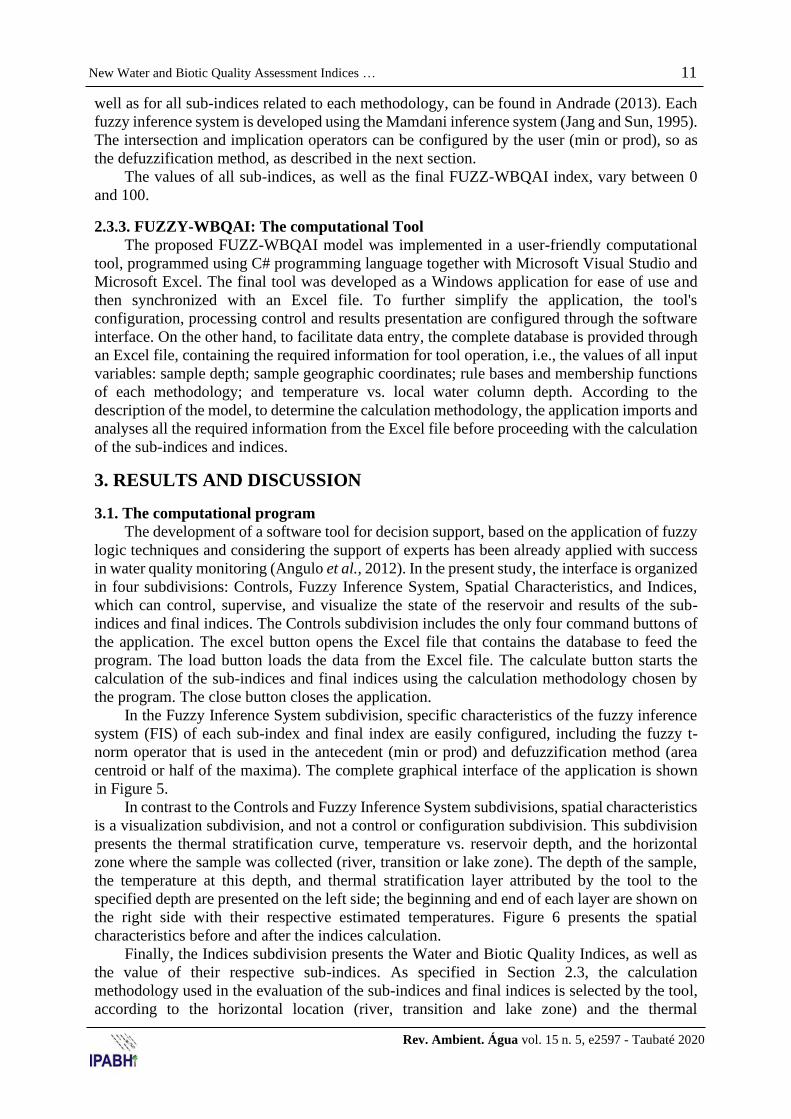
3.1. The computational program
The development of a software tool for decision support, based on the application of fuzzy
logic techniques and considering the support of experts has been already applied with success
in water quality monitoring (Angulo et al., 2012). In the present study, the interface is organized
in four subdivisions: Controls, Fuzzy Inference System, Spatial Characteristics, and Indices,
which can control, supervise, and visualize the state of the reservoir and results of the sub-
indices and final indices. The Controls subdivision includes the only four command buttons of
the application. The excel button opens the Excel file that contains the database to feed the
program. The load button loads the data from the Excel file. The calculate button starts the
calculation of the sub-indices and final indices using the calculation methodology chosen by
the program. The close button closes the application.
In the Fuzzy Inference System subdivision, specific characteristics of the fuzzy inference
system (FIS) of each sub-index and final index are easily configured, including the fuzzy t-
norm operator that is used in the antecedent (min or prod) and defuzzification method (area
centroid or half of the maxima). The complete graphical interface of the application is shown
in Figure 5.
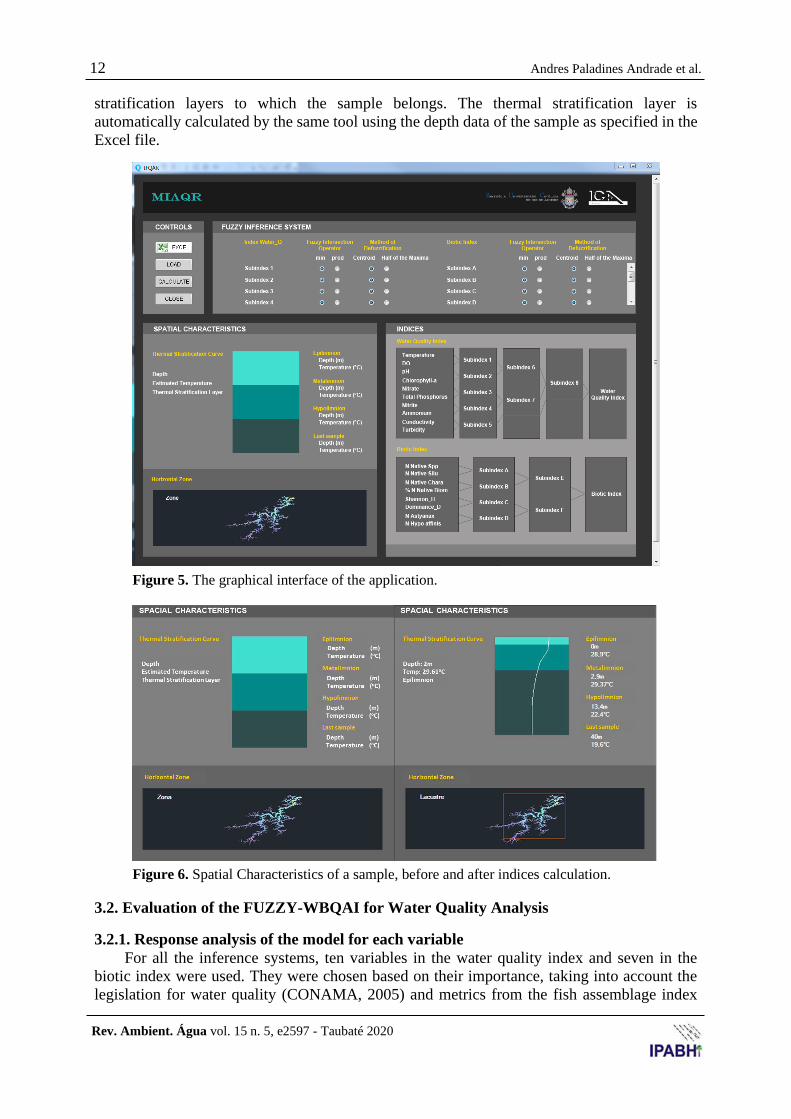
In contrast to the Controls and Fuzzy Inference System subdivisions, spatial characteristics
is a visualization subdivision, and not a control or configuration subdivision. This subdivision
presents the thermal stratification curve, temperature vs. reservoir depth, and the horizontal
zone where the sample was collected (river, transition or lake zone). The depth of the sample,
the temperature at this depth, and thermal stratification layer attributed by the tool to the
specified depth are presented on the left side; the beginning and end of each layer are shown on
the right side with their respective estimated temperatures. Figure 6 presents the spatial
characteristics before and after the indices calculation.
Finally, the Indices subdivision presents the Water and Biotic Quality Indices, as well as
the value of their respective sub-indices. As specified in Section 2.3, the calculation
methodology used in the evaluation of the sub-indices and final indices is selected by the tool,
according to the horizontal location (river, transition and lake zone) and the thermal
Rev. Ambient. Água vol. 15 n. 5, e2597 - Taubaté 2020
12 Andres Paladines Andrade et al.
stratification layers to which the sample belongs. The thermal stratification layer is
automatically calculated by the same tool using the depth data of the sample as specified in the
Excel file.
Figure 5. The graphical interface of the application.
Figure 6. Spatial Characteristics of a sample, before and after indices calculation.
3.2. Evaluation of the FUZZY-WBQAI for Water Quality Analysis
3.2.1. Response analysis of the model for each variable
For all the inference systems, ten variables in the water quality index and seven in the
biotic index were used. They were chosen based on their importance, taking into account the
legislation for water quality (CONAMA, 2005) and metrics from the fish assemblage index
13 New Water and Biotic Quality Assessment Indices …
Rev. Ambient. Água vol. 15 n. 5, e2597 - Taubaté 2020
(Terra and Araújo, 2011). The variables were configured as follows:
• Minimum t-norm as fuzzy operator AND of the antecedents. No rule was implemented
with the operator OR;
• Minimum as implication operator;
• Maximum in the aggregation of the consequents;
• Area Centroid in the defuzzification.
With the purpose of testing each variable in its complete range of variation, simulated data
as input values were used. Two different evaluation databases were created: a database for the
water quality index and another for the biotic index. The data in the databases consisted of
values that were proportionally separated inside the most extensive variation range of each
indicator or metric. The ranges were obtained from the UNIRIO and UFRRJ databases, and 21
values were considered sufficient to represent the entire variation range of each input variable
satisfactorily.
The behaviour of the model for the ten water quality indicators was analysed. The
behaviour test consisted of varying the input value of a single indicator along with the entire
interval, while all other indicators remain fixed. Consequently, the final index and sub-indices
reflect only the variations of the tested indicator.
The chosen values of the other indicators that were not part of the test and remained fixed
were the average of the amounts of all of the collections among the five sampling locations L1,
L2, L3, L4, and L5, performed in the year 2009.
Because the final index is the result of intermediate fuzzy systems, and only the subsystems
with two input variables were used in this study, the sub-indices with both input constants were
also constant. Some comments about the behaviour analysis for the following variables water
temperature, dissolved oxygen, pH, nitrate, nitrite, ammonium, total phosphorus, chlorophyll-
a, electrical conductivity and turbidity are provided below:
• High temperatures exerted a negative influence on water quality. The remarkable
influence of the temperature variable was easily observed in the result of sub-index 1. Thus, we
infer that for temperature values above 24.5°C, the result of the sub-index shows an inversely
proportional trend. Water temperature directly influences dissolved oxygen saturation in the
water; additionally, in the tropical regions oxygen values can show an overall downward trend
during high temperature in the summertime, which can be a threat for aquatic life (Souza et al.,
2011).
• A directly proportional relationship occurs between the water quality and dissolved
oxygen variable. A directly proportional relationship was observed between the values of
dissolved oxygen and results of sub-index 1; the corresponding influence of the indicator on
sub-indices 6 and 8 up to the final index was also observed.
• There is a marked influence of the dissolved oxygen on the final index. Besides being
essential for aquatic life, the dissolved oxygen has a concentration limit for water used for
human consumption supply with disinfection, such as the waters of Lajes Reservoir. According
to the CONAMA 357/2005 (CONAMA, 2005), dissolved oxygen, in any sample, cannot be
less than 6 mg.L-1.
• Better water quality was indicated by pH values close to 6.5. In Lajes Reservoir, pH
presented values around this value at sampling sites without human influence across years of
studies (Guarino et al., 2005; Soares et al., 2008; Rocha et al., 2019).
• An inversely proportional relationship occurs between the water quality and increments
in the nitrogen series, total phosphorus and chlorophyll-a. As an oligo-mesotrophic reservoir,
Rev. Ambient. Água vol. 15 n. 5, e2597 - Taubaté 2020
14 Andres Paladines Andrade et al.
the increase of nutrients can mean a change in trophic conditions, especially in a reservoir with
a high retention time (Klippel et al., 2020). The differentiated condition of an oligo-mesotrophic
system used for domestic water supply was shown by the importance of maintaining
chlorophyll-a values below 5 µg.L-1 for better water quality. This value is lower than that
recommended by the CONAMA 357/2005 (CONAMA, 2005), which is 10 µg.L-1.
• Regarding turbidity and conductivity: no significant variations in water quality were
observed by varying conductivity and turbidity. Lajes Reservoir characteristically presents low
values of these two variables throughout the years. The surroundings protected by rainforest
and the control of human activities in the creeks entering the reservoir explain the good water
conditions of the reservoir (Branco et al., 2009; Rocha et al., 2019).
More generally, it can be observed that there was a predominance of one sub-index over
the others. Sub-index 8 had a strong influence, while sub-index 5 exhibited a weak impact on
the final water quality index. Furthermore, a predominance of one variable over the others was
shown since the influence of oxygen in sub-index 1 was clearly more significant than the
influence of temperature.
3.2.2. Water Quality analysis using real data
Unlike the previous test, real sample data were used in this trial. Due to the lack of samples
at low depths, the index was evaluated at the surface of the reservoir. This test used only
superficial samples collected in the year 2009 and from sampling locations L1, L2, L3, L4, and
L5. A detailed analysis of the behaviour of the sub-indices and final index was performed for
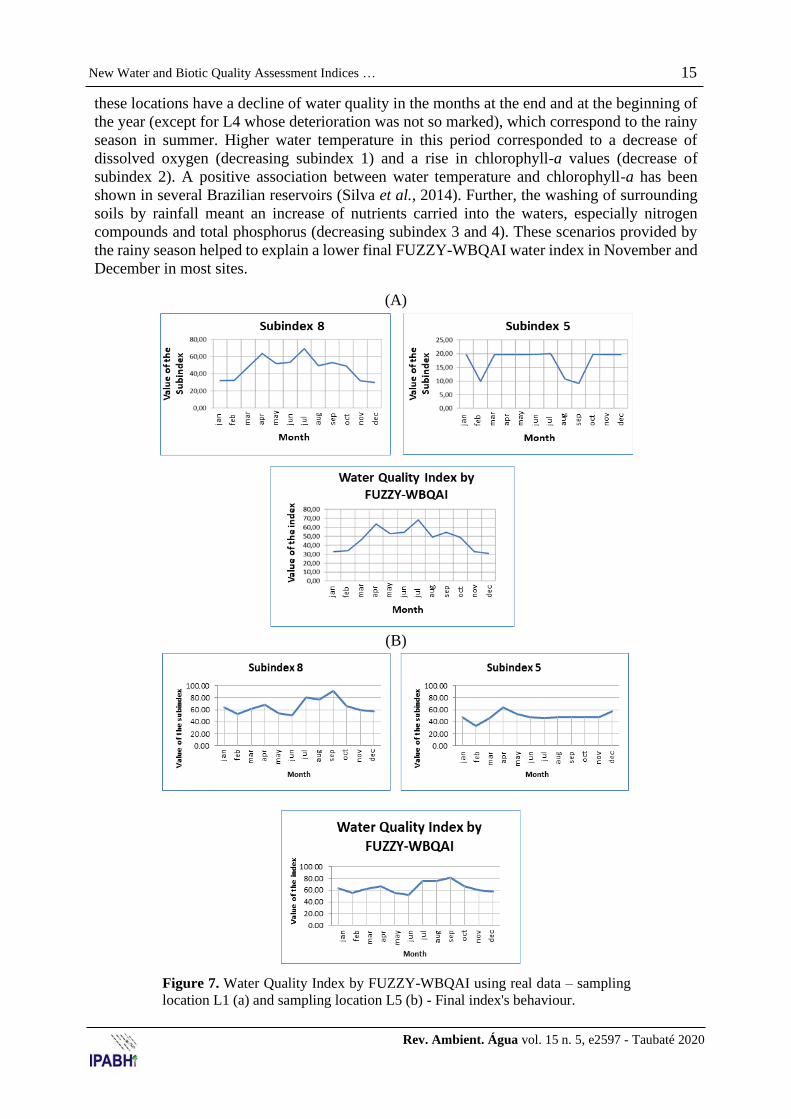
locations L1 and L5 (Figure 7a and b), respectively, near the main tributary of the reservoir and
near an area of fish cage aquaculture.
As a result of the test, at sampling location L1, formulation of the sub-indices followed the
complete logic used in the formulation of the rules. For example, in sub-index 1, average
temperatures between 15 and 20°C and high values of dissolved oxygen between 8 and
10 mg.L-1 generated good water quality values. In sub-index 2, the average pH value of 6.56
and high chlorophyll-a value of 7.4 μg.L-1 in January generated a relatively low sub-index 2
score of 8.38, which represents poor water quality for the Lajes Reservoir at L1. However, in
October, the average pH of 6.3 can be characterized as good and low average chlorophyll-a of
2.2 μg.L-1 resulted in an average sub-index 2 of 58.42, which indicates intermediate quality. In
this example, the predominance of one variable over another was observed. A higher
chlorophyll-a value had greater weight in the evaluation of water quality for human
consumption than did a good pH value. In sub-index 3, low values of nitrate of approximately
0.1 mg.L-1 and low values of total phosphorus of around 0.05 mg.L-1 generated good quality
results. Considering the final FUZZY-WBQAI water index, the worst values are among the
months from November to February (Figure 7a), which are related to months with higher
average temperature, and increase of nutrients input by rains. Augmentation of the content of
phosphate and nitrate in water due to more intense rainfall in summer has been shown for other
Brazilian reservoirs (Brandimarte et al., 2008; Branco et al., 2019).
The results from sampling location L5 (Figure 7b), exhibited the same tendencies as found
in the previous tests. Furthermore, in the final index, a decrease in the water quality was
noticeable in May and June. Differently from location L1, L5 is not influenced by rainfall. The
mixture of the water column at the beginning of the dry season increasing values of ammonium
and nitrite in May and June influenced a decrease in sub-index 4. The result was transmitted by
sub-indices 7 and 8 to the final index. Guarino et al., (2005) and Branco et al., (2009) reported
the increase of nitrogen content in the water surface in Lajes Reservoir caused by the winter
mixing of the water column, consequently decreasing water quality.
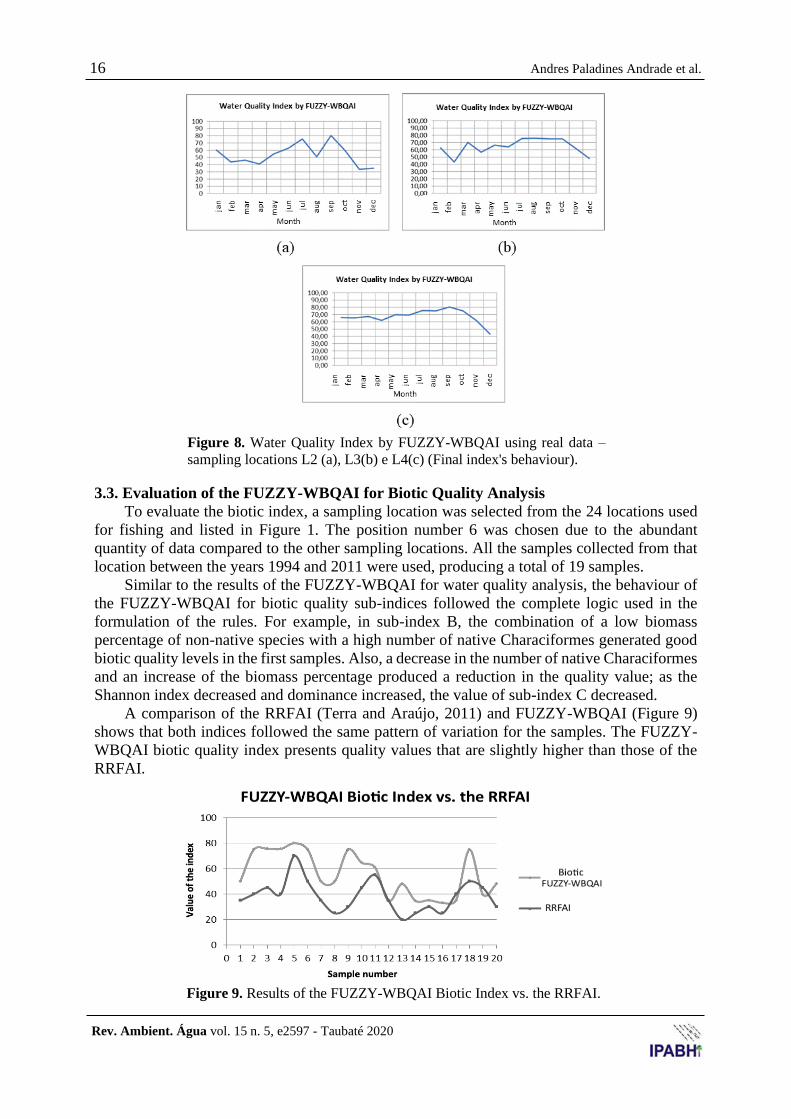
For the sites L2, L3, and L4, only the results for the last index are shown (Figure 8). All
15 New Water and Biotic Quality Assessment Indices …
Rev. Ambient. Água vol. 15 n. 5, e2597 - Taubaté 2020
these locations have a decline of water quality in the months at the end and at the beginning of
the year (except for L4 whose deterioration was not so marked), which correspond to the rainy
season in summer. Higher water temperature in this period corresponded to a decrease of
dissolved oxygen (decreasing subindex 1) and a rise in chlorophyll-a values (decrease of
subindex 2). A positive association between water temperature and chlorophyll-a has been
shown in several Brazilian reservoirs (Silva et al., 2014). Further, the washing of surrounding
soils by rainfall meant an increase of nutrients carried into the waters, especially nitrogen
compounds and total phosphorus (decreasing subindex 3 and 4). These scenarios provided by
the rainy season helped to explain a lower final FUZZY-WBQAI water index in November and
December in most sites.
(A)
(B)
Figure 7. Water Quality Index by FUZZY-WBQAI using real data – sampling
location L1 (a) and sampling location L5 (b) - Final index's behaviour.
Rev. Ambient. Água vol. 15 n. 5, e2597 - Taubaté 2020
16 Andres Paladines Andrade et al.
Figure 8. Water Quality Index by FUZZY-WBQAI using real data –
sampling locations L2 (a), L3(b) e L4(c) (Final index's behaviour).
3.3. Evaluation of the FUZZY-WBQAI for Biotic Quality Analysis
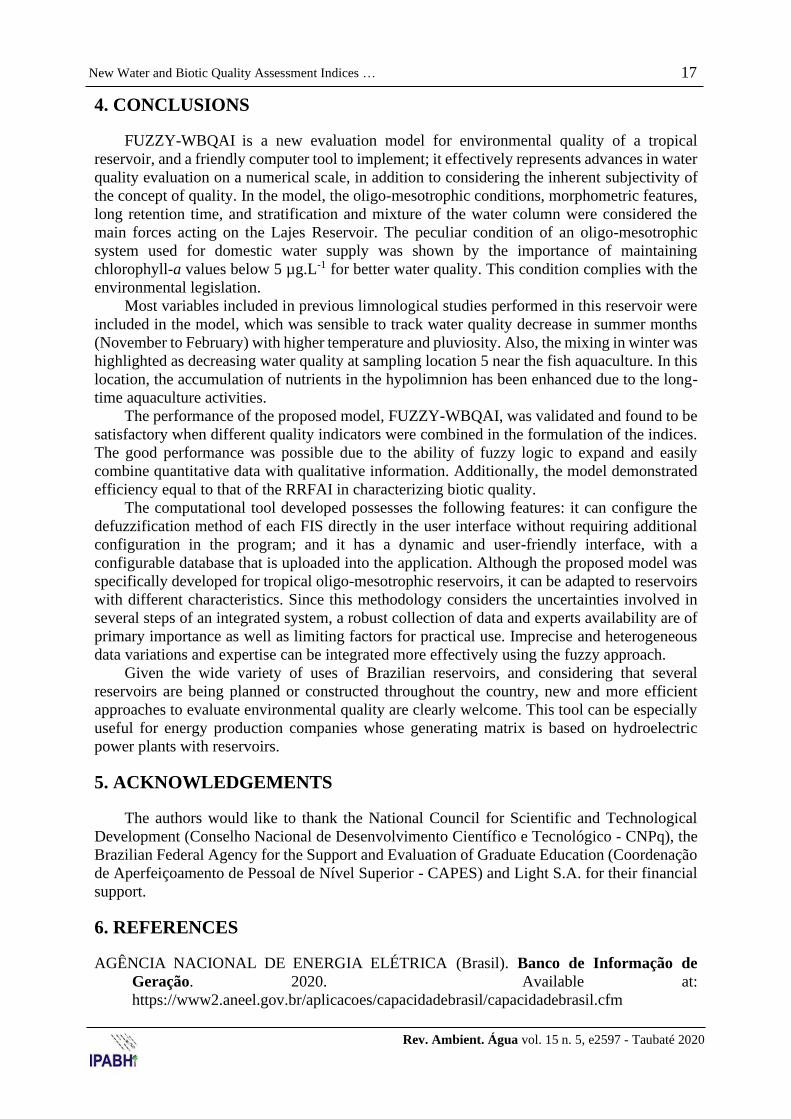
To evaluate the biotic index, a sampling location was selected from the 24 locations used
for fishing and listed in Figure 1. The position number 6 was chosen due to the abundant
quantity of data compared to the other sampling locations. All the samples collected from that
location between the years 1994 and 2011 were used, producing a total of 19 samples.
Similar to the results of the FUZZY-WBQAI for water quality analysis, the behaviour of
the FUZZY-WBQAI for biotic quality sub-indices followed the complete logic used in the
formulation of the rules. For example, in sub-index B, the combination of a low biomass
percentage of non-native species with a high number of native Characiformes generated good
biotic quality levels in the first samples. Also, a decrease in the number of native Characiformes
and an increase of the biomass percentage produced a reduction in the quality value; as the
Shannon index decreased and dominance increased, the value of sub-index C decreased.
A comparison of the RRFAI (Terra and Araújo, 2011) and FUZZY-WBQAI (Figure 9)
shows that both indices followed the same pattern of variation for the samples. The FUZZY-
WBQAI biotic quality index presents quality values that are slightly higher than those of the
RRFAI.
Figure 9. Results of the FUZZY-WBQAI Biotic Index vs. the RRFAI.
17 New Water and Biotic Quality Assessment Indices …
Rev. Ambient. Água vol. 15 n. 5, e2597 - Taubaté 2020
4. CONCLUSIONS
FUZZY-WBQAI is a new evaluation model for environmental quality of a tropical
reservoir, and a friendly computer tool to implement; it effectively represents advances in water
quality evaluation on a numerical scale, in addition to considering the inherent subjectivity of
the concept of quality. In the model, the oligo-mesotrophic conditions, morphometric features,
long retention time, and stratification and mixture of the water column were considered the
main forces acting on the Lajes Reservoir. The peculiar condition of an oligo-mesotrophic
system used for domestic water supply was shown by the importance of maintaining
chlorophyll-a values below 5 µg.L-1 for better water quality. This condition complies with the
environmental legislation.
Most variables included in previous limnological studies performed in this reservoir were
included in the model, which was sensible to track water quality decrease in summer months
(November to February) with higher temperature and pluviosity. Also, the mixing in winter was
highlighted as decreasing water quality at sampling location 5 near the fish aquaculture. In this
location, the accumulation of nutrients in the hypolimnion has been enhanced due to the long-
time aquaculture activities.
The performance of the proposed model, FUZZY-WBQAI, was validated and found to be
satisfactory when different quality indicators were combined in the formulation of the indices.
The good performance was possible due to the ability of fuzzy logic to expand and easily
combine quantitative data with qualitative information. Additionally, the model demonstrated
efficiency equal to that of the RRFAI in characterizing biotic quality.
The computational tool developed possesses the following features: it can configure the
defuzzification method of each FIS directly in the user interface without requiring additional
configuration in the program; and it has a dynamic and user-friendly interface, with a
configurable database that is uploaded into the application. Although the proposed model was
specifically developed for tropical oligo-mesotrophic reservoirs, it can be adapted to reservoirs
with different characteristics. Since this methodology considers the uncertainties involved in
several steps of an integrated system, a robust collection of data and experts availability are of
primary importance as well as limiting factors for practical use. Imprecise and heterogeneous
data variations and expertise can be integrated more effectively using the fuzzy approach.
Given the wide variety of uses of Brazilian reservoirs, and considering that several
reservoirs are being planned or constructed throughout the country, new and more efficient
approaches to evaluate environmental quality are clearly welcome. This tool can be especially
useful for energy production companies whose generating matrix is based on hydroelectric
power plants with reservoirs.
5. ACKNOWLEDGEMENTS
The authors would like to thank the National Council for Scientific and Technological
Development (Conselho Nacional de Desenvolvimento Científico e Tecnológico - CNPq), the
Brazilian Federal Agency for the Support and Evaluation of Graduate Education (Coordenação
de Aperfeiçoamento de Pessoal de Nível Superior - CAPES) and Light S.A. for their financial
support.
6. REFERENCES
AGÊNCIA NACIONAL DE ENERGIA ELÉTRICA (Brasil). Banco de Informação de
Geração. 2020. Available at:
https://www2.aneel.gov.br/aplicacoes/capacidadebrasil/capacidadebrasil.cfm
Rev. Ambient. Água vol. 15 n. 5, e2597 - Taubaté 2020
18 Andres Paladines Andrade et al.
ANDRADE, A. B. P. Modelo Inteligente de Avaliação da Qualidade de Água e da
Qualidade Ambiental para um Reservatório Tropical Oligo-mesotrófico. 2013.
Dissertation - Pontifical Catholic University, Rio de Janeiro, 2013.
ANGULO, C.; CABESTANY, J.; RODRIGUEZ, P.; BATLLE, M.; GONZÁLEZ, A.;
CAMPOS, S. Fuzzy expert system for the detection of episodes of poor water quality
through constant measurement. Expert Systems with Applications, v. 39, p. 1011-1020,
2012. https://doi.org/10.1016/j.eswa.2011.07.102
APPELBERG, M.; BERGQUIST, B. C.; DEGERMAN, E. Using fish to assess environmental
disturbance of Swedish lakes and streams—a preliminary approach. Verhandlungen der
Internationalen Vereinigung fuer Limnologie, n. 27, p. 311–315, 2000.
https://doi.org/10.1080/03680770.1998.11901244
BRANCO, C. W. C.; LEAL, J. J. F.; HUSZAR, V. L. M.; FARIAS, D. S.; SAINT'PIERRE, T.
D.; SOUSA-FILHO, I. F.; KOZLOWSKY-SUZUKI, B. New lake in a changing world:
The construction and filling of a small hydropower reservoir in the tropics (Rio de Janeiro.
Brazil). Environmental Science and Pollution Research, n. 26, p. 36007–36022, 2019.
https://doi.org/10.1007/s11356-019-06665-y
BRANCO, C. W. C.; KOZLOWSKY-SUZUKI, B.; SOUSA-FILHO, I.F.; GUARINO, A. W.
S.; ROCHA, R. J. Impact of climate on the vertical water column structure of Lajes
Reservoir (Brazil): A tropical reservoir case. Lakes Reservoirs Research Management,
n. 4, p. 175-191, 2009. https://doi.org/10.1111/j.1440-1770.2009.00403.x
BRANDIMARTE, A. L.; ANAYA, M.; SHIMIZU, G. Y.; MEIRELLES, S. T.; CANEPPELE,
D. Impact of damming the Mogi-Guaçu River Impact of damming the Mogi-Guaçu River
(São Paulo State, Brazil) on reservoir limnological variables. Lakes Reservoirs
Research Management, n. 13, p. 23–35, 2008. https://doi.org/10.1111/j.1440-
1770.2007.00359.x
BROWN, R. M.; MCCLELLAND, N. I.; DEININGER, R. A.; TOZER, R. G. A Water Quality
Index - Do We Dare? Water and Sewage Works, n. 117, p. 339-343, 1970.
BUSCH, W. D. N.; SLY, P. G. The Development of an Aquatic Habitat Classification
System for Lakes. Boca Raton: CRC Press, 1992.
CARLSON, R. E. A Trophic State Index for Lakes. Limnology and Oceanography, n. 22, p.
361-369, 1977. https://doi.org/10.4319/lo.1977.22.2.0361
CETESB. Relatório 57 de Qualidade das Águas Interiores do Estado de São Paulo, 2004,
2005 and 2006. São Paulo, 2006.
CHANG, H. Spatial analysis of water quality trends in the Han River basin, South Korea.
Water Research, v. 42, p. 3285–3304, 2008.
https://doi.org/10.1016/j.watres.2008.04.006
CHEN, Q.; MYNETT, A. E. Integration of data mining techniques and heuristic knowledge in
fuzzy logic modelling of eutrophication in Taihu Lake. Ecological Modelling, n. 162, p.
55–67, 2003. https://doi.org/10.1016/S0304-3800(02)00389-7
19 New Water and Biotic Quality Assessment Indices …
Rev. Ambient. Água vol. 15 n. 5, e2597 - Taubaté 2020
CONAMA (Brasil). Resolução nº 357 de 17 de março de 2005. Dispõe sobre a classificação
dos corpos de água e diretrizes ambientais para o seu enquadramento, bem como
estabelece as condições e padrões de lançamento de efluentes, e dá outras providências.
Diário Oficial [da] União: seção 1, Brasília, DF, n. 053, p. 58-63, 18 mar. 2005.
CUNHA, D. G. F.; CALIJURI, M. C.; LAMPARELLI, M. C. A trophic state index for
tropical/subtropical reservoirs (TSItsr). Ecological Engineering, n. 60, p. 126–134, 2013.
https://doi.org/10.1016/j.ecoleng.2013.07.058
D'HEYGERE, T.; GOETHALS, P. L. M.; DE PAUW, N. Use of genetic algorithms to select
input variables in decision tree models for the prediction of benthic macroinvertebrates.
Ecological Modelling, n. 160, p. 291–300, 2003. https://doi.org/10.1016/S0304-
3800(02)00260-0
DRAKE, M. T.; PEREIRA, D. L. Development of a fish-based index of biotic integrity for small
inland lakes in central Minnesota. North American Journal of Fisheries Management,
n. 22, p. 1105–1123, 2002. https://doi.org/10.1577/1548-
8675(2002)022%3C1105:DOAFBI%3E2.0.CO;2
FORIO, M. A. E.; MOUTON, A.; LOCK, K.; BOETS, P.; NGUYEN, T. H. T.; DAMANIK A.;
MINAR, N.; MUSONGE, O. L. S.; DOMINGUEZ-GRANDA, L.; GOETHALS, P. L. M.
Fuzzy modelling to identify key drivers of ecological water quality to support decision
and policy making. Environmental Science & Policy, n. 68, p. 58–68, 2017.
https://doi.org/10.1016/j.envsci.2016.12.004
GARCIA, C. A. B.; SILVA, I. S.; MENDONÇA, M. C. S.; GARCIA, H. L. Evaluation of Water
Quality Indices: Use, Evolution and Future Perspectives. Advances in Environmental
Monitoring and Assessment, 2018. https://doi.org/10.5772/intechopen.79408
GHOLAMI, V.; KHALEGHI, M. R.; TAGHVAYE SALIMI, E. Groundwater quality modeling
using self-organizing map (SOM) and geographic information system (GIS) on the
Caspian southern coasts. Journal of Mountain Science, n. 17, p. 1724–1734, 2020.
https://doi.org/10.1007/s11629-019-5483-y
GHOLAMI, V.; AGHAGOLI, H.; KALTECH, A.M. Modeling sanitary boundaries of drinking
water wells on the Caspian Sea southern coasts, Iran. Environmental Earth Sciences, v.
74, n. 4, p. 2981–2990, 2015. https://doi.org/10.1007/s12665-015-4329-3
GHOLAMI, V.; KHALEGHI, M. R.; SEBGHATI, M. A method of groundwater quality
assessment based on fuzzy network-CANFIS and geographic information system (GIS).
Applied Water Science, n. 7, p. 3633–3647, 2017. https://doi.org/10.1007/s13201-016-
0508-y
GONÇALVES, L. B.; VELLASCO, M.; PACHECO, M. Inverted Hierarchical Neuro-Fuzzy
BSP System: A Novel Neuro-Fuzzy Model for Pattern Classification and Rule Extraction
in Databases, IEEE Trans. On Systems, Man, and Cybernetics – Part C: Applications
and Reviews, v. 36, n. 2, 2006. https://dx.doi.org/10.1109/TSMCC.2004.843220
GUARINO, A. W. S.; BRANCO, C. W. C.; DINIZ, G. P.; ROCHA, R. Limnological
Characteristics of an Old Tropical Reservoir (Ribeirão das Lajes Reservoir, RJ, Brazil).
Acta Limnologica Brasiliensia, n. 17, p. 129-141, 2005.
HORTON, R. K. An index number system for rating water quality. Journal of Water Pollution
Control Federation, n. 37, p. 300-306, 1965.
Rev. Ambient. Água vol. 15 n. 5, e2597 - Taubaté 2020
20 Andres Paladines Andrade et al.
ICAGA, Y. Fuzzy evaluation of water quality classification. Ecological Indicators, n. 7, p.
710–718, 2007. https://doi.org/10.1016/j.ecolind.2006.08.002
JANG, J. S. R.; SUN, C. T. Neuro-fuzzy modeling and control. Proceedings IEEE, v. 83, n. 3,
p. 378–406, 1995. https://dx.doi.org/10.1109/5.364486
JENNINGS, M. J.; FORE, L.S.; KARR, J. R. Biological monitoring of fish assemblages in
Tennessee Valley reservoirs. Regulated Rivers: Research & Management, n. 11, p.
263–274, 1995. https://doi.org/10.1002/rrr.3450110303
JIN, Y. Fuzzy modeling of high-dimensional systems: complexity reduction and interpretability
improvement. IEEE Transactions on Fuzzy Systems, v. 8, n. 2, p. 212–221, 2000.
https://doi.org/10.1109/91.842154
KLIPPEL, G.; MACÊDO, R.L.; BRANCO, C. W. C. Comparison of different trophic state
indices applied to tropical reservoirs. Lakes & Reservoirs Research & Management,
v. 25, n. 2, p. 214-229, 2020. https://doi.org/10.1111/lre.12320
LEE, C. S.; CHANG, S. P. Interactive fuzzy optimization for an economic and environmental
balance in a river system. Water Research, v. 39, p. 221–231, 2005.
https://doi.org/10.1016/j.watres.2004.09.013
LERMONTOV, A.; YOKOYAMA, L.; LERMONTOV, M.; MACHADO, M. River quality
analysis using fuzzy water quality index: Ribeira do Iguape River watershed. Ecological
Indicators, n. 9, p. 1118–1197, 2009. https://doi.org/10.1016/j.ecolind.2009.02.006
LIOU, Y. T.; LO, S. L. A fuzzy index model for trophic status evaluation of reservoir waters.
Water Research, n. 39, p. 1415–1423, 2005.
https://doi.org/10.1016/j.watres.2005.01.014
LU, R. S.; LO, S. L.; HU, J. Y. Analysis of reservoir water quality using fuzzy synthetic
evaluation. Stochastic Environmental Research and Risk Assessment, n. 13, p. 327–
336, 1999. https://doi.org/10.1007/s004770050054
MOURHIR A.; RACHIDI T.; KARIM M. River water quality index for Morocco using a fuzzy
inference system. Environmental Systems Research, n. 3, p. 1–12, 2014.
https://doi.org/10.1186/s40068-014-0021-y
OCAMPO-DUQUE, W.; FERRÉ-HUGUET, N.; DOMINGO, J.L.; SCHUHMACHER, M.
Assessing water quality in rivers with fuzzy inference systems: A case study.
Environment International, n. 32, p. 733–742, 2006.
https://doi.org/10.1016/j.envint.2006.03.009
OCAMPO-DUQUE, W.; OSORIO, C.; PIAMBA, C.; SHUMAHMACHER, M.; DOMINGO,
J. L. Water quality analysis in rivers with non-parametric probability distributions and
fuzzy inference systems: Application to the Cauca River. Environment International,
n. 52, p. 17–28, 2013. https://doi.org/10.1016/j.envint.2012.11.007
PINTO, V. G.; LIMA, R. N. S.; SANTOS, R. C. P.; RIBEIRO, C. B. M. Influência do número
de classes na determinação da suscetibilidade morfométricas à inundação. Revista
Ambiente & Água, v. 11, n. 3, 2016. https://doi.org/10.4136/ambi-agua.1842
21 New Water and Biotic Quality Assessment Indices …
Rev. Ambient. Água vol. 15 n. 5, e2597 - Taubaté 2020
RECKNAGEL, F.; BRANCO, C. W. C.; CAO, H.; HUSZAR, V. L. M.; SOUSA-FILHO, I.
Modelling and forecasting the heterogeneous distribution of picocyanobacteria in the
tropical Lajes Reservoir (Brazil) by evolutionary computation. Hydrobiologia, n. 749, n.
1, p. 53–67, 2015. https://doi.org/10.1007/s10750-014-2144-6
ROCHA, M. I. A.; RECKNAGEL, F.; MINOTI, R. T.; HUSZAR, V. L. M.; KOZLOWSKY-
SUZUKI, B.; CAO, H.; STARLING, F. L. R. M.; BRANCO, C. W. C. Assessing the effect
of abiotic variables and zooplankton on picocyanobacterial dominance in two tropical
mesotrophic reservoirs by means of evolutionary computation. Water Research, n. 149,
p. 120–129, 2019. https://doi.org/10.1016/j.watres.2018.10.067
ROSET, N.; GRENOUILLET, G.; GOFFAUX, D.; PONT, D.; KESTEMONT, P. A review of
existing fish assemblage indicators and methodologies. Fisheries Management and
Ecology n.14, p.393–405, 2007. https://doi.org/10.1111/j.1365-2400.2007.00589.x
SALSKI, A. Fuzzy clustering of fuzzy ecological data. Ecological Informatics, n. 2, p. 262–
269, 2007. https://doi.org/10.1016/j.ecoinf.2007.07.002
SANTOS, A.R.; SILVA, R. C. F.; ASSIS, L. C.; MAUAD, F. F. Defining environmental
conservation anthropic activity in the Uberaba River Basin protected area. Revista
Ambiente & Água, v. 14 n. 1, 2019. https://dx.doi.org/10.4136/ambi-agua.2279
SCARDI, M.; CATAUDELLA, S.; DIDATO, P.; FRESI, E.; TANCIONI, L. An expert system
based on fish assemblages for evaluating the ecological quality of streams and rivers.
Ecological Informatics, n. 3, p. 55-63, 2008.
https://doi.org/10.1016/j.ecoinf.2007.10.001
SEMIROMI, F. B.; HASSANI, A. H.; TORABIAN, A.; KARBASSI, A. R.; HOSSEINZADEH,
F. L. Water quality index development using fuzzy logic: A case study of the Karoon
River of Iran. African Journal of Biotechnology, n. 10, p. 10125–10133, 2011.
https://doi.org/10.5897/AJB11.1608
SILVA, L. H. S.; HUSZAR, V. L. M.; MARINHO, M. M.; RANGEL, L. M.; BRASIL, J.;
DOMINGUES, C. D.; BRANCO, C. C.; ROLAND, F. Drivers of phytoplankton,
bacterioplankton and zooplankton carbon biomass in tropical hydroelectric reservoirs.
Limnologica, n. 48, p. 1-10, 2014. https://doi.org/10.1016/j.limno.2014.04.004
SILVERT, W. Fuzzy indices of environmental conditions. Ecological Modelling, n. 130, p.
111–119, 2000. https://doi.org/10.1016/S0304-3800(00)00204-0
SOARES, M. C. S.; MARINHO, M. M.; HUSZAR, V. L. M.; BRANCO, C. W. C.; AZEVEDO,
S. M. F. O. The effects of water retention time and watershed features on the limnology
of two tropical reservoirs in Brazil. Lakes Reservoirs Research Management, n. 13, p.
257-269, 2008. https://doi.org/10.1111/j.1440-1770.2008.00379.x
SOUZA, L. C.; BRANCO, C. W. C.; DOMINGOS, P.; BONECKER, S. L. C. Zooplankton of
an urban coastal lagoon: composition and association with environmental factors and
summer fish kill. Zoologia, n. 28, p. 357-364, 2011. https://doi.org/10.1590/S1984-
46702011000300010
SOYUPAK, S.; CHEN, D. G. Fuzzy Logic Model to Estimate Seasonal Pseudo Steady State
Chlorophyll-A Concentrations in Reservoirs. Environmental Modeling and
Assessment, n. 9, p. 51–59, 2004.
https://doi.org/10.1023/B:ENMO.0000020890.57185.92
Rev. Ambient. Água vol. 15 n. 5, e2597 - Taubaté 2020
22 Andres Paladines Andrade et al.
TAHERIYOUN, M.; KARAMOUZ, M.; BAGHVAND, A. Development of an entropy- based
fuzzy eutrophication index for reservoir water quality evaluation. Iranian Journal of
Environmental Health Science & Engineering, v. 7, n. 1, p. 1-14, 2010.
TERRA, B. D. F.; ARAÚJO, F. G. A preliminary fish assemblage index for a transitional river-
reservoir system in southeastern Brazil. Ecological Indicators, n. 11, p. 874-881, 2011.
https://doi.org/10.1016/j.ecolind.2010.11.006
THORTON, K. W. Perspectives on Reservoir Limnology. In: THORNTON, K. W.; KIMMEL,
B. L.; PAYNE, F. E. (eds.). Reservoir limnology: ecological perspectives. New York:
John Wiley & Sons, 1990. p. 1-12.
VARGAS, R. R.; BARROS, M. S.; SAAD, A. R.; ARRUDA, R. O. M.; AZEVEDO, F. D.
Assessment of the water quality and trophic state of the Ribeirão Guaraçau Watershed,
Guarulhos (SP): a comparative analysis between rural and urban areas. Revista
Ambiente & Água, n. 13, p. 1-13, 2018. https://doi.org/10.4136/ambi-agua.2170