Embed Size (px)
Citation preview

New Year & Christmas 2018 Spending Survey11 December 2017

New Year & Christmas 2018 Spending Survey
2
Contents
Key survey observations 04
Economy and wealth 07
Russians’ New Year budget structure 12
Omni-channel retailing 17
Consumer behavior 23
Research methodology 27
Contacts 28

New Year & Christmas 2018 Spending Survey
3
Deloitte presents the 20th annual global survey of consumer spending ahead of the Christmas and New Year holiday season.

New Year & Christmas 2018 Spending Survey
4
Key survey observations
Online shopping appeals to Russians mostly due to the easy access to product reviews, as well as convenience when searching for goods.
Four out of five people in Russia are concerned about personal data security when shopping online.
Meanwhile, Russians’ actual spending during the last holiday season happened to be 1% higher than was originally planned (RUB 16,900).
The average Russian’s holiday budget structure is expected to remain unchanged: gifts (44%), food and drinks (45%), and entertainment (11%).
Similarly to last year, about one third of Russians who are planning to shop for gifts online intend to make such purchases via foreign marketplaces.
60% of Russians use bank cards as their preferred method of payment, which is in line with the European average. Meanwhile, Russians tend more often to use debit cards to pay for gifts, as opposed to Europeans, who mainly prefer credit cards.
The average Russian’s planned holiday budget is expected to reach RUB 17,600, which is 4% higher than last year’s actual spending (RUB 17,000).
The share of Russians who plan to benefit from Black Friday discounts and promotions has increased from 46% to 53%. Meanwhile, 10% of Russians remain unaware of the existence of Black Friday.

New Year & Christmas 2018 Spending Survey
5
Key survey observations
The share of Russians who believe that the economy is in a recession has decreased from 66% to 51%. This represents the most optimistic outlook on the economy in the last three years of the survey; however, it is still one of the most pessimistic perceptions in Europe.
This year Russians plan to purchase 33% of gifts before 15 December (compared to 28% last year), while 26% of gifts will be bought during the last week of December (compared to 28% last year).
Next year, 16% of Russians expect the economy to grow, and 33% expect a recession. One in five Russians has no idea of what to expect from the economy, which is twice as high when compared with the European average.
For the first time in four years, there is positive dynamics in the Russians’ purchasing power. The percentage of those who feel that their purchasing power improved has increased from 9% to 12%, and the percentage of those who felt they could spend less decreased from 53% to 44%.
Most Russians will purchase gifts from specialized chains (29%), as well as hyper- and supermarkets (21%).
Russians are more likely (18%) than Europeans (12%) to ask for pre-chosen gifts from their relatives and friends.
Similarly to last year, money is by far the most desired gift (men: 65%, and women: 73%). Second place is occupied by tablet devices and computers for men (42%), and travel for women (53%). However, traditionally they are likely to receive chocolates (45%) and cosmetics (42%).
In addition to discounts, customers anticipate improvements from retail stores in the following areas: opportunities for a quick exchange or return of goods (38%), distribution of information on available goods and discounts (36%).
The percentage of Russians who expect their purchasing power to grow next year has also increased from 18% to 23%.
The main reason behind the increase in purchasing power is the growth in income (54%). In Europe this figure is two times lower.

New Year & Christmas 2018 Spending Survey
6
Russian retail market regained growth in dollar terms
Russian retail market:ruble sales continue to grow steadily
Source: Economist Intelligence Unit
Size of the retail market (USD bln) Size of the Russian retail market
• The Russian retail market is predicted to grow in dollar terms for the first time in recent years on the back of the ruble appreciation in 2017 and persistent growth in ruble terms — preliminary estimates put the growth rate at 23%.
• According to early estimates, the Russian retail market will account for 12% of the whole European market due to a decline in the UK retail market following Brexit in 2016 and thanks to the Russian retail market’s growth in 2017. This will put Russia ahead of the UK, in 3rd place after Germany and France.
• Retail sales in Russia continue their strong growth in ruble terms: ruble sales are forecast to increase by 7% in 2017 and continue to grow throughout 2018-2020.
40
35
30
25
20
15
10
5
0
800
700
600
500
400
300
200
100
0
Source: Economist Intelligence Unit
Russian growth, %
European growth, %
40%
30%
20%
10%
0%
-10%
-20%
-30%
-40%
800
600
400
200
0-
2009 20092008 20082011 20112013 20132015
6%
20152017F 2017F2010 20102012 20122014 20142016 20162018F 2018F2019F 2019F2020F 2020F
+7%+7%
+7%
23%
• The market is expected to continue its growth in dollar terms in 2018–2020. However, this growth will be rather moderate, and 2020 retail sales in Russia are expected to only come close to 2011 levels.
Russian sales, USD bn Russian sales, USD bn (left axis)
Russian share in Europe, % Russian sales, RUB tr (right axis)

New Year & Christmas 2018 Spending Survey
7
Economy and wealth Consumer perceptions and purchasing power

New Year & Christmas 2018 Spending Survey
8
Current view of the economic conditions in Russia: peak pessimism has passed
Current perception of the economy
Russia 2017 • The share of Russians who believe that the economy is in a recession has decreased from 66% to 51% during 2017.
• For the first time over the last three years, Russians became more optimistic about the current economic conditions. This holds out hope for further improvement of purchasing power in the future.
• The recession is being felt the most by Russians who were born between 1980–2000.
• This year, both men and women shared the same view on the economy: nearly half of them said that there is a recession in 2017.
• The number of elderly people who believe that Russia’s economy is in a recession is down from the last year and amounts to 46% (69% in 2016).
6%3%
51%
51%
51%
36%
36%
7%
7%
6%
6%
52%
55%
37%
33%
7%
7%
4%
5%
51%
53%
46%
36%
33%
43%
7%
7% 8%
6%
7%3%
66%
5%
Russia 2016
7%
36%
Growth Stability Recession I don’t know
Positive Neutral Negative I don’t know
Average
Average
Male
18-34
Female
35-54 55+
25%

New Year & Christmas 2018 Spending Survey
9
Russians are once again optimistic about the future
Expectations of the economy in 2018
Russian level of pessimism regarding the economy
• The share of Russians who expect economic growth in the next year has increased by more than twofold as compared to last year, up to 16%.
• The peak of the crisis sentiment in 2016 has been overcome and Russians are once again optimistic about their future.
Improvement 7% in 2016
Deterioration51% in 2016
70%
60%
50%
40%
30%
20%
10%
0%200920082007
% – Percentage of those perceiving a recession / expecting a deterioration
2011 2013 2015 2017 2018F2010 2012 2014 2016
20%26%
51%
36%
50%
33%37%
30%
54%
66%
51%
33%
16%16%
33%
29%
33%
Improvement
Deterioration
Stabilisation
}
}
• Russians’ expectations regarding the recession (33%) are close to the 2014 level (30%). Russian expectations regarding the recession are similar to the average expectations in the EU.
• Greece holds the most pessimistic view in the EU with 60% of respondents indicating a recession in 2018.

New Year & Christmas 2018 Spending Survey
10
Purchasing power begins to recover
• This year has seen an increase in the number of Russians who feel that their purchasing power has improved (from 9% to 12%), in addition to a decrease in the number of those who perceived a deterioration in their purchasing power–from 53% to 44%.
• Young Russians (aged 18-34) demonstrate the most optimistic sentiment regarding their purchasing power: the share of those who believe that their purchasing power improved has increased from 13% in 2016 to 20% in 2017.
• The main reason for the improvement in purchasing power is the growth in personal income (54%) which is nearly twice as high as in Europe (23%).
• Similarly to last year, one third of respondents noted that promotional campaigns encourage them to spend more.
• Moreover, 23% of respondents expect their purchasing power to improve in the next year (18% in 2016). The share of Russians who believe that their purchasing power will deteriorate in the next year has fallen to 22% (28% in 2016).
44% 12%
43% 11%
35% 20%
53% 9%
45% 13%
52% 8%
48% 6%
36% 17%
Russia:
2017
2016
Male
Growth in personal income
Denial of economic instability
Promotional campaigns
Improved stability of the economic situation
Consumer reviews and rankings
Emergence of product innovations
Offers and advice
Acceptable borrowing terms
Other
Female
18-34
35-54
55+
Europe2017
You have less to spend You have more to spend
Reasons for Russians’ increased spending
54%
39%
32%
25%
19%
16%
11%
6%
4%
1
1
1
1

New Year & Christmas 2018 Spending Survey
11
Purchasing power begins to recover, %
• After long period of time, in 2018 number of Russians who feel that their purchasing power will improve is reaching parity with those who perceived a deterioration in their purchasing power.
80%
70%
60%
50%
40%
30%
20%
10%
0%
You have less to spendYou have more to spend
200920082007 2011 2013 20152010 2012 2014 2016 2017 2018F
27%
26%
44%
53%
12%9%

New Year & Christmas 2018 Spending Survey
12
Russians’ New Year budget structure Presents people want, and presents people get

New Year & Christmas 2018 Spending Survey
13
The average Russian’s holiday budget is expected to be 4% higher than last year’s spending
Holiday spending of the average Russian in euros
Holiday budget structure in euros
• The average Russian’s planned holiday budget amounts to RUB 17,600 (EUR 262), which is 4% higher than last year’s actual spending of RUB 17,000 (EUR 253).
• Economic instability has taught Russians to balance their checkbooks over the holidays: actual spending in the last holiday season happened to be 1% higher than was originally planned (RUB 16,900).
• The average Russian’s holiday budget structure is expected to remain unchanged: gifts (44%), food and drinks (45%), and entertainment (11%).
• Gifts account for 52% of Europeans’ budget which is 8% higher than that of Russians.
Exchange rate used this year: 67.1 RUB/EURPrior year: 67.6 RUB/EUR
€ 600
€ 500
€ 400
€ 300
€ 200
€ 100
€ 0
Russia Budget 2017
Russia actual 2016
Europe Budget 2017
€ 100€ 0 € 300€ 200 € 400
Actual spendingPlanned budget
Gifts Food and beverages Entertainment
196
110
115
133
114
116
51
29
31
20092008 2011 2013 20152010 2012 2014 2016 2017
€ 245
€ 250
€ 262€ 253

New Year & Christmas 2018 Spending Survey
14
Most Russians want to receive money as a gift
Most desired gifts
• The top 10 most desired gifts remained almost the same, with only books gaining three positions and tablets moving down one position.
• Money traditionally ranks well ahead of all other most desired gifts.
• Men’s gift preferences did not change much in 2017 with computers moving up one position and smartphones/mobile phones and travel losing one position.
• Books are gaining popularity as a desired gift for men (up five positions).
• Beauty care, which advanced two positions in 2017, is gaining popularity as a desired gift for women. Likely in response to purchasing power improvements in 2017, women are spending more on cosmetics and beauty care services which they could not afford earlier.
Men Women
69%
65% 73%41%
42% 53%
37%
36%49%
36%
28%43%
33%
26% 41%
31%
31%
30%
29%
29%
3
1
5
2
1
1
1
Money
Travel
Smartphone/mobile phone
Laptop/PC Computer
Cosmetics/perfumes
Chocolates
Jewellery/watch
Event tickets
Books
Tablets
Money
Laptop/PC Computer
Smartphone/mobile phone
Travel
Books
Money
Travel
Cosmetics/perfumes
Beauty care/massage/SPA
Chocolates

New Year & Christmas 2018 Spending Survey
15
Gift vouchers and books to be the top gift choices for purchase
Most popular gifts
• Chocolates, cosmetics and perfumes remain the most popular gift Russians buy for others.
• This year Russians will be more likely to set their sights on gift vouchers and gift sets when shopping for holiday presents. Books are also a much more likely option than last year (up from seventh to fifth place).
• This year men are much more likely to receive books as presents (two positions up from 2016).
• Men will also have a higher chance of getting money, which climbed up one position from last year to rank second in the list of the most popular gift choices for men.
• Russians’ patterns of selecting gifts for women are relatively stable: the top 5 most popular gifts Russians buy for women stay virtually unchanged year-in and year-out.
• Though travel is the most desired gift for women, they are most likely to receive something else (ranked 34th).
45%
36% 52%42%
33% 51%
31%
32% 29%
22%
22% 27%
19%
18% 21%
19%
16%
16%
15%
15%
1
2
2
4
1
2 15
21
Chocolates
Cosmetics/perfumes
Money (cash)
Gift vouchers
Books
Food and beverages
Gift sets
Cooking accessories
Event tickets
Smartphones/mobile phones
Chocolates
Money (cash)
Cosmetics/perfumes
Smartphones/mobile phones
Books
Chocolates
Cosmetics/perfumes
Money (cash)
Gift vouchers
Food and beverages
Men Women

New Year & Christmas 2018 Spending Survey
16
Construction kits and learning games or consoles and smartphones — what will teenagers receive?
Gift choices for teenagers (12 to 18 years of age) Gift choices for children under 12 years of age
• In 2017, consoles, construction kits, games and toys are gaining popularity as gifts for teens, while clothes, event tickets and sports equipment are losing ground.
• Unlike men and women, teenagers are more likely to get money for Christmas.
• The top options for children under 12 years of age are various games and toys.
• Clothes and shoes have become a less popular gift choice for children in 2017, compared to toys and games. Increased shopping for gifts (toys) for children may have been encouraged by purchasing power improvements.
42% 45%
23% 29%
21% 28%
21% 23%
15% 22%
13% 21%
12% 20%
12% 20%
12% 20%
11% 19%
7 1
8
2
2
1 2
4 2
6
3 1
6
Chocolates
Money (cash)
Books
Games
Console
Smartphones/mobile phones
Construction kits
Cosmetics/perfumes
Tabletop games
Learning toys
Construction kits
Dolls
Learning toys
Books for children
Baby goods (toys and clothes)
Games
Sports and leisure equipment
Learning games
Electronic toys
Clothes/shoes

New Year & Christmas 2018 Spending Survey
17
Omni-channel retailingThe Internet is an integral part of the shopping process

New Year & Christmas 2018 Spending Survey
18
I will not buy from overseas marketplaces
Less than 20%
20 – 50%
50 – 80%
80 – 100%
All of them
Search engines (Google, Yahoo)
Website of stores with one or more physical stores
Comparison sites (Pricing)
Website of stores without physical stores
Websites of brands/suppliers
Websites with coupons and offers
Email newsletters and online leaflet I receive via email
Forums and blogs
None of these
The share of online gift purchases in Russia is growing steadily
Where do people buy gifts?
Share of gifts to be purchased online Where people search for/compare desired products?
Portion of expected online purchases via foreign marketplaces
2011 2012
2013 2014
2015 2016
20170% 10% 20% 30% 40% 50% 60%
Russia
Europe Russia
15%
28%
28%
17%
9%
4%
• The share of online gift purchases in Russia is at approximately 29% and is likely to continue growing. However, Russia is still behind Europe where 37% of gifts are purchased online.
• Similarly to last year, about one third of Russians who are planning to shop for gifts online intend to make such purchases via foreign marketplaces.
• The most common and popular way to find desired gifts in Russia as well as in Europe in 2017 is through search engines with their contextual advertising, followed by online shops of offline retail chains.
• Compared to Europeans, Russians tend to be more thorough when buying gifts. People use special websites to compare prices.
Europe
22%20%
25% 24%27% 26%26% 26%
29%
23%
35%37%
25%
29%

New Year & Christmas 2018 Spending Survey
19
If a product is not available in an online store, only 15% of Russians will go to the physical store of the same retail chain
If a product is not available in an online store, Russians usually prefer to:
0% 10% 20% 30% 40% 50% 60%
2017
Use a search engine or comparison site to find it elsewhere
Go to a physical store of a different chain
Go to a physical store of the same chain
I never shop online
I would look for a different product
• If a product is not available in a familiar online store, people are most likely to first search for this product using another website (search engine, price comparison, etc.) or visit another known online store (53%).
• The same as last year, second place goes to “a physical store of a different retail chain”. Only 15% will go to a physical store of the same retail chain.
2016

New Year & Christmas 2018 Spending Survey
20
Russians particularly like online stores because of the opportunity to know other people’s opinions on products and the ease of finding and selecting products
Offline stores Online stores
• Online shopping is particularly attractive for Russians because it provides easy access to other customers’ reviews and the possibility to find goods more quickly and easily than in a physical store.
• Four out of five people in Russia are concerned about personal data security when shopping online, which hinders the development of the Internet as a sales channel.
• Physical stores are still above the competition in terms of the ease of product exchange or return, after sale services and protection of personal data.
I immediately receive the products I purchase
It is easy to exchange or return goods
After sale services (repair)
Good protection of my personal data
Safe payment services
I can get other consumers’ opinions on products
It is easy to search for and choose what I need
Broad assortment
Acceptable prices
I can compare prices easily
01 01
02 02
03 03
04 04
05 05

New Year & Christmas 2018 Spending Survey
21
Areas in which retailers should invest to improve customers’ shopping experience
Most popular responses Least popular responses
• In addition to price discounts, customers expect improvements in the following areas: quick exchange/return of goods (38%) and information about available goods and discounts (36%).
• Moreover, one in three Russians believes that offline retailers need to develop online stores as well.
• Customers are not interested in offline stores being green, offering self-packing services or developing mobile shopping offerings.
Lower prices
Quick return option
Information on available products and discounts
Home delivery
Online store
Child care
Being green
Mobile commerce
Self-packaging system
72%7%
38%6%
36%6%
33%4%
32%
New Year & Christmas 2018 Spending Survey
22
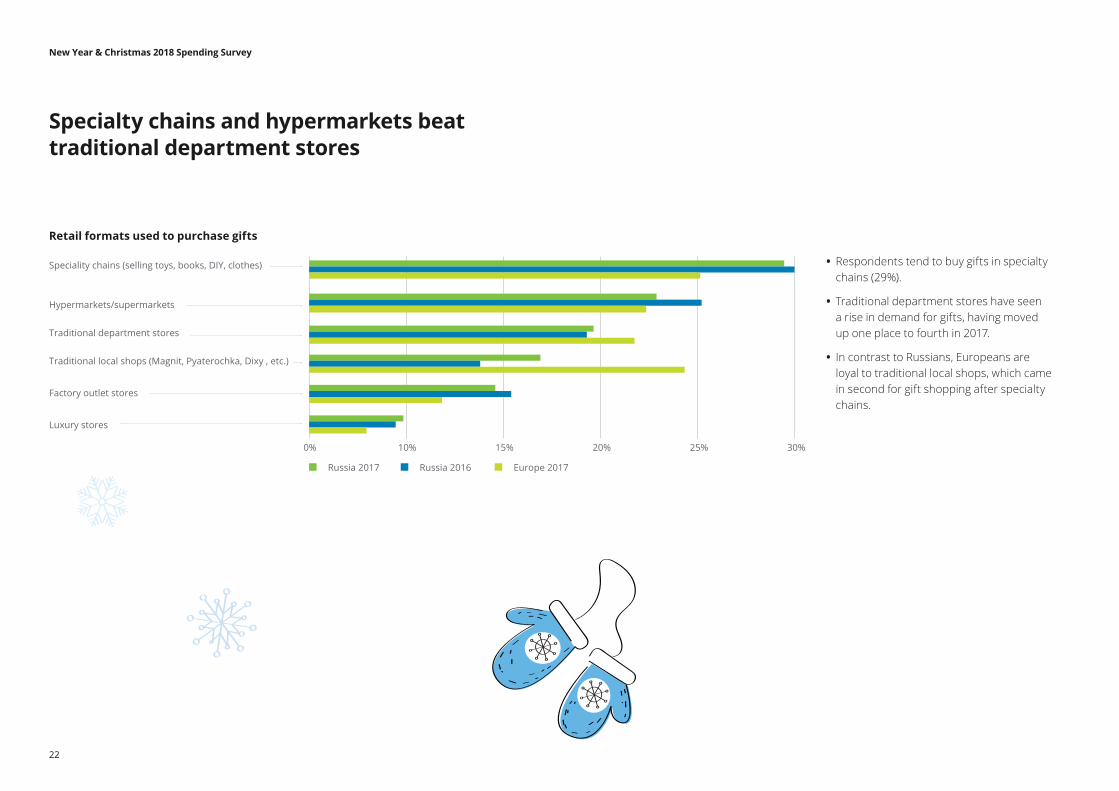
Specialty chains and hypermarkets beat traditional department stores
Retail formats used to purchase gifts
• Respondents tend to buy gifts in specialty chains (29%).
• Traditional department stores have seen a rise in demand for gifts, having moved up one place to fourth in 2017.
• In contrast to Russians, Europeans are loyal to traditional local shops, which came in second for gift shopping after specialty chains.
0% 10% 15% 20% 25% 30%
Speciality chains (selling toys, books, DIY, clothes)
Hypermarkets/supermarkets
Traditional department stores
Traditional local shops (Magnit, Pyaterochka, Dixy , etc.)
Factory outlet stores
Luxury stores
Russia 2017 Russia 2016 Europe 2017

New Year & Christmas 2018 Spending Survey
23
Consumer behavior Decision making and timing of purchases

New Year & Christmas 2018 Spending Survey
24
The shopping season in Russia has started earlier than last year
The appeal of Black Friday for holiday shopping is growing, with more Russians believing they will benefit from the deals offered
Share of gift purchases by time intervals
• Although Russians traditionally do their holiday shopping later than Europeans, this year’s shopping season in Russia will start earlier than last year’s.
• The number of Russians planning to do their holiday shopping in December decreased from 84% in 2016 to 77% in 2017. At the same time, the share of respondents intending to buy their gifts before December increased to 15% in 2017 as compared to 10% in 2016.
• In 2017, more Russians are planning on Black Friday shopping, which is a repeating trend; 53% will use at least some of the opportunities that Black Friday offers (as compared to 46% in 2016).
• In 2017, the share of Russians who are not aware of Black Friday decreased to 10% from 12% in 2016.
• 28% of Russians (32% in 2016) do not believe they can benefit from Black Friday deals, as either the discounts are small/artificial or irrelevant products are on sale.
To what extent are you going to leverage offers during Black Friday as part of your holiday shopping?
20172017
20162016
27%3%
23%2%
26%12%
23%8%
15%
18%
17%
18%
13%
33%
15%
39%
9%
26%
10%
28%
10%
1%
7%12%
1%
5%
Before November
November
1–15 December
16–24 December
25–31 December
January
* Black Friday
I will try to use the maximum of Black Friday opportunities relevant to my shopping needs
I will consider some of the deals on offer to save my holiday budget
I will avoid Black Friday shopping because I expect no significant discounts to normal prices
I will avoid Black Friday shopping because the exact products I need are usually not on offer
The Black Friday period is too early for my holiday shopping, I usually do it closer to the New Year
I do not know what Black Friday means

New Year & Christmas 2018 Spending Survey
25
Physical stores
Websites
I was directly asked for it
Word of mouth: friends/ neighbours/ family
Social media (Facebook, Instagram, Twitter, etc.)
TV
Newspapers and magazines
What channels of information are used for getting ideas and advice on gifts?
• Russians as well as Europeans are most influenced by the Internet and in-store advertisements and promotions.
• Russians use word of mouth more actively than Europeans (18% versus 12%), asking their relatives and friends to buy them pre-selected gifts.
• Newspapers and magazines are traditionally much less popular in Russia for gift ideas than they are in Europe (5% and 11% respectively).
22%
21%
12%
15%
10%
9%
11%
25%
23%
18%
14%
9%
6%
5%
Russia Europe

New Year & Christmas 2018 Spending Survey
26
Russians prefer non-cash payments when shopping for gifts
• Over half of Russians (60%) prefer using bank cards for their holiday shopping, which is in line with the European average.
• Using debit cards is the most popular payment method both in traditional and online stores. In Russia, they are used by 44% of respondents versus 36% in Europe. On the other hand, more Europeans (24%) than Russians (14%) prefer shopping with a credit card.
•
• Despite their concerns over personal data safety, the majority of Russians (51%) prefer to pay for their online holiday purchases with a debit card.
What payment methods are you planning to use for your in-store and online holiday shopping?
Offline purchases Online purchases
Debit card
Cash
Credit card
Other (checks, etc.)
Debit card
Qiwi Wallet, Yandex.Money, etc.
Credit card
Other (checks, etc.)
40%
39%
14% 51%
29%
17%
7% 3%

New Year & Christmas 2018 Spending Survey
27
Research methodology Details and approachThe survey was conducted in nine countries in Eastern and Western Europe from 9 to 16 October 2017.
The respondents are 18 to 65 years old. Information was collected via the Internet with a structured questionnaire distributed to a sample of individuals selected from a control group.
In order to adjust the Internet sample to the population of each country, we used ex-post statistical weighting based on gender and age in each country.
The Russian sample is more representative of the middle and upper social classes in large cities since the survey was carried out via the Internet.
This survey has been conducted since 1998.
Russia has been covered for ten years in a row.

New Year & Christmas 2018 Spending Survey
28
Contacts
Vladimir BiryukovPartnerMoscow, Audit, Head of the Retail, Wholesale & Distribution Group in the CIS+7 (495) 787 06 00, ext. 1860
Vasilyi Podobedov Senior ManagerMoscow, Audit, Consumer & Industrial Products Group in the CIS +7 (495) 787 06 00, ext. 1622
Egor Metelkin PartnerMoscow, Audit, Head of the Consumer & Industrial Products Group in the CIS+7 (495) 787 06 00, ext. 2320
Sergey Turushev DirectorMoscow, Audit, Consumer & Industrial Products Group in the CIS+7 (495) 787 06 00, ext. 2350

New Year & Christmas 2018 Spending Survey
29

deloitte.ruAbout Deloitte
Deloitte refers to one or more of Deloitte Touche Tohmatsu Limited, a UK private company limited by guarantee (“DTTL”), its network of member firms, and their related entities. DTTL and each of its member firms are legally separate and independent entities. DTTL (also referred to as “Deloitte Global”) does not provide services to clients. Please see www.deloitte.com/about for a more detailed description of DTTL and its member firms.
Deloitte provides audit, consulting, financial advisory, risk management, tax and related services to public and private clients spanning multiple industries. Deloitte serves four out of five Fortune Global 500® companies through a globally connected network of member firms in more than 150 countries bringing world-class capabilities, insights, and high-quality service to address clients’ most complex business challenges. To learn more about how Deloitte’s approximately 244,000 professionals make an impact that matters, please connect with us on Facebook, LinkedIn, or Twitter.
This communication contains general information only, and none of Deloitte Touche Tohmatsu Limited, its member firms, or their related entities (collectively, the “Deloitte Network”) is, by means of this communication, rendering professional advice or services. Before making any decision or taking any action that may affect your finances or your business, you should consult a qualified professional adviser. No entity in the Deloitte Network shall be responsible for any loss whatsoever sustained by any person who relies on this communication.
© 2017 ZAO Deloitte & Touche CIS. All rights reserved.


![Spending at Christmas [Infographic]](https://img.pdfslide.net/doc/110x75/55984b081a28ab81608b4608/spending-at-christmas-infographic.jpg)