Embed Size (px)
Citation preview
New York City Department of Environmental Protection
Bureau of Water Supply
Waterfowl Management Program
July 31, 2011
Prepared in accordance with the Final 2007 (Waterfowl Management Program-Section 4.1) of
the United States Environmental Protection Filtration Avoidance Determination
A Waterfowl Management Program was developed to evaluate and mitigate pollutant
impacts (fecal coliform bacteria) from migratory and resident waterbirds (waterfowl, gulls and
cormorants). The purpose of the study reported here, for the period April 1, 2010 to March 31,
2011, is to evaluate further the trends observed in bird numbers and their effect on fecal coliform
bacteria levels as a consequence of DEP’s Waterfowl Management Program.
Prepared by: Christopher A. Nadareski, Section Chief, Wildlife Studies
NYC Department of Environmental Protection
Bureau of Water Supply
Division of Watershed Water Quality Operations
2
TABLE OF CONTENTS
List of Figures 3-6
List of Tables 7
Acknowledgments 8
Introduction 9-10
Methods 10-17
Results and Discussion 18-47
Conclusions 48-49
References 50-51
Appendix A (Reservoir Maps with Bird Zones and Water Sampling Locations) 52-62
3
LIST OF FIGURES Page Number
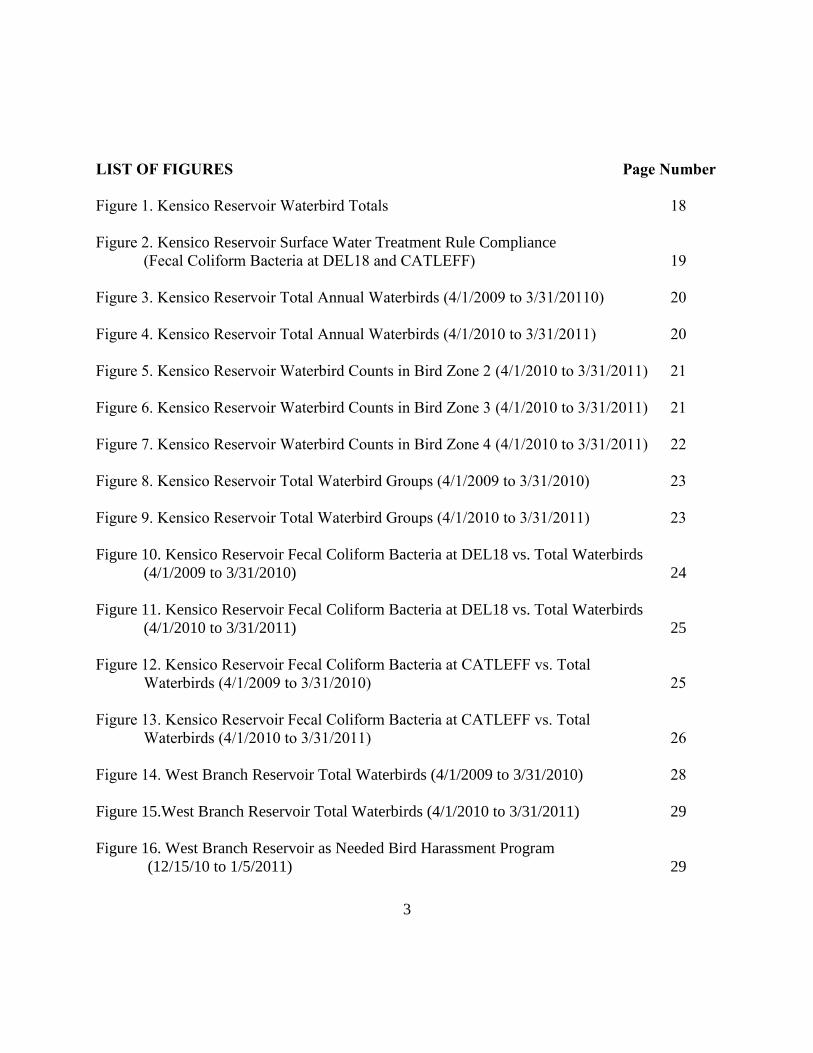
Figure 1. Kensico Reservoir Waterbird Totals 18
Figure 2. Kensico Reservoir Surface Water Treatment Rule Compliance
(Fecal Coliform Bacteria at DEL18 and CATLEFF) 19
Figure 3. Kensico Reservoir Total Annual Waterbirds (4/1/2009 to 3/31/20110) 20
Figure 4. Kensico Reservoir Total Annual Waterbirds (4/1/2010 to 3/31/2011) 20
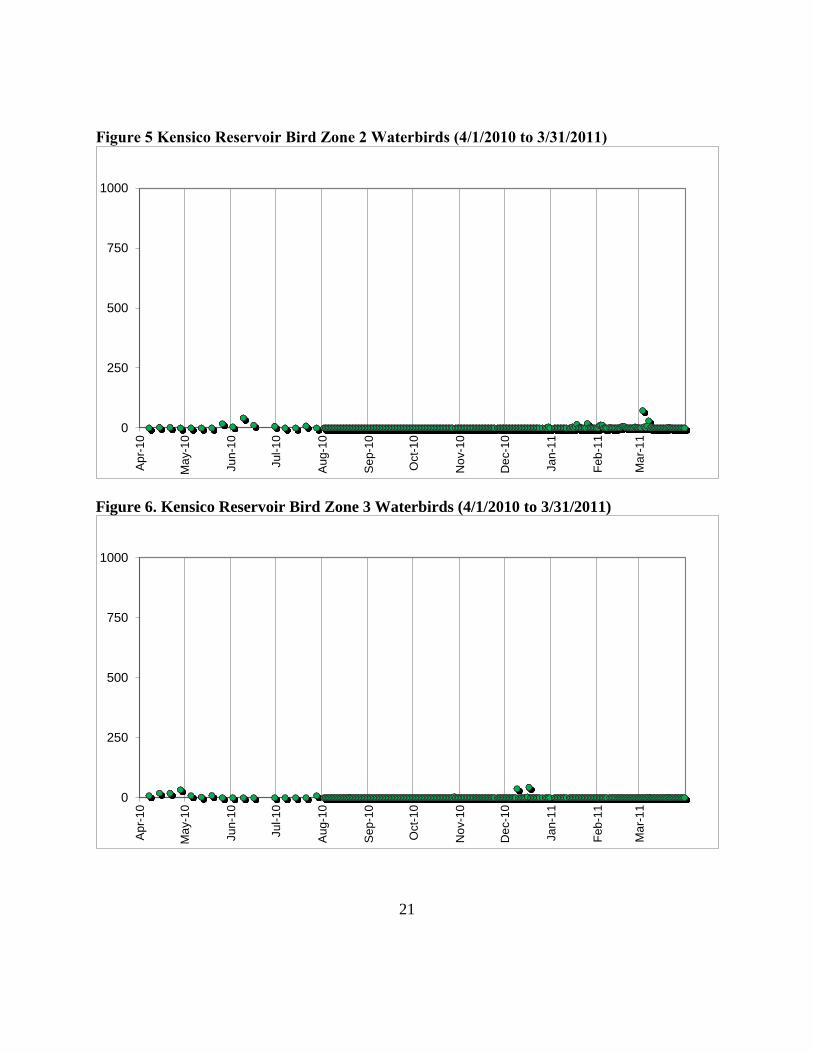
Figure 5. Kensico Reservoir Waterbird Counts in Bird Zone 2 (4/1/2010 to 3/31/2011) 21
Figure 6. Kensico Reservoir Waterbird Counts in Bird Zone 3 (4/1/2010 to 3/31/2011) 21
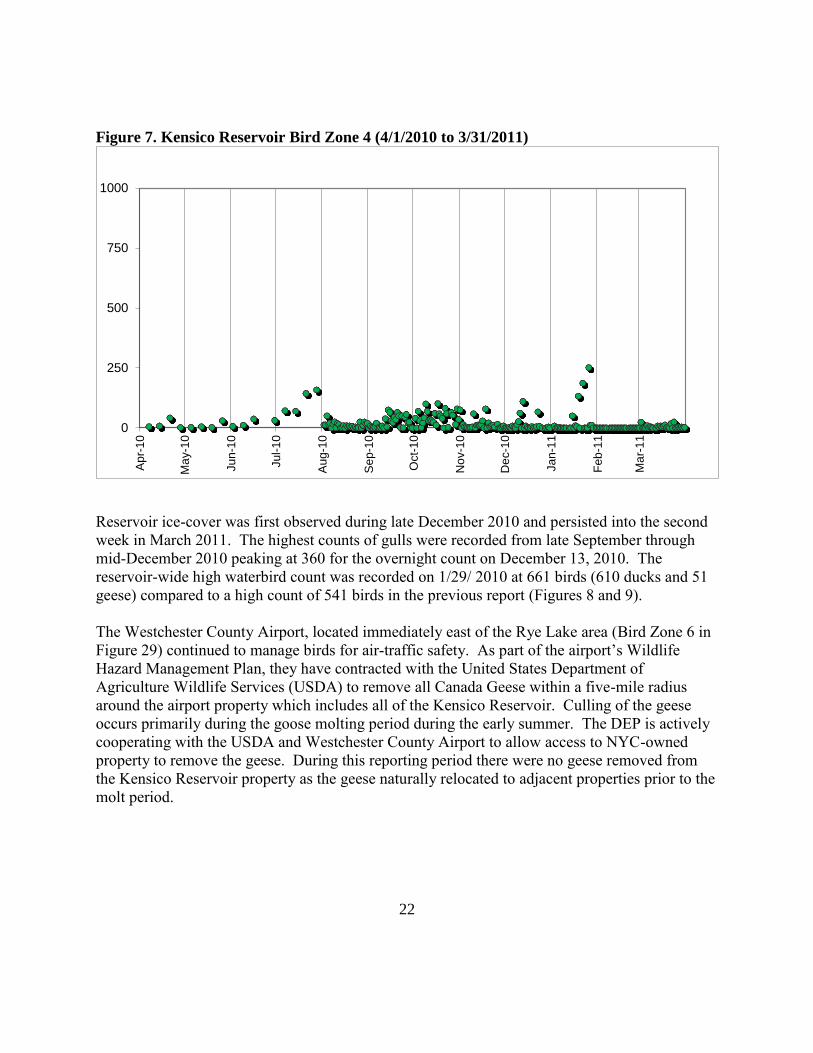
Figure 7. Kensico Reservoir Waterbird Counts in Bird Zone 4 (4/1/2010 to 3/31/2011) 22
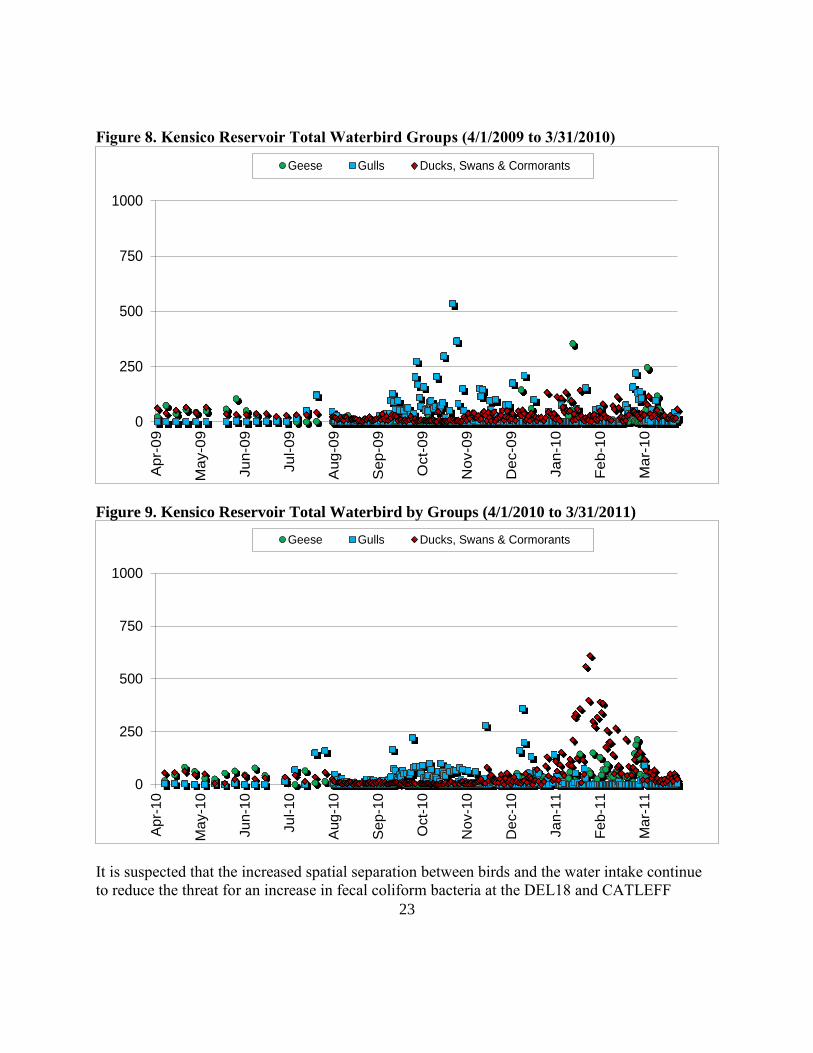
Figure 8. Kensico Reservoir Total Waterbird Groups (4/1/2009 to 3/31/2010) 23
Figure 9. Kensico Reservoir Total Waterbird Groups (4/1/2010 to 3/31/2011) 23
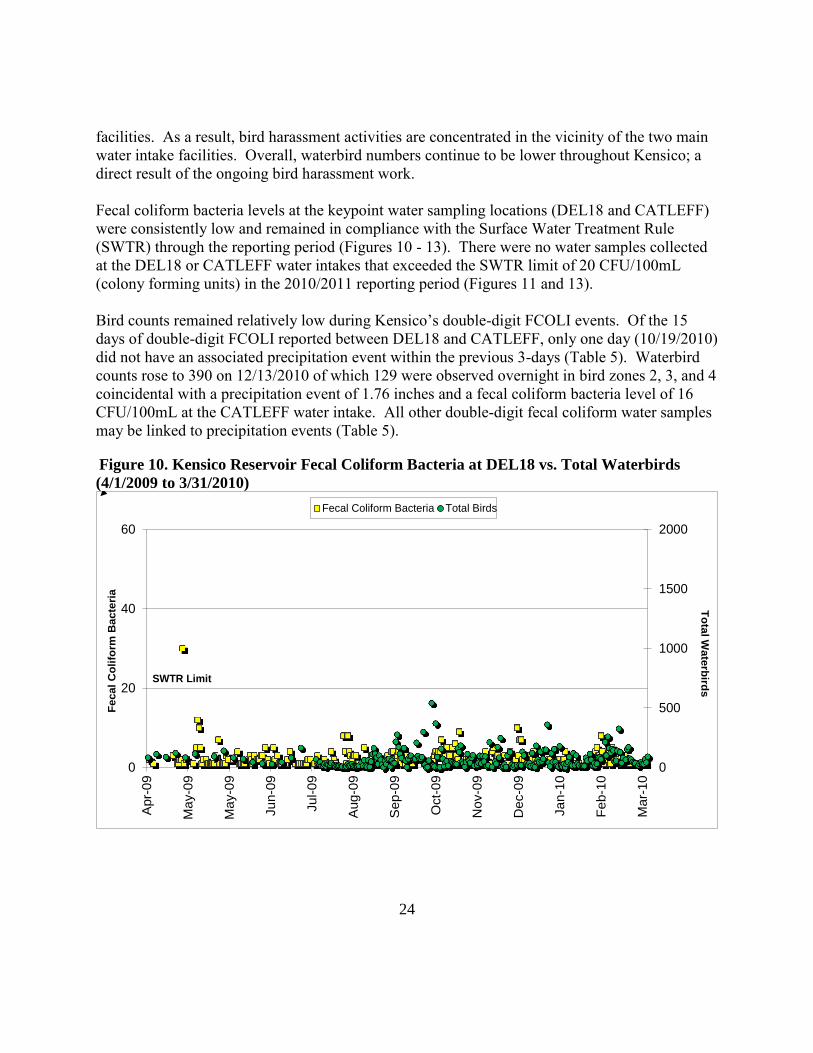
Figure 10. Kensico Reservoir Fecal Coliform Bacteria at DEL18 vs. Total Waterbirds
(4/1/2009 to 3/31/2010) 24
Figure 11. Kensico Reservoir Fecal Coliform Bacteria at DEL18 vs. Total Waterbirds
(4/1/2010 to 3/31/2011) 25
Figure 12. Kensico Reservoir Fecal Coliform Bacteria at CATLEFF vs. Total
Waterbirds (4/1/2009 to 3/31/2010) 25
Figure 13. Kensico Reservoir Fecal Coliform Bacteria at CATLEFF vs. Total
Waterbirds (4/1/2010 to 3/31/2011) 26
Figure 14. West Branch Reservoir Total Waterbirds (4/1/2009 to 3/31/2010) 28
Figure 15.West Branch Reservoir Total Waterbirds (4/1/2010 to 3/31/2011) 29
Figure 16. West Branch Reservoir as Needed Bird Harassment Program
(12/15/10 to 1/5/2011) 29
4
LIST OF FIGURES (continued) Page Number
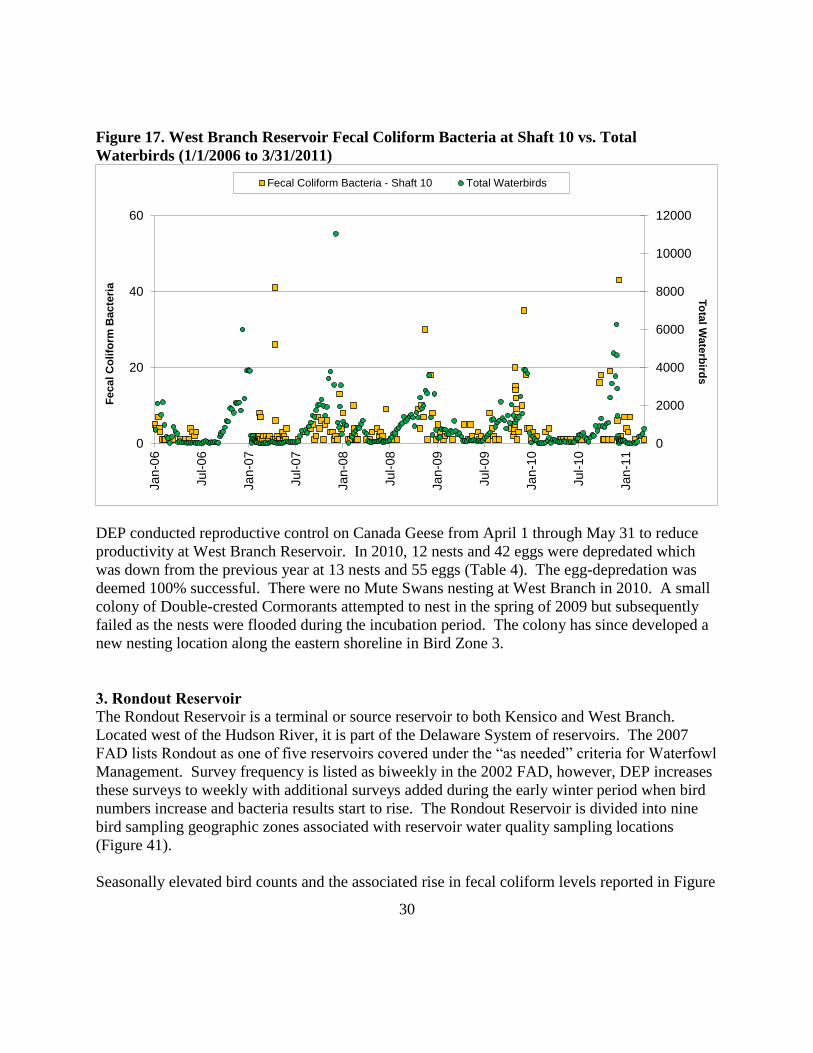
Figure 17. West Branch Reservoir Fecal Coliform Bacteria at Shaft 10 vs.
Total Waterbirds (1/1/2006 to 3/31/2011) 30
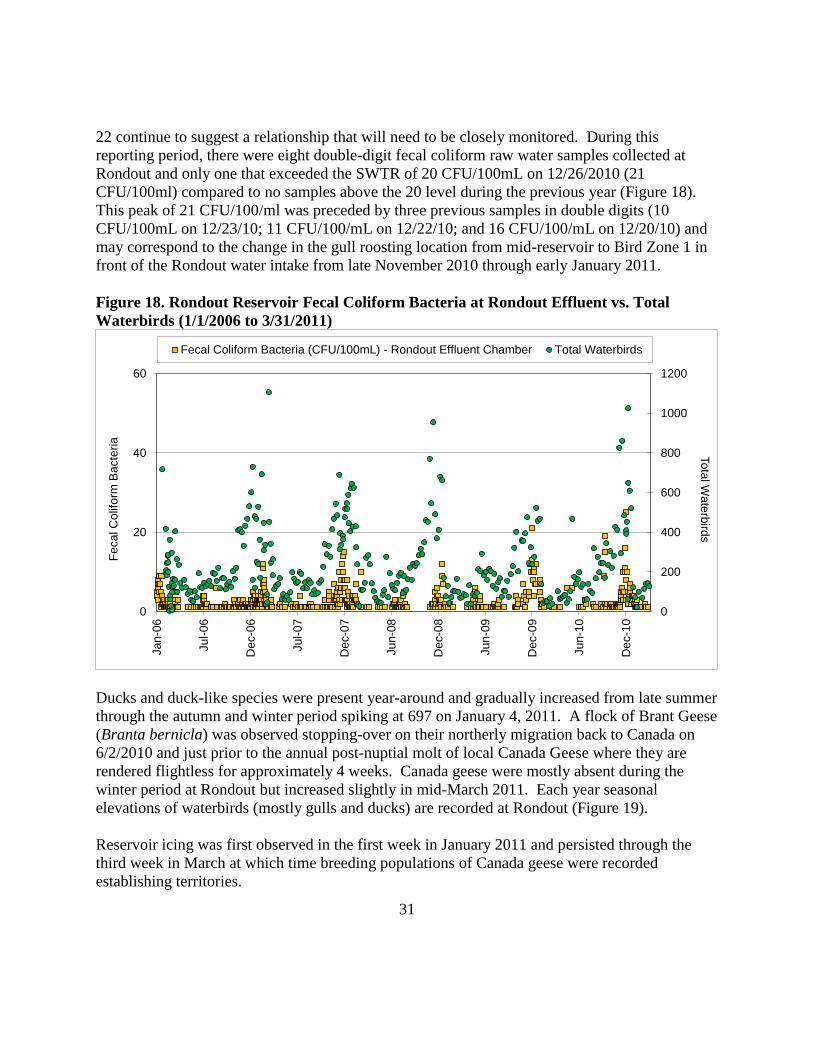
Figure 18. Rondout Reservoir Fecal Coliform Bacteria at Rondout Effluent vs.
Total Waterbirds (1/1/2006 to 3/31/2011) 31
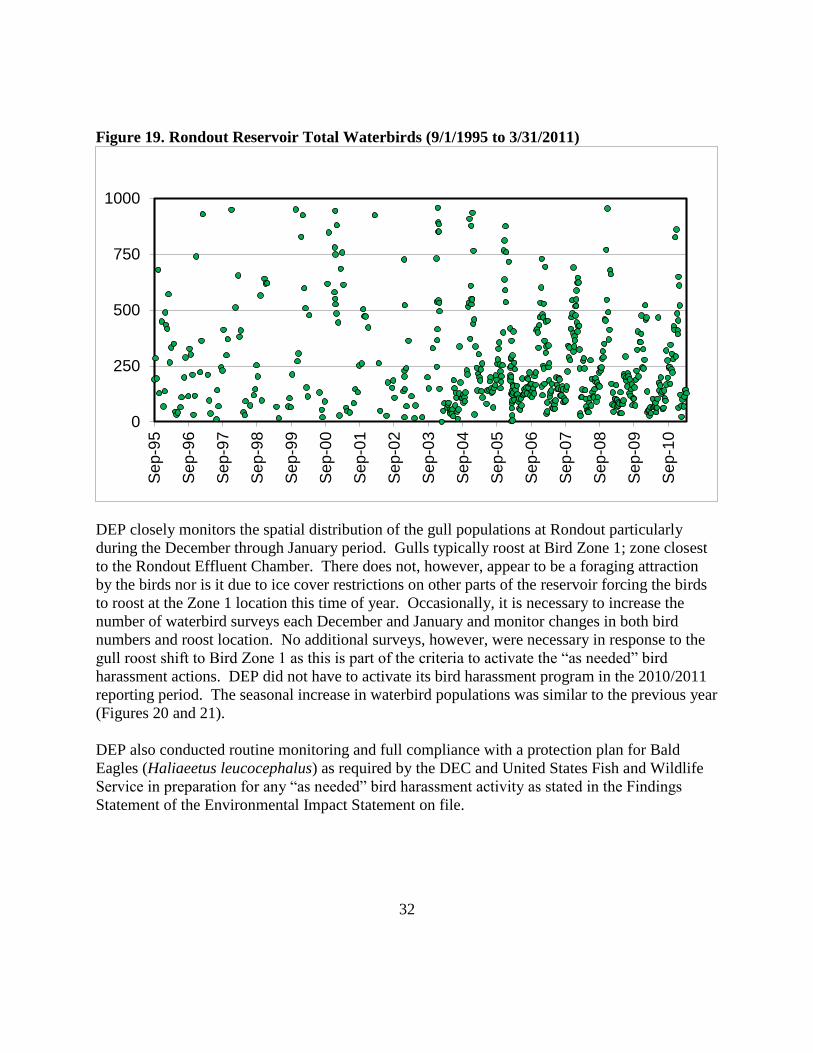
Figure 19. Rondout Reservoir Total Waterbirds (9/1/1995 to 3/31/2011) 32
Figure 20. Rondout Reservoir Total Waterbirds (4/1/2009 to 3/31/2010) 33
Figure 21. Rondout Reservoir Total Waterbirds (4/1/2010 to 3/31/2011) 33
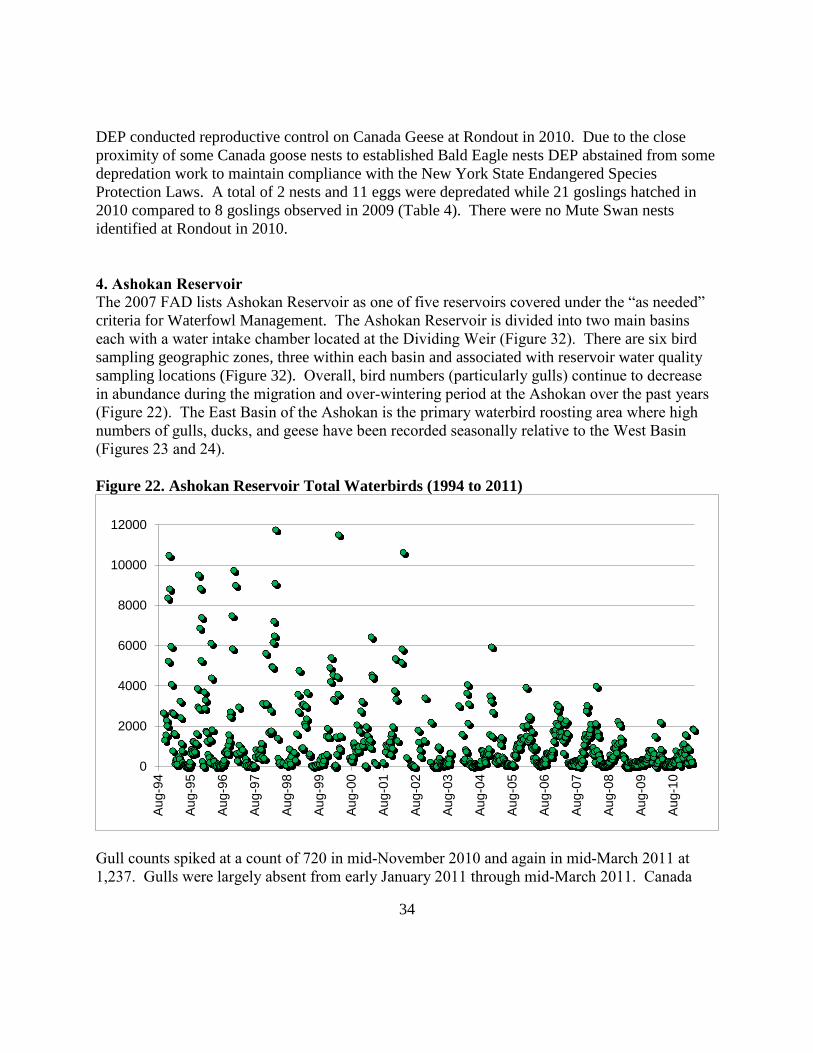
Figure 22. Ashokan Reservoir Total Waterbirds (1994 to 2011) 34
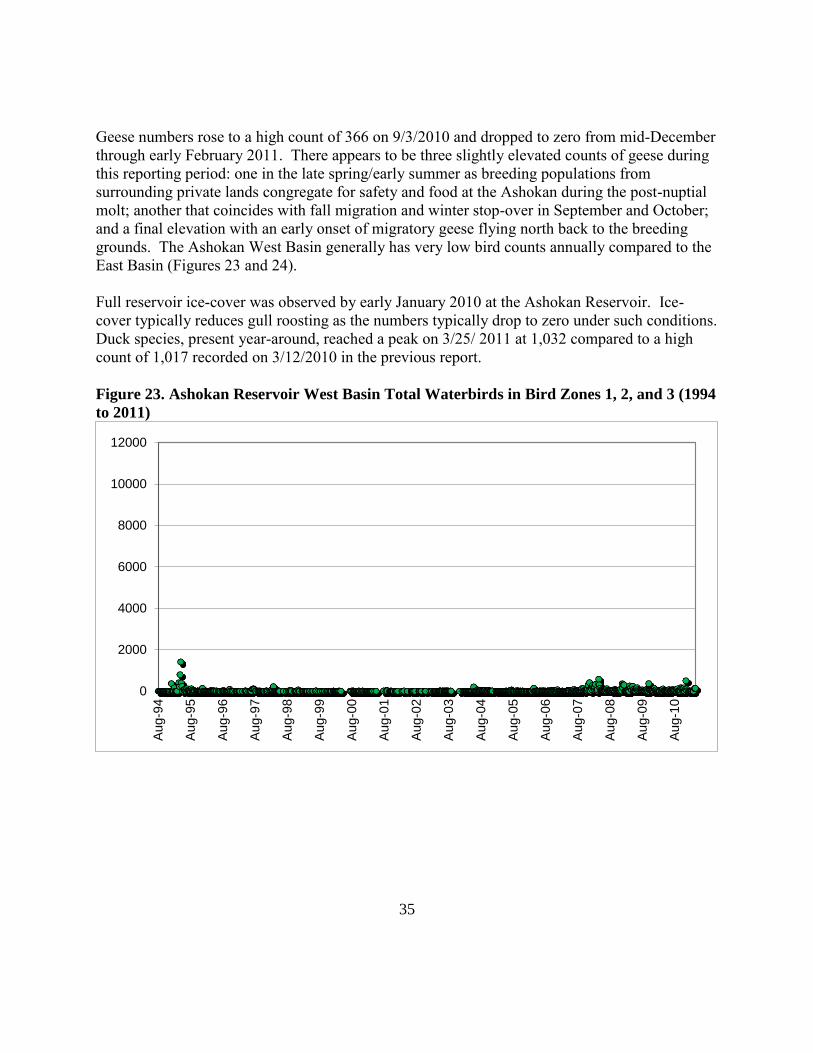
Figure 23. Ashokan Reservoir West Basin Total Waterbirds in Bird Zones 1, 2, and 3
(1994 to 2011) 35
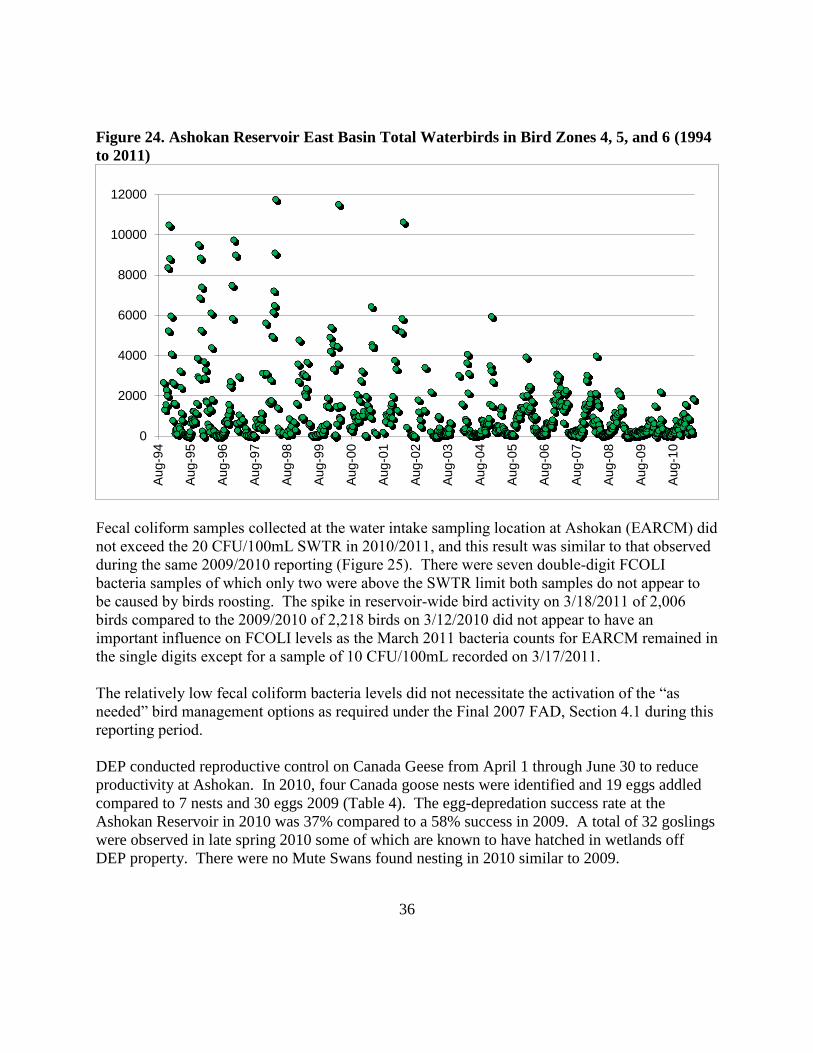
Figure 24. Ashokan Reservoir East Basin Total Waterbirds in Bird Zones 4, 5, and 6
(1994 to 2011) 36
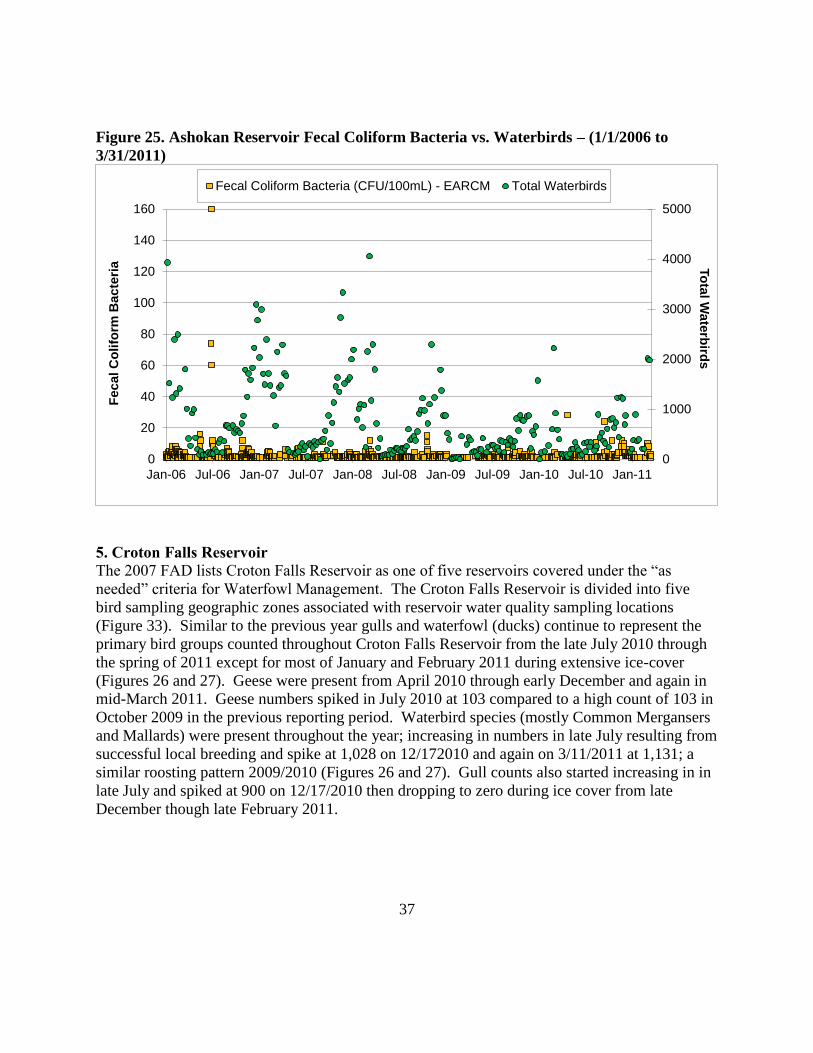
Figure 25. Ashokan Reservoir Fecal Coliform Bacteria vs. Waterbirds
(1/1/2006 to 3/31/2011) 37
Figure 26. Croton Falls Reservoir Total Waterbirds - (4/1/2009 to 3/31/2010) 38
Figure 27. Croton Falls Reservoir Total Waterbirds - (4/1/2010 to 3/31/2011) 38
Figure 28. Croton Falls Reservoir Fecal Coliform Bacteria vs. Total Waterbirds
(1/1/2006 to 3/31/2011) 39
Figure 29. Cross River Reservoir Total Waterbirds (3/1/2002 to 3/31/2011) 40
Figure 30. Cross River Reservoir Fecal Coliform Bacteria vs. Total Waterbirds
(1/1/2006 to 3/31/2011) 41
Figure 31. Hillview Reservoir Total Waterbirds Nocturnal Counts (1993 to 2011) 43
Figure 32. Hillview Reservoir Total Waterbirds Diurnal Counts (1993 to 2011) 43
5
LIST OF FIGURES (continued) Page Number
Figure 33. Hillview Reservoir Number of Positive E. coli at water sampling site 1
(4/1/2010 to 3/31/2011) 44
Figure 34.Hillview Reservoir Number of Positive E. coli at water sampling site 2
(4/1/2010 to 3/31/2011) 45
Figure 35. Hillview Reservoir Number of Positive E. coli at water sampling site 3
(4/1/2010 to 3/31/2011) 45
Figure 36. Hillview Reservoir Number of Positive E. coli at water sampling site 58
(4/1/2010 to 3/31/2011) 46
6
LIST OF FIGURES (continued) Page Number
Appendix A. 52
Figure 37. Map of New York City Water Supply – East of Hudson 53
Figure 38. Map of New York City Water Supply – West of Hudson 54
Figure 39. Map of Kensico Reservoir Bird Zones 55
Figure 40. Map of West Branch Reservoir Bird Zones 56
Figure 41. Map of Rondout Reservoir Bird Zones 57
Figure 42. Map of Ashokan Reservoir Bird Zones 58
Figure 43. Map of Croton Falls Reservoir Bird Zones 59
Figure 44. Map of Cross River Reservoir Bird Zones 60
Figure 45. Map of Hillview Reservoir Bird Zones 61
Figure 46. Map of Hillview Reservoir Water Sampling Locations 62
7
List of Tables Page Number
Table 1. Final 2007 FAD Requirements 11
Table 2. Frequency of bird observation surveys by reservoir 2010/2011
(As listed under the November 2002 FAD, Section 6.4.1) 13
Table 3. Reservoir Bird Mitigation (1993 – 2011) 15
Table 4. 2010 Canada Goose and Mute Swan Nest Census and Egg-Depredation 17
Table 5. Double-digit (>=10) FCOLI elevations at Kensico Reservoir keypoint
water sampling locations 26
8
ACKNOWLEDGMENTS
Special thanks to DEP wildlife biologist Mike Reid who reviewed this document, assisted with
data collection, contract management, and production of the maps for this report.
Thanks goes to the DEP contractor, HDR – Henningson, Durham, and Richardson P.C.,
including James Morrison, Vice President, William Saksen, Laboratory Director, Don Henshaw,
Asst. Laboratory Director, Katherine Drury, Field/Lab Coordinator, Ben Wood, Field Site
Supervisor, Paul Oehrlein, Ornithologist, Kenneth Eggleson, Ornithologist, Matthew Sudol,
Ornithologist Technician, Sean Camillieri, Ornithologist Technician, Kyle Troy, Ornithologist
Technician, and numerous other staff for implementing the Waterfowl Management Program
Contract.
Thanks to Lori Emery, Chief of Watershed Water Quality Operations (WWQO) and Andrew P.
Bader, Deputy Chief, WWQO for document review, Steven Schindler, Director of BWS Water
Quality for document review and logistical support and Heather Bull (Wildlife Studies Summer
Intern) for document review. Additional thanks to Salome Freud (Chief), Virginia Murray
(Deputy Chief), and staff from Distribution Water Quality Operations (DWQO) for assistance
with sample collection, sample analysis, maps, and data acquisition. Finally, thanks to the
Operations Directorate for meteorological data and to Watershed Water Quality Science and
Research for assistance with chart data.
DEP also acknowledges the New York State Department of Environmental Conservation staff
from the Region III Office in New Paltz, New York and the United States Department of
Agriculture, Wildlife Services for consultation assistance with banding locally breeding Canada
geese.
The author, Mr. Christopher A. Nadareski, is DEP’s Section Chief of Wildlife Studies and
is responsible for the Waterfowl Management Program oversight including data management,
field data collection, and contract administration.
9
INTRODUCTION
The management of waterbird populations at key reservoirs throughout the New York City
Water Supply is essential to meet stringent water quality regulations as stated in the
Environmental Protection Agency's (EPA) Surface Water Treatment Rule (SWTR) of 1991. As
a result, DEP developed and implemented a comprehensive Watershed Protection-Filtration
Avoidance Program to protect its water supply. A component of the Watershed Protection Plan
is DEP’s Waterfowl Management Program (WMP) which was established to research the
relationship between wildlife, particularly waterbirds (geese, gulls, cormorants, swans, ducks and
other duck-like birds) that inhabit the reservoirs, and fecal coliform bacteria (FCOLI) elevations
in the untreated surface water. The Waterfowl Management Program, originally developed for
the NYC’s Kensico Reservoir in 1992, has been expanded to include five additional reservoirs
for waterbird management under the November 2002 Filtration Avoidance Determination (FAD)
(Section 4.1 – Waterfowl Management Program). The most recent FAD update (2007 FAD)
includes bird management at Hillview Reservoir in Yonkers, New York.
The WMP was designed to study the relationship between seasonal trends in bird populations on
the reservoirs as well as trends in fecal coliform concentrations both within the reservoir and at
the keypoint water sampling locations. Following several years of waterbird population
monitoring, DEP’s scientific staff consisting of wildlife biologists and microbiologists identified
birds as a significant source of fecal coliform at the Kensico Reservoir. In response, DEP
developed and implemented a Waterfowl Management Program using standard bird management
techniques (approved by the United States Department of Agriculture, Wildlife Services (USDA)
and the New York State Department of Environmental Conservation (DEC)) to reduce or
eliminate the waterbird populations inhabiting the reservoir system (DEP 2002). DEP has also
acquired depredation permits from the United States Fish & Wildlife Service and DEC to
implement some management techniques. Since the initial implementation of DEP’s bird
dispersal and deterrent techniques in 1993 there has been a dramatic reduction in both bird
populations and fecal coliform levels, thus maintaining high quality water in compliance with the
SWTR.
Migratory populations of waterbirds utilize NYC reservoirs as temporary staging areas and
wintering grounds and therefore can significantly contribute to increases in fecal coliform
loadings during the autumn and winter primarily from direct fecal deposition in the reservoirs.
These migrant waterbirds generally roost nocturnally and occasionally forage and loaf diurnally
on the reservoirs, however, it has been determined that most of the feeding activity occurs away
from the reservoir. Fecal samples collected and analyzed for fecal coliform bacteria
concentrations from both Canada geese (Branta canadensis) and Ring-billed Gulls (Larus
delawarensis) revealed that fecal coliform concentrations are high per gram of feces (Alderisio
and DeLuca 1999). Water samples collected near waterbird roosting locations have shown fecal
coliform increases concurrent with waterbird populations at several NYC reservoirs in previous
10
DEP reports (DEP 1993 - 2009). Thus, DEP has determined that waterbirds contributed the most
important fecal coliform bacteria load seasonally to Kensico Reservoir and to other terminal
reservoirs (West Branch, Rondout, Ashokan) and potential source reservoirs to the Catskill-
Delaware System (Croton Falls, and Cross River). Since waterbirds have been associated with
elevated fecal coliform bacteria levels found in various reservoirs and lakes (DEP 1994 and
1995), a program to discourage waterbird activity was developed for Kensico Reservoir in the
fall of 1993 and is expected to continue indefinitely. The bird dispersal program was more
recently expanded to Rondout Reservoir during the winters of 2001 through 2007, West Branch
Reservoir in 2007 and 2010/2011 and at Croton Falls Reservoir during the winter of 2001/2002
on an “as needed” basis. To assure DEP’s program activities remained in compliance with all
federal, State, and Local laws including effects on local environmental conditions including
endangered species an Environmental Impact Statement was completed for Kensico in 1996 and
another one in the spring of 2004 for five additional reservoirs (Rondout, West Branch, Ashokan,
Croton Falls, and Cross River). A Final Environmental Impact Statement including a “findings
statement” can be found on the DEP website identifying program impacts and required
mitigation to meeting implementation standards for the expanded WMP. This report is a
requirement of the 2007 FAD.
The purpose of this report is to evaluate further the down-trend observed in waterbird
populations and its impact on FCOLI concentrations as a consequence of DEP’s Waterfowl
Management Program for the period April 1, 2010 through March 31, 2011.
METHODS
Under the DEP’s Final 2007 Filtration Avoidance Determination Section (FAD), Waterfowl
Management Program Section 4.1, it specifically states the following:
4.1 Waterfowl Management Program The Waterfowl Management Program was initiated in 1993 by the City for the Kensico
Reservoir in response to elevated coliform bacteria levels contained in the Reservoir. The 2002
FAD required that the City continue this program for the Kensico Reservoir on a routine basis
and expand the program on an “as needed” basis for five additional reservoirs. Three of these
five reservoirs (West Branch, Rondout and Ashokan) routinely serve Kensico with its source
water. The remaining two (Cross River and Croton Falls), while in the Croton system, may serve
Kensico with source water under special circumstances. The objective of the program is to
minimize the fecal coliform loading to the reservoirs that result from roosting birds during the
migratory season. The program includes three activities: avian population monitoring, avian
harassment activities (motorboats, air boats, and pyrotechnics) and avian deterrence (depredation
of nests and eggs, bird exclusion wires, and netting at critical intake chambers.) All avian
harassment techniques and deterrence activities have been approved by the United States
11
Department of Agriculture Wildlife Services and DEC.
The City’s 2006 Long-Term Watershed Protection Program expanded the Waterfowl
Management Program on an “as needed” basis to include avian harassment activities for the
Hillview Reservoir as well as avian deterrent measures for Hillview and other City reservoirs.
The term "as needed" refers to implementation of avian management measures based on the
following criteria:
• Current bird populations, including roosting or staging locations relative to water
intakes;
• Fecal coliform bacteria concentrations approaching or exceeding 20 colony-forming
units at reservoir effluent structures coincident with elevated bird populations;
• Recent weather events;
• Operational flow conditions within the reservoir (i.e. elevations and flow patterns and
amounts);
• Reservoir ice coverage and watershed snow cover; and
• Determination that active bird management measures would be effective in reducing
bird populations and fecal coliform bacteria levels.
The 2007 FAD (Table 1) requires that NYCDEP continue implementation of its Waterfowl
Management Program in accordance with Section 2.3.1 of the City’s 2006 Long-Term
Watershed Protection Program and the milestones therein with the following clarification:
NYCDEP will perform avian population monitoring in accordance with the frequencies
specified in the City’s 2001 Watershed Protection Program Summary, Assessment and
Long-term Plan.
Table 1. Final 2007 FAD Requirements
Requirement Due Date
Active Bird Harassment – Kensico Reservoir 8/1 to 3/31;
Annually
“As needed” Bird Harassment – West Branch, Rondout, Ashokan, Cross River,
Croton Falls, and Hillview Reservoirs
8/1 to 4/15;
Annually
Avian Deterrent Measures – Kensico, West Branch, Rondout, Ashokan, Cross
River, Croton Falls, Hillview Reservoirs and other City reservoirs as needed
Year-round;
Annually
Submit annual summary of Waterfowl Management Program activities
including contract status, and implementation and analysis of all program
elements (including special studies)
7/31;
Annually

12
Waterbird Census
The relationship between elevated waterbird counts and increased levels of fecal coliform
bacteria identified from raw water samples is well established. New York City Reservoirs,
situated in southeastern New York State, lie in the Atlantic Flyway, an important migratory
pathway for many groups of birds including waterbirds. Although limited in feeding
opportunities, the NYC reservoirs offer important areas of open water used for night roosting and
winter stop-overs. Since it has been well documented that the primary bacterial contribution of
the water supply is from night-roosting and migratory birds, night census data is presented
throughout this report. Defecation rates of birds are known to be somewhat lower nocturnally
than diurnally.
Daily waterbird observations were conducted at predawn hours (between 4:30am and 8:00am
E.S.T.) and post dusk hours (between 5:00pm to 10:00pm E.S.T.) to determine overnight
waterbird roosting populations and to evaluate the success of the hazing activities from the
previous day (where applicable) at all reservoirs. Survey times vary seasonally reflecting
available daylight hours. Since it has been determined that most birds roost nocturnally, and
generally fly off the reservoir during extended periods of the day, all population monitoring data
reflect overnight roosting (NYCDEP 1993). For successful data collection, ideal weather and
atmospheric conditions were necessary. Otherwise precipitation events and fog prohibited data
collection resulted in short gaps of “no data”. Reservoir maps with Bird Zones can be found in
Appendix A.
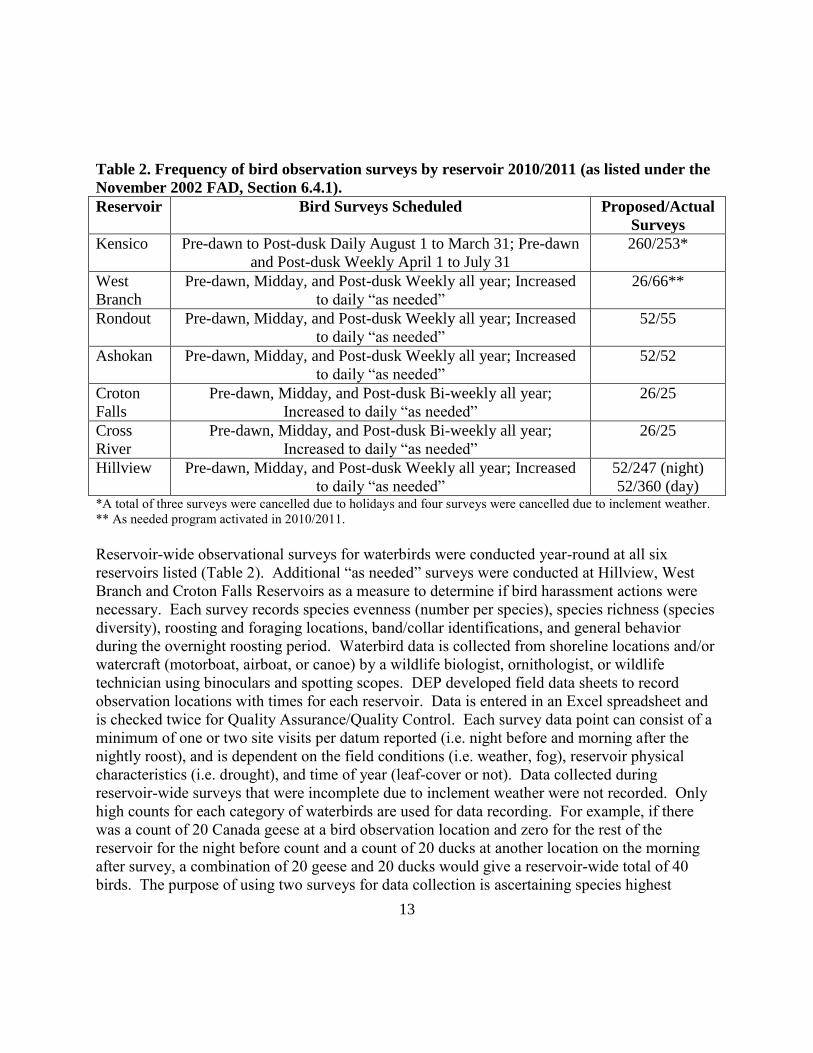
The July 2007 FAD, Section 4.1 specifies the frequency of reservoir surveys and is listed in
Table 2. Actual surveys conducted from April 1, 2010 to March 31, 2011 are also listed in Table
2.
13
Table 2. Frequency of bird observation surveys by reservoir 2010/2011 (as listed under the
November 2002 FAD, Section 6.4.1).
Reservoir Bird Surveys Scheduled Proposed/Actual
Surveys
Kensico Pre-dawn to Post-dusk Daily August 1 to March 31; Pre-dawn
and Post-dusk Weekly April 1 to July 31
260/253*
West
Branch
Pre-dawn, Midday, and Post-dusk Weekly all year; Increased
to daily “as needed”
26/66**
Rondout Pre-dawn, Midday, and Post-dusk Weekly all year; Increased
to daily “as needed”
52/55
Ashokan Pre-dawn, Midday, and Post-dusk Weekly all year; Increased
to daily “as needed”
52/52
Croton
Falls
Pre-dawn, Midday, and Post-dusk Bi-weekly all year;
Increased to daily “as needed”
26/25
Cross
River
Pre-dawn, Midday, and Post-dusk Bi-weekly all year;
Increased to daily “as needed”
26/25
Hillview Pre-dawn, Midday, and Post-dusk Weekly all year; Increased
to daily “as needed”
52/247 (night)
52/360 (day) *A total of three surveys were cancelled due to holidays and four surveys were cancelled due to inclement weather.
** As needed program activated in 2010/2011.
Reservoir-wide observational surveys for waterbirds were conducted year-round at all six
reservoirs listed (Table 2). Additional “as needed” surveys were conducted at Hillview, West
Branch and Croton Falls Reservoirs as a measure to determine if bird harassment actions were
necessary. Each survey records species evenness (number per species), species richness (species
diversity), roosting and foraging locations, band/collar identifications, and general behavior
during the overnight roosting period. Waterbird data is collected from shoreline locations and/or
watercraft (motorboat, airboat, or canoe) by a wildlife biologist, ornithologist, or wildlife
technician using binoculars and spotting scopes. DEP developed field data sheets to record
observation locations with times for each reservoir. Data is entered in an Excel spreadsheet and
is checked twice for Quality Assurance/Quality Control. Each survey data point can consist of a
minimum of one or two site visits per datum reported (i.e. night before and morning after the
nightly roost), and is dependent on the field conditions (i.e. weather, fog), reservoir physical
characteristics (i.e. drought), and time of year (leaf-cover or not). Data collected during
reservoir-wide surveys that were incomplete due to inclement weather were not recorded. Only
high counts for each category of waterbirds are used for data recording. For example, if there
was a count of 20 Canada geese at a bird observation location and zero for the rest of the
reservoir for the night before count and a count of 20 ducks at another location on the morning
after survey, a combination of 20 geese and 20 ducks would give a reservoir-wide total of 40
birds. The purpose of using two surveys for data collection is ascertaining species highest
14
concentrations over a specific time period. Some species at certain times of the year are easier to
count at night when birds are flying into roost areas (or open water) in the evening whereas
others are easier to count when flying out of the reservoir in the early morning.
Waterbird population zones were delineated at all reservoirs to identify local impacts on water
quality and have been described in previous DEP reports for Kensico and West Branch (DEP
1994, 1995, 1997a).
Data reported on fecal coliform bacteria concentrations for both keypoint raw water outflow
samples (aqueduct and outflows) and reservoir samples have been reviewed by DEP laboratory
personnel. The following conditions apply to the water quality data reported:
Only high concentration duplicate samples are reported (for example if two keypoint
samples were collected in a single day, or if more than one sample is collected at
different depths at a single limnology sampling location, the highest bacteria count has
been used for charting)
All special investigation samples are reported
Reanalysis samples are reported
There were no samples with confluent growth reported
Fecal Coliform Bacteria Data
Water quality data presented in this report were collected by DEP’s Watershed Water Quality
Operations personnel and analyzed and reported by four DEP New York State Department of
Health Environmental Laboratory Approval Program certified Laboratories in Valhalla,
Kingston, Grahamsville, and Queens, New York. Watershed DEP Laboratory personnel utilize
the Membrane Filtration Technique for fecal coliform analyses while the Distribution Laboratory
personnel utilize the Colilert18 with Quantitray for E.coli analysis (Hillview samples).
Reservoir-wide waterbird survey results are presented with fecal coliform bacterial levels at
keypoint (outflow) and reservoir sampling areas. Detailed descriptions are listed below by
reservoir (Table 3).
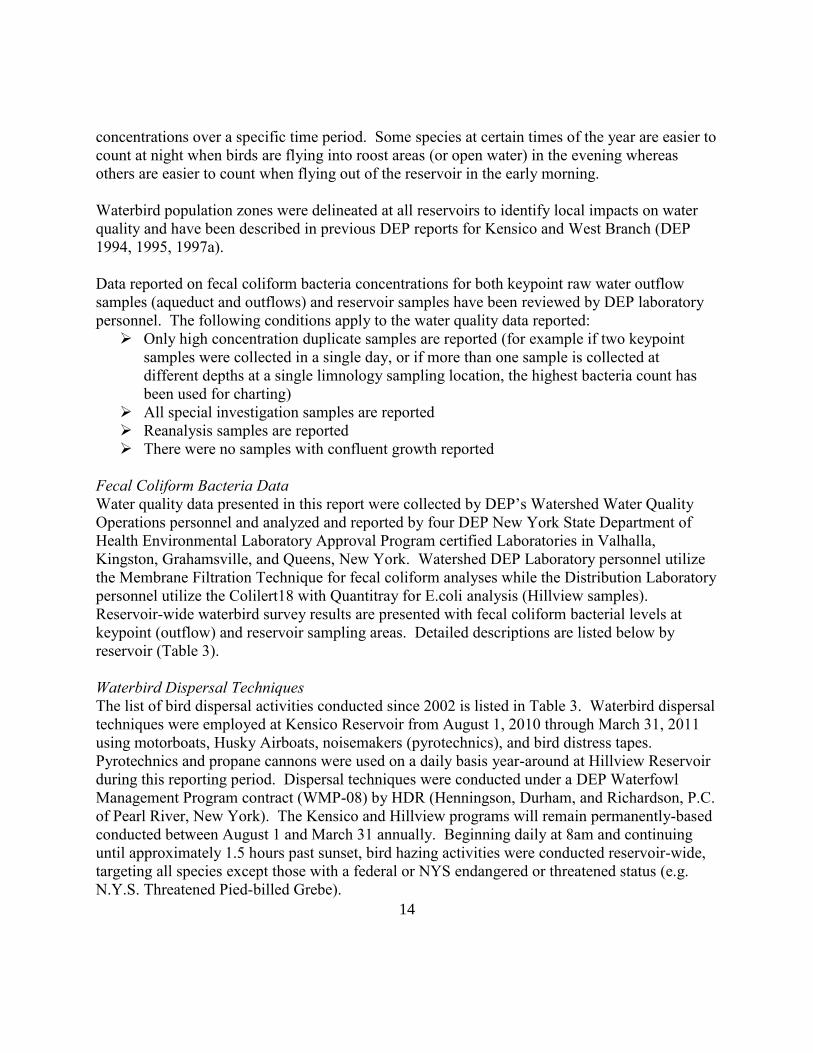
Waterbird Dispersal Techniques
The list of bird dispersal activities conducted since 2002 is listed in Table 3. Waterbird dispersal
techniques were employed at Kensico Reservoir from August 1, 2010 through March 31, 2011
using motorboats, Husky Airboats, noisemakers (pyrotechnics), and bird distress tapes.
Pyrotechnics and propane cannons were used on a daily basis year-around at Hillview Reservoir
during this reporting period. Dispersal techniques were conducted under a DEP Waterfowl
Management Program contract (WMP-08) by HDR (Henningson, Durham, and Richardson, P.C.
of Pearl River, New York). The Kensico and Hillview programs will remain permanently-based
conducted between August 1 and March 31 annually. Beginning daily at 8am and continuing
until approximately 1.5 hours past sunset, bird hazing activities were conducted reservoir-wide,
targeting all species except those with a federal or NYS endangered or threatened status (e.g.
N.Y.S. Threatened Pied-billed Grebe).
15
The Husky Airboats were again used for bird harassment in 2010/2011 at Kensico. Airboats
have the ability to ride over ice and water interfaces with ease. The airboats also have heated
cabins which provide longer time periods of bird hazing opportunities (physical chasing and
pyrotechnic use) during reservoir freezing periods throughout the winter.
The other five reservoirs included in this report are covered under the “as needed” section for the
expanded reservoirs. During this reporting period an “as needed” bird management response
was necessary at West Branch Reservoir. Detailed descriptions are listed below by reservoir.
Table 3. Reservoir Bird Mitigation (1993 – 2011)
Reservoir Dates of Bird
Harassment/Deterrence
Bird
Harassment/Deterrence
Measures Used Kensico August 1,– March 31
1993 to 2011
Bird Harassment (Motorboats,
Husky Airboats, Pyrotechnics,
and Bird Distress Tapes),
Waterbird Reproductive
Depredation, Shoreline Meadow
Management and Fencing, and
Alewife Collections
West Branch* January 11 to March 28, 2007
December 15, 2010 to January 6, 2011
Bird Harassment (Motorboats and
Pyrotechnics) and Waterbird
Reproduction Depredation
Rondout*
December 2002 – January 2003
December 2003 – January 2004
December 2005 – March 2006
None required during this reporting
period
Bird Harassment (Pyrotechnics,
Red-beam Lasers, and Bird
Distress Tapes) and Waterbird
Reproduction Depredation
Ashokan* None required during this reporting
period
Waterbird Reproductive
Depredation
Croton Falls* January – February 2002
None required during this reporting
period
Bird Harassment (Motorboats,
Pyrotechnics, Red-beam Lasers,
and Bird Distress Tapes) and
Waterbird Reproductive
Depredation
Cross River* None required during this reporting
period
Waterbird Reproductive
Depredation
Hillview Year-around-continuous or “as needed”
(July 1993 to March 31, 2011)
Bird Deterrent Wire System and
Bird Harassment (Pyrotechnics) *Indicates reservoir mitigation only occurs “as needed” under the Final 2007 FAD, Section 4.1.
In response to entrainment of Alewives (Alosa pseudoharengus), a baitfish, into the water intake
structures at Ashokan Reservoir and their subsequent outflow at Kensico Reservoir, the DEP
Waterfowl Management contractor installed a temporary collection boom around the Catskill
Influent structure (CATIC) to remove the dead fish that collected at the boom. Alewives are an
16
attractive food source for gulls and some species of ducks and when large numbers of fish are
flushing into the reservoir, the gulls become very difficult to manage.
Waterbird Reproductive Management
Canada Geese and Mute Swan egg and nest depredation were conducted during the spring and
summer periods of 2010 to help reduce fecundity at all NYC reservoirs. Mitigative actions
included Canada goose reproductive management and maintenance of meadow vegetation
(Kensico, Rondout) and shoreline fences (Kensico), where applicable. Egg and nest-depredation
involved locating all Canada Geese and Mute Swan (Cygnus olor) nests within NYC reservoir
property, numbering each nest and egg, and puncturing each egg with a probe to break the
membranes thereby destroying the embryo. Eggs were then replaced in the nest to allow
incubation to continue. A small number of goose nests were often destroyed late in the breeding
season to encourage the birds to relocate off reservoir property during the annual post-nuptial
molt when the birds are rendered flightless for a few weeks.
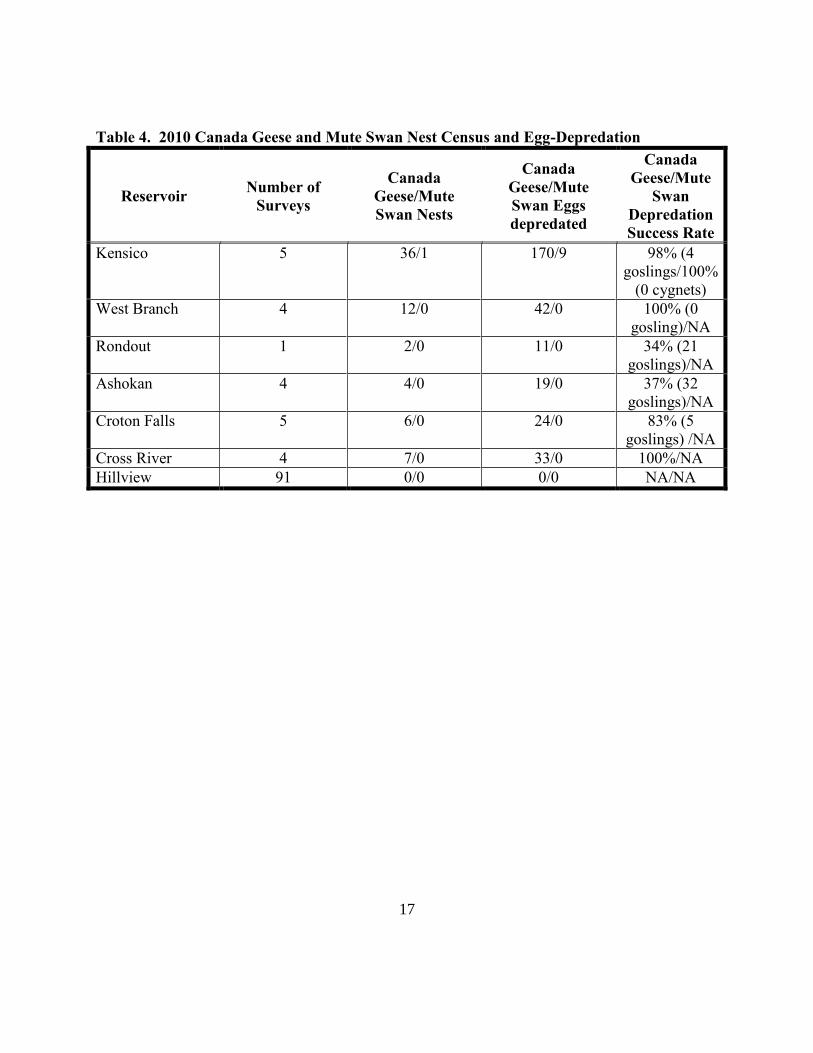
A total of 75 Canada goose nests containing 392 eggs were depredated (punctured) at 7 New
York City Reservoirs (Table 4) during the spring of 2010 compared to 60 nests and 243 eggs in
the previous year. All depredation activity was conducted under the terms of Federal Permit
(#RG-01040A) from the United States Department of the Interior, United States Fish & Wildlife
Service for Canada Geese (Branta Canadensis) and a DEC permit (#3-11-100) for Mute Swans.
Additionally, DEP in conjunction with DEC continued an annual Canada goose banding project
in Westchester, Putnam, and Ulster, Counties to track local movements throughout the NYC
watersheds. Band identifications provide a means to identify local breeding, feeding, and loafing
areas which may aide in implementing best management practices (i.e. elimination of feeding
areas may eliminate presence on reservoirs).
17
Table 4. 2010 Canada Geese and Mute Swan Nest Census and Egg-Depredation
Reservoir Number of
Surveys
Canada
Geese/Mute
Swan Nests
Canada
Geese/Mute
Swan Eggs
depredated
Canada
Geese/Mute
Swan
Depredation
Success Rate
Kensico 5 36/1 170/9 98% (4
goslings/100%
(0 cygnets)
West Branch 4 12/0 42/0 100% (0
gosling)/NA
Rondout 1 2/0 11/0 34% (21
goslings)/NA
Ashokan 4 4/0 19/0 37% (32
goslings)/NA
Croton Falls 5 6/0 24/0 83% (5
goslings) /NA
Cross River 4 7/0 33/0 100%/NA
Hillview 91 0/0 0/0 NA/NA
18
RESULTS and DISCUSSION
1. Kensico Reservoir
Kensico Reservoir receives water from Rondout and West Branch Reservoirs via the Delaware
Aqueduct and from the Ashokan Reservoir via the Catskill Aqueduct. Water leaving Kensico is
disinfected with chlorine and delivered via aqueduct to Hillview Reservoir. Kensico Reservoir
has been divided into eight Bird Zones to compare bird counts with water samples collected at
limnological sampling locations. Waterbird numbers at Kensico Reservoir remained consistently
low throughout the reporting period as a result of continued implementation of the Waterfowl
Management Program (Figures 1 and 2). The geographic configuration of Kensico includes two
main open water areas; one in Bird Zone 4 and one in Bird Zone 6 (Figure 29). These open
water areas tend to attract large numbers of gulls roosting overnight.
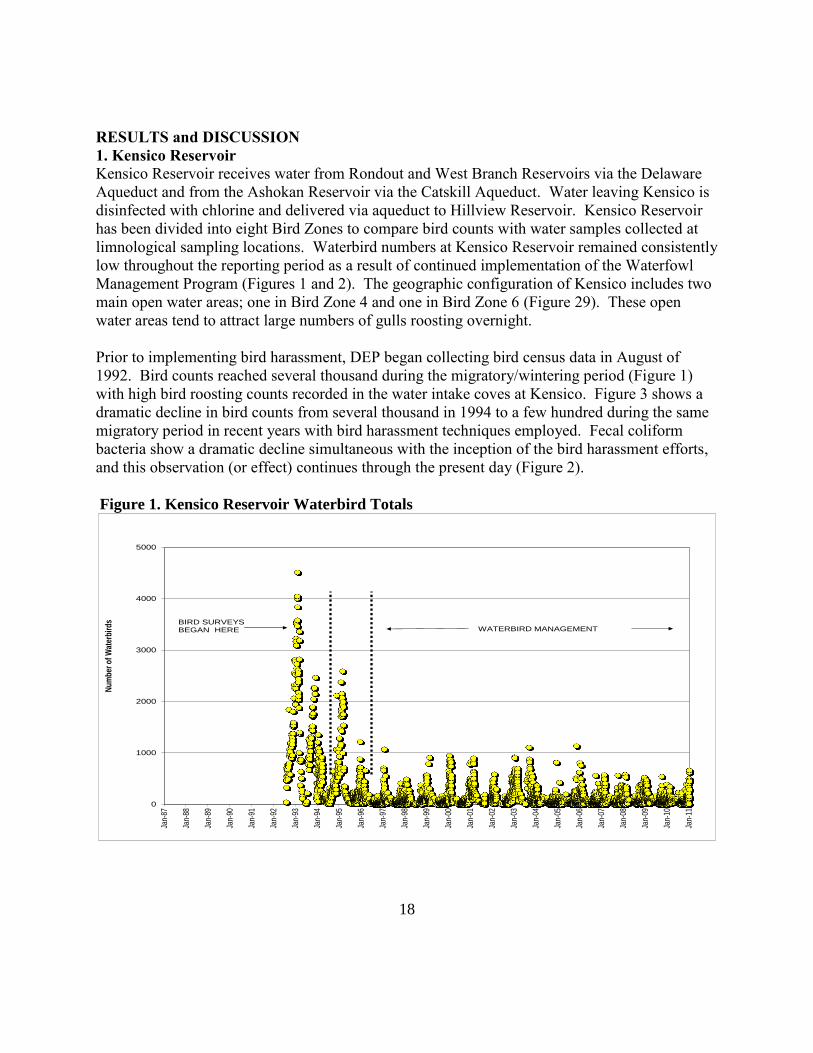
Prior to implementing bird harassment, DEP began collecting bird census data in August of
1992. Bird counts reached several thousand during the migratory/wintering period (Figure 1)
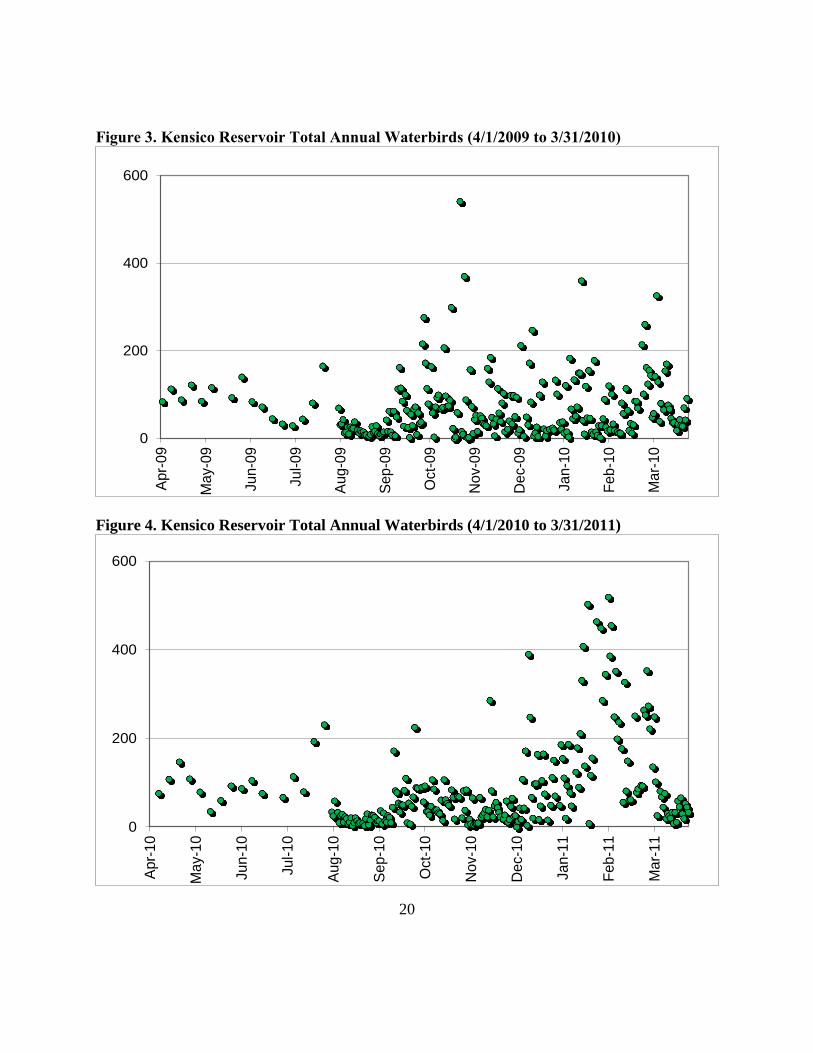
with high bird roosting counts recorded in the water intake coves at Kensico. Figure 3 shows a
dramatic decline in bird counts from several thousand in 1994 to a few hundred during the same
migratory period in recent years with bird harassment techniques employed. Fecal coliform
bacteria show a dramatic decline simultaneous with the inception of the bird harassment efforts,
and this observation (or effect) continues through the present day (Figure 2).
Figure 1. Kensico Reservoir Waterbird Totals
0
1000
2000
3000
4000
5000
Jan-
87
Jan-
88
Jan-
89
Jan-
90
Jan-
91
Jan-
92
Jan-
93
Jan-
94
Jan-
95
Jan-
96
Jan-
97
Jan-
98
Jan-
99
Jan-
00
Jan-
01
Jan-
02
Jan-
03
Jan-
04
Jan-
05
Jan-
06
Jan-
07
Jan-
08
Jan-
09
Jan-
10
Jan-
11
Nu
mb
er o
f W
ater
bir
ds
WATERBIRD MANAGEMENTBIRD SURVEYS BEGAN HERE
19
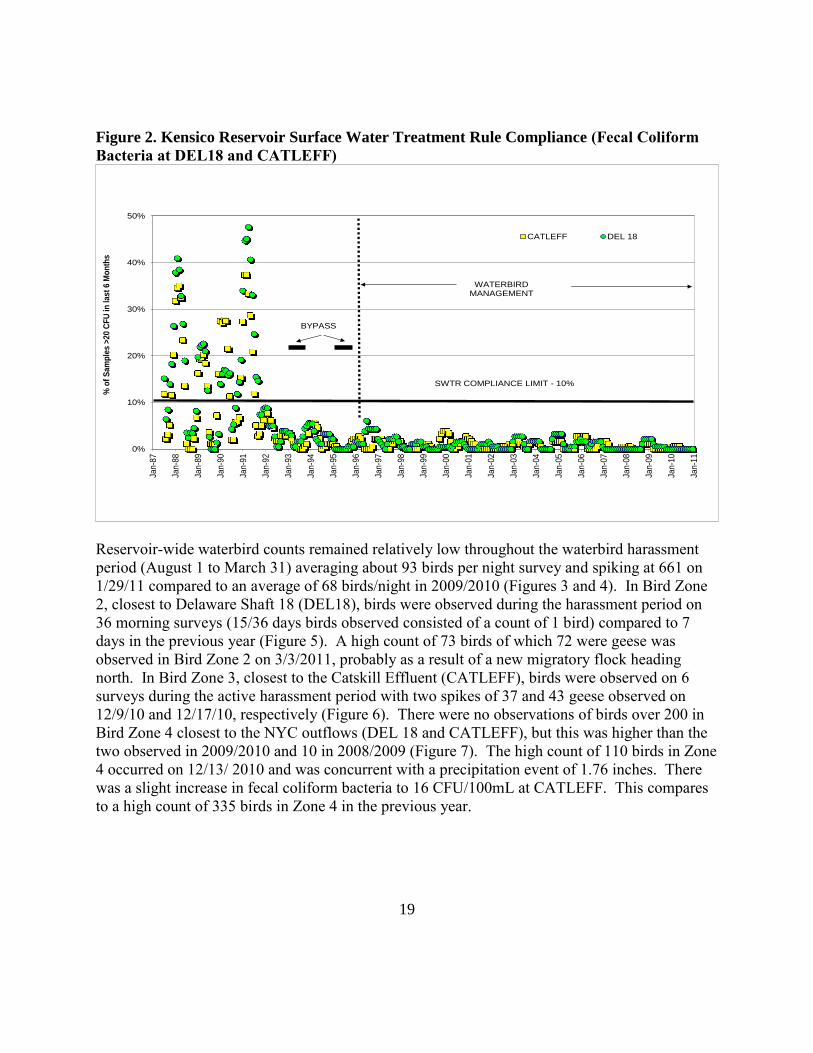
Figure 2. Kensico Reservoir Surface Water Treatment Rule Compliance (Fecal Coliform
Bacteria at DEL18 and CATLEFF)
0%
10%
20%
30%
40%
50%
Jan
-87
Jan
-88
Jan
-89
Jan
-90
Jan
-91
Jan
-92
Jan
-93
Jan
-94
Jan
-95
Jan
-96
Jan
-97
Jan
-98
Jan
-99
Jan
-00
Jan
-01
Jan
-02
Jan
-03
Jan
-04
Jan
-05
Jan
-06
Jan
-07
Jan
-08
Jan
-09
Jan
-10
Jan
-11
% o
f S
am
ple
s >
20 C
FU
in
last
6 M
on
ths
CATLEFF DEL 18
SWTR COMPLIANCE LIMIT - 10%
WATERBIRDMANAGEMENT
BYPASS
Reservoir-wide waterbird counts remained relatively low throughout the waterbird harassment
period (August 1 to March 31) averaging about 93 birds per night survey and spiking at 661 on
1/29/11 compared to an average of 68 birds/night in 2009/2010 (Figures 3 and 4). In Bird Zone
2, closest to Delaware Shaft 18 (DEL18), birds were observed during the harassment period on
36 morning surveys (15/36 days birds observed consisted of a count of 1 bird) compared to 7
days in the previous year (Figure 5). A high count of 73 birds of which 72 were geese was
observed in Bird Zone 2 on 3/3/2011, probably as a result of a new migratory flock heading
north. In Bird Zone 3, closest to the Catskill Effluent (CATLEFF), birds were observed on 6
surveys during the active harassment period with two spikes of 37 and 43 geese observed on
12/9/10 and 12/17/10, respectively (Figure 6). There were no observations of birds over 200 in
Bird Zone 4 closest to the NYC outflows (DEL 18 and CATLEFF), but this was higher than the
two observed in 2009/2010 and 10 in 2008/2009 (Figure 7). The high count of 110 birds in Zone
4 occurred on 12/13/ 2010 and was concurrent with a precipitation event of 1.76 inches. There
was a slight increase in fecal coliform bacteria to 16 CFU/100mL at CATLEFF. This compares
to a high count of 335 birds in Zone 4 in the previous year.
20
Figure 3. Kensico Reservoir Total Annual Waterbirds (4/1/2009 to 3/31/2010)
0
200
400
600A
pr-
09
May-0
9
Ju
n-0
9
Ju
l-0
9
Aug
-09
Sep
-09
Oct-
09
No
v-0
9
Dec-0
9
Ja
n-1
0
Feb-1
0
Ma
r-10
Figure 4. Kensico Reservoir Total Annual Waterbirds (4/1/2010 to 3/31/2011)
0
200
400
600
Apr-
10
Ma
y-1
0
Ju
n-1
0
Ju
l-1
0
Aug
-10
Sep-1
0
Oct-
10
Nov-1
0
Dec-1
0
Ja
n-1
1
Feb-1
1
Ma
r-11
21
Figure 5 Kensico Reservoir Bird Zone 2 Waterbirds (4/1/2010 to 3/31/2011)
0
250
500
750
1000
Ap
r-1
0
Ma
y-1
0
Ju
n-1
0
Jul-1
0
Au
g-1
0
Se
p-1
0
Oct-
10
No
v-1
0
De
c-1
0
Ja
n-1
1
Feb
-11
Ma
r-1
1
Figure 6. Kensico Reservoir Bird Zone 3 Waterbirds (4/1/2010 to 3/31/2011)
0
250
500
750
1000
Ap
r-1
0
Ma
y-1
0
Ju
n-1
0
Ju
l-1
0
Au
g-1
0
Se
p-1
0
Oct-
10
No
v-1
0
De
c-1
0
Ja
n-1
1
Fe
b-1
1
Ma
r-1
1
22
Figure 7. Kensico Reservoir Bird Zone 4 (4/1/2010 to 3/31/2011)
0
250
500
750
1000
Apr-
10
Ma
y-1
0
Jun-1
0
Jul-1
0
Aug-1
0
Sep-1
0
Oct-
10
No
v-1
0
De
c-1
0
Jan-1
1
Fe
b-1
1
Ma
r-1
1
Reservoir ice-cover was first observed during late December 2010 and persisted into the second
week in March 2011. The highest counts of gulls were recorded from late September through
mid-December 2010 peaking at 360 for the overnight count on December 13, 2010. The
reservoir-wide high waterbird count was recorded on 1/29/ 2010 at 661 birds (610 ducks and 51
geese) compared to a high count of 541 birds in the previous report (Figures 8 and 9).
The Westchester County Airport, located immediately east of the Rye Lake area (Bird Zone 6 in
Figure 29) continued to manage birds for air-traffic safety. As part of the airport’s Wildlife
Hazard Management Plan, they have contracted with the United States Department of
Agriculture Wildlife Services (USDA) to remove all Canada Geese within a five-mile radius
around the airport property which includes all of the Kensico Reservoir. Culling of the geese
occurs primarily during the goose molting period during the early summer. The DEP is actively
cooperating with the USDA and Westchester County Airport to allow access to NYC-owned
property to remove the geese. During this reporting period there were no geese removed from
the Kensico Reservoir property as the geese naturally relocated to adjacent properties prior to the
molt period.
23
Figure 8. Kensico Reservoir Total Waterbird Groups (4/1/2009 to 3/31/2010)
0
250
500
750
1000
Apr-
09
Ma
y-0
9
Ju
n-0
9
Ju
l-0
9
Aug
-09
Sep
-09
Oct-
09
Nov-0
9
Dec-0
9
Ja
n-1
0
Feb-1
0
Ma
r-10
Geese Gulls Ducks, Swans & Cormorants
Figure 9. Kensico Reservoir Total Waterbird by Groups (4/1/2010 to 3/31/2011)
0
250
500
750
1000
Apr-
10
Ma
y-1
0
Ju
n-1
0
Ju
l-1
0
Aug
-10
Sep
-10
Oct-
10
No
v-1
0
De
c-1
0
Ja
n-1
1
Fe
b-1
1
Ma
r-11
Geese Gulls Ducks, Swans & Cormorants
It is suspected that the increased spatial separation between birds and the water intake continue
to reduce the threat for an increase in fecal coliform bacteria at the DEL18 and CATLEFF
24
facilities. As a result, bird harassment activities are concentrated in the vicinity of the two main
water intake facilities. Overall, waterbird numbers continue to be lower throughout Kensico; a
direct result of the ongoing bird harassment work.
Fecal coliform bacteria levels at the keypoint water sampling locations (DEL18 and CATLEFF)
were consistently low and remained in compliance with the Surface Water Treatment Rule
(SWTR) through the reporting period (Figures 10 - 13). There were no water samples collected
at the DEL18 or CATLEFF water intakes that exceeded the SWTR limit of 20 CFU/100mL
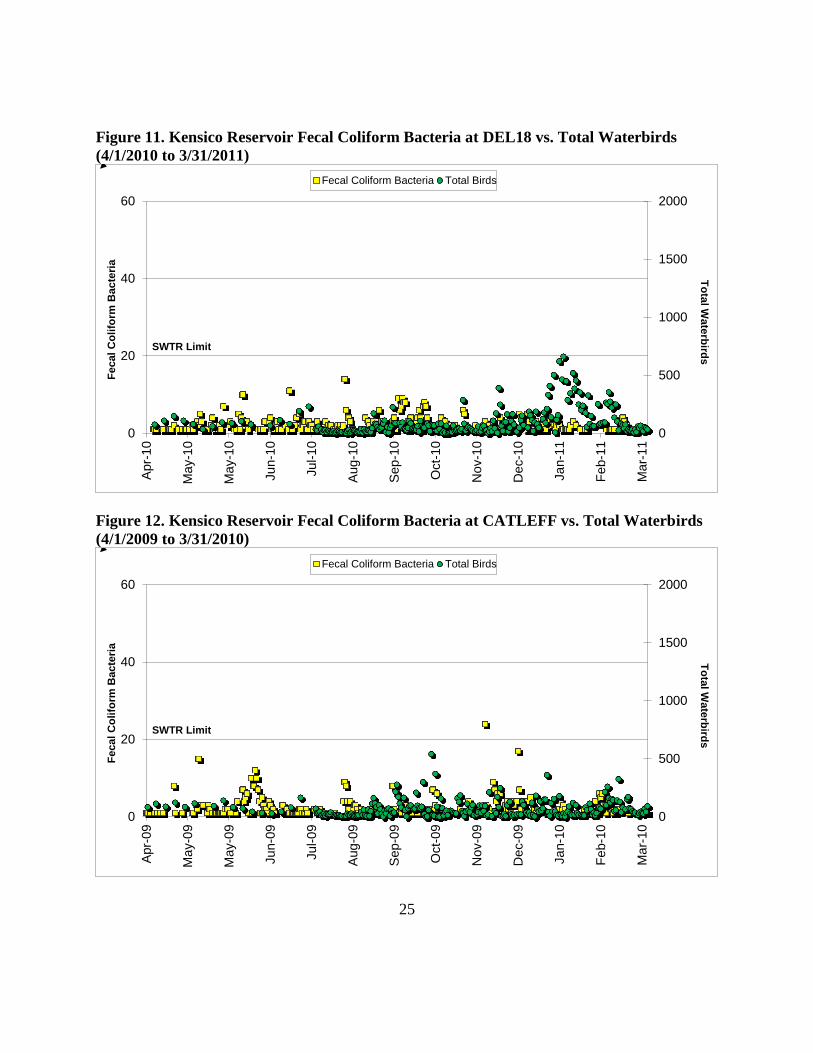
(colony forming units) in the 2010/2011 reporting period (Figures 11 and 13).
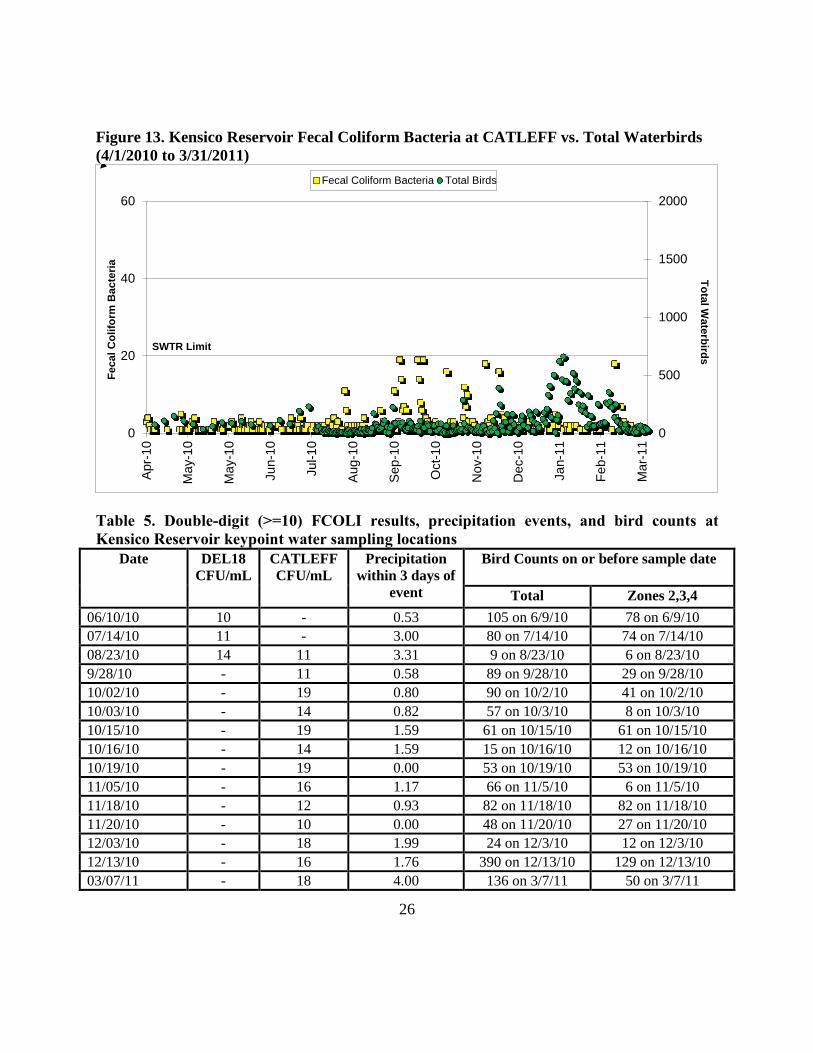
Bird counts remained relatively low during Kensico’s double-digit FCOLI events. Of the 15
days of double-digit FCOLI reported between DEL18 and CATLEFF, only one day (10/19/2010)
did not have an associated precipitation event within the previous 3-days (Table 5). Waterbird
counts rose to 390 on 12/13/2010 of which 129 were observed overnight in bird zones 2, 3, and 4
coincidental with a precipitation event of 1.76 inches and a fecal coliform bacteria level of 16
CFU/100mL at the CATLEFF water intake. All other double-digit fecal coliform water samples
may be linked to precipitation events (Table 5).
Figure 10. Kensico Reservoir Fecal Coliform Bacteria at DEL18 vs. Total Waterbirds
(4/1/2009 to 3/31/2010)
0
500
1000
1500
2000
0
20
40
60
Apr-
09
Ma
y-0
9
Ma
y-0
9
Ju
n-0
9
Ju
l-0
9
Aug
-09
Sep
-09
Oct-
09
Nov-0
9
Dec-0
9
Ja
n-1
0
Feb-1
0
Ma
r-10
To
tal W
ate
rbird
sF
ecal
Co
lifo
rm B
acte
ria
Fecal Coliform Bacteria Total Birds
SWTR Limit
25
Figure 11. Kensico Reservoir Fecal Coliform Bacteria at DEL18 vs. Total Waterbirds
(4/1/2010 to 3/31/2011)
0
500
1000
1500
2000
0
20
40
60
Apr-
10
Ma
y-1
0
Ma
y-1
0
Ju
n-1
0
Ju
l-1
0
Aug
-10
Sep
-10
Oct-
10
Nov-1
0
Dec-1
0
Ja
n-1
1
Feb-1
1
Ma
r-11
To
tal W
ate
rbird
sF
eca
l C
oli
form
Ba
cte
ria
Fecal Coliform Bacteria Total Birds
SWTR Limit
Figure 12. Kensico Reservoir Fecal Coliform Bacteria at CATLEFF vs. Total Waterbirds
(4/1/2009 to 3/31/2010)
0
500
1000
1500
2000
0
20
40
60
Apr-
09
Ma
y-0
9
Ma
y-0
9
Ju
n-0
9
Ju
l-0
9
Aug
-09
Sep
-09
Oct-
09
Nov-0
9
Dec-0
9
Ja
n-1
0
Feb-1
0
Ma
r-10
To
tal W
ate
rbird
sF
eca
l C
oli
form
Ba
cte
ria
Fecal Coliform Bacteria Total Birds
SWTR Limit
26
Figure 13. Kensico Reservoir Fecal Coliform Bacteria at CATLEFF vs. Total Waterbirds
(4/1/2010 to 3/31/2011)
0
500
1000
1500
2000
0
20
40
60
Apr-
10
Ma
y-1
0
Ma
y-1
0
Ju
n-1
0
Ju
l-1
0
Aug
-10
Sep
-10
Oct-
10
Nov-1
0
Dec-1
0
Ja
n-1
1
Feb-1
1
Ma
r-11
To
tal W
ate
rbird
sF
eca
l C
oli
form
Ba
cte
ria
Fecal Coliform Bacteria Total Birds
SWTR Limit
Table 5. Double-digit (>=10) FCOLI results, precipitation events, and bird counts at
Kensico Reservoir keypoint water sampling locations
Date DEL18
CFU/mL
CATLEFF
CFU/mL
Precipitation
within 3 days of
event
Bird Counts on or before sample date
Total Zones 2,3,4
06/10/10 10
- 0.53 105 on 6/9/10 78 on 6/9/10
07/14/10 11 - 3.00 80 on 7/14/10 74 on 7/14/10
08/23/10 14 11 3.31 9 on 8/23/10 6 on 8/23/10
9/28/10 - 11 0.58 89 on 9/28/10 29 on 9/28/10
10/02/10 - 19 0.80 90 on 10/2/10 41 on 10/2/10
10/03/10 - 14 0.82 57 on 10/3/10 8 on 10/3/10
10/15/10 - 19 1.59 61 on 10/15/10 61 on 10/15/10
10/16/10 - 14 1.59 15 on 10/16/10 12 on 10/16/10
10/19/10 - 19 0.00 53 on 10/19/10 53 on 10/19/10
11/05/10 - 16 1.17 66 on 11/5/10 6 on 11/5/10
11/18/10 - 12 0.93 82 on 11/18/10 82 on 11/18/10
11/20/10 - 10 0.00 48 on 11/20/10 27 on 11/20/10
12/03/10 - 18 1.99 24 on 12/3/10 12 on 12/3/10
12/13/10 - 16 1.76 390 on 12/13/10 129 on 12/13/10
03/07/11 - 18 4.00 136 on 3/7/11 50 on 3/7/11
27
Alewives (baitfish) flushing through upstate aqueducts to Kensico was unremarkable once again
during the fall/winter period of 2010/2011. The dead and dying alewives typically attract
foraging gulls and ducks. DEP has determined additional measures to deter baitfish from
becoming entrained into the aqueducts may not be effective at reservoirs that are a source to
Kensico. DEP and its contractor will continue monitor fish concentrations and collect
dead/dying baitfish as they enter Kensico Reservoir. The volume of fish observed, collected and
disposed of at the Kensico water intakes dramatically decreased in 2010/2011 compared to
2009/2010. There was no collection of dead fish from the Catskill Influent Chamber (CATIC) at
Kensico reported during this period compared to 200 pounds collected during the previous
reporting period.
In the spring of 2010 a total of 36 Canada Geese nests were identified along the reservoir
shoreline and on islands. Among the 36 nests, 170 eggs were punctured and replaced back to the
nest to allow the nesting geese to continue to incubate (Table 4). The average number of eggs
per nest was 4.8 compared to 5.1 in the previous year. A total of 4 young goslings were
observed rendering the egg depredation success at 98% in 2010 compared to a 99% success rate
in 2009. Normally, the adult breeding geese or failed breeders disperse from the reservoir prior
to the post-breeding season molt which begins in June however the one brood of 2 goslings
attracted many of these adults to remain at the reservoir during the molt. Usually, the geese molt
off-reservoir and generally remain flightless for approximately three weeks to a month before
attempting to fly back to the reservoir.
2. West Branch Reservoir
The 2007 FAD lists West Branch Reservoir as one of five reservoirs covered under the “as
needed” criteria for Waterfowl Management. West Branch Reservoir is divided into four bird
survey zones associated with reservoir water quality sampling locations (Figure 30). Migratory
and wintering waterbird populations at West Branch are sampled weekly to record annual trends
which aid in identifying sources of elevated fecal coliform bacteria levels. In 2010, similar to
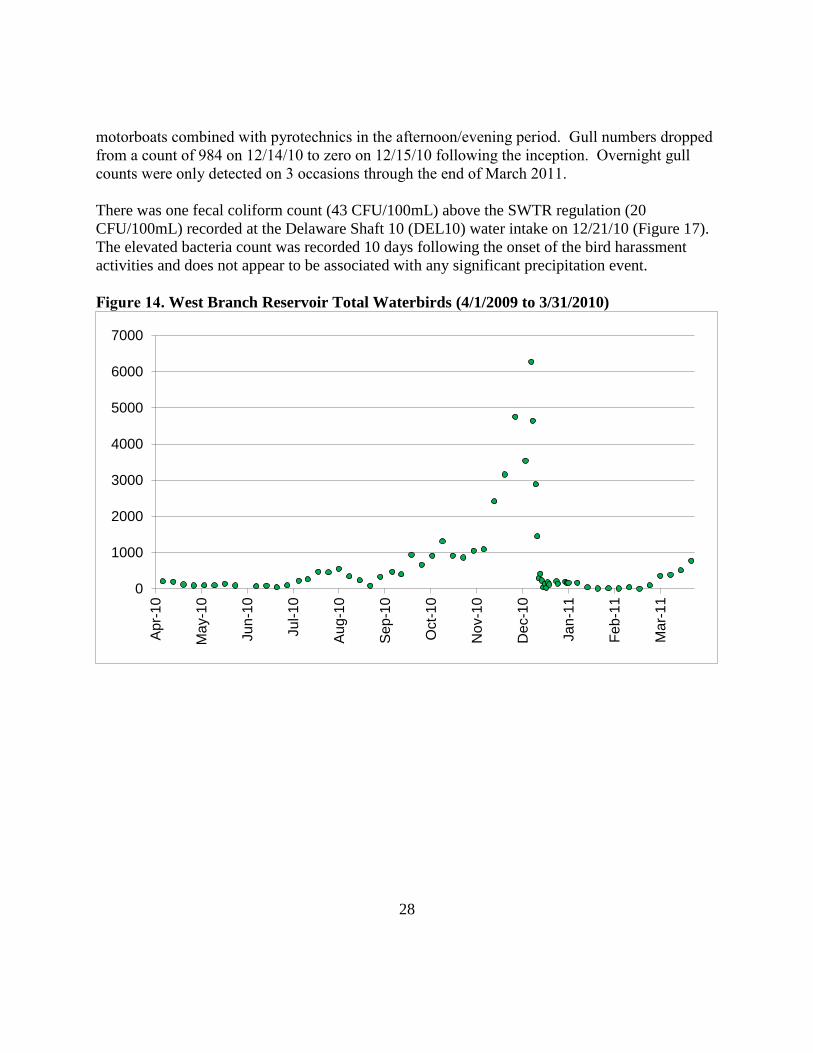
previous years gull counts started increasing by mid-summer (Figure 14). Gull counts peaked to
a level of 1,200 on 11/23/2010 with a reservoir-wide total bird spike of 6,289 recorded on
12/11/10. During this reporting period the birds (mostly waterfowl) increased to a peak of 5,564
on 12/11/2010. This was much higher than the peak of 3,890 observed on 12/15/2009 (Figures
14 and 15).
DEP determined it was necessary to conduct the bird harassment during this reporting period at
West Branch based on the criteria established for “as needed” actions (i.e. bird counts, fecal
coliform bacteria levels, reservoir operations). The program was implemented from 12/15/10
through 1/5/11 due to elevated fecal coliform bacteria detected in water samples collected at
Shaft 17 probably a result of an operational shutdown of the Rondout Reservoir which decreased
water elevations at West Branch and during the onset of the winter waterbird migration (Figure
16). The bird harassment program consisted of daily shoreline harassment and occasional use of
28
motorboats combined with pyrotechnics in the afternoon/evening period. Gull numbers dropped
from a count of 984 on 12/14/10 to zero on 12/15/10 following the inception. Overnight gull
counts were only detected on 3 occasions through the end of March 2011.
There was one fecal coliform count (43 CFU/100mL) above the SWTR regulation (20
CFU/100mL) recorded at the Delaware Shaft 10 (DEL10) water intake on 12/21/10 (Figure 17).
The elevated bacteria count was recorded 10 days following the onset of the bird harassment
activities and does not appear to be associated with any significant precipitation event.
Figure 14. West Branch Reservoir Total Waterbirds (4/1/2009 to 3/31/2010)
0
1000
2000
3000
4000
5000
6000
7000
Ap
r-1
0
Ma
y-1
0
Ju
n-1
0
Ju
l-1
0
Au
g-1
0
Se
p-1
0
Oct-
10
No
v-1
0
De
c-1
0
Ja
n-1
1
Fe
b-1
1
Ma
r-1
1

29
Figure 15. West Branch Reservoir Total Waterbirds (4/1/2010 to 3/31/2011)
0
1000
2000
3000
4000
5000
6000
7000A
pr-
09
May-0
9
Jun-0
9
Jul-09
Aug-0
9
Sep-0
9
Oct-
09
Nov-0
9
Dec-0
9
Jan-1
0
Feb-1
0
Mar-
10
Figure 16. West Branch Reservoir As Needed Bird Harassment Program (12/15/2010 to
1/5/2011)
0
2500
5000
7500
10/5
/10
10/1
0/1
0
10/1
5/1
0
10/2
0/1
0
10/2
5/1
0
10/3
0/1
0
11/4
/10
11/9
/10
11/1
4/1
0
11/1
9/1
0
11/2
4/1
0
11/2
9/1
0
12/4
/10
12/9
/10
12/1
4/1
0
12/1
9/1
0
12/2
4/1
0
12/2
9/1
0
1/3
/11
30
Figure 17. West Branch Reservoir Fecal Coliform Bacteria at Shaft 10 vs. Total
Waterbirds (1/1/2006 to 3/31/2011)
0
2000
4000
6000
8000
10000
12000
0
20
40
60
Jan-0
6
Ju
l-0
6
Ja
n-0
7
Ju
l-0
7
Ja
n-0
8
Ju
l-0
8
Ja
n-0
9
Ju
l-0
9
Ja
n-1
0
Ju
l-1
0
Ja
n-1
1
To
tal W
ate
rbird
sF
ec
al C
olifo
rm B
ac
teri
a
Fecal Coliform Bacteria - Shaft 10 Total Waterbirds
DEP conducted reproductive control on Canada Geese from April 1 through May 31 to reduce
productivity at West Branch Reservoir. In 2010, 12 nests and 42 eggs were depredated which
was down from the previous year at 13 nests and 55 eggs (Table 4). The egg-depredation was
deemed 100% successful. There were no Mute Swans nesting at West Branch in 2010. A small
colony of Double-crested Cormorants attempted to nest in the spring of 2009 but subsequently
failed as the nests were flooded during the incubation period. The colony has since developed a
new nesting location along the eastern shoreline in Bird Zone 3.
3. Rondout Reservoir The Rondout Reservoir is a terminal or source reservoir to both Kensico and West Branch.
Located west of the Hudson River, it is part of the Delaware System of reservoirs. The 2007
FAD lists Rondout as one of five reservoirs covered under the “as needed” criteria for Waterfowl
Management. Survey frequency is listed as biweekly in the 2002 FAD, however, DEP increases
these surveys to weekly with additional surveys added during the early winter period when bird
numbers increase and bacteria results start to rise. The Rondout Reservoir is divided into nine
bird sampling geographic zones associated with reservoir water quality sampling locations
(Figure 41).
Seasonally elevated bird counts and the associated rise in fecal coliform levels reported in Figure
31
22 continue to suggest a relationship that will need to be closely monitored. During this
reporting period, there were eight double-digit fecal coliform raw water samples collected at
Rondout and only one that exceeded the SWTR of 20 CFU/100mL on 12/26/2010 (21
CFU/100ml) compared to no samples above the 20 level during the previous year (Figure 18).
This peak of 21 CFU/100/ml was preceded by three previous samples in double digits (10
CFU/100mL on 12/23/10; 11 CFU/100/mL on 12/22/10; and 16 CFU/100/mL on 12/20/10) and
may correspond to the change in the gull roosting location from mid-reservoir to Bird Zone 1 in
front of the Rondout water intake from late November 2010 through early January 2011.
Figure 18. Rondout Reservoir Fecal Coliform Bacteria at Rondout Effluent vs. Total
Waterbirds (1/1/2006 to 3/31/2011)
0
200
400
600
800
1000
1200
0
20
40
60
Ja
n-0
6
Ju
l-0
6
De
c-0
6
Ju
l-0
7
De
c-0
7
Ju
n-0
8
De
c-0
8
Ju
n-0
9
De
c-0
9
Ju
n-1
0
De
c-1
0
To
tal W
ate
rbird
sF
eca
l C
olif
orm
Ba
cte
ria
Fecal Coliform Bacteria (CFU/100mL) - Rondout Effluent Chamber Total Waterbirds
Ducks and duck-like species were present year-around and gradually increased from late summer
through the autumn and winter period spiking at 697 on January 4, 2011. A flock of Brant Geese
(Branta bernicla) was observed stopping-over on their northerly migration back to Canada on
6/2/2010 and just prior to the annual post-nuptial molt of local Canada Geese where they are
rendered flightless for approximately 4 weeks. Canada geese were mostly absent during the
winter period at Rondout but increased slightly in mid-March 2011. Each year seasonal
elevations of waterbirds (mostly gulls and ducks) are recorded at Rondout (Figure 19).
Reservoir icing was first observed in the first week in January 2011 and persisted through the
third week in March at which time breeding populations of Canada geese were recorded
establishing territories.
32
Figure 19. Rondout Reservoir Total Waterbirds (9/1/1995 to 3/31/2011)
0
250
500
750
1000
Se
p-9
5
Se
p-9
6
Se
p-9
7
Se
p-9
8
Se
p-9
9
Se
p-0
0
Se
p-0
1
Se
p-0
2
Se
p-0
3
Se
p-0
4
Se
p-0
5
Se
p-0
6
Se
p-0
7
Se
p-0
8
Se
p-0
9
Se
p-1
0
DEP closely monitors the spatial distribution of the gull populations at Rondout particularly
during the December through January period. Gulls typically roost at Bird Zone 1; zone closest
to the Rondout Effluent Chamber. There does not, however, appear to be a foraging attraction
by the birds nor is it due to ice cover restrictions on other parts of the reservoir forcing the birds
to roost at the Zone 1 location this time of year. Occasionally, it is necessary to increase the
number of waterbird surveys each December and January and monitor changes in both bird
numbers and roost location. No additional surveys, however, were necessary in response to the
gull roost shift to Bird Zone 1 as this is part of the criteria to activate the “as needed” bird
harassment actions. DEP did not have to activate its bird harassment program in the 2010/2011
reporting period. The seasonal increase in waterbird populations was similar to the previous year
(Figures 20 and 21).
DEP also conducted routine monitoring and full compliance with a protection plan for Bald
Eagles (Haliaeetus leucocephalus) as required by the DEC and United States Fish and Wildlife
Service in preparation for any “as needed” bird harassment activity as stated in the Findings
Statement of the Environmental Impact Statement on file.

33
Figure 20. Rondout Reservoir Total Waterbirds (4/1/2009 to 3/31/2010)
0
250
500
750
1000
Ap
r-0
9
Ma
y-0
9
Jun
-09
Jul-0
9
Au
g-0
9
Se
p-0
9
Oct-
09
No
v-0
9
De
c-0
9
Jan
-10
Fe
b-1
0
Ma
r-1
0
Figure 21. Rondout Reservoir Total Waterbirds (4/1/2010 to 3/31/2011)
0
250
500
750
1000
Ap
r-1
0
Ma
y-1
0
Jun
-10
Jul-1
0
Au
g-1
0
Se
p-1
0
Oct-
10
No
v-1
0
De
c-1
0
Jan
-11
Fe
b-1
1
Ma
r-1
1
34
DEP conducted reproductive control on Canada Geese at Rondout in 2010. Due to the close
proximity of some Canada goose nests to established Bald Eagle nests DEP abstained from some
depredation work to maintain compliance with the New York State Endangered Species
Protection Laws. A total of 2 nests and 11 eggs were depredated while 21 goslings hatched in
2010 compared to 8 goslings observed in 2009 (Table 4). There were no Mute Swan nests
identified at Rondout in 2010.
4. Ashokan Reservoir
The 2007 FAD lists Ashokan Reservoir as one of five reservoirs covered under the “as needed”
criteria for Waterfowl Management. The Ashokan Reservoir is divided into two main basins
each with a water intake chamber located at the Dividing Weir (Figure 32). There are six bird
sampling geographic zones, three within each basin and associated with reservoir water quality
sampling locations (Figure 32). Overall, bird numbers (particularly gulls) continue to decrease
in abundance during the migration and over-wintering period at the Ashokan over the past years
(Figure 22). The East Basin of the Ashokan is the primary waterbird roosting area where high
numbers of gulls, ducks, and geese have been recorded seasonally relative to the West Basin
(Figures 23 and 24).
Figure 22. Ashokan Reservoir Total Waterbirds (1994 to 2011)
0
2000
4000
6000
8000
10000
12000
Aug-9
4
Aug-9
5
Aug-9
6
Aug-9
7
Au
g-9
8
Aug-9
9
Aug-0
0
Aug-0
1
Aug-0
2
Aug-0
3
Aug-0
4
Aug-0
5
Aug-0
6
Aug-0
7
Aug-0
8
Aug-0
9
Au
g-1
0
Gull counts spiked at a count of 720 in mid-November 2010 and again in mid-March 2011 at
1,237. Gulls were largely absent from early January 2011 through mid-March 2011. Canada
35
Geese numbers rose to a high count of 366 on 9/3/2010 and dropped to zero from mid-December
through early February 2011. There appears to be three slightly elevated counts of geese during
this reporting period: one in the late spring/early summer as breeding populations from
surrounding private lands congregate for safety and food at the Ashokan during the post-nuptial
molt; another that coincides with fall migration and winter stop-over in September and October;
and a final elevation with an early onset of migratory geese flying north back to the breeding
grounds. The Ashokan West Basin generally has very low bird counts annually compared to the
East Basin (Figures 23 and 24).
Full reservoir ice-cover was observed by early January 2010 at the Ashokan Reservoir. Ice-
cover typically reduces gull roosting as the numbers typically drop to zero under such conditions.
Duck species, present year-around, reached a peak on 3/25/ 2011 at 1,032 compared to a high
count of 1,017 recorded on 3/12/2010 in the previous report.
Figure 23. Ashokan Reservoir West Basin Total Waterbirds in Bird Zones 1, 2, and 3 (1994
to 2011)
0
2000
4000
6000
8000
10000
12000
Aug-9
4
Aug-9
5
Aug-9
6
Aug-9
7
Aug-9
8
Aug-9
9
Aug-0
0
Aug-0
1
Aug-0
2
Aug-0
3
Aug-0
4
Aug-0
5
Aug-0
6
Aug-0
7
Aug-0
8
Aug-0
9
Aug-1
0
36
Figure 24. Ashokan Reservoir East Basin Total Waterbirds in Bird Zones 4, 5, and 6 (1994
to 2011)
0
2000
4000
6000
8000
10000
12000
Aug-9
4
Aug-9
5
Aug-9
6
Aug-9
7
Au
g-9
8
Aug-9
9
Aug-0
0
Aug-0
1
Aug-0
2
Aug-0
3
Aug-0
4
Aug-0
5
Aug-0
6
Aug-0
7
Aug-0
8
Aug-0
9
Au
g-1
0
Fecal coliform samples collected at the water intake sampling location at Ashokan (EARCM) did
not exceed the 20 CFU/100mL SWTR in 2010/2011, and this result was similar to that observed
during the same 2009/2010 reporting (Figure 25). There were seven double-digit FCOLI
bacteria samples of which only two were above the SWTR limit both samples do not appear to
be caused by birds roosting. The spike in reservoir-wide bird activity on 3/18/2011 of 2,006
birds compared to the 2009/2010 of 2,218 birds on 3/12/2010 did not appear to have an
important influence on FCOLI levels as the March 2011 bacteria counts for EARCM remained in
the single digits except for a sample of 10 CFU/100mL recorded on 3/17/2011.
The relatively low fecal coliform bacteria levels did not necessitate the activation of the “as
needed” bird management options as required under the Final 2007 FAD, Section 4.1 during this
reporting period.
DEP conducted reproductive control on Canada Geese from April 1 through June 30 to reduce
productivity at Ashokan. In 2010, four Canada goose nests were identified and 19 eggs addled
compared to 7 nests and 30 eggs 2009 (Table 4). The egg-depredation success rate at the
Ashokan Reservoir in 2010 was 37% compared to a 58% success in 2009. A total of 32 goslings
were observed in late spring 2010 some of which are known to have hatched in wetlands off
DEP property. There were no Mute Swans found nesting in 2010 similar to 2009.
37
Figure 25. Ashokan Reservoir Fecal Coliform Bacteria vs. Waterbirds – (1/1/2006 to
3/31/2011)
0
1000
2000
3000
4000
5000
0
20
40
60
80
100
120
140
160
Jan-06 Jul-06 Jan-07 Jul-07 Jan-08 Jul-08 Jan-09 Jul-09 Jan-10 Jul-10 Jan-11
To
tal W
ate
rbird
sF
ec
al C
oli
form
Ba
cte
ria
Fecal Coliform Bacteria (CFU/100mL) - EARCM Total Waterbirds
5. Croton Falls Reservoir
The 2007 FAD lists Croton Falls Reservoir as one of five reservoirs covered under the “as
needed” criteria for Waterfowl Management. The Croton Falls Reservoir is divided into five
bird sampling geographic zones associated with reservoir water quality sampling locations
(Figure 33). Similar to the previous year gulls and waterfowl (ducks) continue to represent the
primary bird groups counted throughout Croton Falls Reservoir from the late July 2010 through
the spring of 2011 except for most of January and February 2011 during extensive ice-cover
(Figures 26 and 27). Geese were present from April 2010 through early December and again in
mid-March 2011. Geese numbers spiked in July 2010 at 103 compared to a high count of 103 in
October 2009 in the previous reporting period. Waterbird species (mostly Common Mergansers
and Mallards) were present throughout the year; increasing in numbers in late July resulting from
successful local breeding and spike at 1,028 on 12/172010 and again on 3/11/2011 at 1,131; a
similar roosting pattern 2009/2010 (Figures 26 and 27). Gull counts also started increasing in in
late July and spiked at 900 on 12/17/2010 then dropping to zero during ice cover from late
December though late February 2011.

38
Figure 26. Croton Falls Reservoir Total Waterbirds - (4/1/2009 to 3/31/2010)
0
1000
2000
3000
4000
Apr-
09
Ma
y-0
9
Ju
n-0
9
Ju
l-0
9
Aug
-09
Sep
-09
Oct-
09
Nov-0
9
Dec-0
9
Ja
n-1
0
Feb-1
0
Ma
r-10
Figure 27. Croton Falls Reservoir Total Waterbirds (4/1/2010 to 3/31/2011)
0
1000
2000
3000
4000
Apr-
10
Ma
y-1
0
Ju
n-1
0
Ju
l-1
0
Aug
-10
Sep
-10
Oct-
10
Nov-1
0
Dec-1
0
Ja
n-1
1
Feb-1
1
Ma
r-11
There were a total of 9 double-digit fecal coliform bacteria samples measured at the Croton Falls
effluent chamber in 2010/2011 of which 4 were above the 20 CFU/100mL limit compared to 21
double-digit samples of which only 1 was above 20 CFU/100mL recorded in 2009/2010. There
does appear to be a relationship between the seasonal increases in bird activity and elevated
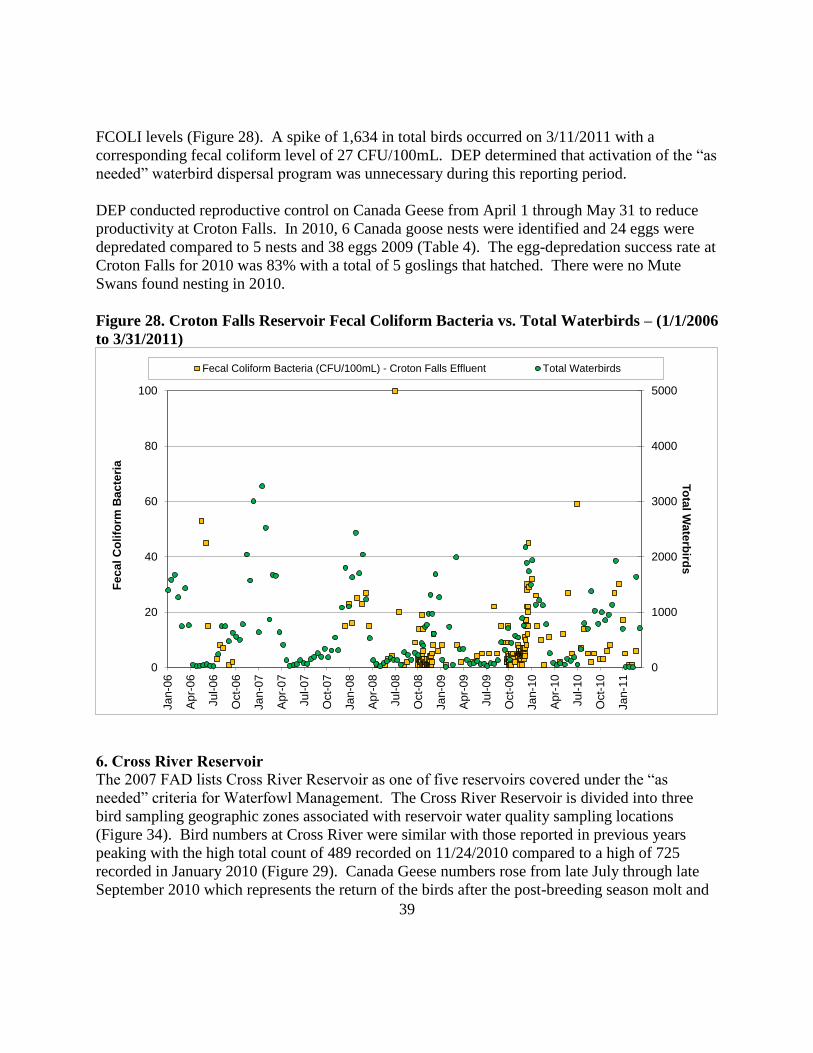
39
FCOLI levels (Figure 28). A spike of 1,634 in total birds occurred on 3/11/2011 with a
corresponding fecal coliform level of 27 CFU/100mL. DEP determined that activation of the “as
needed” waterbird dispersal program was unnecessary during this reporting period.
DEP conducted reproductive control on Canada Geese from April 1 through May 31 to reduce
productivity at Croton Falls. In 2010, 6 Canada goose nests were identified and 24 eggs were
depredated compared to 5 nests and 38 eggs 2009 (Table 4). The egg-depredation success rate at
Croton Falls for 2010 was 83% with a total of 5 goslings that hatched. There were no Mute
Swans found nesting in 2010.
Figure 28. Croton Falls Reservoir Fecal Coliform Bacteria vs. Total Waterbirds – (1/1/2006
to 3/31/2011)
0
1000
2000
3000
4000
5000
0
20
40
60
80
100
Ja
n-0
6
Apr-
06
Ju
l-0
6
Oct-
06
Ja
n-0
7
Apr-
07
Ju
l-0
7
Oct-
07
Ja
n-0
8
Apr-
08
Ju
l-0
8
Oct-
08
Ja
n-0
9
Apr-
09
Ju
l-0
9
Oct-
09
Ja
n-1
0
Apr-
10
Ju
l-1
0
Oct-
10
Ja
n-1
1
To
tal W
ate
rbird
sF
ec
al C
oli
form
Ba
cte
ria
Fecal Coliform Bacteria (CFU/100mL) - Croton Falls Effluent Total Waterbirds
6. Cross River Reservoir
The 2007 FAD lists Cross River Reservoir as one of five reservoirs covered under the “as
needed” criteria for Waterfowl Management. The Cross River Reservoir is divided into three
bird sampling geographic zones associated with reservoir water quality sampling locations
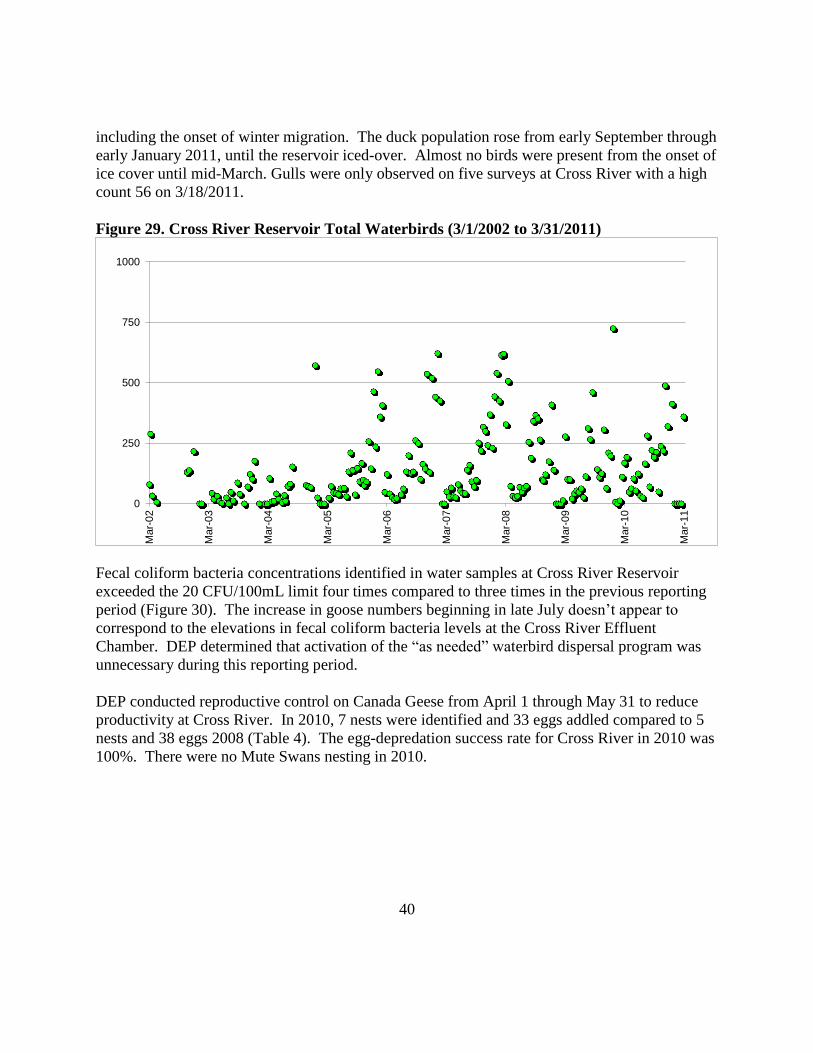
(Figure 34). Bird numbers at Cross River were similar with those reported in previous years
peaking with the high total count of 489 recorded on 11/24/2010 compared to a high of 725
recorded in January 2010 (Figure 29). Canada Geese numbers rose from late July through late
September 2010 which represents the return of the birds after the post-breeding season molt and
40
including the onset of winter migration. The duck population rose from early September through
early January 2011, until the reservoir iced-over. Almost no birds were present from the onset of
ice cover until mid-March. Gulls were only observed on five surveys at Cross River with a high
count 56 on 3/18/2011.
Figure 29. Cross River Reservoir Total Waterbirds (3/1/2002 to 3/31/2011)
0
250
500
750
1000
Mar-
02
Mar-
03
Mar-
04
Mar-
05
Mar-
06
Mar-
07
Mar-
08
Mar-
09
Mar-
10
Mar-
11
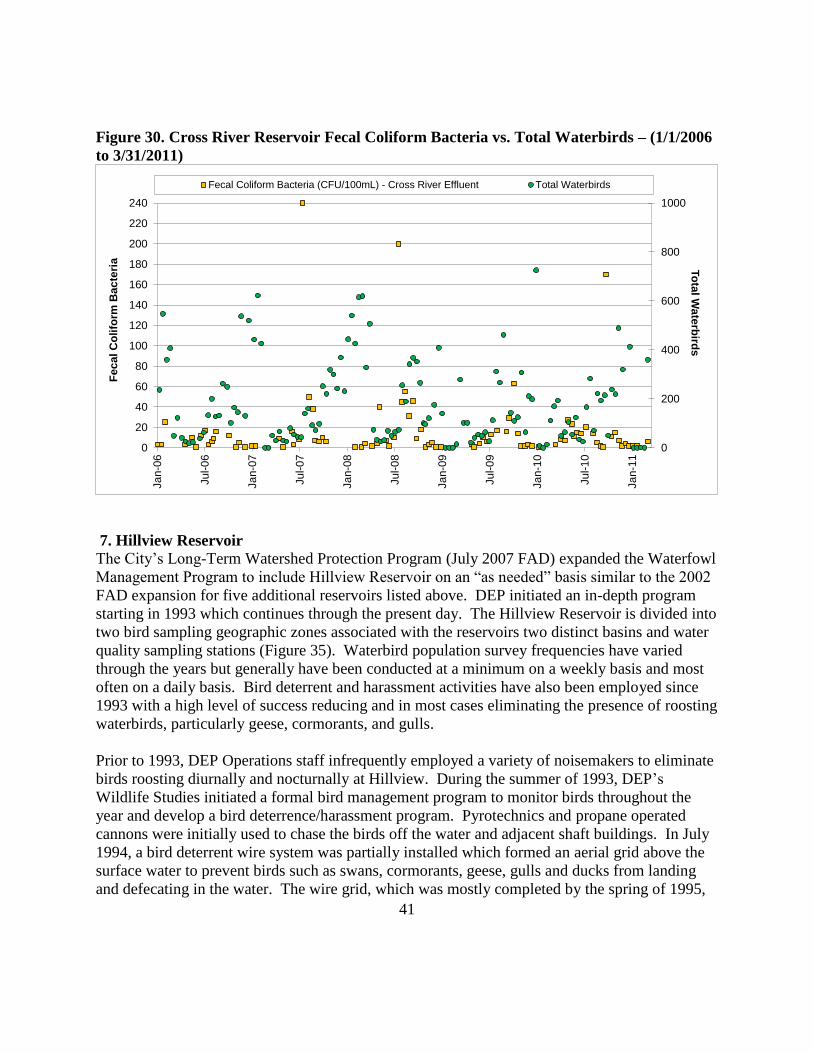
Fecal coliform bacteria concentrations identified in water samples at Cross River Reservoir
exceeded the 20 CFU/100mL limit four times compared to three times in the previous reporting
period (Figure 30). The increase in goose numbers beginning in late July doesn’t appear to
correspond to the elevations in fecal coliform bacteria levels at the Cross River Effluent
Chamber. DEP determined that activation of the “as needed” waterbird dispersal program was
unnecessary during this reporting period.
DEP conducted reproductive control on Canada Geese from April 1 through May 31 to reduce
productivity at Cross River. In 2010, 7 nests were identified and 33 eggs addled compared to 5
nests and 38 eggs 2008 (Table 4). The egg-depredation success rate for Cross River in 2010 was
100%. There were no Mute Swans nesting in 2010.
41
Figure 30. Cross River Reservoir Fecal Coliform Bacteria vs. Total Waterbirds – (1/1/2006
to 3/31/2011)
0
200
400
600
800
1000
0
20
40
60
80
100
120
140
160
180
200
220
240
Ja
n-0
6
Ju
l-0
6
Ja
n-0
7
Ju
l-0
7
Ja
n-0
8
Ju
l-0
8
Ja
n-0
9
Ju
l-0
9
Ja
n-1
0
Ju
l-1
0
Ja
n-1
1
To
tal W
ate
rbird
sF
ec
al C
olifo
rm B
ac
teri
a
Fecal Coliform Bacteria (CFU/100mL) - Cross River Effluent Total Waterbirds
7. Hillview Reservoir
The City’s Long-Term Watershed Protection Program (July 2007 FAD) expanded the Waterfowl
Management Program to include Hillview Reservoir on an “as needed” basis similar to the 2002
FAD expansion for five additional reservoirs listed above. DEP initiated an in-depth program
starting in 1993 which continues through the present day. The Hillview Reservoir is divided into
two bird sampling geographic zones associated with the reservoirs two distinct basins and water
quality sampling stations (Figure 35). Waterbird population survey frequencies have varied
through the years but generally have been conducted at a minimum on a weekly basis and most
often on a daily basis. Bird deterrent and harassment activities have also been employed since
1993 with a high level of success reducing and in most cases eliminating the presence of roosting
waterbirds, particularly geese, cormorants, and gulls.
Prior to 1993, DEP Operations staff infrequently employed a variety of noisemakers to eliminate
birds roosting diurnally and nocturnally at Hillview. During the summer of 1993, DEP’s
Wildlife Studies initiated a formal bird management program to monitor birds throughout the
year and develop a bird deterrence/harassment program. Pyrotechnics and propane operated
cannons were initially used to chase the birds off the water and adjacent shaft buildings. In July
1994, a bird deterrent wire system was partially installed which formed an aerial grid above the
surface water to prevent birds such as swans, cormorants, geese, gulls and ducks from landing
and defecating in the water. The wire grid, which was mostly completed by the spring of 1995,
42
consisted of a combination of high-test monofilament, Kevlar wire, and twine. The grid was
strung along the shoreline fences spanning a distance of nearly 1,200 feet. From 1994 to 2006,
this wire grid system was maintained by DEP staff until a contract was let in 2006 to install an
upgraded version of the wire deterrent system using 15’ stanchions with reel tensioning devices
at the base. DEP and its contractor continue to use pyrotechnics to supplement the wire system
to actively keep birds off the reservoir. In the early winter of 2008, DEP installed remote-
operated propane cannons along the reservoir’s dividing wall to keep gulls and other birds from
roosting on the dividing wall railings. The cannons were supplemented by installation of Daddi-
long-legs (bird deterrent wires) placed on the tops of the 15’ stanchions to prevent birds from
roosting. The program enhancements were funded in association with an EPA Administrative
Order.
A new EPA Administrative Order on Consent governing the covering of Hillview Reservoir
(Docket No. SDWA-02-2010-8027 Catskill Delaware System) was signed on 5/24/2010. Under
this order and beginning on 8/1/2011 DEP will be implementing an enhanced wildlife
management program at Hillview to further protect the water supply. New best management
practices will include increased bird census and harassment, mammal population monitoring and
removal, alewife (baitfish) monitoring and removal, facility and grounds inspections and clean-
up of animal feces and monthly reporting on wildlife management activities at Hillview
Reservoir.
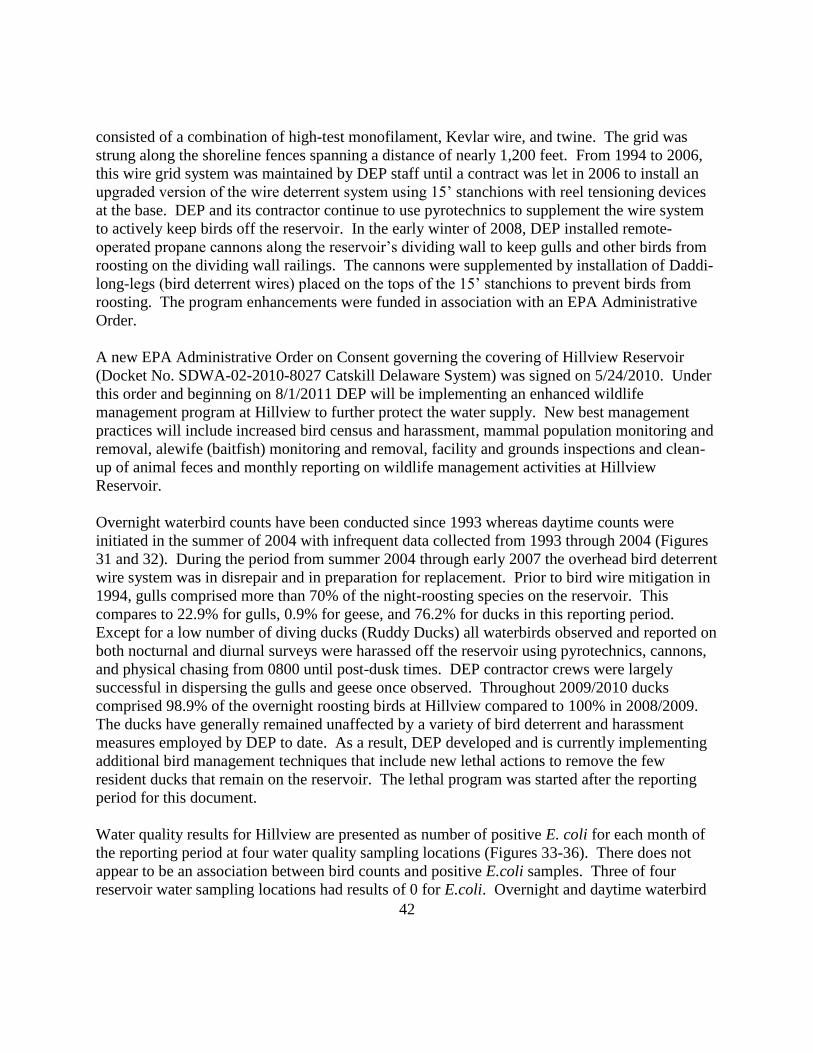
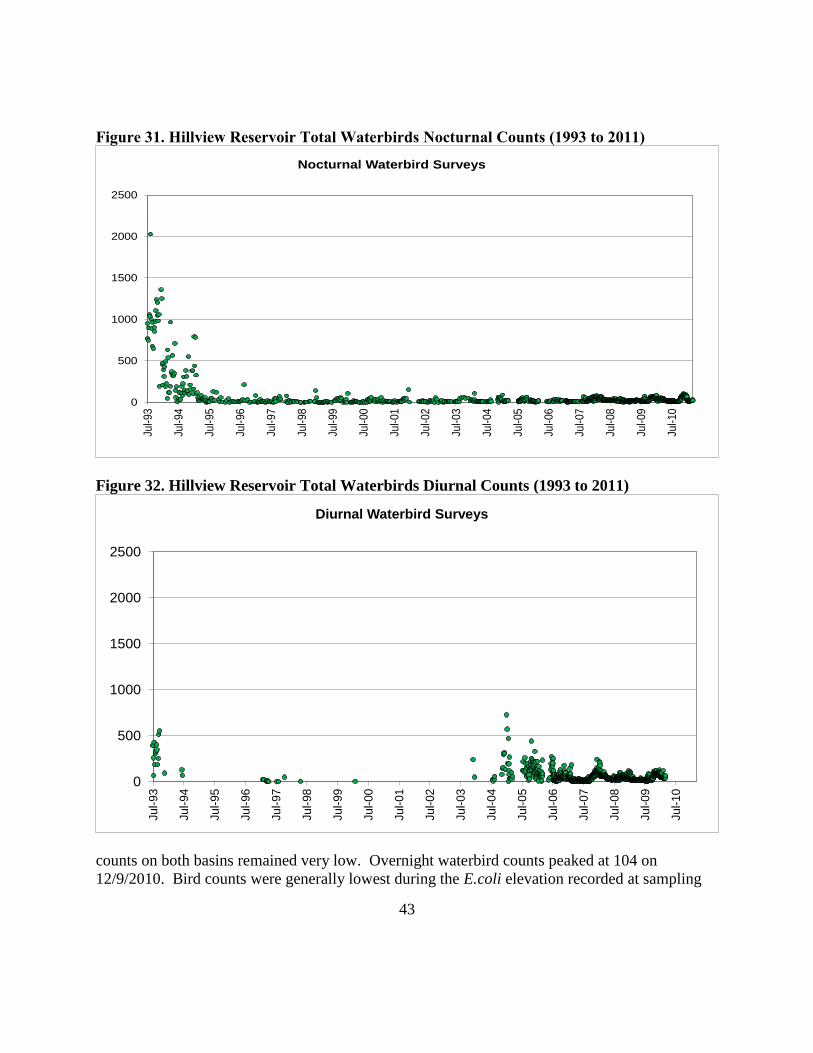
Overnight waterbird counts have been conducted since 1993 whereas daytime counts were
initiated in the summer of 2004 with infrequent data collected from 1993 through 2004 (Figures
31 and 32). During the period from summer 2004 through early 2007 the overhead bird deterrent
wire system was in disrepair and in preparation for replacement. Prior to bird wire mitigation in
1994, gulls comprised more than 70% of the night-roosting species on the reservoir. This
compares to 22.9% for gulls, 0.9% for geese, and 76.2% for ducks in this reporting period.
Except for a low number of diving ducks (Ruddy Ducks) all waterbirds observed and reported on
both nocturnal and diurnal surveys were harassed off the reservoir using pyrotechnics, cannons,
and physical chasing from 0800 until post-dusk times. DEP contractor crews were largely
successful in dispersing the gulls and geese once observed. Throughout 2009/2010 ducks
comprised 98.9% of the overnight roosting birds at Hillview compared to 100% in 2008/2009.
The ducks have generally remained unaffected by a variety of bird deterrent and harassment
measures employed by DEP to date. As a result, DEP developed and is currently implementing
additional bird management techniques that include new lethal actions to remove the few
resident ducks that remain on the reservoir. The lethal program was started after the reporting
period for this document.
Water quality results for Hillview are presented as number of positive E. coli for each month of
the reporting period at four water quality sampling locations (Figures 33-36). There does not
appear to be an association between bird counts and positive E.coli samples. Three of four
reservoir water sampling locations had results of 0 for E.coli. Overnight and daytime waterbird
43
Figure 31. Hillview Reservoir Total Waterbirds Nocturnal Counts (1993 to 2011)
0
500
1000
1500
2000
2500
Jul-93
Jul-94
Jul-95
Jul-96
Jul-97
Jul-98
Jul-99
Jul-00
Jul-01
Jul-02
Jul-03
Jul-04
Jul-05
Jul-06
Jul-07
Jul-08
Jul-09
Jul-10
Nocturnal Waterbird Surveys
Figure 32. Hillview Reservoir Total Waterbirds Diurnal Counts (1993 to 2011)
0
500
1000
1500
2000
2500
Ju
l-93
Ju
l-94
Ju
l-95
Ju
l-96
Ju
l-97
Ju
l-98
Ju
l-99
Ju
l-00
Ju
l-01
Ju
l-02
Ju
l-03
Ju
l-04
Ju
l-05
Ju
l-06
Ju
l-07
Ju
l-08
Ju
l-09
Ju
l-10
Diurnal Waterbird Surveys
counts on both basins remained very low. Overnight waterbird counts peaked at 104 on
12/9/2010. Bird counts were generally lowest during the E.coli elevation recorded at sampling
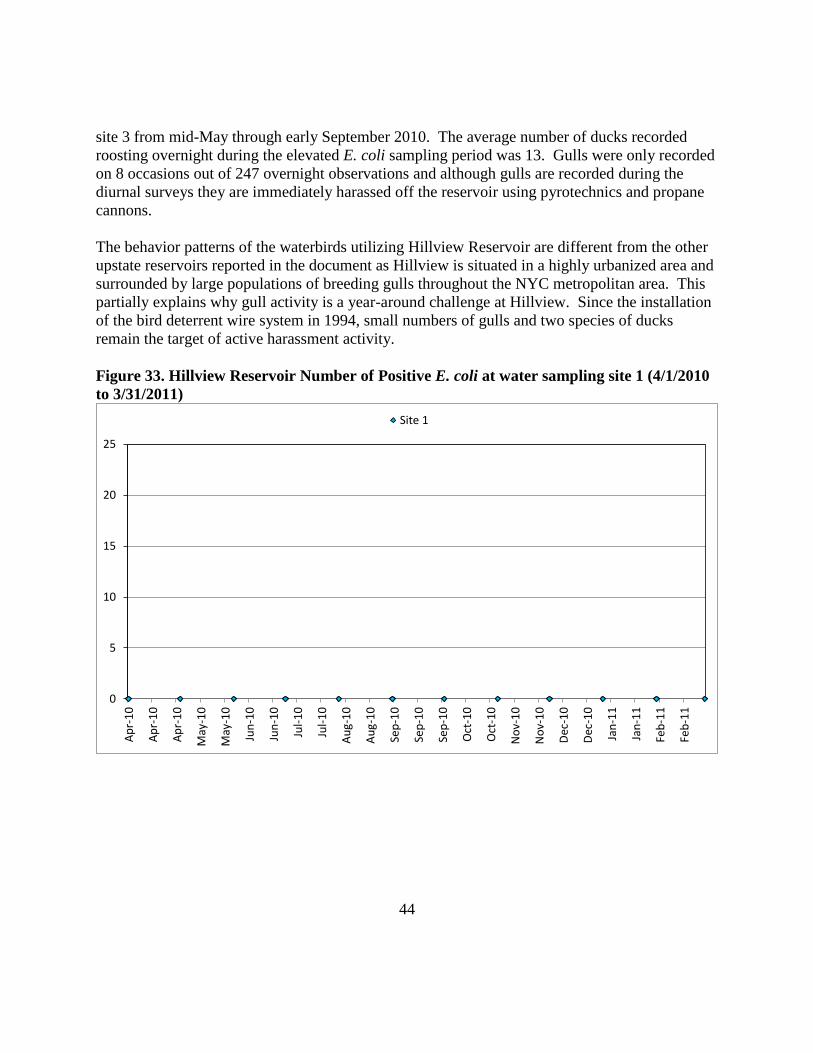
44
site 3 from mid-May through early September 2010. The average number of ducks recorded
roosting overnight during the elevated E. coli sampling period was 13. Gulls were only recorded
on 8 occasions out of 247 overnight observations and although gulls are recorded during the
diurnal surveys they are immediately harassed off the reservoir using pyrotechnics and propane
cannons.
The behavior patterns of the waterbirds utilizing Hillview Reservoir are different from the other
upstate reservoirs reported in the document as Hillview is situated in a highly urbanized area and
surrounded by large populations of breeding gulls throughout the NYC metropolitan area. This
partially explains why gull activity is a year-around challenge at Hillview. Since the installation
of the bird deterrent wire system in 1994, small numbers of gulls and two species of ducks
remain the target of active harassment activity.
Figure 33. Hillview Reservoir Number of Positive E. coli at water sampling site 1 (4/1/2010
to 3/31/2011)
0
5
10
15
20
25
Ap
r-1
0
Ap
r-1
0
Ap
r-1
0
May
-10
May
-10
Jun
-10
Jun
-10
Jul-
10
Jul-
10
Au
g-1
0
Au
g-1
0
Sep
-10
Sep
-10
Sep
-10
Oct
-10
Oct
-10
No
v-1
0
No
v-1
0
Dec
-10
Dec
-10
Jan
-11
Jan
-11
Feb
-11
Feb
-11
Site 1
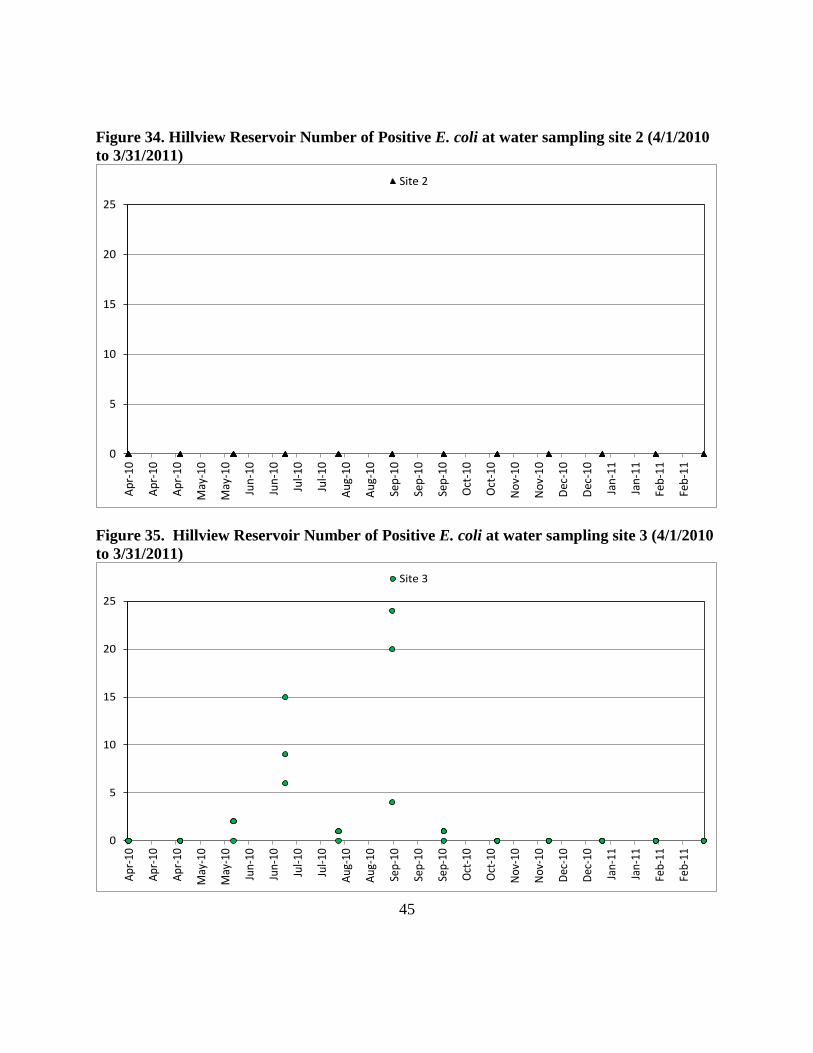
45
Figure 34. Hillview Reservoir Number of Positive E. coli at water sampling site 2 (4/1/2010
to 3/31/2011)
0
5
10
15
20
25
Ap
r-10
Ap
r-10
Ap
r-10
May
-10
May
-10
Jun
-10
Jun
-10
Jul-
10
Jul-
10
Au
g-10
Au
g-10
Sep
-10
Sep
-10
Sep
-10
Oct
-10
Oct
-10
No
v-10
No
v-10
Dec
-10
Dec
-10
Jan
-11
Jan
-11
Feb
-11
Feb
-11
Site 2
Figure 35. Hillview Reservoir Number of Positive E. coli at water sampling site 3 (4/1/2010
to 3/31/2011)
0
5
10
15
20
25
Apr
-10
Apr
-10
Apr
-10
May
-10
May
-10
Jun-
10
Jun-
10
Jul-
10
Jul-
10
Aug
-10
Aug
-10
Sep-
10
Sep-
10
Sep-
10
Oct
-10
Oct
-10
Nov
-10
Nov
-10
Dec
-10
Dec
-10
Jan-
11
Jan-
11
Feb-
11
Feb-
11
Site 3

46
Figure 36. Hillview Reservoir Number of Positive E. coli at water sampling site 58 (4/1/2010
to 3/31/2011)
0
5
10
15
20
25
Ap
r-1
0
Ap
r-1
0
Ap
r-1
0
May
-10
May
-10
Jun
-10
Jun
-10
Jul-
10
Jul-
10
Au
g-1
0
Au
g-1
0
Sep
-10
Sep
-10
Sep
-10
Oct
-10
Oct
-10
No
v-1
0
No
v-1
0
Dec
-10
Dec
-10
Jan
-11
Jan
-11
Feb
-11
Feb
-11
Site 58
DEP attempted to trap and relocate the small flock of Ruddy Ducks in 2010/2011 using, nets,
running remote control motor boats, harassment, and attempted capture by boat largely without
success except for the capture and removal of one Ruddy Duck by net. Several Ruddy Ducks
once again perished at Hillview and appear to have starved to death. Some collected specimens
revealed wing and tail feather deformities which appeared to have developed among the resident
population. Since Ruddy Ducks are not typically found as breeding species in this region, it is
believed that the resident ducks with deformities perished due to dietary changes. DEP
continued to submit the Ruddy duck specimens to the New York State Department of
Environmental Conservation Wildlife Pathology Unit for stomach content analysis and cause of
death. To date, many of the specimens appear to have been affected by starvation and stomach
contents were generally empty. The Hillview basins are concrete and may not provide proper
nutrition of aquatic invertebrates for the ducks to survive. Additional actions employed by DEP
working in conjunction with assistance of DEC and USDA Wildlife Services included the
following:
September 2008 and February 2009 – Present: Use of remote control motor boat for
harassment
December 2008 – Present: Use of canoes, kayaks, and electric motored Jon-boats for
harassment
September 2009 – Present: Deployment of gill nets and use of electric motored Jon-boats
47
to attempt to capture ducks
April 2010 – Present: Experimental lethal shooting employed by the USDA Wildlife
Services
April 2010 – Present: Nighttime spotlighting using electric motored Jon-boats for
capturing ducks
July 2010 – Present: Bird wiring installed on reservoir shaft buildings intake openings to
preclude roosting and breeding swallow spp.
DEP will continue to assess the feasibility of trapping efforts using the nighttime spotlighting
technique as well as gill net deployment in the late summer when the ducks undergo a molt and
are temporarily rendered flightless. If live-trapping efforts are successful the small flock of
Ruddy Ducks will be relocated to a northern New York location that has been predetermined by
the DEC. Daily monitoring and bird harassment activities will continue by DEP contract to
supplement the new bird wire grid system which was completed in late 2007. DEP has also
developed an Intergovernmental Cooperative Agreement (contract) for services to lethally
remove the Ruddy Ducks with the USDA Wildlife Services which was implemented during the
spring of 2011.
48
CONCLUSION DEP’s Waterfowl Management Program is a key component to the City’s continuance of
Filtration Avoidance as outlined under the Final 2007 FAD document. The program has allowed
DEP to retain flexibility in choosing the highest quality water for distribution. The Waterfowl
Management Program has been in continuous operation since 1993 and continues to effectively
reduce waterbird populations and keep fecal coliform bacteria levels in compliance with the
Environmental Protection Agency’s Surface Water Drinking Rule (SWTR) of 1991 as part of the
Safe Drinking Water Act regulations.
It is well established that waterbird elevations and their spatial distributions relative to NYC
watershed reservoirs’ water intake facilities can affect fecal coliform bacteria levels in water
samples collected. It will remain important for DEP to continue indefinitely with year-around
monitoring and bird reduction measures where necessary.
The reduced waterbird and fecal coliform bacteria counts at Kensico Reservoir and other
reservoirs as covered under the “as needed” section can be attributed directly to the seasonal bird
the variety of bird dispersal and deterrence techniques. When dispersal tools (motorboats, Husky
Airboats, and pyrotechnics) are used together they result in the most effective means to bird
reduction over large open areas of drinking water. To date, it remains inconclusive whether a
tolerable number of waterbirds can be considered acceptable at Kensico or other reservoirs listed
at terminal reservoirs in the NYC water supply before water quality is compromised; therefore,
the objective of the Waterfowl Management Program will be to continue with the elimination of
all roosting birds during the bird migratory seasons for Kensico and Hillview Reservoirs and on
as “as needed” basis for reservoirs that are a direct source to Kensico. Operational changes in
the Delaware Aqueduct system occurred during the migratory/overwintering period for several
waterbird species resulting in the need to activate the “as needed” management program for West
Branch Reservoir during this reporting period. In anticipation of elevated fecal coliform bacteria
levels entering Kensico Reservoir from West Branch and as a preventive measure to comply with
the Surface Water Treatment Rule the bird management activities proved successful eliminating
birds and decreasing fecal coliform bacteria levels.
The establishment of bird-free zones (spatial distributions) around water intake structures at
reservoirs source to Kensico (i.e., Rondout and Ashokan Reservoirs), whether program-initiated
through harassment or by the natural process of the birds selecting roosting locations, continues
to be a key influence on lower fecal coliform bacteria levels. The spatial distributions of the
birds in relation to the flow dynamics of the reservoir appear to have the greatest influence in the
transport of bacteria to the water intakes. It is evident that when DEP properly manages its
waterbird populations, fecal coliform bacteria concentrations remain low and in compliance with
EPA regulations.
Bird deterrence measures which include waterbird reproductive management, shoreline fencing,
and meadow management continued to reduce local breeding opportunities around water intake
49
structures and eliminate fecundity during this reporting period. Future options for Canada Geese
and Mute Swan management should consider incorporation of measures to reduce local breeding
populations by means of “take” under federal permit. The “take” option, although not employed
by DEP or by the Westchester County Airport depredation order during this reporting period, is
expected to be used in the summer of 2011 and thereafter.
Additional bird deterrent equipment is proposed to be installed during the 2011/2012 reporting
period. These measures included bird netting to cover additional water intake chambers to the
reservoir influent and effluent facilities Hillview, and West Branch Reservoirs. At the Hillview
Reservoir, DEP continued to employ the use of pyrotechnics, physical chasing, remote-operated
propane cannons, Daddi-long-leg, bird deterrent wires and netting, and lethal control measures to
prevent ducks, gulls and other non-waterbird species from landing on the reservoir dividing wall.
Remote-operated propane cannons have improved bird deterrence during times of inclement
weather when contractor staff is not permitted on the reservoir dividing wall and pyrotechnics
are rendered ineffective from the reservoir shoreline.
Waterbird populations continue to demonstrate seasonal elevations primarily during the autumn
and winter periods in all reservoirs listed in this report. Climate alterations can affect behaviors
and migratory activity changes of “local” or resident birds such as Canada Geese. Gull
populations are migratory and utilize the New York City Reservoir system as a migratory stop-
over or wintering area until local conditions (i.e. ice and snow cover) become too intolerable.
Ice cover on the reservoirs and snow cover in the associated watershed or daily flight range for
food often determine whether they will continue in migration. If climate conditions become
warmer it could potentially develop an increased demand to use the “as needed” component for
bird management at a significant increase in cost.
Although NYC continues to remain in compliance with SWTR regulations, low seasonal
elevations of fecal coliform bacteria were recorded annually from late autumn through early
winter oftentimes associated with migratory waterbirds stopping over and wintering on the
reservoirs and/or precipitation events. Monitoring the effects that bird dispersal measures have
on each reservoir can be achieved through continued routine population surveys and expanding
research identifying bacteria origins. Survey results provide inferences about the potential effect
the bird’s fecal matter through the spatial and temporal aspects of the birds but also evaluate the
effectiveness of the dispersal measures. DEP will continue with the implementation of the
Waterfowl Management Program indefinitely to ensure the highest quality water by managing
waterbird populations.
50
REFERENCES
Alderisio, K.A. and N. DeLuca. 1999. Seasonal enumeration of fecal coliform bacteria from the feces of Ring-
billed Gulls (Larus delawarensis) and Canada geese (Branta canadensis), Applied and Environmental
Microbiology 65:5628-5630.
New York City Department of Environmental Protection (DEP). 1993. Kensico Watershed Study 1991-1993.
Division of Drinking Water Quality Control, Valhalla, NY.
New York City Department of Environmental Protection (DEP). 1994. Kensico Watershed Study Augmented
Annual Research Report, January 1993- March 1994. Division of Drinking Water Quality Control,
Valhalla, NY.
New York City Department of Environmental Protection (DEP). 1995. Kensico Watershed Study Annual Research
Report, April 1994-March 1995. Division of Drinking Water Quality Control, Valhalla, NY.
New York City Department of Environmental Protection (DEP). 1996. Kensico Watershed Study Annual Research
Report, April 1995-March 1996. Division of Drinking Water Quality Control, Valhalla, NY.
New York City Department of Environmental Protection (DEP). 1997. Kensico Watershed
Study Annual Research Report. April 1996-March 1997. Division of Drinking Water Quality Control,
Valhalla, NY.
New York City Department of Environmental Protection (DEP). 1997a. West Branch Drainage Basin Report, A
Preliminary Data Review for Planning. Division of Drinking Water Quality Control, Valhalla, NY.
New York City Department of Environmental Protection (DEP). 2002. Continue Implementation of Final
Waterfowl Management Plan. Division of Drinking Water Quality Control, Valhalla, NY.
New York City Department of Environmental Protection (DEP). 2003. Waterfowl Management Program. July 31,
2003. Division of Drinking Water Quality Control, Valhalla, NY
New York City Department of Environmental Protection (DEP). 2004. Waterfowl Management Program. July 31,
2004. Division of Drinking Water Quality Control, Valhalla, NY.
New York City Department of Environmental Protection (DEP). 2005. Waterfowl Management Program. July 31,
2005. Division of Drinking Water Quality Control, Valhalla, NY.
New York City Department of Environmental Protection (DEP). 2006. Waterfowl Management Program. July 31,
2006. Division of Drinking Water Quality Control, Valhalla, NY.
New York City Department of Environmental Protection (DEP). 2007. Waterfowl Management Program. July 31,
2007. Division of Drinking Water Quality Control, Valhalla, NY.
New York City Department of Environmental Protection (DEP). 2008. Waterfowl Management Program. July 31,
2008. Division of Drinking Water Quality Control, Valhalla, NY.
New York City Department of Environmental Protection (DEP). 2009. Waterfowl Management Program. July 31,
2009. Division of Drinking Water Quality Control, Valhalla, NY.

51
New York City Department of Environmental Protection (DEP). 2010. Waterfowl Management Program. July 31,
2010. Division of Drinking Water Quality Control, Valhalla, NY.
52
Appendix A. Reservoir Maps with Bird Zone Designations and Water
Sampling Locations
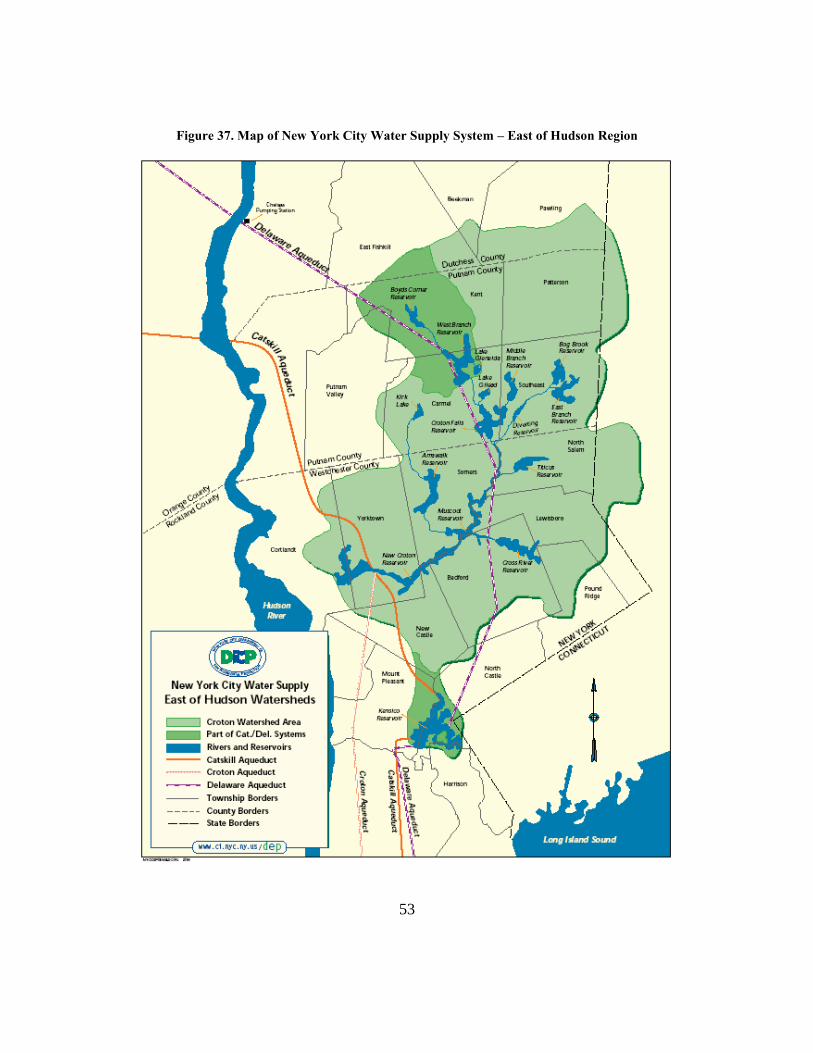
53
Figure 37. Map of New York City Water Supply System – East of Hudson Region
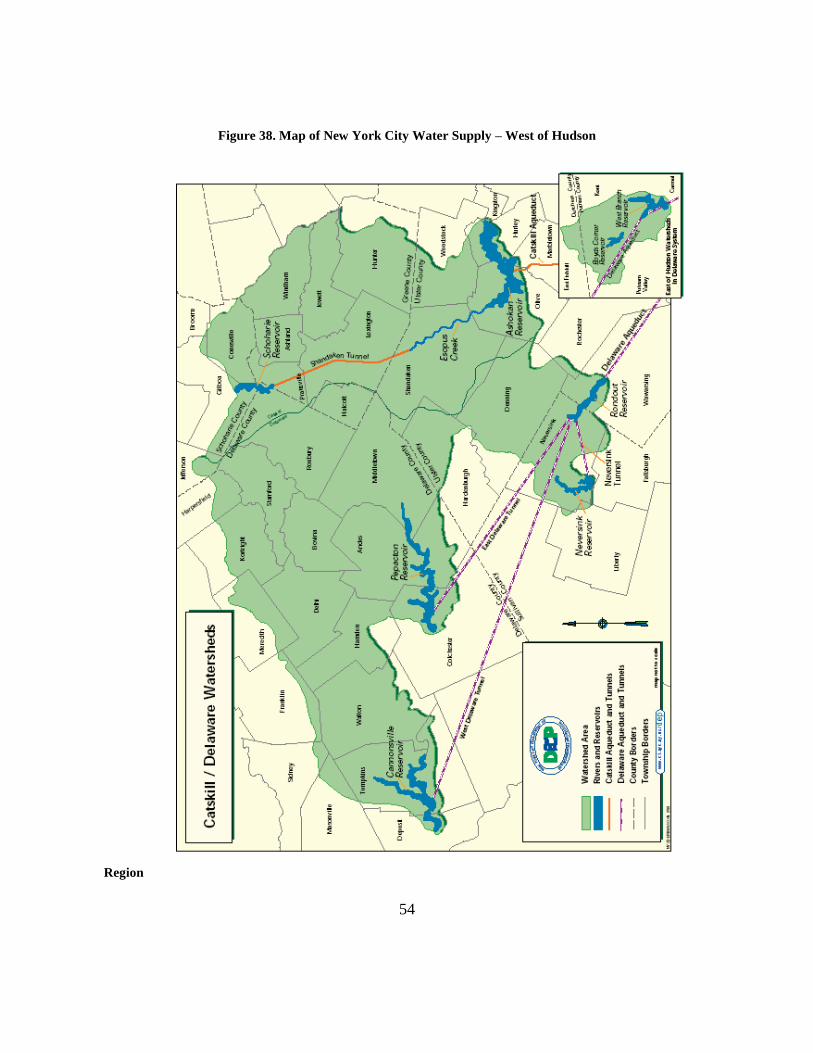
54
Figure 38. Map of New York City Water Supply – West of Hudson
Region
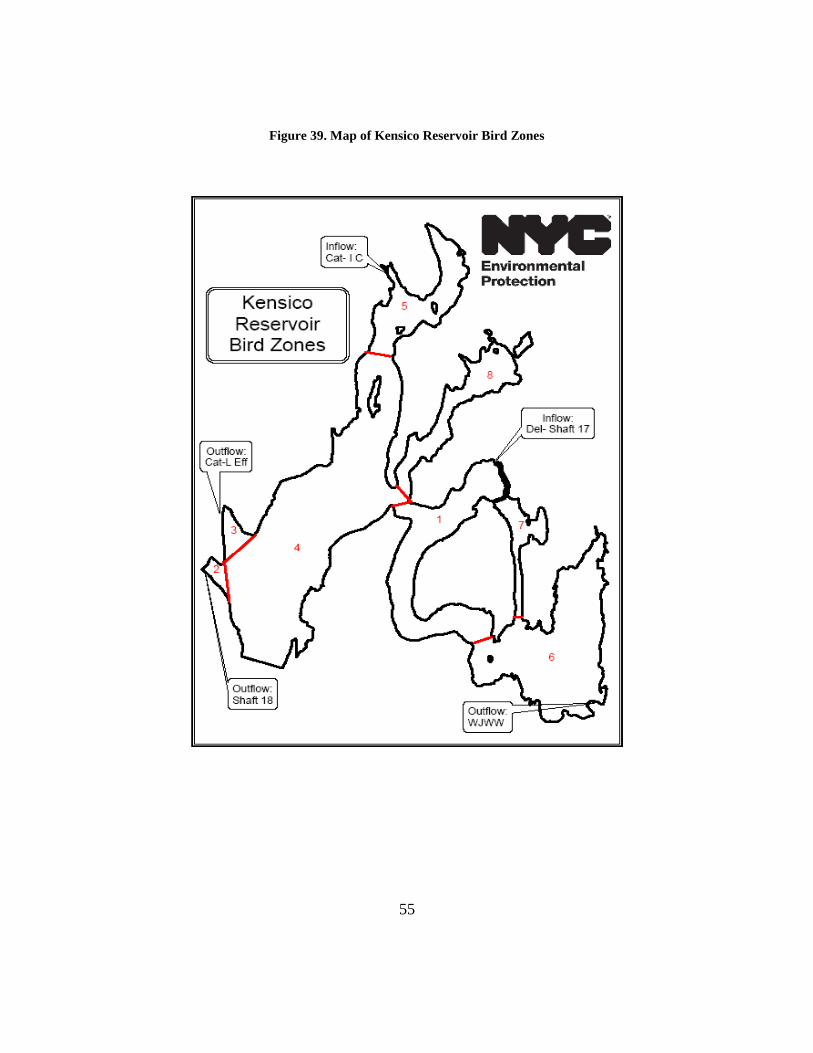
55
Figure 39. Map of Kensico Reservoir Bird Zones
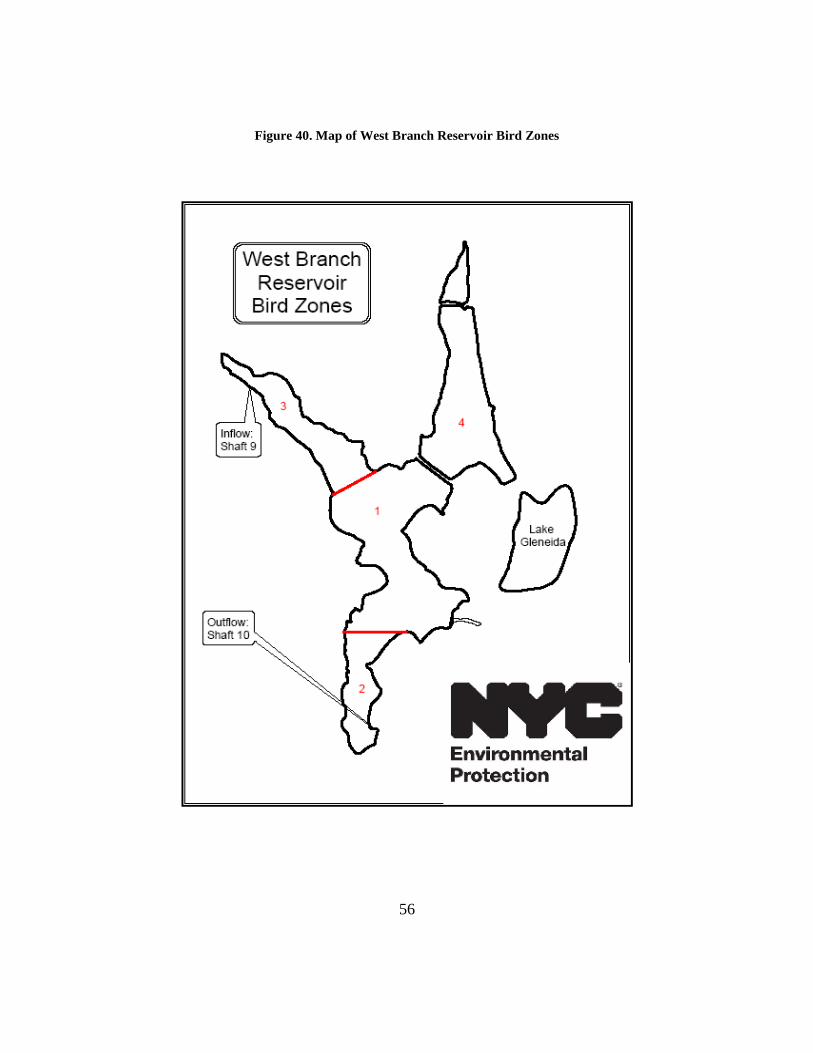
56
Figure 40. Map of West Branch Reservoir Bird Zones
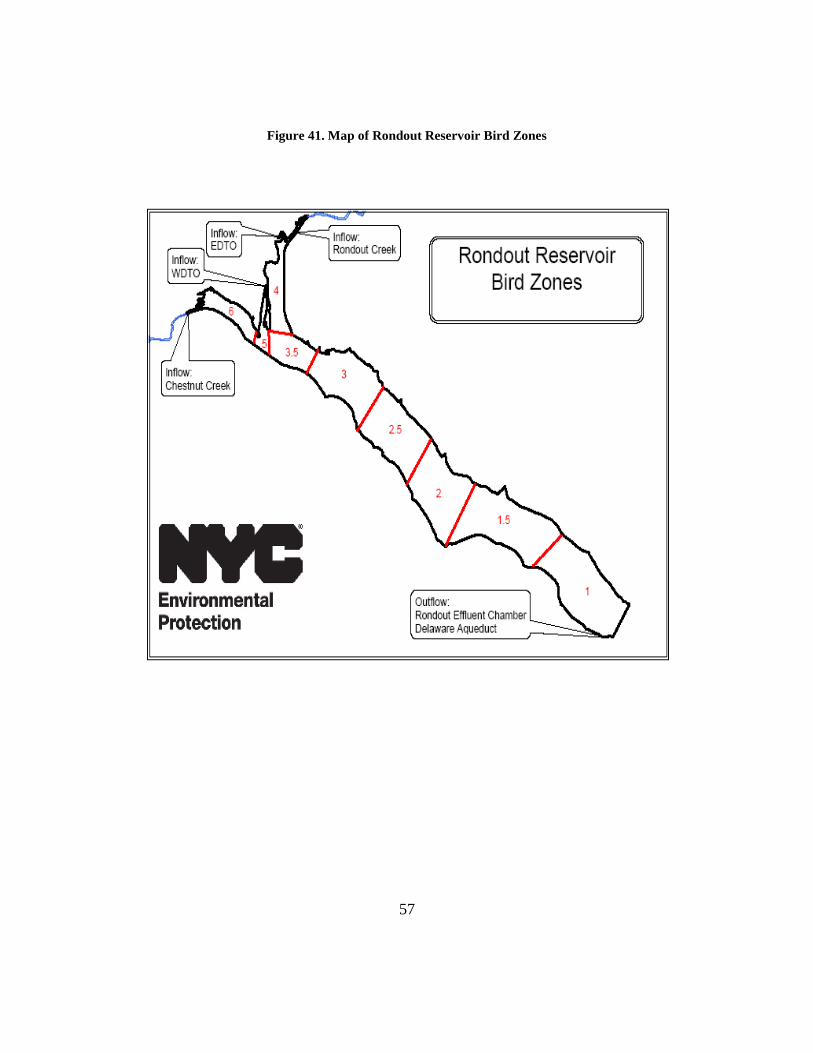
57
Figure 41. Map of Rondout Reservoir Bird Zones
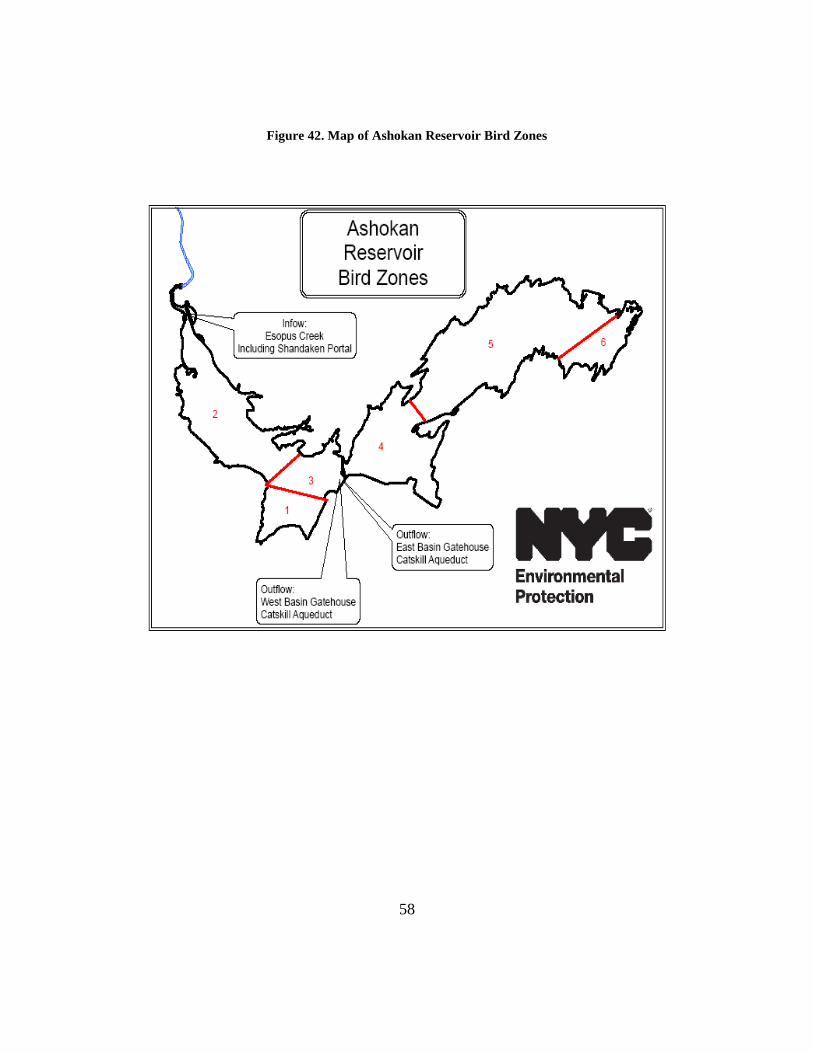
58
Figure 42. Map of Ashokan Reservoir Bird Zones
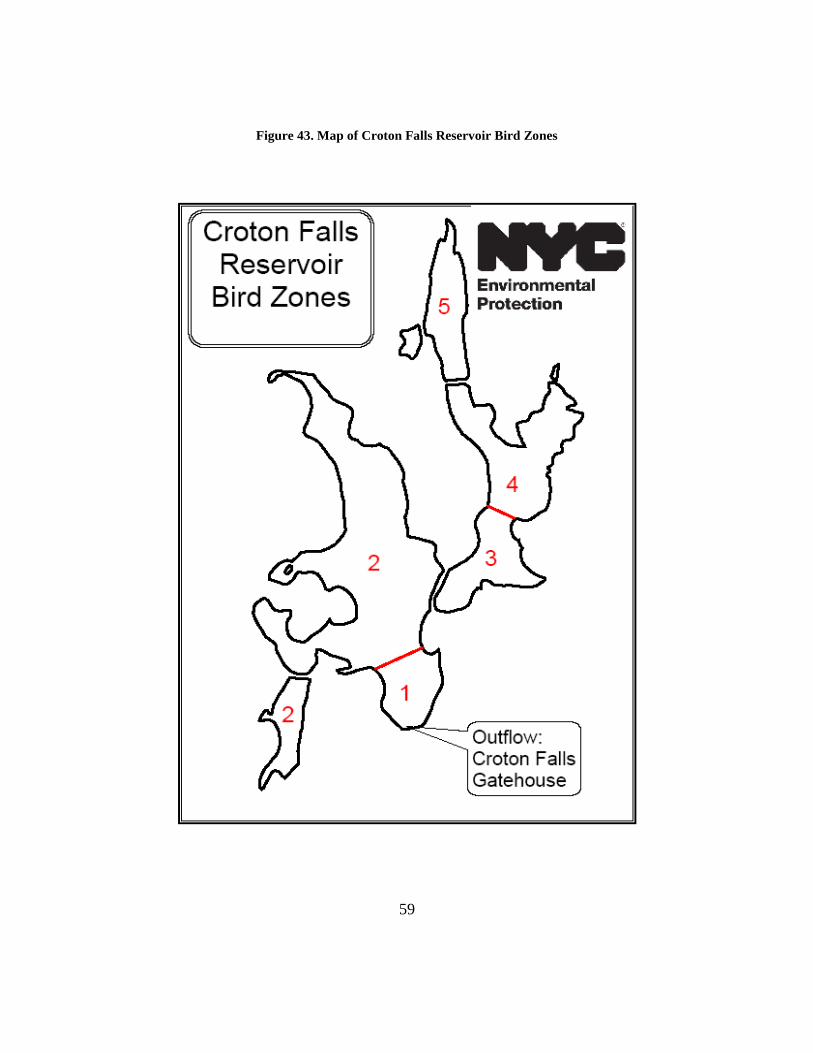
59
Figure 43. Map of Croton Falls Reservoir Bird Zones
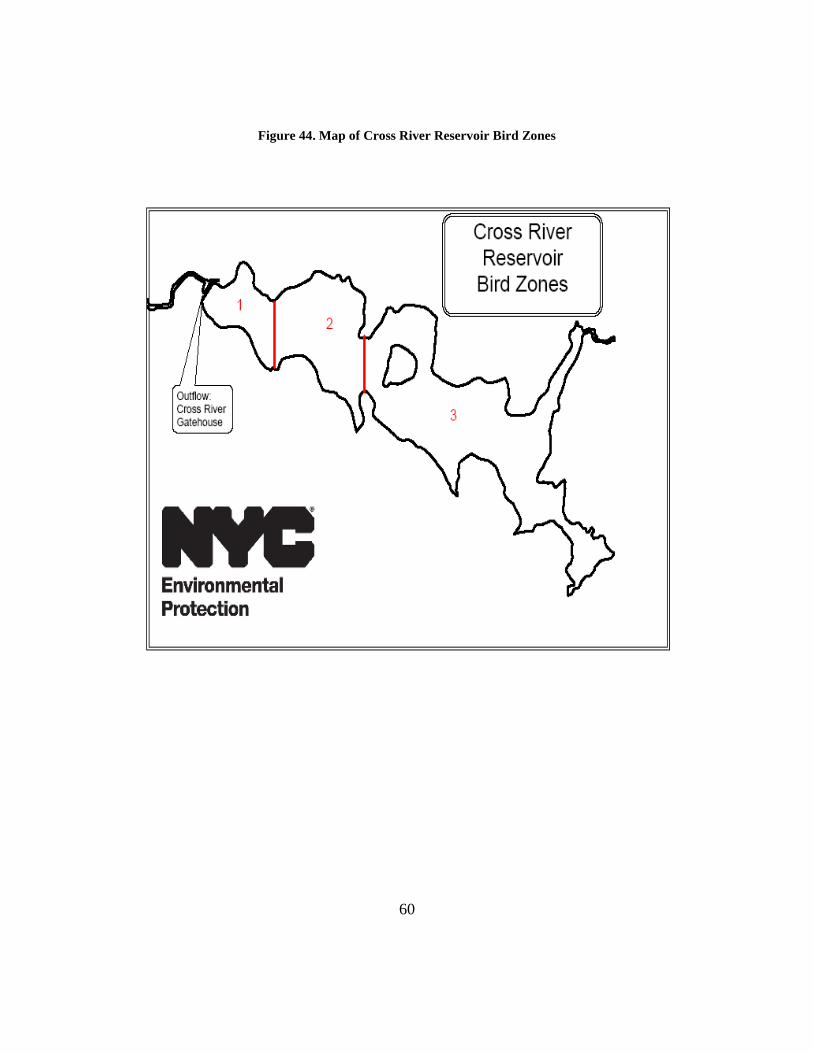
60
Figure 44. Map of Cross River Reservoir Bird Zones
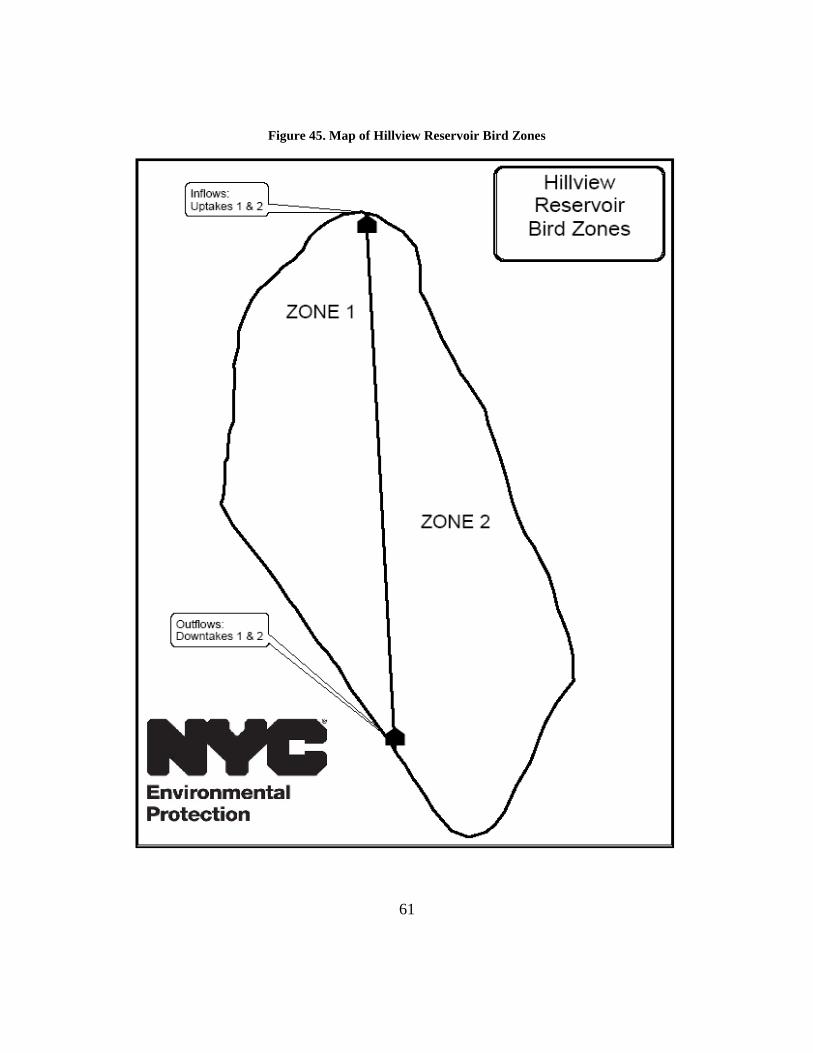
61
Figure 45. Map of Hillview Reservoir Bird Zones
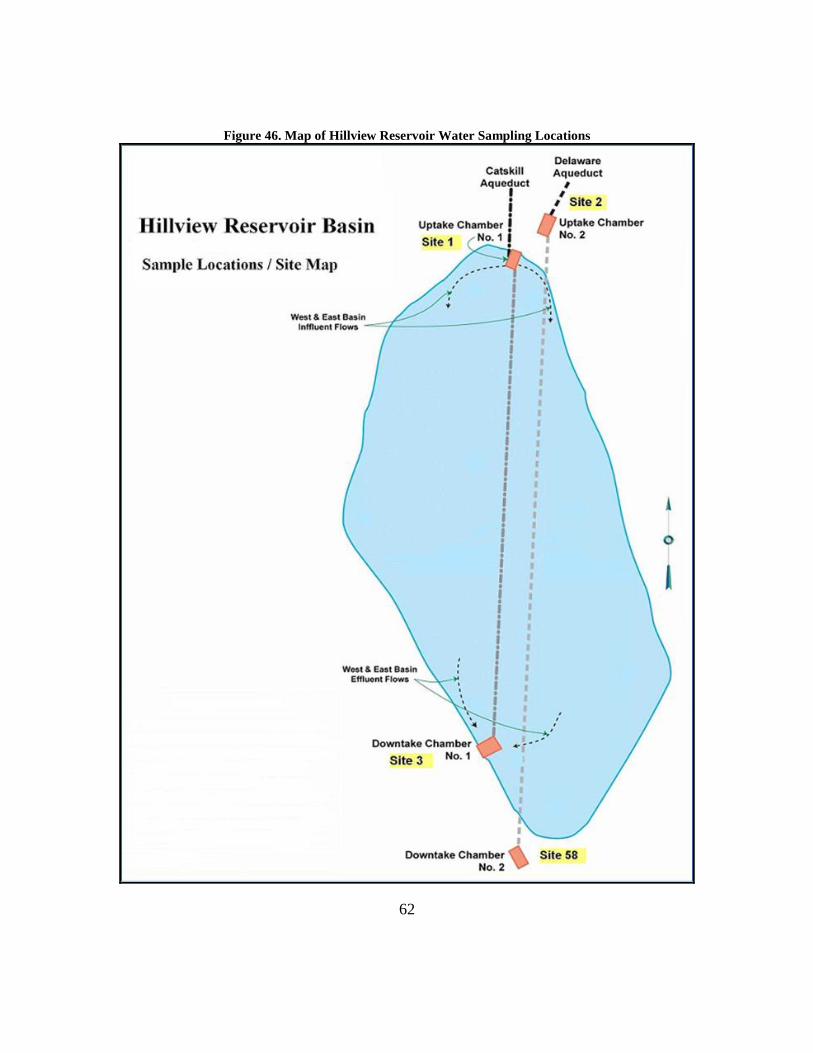
62
Figure 46. Map of Hillview Reservoir Water Sampling Locations