Embed Size (px)
Citation preview
Scott C. Evans
Chief Investment Officer
THE CITY OF NEW YORK
OFFICE OF THE COMPTROLLER BUREAU OF ASSET MANAGEMENT
1 CENTRE STREET ROOM 736 NEW YORK, N.Y. 10007-2341 ─────────────
SCOTT M. STRINGER COMPTROLLER
TELEPHONE: (212) 669-8318 FAX NUMBER: (212) 815-8503
WWW.COMPTROLLER.NYC.GOV
EMAIL: [email protected]
MEMORANDUM
TO: Trustees New York City Employees’ Retirement System
FROM: Scott C. Evans
DATE: July 21, 2015
RE: NYC Employees’ Retirement System Investment Meeting – July 28, 2015
Enclosed is a copy of the public agenda for the July 28, 2015 Investment Meeting. The meeting will be held at 335 Adams Street - Suite 2200, Brooklyn, N.Y., (beginning at 9:30am). If you have questions about any agenda item, please contact me at (212) 669-8318.
I:\Investment Strategy\Agendas\AGENDAS -NYCERS\07 - July 28, 2015\Memo (Public).doc

THE CITY OF NEW YORK
OFFICE OF THE COMPTROLLER 1 CENTRE STREET
NEW YORK, N.Y. 10007-2341 ─────────────
Scott M. Stringer COMPTROLLER
NEW YORK CITY EMPLOYEES’ RETIREMENT SYSTEM
INVESTMENT MEETING
JULY 28, 2015
LOCATION: 335 Adams Street, Suite 2200
Brooklyn, N.Y.
1

NEW YORK CITY EMPLOYEES’ RETIREMENT SYSTEM
INVESTMENT MEETING
JULY 28, 2015
PUBLIC AGENDA
Page
I. May Monthly Performance Review: (30 Minutes) 4
II. Diversity Initiative for Managers Update: (20 Minutes) ---
III. Trustee Education – Asset Allocation Review (Callan): (45 Minutes) 73
APPENDICES: • Basket Clause 119 • Liquidity Analysis 121
2

PUBLIC AGENDA
3

I. May Monthly Performance Review:
4
Monthly Performance ReviewMay 2015
Prepared for the New York City Employees’ Retirement System
7.28.2015
THE CITY OF NEW YORKOFFICE OF THE COMPTROLLER
5

TABLE OF CONTENTS
Economic Indicators –From BAM ... ..................................................................................................................................... 1
Market Indicators –From BAM ........................................................................................................................................... 14
Market Indicators for May & June ....................................................................................................................................... 27
Contribution to Returns ........................................................................................................................................................ 31
Asset Allocation and Adjusted Policy Weight Mixes ............................................................................................................ 32
Classification of Investments. ............................................................................................................................................... 34 NYCERS Market Values 2014-2015………………………………………………………………………………………………………………..37 NYCERS Market Values 2006-2015………………………………………………………………………………………………………………..38
Manager / Benchmark Comparison Report ......................................................................................................................... 39
Private Equity Fund Supplemental Details .......................................................................................................................... 59
Private Equity Cash Flow Tracker ....................................................................................................................................... 63
Real Estate Fund Supplemental Details ............................................................................................................................... 64
Real Estate Cash Flow Tracker ............................................................................................................................................ 65
6

1
7

2
US Capacity Utilization
8

3
Institute of Supply Management (Manufacturing Index)
9

4
US Weekly Unemployment Claims (First Time)
10

5
US Total Unemployment Rate (Seasonally Adjusted)
11
6
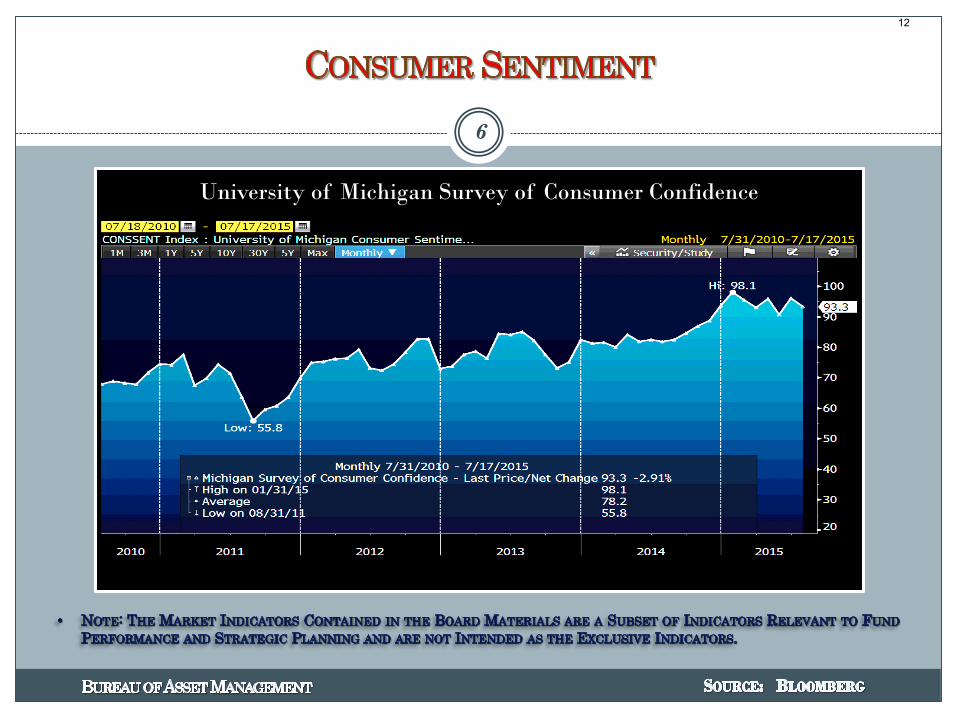
University of Michigan Survey of Consumer Confidence
12

7
US Architectural Billings Index
13

8
US Existing Home Index
14

9
New Privately Owned Housing Starts
15
10
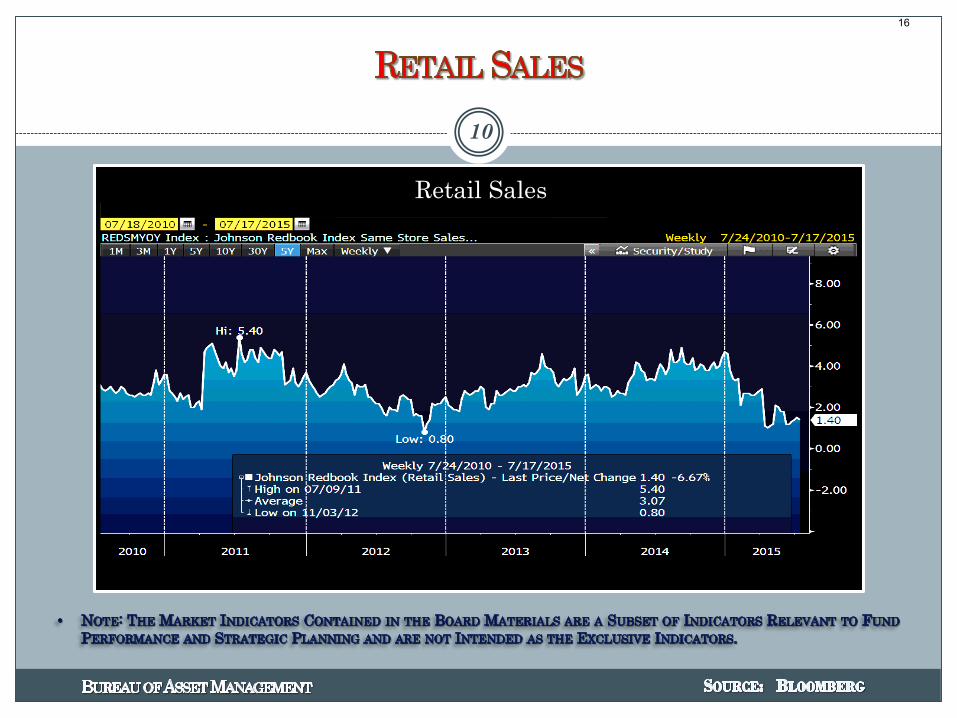
Retail Sales
16
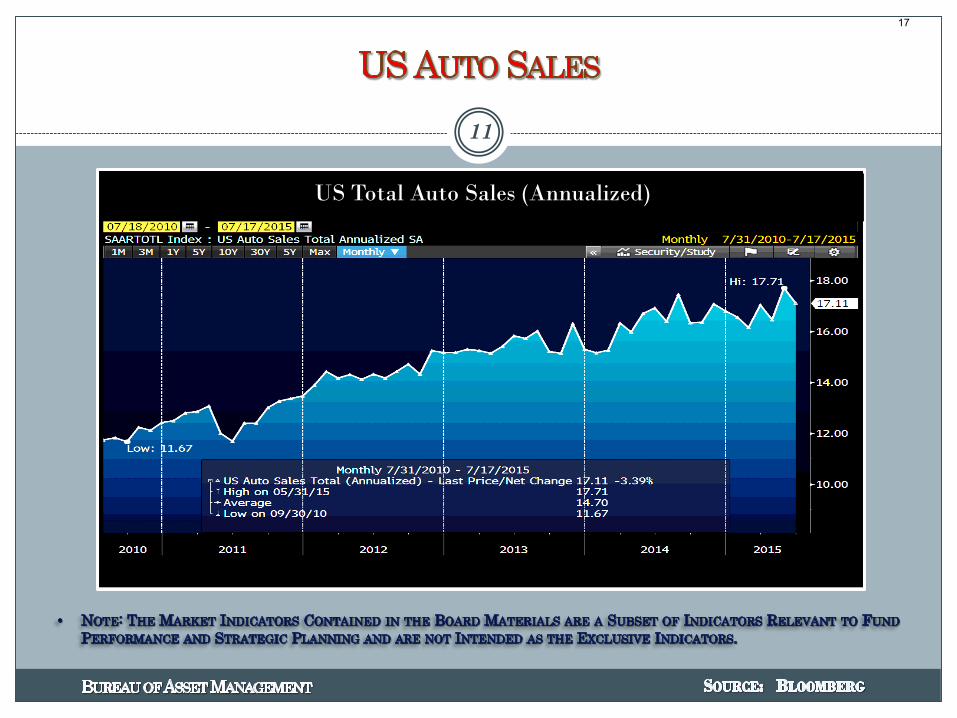
11
US Total Auto Sales (Annualized)
17
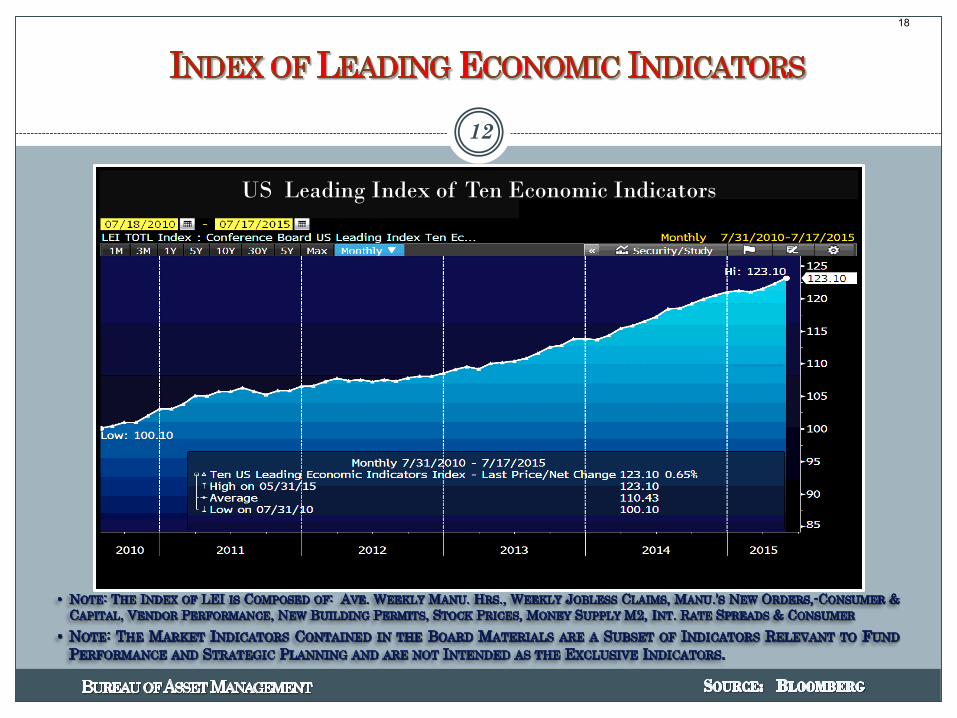
12
US Leading Index of Ten Economic Indicators
18
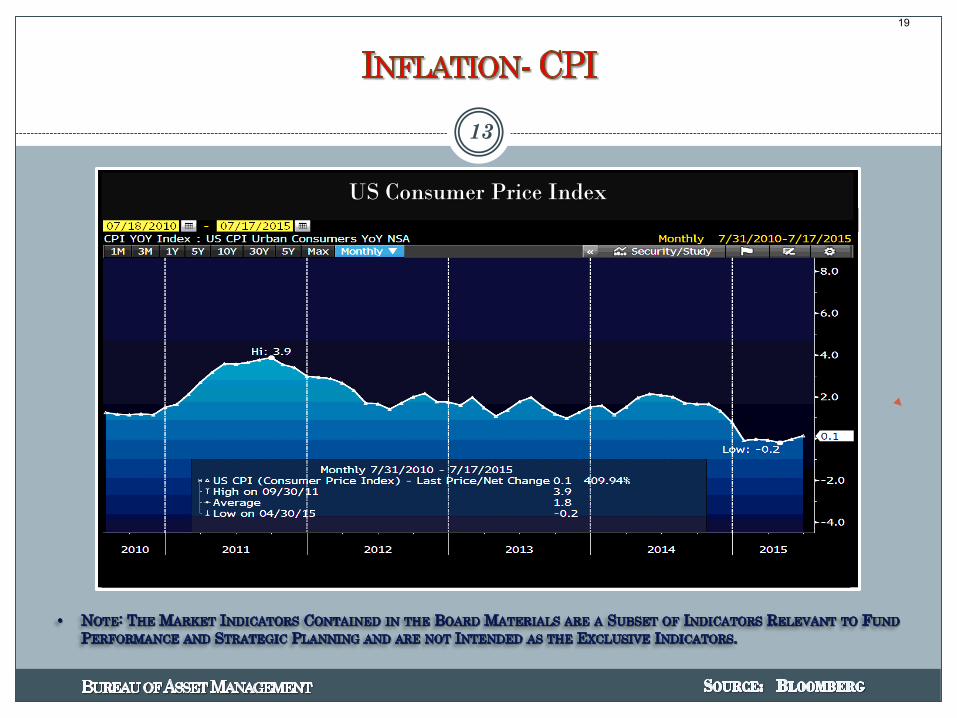
13
US Consumer Price Index
19

14
20

15
US Dollar Price Index
21

16
USD/Euro Exchange Rate
22

17
West Texas Intermediate (“WTI”) Crude Oil
23

18
The S & P 500 Volatility Index
24

19
US RECENT HISTORICAL YIELD CURVES (YIELD V. MATURITY)
25

20
US Ten Year Treasury Rates
26

.
21
27

22
CORPORATE EARNINGS
28

23
RUSSELL-3000 INDEX, MSCI EAFE AND MSCI EMERGING MARKETS
29

RUSSELL TOP 200 INDEX, S & P 400 MID-CAP AND R-2000 INDEX
24
30

25
)
31
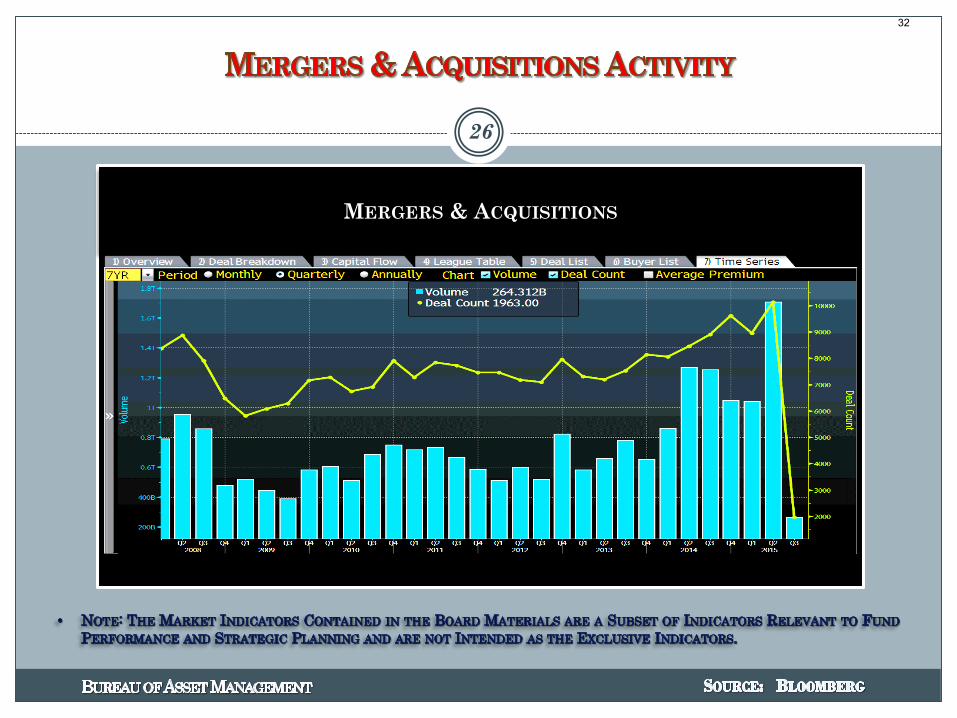
MERGERS & ACQUISITIONS
26
32

MARKET INDICATORS1 Month 3 Month Fiscal YTD 1 Year 2 Year 3 Year 5 Year 10 Year
S&P 500 1.29 0.64 9.54 11.81 16.05 19.67 16.54 8.12S&P 400 MIDCAP 1.78 1.58 7.82 12.28 15.13 19.87 16.55 10.14RUSSELL 1000 1.31 0.76 9.42 11.91 16.32 19.97 16.68 8.38RUSSELL 2000 2.28 1.41 5.69 11.32 14.02 19.45 15.04 8.73RUSSELL 3000 1.38 0.81 9.12 11.86 16.13 19.92 16.54 8.41RUSSELL 3000 GROWTH 1.58 0.88 12.40 14.95 18.29 19.89 17.64 9.33RUSSELL 3000 VALUE 1.17 0.72 5.80 8.71 13.92 19.84 15.39 7.37
MSCI EAFE NET (0.51) 1.98 (1.43) (0.48) 8.39 15.63 9.95 5.56MSCI EMF NET (4.00) 1.91 (2.59) (0.01) 2.11 5.96 4.08 8.76FTSE CUSTOM NYCERS (3.88) (2.10) (8.33) (5.84) (0.28) 4.23 3.76 8.92MSCI WORLD NET 0.34 1.09 3.84 5.70 12.09 17.09 12.84 6.72MSCI EUROPE SMID CAP NET 0.69 3.14 (0.98) (1.74) 13.07 20.73 13.51 7.76MSCI AC WORLD ex US NET (1.56) 1.74 (2.54) (0.90) 6.54 12.61 8.09 6.04
1 YEAR TREASURY BILL YIELD + 4% 0.35 1.09 3.95 4.31 4.30 4.30 4.40 5.94HFRI FUND OF FUNDS COMPOSITE + 1% 1.09 2.26 6.13 7.27 6.71 7.62 5.19 4.50
NYC - TREASURY AGENCY PLUS FIVE (0.60) (1.01) 6.40 6.19 3.77 1.55 5.78 5.71CITIGROUP MORTGAGE (0.06) 0.51 3.19 3.47 3.42 2.21 3.32 4.72NYC - INVESTMENT GRADE CREDIT (0.53) (0.62) 2.64 2.73 3.51 3.82 5.57 5.24NYC - CORE PLUS FIVE (0.37) (0.29) 3.53 3.64 3.53 2.70 4.66 5.22CITIGROUP BROAD INVESTMENT GRADE (0.26) (0.10) 2.98 3.03 2.89 2.21 3.87 4.70BARCLAYS AGGREGATE (0.24) (0.14) 2.98 3.03 2.87 2.21 3.90 4.61
CITY OF NEW YORKNYC Employees' Retirement System
Market Indicator ReportMay 31, 2015
*NCREIF NFI - ODCE NET index return calculated on a quarterly basis Prepared by State Street Investment Analytics
33

MARKET INDICATORS1 Month 3 Month Fiscal YTD 1 Year 2 Year 3 Year 5 Year 10 Year
CITIGROUP BB & B 0.47 1.16 1.76 2.50 4.87 7.59 8.97 6.81BofA ML HIGH YIELD MASTER II 0.30 0.96 0.99 1.84 4.85 8.07 9.03 8.12CSFB LEVERAGED LOAN 0.20 1.50 2.47 3.09 3.99 5.65 5.77 4.85
BARCLAYS GLOBAL US TIPS (0.82) (0.56) (0.77) (0.47) (0.04) (0.62) 3.79 4.28
BofA ML ALL CONVERTIBLES EX MANDATORY 2.22 2.82 5.75 8.71 13.63 16.60 12.69 8.67
DJ US SELECT REAL ESTATE (0.06) (4.17) 10.12 11.10 10.68 12.32 14.14 7.71NCREIF NFI - ODCE NET* 0.00 3.15 9.46 12.40 12.57 11.60 13.44 6.00CPI + 4% 0.77 1.78 3.52 5.21 5.5291 DAY TREASURY BILL 0.00 0.00 0.02 0.02 0.04 0.07 0.08 1.45
CITY OF NEW YORKNYC Employees' Retirement System
Market Indicator ReportMay 31, 2015
*NCREIF NFI - ODCE NET index return calculated on a quarterly basis Prepared by State Street Investment Analytics
34

MARKET INDICATORS1 Month 3 Month Fiscal YTD 1 Year 2 Year 3 Year 5 Year 10 Year
S&P 500 (1.94) 0.28 7.42 7.42 15.70 17.31 17.34 7.89S&P 400 MIDCAP (1.32) (1.06) 6.40 6.40 15.43 18.60 17.82 9.74RUSSELL 1000 (1.88) 0.11 7.37 7.37 16.01 17.73 17.58 8.13RUSSELL 2000 0.75 0.42 6.49 6.49 14.74 17.81 17.08 8.40RUSSELL 3000 (1.67) 0.14 7.29 7.29 15.91 17.73 17.54 8.15RUSSELL 3000 GROWTH (1.52) 0.27 10.69 10.69 18.45 18.15 18.64 9.17RUSSELL 3000 VALUE (1.83) 0.00 3.86 3.86 13.35 17.20 16.36 7.03
MSCI EAFE NET (2.83) 0.62 (4.22) (4.22) 8.79 11.97 9.54 5.12MSCI EMF NET (2.60) 0.69 (5.12) (5.12) 4.14 3.71 3.68 8.11FTSE CUSTOM NYCERS (1.32) (0.63) (9.54) (9.54) 2.31 2.53 3.60 8.45MSCI WORLD NET (2.33) 0.31 1.43 1.43 12.17 14.27 13.10 6.38MSCI EUROPE SMID CAP NET (2.02) 3.78 (2.98) (2.98) 14.25 17.63 13.16 7.34MSCI AC WORLD ex US NET (2.79) 0.53 (5.26) (5.26) 7.40 9.44 7.76 5.54
1 YEAR TREASURY BILL YIELD + 4% 0.36 1.12 4.32 4.32 4.32 4.32 4.38 5.93HFRI FUND OF FUNDS COMPOSITE + 1%
NYC - TREASURY AGENCY PLUS FIVE (2.13) (4.04) 4.13 4.13 3.96 1.05 4.65 5.37CITIGROUP MORTGAGE (0.82) (0.78) 2.35 2.35 3.46 1.90 2.89 4.60NYC - INVESTMENT GRADE CREDIT (1.56) (2.55) 1.04 1.04 4.06 3.10 4.85 4.98NYC - CORE PLUS FIVE (1.40) (2.21) 2.08 2.08 3.80 2.19 3.98 5.00CITIGROUP BROAD INVESTMENT GRADE (1.07) (1.66) 1.87 1.87 3.10 1.83 3.31 4.53BARCLAYS AGGREGATE (1.09) (1.68) 1.86 1.86 3.11 1.83 3.35 4.44
CITY OF NEW YORKNYC Employees' Retirement System
Market Indicator ReportJune 30, 2015
*NCREIF NFI - ODCE NET index return calculated on a quarterly basis Prepared by State Street Investment Analytics
35
MARKET INDICATORS1 Month 3 Month Fiscal YTD 1 Year 2 Year 3 Year 5 Year 10 Year
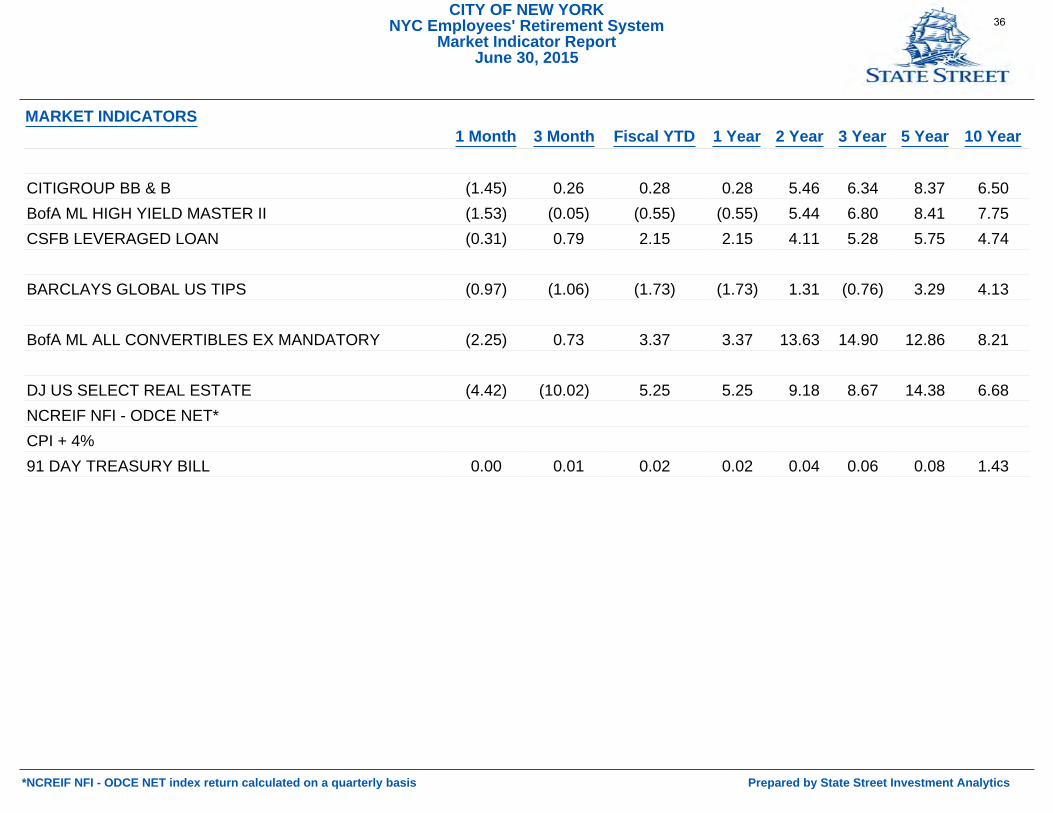
CITIGROUP BB & B (1.45) 0.26 0.28 0.28 5.46 6.34 8.37 6.50BofA ML HIGH YIELD MASTER II (1.53) (0.05) (0.55) (0.55) 5.44 6.80 8.41 7.75CSFB LEVERAGED LOAN (0.31) 0.79 2.15 2.15 4.11 5.28 5.75 4.74
BARCLAYS GLOBAL US TIPS (0.97) (1.06) (1.73) (1.73) 1.31 (0.76) 3.29 4.13
BofA ML ALL CONVERTIBLES EX MANDATORY (2.25) 0.73 3.37 3.37 13.63 14.90 12.86 8.21
DJ US SELECT REAL ESTATE (4.42) (10.02) 5.25 5.25 9.18 8.67 14.38 6.68NCREIF NFI - ODCE NET*CPI + 4%91 DAY TREASURY BILL 0.00 0.01 0.02 0.02 0.04 0.06 0.08 1.43
CITY OF NEW YORKNYC Employees' Retirement System
Market Indicator ReportJune 30, 2015
*NCREIF NFI - ODCE NET index return calculated on a quarterly basis Prepared by State Street Investment Analytics
36

NYC Employees' Retirement System Contribution to Return - May 2015
1 Month - Total Fund 3 Months - Total Fund FYTD - Total Fund FY Ending 6/30/14 Total FY Ending 6/30/13
Return: 0.36% Return: 1.09% Return: 4.62% Return: 17.03% Return: 12.24%
6/26/2015 1:22 PM
(0.14) (1.76)
(0.40) 0.06
0.22 0.69 0.62
0.52
0.20
0.41
0.82
1.26
0.74
0.03 0.03 0.04
0.57
0.61
(0.06)
(0.05)
0.57
1.19
0.04
0.21 (0.26)
(0.14)
(0.57)
1.16
(0.07)
0.27
2.56
1.71
0.44
0.24
2.80 10.34
8.26
DOMESTIC EQUITY
DEVELOPED EQUITY
EMERGING MARKETS
HEDGE FUNDS
CORE + 5
TIPS
ENHANCED YIELD
BANK LOANS
CONVERTIBLE BONDS
OPPORTUNISTIC FIXED
TARGETED
OTHER FIXED
PRIVATE EQUITY
REAL ASSETS
RESIDUAL0.02-HF (0.02)-TIPS 0.01-EY 0.00-BL 0.01-Conv 0.01-Opp FI (0.00)-ETI 0.00-Oth FI 0.00-Res
Prepared by State Street
(0.01)-TIPS 0.02-Conv 0.00-ETI 0.00-Oth FI (0.02)-Res
(0.01)-Devel Eq (0.02)-TIPS 0.05-EY 0.06-BL 0.06-Conv 0.05-Opp FI 0.04-ETI 0.01-Oth FI
0.24-HF 0.14-TIPS 0.13-BL 0.17-Conv 0.30-Opp FI 0.10-ETI 0.00-Oth FI
0.25-EM 0.19-HF 0.06-Core+5 (0.10)-TIPS 0.00-BL 0.18-Conv 0.17-Opp FI 0.04-ETI 0.01-Oth FI
Limited Access
37

$55.2B Under ManagementPortfolio Asset Allocation: May 31, 2015
Relative Mix to Adjusted New Policy Weights
Domestic Equity
Enhanced Yield
-0.1% 0.3%
-0.2%
0.0% 0.3% 0.0%
-3.9%
-1.3%
0.4% 0.0% 0.0% 0.0% 0.0%
3.2%
-8.00%-6.00%-4.00%-2.00%0.00%2.00%4.00%6.00%8.00%
TIPS Convertible Bonds
Note: Brackets represent rebalancing ranges versus policy.
Opportunistic FI ETICore + 5 CashBank Loans
Asset Allocation
Developed Markets Real AssetsEmerging Markets Private EquityHedge Funds
$18.533.5%
$5.810.4%
$1.83.2%
$9.717.5%
$2.74.8%
$1.01.8%
$4.07.3%
$3.76.7%
$0.61.0%
$1.32.4%
$0.61.2%
$1.73.1%
$2.13.8%
$1.83.2%
New York City Employees’ Retirement SystemPerformance Overview as of May 31, 2015Prepared by State Street
38
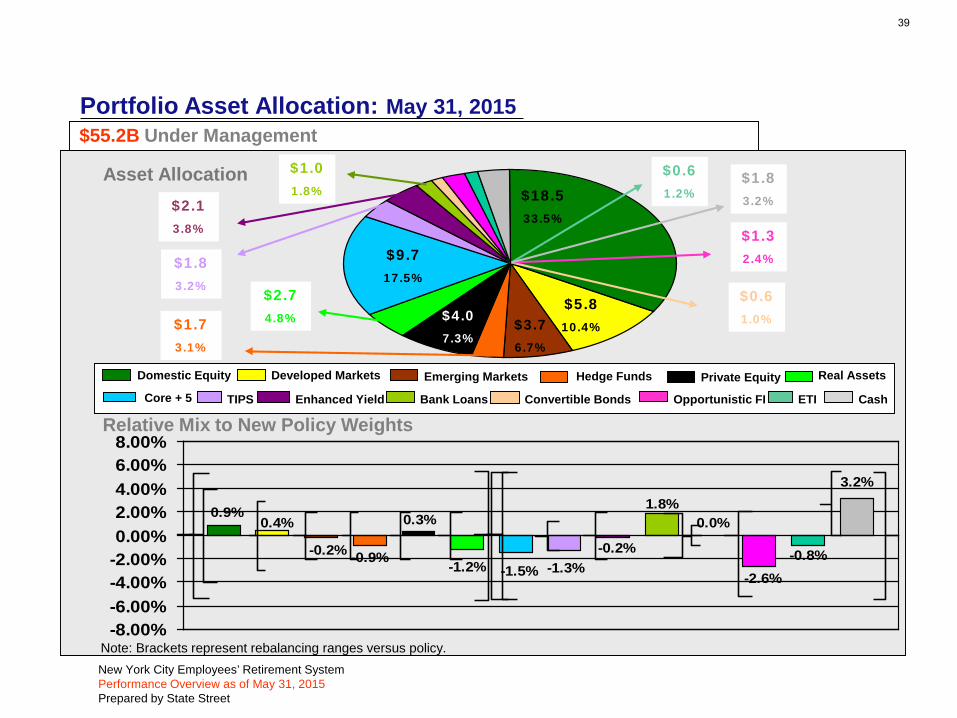
$55.2B Under ManagementPortfolio Asset Allocation: May 31, 2015
Asset Allocation
Relative Mix to New Policy Weights
Domestic Equity Developed Markets
Enhanced Yield
0.9%0.4%
-0.2% -0.9%
0.3%
-1.2% -1.5% -1.3%-0.2%
1.8%0.0%
-2.6%-0.8%
3.2%
-8.00%-6.00%-4.00%-2.00%0.00%2.00%4.00%6.00%8.00%
Real Assets
TIPS
Emerging Markets Private Equity
Convertible Bonds
Note: Brackets represent rebalancing ranges versus policy.
Opportunistic FI ETICore + 5 Cash
Hedge Funds
Bank Loans
$18.533.5%
$5.810.4%
$1.83.2%
$9.717.5%
$2.74.8%
$1.01.8%
$4.07.3%
$3.76.7%
$0.61.0%
$1.32.4%
$0.61.2%
$1.73.1%
$2.13.8%
$1.83.2%
New York City Employees’ Retirement SystemPerformance Overview as of May 31, 2015Prepared by State Street
39

NYC EMPLOYEES' RETIREMENT SYSTEMCLASSIFICATION OF INVESTMENTS
(as of May 31st, 2015)ASSET CLASS ALLOCATIONS
Actual Policy Target Adjustment Adjusted Policy
TOTAL EQUITIES $36,352.3 65.9% 66.5% NA 65.5% 60.5% - 70.5%TOTAL FIXED INCOME $18,807.6 34.1% 33.5% NA 34.5% 29.5% - 39.5%TOTAL ASSETS 100.0% 100.0% NA 100.0%
Actual Policy Target Adjustment Adjusted Policy
US Equities $18,470.0 33.5% 32.6% 0.9% 33.5% 29.5% - 37.5%Non-US Equities/EAFE $5,753.1 10.4% 10.0% 0.1% 10.1% 7.1% - 13.1%Emerging Markets $3,693.3 6.7% 6.9% NA 6.9% 4.9% - 8.9%TOTAL PUBLIC EQUITY 50.6% 49.5% NA 50.5%
HEDGE FUNDS 3.1% 4.0% NA 3.1% 2.0% - 6.0%* REAL ASSETS 4.8% 6.0% NA 4.8% 4.0% - 8.0%* PRIVATE EQUITY 7.3% 7.0% NA 7.0% 5.0% - 9.0%
TOTAL EQUITIES 65.9% 66.5% NA 65.5% 60.5% - 70.5%
Actual Policy Target Adjustment Adjusted Policy
US - Government $1,117.0 2.0% NAUS - Mortgage $3,508.2 6.4% NAUS - Investment Grade Credit $4,540.2 8.2% NATOTAL CORE + 5 17.5% 19.0% 2.3% 21.3% 16.3% - 26.3%
High Yield $2,100.7 3.8% NA 3.3% - 7.3%Bank Loans $1,007.9 1.8% NA 0.0% - 1.8%Total High Yield & Bank Loans 5.6% 4.0% 1.3% 5.3% 3.3% - 7.3%
TIPS $1,777.8 3.2% 4.5% NA 4.5% 3.0% - 6.0%Convertible Bonds $550.0 1.0% 1.0% NA 1.0% 0.0% - 2.0%**ETI $645.3 1.2% **2.0% NA ** 1.2%Cash $1,756.8 3.2% 0.0% NA 0.0% 0.0% - 5.0%TOTAL PUBLIC FIXED INCOME 31.7% 28.5% NA 32.1%* OPPORTUNISTIC FIXED INCOME 2.4% 5.0% NA 2.4% 0.0% - 7.0%
TOTAL FIXED INCOME 34.1% 33.5% NA 34.5% 29.5% - 39.5%*
**
***
Adjusted Target Range ***
In $MM
$17,495.3
$1,312.3
$18,807.6
ETIs have a policy of 2% of the total Fund. The ETI adjusted policy % is shown for illustrative purposes only and is not included in the sub-totals. The ETI policy % is included within the policy % of the other asset classes.
Adjusted Target Ranges are calculated as follows: Total Equities: +/-5%; Total Fixed Income: +/-5%; US Equities: +/-4%; Non-US Equities/EAFE: +/-3%; Emerging Markets: +/-2%; Hedge Funds: +/-2%; Real Assets: +/-2%; Private Equity: +/-2%; Core +5: +/-5%; TIPS: +/-1.5%; High Yield & Bank Loans: +/-2% (Bank Loans up to 1/3 of Adjusted Policy); Convertible Bonds: +/-1%; Cash: 0-5%; OFI: +2%/-5%.
19.0%
$1,733.1
$55,159.9
In $MM
$9,656.7
Adjusted Target Range ***
$27,916.3
$2,656.2
$4,046.7
$36,352.3
Ranges for illiquid asset classes represent minimums and maximums which will be monitored and will influence pacing analysis but will not necessarily result in purchases or sales.
Adjusted Target Range ***
Cor
e +5
21.3% 16.3% - 26.3%
** 1.2%
$3,108.7
4.0% 5.3%
In $MM
40

NYC EMPLOYEES' RETIREMENT SYSTEMCLASSIFICATION OF INVESTMENTS
(as of May 31st, 2015)
Adjustments to Long-Term Asset Allocation
1) Private Equity
2) Real Assets
3) Opportunistic Fixed Income
4) Hedge Funds
Impact of Adjustments
1) Core +5 Policy Target % 19.0%Adjustment: 50% of uninvested Opportunistic FI 1.3%Adjustment: 50% of uninvested Real Assets 0.6%Adjustment: 50% of uninvested Hedge Funds 0.4%Adjusted Core+5 Policy Target % 21.3%
2) High Yield Policy Target % 4.0%Adjustment: 50% of uninvested Opportunistic FI 1.3%Adjusted High Yield Policy Target % 5.3%
3) Domestic Equity Policy Target % 32.6%Adjustment: 50% of uninvested Real Assets 0.6%Adjustment: 76% of uninvested Private Equity 0.0%Adjustment: 38% of uninvested Hedge Funds 0.3%Adjusted Domestic Equity Policy Target % 33.5%
4) Non-U.S. Equity (Developed) Policy Target % 10.0%Adjustment: 24% of uninvested Private Equity 0.0%Adjustment: 12% of uninvested Hedge Funds 0.1%Adjusted Non-U.S. Equity (Developed) Policy Target % 10.1%
100% of uninvested commitments will be invested in Global Equity.
50% of uninvested commitments will be invested in Fixed Income Core +5 and 50% of uninvested commitments will be invested in High Yield.
50% of uninvested commitments will be invested in Fixed Income Core +5 and 50% of uninvested commitments will be invested in Global Equity.
50% of uninvested commitments will be invested in Fixed Income Core +5 and 50% of uninvested commitments will be invested in US Equity.
41

NYC EMPLOYEES' RETIREMENT SYSTEMCLASSIFICATION OF INVESTMENTS
(as of May 31st, 2015)
Note: Totals may not equal 100% due to rounding
US Equities66%
Non-US Equities/EAFE21%
Emerging Markets14%
Total Public Equities
US - Government6%
US - Mortgage19%
US - Investment Grade Credit
25%High Yield11%
Bank Loans6%
TIPS10%
Convertible Bonds3%
ETI4%
Cash10%
Opportunistic Fixed Income
7%
Total Fixed Income
42

$53,548
$52,848
$54,250
$52,725$53,303
$54,081
$53,293 $53,405
$54,917
$54,339$54,836
$55,160
$48,500
$49,500
$50,500
$51,500
$52,500
$53,500
$54,500
$55,500
NYCERS MARKET VALUESJUNE 2014 - MAY 2015
43

$36,650
$42,237
$38,862
$30,929
$34,598
$41,623
$41,621
$46,538
$53,548 $55,160
$28,500 $31,500 $34,500 $37,500 $40,500 $43,500 $46,500 $49,500 $52,500 $55,500
44

Limited Access 06/29/2015 09:49:01 AM
Assets($MM)
%of Total
Trailing1 Month
Trailing3 Month FYTD CYTD
FYE06/30/14
CYE12/31/14
CYE12/31/13
CYE12/31/12
CYE12/31/11
CYE12/31/10
Trailing1 Year
Trailing3 Year
Trailing5 Year
Trailing10 Year ITD
InceptionDate
ASSET CLASS SUMMARY
NYCERS-TOTAL DOM EQUITY 18,469.99 33.48 1.32 0.72 8.05 3.36 24.96 11.35 34.39 16.62 0.17 17.16 11.10 19.80 16.18 8.33 11.43 Aug-01-79
NYCERS-TOTAL DEVELOPED ENVIRON ACTIVIST 5,753.08 10.43 -0.63 2.52 -0.06 8.30 23.25 -4.09 22.56 17.47 -12.59 11.17 0.88 15.29 10.13 5.93 6.39 Apr-01-04
NYCERS-TOTAL EMERGING MARKETS 3,693.28 6.70 -3.67 -2.05 -8.24 0.65 17.34 0.22 -1.64 19.81 -18.76 26.33 -5.56 5.26 4.69 8.46 Sep-01-05
NYCERS-TOTAL HEDGE FUNDS 1,733.05 3.14 0.58 1.24 6.12 3.88 6.73 5.53 4.96 8.16 6.90 6.87 4.81 Jul-01-11
NYCERS-TOTAL CORE PLUS FIX INC 379.38 0.69 -0.04 0.15 3.15 1.58 5.12 5.84 -1.54 6.23 8.11 7.47 3.51 3.07 4.84 5.91 May-01-09
NYCERS-TOTAL STRUCTURED 9,165.39 16.62 -0.33 -0.29 3.32 1.21 6.61 7.69 -1.73 6.92 8.85 9.42 3.54 3.45 5.32 5.66 8.21 Jan-01-85
NYCERS-TOTAL CONVERTIBLE BONDS 550.01 1.00 1.50 1.97 5.59 4.54 16.30 8.42 16.33 11.66 -3.02 14.54 7.00 12.58 9.98 7.11 Jun-01-08
NYCERS-TOTAL TIPS MANAGERS 1,777.84 3.22 -0.73 -0.48 -0.61 1.63 4.57 3.50 -8.42 7.25 13.50 6.47 -0.30 -0.42 3.92 4.46 4.46 Jun-01-05
NYCERS-TOTAL ENHANCED YIELD 2,100.73 3.81 0.38 1.09 1.34 4.54 12.88 2.94 8.31 14.56 5.73 14.24 2.39 8.55 9.41 8.08 8.24 Oct-01-94
NYCERS-TOTAL BANK LOANS 1,007.94 1.83 0.24 1.67 3.54 3.44 6.38 2.58 6.41 4.13 5.15 Dec-01-12
NYCERS-TOTAL OPPORTUNISTIC FIXED 1,312.27 2.38 0.40 1.15 2.09 1.17 14.77 8.15 17.55 20.49 -4.40 26.01 3.30 11.06 11.31 8.73 Oct-01-07
NYCERS-TOTAL PROGRESS FIXED 111.92 0.20 -0.41 -0.30 2.76 1.08 4.92 6.18 -1.76 5.51 8.39 7.43 2.76 2.56 4.47 5.41 6.23 Jan-01-92
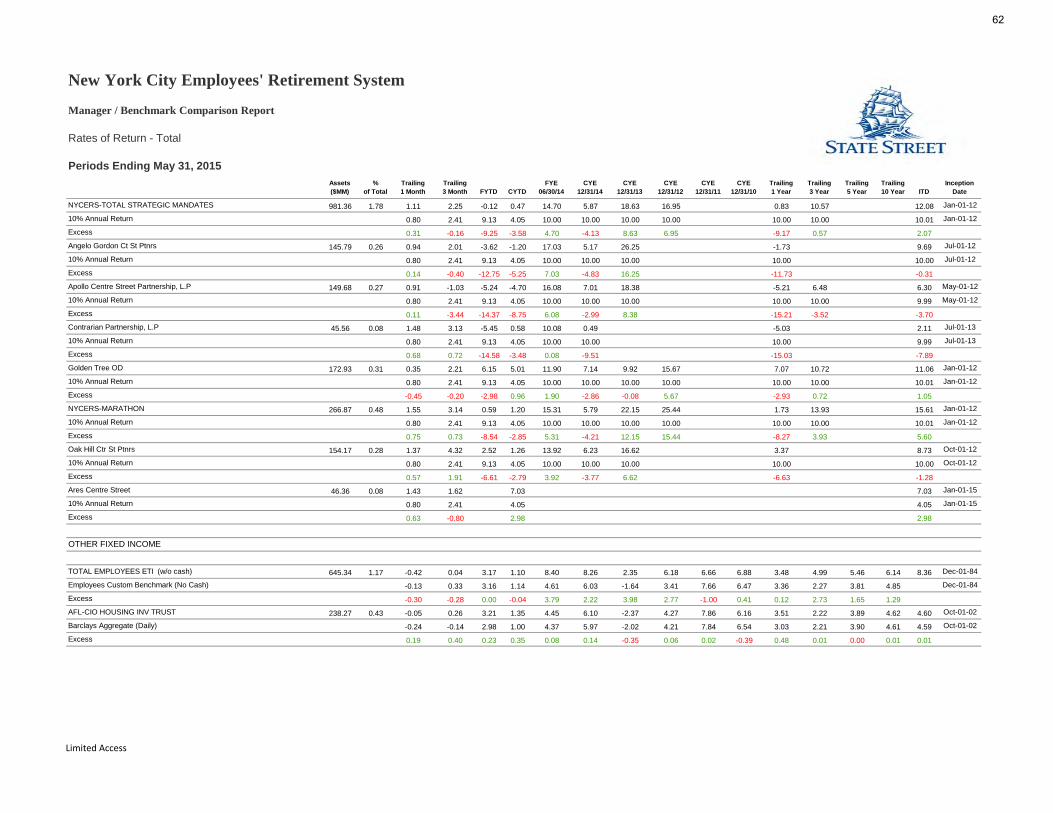
TOTAL EMPLOYEES ETI (w/o cash) 645.34 1.17 -0.42 0.04 3.17 1.10 8.40 8.26 2.35 6.18 6.66 6.88 3.48 4.99 5.46 6.14 8.36 Dec-01-84
NYCERS-TOTAL REAL ASSETS 2,656.20 4.82 1.24 4.77 15.10 7.79 13.24 15.48 12.61 14.43 22.28 8.46 16.05 14.26 17.02 8.89 8.89 Apr-01-04
NYCERS-TOTAL PRIVATE EQUITY 4,046.75 7.34 2.79 5.66 10.97 6.14 15.21 13.99 8.08 12.74 13.78 14.02 12.52 11.99 12.33 9.91 12.08 Apr-01-04
NYCERS-TOTAL CASH 1,757.95 3.19 0.06 0.16 0.44 0.23 0.22 0.34 0.43 0.90 0.89 0.48 0.46 0.41 0.54 2.08 2.16 Apr-01-04
SECURITY LENDING -1.16 0.00 Apr-01-04
NYCERS-TOTAL EMPLOYEES 55,159.95 100.00 0.36 1.09 4.62 3.57 17.03 7.34 15.73 13.41 1.13 13.79 6.33 12.11 10.90 7.15 8.93 Jul-01-87
NYCERS-TOTAL EQUITY 27,916.35 50.61 0.23 0.71 4.12 3.98 23.73 6.57 27.40 16.98 -4.35 16.31 6.70 17.03 13.49 7.55 8.87 Aug-01-93
NYCERS-TOTAL FIXED INCOME (MINUS SS) 17,050.83 30.91 -0.14 0.16 2.67 1.88 8.09 6.41 1.29 8.95 7.75 10.68 3.14 4.81 6.42 6.26 6.05 Apr-01-04
NYCERS-TOTAL HEDGE FUNDS 1,733.05 3.14 0.58 1.24 6.12 3.88 6.73 5.53 4.96 8.16 6.90 6.87 4.81 Jul-01-11
NYCERS-TOTAL PRIVATE EQUITY 4,046.75 7.34 2.79 5.66 10.97 6.14 15.21 13.99 8.08 12.74 13.78 14.02 12.52 11.99 12.33 9.91 12.08 Apr-01-04
NYCERS-TOTAL REAL ASSETS 2,656.20 4.82 1.24 4.77 15.10 7.79 13.24 15.48 12.61 14.43 22.28 8.46 16.05 14.26 17.02 8.89 8.89 Apr-01-04
NYCERS-TOTAL CASH 1,757.95 3.19 0.06 0.16 0.44 0.23 0.22 0.34 0.43 0.90 0.89 0.48 0.46 0.41 0.54 2.08 2.16 Apr-01-04
SECURITY LENDING -1.16 0.00 Apr-01-04
NYCERS-TOTAL EMPLOYEES 55,159.95 100.00 0.36 1.09 4.62 3.57 17.03 7.34 15.73 13.41 1.13 13.79 6.33 12.11 10.90 7.15 8.93 Jul-01-87
Employees Policy Benchmark 0.53 0.87 5.23 3.76 16.72 8.15 15.33 13.39 2.14 13.84 6.74 12.39 11.49 7.35 Jun-01-94
Periods Ending May 31, 2015
New York City Employees' Retirement System
Manager / Benchmark Comparison Report
Rates of Return - Total
45

Limited Access
Assets ($MM)
% of Total
Trailing1 Month
Trailing3 Month FYTD CYTD
FYE06/30/14
CYE12/31/14
CYE12/31/13
CYE12/31/12
CYE12/31/11
CYE12/31/10
Trailing1 Year
Trailing3 Year
Trailing5 Year
Trailing10 Year ITD
InceptionDate
EQUITY ASSET CLASS SUMMARY
NYCERS-TOTAL DOM EQUITY 18,469.99 33.48 1.32 0.72 8.05 3.36 24.96 11.35 34.39 16.62 0.17 17.16 11.10 19.80 16.18 8.33 11.43 Aug-01-79
RUSSELL 3000 (DAILY) 1.38 0.81 9.12 3.68 25.22 12.56 33.55 16.42 1.03 16.93 11.86 19.92 16.54 8.41 11.78 Aug-01-79
Excess -0.06 -0.09 -1.07 -0.32 -0.26 -1.21 0.84 0.21 -0.85 0.23 -0.76 -0.12 -0.37 -0.08 -0.35
NYCERS-TOTAL PASSIVE DOMESTIC EQUITY 13,448.75 24.38 1.40 0.90 9.15 3.82 24.96 12.55 33.18 16.51 0.52 16.58 12.02 19.90 16.41 8.29 11.33 Dec-01-84
RUSSELL 3000 (DAILY) 1.38 0.81 9.12 3.68 25.22 12.56 33.55 16.42 1.03 16.93 11.86 19.92 16.54 8.41 11.33 Dec-01-84
Excess 0.02 0.09 0.03 0.14 -0.26 -0.01 -0.38 0.09 -0.51 -0.35 0.17 -0.03 -0.14 -0.12 0.00
NYCERS-TOTAL RUSSELL 3000 PASSIVE 1,696.13 3.07 1.36 0.80 9.42 3.65 25.29 12.89 33.63 16.34 1.05 17.22 12.13 20.03 16.66 8.46 10.18 Feb-01-90
RUSSELL 3000 (DAILY) 1.38 0.81 9.12 3.68 25.22 12.56 33.55 16.42 1.03 16.93 11.86 19.92 16.54 8.41 10.14 Feb-01-90
Excess -0.02 0.00 0.30 -0.02 0.07 0.33 0.08 -0.08 0.02 0.29 0.28 0.11 0.12 0.05 0.05
NYCERS-TOTAL SMALL CAP PASSIVE 288.03 0.52 3.09 1.98 8.71 5.80 23.39 5.57 38.84 16.41 14.75 20.38 12.00 Apr-01-11
RUSSELL 2000 (DAILY) 2.28 1.41 5.69 3.98 23.64 4.89 38.82 16.35 11.32 19.45 11.33 Apr-01-11
Excess 0.80 0.57 3.01 1.83 -0.25 0.68 0.02 0.06 3.44 0.93 0.67
NYCERS-TOTAL MID CAP PASSIVE 1,826.38 3.31 1.74 1.67 8.07 5.56 24.97 9.98 33.13 17.81 12.53 19.79 13.88 Feb-01-11
S&P 400 MIDCAP INDEX (DAILY) 1.78 1.58 7.82 5.59 25.24 9.77 33.50 17.88 12.28 19.87 13.91 Feb-01-11
Excess -0.04 0.08 0.25 -0.03 -0.27 0.21 -0.37 -0.07 0.25 -0.07 -0.03
NYCERS-TOTAL RUSSELL 1000 PASSIVE 5,419.02 9.82 1.30 0.73 9.26 3.51 13.20 11.76 16.56 Oct-01-13
RUSSELL 1000 (DAILY) 1.31 0.76 9.42 3.65 13.24 11.91 16.72 Oct-01-13
Excess 0.00 -0.03 -0.16 -0.14 -0.04 -0.15 -0.16
NYCERS-TOTAL S&P 500 PASSIVE 4,219.18 7.65 1.28 0.66 9.52 3.19 24.60 13.62 32.49 15.99 1.74 14.90 11.81 19.71 16.41 8.04 4.41 Jul-01-00
S&P 500 INDEX (DAILY) 1.29 0.64 9.54 3.23 24.61 13.69 32.39 16.00 2.11 15.06 11.81 19.67 16.54 8.12 4.52 Jul-01-00
Excess -0.01 0.02 -0.03 -0.04 -0.01 -0.07 0.10 -0.02 -0.37 -0.16 0.00 0.03 -0.13 -0.08 -0.11
NYCERS-TOTAL ACTIVE DOM EQUITY 4,678.85 8.48 1.11 0.26 5.60 2.20 25.60 8.90 38.54 17.12 -1.73 19.89 8.97 20.15 15.84 8.71 10.71 Dec-01-84
RUSSELL 3000 (DAILY) 1.38 0.81 9.12 3.68 25.22 12.56 33.55 16.42 1.03 16.93 11.86 19.92 16.54 8.41 11.33 Dec-01-84
Excess -0.27 -0.54 -3.52 -1.47 0.38 -3.65 4.98 0.71 -2.76 2.96 -2.89 0.22 -0.71 0.30 -0.62
NYCERS-TOTAL SMALL CAP ACTIVE 1,669.01 3.03 0.96 0.05 2.80 1.21 24.69 4.17 42.73 18.75 -6.63 29.84 7.70 20.10 14.87 8.49 8.42 Apr-01-04
RUSSELL 2000 (DAILY) 2.28 1.41 5.69 3.98 23.64 4.89 38.82 16.35 -4.18 26.85 11.32 19.45 15.04 8.73 8.34 Apr-01-04
Excess -1.32 -1.36 -2.89 -2.76 1.05 -0.73 3.90 2.41 -2.46 2.99 -3.62 0.66 -0.17 -0.24 0.08
Periods Ending May 31, 2015
New York City Employees' Retirement System
Manager / Benchmark Comparison Report
Rates of Return - Total
46

Limited Access
Assets ($MM)
% of Total
Trailing1 Month
Trailing3 Month FYTD CYTD
FYE06/30/14
CYE12/31/14
CYE12/31/13
CYE12/31/12
CYE12/31/11
CYE12/31/10
Trailing1 Year
Trailing3 Year
Trailing5 Year
Trailing10 Year ITD
InceptionDate
Periods Ending May 31, 2015
New York City Employees' Retirement System
Manager / Benchmark Comparison Report
Rates of Return - Total
NYCERS-TOTAL RUSSELL 1000 ACTIVE 1,913.53 3.47 1.08 0.35 7.37 2.35 25.74 12.65 36.04 16.76 0.66 16.74 9.88 20.68 16.48 10.95 Jul-01-08
RUSSELL 1000 (DAILY) 1.31 0.76 9.42 3.65 25.35 13.24 33.11 16.42 1.50 16.10 11.91 19.97 16.68 10.01 Jul-01-08
Excess -0.22 -0.40 -2.05 -1.30 0.38 -0.59 2.93 0.33 -0.84 0.64 -2.03 0.71 -0.19 0.94
NYCERS-TOTAL EMERGING MANAGER- EQUITY 1,096.19 1.99 1.39 0.64 5.80 3.25 26.70 8.19 37.19 16.17 -0.20 17.79 8.63 19.23 16.02 8.59 9.15 Jul-01-93
RUSSELL 3000 (DAILY) 1.38 0.81 9.12 3.68 25.22 12.56 33.55 16.42 1.03 16.93 11.86 19.92 16.54 8.41 9.51 Jul-01-93
Excess 0.00 -0.17 -3.32 -0.43 1.48 -4.37 3.63 -0.25 -1.23 0.86 -3.23 -0.69 -0.52 0.18 -0.36
Large Cap Transition 0.12 0.00 Jan-01-11
Walden Asset Management (ENVRN) 342.40 0.62 0.95 -0.18 2.72 2.23 18.10 0.11 32.89 13.51 1.17 26.98 8.73 14.49 13.55 9.31 May-01-08
RUSSELL 2000 (DAILY) 2.28 1.41 5.69 3.98 23.64 4.89 38.82 16.35 -4.18 26.85 11.32 19.45 15.04 9.65 May-01-08
Excess -1.33 -1.59 -2.97 -1.75 -5.54 -4.79 -5.93 -2.84 5.34 0.13 -2.59 -4.95 -1.49 -0.34
NYCERS-TOTAL INTL EQUITY 9,446.36 17.13 -1.84 0.70 -3.38 5.23 20.94 -2.50 12.45 18.06 -14.05 14.04 -1.74 11.22 7.95 5.94 6.59 Sep-01-90
MSCI AC WORLD ex US (NET) -1.56 1.74 -2.54 7.02 21.75 -3.87 15.29 16.83 -13.71 11.15 -0.90 12.61 8.09 6.04 Sep-01-90
Excess -0.28 -1.04 -0.84 -1.80 -0.81 1.36 -2.84 1.23 -0.34 2.89 -0.84 -1.39 -0.14 -0.09
NYCERS-TOTAL PASSIVE DEVELOPED EQUITY 866.41 1.57 0.00 3.03 -0.90 9.78 23.13 -5.80 23.02 17.60 -12.50 8.18 0.31 15.72 9.95 5.83 5.77 Sep-01-90
MSCI EAFE -0.51 1.98 -1.43 8.60 23.57 -4.90 22.78 17.32 -12.14 7.75 -0.48 15.63 9.95 5.56 5.62 Sep-01-90
Excess 0.52 1.05 0.53 1.18 -0.44 -0.89 0.24 0.28 -0.36 0.43 0.79 0.09 0.00 0.27 0.14 MSCI EAFE IMI NET -0.31 2.31 -1.18 8.97 24.22 -4.90 23.54 17.64 -12.61 9.30 -0.16 15.89 10.26 5.82 Sep-01-90
Excess 0.32 0.72 0.28 0.81 -1.10 -0.89 -0.52 -0.04 0.11 -1.12 0.47 -0.17 -0.32 0.01
NYCERS-TOTAL PASSIVE EMERGING MARKETS 1,310.97 2.38 -4.23 -1.99 -9.38 0.54 14.99 -1.29 -4.24 16.11 -7.00 3.44 -2.71 Apr-01-11
MSCI Custom NYCERS Emerging Mkts Index -4.21 -2.08 -9.37 0.38 15.67 -0.98 -3.69 -6.97 3.87 Apr-01-11
Excess -0.02 0.09 -0.01 0.16 -0.68 -0.31 -0.55 -0.03 -0.43
NYCERS-TOTAL ACTIVE INTL EQUITY 7,268.02 13.18 -1.61 0.91 -2.66 5.52 21.81 -2.32 14.35 18.35 -14.24 15.27 -1.10 11.99 8.54 6.51 6.90 Apr-01-04
MSCI AC WORLD ex US (NET) -1.56 1.74 -2.54 7.02 21.75 -3.87 15.29 16.83 -13.71 11.15 -0.90 12.61 8.09 6.04 6.58 Apr-01-04
Excess -0.05 -0.83 -0.13 -1.50 0.05 1.55 -0.94 1.52 -0.53 4.12 -0.20 -0.62 0.45 0.47 0.32
NYCERS-TOTAL ACTIVE DEVELOPED EQUITY 4,676.98 8.48 -0.79 2.43 -0.55 8.06 22.87 -4.54 21.14 16.97 -11.88 10.56 0.29 14.41 9.77 5.68 7.08 Mar-01-91
MSCI EAFE -0.51 1.98 -1.43 8.60 23.57 -4.90 22.78 17.32 -12.14 7.75 -0.48 15.63 9.95 5.56 5.38 Mar-01-91
Excess -0.28 0.45 0.88 -0.54 -0.70 0.36 -1.64 -0.35 0.26 2.81 0.77 -1.22 -0.18 0.12 1.70
47

Limited Access
Assets ($MM)
% of Total
Trailing1 Month
Trailing3 Month FYTD CYTD
FYE06/30/14
CYE12/31/14
CYE12/31/13
CYE12/31/12
CYE12/31/11
CYE12/31/10
Trailing1 Year
Trailing3 Year
Trailing5 Year
Trailing10 Year ITD
InceptionDate
Periods Ending May 31, 2015
New York City Employees' Retirement System
Manager / Benchmark Comparison Report
Rates of Return - Total
NYCERS-TOTAL ACTIVE EMERGING MARKET 2,382.31 4.32 -3.36 -2.09 -7.61 0.72 18.53 1.02 -0.20 20.86 -18.86 27.44 -4.78 6.27 5.52 8.96 Nov-01-05
FTSE Custom NYCERS All Emerging Index -3.88 -2.10 -8.33 0.61 15.72 -0.07 -4.22 17.84 -18.20 23.58 -5.84 4.23 3.76 7.91 Nov-01-05
Excess 0.52 0.02 0.72 0.11 2.81 1.10 4.03 3.02 -0.67 3.86 1.06 2.04 1.76 1.05
NYCERS-TOTAL NON-U.S. ENVIRONMENTAL 207.84 0.38 0.57 2.67 13.08 7.57 22.90 11.99 29.01 18.76 -7.75 8.66 14.78 20.94 15.55 7.14 Sep-01-08
MSCI World Index 0.34 1.09 3.84 5.07 24.05 4.94 26.68 15.83 -5.54 11.76 5.70 17.09 12.84 6.51 Sep-01-08
Excess 0.22 1.58 9.24 2.50 -1.15 7.06 2.34 2.93 -2.21 -3.10 9.08 3.85 2.72 0.64
FIXED INCOME ASSET CLASS SUMMARY
NYCERS-TOTAL FIXED INCOME (DOM & GLOBAL) 18,805.86 34.09 -0.12 0.16 2.51 1.76 7.79 6.18 1.19 8.31 6.77 10.03 2.97 4.56 5.92 5.98 8.70 Feb-01-80
NYCERS-TOTAL STRUCTURED 9,165.39 16.62 -0.33 -0.29 3.32 1.21 6.61 7.69 -1.73 6.92 8.85 9.42 3.54 3.45 5.32 5.66 8.21 Jan-01-85
NYC - Core Plus Five -0.37 -0.29 3.53 1.05 5.54 7.66 -2.79 5.41 9.40 7.13 3.64 2.70 4.66 5.22 Jan-01-85
Excess 0.04 0.01 -0.21 0.17 1.07 0.02 1.06 1.51 -0.55 2.28 -0.10 0.75 0.66 0.44
NYCERS-TOTAL MORTGAGE 3,508.23 6.36 -0.08 0.44 3.34 1.26 5.30 6.38 -0.84 4.26 6.19 9.12 3.64 2.86 4.07 5.16 7.06 Mar-01-87
CITIGROUP MORTGAGE INDEX -0.06 0.51 3.19 1.19 4.59 6.12 -1.52 2.60 6.38 5.50 3.47 2.21 3.32 4.72 6.67 Mar-01-87
Excess -0.02 -0.07 0.15 0.07 0.71 0.26 0.68 1.66 -0.19 3.63 0.17 0.65 0.75 0.44 0.39
NYCERS-TOTAL INVESTMENT GRADE CREDIT 4,540.21 8.23 -0.47 -0.68 2.78 1.27 8.36 7.72 -0.85 10.58 7.82 9.63 3.00 4.60 6.35 5.78 7.41 Jan-01-87
NYC - Investment Grade Credit -0.53 -0.62 2.64 1.06 7.17 7.04 -1.85 9.52 7.79 8.36 2.73 3.82 5.57 5.24 Jan-01-87
Excess 0.06 -0.05 0.14 0.21 1.19 0.68 1.00 1.05 0.03 1.27 0.27 0.78 0.77 0.54
NYCERS-TOTAL GOVERNMENT 1,116.95 2.02 -0.56 -0.98 5.49 0.91 4.35 11.76 -7.30 4.20 18.35 9.55 5.41 1.49 5.78 5.75 7.75 Jan-01-87
NYC - Treasury Agency Plus Five -0.60 -1.01 6.40 0.84 3.79 12.38 -7.48 3.84 18.44 9.24 6.19 1.55 5.78 5.71 Jan-01-87
Excess 0.04 0.03 -0.91 0.07 0.57 -0.62 0.18 0.36 -0.09 0.31 -0.78 -0.06 0.00 0.04
NYCERS-TOTAL TIPS MANAGERS 1,777.84 3.22 -0.73 -0.48 -0.61 1.63 4.57 3.50 -8.42 7.25 13.50 6.47 -0.30 -0.42 3.92 4.46 4.46 Jun-01-05
Barclays Global Inflation Linked: US TIPS (Daily) -0.82 -0.56 -0.77 1.33 4.44 3.64 -8.61 6.98 13.56 6.31 -0.47 -0.62 3.79 4.28 4.28 Jun-01-05
Excess 0.09 0.08 0.15 0.30 0.13 -0.14 0.19 0.27 -0.06 0.16 0.16 0.21 0.13 0.19 0.19
NYCERS-TOTAL ENHANCED YIELD 2,100.73 3.81 0.38 1.09 1.34 4.54 12.88 2.94 8.31 14.56 5.73 14.24 2.39 8.55 9.41 8.08 8.24 Oct-01-94
CITIGROUP BB & B 0.47 1.16 1.76 4.26 10.91 2.78 6.17 14.45 6.58 13.35 2.50 7.59 8.97 6.81 7.29 Oct-01-94
Excess -0.09 -0.06 -0.42 0.28 1.97 0.15 2.14 0.11 -0.85 0.89 -0.11 0.96 0.44 1.27 0.95
48

Limited Access
Assets ($MM)
% of Total
Trailing1 Month
Trailing3 Month FYTD CYTD
FYE06/30/14
CYE12/31/14
CYE12/31/13
CYE12/31/12
CYE12/31/11
CYE12/31/10
Trailing1 Year
Trailing3 Year
Trailing5 Year
Trailing10 Year ITD
InceptionDate
Periods Ending May 31, 2015
New York City Employees' Retirement System
Manager / Benchmark Comparison Report
Rates of Return - Total
NYCERS-TOTAL BANK LOANS 1,007.94 1.83 0.24 1.67 3.54 3.44 6.38 2.58 6.41 4.13 5.15 Dec-01-12
CSFB LEVERAGED LOAN INDEX 0.20 1.50 2.47 3.19 6.11 2.06 6.15 3.09 4.87 Dec-01-12
Excess 0.04 0.17 1.07 0.25 0.27 0.52 0.26 1.04 0.28
NYCERS-TOTAL CONVERTIBLE BONDS 550.01 1.00 1.50 1.97 5.59 4.54 16.30 8.42 16.33 11.66 -3.02 14.54 7.00 12.58 9.98 7.11 Jun-01-08
BofAML ALL CONVERTIBLE EX M AI (DAILY) 2.22 2.82 5.75 6.10 24.91 9.33 25.00 14.41 -3.42 16.52 8.71 16.60 12.69 8.96 Jun-01-08
Excess -0.72 -0.85 -0.15 -1.56 -8.61 -0.91 -8.68 -2.76 0.39 -1.98 -1.72 -4.02 -2.71 -1.85
NYCERS-TOTAL OPPORTUNISTIC FIXED 1,312.27 2.38 0.40 1.15 2.09 1.17 14.77 8.15 17.55 20.49 -4.40 26.01 3.30 11.06 11.31 8.73 Oct-01-07
10% Annual Return 0.80 2.41 9.13 4.05 10.00 10.00 10.00 10.00 10.00 10.00 10.00 10.00 10.00 10.00 Oct-01-07
Excess -0.40 -1.27 -7.04 -2.88 4.77 -1.85 7.55 10.49 -14.40 16.01 -6.70 1.06 1.31 -1.27
NYCERS-TOTAL PROGRESS FIXED 111.92 0.20 -0.41 -0.30 2.76 1.08 4.92 6.18 -1.76 5.51 8.39 7.43 2.76 2.56 4.47 5.41 6.23 Jan-01-92
Barclays Aggregate (Daily) -0.24 -0.14 2.98 1.00 4.37 5.97 -2.02 4.21 7.84 6.54 3.03 2.21 3.90 4.61 5.93 Jan-01-92
Excess -0.17 -0.17 -0.22 0.08 0.54 0.22 0.26 1.29 0.55 0.89 -0.27 0.35 0.58 0.80 0.30
NYCERS-TOTAL CORE PLUS FIX INC 379.38 0.69 -0.04 0.15 3.15 1.58 5.12 5.84 -1.54 6.23 8.11 7.47 3.51 3.07 4.84 5.91 May-01-09
Barclays Aggregate (Daily) -0.24 -0.14 2.98 1.00 4.37 5.97 -2.02 4.21 7.84 6.54 3.03 2.21 3.90 4.70 May-01-09
Excess 0.20 0.29 0.17 0.58 0.75 -0.13 0.49 2.02 0.27 0.92 0.48 0.85 0.94 1.22
NYCERS-TOTAL TARGETED 645.34 1.17 -0.42 0.04 3.20 1.14 8.35 8.21 2.34 6.15 6.63 6.87 3.52 4.98 5.45 6.13 9.50 May-01-82
Employees Custom Benchmark (No Cash) -0.13 0.33 3.16 1.14 4.61 6.03 -1.64 3.41 7.66 6.47 3.36 2.27 3.81 4.85 May-01-82
Excess -0.30 -0.28 0.04 0.00 3.75 2.18 3.97 2.75 -1.03 0.41 0.15 2.72 1.64 1.28
CASH ASSET CLASS SUMMARY
NYCERS-TOTAL CASH 1,757.95 3.19 0.06 0.16 0.44 0.23 0.22 0.34 0.43 0.90 0.89 0.48 0.46 0.41 0.54 2.08 2.16 Apr-01-04
91 DAY TREASURY BILL (DAILY) 0.00 0.00 0.02 0.01 0.05 0.03 0.07 0.11 0.10 0.13 0.02 0.07 0.08 1.45 1.50 Apr-01-04
Excess 0.06 0.16 0.42 0.22 0.16 0.30 0.35 0.79 0.79 0.35 0.43 0.34 0.46 0.62 0.66
US EQUITY
State Street Global Advisors R3000 1,695.93 3.07 1.36 0.80 9.41 3.65 25.13 12.88 33.42 16.41 1.19 12.12 19.99 16.66 Oct-01-10
RUSSELL 3000 (DAILY) 1.38 0.81 9.12 3.68 25.22 12.56 33.55 16.42 1.03 11.86 19.92 16.58 Oct-01-10
Excess -0.02 0.00 0.29 -0.03 -0.09 0.32 -0.13 0.00 0.17 0.26 0.07 0.08
49

Limited Access
Assets ($MM)
% of Total
Trailing1 Month
Trailing3 Month FYTD CYTD
FYE06/30/14
CYE12/31/14
CYE12/31/13
CYE12/31/12
CYE12/31/11
CYE12/31/10
Trailing1 Year
Trailing3 Year
Trailing5 Year
Trailing10 Year ITD
InceptionDate
Periods Ending May 31, 2015
New York City Employees' Retirement System
Manager / Benchmark Comparison Report
Rates of Return - Total
Amalgamated Bank 4,219.18 7.65 1.28 0.66 9.52 3.19 24.60 13.62 32.49 15.99 1.74 14.90 11.81 19.71 16.41 8.04 4.55 Aug-01-00
S&P 500 INDEX (DAILY) 1.29 0.64 9.54 3.23 24.61 13.69 32.39 16.00 2.11 15.06 11.81 19.67 16.54 8.12 4.66 Aug-01-00
Excess -0.01 0.02 -0.03 -0.04 -0.01 -0.07 0.10 -0.02 -0.37 -0.16 0.00 0.03 -0.13 -0.08 -0.10
NYCERS-TOTAL SMALL CAP 1,957.04 3.55 1.27 0.33 3.66 1.86 24.34 4.40 41.99 17.81 -4.50 29.84 8.75 19.88 15.28 8.69 8.60 Apr-01-04
RUSSELL 2000 (DAILY) 2.28 1.41 5.69 3.98 23.64 4.89 38.82 16.35 -4.18 26.85 11.32 19.45 15.04 8.73 8.34 Apr-01-04
Excess -1.01 -1.08 -2.03 -2.11 0.70 -0.50 3.17 1.46 -0.33 2.99 -2.57 0.44 0.24 -0.05 0.26
NYCERS-TOTAL SMALL CAP PASSIVE 288.03 0.52 3.09 1.98 8.71 5.80 23.39 5.57 38.84 16.41 14.75 20.38 12.00 Apr-01-11
RUSSELL 2000 (DAILY) 2.28 1.41 5.69 3.98 23.64 4.89 38.82 16.35 11.32 19.45 11.33 Apr-01-11
Excess 0.80 0.57 3.01 1.83 -0.25 0.68 0.02 0.06 3.44 0.93 0.67Blackrock Inst R 2000 Growth 229.37 0.42 3.68 2.41 10.84 7.20 5.71 17.76 13.10 Oct-01-13
RUSSELL 2000 GROWTH DAILY 3.67 2.43 10.85 7.30 5.60 17.73 12.99 Oct-01-13
Excess 0.00 -0.02 -0.01 -0.10 0.10 0.03 0.10Blackrock Inst R 2000 Value 58.57 0.11 0.83 0.34 1.27 0.58 4.90 5.75 8.92 Oct-01-13
RUSSELL 2000 VALUE DAILY 0.83 0.34 0.64 0.63 4.22 5.10 8.54 Oct-01-13
Excess 0.00 0.00 0.63 -0.05 0.69 0.66 0.38
NYCERS-TOTAL SMALL CAP ACTIVE 1,669.01 3.03 0.96 0.05 2.80 1.21 24.69 4.17 42.73 18.75 -6.63 29.84 7.70 20.10 14.87 8.49 8.42 Apr-01-04
RUSSELL 2000 (DAILY) 2.28 1.41 5.69 3.98 23.64 4.89 38.82 16.35 -4.18 26.85 11.32 19.45 15.04 8.73 8.34 Apr-01-04
Excess -1.32 -1.36 -2.89 -2.76 1.05 -0.73 3.90 2.41 -2.46 2.99 -3.62 0.66 -0.17 -0.24 0.08RAFI - SC Fundamental 1,009.24 1.83 1.07 0.70 4.29 1.48 24.37 4.77 44.43 19.50 -4.70 29.59 9.05 20.96 15.74 12.04 Jul-01-08
RUSSELL 2000 (DAILY) 2.28 1.41 5.69 3.98 23.64 4.89 38.82 16.35 -4.18 26.85 11.32 19.45 15.04 10.46 Jul-01-08
Excess -1.21 -0.71 -1.40 -2.50 0.73 -0.12 5.61 3.15 -0.52 2.73 -2.27 1.52 0.70 1.58Ceredex SCV 286.37 0.52 0.99 0.60 0.80 1.84 26.04 3.12 36.01 5.90 15.92 Jan-01-13
RUSSELL 2000 VALUE DAILY 0.83 0.34 0.64 0.63 22.54 4.22 34.52 5.10 15.32 Jan-01-13
Excess 0.17 0.26 0.16 1.21 3.49 -1.09 1.48 0.80 0.59
NYCERS-TOTAL SMALL CAP CORE 373.40 0.68 0.64 -2.08 0.46 0.05 24.49 3.36 43.61 18.95 -10.13 31.75 5.53 20.23 14.23 16.68 Nov-01-08
RUSSELL 2000 (DAILY) 2.28 1.41 5.69 3.98 23.64 4.89 38.82 16.35 -4.18 26.85 11.32 19.45 15.04 15.22 Nov-01-08
Excess -1.64 -3.49 -5.23 -3.93 0.85 -1.53 4.79 2.60 -5.96 4.89 -5.79 0.78 -0.81 1.46Daruma Asset Management 210.92 0.38 -0.10 -3.82 -4.59 -2.51 22.19 -1.37 44.51 19.91 -10.13 31.75 -0.54 17.91 12.90 15.65 Nov-01-08
RUSSELL 2000 (DAILY) 2.28 1.41 5.69 3.98 23.64 4.89 38.82 16.35 -4.18 26.85 11.32 19.45 15.04 15.22 Nov-01-08
Excess -2.38 -5.23 -10.29 -6.48 -1.45 -6.26 5.69 3.56 -5.96 4.89 -11.85 -1.54 -2.14 0.43Wellington Small Core 162.48 0.29 1.61 0.27 7.87 3.57 28.02 10.67 42.24 14.58 22.45 Jan-01-13
RUSSELL 2000 (DAILY) 2.28 1.41 5.69 3.98 23.64 4.89 38.82 11.32 18.75 Jan-01-13
Excess -0.67 -1.14 2.17 -0.40 4.38 5.78 3.42 3.27 3.70
50

Limited Access
Assets ($MM)
% of Total
Trailing1 Month
Trailing3 Month FYTD CYTD
FYE06/30/14
CYE12/31/14
CYE12/31/13
CYE12/31/12
CYE12/31/11
CYE12/31/10
Trailing1 Year
Trailing3 Year
Trailing5 Year
Trailing10 Year ITD
InceptionDate
Periods Ending May 31, 2015
New York City Employees' Retirement System
Manager / Benchmark Comparison Report
Rates of Return - Total
State Street GA S&P 400 1,826.38 3.31 1.62 1.55 7.95 5.44 24.97 9.98 33.13 17.81 12.40 19.75 13.85 Feb-01-11
S&P 400 MIDCAP INDEX (DAILY) 1.78 1.58 7.82 5.59 25.24 9.77 33.50 17.88 12.28 19.87 13.91 Feb-01-11
Excess -0.16 -0.04 0.13 -0.15 -0.27 0.21 -0.37 -0.07 0.12 -0.12 -0.06
NYCERS-TOTAL RUSSELL 1000 7,332.56 13.29 1.25 0.53 8.54 3.04 25.34 13.02 35.73 16.76 0.66 16.74 11.05 20.99 16.66 11.07 Jul-01-08
RUSSELL 1000 (DAILY) 1.31 0.76 9.42 3.65 25.35 13.24 33.11 16.42 1.50 16.10 11.91 19.97 16.68 10.01 Jul-01-08
Excess -0.06 -0.23 -0.88 -0.62 -0.01 -0.22 2.62 0.33 -0.84 0.64 -0.86 1.02 -0.02 1.06
NYCERS-TOTAL RUSSELL 1000 PASSIVE 5,419.02 9.82 1.30 0.73 9.26 3.51 13.20 11.76 16.56 Oct-01-13
RUSSELL 1000 (DAILY) 1.31 0.76 9.42 3.65 13.24 11.91 16.72 Oct-01-13
Excess 0.00 -0.03 -0.16 -0.14 -0.04 -0.15 -0.16Blackrock Inst R 1000 Growth 2,758.79 5.00 1.40 0.74 12.45 5.79 12.90 14.65 18.09 Oct-01-13
RUSSELL 1000 GROWTH - DAILY 1.41 0.76 12.54 5.83 13.05 14.73 18.20 Oct-01-13
Excess -0.01 -0.02 -0.08 -0.03 -0.15 -0.08 -0.11Blackrock Inst R 1000 Value 2,660.23 4.82 1.20 0.72 6.29 1.37 13.52 9.07 15.12 Oct-01-13
RUSSELL 1000 VALUE (DAILY) 1.20 0.76 6.25 1.41 13.45 9.03 15.19 Oct-01-13
Excess 0.00 -0.04 0.04 -0.04 0.06 0.04 -0.07
NYCERS-TOTAL RUSSELL 1000 ACTIVE 1,913.53 3.47 1.08 0.35 7.37 2.35 25.74 12.65 36.04 16.76 0.66 16.74 9.88 20.68 16.48 10.95 Jul-01-08
RUSSELL 1000 (DAILY) 1.31 0.76 9.42 3.65 25.35 13.24 33.11 16.42 1.50 16.10 11.91 19.97 16.68 10.01 Jul-01-08
Excess -0.22 -0.40 -2.05 -1.30 0.38 -0.59 2.93 0.33 -0.84 0.64 -2.03 0.71 -0.19 0.94
NYCERS-TOTAL FUNDAMENTAL RUSSELL 1000 1,913.92 3.47 1.08 0.43 7.00 2.27 25.82 12.72 37.21 17.36 1.24 18.05 9.54 21.29 17.00 11.28 Jul-01-08
RUSSELL 1000 (DAILY) 1.31 0.76 9.42 3.65 25.35 13.24 33.11 16.42 1.50 16.10 11.91 19.97 16.68 10.01 Jul-01-08
Excess -0.22 -0.32 -2.42 -1.38 0.47 -0.52 4.10 0.94 -0.26 1.95 -2.37 1.33 0.32 1.27VTL S&P 500 Fundamental 487.55 0.88 0.98 0.39 10.57 3.18 25.49 13.95 38.25 18.65 0.72 17.47 12.13 22.70 17.52 11.41 Jul-01-08
S&P 500 INDEX (DAILY) 1.29 0.64 9.54 3.23 24.61 13.69 32.39 16.00 2.11 15.06 11.81 19.67 16.54 9.85 Jul-01-08
Excess -0.30 -0.25 1.03 -0.05 0.88 0.26 5.86 2.65 -1.39 2.40 0.32 3.03 0.98 1.56RAFI - LC Fundamental 1,426.37 2.59 1.12 0.45 5.84 1.96 25.93 12.31 36.87 16.94 2.38 18.99 8.68 20.83 16.94 11.51 Jul-01-08
RUSSELL 1000 (DAILY) 1.31 0.76 9.42 3.65 25.35 13.24 33.11 16.42 1.50 16.10 11.91 19.97 16.68 10.01 Jul-01-08
Excess -0.19 -0.31 -3.58 -1.69 0.58 -0.93 3.76 0.52 0.88 2.89 -3.22 0.86 0.27 1.50
51

Limited Access
Assets ($MM)
% of Total
Trailing1 Month
Trailing3 Month FYTD CYTD
FYE06/30/14
CYE12/31/14
CYE12/31/13
CYE12/31/12
CYE12/31/11
CYE12/31/10
Trailing1 Year
Trailing3 Year
Trailing5 Year
Trailing10 Year ITD
InceptionDate
Periods Ending May 31, 2015
New York City Employees' Retirement System
Manager / Benchmark Comparison Report
Rates of Return - Total
EMERGING MANAGERS
NYCERS-TOTAL EMERGING MANAGER- EQUITY 1,096.19 1.99 1.39 0.64 5.80 3.25 26.70 8.19 37.19 16.17 -0.20 17.79 8.63 19.23 16.02 8.59 9.15 Jul-01-93
RUSSELL 3000 (DAILY) 1.38 0.81 9.12 3.68 25.22 12.56 33.55 16.42 1.03 16.93 11.86 19.92 16.54 8.41 9.51 Jul-01-93
Excess 0.00 -0.17 -3.32 -0.43 1.48 -4.37 3.63 -0.25 -1.23 0.86 -3.23 -0.69 -0.52 0.18 -0.36NYCERS-TOTAL PROGRESS EQUITY 433.89 0.79 1.39 0.55 4.88 2.79 27.40 7.59 38.14 16.85 -1.18 16.81 7.66 19.25 15.81 8.70 9.16 Jan-01-92
RUSSELL 3000 (DAILY) 1.38 0.81 9.12 3.68 25.22 12.56 33.55 16.42 1.03 16.93 11.86 19.92 16.54 8.41 9.53 Jan-01-92
Excess 0.00 -0.26 -4.24 -0.89 2.18 -4.97 4.59 0.44 -2.21 -0.12 -4.20 -0.67 -0.74 0.29 -0.38NYCERS-TOTAL ATTUCKS 337.26 0.61 1.32 0.67 7.51 3.97 26.33 10.10 36.09 15.59 0.50 18.78 10.23 19.86 16.62 7.40 Jan-01-08
RUSSELL 3000 (DAILY) 1.38 0.81 9.12 3.68 25.22 12.56 33.55 16.42 1.03 16.93 11.86 19.92 16.54 7.63 Jan-01-08
Excess -0.07 -0.14 -1.61 0.29 1.11 -2.45 2.54 -0.83 -0.52 1.85 -1.63 -0.06 0.08 -0.23NYCERS-TOTAL F I S 246.66 0.45 1.46 0.76 4.76 3.18 26.62 6.22 37.69 16.02 0.81 16.39 7.54 18.47 15.78 7.98 5.15 May-01-99
RUSSELL 3000 (DAILY) 1.38 0.81 9.12 3.68 25.22 12.56 33.55 16.42 1.03 16.93 11.86 19.92 16.54 8.41 5.45 May-01-99
Excess 0.08 -0.05 -4.36 -0.49 1.40 -6.34 4.14 -0.39 -0.22 -0.54 -4.31 -1.45 -0.77 -0.43 -0.30NYCERS-TOTAL CAPITAL PROSPECTS (CP) 78.37 0.14 1.45 0.64 6.92 2.92 24.41 9.83 34.78 15.36 -0.95 18.56 10.71 18.82 15.46 6.69 Dec-01-07
RUSSELL 3000 (DAILY) 1.38 0.81 9.12 3.68 25.22 12.56 33.55 16.42 1.03 16.93 11.86 19.92 16.54 7.45 Dec-01-07
Excess 0.06 -0.16 -2.20 -0.75 -0.81 -2.73 1.23 -1.06 -1.97 1.63 -1.15 -1.10 -1.09 -0.76
U.S. ENVIRONMENTALWalden Asset Management (ENVRN) 342.40 0.62 0.95 -0.18 2.72 2.23 18.10 0.11 32.89 13.51 1.17 26.98 8.73 14.49 13.55 9.31 May-01-08
RUSSELL 2000 (DAILY) 2.28 1.41 5.69 3.98 23.64 4.89 38.82 16.35 -4.18 26.85 11.32 19.45 15.04 9.65 May-01-08
Excess -1.33 -1.59 -2.97 -1.75 -5.54 -4.79 -5.93 -2.84 5.34 0.13 -2.59 -4.95 -1.49 -0.34
NON - US EQUITY
NYCERS-TOTAL DEVELOPED VALUE 1,920.24 3.48 -1.57 1.10 -3.11 5.97 23.35 -3.85 22.15 14.03 -11.01 10.07 -2.59 13.86 9.18 5.21 6.38 Apr-01-04
MSCI EAFE VALUE NET (DAILY) -0.97 1.38 -4.12 7.43 26.86 -5.39 22.95 17.69 -12.17 3.25 -2.98 16.13 9.17 4.89 5.76 Apr-01-04
Excess -0.60 -0.28 1.01 -1.46 -3.51 1.55 -0.80 -3.66 1.16 6.82 0.39 -2.27 0.00 0.32 0.62Causeway 922.97 1.67 -1.11 2.75 0.38 8.25 23.73 -4.60 0.25 10.38 May-01-13
MSCI EAFE VALUE NET (DAILY) -0.97 1.38 -4.12 7.43 26.86 -5.39 -2.98 6.32 May-01-13
Excess -0.14 1.37 4.50 0.82 -3.13 0.80 3.23 4.06Sprucegrove 997.13 1.81 -1.99 -0.38 -5.89 3.95 23.13 -3.49 17.65 17.62 -10.12 19.06 -5.00 11.95 9.41 1.89 Sep-01-07
MSCI EAFE VALUE NET (DAILY) -0.97 1.38 -4.12 7.43 26.86 -5.39 22.95 17.69 -12.17 3.25 -2.98 16.13 9.17 0.14 Sep-01-07
Excess -1.02 -1.76 -1.77 -3.48 -3.73 1.91 -5.30 -0.07 2.06 15.81 -2.02 -4.18 0.24 1.75
52

Limited Access
Assets ($MM)
% of Total
Trailing1 Month
Trailing3 Month FYTD CYTD
FYE06/30/14
CYE12/31/14
CYE12/31/13
CYE12/31/12
CYE12/31/11
CYE12/31/10
Trailing1 Year
Trailing3 Year
Trailing5 Year
Trailing10 Year ITD
InceptionDate
Periods Ending May 31, 2015
New York City Employees' Retirement System
Manager / Benchmark Comparison Report
Rates of Return - Total
NYCERS-TOTAL DEVELOPED GROWTH 2,020.24 3.66 -0.53 2.85 1.55 8.92 20.67 -5.15 20.21 20.02 -12.92 10.16 2.15 14.66 9.98 7.36 7.82 Apr-01-04
MSCI EAFE GROWTH -0.08 2.55 1.28 9.74 20.33 -4.43 22.55 16.86 -12.11 12.25 2.02 15.10 10.66 6.16 6.31 Apr-01-04
Excess -0.46 0.30 0.27 -0.82 0.34 -0.72 -2.34 3.16 -0.80 -2.09 0.13 -0.44 -0.68 1.20 1.51Baillie Gifford MTA 981.50 1.78 -0.41 2.96 2.03 10.18 22.96 -6.57 24.28 19.04 -11.03 17.57 2.20 15.75 11.77 3.46 Jan-01-08
MSCI EAFE GROWTH -0.08 2.55 1.28 9.74 20.33 -4.43 22.55 16.86 -12.11 12.25 2.02 15.10 10.66 1.27 Jan-01-08
Excess -0.33 0.41 0.75 0.44 2.62 -2.14 1.73 2.18 1.08 5.32 0.18 0.65 1.11 2.19Walter Scott 1,038.60 1.88 -0.65 2.76 1.45 7.76 14.98 -3.13 2.64 4.12 May-01-13
MSCI EAFE GROWTH -0.08 2.55 1.28 9.74 20.33 -4.43 2.02 7.18 May-01-13
Excess -0.57 0.21 0.17 -1.98 -5.35 1.30 0.62 -3.06
NYCERS-TOTAL DEVELOPED SMALL CAP ACTIVE 681.48 1.24 0.61 4.92 0.46 11.57 30.35 -3.78 2.72 10.97 May-01-13
S&P EPAC Small Cap Index 0.78 5.15 2.03 12.06 29.60 -3.10 3.39 11.29 May-01-13
Excess -0.17 -0.23 -1.56 -0.49 0.75 -0.68 -0.67 -0.32Acadian 342.28 0.62 0.44 4.65 -1.78 10.59 35.51 -2.69 1.39 11.30 May-01-13
S&P EPAC Small Cap Index 0.78 5.15 2.03 12.06 29.60 -3.10 3.39 11.29 May-01-13
Excess -0.34 -0.50 -3.81 -1.47 5.91 0.41 -2.00 0.01Pyramis 339.20 0.61 0.79 5.20 2.84 12.58 25.29 -4.87 4.10 10.62 May-01-13
S&P EPAC Small Cap Index 0.78 5.15 2.03 12.06 29.60 -3.10 3.39 11.29 May-01-13
Excess 0.00 0.05 0.82 0.52 -4.31 -1.77 0.71 -0.67
NYCERS-TOTAL PROGRESS INTL 53.82 0.10 -0.27 3.82 -0.34 9.07 23.09 -4.89 21.26 18.84 -13.33 12.96 1.78 15.03 9.95 1.14 Dec-01-07
MSCI EAFE -0.51 1.98 -1.43 8.60 23.57 -4.90 22.78 17.32 -12.14 7.75 -0.48 15.63 9.95 0.36 Dec-01-07
Excess 0.24 1.85 1.09 0.47 -0.48 0.01 -1.52 1.52 -1.19 5.21 2.26 -0.60 0.00 0.78
NYCERS-TOTAL ACTIVE DEVELOPED EQUITY 4,676.98 8.48 -0.79 2.43 -0.55 8.06 22.87 -4.54 21.14 16.97 -11.88 10.56 0.29 14.41 9.77 5.68 7.08 Mar-01-91
MSCI EAFE -0.51 1.98 -1.43 8.60 23.57 -4.90 22.78 17.32 -12.14 7.75 -0.48 15.63 9.95 5.56 5.38 Mar-01-91
Excess -0.28 0.45 0.88 -0.54 -0.70 0.36 -1.64 -0.35 0.26 2.81 0.77 -1.22 -0.18 0.12 1.70
NYCERS-TOTAL PASSIVE DEVELOPED EQUITY 866.41 1.57 0.00 3.03 -0.90 9.78 23.13 -5.80 23.02 17.60 -12.50 8.18 0.31 15.72 9.95 5.83 5.77 Sep-01-90
MSCI EAFE -0.51 1.98 -1.43 8.60 23.57 -4.90 22.78 17.32 -12.14 7.75 -0.48 15.63 9.95 5.56 5.62 Sep-01-90
Excess 0.52 1.05 0.53 1.18 -0.44 -0.89 0.24 0.28 -0.36 0.43 0.79 0.09 0.00 0.27 0.14 MSCI EAFE IMI NET -0.31 2.31 -1.18 8.97 24.22 -4.90 23.54 17.64 -12.61 9.30 -0.16 15.89 10.26 5.82 Sep-01-90
Excess 0.32 0.72 0.28 0.81 -1.10 -0.89 -0.52 -0.04 0.11 -1.12 0.47 -0.17 -0.32 0.01
NYCERS-TOTAL DEVELOPED LARGE CAP PASSIVE 612.45 1.11 -0.44 2.25 -1.51 8.89 23.94 -4.98 23.02 17.60 -0.51 15.74 6.07 Feb-01-11
MSCI EAFE -0.51 1.98 -1.43 8.60 23.57 -4.90 22.78 17.32 -0.48 15.63 5.81 Feb-01-11
Excess 0.07 0.28 -0.08 0.29 0.37 -0.08 0.24 0.28 -0.03 0.10 0.26
53

Limited Access
Assets ($MM)
% of Total
Trailing1 Month
Trailing3 Month FYTD CYTD
FYE06/30/14
CYE12/31/14
CYE12/31/13
CYE12/31/12
CYE12/31/11
CYE12/31/10
Trailing1 Year
Trailing3 Year
Trailing5 Year
Trailing10 Year ITD
InceptionDate
Periods Ending May 31, 2015
New York City Employees' Retirement System
Manager / Benchmark Comparison Report
Rates of Return - Total
SSGA MTA 121 612.45 1.11 -0.44 2.25 -1.51 8.89 23.94 -4.98 23.02 17.60 -0.51 15.74 6.07 Feb-01-11
MSCI EAFE -0.51 1.98 -1.43 8.60 23.57 -4.90 22.78 17.32 -0.48 15.63 5.81 Feb-01-11
Excess 0.07 0.28 -0.08 0.29 0.37 -0.08 0.24 0.28 -0.03 0.10 0.26
NYCERS-TOTAL DEVELOPED SMALL CAP PASSIVE 253.96 0.46 1.09 4.85 1.20 11.87 2.74 6.44 Feb-01-14
MSCI EAFE SMALL CAP NET (DAILY) 1.05 4.59 0.51 11.56 2.00 5.74 Feb-01-14
Excess 0.04 0.26 0.69 0.30 0.74 0.70SSGA MSCI EAFE Small Cap Index 253.96 0.46 1.09 4.85 1.20 11.87 2.74 6.44 Feb-01-14
MSCI EAFE SMALL CAP NET (DAILY) 1.05 4.59 0.51 11.56 2.00 5.74 Feb-01-14
Excess 0.04 0.26 0.69 0.30 0.74 0.70
NYCERS-TOTAL DEVELOPED MARKETS 5,543.39 10.05 -0.67 2.53 -0.56 8.36 22.79 -4.73 21.44 17.17 -12.11 10.09 0.34 14.74 9.78 5.70 6.49 Sep-01-90
MSCI EAFE -0.51 1.98 -1.43 8.60 23.57 -4.90 22.78 17.32 -12.14 7.75 -0.48 15.63 9.95 5.56 5.62 Sep-01-90
Excess -0.16 0.55 0.87 -0.24 -0.79 0.17 -1.34 -0.15 0.03 2.34 0.82 -0.90 -0.17 0.14 0.87
NYCERS-TOTAL NON-U.S. ENVIRONMENTAL 207.84 0.38 0.57 2.67 13.08 7.57 22.90 11.99 29.01 18.76 -7.75 8.66 14.78 20.94 15.55 7.14 Sep-01-08
MSCI World Index 0.34 1.09 3.84 5.07 24.05 4.94 26.68 15.83 -5.54 11.76 5.70 17.09 12.84 6.51 Sep-01-08
Excess 0.22 1.58 9.24 2.50 -1.15 7.06 2.34 2.93 -2.21 -3.10 9.08 3.85 2.72 0.64Generation GE MTA 207.81 0.38 0.57 2.67 13.09 7.58 22.90 11.99 28.87 19.40 -7.77 15.09 14.78 20.96 15.46 11.95 Sep-01-08
MSCI World Index 0.34 1.09 3.84 5.07 24.05 4.94 26.68 15.83 -5.54 11.76 5.70 17.09 12.84 6.51 Sep-01-08
Excess 0.22 1.58 9.24 2.50 -1.15 7.06 2.19 3.58 -2.23 3.33 9.08 3.87 2.62 5.45
NYCERS-TOTAL DVLPED ENV ACT EX PASSIVE 4,885.70 8.86 -0.74 2.44 -0.04 8.04 23.39 -3.94 22.56 17.38 -12.55 11.82 0.84 15.04 10.15 5.94 6.39 Apr-01-04
MSCI EAFE -0.51 1.98 -1.43 8.60 23.57 -4.90 22.78 17.32 -12.14 7.75 -0.48 15.63 9.95 5.56 6.07 Apr-01-04
Excess -0.22 0.46 1.39 -0.57 -0.19 0.96 -0.22 0.06 -0.40 4.07 1.32 -0.59 0.20 0.38 0.32
NYCERS-TOTAL DEVELOPED ENVIRON ACTIVIST 5,753.08 10.43 -0.63 2.52 -0.06 8.30 23.25 -4.09 22.56 17.47 -12.59 11.17 0.88 15.29 10.13 5.93 6.39 Apr-01-04
MSCI EAFE -0.51 1.98 -1.43 8.60 23.57 -4.90 22.78 17.32 -12.14 7.75 -0.48 15.63 9.95 5.56 6.07 Apr-01-04
Excess -0.11 0.55 1.37 -0.30 -0.32 0.81 -0.21 0.15 -0.45 3.42 1.36 -0.34 0.18 0.37 0.32 MSCI EAFE IMI NET -0.31 2.31 -1.18 8.97 24.22 -4.90 23.54 17.64 -12.61 9.30 -0.16 15.89 10.26 5.82 6.32 Apr-01-04
Excess -0.31 0.22 1.12 -0.68 -0.97 0.81 -0.97 -0.17 0.02 1.87 1.04 -0.60 -0.14 0.11 0.07
54

Limited Access
Assets ($MM)
% of Total
Trailing1 Month
Trailing3 Month FYTD CYTD
FYE06/30/14
CYE12/31/14
CYE12/31/13
CYE12/31/12
CYE12/31/11
CYE12/31/10
Trailing1 Year
Trailing3 Year
Trailing5 Year
Trailing10 Year ITD
InceptionDate
Periods Ending May 31, 2015
New York City Employees' Retirement System
Manager / Benchmark Comparison Report
Rates of Return - Total
EMERGING MARKETS
NYCERS-TOTAL EMERGING MARKETS 3,693.28 6.70 -3.67 -2.05 -8.24 0.65 17.34 0.22 -1.64 19.81 -18.76 26.33 -5.56 5.26 4.69 8.46 Sep-01-05
FTSE Custom NYCERS All Emerging Index -3.88 -2.10 -8.33 0.61 15.72 -0.07 -4.22 17.84 -18.20 23.58 -5.84 4.23 3.76 8.06 Sep-01-05
Excess 0.21 0.05 0.10 0.04 1.62 0.29 2.58 1.97 -0.57 2.75 0.29 1.03 0.93 0.40
NYCERS-TOTAL ACTIVE EMERGING MARKET 2,382.31 4.32 -3.36 -2.09 -7.61 0.72 18.53 1.02 -0.20 20.86 -18.86 27.44 -4.78 6.27 5.52 8.96 Nov-01-05
FTSE Custom NYCERS All Emerging Index -3.88 -2.10 -8.33 0.61 15.72 -0.07 -4.22 17.84 -18.20 23.58 -5.84 4.23 3.76 7.91 Nov-01-05
Excess 0.52 0.02 0.72 0.11 2.81 1.10 4.03 3.02 -0.67 3.86 1.06 2.04 1.76 1.05BALLIE MTA 641.34 1.16 -1.67 -1.76 -3.47 2.48 26.63 5.15 7.97 11.33 -17.76 24.87 -0.50 9.91 6.58 9.25 Nov-01-05
FTSE Custom NYCERS All Emerging Index -3.88 -2.10 -8.33 0.61 15.72 -0.07 -4.22 17.84 -18.20 23.58 -5.84 4.23 3.76 7.91 Nov-01-05
Excess 2.21 0.34 4.87 1.88 10.91 5.22 12.19 -6.51 0.44 1.29 5.34 5.68 2.82 1.34Acadian / MTA 599.92 1.09 -3.13 -2.15 -5.19 0.93 17.92 3.46 1.02 22.11 -15.94 25.57 -0.93 8.47 7.25 9.63 Nov-01-05
FTSE Custom NYCERS All Emerging Index -3.88 -2.10 -8.33 0.61 15.72 -0.07 -4.22 17.84 -18.20 23.58 -5.84 4.23 3.76 7.91 Nov-01-05
Excess 0.75 -0.04 3.15 0.32 2.20 3.53 5.24 4.27 2.25 1.99 4.91 4.24 3.50 1.72Eaton Vance EM 584.46 1.06 -3.96 -2.44 -9.32 -0.62 13.77 -1.05 -3.80 -7.60 3.93 3.93 Jun-01-12
FTSE Custom NYCERS All Emerging Index -3.88 -2.10 -8.33 0.61 15.72 -0.07 -4.22 -5.84 4.23 4.23 Jun-01-12
Excess -0.08 -0.34 -0.98 -1.23 -1.95 -0.98 0.42 -1.76 -0.30 -0.30DFA MTA 556.60 1.01 -4.85 -2.02 -12.72 -0.09 15.97 -3.68 -4.25 20.10 -23.73 32.75 -10.06 3.03 2.44 9.11 Nov-01-05
FTSE Custom NYCERS All Emerging Index -3.88 -2.10 -8.33 0.61 15.72 -0.07 -4.22 17.84 -18.20 23.58 -5.84 4.23 3.76 7.91 Nov-01-05
Excess -0.98 0.08 -4.39 -0.70 0.25 -3.61 -0.02 2.26 -5.54 9.18 -4.22 -1.20 -1.32 1.21
NYCERS-TOTAL PASSIVE EMERGING MARKETS 1,310.97 2.38 -4.23 -1.99 -9.38 0.54 14.99 -1.29 -4.24 16.11 -7.00 3.44 -2.71 Apr-01-11
MSCI Custom NYCERS Emerging Mkts Index -4.21 -2.08 -9.37 0.38 15.67 -0.98 -3.69 -6.97 3.87 Apr-01-11
Excess -0.02 0.09 -0.01 0.16 -0.68 -0.31 -0.55 -0.03 -0.43Blackrock EM 1,310.97 2.38 -4.23 -1.99 -9.54 0.54 14.99 -1.46 -4.24 16.11 -7.16 3.38 -2.75 Apr-01-11
MSCI Custom NYCERS Emerging Mkts Index -4.21 -2.08 -9.37 0.38 15.67 -0.98 -3.69 -6.97 3.87 Apr-01-11
Excess -0.02 0.09 -0.17 0.16 -0.68 -0.48 -0.55 -0.19 -0.49
NYCERS-TOTAL INTL EQUITY 9,446.36 17.13 -1.84 0.70 -3.38 5.23 20.94 -2.50 12.45 18.06 -14.05 14.04 -1.74 11.22 7.95 5.94 6.59 Sep-01-90
MSCI AC WORLD ex US (NET) -1.56 1.74 -2.54 7.02 21.75 -3.87 15.29 16.83 -13.71 11.15 -0.90 12.61 8.09 6.04 Sep-01-90
Excess -0.28 -1.04 -0.84 -1.80 -0.81 1.36 -2.84 1.23 -0.34 2.89 -0.84 -1.39 -0.14 -0.09
HEDGE FUNDS
NYCERS-TOTAL HEDGE FUNDS 1,733.05 3.14 0.58 1.24 6.12 3.88 6.73 5.53 4.96 8.16 6.90 6.87 4.81 Jul-01-11
HFRI Fund of Funds Composite Index + 1% 1.09 2.26 6.13 4.33 8.70 4.40 10.04 5.82 7.27 7.62 4.89 Jul-01-11
Excess -0.51 -1.02 -0.01 -0.45 -1.98 1.14 -5.08 2.34 -0.37 -0.75 -0.07
55

Limited Access
Assets ($MM)
% of Total
Trailing1 Month
Trailing3 Month FYTD CYTD
FYE06/30/14
CYE12/31/14
CYE12/31/13
CYE12/31/12
CYE12/31/11
CYE12/31/10
Trailing1 Year
Trailing3 Year
Trailing5 Year
Trailing10 Year ITD
InceptionDate
Periods Ending May 31, 2015
New York City Employees' Retirement System
Manager / Benchmark Comparison Report
Rates of Return - Total
NYCERS-TOTAL DIRECT HEDGE FUNDS 1,475.10 2.67 0.70 1.17 6.51 4.12 6.98 5.96 4.24 9.44 7.44 7.07 6.97 Jan-01-12
HFRI Fund of Funds Composite Index + 1% 1.09 2.26 6.13 4.33 8.70 4.40 10.04 5.82 7.27 7.62 7.21 Jan-01-12
Excess -0.39 -1.09 0.38 -0.21 -1.72 1.57 -5.80 3.62 0.16 -0.55 -0.24D.E. Shaw Composite Fd 174.53 0.32 1.71 3.98 15.85 9.16 13.44 16.07 13.66 17.50 16.16 17.21 16.66 Jan-01-12
Brevan Howard Lp 52.86 0.10 0.53 3.08 9.89 5.89 -5.37 -0.74 2.49 9.62 4.35 3.11 Feb-01-12
Brevan Howard Opp 109.31 0.20 0.93 0.33 7.83 3.12 -4.26 0.79 7.71 1.67 Jul-01-13
Brigade Lev Cap Str Fd 101.05 0.18 1.09 3.86 1.64 6.25 9.75 0.68 6.12 3.16 5.44 5.44 Mar-01-12
Blue Trend Fd 97.41 0.18 -1.76 -1.50 13.48 7.12 4.87 12.46 -11.20 16.57 3.49 Jul-01-12
Carlson Double Blk DIA FD 155.38 0.28 -0.82 1.11 2.36 1.69 10.05 5.50 3.25 6.41 Jul-01-13
Caspian Select Cf 120.49 0.22 -0.33 0.56 -1.83 -0.17 10.04 3.17 9.71 -1.03 6.55 6.30 May-01-12
CCP Quant Fd 116.95 0.21 -0.48 -5.92 51.40 5.89 -12.33 40.16 55.16 2.67 Feb-01-13
Fir Tree Val Fd 155.77 0.28 3.27 3.40 3.02 5.09 9.67 -1.72 5.45 7.60 Feb-01-13
Luxor Capital 101.03 0.18 2.85 4.85 -6.60 3.28 -8.15 -8.15 Jun-01-14
Perry Capital Lp 111.46 0.20 -0.81 -1.33 -7.50 -0.64 12.81 -4.25 -6.92 0.71 Jun-01-13
Pharo Macro Fd 100.98 0.18 -0.39 -1.78 1.32 2.29 20.07 8.22 2.47 10.76 Jul-01-13
SRS Investment Management 52.13 0.09 5.17 9.09 6.94 6.94 Jan-01-15
Standard General 25.74 0.05 0.01 -0.51 0.27 -0.47 2.96 2.96 Jun-01-14
NYCERS-TOTAL PERMAL HEDGE FUNDS OF FUNDS 257.95 0.47 -0.09 1.68 3.90 2.48 5.35 3.23 7.74 5.10 3.90 5.93 3.80 Jul-01-11
HFRI Fund of Funds Composite Index + 1% 1.09 2.26 6.13 4.33 8.70 4.40 10.04 5.82 7.27 7.62 4.89 Jul-01-11
Excess -1.18 -0.58 -2.23 -1.85 -3.35 -1.17 -2.30 -0.73 -3.37 -1.69 -1.09
FIXED INCOME
NYCERS-TOTAL STRUCTURED 9,165.39 16.62 -0.33 -0.29 3.32 1.21 6.61 7.69 -1.73 6.92 8.85 9.42 3.54 3.45 5.32 5.66 8.21 Jan-01-85
NYC - Core Plus Five -0.37 -0.29 3.53 1.05 5.54 7.66 -2.79 5.41 9.40 7.13 3.64 2.70 4.66 5.22 Jan-01-85
Excess 0.04 0.01 -0.21 0.17 1.07 0.02 1.06 1.51 -0.55 2.28 -0.10 0.75 0.66 0.44
NYCERS-TOTAL MORTGAGE 3,508.23 6.36 -0.08 0.44 3.34 1.26 5.30 6.38 -0.84 4.26 6.19 9.12 3.64 2.86 4.07 5.16 7.06 Mar-01-87
CITIGROUP MORTGAGE INDEX -0.06 0.51 3.19 1.19 4.59 6.12 -1.52 2.60 6.38 5.50 3.47 2.21 3.32 4.72 6.67 Mar-01-87
Excess -0.02 -0.07 0.15 0.07 0.71 0.26 0.68 1.66 -0.19 3.63 0.17 0.65 0.75 0.44 0.39
56

Limited Access
Assets ($MM)
% of Total
Trailing1 Month
Trailing3 Month FYTD CYTD
FYE06/30/14
CYE12/31/14
CYE12/31/13
CYE12/31/12
CYE12/31/11
CYE12/31/10
Trailing1 Year
Trailing3 Year
Trailing5 Year
Trailing10 Year ITD
InceptionDate
Periods Ending May 31, 2015
New York City Employees' Retirement System
Manager / Benchmark Comparison Report
Rates of Return - Total
Neuberger Berman - Mortgage 1,049.95 1.90 -0.11 0.32 3.31 1.09 5.32 7.04 -1.21 3.64 5.73 3.67 2.76 3.84 4.03 Feb-01-10
CITIGROUP MORTGAGE INDEX -0.06 0.51 3.19 1.19 4.59 6.12 -1.52 2.60 6.38 3.47 2.21 3.32 3.50 Feb-01-10
Excess -0.05 -0.19 0.12 -0.10 0.73 0.92 0.31 1.04 -0.65 0.20 0.54 0.52 0.53Blackrock - Mortgage 1,189.33 2.16 -0.10 0.45 3.62 1.39 5.33 6.79 -0.68 5.79 6.04 8.81 3.92 3.29 4.65 5.39 5.89 Sep-01-00
CITIGROUP MORTGAGE INDEX -0.06 0.51 3.19 1.19 4.59 6.12 -1.52 2.60 6.38 5.50 3.47 2.21 3.32 4.72 5.35 Sep-01-00
Excess -0.04 -0.05 0.43 0.20 0.74 0.67 0.84 3.19 -0.33 3.31 0.44 1.07 1.33 0.67 0.54Wellington - Mortgage 510.86 0.93 0.00 0.48 3.51 1.20 4.87 6.87 -2.29 2.89 7.01 6.02 3.85 2.28 3.55 4.13 Aug-01-09
CITIGROUP MORTGAGE INDEX -0.06 0.51 3.19 1.19 4.59 6.12 -1.52 2.60 6.38 5.50 3.47 2.21 3.32 3.80 Aug-01-09
Excess 0.06 -0.02 0.32 0.02 0.28 0.75 -0.78 0.30 0.63 0.52 0.38 0.07 0.23 0.33Goldman Sachs - Mortgage 541.25 0.98 -0.08 0.50 3.27 1.25 4.87 6.35 -1.52 3.80 6.57 5.80 3.51 2.55 3.70 4.20 Aug-01-09
CITIGROUP MORTGAGE INDEX -0.06 0.51 3.19 1.19 4.59 6.12 -1.52 2.60 6.38 5.50 3.47 2.21 3.32 3.80 Aug-01-09
Excess -0.02 0.00 0.08 0.06 0.28 0.22 0.00 1.20 0.19 0.31 0.04 0.33 0.38 0.39Smith Breeden - Mortgage 216.92 0.39 0.00 0.53 3.65 1.39 4.95 6.48 -0.62 3.73 6.00 6.40 3.97 2.94 3.90 4.39 Aug-01-09
CITIGROUP MORTGAGE INDEX -0.06 0.51 3.19 1.19 4.59 6.12 -1.52 2.60 6.38 5.50 3.47 2.21 3.32 3.80 Aug-01-09
Excess 0.06 0.02 0.46 0.21 0.36 0.36 0.90 1.13 -0.38 0.90 0.50 0.73 0.58 0.59
NYCERS-TOTAL INVESTMENT GRADE CREDIT 4,540.21 8.23 -0.47 -0.68 2.78 1.27 8.36 7.72 -0.85 10.58 7.82 9.63 3.00 4.60 6.35 5.78 7.41 Jan-01-87
NYC - Investment Grade Credit -0.53 -0.62 2.64 1.06 7.17 7.04 -1.85 9.52 7.79 8.36 2.73 3.82 5.57 5.24 Jan-01-87
Excess 0.06 -0.05 0.14 0.21 1.19 0.68 1.00 1.05 0.03 1.27 0.27 0.78 0.77 0.54Prudential - Corp - Credit 1,191.36 2.16 -0.49 -0.70 2.86 1.05 7.51 7.62 -1.46 9.43 8.28 9.01 2.98 4.06 5.90 6.01 6.80 Oct-01-00
NYC - Investment Grade Credit -0.53 -0.62 2.64 1.06 7.17 7.04 -1.85 9.52 7.79 8.36 2.73 3.82 5.57 5.24 6.21 Oct-01-00
Excess 0.04 -0.08 0.22 -0.01 0.33 0.58 0.39 -0.09 0.48 0.65 0.25 0.24 0.32 0.77 0.59T. Rowe Price - Credit 871.01 1.58 -0.39 -0.46 3.34 1.90 9.12 8.05 -0.72 11.40 8.08 10.54 3.67 5.07 6.89 6.39 7.74 Jan-01-87
NYC - Investment Grade Credit -0.53 -0.62 2.64 1.06 7.17 7.04 -1.85 9.52 7.79 8.36 2.73 3.82 5.57 5.24 Jan-01-87
Excess 0.14 0.16 0.70 0.84 1.95 1.01 1.13 1.88 0.28 2.18 0.94 1.25 1.31 1.15Blackrock - Credit 868.21 1.57 -0.50 -0.71 2.76 1.19 8.08 7.53 -0.95 10.48 7.75 9.56 2.92 4.38 6.23 5.79 6.72 Oct-01-00
NYC - Investment Grade Credit -0.53 -0.62 2.64 1.06 7.17 7.04 -1.85 9.52 7.79 8.36 2.73 3.82 5.57 5.24 6.21 Oct-01-00
Excess 0.03 -0.08 0.12 0.12 0.91 0.49 0.90 0.96 -0.05 1.20 0.19 0.56 0.65 0.55 0.51Taplin Canida Habacht - Credit 762.70 1.38 -0.59 -1.05 1.66 0.76 9.32 7.92 -0.43 11.02 7.88 9.33 1.99 4.91 6.48 5.16 7.06 Jul-01-91
NYC - Investment Grade Credit -0.53 -0.62 2.64 1.06 7.17 7.04 -1.85 9.52 7.79 8.36 2.73 3.82 5.57 5.24 Jul-01-91
Excess -0.06 -0.43 -0.99 -0.30 2.15 0.88 1.42 1.50 0.09 0.97 -0.73 1.10 0.90 -0.08Barrow Hanley - Credit 654.29 1.19 -0.59 -0.84 2.55 1.24 8.89 7.62 -0.60 11.45 6.78 9.97 2.87 4.80 6.41 6.82 Sep-01-09
NYC - Investment Grade Credit -0.53 -0.62 2.64 1.06 7.17 7.04 -1.85 9.52 7.79 8.36 2.73 3.82 5.57 5.95 Sep-01-09
Excess -0.06 -0.22 -0.09 0.17 1.72 0.58 1.25 1.92 -1.01 1.61 0.14 0.99 0.84 0.87Prudential-Privest - Credit 192.64 0.35 0.28 0.71 4.99 2.22 5.92 7.27 0.00 4.91 3.53 Sep-01-12
NYC - Investment Grade Credit -0.53 -0.62 2.64 1.06 7.17 7.04 -1.85 2.73 2.86 Sep-01-12
Excess 0.82 1.34 2.35 1.16 -1.25 0.23 1.85 2.18 0.68
57

Limited Access
Assets ($MM)
% of Total
Trailing1 Month
Trailing3 Month FYTD CYTD
FYE06/30/14
CYE12/31/14
CYE12/31/13
CYE12/31/12
CYE12/31/11
CYE12/31/10
Trailing1 Year
Trailing3 Year
Trailing5 Year
Trailing10 Year ITD
InceptionDate
Periods Ending May 31, 2015
New York City Employees' Retirement System
Manager / Benchmark Comparison Report
Rates of Return - Total
NYCERS-TOTAL GOVERNMENT 1,116.95 2.02 -0.56 -0.98 5.49 0.91 4.35 11.76 -7.30 4.20 18.35 9.55 5.41 1.49 5.78 5.75 7.75 Jan-01-87
NYC - Treasury Agency Plus Five -0.60 -1.01 6.40 0.84 3.79 12.38 -7.48 3.84 18.44 9.24 6.19 1.55 5.78 5.71 Jan-01-87
Excess 0.04 0.03 -0.91 0.07 0.57 -0.62 0.18 0.36 -0.09 0.31 -0.78 -0.06 0.00 0.04Blackrock - Gov't 558.10 1.01 -0.52 -0.89 6.09 0.97 4.14 12.03 -7.21 3.99 18.59 9.14 5.94 1.62 5.84 6.07 Aug-01-09
NYC - Treasury Agency Plus Five -0.60 -1.01 6.40 0.84 3.79 12.38 -7.48 3.84 18.44 9.24 6.19 1.55 5.78 6.01 Aug-01-09
Excess 0.08 0.12 -0.31 0.13 0.35 -0.35 0.27 0.15 0.15 -0.10 -0.25 0.07 0.06 0.07State Street - Gov't 558.89 1.01 -0.60 -1.07 6.36 0.84 3.94 12.15 -7.51 3.96 18.51 8.93 6.22 1.50 5.72 5.80 8.03 Jun-01-87
NYC - Treasury Agency Plus Five -0.60 -1.01 6.40 0.84 3.79 12.38 -7.48 3.84 18.44 9.24 6.19 1.55 5.78 5.71 Jun-01-87
Excess 0.00 -0.06 -0.04 0.00 0.16 -0.22 -0.03 0.12 0.07 -0.31 0.03 -0.05 -0.06 0.10
HIGH YIELD
NYCERS-TOTAL ENHANCED YIELD 2,100.73 3.81 0.38 1.09 1.34 4.54 12.88 2.94 8.31 14.56 5.73 14.24 2.39 8.55 9.41 8.08 8.24 Oct-01-94
CITIGROUP BB & B 0.47 1.16 1.76 4.26 10.91 2.78 6.17 14.45 6.58 13.35 2.50 7.59 8.97 6.81 7.29 Oct-01-94
Excess -0.09 -0.06 -0.42 0.28 1.97 0.15 2.14 0.11 -0.85 0.89 -0.11 0.96 0.44 1.27 0.95Loomis, Sayles - High Yield 420.62 0.76 0.35 1.24 0.80 5.28 17.28 5.23 12.60 18.69 7.60 16.36 2.69 11.86 12.18 10.05 9.82 Feb-01-95
NYC-Loomis (BoA MLMSTII 7-03/BB&B PRIOR) 0.30 0.96 0.99 4.08 11.80 2.50 7.42 15.58 4.38 15.19 1.84 8.07 9.03 8.12 Feb-01-95
Excess 0.06 0.28 -0.19 1.20 5.48 2.72 5.18 3.10 3.22 1.17 0.85 3.79 3.16 1.93Oaktree - High Yield 334.62 0.61 0.43 0.91 1.17 4.13 11.28 1.94 1.91 5.01 Feb-01-13
BofAML HYM CONSTRAINED (DAILY) 0.29 0.96 1.00 4.08 11.79 2.51 1.86 5.41 Feb-01-13
Excess 0.13 -0.05 0.17 0.05 -0.51 -0.57 0.06 -0.39NEUBERGER BERMAN - HIGH YIELD 353.32 0.64 0.25 0.55 1.28 4.01 12.72 2.52 8.38 2.23 7.24 Sep-01-12
BofAML HIGH YIELD MASTER II (DAILY) 0.30 0.96 0.99 4.08 11.80 2.50 7.42 1.84 6.84 Sep-01-12
Excess -0.04 -0.41 0.29 -0.07 0.92 0.01 0.96 0.39 0.40Stone Harbor - High Yield 207.63 0.38 0.10 0.43 -0.69 3.84 12.30 1.34 7.95 0.27 6.36 Oct-01-12
BofAML HIGH YIELD MASTER II (DAILY) 0.30 0.96 0.99 4.08 11.80 2.50 7.42 1.84 6.49 Oct-01-12
Excess -0.20 -0.52 -1.68 -0.24 0.50 -1.16 0.53 -1.57 -0.13T. Rowe Price - Enhanced Yield 356.55 0.65 0.68 1.62 2.63 4.80 11.94 3.28 7.51 13.95 4.96 14.14 3.47 8.59 9.11 8.12 8.97 Jan-01-95
CITIGROUP BB & B 0.47 1.16 1.76 4.26 10.91 2.78 6.17 14.45 6.58 13.35 2.50 7.59 8.97 6.81 7.37 Jan-01-95
Excess 0.21 0.46 0.87 0.54 1.03 0.50 1.34 -0.51 -1.62 0.80 0.97 1.00 0.14 1.31 1.61Shenkman - High Yield 177.70 0.32 0.42 1.60 3.35 4.90 10.77 3.28 5.83 11.77 5.34 11.70 4.03 7.43 8.16 7.20 7.31 Oct-01-03
CITIGROUP BB & B 0.47 1.16 1.76 4.26 10.91 2.78 6.17 14.45 6.58 13.35 2.50 7.59 8.97 6.81 7.19 Oct-01-03
Excess -0.05 0.44 1.59 0.64 -0.14 0.50 -0.34 -2.68 -1.24 -1.65 1.53 -0.16 -0.81 0.39 0.12
58

Limited Access
Assets ($MM)
% of Total
Trailing1 Month
Trailing3 Month FYTD CYTD
FYE06/30/14
CYE12/31/14
CYE12/31/13
CYE12/31/12
CYE12/31/11
CYE12/31/10
Trailing1 Year
Trailing3 Year
Trailing5 Year
Trailing10 Year ITD
InceptionDate
Periods Ending May 31, 2015
New York City Employees' Retirement System
Manager / Benchmark Comparison Report
Rates of Return - Total
Penn Capital Mgt 129.49 0.23 0.29 1.29 0.55 4.35 11.32 1.18 6.26 1.31 5.89 Sep-01-12
CITIGROUP BB & B 0.47 1.16 1.76 4.26 10.91 2.78 6.17 2.50 6.38 Sep-01-12
Excess -0.18 0.13 -1.21 0.09 0.41 -1.60 0.09 -1.19 -0.49Fort Washington 120.79 0.22 0.43 1.38 1.70 4.77 11.35 2.44 5.89 2.45 6.46 Sep-01-12
CITIGROUP BB & B 0.47 1.16 1.76 4.26 10.91 2.78 6.17 2.50 6.38 Sep-01-12
Excess -0.04 0.22 -0.06 0.51 0.44 -0.34 -0.28 -0.04 0.09
BANK LOANS
NYCERS-TOTAL BANK LOANS 1,007.94 1.83 0.24 1.67 3.54 3.44 6.38 2.58 6.41 4.13 5.15 Dec-01-12
CSFB LEVERAGED LOAN INDEX 0.20 1.50 2.47 3.19 6.11 2.06 6.15 3.09 4.87 Dec-01-12
Excess 0.04 0.17 1.07 0.25 0.27 0.52 0.26 1.04 0.28Babson BL 277.06 0.50 0.26 1.69 3.23 3.42 6.31 2.34 6.33 3.75 5.15 Dec-01-12
CSFB LEVERAGED LOAN INDEX 0.20 1.50 2.47 3.19 6.11 2.06 6.15 3.09 4.87 Dec-01-12
Excess 0.06 0.19 0.75 0.22 0.20 0.28 0.18 0.66 0.28Credit Suisse BL 277.26 0.50 0.29 1.94 4.32 3.82 5.94 2.90 4.90 5.08 Feb-01-13
CSFB LEVERAGED LOAN INDEX 0.20 1.50 2.47 3.19 6.11 2.06 3.09 4.40 Feb-01-13
Excess 0.09 0.44 1.84 0.63 -0.17 0.84 1.81 0.68Guggenheim BL 178.24 0.32 0.26 1.61 4.19 3.41 7.24 3.30 4.77 5.71 Mar-01-13
CSFB LEVERAGED LOAN INDEX 0.20 1.50 2.47 3.19 6.11 2.06 3.09 4.38 Mar-01-13
Excess 0.06 0.11 1.72 0.22 1.13 1.25 1.68 1.33Invesco BL 275.38 0.50 0.17 1.42 2.68 3.10 6.35 2.03 3.36 4.47 Feb-01-13
CSFB LEVERAGED LOAN INDEX 0.20 1.50 2.47 3.19 6.11 2.06 3.09 4.40 Feb-01-13
Excess -0.03 -0.08 0.21 -0.10 0.24 -0.03 0.27 0.06
59

Limited Access
Assets ($MM)
% of Total
Trailing1 Month
Trailing3 Month FYTD CYTD
FYE06/30/14
CYE12/31/14
CYE12/31/13
CYE12/31/12
CYE12/31/11
CYE12/31/10
Trailing1 Year
Trailing3 Year
Trailing5 Year
Trailing10 Year ITD
InceptionDate
Periods Ending May 31, 2015
New York City Employees' Retirement System
Manager / Benchmark Comparison Report
Rates of Return - Total
TIPS
NYCERS-TOTAL TIPS MANAGERS 1,777.84 3.22 -0.73 -0.48 -0.61 1.63 4.57 3.50 -8.42 7.25 13.50 6.47 -0.30 -0.42 3.92 4.46 4.46 Jun-01-05
Barclays Global Inflation Linked: US TIPS (Daily) -0.82 -0.56 -0.77 1.33 4.44 3.64 -8.61 6.98 13.56 6.31 -0.47 -0.62 3.79 4.28 4.28 Jun-01-05
Excess 0.09 0.08 0.15 0.30 0.13 -0.14 0.19 0.27 -0.06 0.16 0.16 0.21 0.13 0.19 0.19State Street TIPS MTA 1,344.49 2.44 -0.75 -0.49 -0.72 1.48 4.61 3.58 -8.54 6.87 13.61 6.34 -0.39 -0.56 3.82 4.55 Aug-01-05
Barclays Global Inflation Linked: US TIPS (Daily) -0.82 -0.56 -0.77 1.33 4.44 3.64 -8.61 6.98 13.56 6.31 -0.47 -0.62 3.79 4.53 Aug-01-05
Excess 0.07 0.07 0.04 0.15 0.17 -0.06 0.06 -0.11 0.05 0.03 0.08 0.06 0.03 0.02Blackrock TIPS MTA 432.95 0.78 -0.69 -0.39 -0.34 1.57 4.58 3.80 -8.21 6.42 13.82 6.34 -0.06 -0.37 3.88 4.86 Dec-01-05
Barclays Global Inflation Linked: US TIPS (Daily) -0.82 -0.56 -0.77 1.33 4.44 3.64 -8.61 6.98 13.56 6.31 -0.47 -0.62 3.79 4.58 Dec-01-05
Excess 0.13 0.17 0.42 0.24 0.14 0.16 0.40 -0.56 0.26 0.03 0.41 0.26 0.09 0.28
CONVERTIBLE BONDS
NYCERS-TOTAL CONVERTIBLE BONDS 550.01 1.00 1.50 1.97 5.59 4.54 16.30 8.42 16.33 11.66 -3.02 14.54 7.00 12.58 9.98 7.11 Jun-01-08
BofAML ALL CONVERTIBLE EX M AI (DAILY) 2.22 2.82 5.75 6.10 24.91 9.33 25.00 14.41 -3.42 16.52 8.71 16.60 12.69 8.96 Jun-01-08
Excess -0.72 -0.85 -0.15 -1.56 -8.61 -0.91 -8.68 -2.76 0.39 -1.98 -1.72 -4.02 -2.71 -1.85Advent Conv Bonds 339.91 0.62 0.90 1.49 3.23 4.28 13.71 5.22 13.96 11.69 -1.59 14.96 4.38 10.50 8.90 7.76 Jun-01-08
BofA ML U.S. Convertible - Yield Alternatives 0.09 0.87 -0.48 2.65 11.12 2.75 10.33 12.21 -1.73 12.98 0.32 8.01 6.98 6.28 Jun-01-08
Excess 0.81 0.62 3.72 1.63 2.60 2.47 3.63 -0.52 0.14 1.97 4.06 2.49 1.91 1.48Victory - Conv Bonds 210.10 0.38 2.49 2.75 9.67 4.97 21.08 14.10 20.67 10.42 -3.05 11.63 11.53 15.85 11.45 7.89 Jul-01-08
BofA Merrill Lynch US Investment Grade Convertible Bond Index 2.68 3.51 10.98 5.20 22.60 15.69 21.40 11.89 -3.14 7.88 12.79 16.78 11.62 6.99 Jul-01-08
Excess -0.20 -0.76 -1.32 -0.23 -1.52 -1.59 -0.73 -1.48 0.09 3.74 -1.25 -0.94 -0.17 0.91
FIXED INCOME EMERGING / DEVELOPING MANAGERS
NYCERS-TOTAL PROGRESS FIXED 111.92 0.20 -0.41 -0.30 2.76 1.08 4.92 6.18 -1.76 5.51 8.39 7.43 2.76 2.56 4.47 5.41 6.23 Jan-01-92
Barclays Aggregate (Daily) -0.24 -0.14 2.98 1.00 4.37 5.97 -2.02 4.21 7.84 6.54 3.03 2.21 3.90 4.61 5.93 Jan-01-92
Excess -0.17 -0.17 -0.22 0.08 0.54 0.22 0.26 1.29 0.55 0.89 -0.27 0.35 0.58 0.80 0.30
LM Capital 279.20 0.51 -0.12 0.08 3.08 1.50 5.12 5.84 -1.54 6.23 8.11 7.47 3.44 3.04 4.82 5.90 May-01-09
Barclays Aggregate (Daily) -0.24 -0.14 2.98 1.00 4.37 5.97 -2.02 4.21 7.84 6.54 3.03 2.21 3.90 4.70 May-01-09
Excess 0.12 0.21 0.09 0.50 0.75 -0.13 0.49 2.02 0.27 0.92 0.40 0.83 0.93 1.20
60

Limited Access
Assets ($MM)
% of Total
Trailing1 Month
Trailing3 Month FYTD CYTD
FYE06/30/14
CYE12/31/14
CYE12/31/13
CYE12/31/12
CYE12/31/11
CYE12/31/10
Trailing1 Year
Trailing3 Year
Trailing5 Year
Trailing10 Year ITD
InceptionDate
Periods Ending May 31, 2015
New York City Employees' Retirement System
Manager / Benchmark Comparison Report
Rates of Return - Total
GIA 100.18 0.18 May-01-15
Barclays Aggregate (Daily) May-01-15
Excess
OPPORTUNISTIC FIXED
NYCERS-TOTAL OPPORTUNISTIC FIXED 1,312.27 2.38 0.40 1.15 2.09 1.17 14.77 8.15 17.55 20.49 -4.40 26.01 3.30 11.06 11.31 Oct-01-07
10% Annual Return 0.80 2.41 9.13 4.05 10.00 10.00 10.00 10.00 10.00 10.00 10.00 10.00 10.00 Oct-01-07
Excess -0.40 -1.27 -7.04 -2.88 4.77 -1.85 7.55 10.49 -14.40 16.01 -6.70 1.06 1.31
NYCERS-TOTAL FUND STRATEGIES 330.92 0.60 -1.62 -1.96 9.25 3.28 14.34 15.84 12.91 29.32 -5.33 21.05 11.39 13.22 13.27 Oct-01-07
10% Annual Return 0.80 2.41 9.13 4.05 10.00 10.00 10.00 10.00 10.00 10.00 10.00 10.00 10.00 Oct-01-07
Excess -2.42 -4.38 0.12 -0.77 4.34 5.84 2.91 19.32 -15.33 11.05 1.39 3.22 3.27Avenue Europe Special Sit. Fund, L.P. 0.91 0.00 Oct-01-08
10% Annual Return Oct-01-08
Excess
Avenue Special Situations Fund V, L.P. 0.79 0.00 Oct-01-07
10% Annual Return Oct-01-07
Excess
Ave Special Situation Fd VI 53.42 0.10 1.02 0.96 2.22 0.96 15.16 11.08 10.19 19.30 2.22 8.66 5.14 Aug-01-11
10% Annual Return 0.80 2.41 9.13 4.05 10.00 10.00 10.00 10.00 10.00 10.00 10.00 Aug-01-11
Excess 0.22 -1.45 -6.91 -3.09 5.16 1.08 0.19 9.30 -7.78 -1.34 -4.87Fortress Ctr St Ptnrs 111.90 0.20 -5.22 -5.22 10.67 5.30 9.41 10.91 19.64 10.67 12.05 11.70 May-01-12
10% Annual Return 0.80 2.41 9.13 4.05 10.00 10.00 10.00 10.00 10.00 9.99 May-01-12
Excess -6.02 -7.63 1.54 1.25 -0.59 0.91 9.64 0.67 2.05 1.71Lone Star Fd VIII 59.49 0.11 Nov-01-13
10% Annual Return Nov-01-13
Excess
Oaktree Opp Fd IX 91.17 0.17 0.00 -1.58 -2.98 -3.49 10.56 9.69 -2.98 2.64 Apr-01-13
10% Annual Return 0.80 2.41 9.13 4.05 10.00 10.00 10.00 10.00 Apr-01-13
Excess -0.80 -3.99 -12.11 -7.54 0.56 -0.31 -12.98 -7.36Brightwood Capital Advisors III, LP 13.24 0.02 Apr-01-15
10% Annual Return Apr-01-15
Excess
61
Limited Access
Assets ($MM)
% of Total
Trailing1 Month
Trailing3 Month FYTD CYTD
FYE06/30/14
CYE12/31/14
CYE12/31/13
CYE12/31/12
CYE12/31/11
CYE12/31/10
Trailing1 Year
Trailing3 Year
Trailing5 Year
Trailing10 Year ITD
InceptionDate
Periods Ending May 31, 2015
New York City Employees' Retirement System
Manager / Benchmark Comparison Report
Rates of Return - Total
NYCERS-TOTAL STRATEGIC MANDATES 981.36 1.78 1.11 2.25 -0.12 0.47 14.70 5.87 18.63 16.95 0.83 10.57 12.08 Jan-01-12
10% Annual Return 0.80 2.41 9.13 4.05 10.00 10.00 10.00 10.00 10.00 10.00 10.01 Jan-01-12
Excess 0.31 -0.16 -9.25 -3.58 4.70 -4.13 8.63 6.95 -9.17 0.57 2.07Angelo Gordon Ct St Ptnrs 145.79 0.26 0.94 2.01 -3.62 -1.20 17.03 5.17 26.25 -1.73 9.69 Jul-01-12
10% Annual Return 0.80 2.41 9.13 4.05 10.00 10.00 10.00 10.00 10.00 Jul-01-12
Excess 0.14 -0.40 -12.75 -5.25 7.03 -4.83 16.25 -11.73 -0.31Apollo Centre Street Partnership, L.P 149.68 0.27 0.91 -1.03 -5.24 -4.70 16.08 7.01 18.38 -5.21 6.48 6.30 May-01-12
10% Annual Return 0.80 2.41 9.13 4.05 10.00 10.00 10.00 10.00 10.00 9.99 May-01-12
Excess 0.11 -3.44 -14.37 -8.75 6.08 -2.99 8.38 -15.21 -3.52 -3.70Contrarian Partnership, L.P 45.56 0.08 1.48 3.13 -5.45 0.58 10.08 0.49 -5.03 2.11 Jul-01-13
10% Annual Return 0.80 2.41 9.13 4.05 10.00 10.00 10.00 9.99 Jul-01-13
Excess 0.68 0.72 -14.58 -3.48 0.08 -9.51 -15.03 -7.89Golden Tree OD 172.93 0.31 0.35 2.21 6.15 5.01 11.90 7.14 9.92 15.67 7.07 10.72 11.06 Jan-01-12
10% Annual Return 0.80 2.41 9.13 4.05 10.00 10.00 10.00 10.00 10.00 10.00 10.01 Jan-01-12
Excess -0.45 -0.20 -2.98 0.96 1.90 -2.86 -0.08 5.67 -2.93 0.72 1.05NYCERS-MARATHON 266.87 0.48 1.55 3.14 0.59 1.20 15.31 5.79 22.15 25.44 1.73 13.93 15.61 Jan-01-12
10% Annual Return 0.80 2.41 9.13 4.05 10.00 10.00 10.00 10.00 10.00 10.00 10.01 Jan-01-12
Excess 0.75 0.73 -8.54 -2.85 5.31 -4.21 12.15 15.44 -8.27 3.93 5.60Oak Hill Ctr St Ptnrs 154.17 0.28 1.37 4.32 2.52 1.26 13.92 6.23 16.62 3.37 8.73 Oct-01-12
10% Annual Return 0.80 2.41 9.13 4.05 10.00 10.00 10.00 10.00 10.00 Oct-01-12
Excess 0.57 1.91 -6.61 -2.79 3.92 -3.77 6.62 -6.63 -1.28Ares Centre Street 46.36 0.08 1.43 1.62 7.03 7.03 Jan-01-15
10% Annual Return 0.80 2.41 4.05 4.05 Jan-01-15
Excess 0.63 -0.80 2.98 2.98
OTHER FIXED INCOME
TOTAL EMPLOYEES ETI (w/o cash) 645.34 1.17 -0.42 0.04 3.17 1.10 8.40 8.26 2.35 6.18 6.66 6.88 3.48 4.99 5.46 6.14 8.36 Dec-01-84
Employees Custom Benchmark (No Cash) -0.13 0.33 3.16 1.14 4.61 6.03 -1.64 3.41 7.66 6.47 3.36 2.27 3.81 4.85 Dec-01-84
Excess -0.30 -0.28 0.00 -0.04 3.79 2.22 3.98 2.77 -1.00 0.41 0.12 2.73 1.65 1.29AFL-CIO HOUSING INV TRUST 238.27 0.43 -0.05 0.26 3.21 1.35 4.45 6.10 -2.37 4.27 7.86 6.16 3.51 2.22 3.89 4.62 4.60 Oct-01-02
Barclays Aggregate (Daily) -0.24 -0.14 2.98 1.00 4.37 5.97 -2.02 4.21 7.84 6.54 3.03 2.21 3.90 4.61 4.59 Oct-01-02
Excess 0.19 0.40 0.23 0.35 0.08 0.14 -0.35 0.06 0.02 -0.39 0.48 0.01 0.00 0.01 0.01
62
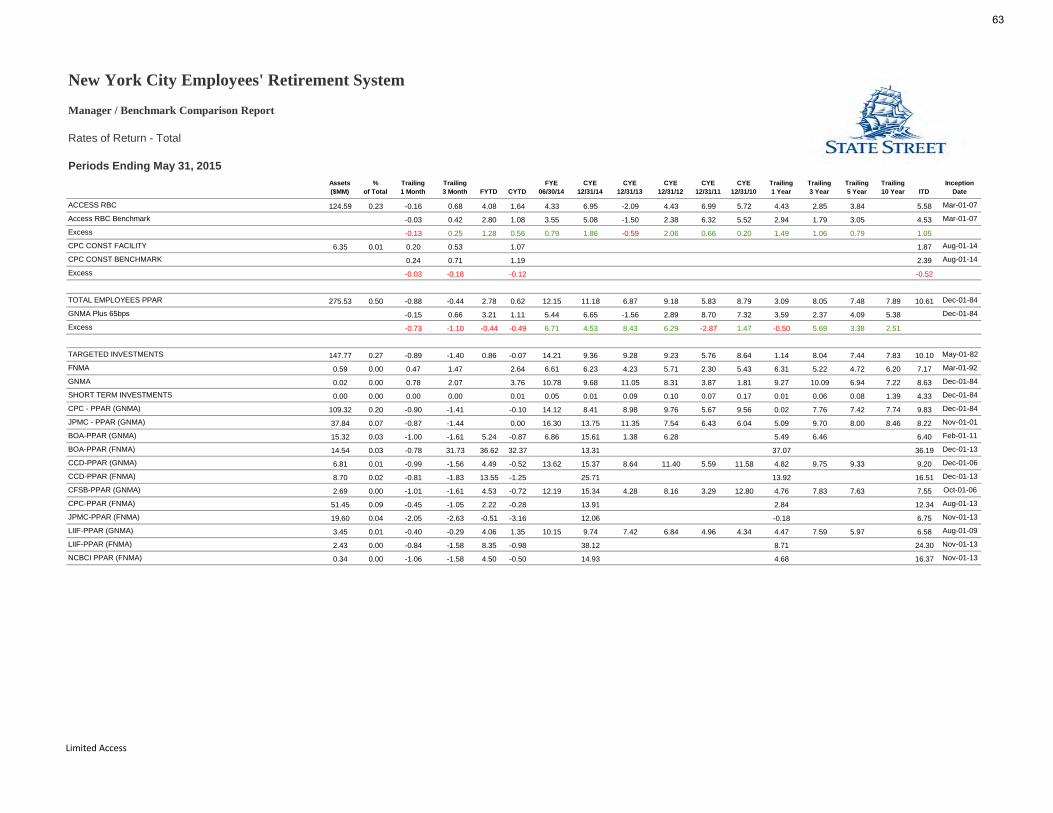
Limited Access
Assets ($MM)
% of Total
Trailing1 Month
Trailing3 Month FYTD CYTD
FYE06/30/14
CYE12/31/14
CYE12/31/13
CYE12/31/12
CYE12/31/11
CYE12/31/10
Trailing1 Year
Trailing3 Year
Trailing5 Year
Trailing10 Year ITD
InceptionDate
Periods Ending May 31, 2015
New York City Employees' Retirement System
Manager / Benchmark Comparison Report
Rates of Return - Total
ACCESS RBC 124.59 0.23 -0.16 0.68 4.08 1.64 4.33 6.95 -2.09 4.43 6.99 5.72 4.43 2.85 3.84 5.58 Mar-01-07
Access RBC Benchmark -0.03 0.42 2.80 1.08 3.55 5.08 -1.50 2.38 6.32 5.52 2.94 1.79 3.05 4.53 Mar-01-07
Excess -0.13 0.25 1.28 0.56 0.79 1.86 -0.59 2.06 0.66 0.20 1.49 1.06 0.79 1.05CPC CONST FACILITY 6.35 0.01 0.20 0.53 1.07 1.87 Aug-01-14
CPC CONST BENCHMARK 0.24 0.71 1.19 2.39 Aug-01-14
Excess -0.03 -0.18 -0.12 -0.52
TOTAL EMPLOYEES PPAR 275.53 0.50 -0.88 -0.44 2.78 0.62 12.15 11.18 6.87 9.18 5.83 8.79 3.09 8.05 7.48 7.89 10.61 Dec-01-84
GNMA Plus 65bps -0.15 0.66 3.21 1.11 5.44 6.65 -1.56 2.89 8.70 7.32 3.59 2.37 4.09 5.38 Dec-01-84
Excess -0.73 -1.10 -0.44 -0.49 6.71 4.53 8.43 6.29 -2.87 1.47 -0.50 5.69 3.38 2.51
TARGETED INVESTMENTS 147.77 0.27 -0.89 -1.40 0.86 -0.07 14.21 9.36 9.28 9.23 5.76 8.64 1.14 8.04 7.44 7.83 10.10 May-01-82
FNMA 0.59 0.00 0.47 1.47 2.64 6.61 6.23 4.23 5.71 2.30 5.43 6.31 5.22 4.72 6.20 7.17 Mar-01-92
GNMA 0.02 0.00 0.78 2.07 3.76 10.78 9.68 11.05 8.31 3.87 1.81 9.27 10.09 6.94 7.22 8.63 Dec-01-84
SHORT TERM INVESTMENTS 0.00 0.00 0.00 0.00 0.01 0.05 0.01 0.09 0.10 0.07 0.17 0.01 0.06 0.08 1.39 4.33 Dec-01-84
CPC - PPAR (GNMA) 109.32 0.20 -0.90 -1.41 -0.10 14.12 8.41 8.98 9.76 5.67 9.56 0.02 7.76 7.42 7.74 9.83 Dec-01-84
JPMC - PPAR (GNMA) 37.84 0.07 -0.87 -1.44 0.00 16.30 13.75 11.35 7.54 6.43 6.04 5.09 9.70 8.00 8.46 8.22 Nov-01-01
BOA-PPAR (GNMA) 15.32 0.03 -1.00 -1.61 5.24 -0.87 6.86 15.61 1.38 6.28 5.49 6.46 6.40 Feb-01-11
BOA-PPAR (FNMA) 14.54 0.03 -0.78 31.73 36.62 32.37 13.31 37.07 36.19 Dec-01-13
CCD-PPAR (GNMA) 6.81 0.01 -0.99 -1.56 4.49 -0.52 13.62 15.37 8.64 11.40 5.59 11.58 4.82 9.75 9.33 9.20 Dec-01-06
CCD-PPAR (FNMA) 8.70 0.02 -0.81 -1.83 13.55 -1.25 25.71 13.92 16.51 Dec-01-13
CFSB-PPAR (GNMA) 2.69 0.00 -1.01 -1.61 4.53 -0.72 12.19 15.34 4.28 8.16 3.29 12.80 4.76 7.83 7.63 7.55 Oct-01-06
CPC-PPAR (FNMA) 51.45 0.09 -0.45 -1.05 2.22 -0.28 13.91 2.84 12.34 Aug-01-13
JPMC-PPAR (FNMA) 19.60 0.04 -2.05 -2.63 -0.51 -3.16 12.06 -0.18 6.75 Nov-01-13
LIIF-PPAR (GNMA) 3.45 0.01 -0.40 -0.29 4.06 1.35 10.15 9.74 7.42 6.84 4.96 4.34 4.47 7.59 5.97 6.58 Aug-01-09
LIIF-PPAR (FNMA) 2.43 0.00 -0.84 -1.58 8.35 -0.98 38.12 8.71 24.30 Nov-01-13
NCBCI PPAR (FNMA) 0.34 0.00 -1.06 -1.58 4.50 -0.50 14.93 4.68 16.37 Nov-01-13
63

Limited Access
Assets ($MM)
% of Total
Trailing1 Month
Trailing3 Month FYTD CYTD
FYE06/30/14
CYE12/31/14
CYE12/31/13
CYE12/31/12
CYE12/31/11
CYE12/31/10
Trailing1 Year
Trailing3 Year
Trailing5 Year
Trailing10 Year ITD
InceptionDate
Periods Ending May 31, 2015
New York City Employees' Retirement System
Manager / Benchmark Comparison Report
Rates of Return - Total
NCBCI-PPAR (GNMA) 1.80 0.00 -1.06 -1.59 5.67 -0.39 17.34 16.66 11.82 9.46 8.50 4.10 6.15 11.32 9.16 8.98 Aug-01-09
NHS-PPAR (GNMA) 1.24 0.00 -0.92 -1.48 4.43 0.26 13.20 13.73 8.83 9.68 3.85 9.95 4.79 9.62 7.68 8.96 Oct-01-07
CASH
NYCERS-TOTAL CASH 1,757.95 3.19 0.06 0.16 0.44 0.23 0.22 0.34 0.43 0.90 0.89 0.48 0.46 0.41 0.54 2.08 2.16 Apr-01-04
91 DAY TREASURY BILL (DAILY) 0.00 0.00 0.02 0.01 0.05 0.03 0.07 0.11 0.10 0.13 0.02 0.07 0.08 1.45 1.50 Apr-01-04
Excess 0.06 0.16 0.42 0.22 0.16 0.30 0.35 0.79 0.79 0.35 0.43 0.34 0.46 0.62 0.66EMPLOYEES' SHORT TERM 1,755.03 3.18 0.06 0.16 0.49 0.28 0.21 0.36 0.19 0.56 0.92 0.26 0.51 0.35 0.44 2.01 Apr-01-82
91 DAY T-BILL 0.00 0.00 0.00 0.00 0.05 0.02 0.08 0.11 0.11 0.14 0.01 0.06 0.08 1.44 Apr-01-82
Excess 0.06 0.16 0.49 0.28 0.16 0.34 0.11 0.45 0.81 0.12 0.50 0.29 0.36 0.57C/D - Fail Float Earnings 2.92 0.01 Apr-01-04
SECURITY LENDING -1.16 0.00 Apr-01-04
PRIVATE EQUITY
NYCERS-TOTAL PRIVATE EQUITY 4,046.75 7.34 2.79 5.66 10.97 6.14 15.21 13.99 8.08 12.74 13.78 14.02 12.52 11.99 12.33 9.91 12.08 Apr-01-04
NYC R3000 +3% Lagged 25.27 21.24 24.53 35.20 5.55 15.96Excess -10.06 -7.26 -16.45 -22.47 8.23 -1.95
REAL ASSETS
NYCERS-TOTAL REAL ASSETS 2,656.20 4.82 1.24 4.77 15.10 7.79 13.24 15.48 12.61 14.43 22.28 8.46 16.05 14.26 17.02 8.89 8.89 Apr-01-04
NYCERS-TOTAL PRIVATE REAL ESTATE 2,544.14 4.61 1.25 4.74 15.11 7.78 13.19 15.44 12.61 14.43 22.28 8.46 16.05 14.25 17.01 8.89 8.88 Apr-01-04
NCREIF NFI-ODCE NET + 100 BP 0.08 3.41 10.46 3.58 12.85 12.56 14.02 10.88 16.09 13.52 12.70 Apr-01-04
Excess 1.17 1.34 4.65 4.20 0.34 2.88 -1.41 3.55 6.19 2.53 1.55NYCERS-TOTAL INFRASTRUCTURE 112.06 0.20 0.86 7.59 15.60 9.32 20.16 17.54 19.96 Dec-01-13
CPI + 4% 0.77 1.78 3.52 1.97 4.70 5.21 4.89 Dec-01-13
Excess 0.08 5.81 12.08 7.35 15.45 12.34 15.07
NYCERS-TOTAL EMPLOYEES 55,159.95 100.00 0.36 1.09 4.62 3.57 17.03 7.34 15.73 13.41 1.13 13.79 6.33 12.11 10.90 7.15 8.93 Jul-01-87
Employees Policy Benchmark 0.53 0.87 5.23 3.76 16.72 8.15 15.33 13.39 2.14 13.84 6.74 12.39 11.49 7.35 Jul-01-87
Excess -0.17 0.23 -0.61 -0.19 0.31 -0.81 0.40 0.02 -1.01 -0.04 -0.40 -0.28 -0.59 -0.20
64

StepStone Group LP
New York City Employees' Retirement SystemPrivate Equity Portfolio
As of December 31, 2014 (in USD)
Vintage Year
Investment First Drawdown Committed
Capital Contributed
Capital Distributed
Capital Market Value Multiple IRR
Active Investments1998 VS&A Communications Partners III, L.P. 12/15/1998 50,000,000$ 50,248,403$ 68,324,143$ 760,271$ 1.37x 6.3%1999 Cypress Merchant Banking Partners II, L.P. 3/29/1999 45,172,972 53,861,600 43,440,706 7,591,322 0.95x (1.0%)1999 FdG Capital Partners LLC 6/2/1999 25,000,000 28,756,835 42,947,883 4,464,067 1.65x 14.6%1999 Lincolnshire Equity Fund II, L.P. 10/20/1999 18,397,347 19,261,466 36,463,088 1,202,526 1.96x 24.6%2000 Carlyle Partners III, L.P. 3/1/2000 45,423,105 55,645,609 108,817,410 - 1.96x 20.5%2000 Solera Partners, L.P. 5/26/2000 19,999,779 26,311,626 41,635,156 11,058,616 2.00x 10.6%2000 SCP Private Equity Partners II, L.P. 6/15/2000 27,442,463 30,827,225 9,060,182 7,071,717 0.52x (8.8%)2001 New Mountain Partners, L.P. 3/16/2001 18,141,933 17,116,468 24,431,489 464,986 1.45x 12.4%2001 Apollo Investment Fund V, L.P. 4/13/2001 40,000,000 62,509,880 122,768,943 2,265,450 2.00x 38.6%2001 RRE Ventures III, L.P. 7/6/2001 19,999,999 26,134,419 31,969,988 4,552,632 1.40x 6.2%2002 Yucaipa American Alliance Fund I, LP 7/1/2002 90,000,000 114,094,892 78,726,419 66,674,604 1.27x 6.4%2002 Thomas, McNerney & Partners, L.P. 10/9/2002 20,000,000 19,600,000 7,003,139 6,309,179 0.68x (7.8%)2002 BDCM Opportunity Fund, L.P. 10/14/2002 25,000,000 52,554,619 88,799,411 1,377,025 1.72x 22.8%2002 Landmark Equity Partners XI, L.P. 10/23/2002 55,000,000 52,284,778 73,905,582 7,143,977 1.55x 23.8%2003 FS Equity Partners V, L.P. 1/20/2003 25,000,000 22,894,666 38,934,406 8,146,788 2.06x 16.5%2003 Blackstone Capital Partners IV, L.P. 2/26/2003 34,418,762 38,818,058 93,275,713 5,052,059 2.53x 39.7%2003 Ares Corporate Opportunities Fund, L.P. 4/1/2003 45,000,000 54,008,942 76,277,238 5,537,537 1.51x 13.5%2004 Markstone Capital Partners, LP 1/30/2004 40,000,000 46,899,103 19,568,130 11,775,081 0.67x (12.0%)2004 FdG Capital Partners II LP 8/30/2004 35,000,000 37,115,171 41,665,122 4,972,853 1.26x 4.5%2004 Paladin Homeland Security Fund (NY City), L.P. 9/27/2004 15,000,000 16,127,481 3,768,534 4,969,487 0.54x (8.9%)2004 Lincolnshire Equity Fund III, L.P. 10/1/2004 55,000,000 52,399,965 67,756,658 29,527,218 1.86x 32.1%2004 New York/Fairview Emerging Managers Fund, L.P.-Tranche 1 10/21/2004 32,000,000 31,906,207 15,217,487 21,594,295 1.15x 3.0%2005 Palladium Equity Partners III, L.P. 11/12/2004 35,000,000 34,757,061 48,554,867 25,180,893 2.12x 20.4%2004 Aurora Equity Partners III L.P. 11/16/2004 50,000,000 54,119,877 86,237,201 4,090,599 1.67x 14.2%2004 Trilantic Capital Partners III L.P. 11/18/2004 45,088,848 39,477,498 58,031,997 2,069,412 1.52x 12.7%2004 Celtic Pharmaceutical Holdings L.P. 12/23/2004 25,000,000 25,402,094 402,094 15,195,734 0.61x (6.4%)2005 New Mountain Partners II, L.P. 1/12/2005 46,451,615 41,391,315 71,493,739 7,306,073 1.90x 13.4%2005 VSS Communications Partners IV, L.P. 3/14/2005 25,000,000 28,201,361 13,413,192 9,115,939 0.80x (4.1%)2005 Prism Venture Partners V-A, L.P. 7/14/2005 30,000,000 30,299,779 11,824,675 12,135,973 0.79x (4.9%)2005 Erasmus New York City Growth Fund 8/16/2005 34,819,694 34,819,694 29,838,461 276,897 0.86x (3.0%)2005 Quadrangle Capital Partners II LP 8/29/2005 60,636,859 60,814,632 60,128,047 19,736,420 1.31x 5.9%2005 Snow Phipps Group, L.P. 9/7/2005 20,000,000 22,769,565 15,018,665 14,341,019 1.29x 7.8%2005 GI Partners Fund II L.P. 9/26/2005 35,000,000 35,310,176 38,962,335 13,481,149 1.49x 7.0%2005 Blackstone Mezzanine Partners II, L.P. 10/10/2005 25,000,000 23,444,177 28,037,339 2,597,927 1.31x 7.2%2005 Psilos Group Partners III, L.P. 10/24/2005 35,000,000 37,205,819 17,948,760 29,019,093 1.26x 5.5%2005 USPF II Institutional Fund, L.P. 11/23/2005 65,000,000 85,734,194 57,215,147 54,375,279 1.30x 5.9%2005 JP Morgan Fleming (Tranche A) 12/21/2005 43,000,000 40,877,392 25,450,746 31,404,072 1.39x 8.1%2006 Aisling Capital II, LP 1/12/2006 6,680,102 7,309,525 3,284,579 5,283,453 1.17x 3.4%2006 InterMedia Partners VII, L.P. 1/20/2006 25,000,000 28,671,799 16,147,308 29,987,716 1.61x 8.0%2006 Terra Firma Capital Partners III, L.P. 3/8/2006 52,784,856 52,635,580 1,124,908 30,567,593 0.60x (9.7%)2006 BDCM Opportunity Fund II, L.P. 3/29/2006 25,000,000 35,655,722 31,537,456 34,709,978 1.86x 17.8%2006 Blackstone Capital Partners V, L.P. 4/13/2006 123,900,000 128,866,788 107,224,836 92,203,395 1.55x 8.0%2006 Avista Capital Partners, L.P. 4/27/2006 45,000,000 57,146,738 46,032,796 29,879,192 1.33x 6.7%
65
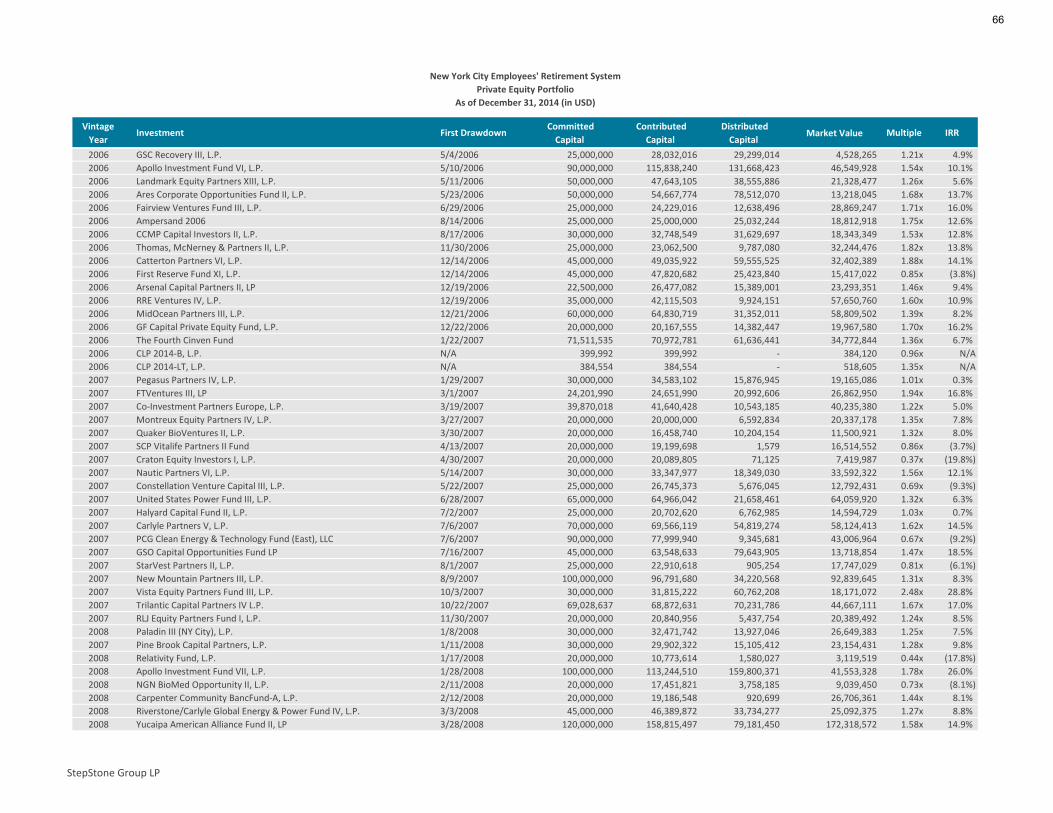
StepStone Group LP
New York City Employees' Retirement SystemPrivate Equity Portfolio
As of December 31, 2014 (in USD)
Vintage Year
Investment First Drawdown Committed
Capital Contributed
Capital Distributed
Capital Market Value Multiple IRR
2006 GSC Recovery III, L.P. 5/4/2006 25,000,000 28,032,016 29,299,014 4,528,265 1.21x 4.9%2006 Apollo Investment Fund VI, L.P. 5/10/2006 90,000,000 115,838,240 131,668,423 46,549,928 1.54x 10.1%2006 Landmark Equity Partners XIII, L.P. 5/11/2006 50,000,000 47,643,105 38,555,886 21,328,477 1.26x 5.6%2006 Ares Corporate Opportunities Fund II, L.P. 5/23/2006 50,000,000 54,667,774 78,512,070 13,218,045 1.68x 13.7%2006 Fairview Ventures Fund III, L.P. 6/29/2006 25,000,000 24,229,016 12,638,496 28,869,247 1.71x 16.0%2006 Ampersand 2006 8/14/2006 25,000,000 25,000,000 25,032,244 18,812,918 1.75x 12.6%2006 CCMP Capital Investors II, L.P. 8/17/2006 30,000,000 32,748,549 31,629,697 18,343,349 1.53x 12.8%2006 Thomas, McNerney & Partners II, L.P. 11/30/2006 25,000,000 23,062,500 9,787,080 32,244,476 1.82x 13.8%2006 Catterton Partners VI, L.P. 12/14/2006 45,000,000 49,035,922 59,555,525 32,402,389 1.88x 14.1%2006 First Reserve Fund XI, L.P. 12/14/2006 45,000,000 47,820,682 25,423,840 15,417,022 0.85x (3.8%)2006 Arsenal Capital Partners II, LP 12/19/2006 22,500,000 26,477,082 15,389,001 23,293,351 1.46x 9.4%2006 RRE Ventures IV, L.P. 12/19/2006 35,000,000 42,115,503 9,924,151 57,650,760 1.60x 10.9%2006 MidOcean Partners III, L.P. 12/21/2006 60,000,000 64,830,719 31,352,011 58,809,502 1.39x 8.2%2006 GF Capital Private Equity Fund, L.P. 12/22/2006 20,000,000 20,167,555 14,382,447 19,967,580 1.70x 16.2%2006 The Fourth Cinven Fund 1/22/2007 71,511,535 70,972,781 61,636,441 34,772,844 1.36x 6.7%2006 CLP 2014-B, L.P. N/A 399,992 399,992 - 384,120 0.96x N/A2006 CLP 2014-LT, L.P. N/A 384,554 384,554 - 518,605 1.35x N/A2007 Pegasus Partners IV, L.P. 1/29/2007 30,000,000 34,583,102 15,876,945 19,165,086 1.01x 0.3%2007 FTVentures III, LP 3/1/2007 24,201,990 24,651,990 20,992,606 26,862,950 1.94x 16.8%2007 Co-Investment Partners Europe, L.P. 3/19/2007 39,870,018 41,640,428 10,543,185 40,235,380 1.22x 5.0%2007 Montreux Equity Partners IV, L.P. 3/27/2007 20,000,000 20,000,000 6,592,834 20,337,178 1.35x 7.8%2007 Quaker BioVentures II, L.P. 3/30/2007 20,000,000 16,458,740 10,204,154 11,500,921 1.32x 8.0%2007 SCP Vitalife Partners II Fund 4/13/2007 20,000,000 19,199,698 1,579 16,514,552 0.86x (3.7%)2007 Craton Equity Investors I, L.P. 4/30/2007 20,000,000 20,089,805 71,125 7,419,987 0.37x (19.8%)2007 Nautic Partners VI, L.P. 5/14/2007 30,000,000 33,347,977 18,349,030 33,592,322 1.56x 12.1%2007 Constellation Venture Capital III, L.P. 5/22/2007 25,000,000 26,745,373 5,676,045 12,792,431 0.69x (9.3%)2007 United States Power Fund III, L.P. 6/28/2007 65,000,000 64,966,042 21,658,461 64,059,920 1.32x 6.3%2007 Halyard Capital Fund II, L.P. 7/2/2007 25,000,000 20,702,620 6,762,985 14,594,729 1.03x 0.7%2007 Carlyle Partners V, L.P. 7/6/2007 70,000,000 69,566,119 54,819,274 58,124,413 1.62x 14.5%2007 PCG Clean Energy & Technology Fund (East), LLC 7/6/2007 90,000,000 77,999,940 9,345,681 43,006,964 0.67x (9.2%)2007 GSO Capital Opportunities Fund LP 7/16/2007 45,000,000 63,548,633 79,643,905 13,718,854 1.47x 18.5%2007 StarVest Partners II, L.P. 8/1/2007 25,000,000 22,910,618 905,254 17,747,029 0.81x (6.1%)2007 New Mountain Partners III, L.P. 8/9/2007 100,000,000 96,791,680 34,220,568 92,839,645 1.31x 8.3%2007 Vista Equity Partners Fund III, L.P. 10/3/2007 30,000,000 31,815,222 60,762,208 18,171,072 2.48x 28.8%2007 Trilantic Capital Partners IV L.P. 10/22/2007 69,028,637 68,872,631 70,231,786 44,667,111 1.67x 17.0%2007 RLJ Equity Partners Fund I, L.P. 11/30/2007 20,000,000 20,840,956 5,437,754 20,389,492 1.24x 8.5%2008 Paladin III (NY City), L.P. 1/8/2008 30,000,000 32,471,742 13,927,046 26,649,383 1.25x 7.5%2007 Pine Brook Capital Partners, L.P. 1/11/2008 30,000,000 29,902,322 15,105,412 23,154,431 1.28x 9.8%2008 Relativity Fund, L.P. 1/17/2008 20,000,000 10,773,614 1,580,027 3,119,519 0.44x (17.8%)2008 Apollo Investment Fund VII, L.P. 1/28/2008 100,000,000 113,244,510 159,800,371 41,553,328 1.78x 26.0%2008 NGN BioMed Opportunity II, L.P. 2/11/2008 20,000,000 17,451,821 3,758,185 9,039,450 0.73x (8.1%)2008 Carpenter Community BancFund-A, L.P. 2/12/2008 20,000,000 19,186,548 920,699 26,706,361 1.44x 8.1%2008 Riverstone/Carlyle Global Energy & Power Fund IV, L.P. 3/3/2008 45,000,000 46,389,872 33,734,277 25,092,375 1.27x 8.8%2008 Yucaipa American Alliance Fund II, LP 3/28/2008 120,000,000 158,815,497 79,181,450 172,318,572 1.58x 14.9%
66

StepStone Group LP
New York City Employees' Retirement SystemPrivate Equity Portfolio
As of December 31, 2014 (in USD)
Vintage Year
Investment First Drawdown Committed
Capital Contributed
Capital Distributed
Capital Market Value Multiple IRR
2008 Levine Leichtman Capital Partners IV, L.P. 4/8/2008 35,000,000 34,823,949 38,776,857 16,909,282 1.60x 20.0%2008 Lee Equity Partners Fund, L.P. 4/23/2008 42,500,000 45,072,005 17,447,993 38,483,548 1.24x 7.8%2008 New York/Fairview Emerging Managers Fund, L.P.-Tranche 2 5/28/2008 45,000,000 36,130,500 13,667,000 36,353,523 1.38x 13.7%2008 Yucaipa Corporate Initiatives Fund II, LP 6/23/2008 42,092,788 40,651,946 7,186,103 27,113,866 0.84x (4.8%)2008 Leeds Equity Partners V, L.P. 7/28/2008 60,000,000 46,353,468 7,450,353 59,703,349 1.45x 14.2%2008 GI Partners Fund III L.P. 7/29/2008 45,000,000 47,548,409 43,646,887 27,414,725 1.49x 15.3%2008 Ares Corporate Opportunities Fund III, L.P. 7/30/2008 75,000,000 86,944,617 71,580,673 71,203,976 1.64x 22.0%2008 GCM Grosvenor NYCERS Emerging Manager Co-Investment Fund, L.P. 8/22/2008 12,875,950 14,563,412 17,214,536 5,786,938 1.58x 12.1%2008 GCM Grosvenor NYCERS Emerging Manager Fund, L.P. 8/22/2008 116,737,374 103,359,089 49,013,947 77,417,592 1.22x 9.8%2008 First Reserve Fund XII, L.P. 8/25/2008 45,000,000 46,125,479 16,848,709 28,292,085 0.98x (0.7%)2008 Landmark Equity Partners XIV, L.P. 9/19/2008 109,120,000 96,526,462 58,856,035 71,122,302 1.35x 16.3%2008 Crestview Partners II, L.P. 10/1/2008 50,000,000 51,724,722 31,378,664 44,309,076 1.46x 15.0%2008 Avista Capital Partners II, L.P. 11/5/2008 75,000,000 86,548,653 63,823,277 96,610,310 1.85x 20.9%2008 Blue Wolf Capital Fund II, L.P. 11/14/2008 25,000,000 26,744,713 9,980,200 20,604,228 1.14x 6.1%2008 Bridgepoint Europe IV 11/14/2008 26,841,939 25,248,791 13,830,232 20,171,144 1.35x 10.7%2008 Aisling Capital III, LP 11/20/2008 14,000,000 12,955,068 9,154,471 11,535,889 1.60x 24.6%2008 Onex Partners III LP 12/10/2008 75,000,000 80,595,916 33,974,129 70,421,507 1.30x 11.1%2009 Welsh, Carson, Anderson & Stowe XI, L.P. 2/10/2009 40,000,000 36,372,773 22,038,021 30,837,278 1.45x 14.2%2009 FS Equity Partners VI, L.P. 7/27/2009 32,500,000 32,659,072 14,992,509 38,125,181 1.63x 20.3%2009 Lincolnshire Equity Fund IV, L.P. 8/5/2009 27,500,000 24,293,185 5,000,723 23,172,055 1.16x 7.3%2009 Lexington Capital Partners VII, L.P. 12/3/2009 50,000,000 39,398,636 25,151,726 32,410,000 1.46x 18.0%2010 Snow Phipps II, L.P. 1/8/2010 30,000,000 20,083,805 3,220,851 25,187,688 1.41x 16.8%2010 JP Morgan Fleming (Tranche B) 2/26/2010 35,000,000 27,761,270 7,898,056 29,835,717 1.36x 13.6%2010 Trident V, L.P. 4/29/2010 110,000,000 110,020,185 16,075,324 110,292,524 1.15x 7.7%2011 Blackstone Capital Partners VI, L.P. 1/24/2011 120,000,000 77,701,069 13,023,760 80,281,551 1.20x 14.2%2011 Ampersand 2011 3/11/2011 25,000,000 21,500,000 1,410,929 33,332,477 1.62x 20.6%2011 BDCM Opportunity Fund III, L.P. 4/8/2011 45,000,000 47,014,882 20,577,598 35,344,823 1.19x 13.3%2011 AXA Secondary Fund V B L.P. 6/16/2011 120,000,000 82,158,986 30,669,432 90,280,847 1.47x 21.7%2011 Wellspring Capital Partners V, L.P. 7/1/2011 40,000,000 24,261,947 2,299,648 23,436,402 1.06x 4.1%2011 EQT VI, L.P. 8/1/2011 107,576,766 77,111,903 1,058,670 78,812,253 1.04x 2.4%2011 Pegasus Partners V, L.P. 8/16/2011 20,789,916 12,455,406 105,763 16,889,609 1.36x 13.5%2011 BC European Capital IX 9/19/2011 136,390,412 82,036,071 13,244,406 75,357,560 1.08x 4.5%2011 American Securities Partners VI, L.P. 11/18/2011 80,000,000 58,105,741 16,759,152 58,258,431 1.29x 20.6%2011 Vista Equity Partners Fund IV, L.P. 11/30/2011 100,000,000 90,113,515 9,066,786 109,892,941 1.32x 16.5%2012 Warburg Pincus Private Equity XI, L.P. 5/24/2012 110,000,000 69,394,372 10,507,750 73,688,018 1.21x 18.7%2012 Trilantic Capital Partners V L.P. 9/20/2012 70,000,000 22,062,895 152,179 20,721,223 0.95x (5.5%)2012 Palladium Equity Partners IV, L.P. 10/10/2012 55,000,000 15,769,407 1,086,857 16,592,855 1.12x 9.0%2012 Ares Corporate Opportunities Fund IV, L.P. 11/5/2012 125,000,000 64,518,413 91,809 68,618,147 1.06x 8.3%2012 Green Equity Investors VI, L.P. 11/30/2012 120,000,000 58,220,632 713,280 62,229,975 1.08x 8.5%2012 Platinum Equity Capital Partners III, L.P. 1/14/2013 100,000,000 37,286,404 27,164,786 35,774,216 1.69x NM2012 NYCERS - 2012 Emerging Manager Program* 6/21/2013 150,000,000 30,885,424 670,504 30,249,050 1.00x NM2013 Carlyle Partners VI, L.P. 7/3/2013 75,000,000 23,407,124 726 22,293,474 0.95x NM2013 Carlyle Partners VI, L.P. (Side Car) 9/23/2014 8,250,000 1,820,369 - 1,683,217 0.92x NM2013 Landmark Equity Partners XV, L.P. 10/30/2013 75,000,000 16,077,728 - 17,774,244 1.11x NM
67

StepStone Group LP
New York City Employees' Retirement SystemPrivate Equity Portfolio
As of December 31, 2014 (in USD)
Vintage Year
Investment First Drawdown Committed
Capital Contributed
Capital Distributed
Capital Market Value Multiple IRR
2013 Landmark - NYC Fund I, L.P. 12/24/2013 25,000,000 7,810,281 - 8,224,179 1.05x NM2013 Apollo Investment Fund VIII, L.P. 12/11/2013 140,000,000 12,233,481 203,537 11,337,175 0.94x NM2013 CVC Capital Partners VI, L.P. 2/18/2014 131,563,580 11,431,065 829,561 8,018,037 0.77x NM2013 Crestview Partners III, L.P. 3/3/2015 66,000,000 - - (338,232) - NM2013 Crestview Partners III (Co-Investment B), L.P. N/A 22,000,000 - - - - N/A2014 Olympus Growth Fund VI, L.P. 1/21/2014 75,000,000 8,635,209 12,667 8,623,735 1.00x NM2014 ASF VI B L.P. 5/9/2014 83,000,000 19,492,968 - 23,683,982 1.22x NM2014 ASF VI B NYC Co-Invest L.P. 5/9/2014 27,000,000 15,768,881 - 18,869,102 1.20x NM2014 Vista Equity Partners Fund V, L.P. 9/8/2014 125,000,000 40,150,071 9,745 38,962,329 0.97x NM2014 Lexington Capital Partners VIII, L.P. 1/8/2015 110,000,000 - - 3,227,000 - NM2014 Centerbridge Capital Partners III, L.P. 5/21/2015 23,700,000 - - - - NM
Total Portfolio1 7,572,734,838$ 6,390,146,649$ 4,484,751,583$ 4,091,386,232$ 1.34x 9.4%
Vintage Year
Investment First Drawdown Committed
Capital Contributed
Capital Distributed
Capital Market Value Multiple IRR
Commitments Closed Subsequent to as of Date2015 American Securities Partners VII, L.P. N/A 80,000,000 - - - N/A N/A2015 Siris Partners III, L.P. 5/4/2015 31,000,000 - - - N/A N/A2015 Valor Equity Partners III, L.P. N/A 10,000,000 - - - N/A N/A
Total Commitments Closed Subsequent to as of Date 121,000,000$ -$ -$ -$ N/A N/A
*Please note that the NYCERS - 2012 Emerging Manager Program total commitment amount includes the full amount allocated to the Program, of which $122.1 million has been committed as of June 2, 2015.1Please note that the Total Portfolio includes liquidated investments.
Note: IRRs presented are interim estimates and may not be indicative of the ultimate performance of fund investments due to a number of factors, such as the lack of industry valuation standards and the differences in the investment pace and strategy ofvarious funds. Until a fund is liquidated, typically over 10 to 12 years, the IRR is only an interim estimated return. The IRR calculated in early years of a fund is not meaningful given the J-curve effect. The actual IRR performance of any fund is not known until allcapital contributed and earnings have been distributed to the investor. The IRRs contained in this report are calculated by StepStone Group LP (“StepStone”), a consultant to the New York City Employees’ Retirement System, based on information provided bythe general partners (e.g. cash flows and valuations). The IRR calculations and other information contained in this report have not been reviewed or confirmed by the general partners. The result of the IRR calculation may differ from that generated by thegeneral partner or other limited partners. Differences in IRR calculations can be affected by cash-flow timing, the accounting treatment of carried interest, fund management fees, advisory fees, organizational fees, other fund expenses, sale of distributed stock,and valuations.
68

-$125.0
-$100.0
-$75.0
-$50.0
-$25.0
$0.0
$25.0
$50.0
$75.0
$100.0
$125.0
($ m
m)
NYCERS Monthly PE Cash Flow Summary(as of May 31,2015)
Contributions Distributions Net Cash Flow
69
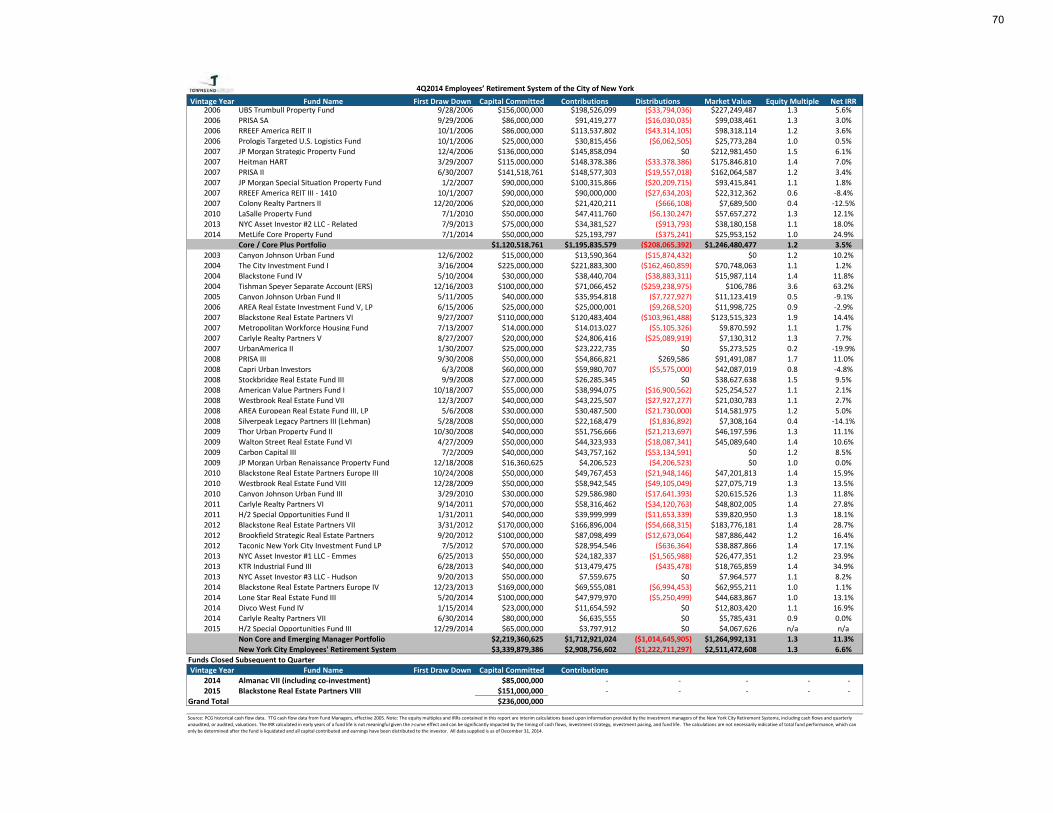
Vintage Year Fund Name First Draw Down Capital Committed Contributions Distributions Market Value Equity Multiple Net IRR2006 UBS Trumbull Property Fund 9/28/2006 $156,000,000 $198,526,099 ($33,794,036) $227,249,487 1.3 5.6%2006 PRISA SA 9/29/2006 $86,000,000 $91,419,277 ($16,030,035) $99,038,461 1.3 3.0%2006 RREEF America REIT II 10/1/2006 $86,000,000 $113,537,802 ($43,314,105) $98,318,114 1.2 3.6%2006 Prologis Targeted U.S. Logistics Fund 10/1/2006 $25,000,000 $30,815,456 ($6,062,505) $25,773,284 1.0 0.5%2007 JP Morgan Strategic Property Fund 12/4/2006 $136,000,000 $145,858,094 $0 $212,981,450 1.5 6.1%2007 Heitman HART 3/29/2007 $115,000,000 $148,378,386 ($33,378,386) $175,846,810 1.4 7.0%2007 PRISA II 6/30/2007 $141,518,761 $148,577,303 ($19,557,018) $162,064,587 1.2 3.4%2007 JP Morgan Special Situation Property Fund 1/2/2007 $90,000,000 $100,315,866 ($20,209,715) $93,415,841 1.1 1.8%2007 RREEF America REIT III - 1410 10/1/2007 $90,000,000 $90,000,000 ($27,634,203) $22,312,362 0.6 -8.4%2007 Colony Realty Partners II 12/20/2006 $20,000,000 $21,420,211 ($666,108) $7,689,500 0.4 -12.5%2010 LaSalle Property Fund 7/1/2010 $50,000,000 $47,411,760 ($6,130,247) $57,657,272 1.3 12.1%2013 NYC Asset Investor #2 LLC - Related 7/9/2013 $75,000,000 $34,381,527 ($913,793) $38,180,158 1.1 18.0%2014 MetLife Core Property Fund 7/1/2014 $50,000,000 $25,193,797 ($375,241) $25,953,152 1.0 24.9%
Core / Core Plus Portfolio $1,120,518,761 $1,195,835,579 ($208,065,392) $1,246,480,477 1.2 3.5%2003 Canyon Johnson Urban Fund 12/6/2002 $15,000,000 $13,590,364 ($15,874,432) $0 1.2 10.2%2004 The City Investment Fund I 3/16/2004 $225,000,000 $221,883,300 ($162,460,859) $70,748,063 1.1 1.2%2004 Blackstone Fund IV 5/10/2004 $30,000,000 $38,440,704 ($38,883,311) $15,987,114 1.4 11.8%2004 Tishman Speyer Separate Account (ERS) 12/16/2003 $100,000,000 $71,066,452 ($259,238,975) $106,786 3.6 63.2%2005 Canyon Johnson Urban Fund II 5/11/2005 $40,000,000 $35,954,818 ($7,727,927) $11,123,419 0.5 -9.1%2006 AREA Real Estate Investment Fund V, LP 6/15/2006 $25,000,000 $25,000,001 ($9,268,520) $11,998,725 0.9 -2.9%2007 Blackstone Real Estate Partners VI 9/27/2007 $110,000,000 $120,483,404 ($103,961,488) $123,515,323 1.9 14.4%2007 Metropolitan Workforce Housing Fund 7/13/2007 $14,000,000 $14,013,027 ($5,105,326) $9,870,592 1.1 1.7%2007 Carlyle Realty Partners V 8/27/2007 $20,000,000 $24,806,416 ($25,089,919) $7,130,312 1.3 7.7%2007 UrbanAmerica II 1/30/2007 $25,000,000 $23,222,735 $0 $5,273,525 0.2 -19.9%2008 PRISA III 9/30/2008 $50,000,000 $54,866,821 $269,586 $91,491,087 1.7 11.0%2008 Capri Urban Investors 6/3/2008 $60,000,000 $59,980,707 ($5,575,000) $42,087,019 0.8 -4.8%2008 Stockbridge Real Estate Fund III 9/9/2008 $27,000,000 $26,285,345 $0 $38,627,638 1.5 9.5%2008 American Value Partners Fund I 10/18/2007 $55,000,000 $38,994,075 ($16,900,562) $25,254,527 1.1 2.1%2008 Westbrook Real Estate Fund VII 12/3/2007 $40,000,000 $43,225,507 ($27,927,277) $21,030,783 1.1 2.7%2008 AREA European Real Estate Fund III, LP 5/6/2008 $30,000,000 $30,487,500 ($21,730,000) $14,581,975 1.2 5.0%2008 Silverpeak Legacy Partners III (Lehman) 5/28/2008 $50,000,000 $22,168,479 ($1,836,892) $7,308,164 0.4 -14.1%2009 Thor Urban Property Fund II 10/30/2008 $40,000,000 $51,756,666 ($21,213,697) $46,197,596 1.3 11.1%2009 Walton Street Real Estate Fund VI 4/27/2009 $50,000,000 $44,323,933 ($18,087,341) $45,089,640 1.4 10.6%2009 Carbon Capital III 7/2/2009 $40,000,000 $43,757,162 ($53,134,591) $0 1.2 8.5%2009 JP Morgan Urban Renaissance Property Fund 12/18/2008 $16,360,625 $4,206,523 ($4,206,523) $0 1.0 0.0%2010 Blackstone Real Estate Partners Europe III 10/24/2008 $50,000,000 $49,767,453 ($21,948,146) $47,201,813 1.4 15.9%2010 Westbrook Real Estate Fund VIII 12/28/2009 $50,000,000 $58,942,545 ($49,105,049) $27,075,719 1.3 13.5%2010 Canyon Johnson Urban Fund III 3/29/2010 $30,000,000 $29,586,980 ($17,641,393) $20,615,526 1.3 11.8%2011 Carlyle Realty Partners VI 9/14/2011 $70,000,000 $58,316,462 ($34,120,763) $48,802,005 1.4 27.8%2011 H/2 Special Opportunities Fund II 1/31/2011 $40,000,000 $39,999,999 ($11,653,339) $39,820,950 1.3 18.1%2012 Blackstone Real Estate Partners VII 3/31/2012 $170,000,000 $166,896,004 ($54,668,315) $183,776,181 1.4 28.7%2012 Brookfield Strategic Real Estate Partners 9/20/2012 $100,000,000 $87,098,499 ($12,673,064) $87,886,442 1.2 16.4%2012 Taconic New York City Investment Fund LP 7/5/2012 $70,000,000 $28,954,546 ($636,364) $38,887,866 1.4 17.1%2013 NYC Asset Investor #1 LLC - Emmes 6/25/2013 $50,000,000 $24,182,337 ($1,565,988) $26,477,351 1.2 23.9%2013 KTR Industrial Fund III 6/28/2013 $40,000,000 $13,479,475 ($435,478) $18,765,859 1.4 34.9%2013 NYC Asset Investor #3 LLC - Hudson 9/20/2013 $50,000,000 $7,559,675 $0 $7,964,577 1.1 8.2%2014 Blackstone Real Estate Partners Europe IV 12/23/2013 $169,000,000 $69,555,081 ($6,994,453) $62,955,211 1.0 1.1%2014 Lone Star Real Estate Fund III 5/20/2014 $100,000,000 $47,979,970 ($5,250,499) $44,683,867 1.0 13.1%2014 Divco West Fund IV 1/15/2014 $23,000,000 $11,654,592 $0 $12,803,420 1.1 16.9%2014 Carlyle Realty Partners VII 6/30/2014 $80,000,000 $6,635,555 $0 $5,785,431 0.9 0.0%2015 H/2 Special Opportunities Fund III 12/29/2014 $65,000,000 $3,797,912 $0 $4,067,626 n/a n/a
Non Core and Emerging Manager Portfolio $2,219,360,625 $1,712,921,024 ($1,014,645,905) $1,264,992,131 1.3 11.3%New York City Employees' Retirement System $3,339,879,386 $2,908,756,602 ($1,222,711,297) $2,511,472,608 1.3 6.6%
Funds Closed Subsequent to QuarterVintage Year Fund Name First Draw Down Capital Committed Contributions
2014 Almanac VII (including co-investment) $85,000,000 - - - - - 2015 Blackstone Real Estate Partners VIII $151,000,000 - - - - -
Grand Total $236,000,000
4Q2014 Employees’ Retirement System of the City of New York
Source: PCG historical cash flow data. TTG cash flow data from Fund Managers, effective 2005. Note: The equity multiples and IRRs contained in this report are interim calculations based upon information provided by the investment managers of the New York City Retirement Systems, including cash flows and quarterly unaudited, or audited, valuations. The IRR calculated in early years of a fund life is not meaningful given the J-curve effect and can be significantly impacted by the timing of cash flows, investment strategy, investment pacing, and fund life. The calculations are not necessarily indicative of total fund performance, which can only be determined after the fund is liquidated and all capital contributed and earnings have been distributed to the investor. All data supplied is as of December 31, 2014.
70

-$60,000,000
-$40,000,000
-$20,000,000
$0
$20,000,000
$40,000,000
$60,000,000
$80,000,000
Amou
ntNYCERS Monthly Real Estate Cash Flow Summary
Contributions Distributions Net Cash Flow
71

II. Diversity Initiative for Managers Update:
72

III. Trustee Education – Asset Allocation Review (Callan):
73
New York City Employees’ Retirement System
Asset Allocation Education
July 28, 2015
Bud Pellecchia Senior Vice President
Tom Shingler Senior Vice President
Jim Van Heuit Senior Vice President
74

1 New York City Employees’ Retirement System
Asset Allocation Education Knowledge. Experience. Integrity.
Overview
Ɣ Why Conduct an Asset Allocation Study?
Ɣ Capital Markets and Modern Portfolio Theory
Ɣ New Theories on Asset Allocation
Ɣ Develop Capital Market Expectations
Ɣ Pros and Cons of Various Asset Classes
Ɣ NYCERS Asset Allocation Preview and Sample Output
75

Why Conduct an Asset Allocation Study?
76

3 New York City Employees’ Retirement System
Asset Allocation Education Knowledge. Experience. Integrity.
Goal of the Asset-Allocation Study
Ɣ The goal of an asset allocation study is to establish a long term strategic asset allocation target
Ɣ An appropriate asset allocation will depend on the Plan Sponsor’s investment objectives: – Minimize costs over the long run (long-term goal)
– How much return generation (from beta and alpha) is necessary to lower contributions and/or improve funded status? – Minimize funded status volatility (short-term goal)
– How much risk reduction to reduce contribution/funded status volatility?
Ɣ The strategic asset allocation target should be an optimal balance between sustainable funded status volatility and minimization of contributions over the long run
Ɣ The strategic asset allocation will vary by the unique circumstances of the Plan Sponsor – No “one-size-fits-all” solution exists
77

4 New York City Employees’ Retirement System
Asset Allocation Education Knowledge. Experience. Integrity.
Where Does Asset Allocation Fit In?
Investment Policy Ɣ How will the assets supporting
the benefits be invested? Ɣ What risk and return objectives? Ɣ How to manage cash flows?
Funding Policy Ɣ How will the benefits be funded? Ɣ What assumed investment
return? Ɣ How are defects amortized? Ɣ What actuarial methodologies
are applied to dampen contribution volatility?
Benefits Policy Ɣ What type/kind of benefits Ɣ What level of benefit Ɣ When and to whom are they payable
Investment Policy
Benefits Policy
Funding Policy
Evaluating the interaction of the three key policies that govern a defined benefit plan with the goal of establishing the best investment policy
78

Capital Market and Modern Portfolio Theory
79

6 New York City Employees’ Retirement System
Asset Allocation Education Knowledge. Experience. Integrity.
6
The Role of Capital Market Theory
Ɣ Capital Market Theory Attempts to Explain the Relationship Between Investment Returns and Risks
Ɣ Addresses Both Individual Investments and Portfolios of Multiple Investments
Ɣ Portfolio Construction – How should a portfolio of assets be constructed given the variety of different assets available for investment? – Return target? – Risk tolerance?
80

7 New York City Employees’ Retirement System
Asset Allocation Education Knowledge. Experience. Integrity.
7
Definition of Risk
Ɣ Practical Definition of Risk: the Possibility of Losing Money
Ɣ Volatility is A Useful Retrospective Definition of Risk – How much did returns differ from the average return? – How often did returns differ from the average return?
Ɣ Uncertainty is A Useful Prospective Definition of Risk – How much could differ from the average return? – How often could returns differ from the average return?
Ɣ Risk is important to a pension plan – Risks should be appropriately compensated by returns in the long run – The appropriate level of risk should balance long-term gains and shorter-term losses
Ɣ Volatility and Uncertainty Require Multiple Periods for Measurement – Return can be measured in a single period (although returns over multiple periods are probably more
interesting) – Risk requires multiple periods to observe the fluctuations – Don’t have a point-in-time risk – Changes in risk appear slowly
81

8 New York City Employees’ Retirement System
Asset Allocation Education Knowledge. Experience. Integrity.
8
Standard Deviation Measures Risk
Ɣ Most Common Measure of “Absolute” Risk – “Absolute” means without reference to a benchmark
Ɣ Defined for Historical Data as the Average Difference from the Average Return – The volatility is measured relative to the average return (see slide 4) – If there are large deviations from the average, the standard deviation is high meaning the returns are very
volatile
Ɣ Defined Prospectively as the Expected Deviation From the Expected Return – Prospective volatility is estimated rather than measured although the estimation is generally based on historical
measurements – Higher prospective volatility means greater uncertainty
Ɣ Calculation of the Standard Deviation Includes Returns Above as Well as Below the Average – Both high and low returns provide information about volatility – High returns are infrequently earned without the possibility of large losses
82

9 New York City Employees’ Retirement System
Asset Allocation Education Knowledge. Experience. Integrity.
Historical Standard Deviation
Ɣ Volatility is reflected in the deviations around the average of historical returns
Ɣ Calculate historical standard deviation – Calculate the average over multiple periods – Measure the deviations from the average for each time period in the average – Calculate an average deviation (sort of)
Ɣ Only one outcome for each time period; we know what happened and when
Measured Volatility
9
83

10 New York City Employees’ Retirement System
Asset Allocation Education Knowledge. Experience. Integrity.
Future Risk
Ɣ Uncertainty is reflected in the range of possible future outcomes
Ɣ The horizontal axis shows future time periods
Ɣ There are multiple potential outcomes in each time period; we don’t know what will happen or when
Ɣ The variations of outcomes represents estimates of future risk – Wider variations in the tree represent more risk
Prospective Uncertainty
10
Risk
$161
$146
$133 $132
$121 $120
$110 $109 $108
$100 $99 $98
$90 $89 $88
$81 $80
$73 $72
$66
$59
Years
2015 2016 2017 2018 2019 2020
84
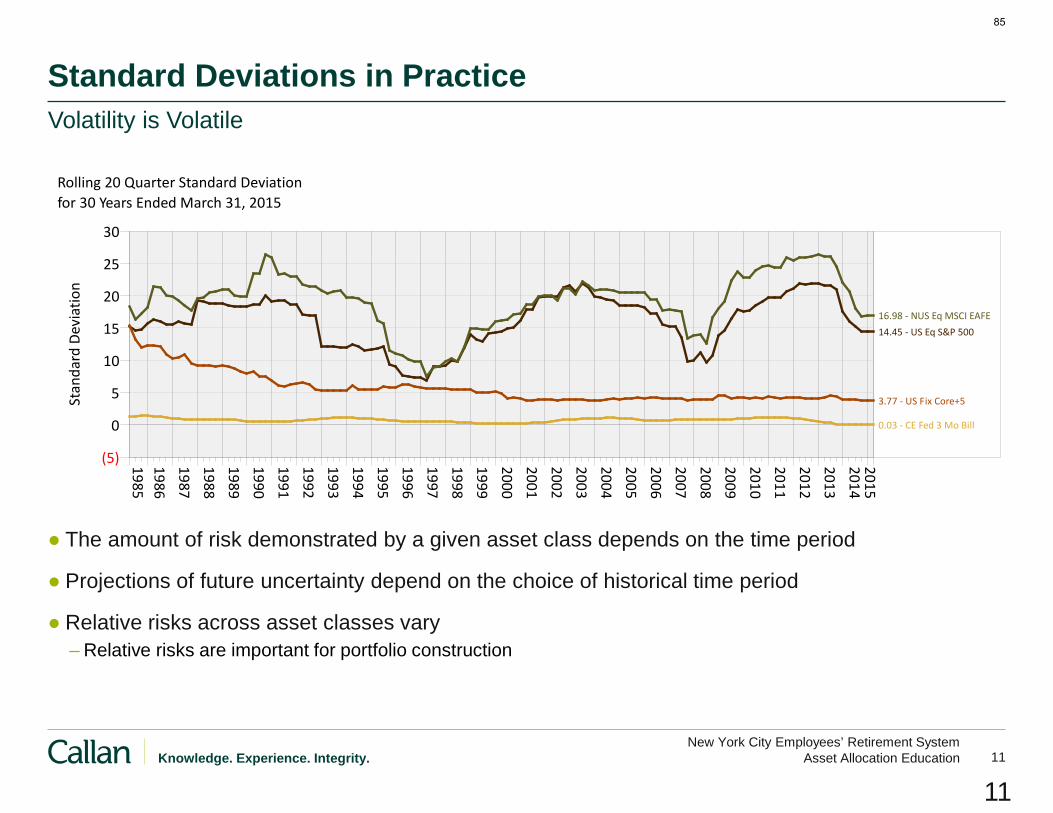
11 New York City Employees’ Retirement System
Asset Allocation Education Knowledge. Experience. Integrity.
Standard Deviations in Practice
Ɣ The amount of risk demonstrated by a given asset class depends on the time period
Ɣ Projections of future uncertainty depend on the choice of historical time period
Ɣ Relative risks across asset classes vary – Relative risks are important for portfolio construction
Volatility is Volatile
11
1985198619871988198919901991199219931994199519961997199819992000200120022003200420052006200720082009201020112012201320142015
(5)
0
5
10
15
20
25
30
for 30 Years Ended March 31, 2015Rolling 20 Quarter Standard Deviation
Stan
dard
Dev
iatio
n
14.45 - US Eq S&P 50016.98 - NUS Eq MSCI EAFE
3.77 - US Fix Core+5
0.03 - CE Fed 3 Mo Bill
85

12 New York City Employees’ Retirement System
Asset Allocation Education Knowledge. Experience. Integrity.
12
Diversification
Ɣ Age-Old Concept – “Don’t put all of your eggs in one basket.”
Ɣ The Object is Risk Control – If one outcome is bad, all is not lost
Ɣ Reduce Volatility or Uncertainty – If good outcomes occur for one assets at the same time as bad outcomes occur for another asset then the
worst outcomes for any given asset are avoided for the overall portfolio – The converse is also true: when bad outcomes occur at the same time as good outcomes, the best outcomes
for any given asset are never realized for the overall portfolio – Bets on multiple numbers on the roulette table rather than one
86

13 New York City Employees’ Retirement System
Asset Allocation Education Knowledge. Experience. Integrity.
13
Correlation Measures Diversification
Ɣ Correlations Range from -1 to 1
Ɣ -1 Correlation – Returns are completely out of synchronization – Good and bad returns exactly cancel leaving no volatility – Investments in the real world that have -1 correlations earn the risk-free rate of return
Ɣ 0 Correlation – The relationship between the returns of 2 investments is completely random – Substantial but not complete reduction in volatility
Ɣ 1 Correlation – Returns are completely in synchronization – “Perfect correlation” – Volatility is the same for a portfolio of the two investments as it is for either single investment – No diversification so no volatility reduction
87

14 New York City Employees’ Retirement System
Asset Allocation Education Knowledge. Experience. Integrity.
Correlation as a Measure of Diversification
Ɣ Historical correlation is measured as the simultaneous deviations of asset returns around their respective historical averages
Ɣ Asset classes with correlations even moderately below 1 can measurably reduce portfolio risk
Measured “Co-volatility”
88

15 New York City Employees’ Retirement System
Asset Allocation Education Knowledge. Experience. Integrity.
Correlations in Practice
Ɣ Historically, correlations have varied significantly
Ɣ High correlations during and after the financial crisis were short lived – Rolling 5-year correlations between US and non-US equity rose only modestly during the financial crisis – Strategic long-term investors still experienced diversification
Correlations are Volatile
1985198619871988198919901991199219931994199519961997199819992000200120022003200420052006200720082009201020112012201320142015
(1.00)
(0.75)
(0.50)
(0.25)
0.00
0.25
0.50
0.75
1.00
for 30 Years Ended March 31, 2015Rolling 20 Quarter Correlation Relative To S&P 500 Index
Corr
elat
ion
(0.58) - US Fix Core+5
0.84 - NUS Eq MSCI EAFE
(0.14) - CE Fed 3 Mo Bill
89

16 New York City Employees’ Retirement System
Asset Allocation Education Knowledge. Experience. Integrity.
16
Modern Portfolio Theory (MPT)
Ɣ Developed by Harry Markowitz – “Portfolio Selection”, Journal of Finance, 1952 – Nobel Prize winning theory
Ɣ MPT Quantifies the Idea of Diversified Investment Portfolios Through the Use of Correlation – Previously a subjective judgment – Makes use of the correlations of investment returns for the first time
Ɣ Quantification Allows Ranking Diversification Opportunities – Given two otherwise identical investments, choose the one that diversifies the portfolio most
Ɣ Quantification Allows the Measurement of Total Portfolio Diversification – Can now measure the probability of losing a given amount of money – Can compare the relative diversification of different portfolios
90
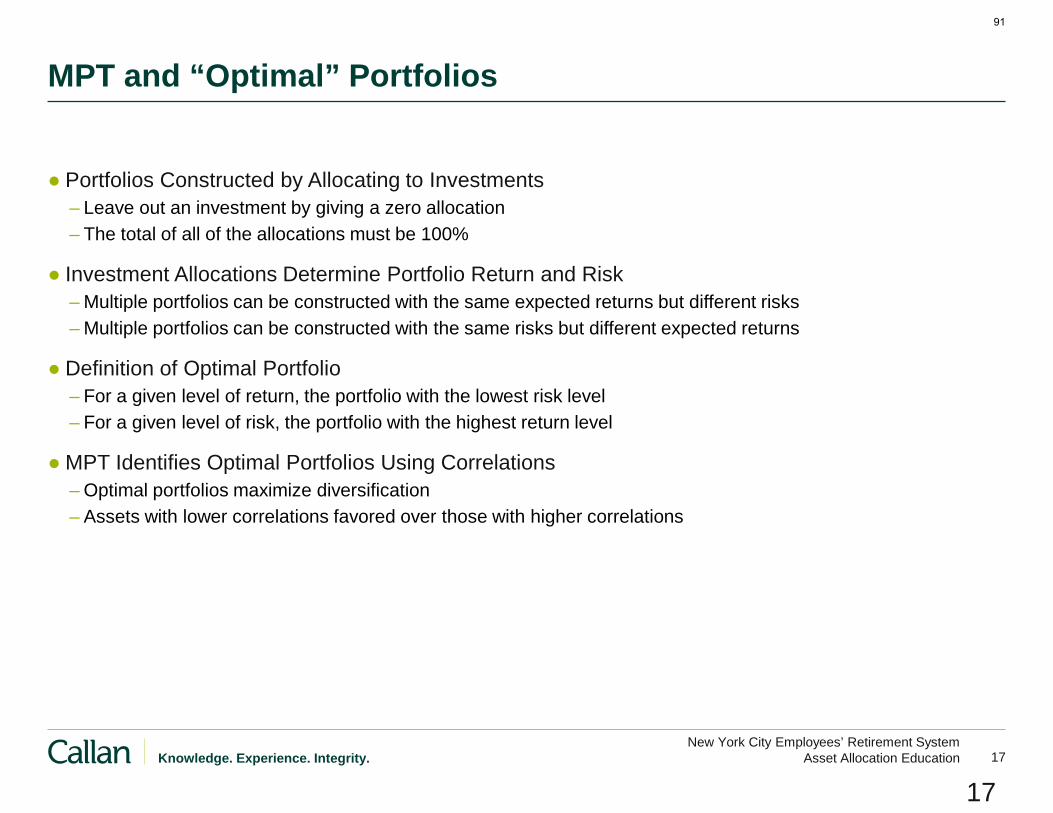
17 New York City Employees’ Retirement System
Asset Allocation Education Knowledge. Experience. Integrity.
17
MPT and “Optimal” Portfolios
Ɣ Portfolios Constructed by Allocating to Investments – Leave out an investment by giving a zero allocation – The total of all of the allocations must be 100%
Ɣ Investment Allocations Determine Portfolio Return and Risk – Multiple portfolios can be constructed with the same expected returns but different risks – Multiple portfolios can be constructed with the same risks but different expected returns
Ɣ Definition of Optimal Portfolio – For a given level of return, the portfolio with the lowest risk level – For a given level of risk, the portfolio with the highest return level
Ɣ MPT Identifies Optimal Portfolios Using Correlations – Optimal portfolios maximize diversification – Assets with lower correlations favored over those with higher correlations
91

18 New York City Employees’ Retirement System
Asset Allocation Education Knowledge. Experience. Integrity.
18
MPT and the “Efficient Frontier”
Ɣ Optimal Portfolios Exist for Each Level of Return or Risk
Ɣ Efficient Frontier is the Locus of All Optimal Portfolios – Begins at minimum risk portfolio – All portfolios that have the least risk for a given level of return – All portfolios that have the most return for a given level of risk – Infinite number of portfolios on the frontier
92

19 New York City Employees’ Retirement System
Asset Allocation Education Knowledge. Experience. Integrity.
Optimal Portfolios and the Efficient Frontier
Ɣ A suboptimal asset allocation can be made optimal in one of three ways – It can earn more return for the same level of risk – It can earn the same return for less risk – It can earn somewhat more return for somewhat less risk
Ɣ Suboptimal asset allocations do not maximize diversification
19
93

New Theories on Asset Allocation
94

21 New York City Employees’ Retirement System
Asset Allocation Education Knowledge. Experience. Integrity.
Grouping Asset Classes by Economic Roles
Ɣ Investors seek economic diversification to a range of scenarios like - high inflation, deflation, stagflation, and growth given uncertainty in the capital markets going forward – Scenarios (quadrants) are not equally likely and the graph does not imply 25% of assets should be dedicated to each bucket – Asset classes may not perform well in scenario indicated above (no guarantees) – No distinction is made between unexpected or expected inflation which can have ramifications for how an asset class performs.
Low Growth High Inflation Inflation Linked Bonds Commodities Infrastructure
High Growth High Inflation Real Assets: Real Estate, Timberland, Farmland, Energy
Low Growth Low Inflation (Deflation) Cash Government Bonds
High Growth Low Inflation Equity Corporate Debt
Economic Growth In
flatio
n
95
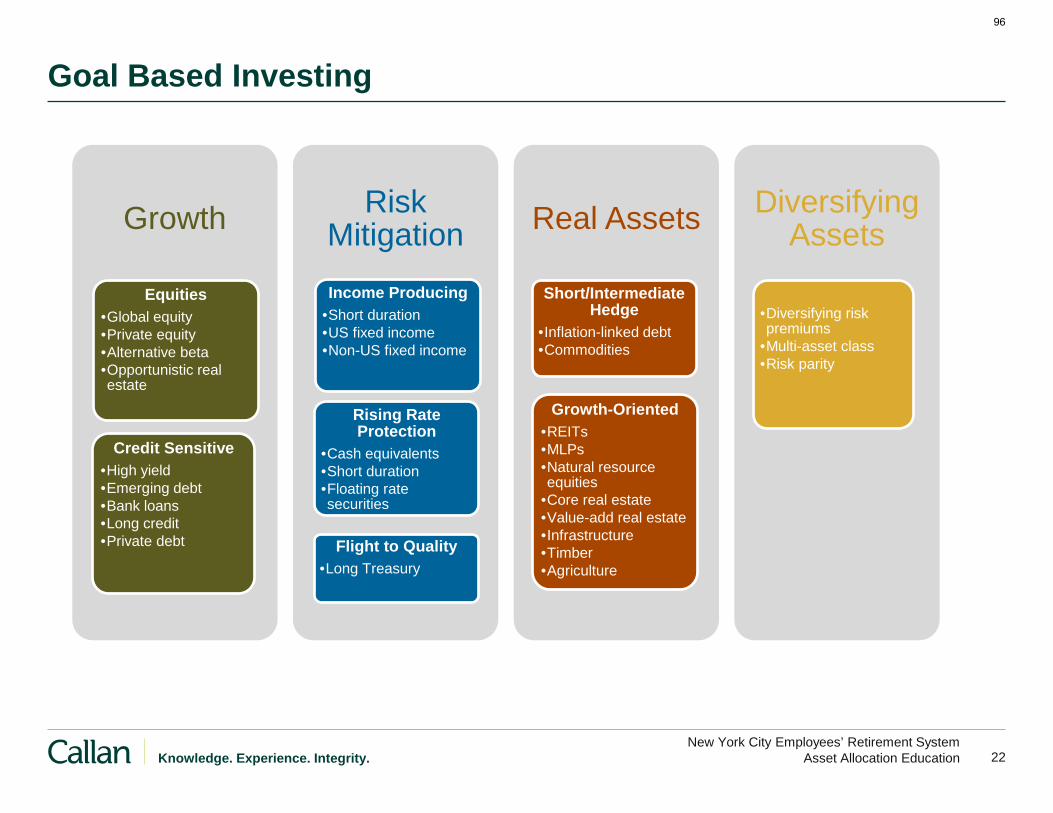
22 New York City Employees’ Retirement System
Asset Allocation Education Knowledge. Experience. Integrity.
Goal Based Investing
Growth
Equities •Global equity •Private equity •Alternative beta •Opportunistic real estate
Credit Sensitive •High yield •Emerging debt •Bank loans •Long credit •Private debt
Risk Mitigation
Rising Rate Protection
•Cash equivalents •Short duration •Floating rate securities
Income Producing •Short duration •US fixed income •Non-US fixed income
Flight to Quality •Long Treasury
Real Assets
Short/Intermediate Hedge
•Inflation-linked debt •Commodities
Growth-Oriented •REITs •MLPs •Natural resource equities
•Core real estate •Value-add real estate •Infrastructure •Timber •Agriculture
Diversifying Assets
•Diversifying risk premiums
•Multi-asset class •Risk parity
96

Setting 2015 Capital Markets Expectations
97

24 New York City Employees’ Retirement System
Asset Allocation Education Knowledge. Experience. Integrity.
Themes Explored in Setting the 2015 Expectations
Ɣ What are the prospects for economic growth? – US economic outlook is positive although the post financial crisis recovery has been below average. – Economic growth in Europe and Japan is anemic with the potential for sustained deflation.
– Capacity available for growth. – Fiscal policies can be limited by government debt.
– Emerging market economic growth will be muted relative to history – Current growth below historical values but still high. – Investment continues at a high rate. – Exports to play a smaller but still very significant role in future growth.
Ɣ Where is inflation likely to head? – US deflation is not on the horizon but inflation is still below target. – Japan continues to try to ward off deflation. – Europe has now joined the fight. – Emerging markets inflation likely to be more favorable. – Currency and oil prices are a mixed bag.
Ɣ When will interest rates hit bottom? – Interest rates fell in 2014 in response to multiple factors. – Fed has signaled rate increases in 2015 and beyond
98

25 New York City Employees’ Retirement System
Asset Allocation Education Knowledge. Experience. Integrity.
Themes Explored in Setting the 2015 Expectations
Ɣ Will rising rates crush US fixed income markets? – Drop in longer-term yields in 2014 will make rising rates more painful. – Distribution of rate increases across the yield curve matters. – Only marginal changes in credit spreads. – Longer periods of higher yields help to offset shorter-term capital losses.
Ɣ Are US equity markets overvalued? – Markets reached record highs in 2014. – Over the most recent 6 years, the S&P 500 has returned a cumulative 159% while the Russell 2500 has
returned 187%. – Underlying corporate performance could support returns.
Ɣ Can non-US equities overcome economic issues? – Fundamentals more favorable in non-US developed equity markets than in the US. – Emerging market fundamentals have yet to fully recover from the Financial Crisis.
Ɣ Resolution of short-term uncertainties determines long-term outcomes – Even best case scenarios show some pain over the next 1 to 3 years before a return to normalcy over the
longer term. – Substantially poorer outcomes cannot be discounted.
99

26 New York City Employees’ Retirement System
Asset Allocation Education Knowledge. Experience. Integrity.
Summary of Economic Analysis
Ɣ Economic growth has suffered due to the world-wide impact of the Financial Crisis
Ɣ While conditions remain tenuous, there are geographically dispersed signs of improved economic growth – Growth rates in the US and the UK have rebounded strongly – Emerging markets growth slowing to “less high” rates – With some markets are already recovering, monetary stimulus in Europe and Japan is likely to show fruits
– US policies stymied for years by nearly universal economic problems but ultimately seems to have been successful – Signs of policy flexibility in Japan and to a lesser extent in Europe are encouraging
Ɣ Inflation can remain muted (but positive) given spare productive capacity – Labor and capital underutilized – Wage expectations appear to be anchored at low levels – Raw materials prices unlikely to accelerate quickly
Ɣ More fertile ground for monetary policy likely to lead to an increase in rates sooner rather than later
Ɣ US Forecasts: Real GDP Growth = 3%, Inflation = 2.25%
Ɣ Non-US Forecasts: Developed Real GDP Growth = 2%, Inflation = 2%
Ɣ Emerging Markets Forecasts: Real GDP Growth = 5%, Inflation = 5%
Return to More Normal Economic Conditions
100

27 New York City Employees’ Retirement System
Asset Allocation Education Knowledge. Experience. Integrity.
Will Rising Rates Crush US Fixed Income Markets?
Ɣ The decline in long yields in 2014 will make the return to a more normal long end of the yield curve more painful. – Long bonds generated terrific returns last year. – Greater yield increases mean greater capital losses especially for long duration securities. – However, relative to last year there is one less year of low yields and one more year of higher yields in our 10-
year projection.
Ɣ Yields in the intermediate portion of the curve held up in 2014. – Stable yields led to more yield-like returns. – Smaller yield increases to reach normal rates will make returns over the next few years more tolerable.
Ɣ Cash returns likely to experience gain without pain. – The shortest term securities will increase in yield the most over the next few years. – Their near-zero duration means that they will increasingly harvest returns without the pain of lost capital.
Ɣ Interest rates will rise over approximately the same period as the FOMC expects Fed Funds to rise. – Most of the capital losses likely to be realized in the next three years. – Higher yields in subsequent years expected to make long-term annualized returns more tolerable.
Ɣ The Barclays Capital Aggregate Index is expected to return 3% per year on average.
Return to More Normal Yield Curve Will Be Painful Before Profitable
101

28 New York City Employees’ Retirement System
Asset Allocation Education Knowledge. Experience. Integrity.
Are US Equity Markets Overvalued?
Ɣ Current strong dividend growth is expected to return to a more moderate pace.
Ɣ Firms are expected to return more capital to moderate the level of cash on their balance sheets. – Increases in dividends paid from earnings. – Real free cash flow returns (e.g. special dividends
and share buybacks).
Ɣ Strong profit growth has kept US valuations reasonable.
Ɣ Expectations for moderate economic growth should support future corporate profits.
Ɣ Continued strong earnings supported by the recovering economy means that valuations can return to average with moderate stock returns rather than a bear market.
Future Returns Driven by Economic Performance
Factor Large Cap Sm/Mid CapReal Capital AppreciationReal Dividend Growth 5.75% 1.75%Payout Ratio Growth 1.00% -2.50%P/E Growth -0.50% 1.00%Real Price Return 4.18% 5.40%
YieldReal Dividend Growth 5.75% 1.75%Current Real Dividend Yield 0.25% -0.35%2024 Real Dividend Yield 0.25% -0.34%Average Real Dividend Yield 0.25% -0.34%
Real Free Cash Flow Return 0.70% 0.40%
Real Return 5.13% 5.46%
Inflation 2.25% 2.25%
Mean Nominal Compound Return 7.50% 7.85%
102

29 New York City Employees’ Retirement System
Asset Allocation Education Knowledge. Experience. Integrity.
Can Non-US Equities Overcome Economic Issues?
Ɣ Improved developed non-US market economic performance will translate into equity returns. – Earnings will improve as economic issues resolved. – History of relatively high dividends to continue. – Better conditions will lead to more corporate activity.
Ɣ Low developed non-US inflation will limit the size of nominal returns.
Ɣ Emerging market economic growth is falling but still high.
Ɣ Emerging market returns will benefit from growth as well as market factors. – Below average valuations – Higher dividends
Ɣ Emerging market inflation supports nominal returns. – Inflation rates are lower and more stable than in
decades past. – Future price growth depends on government
policies as well as economics.
Future Returns Driven by Economic Performance
Factor Developed EmergingReal Capital AppreciationReal Dividend Growth 5.50% 6.00%Payout Ratio Growth 1.75% 0.30%P/E Growth 0.00% 0.25%Real Price Return 3.69% 5.95%
YieldReal Dividend Growth 5.50% 6.00%Current Real Dividend Yield 1.00% -3.15%2024 Real Dividend Yield 1.02% -3.15%Average Real Dividend Yield 1.01% -3.15%
Real Free Cash Flow Return 0.70% 0.00%
Real Return 5.39% 2.80%
Inflation 2.00% 5.00%
Mean Nominal Compound Return 7.50% 7.95%
103

30 New York City Employees’ Retirement System
Asset Allocation Education Knowledge. Experience. Integrity.
2015 Capital Market Projections The Capital Markets at January 2015
Ɣ Results for 2014 showed continuing strength in large cap U.S. equity and weakness in small cap with substantial intra-year variability. Developed international markets turned down as economic fortunes flagged. Emerging markets continue to suffer.
Ɣ Five-year equity returns through 2014 are free of the financial crisis and are very strong. Ten-year returns no longer include the 2000 – 2002 downturn, but no longer include the robust 2003-04 results. Fifteen-year equity returns are still below long-run averages, and are equal to those of fixed income.
2014 Average Annual Returns
2009 2010 2011 2012 2013
YTD thru Dec
5 Years 2010–14
10 Years 2005–14
15 Years 2000–14
Broad U.S. Stock Market Russell 3000 28.34 16.93 1.03 16.42 33.55 12.56 15.63 7.94 4.82 S&P Super Composite 1500 27.25 16.38 1.75 16.17 32.59 13.08 15.58 7.88 4.81 Large Cap U.S. Stocks Russell 1000 28.43 16.10 1.50 16.42 33.11 13.24 15.64 7.96 4.62 S&P 500 26.47 15.06 2.11 16.00 32.39 13.69 15.45 7.67 4.24 Small Cap U.S. Stocks Russell 2000 27.17 26.85 -4.18 16.35 38.82 4.89 15.55 7.77 7.38 S&P 600 Small Cap 25.57 26.31 1.02 16.33 41.31 5.76 17.27 9.02 9.87 Non-U.S. Stock Markets MSCI EAFE US$ 31.78 7.75 -12.14 17.32 22.78 -4.90 5.33 4.43 2.54 MSCI Emerging Markets 79.02 19.20 -18.17 18.63 -2.27 -1.82 2.11 8.78 7.38 Fixed Income Barclays Aggregate 5.93 6.54 7.84 4.21 -2.02 5.97 4.45 4.71 5.70 Citi Non-US 4.38 5.22 5.17 1.51 -4.56 -2.68 0.85 2.64 4.65 Hedge Funds DJCS Hedge Fund Index 18.57 10.95 -2.52 7.67 9.73 4.13 5.88 5.82 6.34 Cash Market 90-Day T-Bill 0.21 0.13 0.10 0.11 0.07 0.03 0.09 1.54 2.01 Inflation CPI-U 2.72 1.50 2.96 1.74 1.50 0.76 1.69 2.12 2.24
Source: Callan Associates
104

31 New York City Employees’ Retirement System
Asset Allocation Education Knowledge. Experience. Integrity.
2015 Capital Market Projections Long-Term Return and Risk Projections (2015 – 2024)
Source: Callan Associates
PROJECTED RETURN PROJECTED RISK
Asset Class Index1-Year
Arithmetic10-Year
Geometric* RealStandard Deviation
Projected Yield
EquitiesUS Broad Equity Russell 3000 9.15% 7.60% 5.35% 19.00% 2.40%Large Cap S&P 500 8.90% 7.50% 5.25% 18.30% 2.50%Small/Mid Cap Russell 2500 10.15% 7.85% 5.60% 22.95% 1.90%International Equity MSCI World ex USA 9.25% 7.50% 5.25% 20.20% 3.00%Emerging Markets Equity MSCI Emerging Markets 11.45% 7.90% 5.65% 27.95% 1.70%Global Ex-US Equity MSCI ACWI ex USA 9.80% 7.80% 5.55% 21.45% 2.70%Natural Resources Equity S&P Global Natural Resources 9.75% 7.15% 4.90% 24.00% 2.30%US REITs MSCI US REIT 9.20% 7.25% 5.00% 21.00% 2.25%Non-US REITs S&P Global ex US REIT 9.65% 7.50% 5.25% 21.95% 2.50%Listed Infrastructure S&P Global Infrastructure 10.45% 8.00% 5.75% 23.55% 1.75%Alternative Equity Alternative Equity Benchmark 7.30% 6.60% 4.35% 13.35% 3.25%
Fixed IncomeShort Duration Barclays Gov/Credit 1-3 2.40% 2.40% 0.15% 2.25% 2.80%Domestic Fixed Barclays Aggregate 3.05% 3.00% 0.75% 3.75% 4.60%Non US Fixed Barclays Global Aggregate ex US 2.70% 2.30% 0.05% 9.40% 4.00%TIPS Barclays US TIPS 3.10% 3.00% 0.75% 5.30% 4.20%Emerging Markets Debt EMBI Global Diversified 5.10% 4.70% 2.45% 10.00% 6.50%Leveraged Loans S&P/LSTA Leveraged Loan 100 5.35% 4.95% 2.70% 9.85% 6.40%High Yield ML US High-Yield Master II 5.50% 5.00% 2.75% 11.10% 8.00%
OtherCommodities Bloomberg Commodity 4.40% 2.75% 0.50% 18.50% 2.25%Real Estate Callan Real Estate 7.35% 6.15% 3.90% 16.50% 5.00%Private Equity TR Post Venture Cap 13.55% 8.50% 6.25% 33.05% 0.00%Cash Equivalents 90-Day T-Bill 2.25% 2.25% 0.00% 0.90% 2.25%
Inflation CPI-U 2.25% 2.25% 1.50%
* Geometric returns are derived from arithmetic returns and the associated risk (standard deviation).
105

32 New York City Employees’ Retirement System
Asset Allocation Education Knowledge. Experience. Integrity.
2015 Capital Market Projections Long-Term Correlation Projections (2015 – 2024)
Ɣ Relationships between asset classes are important.
Ɣ To determine portfolio mixes, Callan employs mean-variance optimization.
Ɣ Return, standard deviation and correlation determine the composition of efficient asset mixes.
Source: Callan Associates
1 2 3 4 5 6 7 8 9 10 11 12 13 14 15 16 17 18 19 20 21 22 231 US Broad Equity 1.00 0.00 0.00 0.00 0.00 0.00 0.00 0.00 0.00 0.00 0.00 0.00 0.00 0.00 0.00 0.00 0.00 0.00 0.00 0.00 0.00 0.00 0.002 Large Cap 1.00 1.00 0.00 0.00 0.00 0.00 0.00 0.00 0.00 0.00 0.00 0.00 0.00 0.00 0.00 0.00 0.00 0.00 0.00 0.00 0.00 0.00 0.003 Small/Mid Cap 0.96 0.94 1.00 0.00 0.00 0.00 0.00 0.00 0.00 0.00 0.00 0.00 0.00 0.00 0.00 0.00 0.00 0.00 0.00 0.00 0.00 0.00 0.004 International Equity 0.85 0.85 0.82 1.00 0.00 0.00 0.00 0.00 0.00 0.00 0.00 0.00 0.00 0.00 0.00 0.00 0.00 0.00 0.00 0.00 0.00 0.00 0.005 Emerging Markets Equity 0.86 0.86 0.84 0.86 1.00 0.00 0.00 0.00 0.00 0.00 0.00 0.00 0.00 0.00 0.00 0.00 0.00 0.00 0.00 0.00 0.00 0.00 0.006 Global Ex-US Equity 0.88 0.88 0.85 0.99 0.93 1.00 0.00 0.00 0.00 0.00 0.00 0.00 0.00 0.00 0.00 0.00 0.00 0.00 0.00 0.00 0.00 0.00 0.007 Natural Resources Equity 0.77 0.77 0.75 0.71 0.77 0.75 1.00 0.00 0.00 0.00 0.00 0.00 0.00 0.00 0.00 0.00 0.00 0.00 0.00 0.00 0.00 0.00 0.008 US REITs 0.85 0.84 0.86 0.84 0.80 0.85 0.77 1.00 0.00 0.00 0.00 0.00 0.00 0.00 0.00 0.00 0.00 0.00 0.00 0.00 0.00 0.00 0.009 Non-US REITs 0.87 0.87 0.85 0.87 1.00 0.94 0.78 0.83 1.00 0.00 0.00 0.00 0.00 0.00 0.00 0.00 0.00 0.00 0.00 0.00 0.00 0.00 0.0010 Listed Infrastructure 0.97 0.95 1.00 0.84 0.86 0.87 0.76 0.86 0.87 1.00 0.00 0.00 0.00 0.00 0.00 0.00 0.00 0.00 0.00 0.00 0.00 0.00 0.0011 Alternative Equity 0.93 0.92 0.93 0.86 0.89 0.89 0.89 0.90 0.90 0.93 1.00 0.00 0.00 0.00 0.00 0.00 0.00 0.00 0.00 0.00 0.00 0.00 0.0012 Short Duration -0.24 -0.23 -0.26 -0.23 -0.28 -0.25 -0.18 -0.20 -0.26 -0.26 -0.24 1.00 0.00 0.00 0.00 0.00 0.00 0.00 0.00 0.00 0.00 0.00 0.0013 Domestic Fixed -0.11 -0.10 -0.13 -0.10 -0.15 -0.12 -0.15 -0.10 -0.13 -0.13 -0.10 0.87 1.00 0.00 0.00 0.00 0.00 0.00 0.00 0.00 0.00 0.00 0.0014 Non US Fixed 0.01 0.05 -0.10 0.06 -0.09 0.01 0.05 0.01 -0.07 -0.09 0.00 0.48 0.51 1.00 0.00 0.00 0.00 0.00 0.00 0.00 0.00 0.00 0.0015 TIPS -0.05 -0.05 -0.07 -0.05 -0.06 -0.05 0.03 0.11 -0.04 -0.07 0.07 0.53 0.58 0.34 1.00 0.00 0.00 0.00 0.00 0.00 0.00 0.00 0.0016 Emerging Markets Debt 0.59 0.59 0.55 0.53 0.55 0.55 0.51 0.51 0.56 0.56 0.67 -0.12 0.03 0.01 0.17 1.00 0.00 0.00 0.00 0.00 0.00 0.00 0.0017 Leveraged Loans 0.68 0.68 0.64 0.61 0.63 0.63 0.58 0.59 0.63 0.65 0.75 -0.15 0.02 0.01 0.15 0.99 1.00 0.00 0.00 0.00 0.00 0.00 0.0018 High Yield 0.60 0.61 0.58 0.57 0.57 0.59 0.49 0.49 0.57 0.59 0.64 -0.17 0.04 0.12 0.03 0.39 0.48 1.00 0.00 0.00 0.00 0.00 0.0019 Commodities 0.16 0.16 0.16 0.16 0.17 0.17 0.50 0.20 0.17 0.16 0.39 -0.22 -0.12 0.05 0.10 0.19 0.20 0.10 1.00 0.00 0.00 0.00 0.0020 Real Estate 0.73 0.73 0.72 0.65 0.65 0.67 0.65 0.80 0.67 0.72 0.76 -0.14 -0.02 -0.05 0.01 0.45 0.52 0.54 0.20 1.00 0.00 0.00 0.0021 Private Equity 0.94 0.94 0.91 0.90 0.90 0.93 0.78 0.82 0.90 0.93 0.91 -0.24 -0.18 -0.06 -0.09 0.56 0.65 0.61 0.18 0.72 1.00 0.00 0.0022 Cash Equivalents -0.04 -0.03 -0.08 -0.01 -0.10 -0.04 0.05 -0.06 -0.09 -0.07 -0.05 0.30 0.10 -0.09 0.07 -0.07 -0.08 -0.11 0.07 -0.06 0.00 1.00 0.0023 Inflation -0.03 -0.02 -0.04 -0.05 0.05 -0.02 0.32 0.14 0.05 -0.04 0.14 -0.20 -0.28 -0.15 0.16 0.00 0.00 0.06 0.40 0.15 -0.03 0.05 1.00
106

Pros and Cons of Various Asset Classes
107

34 New York City Employees’ Retirement System
Asset Allocation Education Knowledge. Experience. Integrity.
Additional Investment Strategies
Strategy Advantages Disadvantages
Private Equity • Higher expected returns than public equities • Illiquid
• Differentiated source of return • High fees relative to public markets
• Additional portfolio diversification • Allocation must be a long-term commitment
• Available to smaller investors via fund-of-funds
• Investment pattern can produce losses in early years
• Implementation risk (need to select top
quartile managers; median manager does not beat S&P; difficult to value/monitor)
Real Estate • Returns are generally between stocks and bonds • Illiquid
(Including Timber) • Strong income component • High fees relative to stocks and bonds • Low volatility • Economically cyclical
• Provides diversification • Implementation risk (can be difficult and time consuming to monitor)
• Potential for higher risk-adjusted returns • Illiquid (often significant exposure to poorly traded instruments)
• Returns are generally between stocks and bonds
• Some key risks cannot be quantified (lack of transparency, potential for fraudulent behavior)
Hedge Funds • Capital preservation • High fees relative to public markets
• Reduced volatility • Implementation risk (solely reliant on
manager skill for positive return; no custodian; difficult to monitor)
• Attractive correlations • Capacity constraints • High level of income • Could be illiquid
108

35 New York City Employees’ Retirement System
Asset Allocation Education Knowledge. Experience. Integrity.
Additional Investment Strategies
Strategy Advantages Disadvantages
Emerging Markets Debt • Global growth outlook favors emerging market economies over developed.
• During risk-off environments, fundamentals can be ignored.
• The market has evolved into three distinct segments, each with unique risk/return characteristics.
• Although liquidity has improved, bid-offer spreads can be wide during periods of market stress.
• External sovereign and corporate debt offer a yield pick-up versus other spread product with similar credit quality.
• Ability to pay has improved, but willingness to pay may be influenced by shifting political regimes.
• Local sovereign debt diversifies U.S. interest rate risk, offers an attractive real yield and provides the potential for currency appreciation.
• Emerging market debt may potentially increase the risk profile of the fixed income structure.
• Expanding market has increased breadth and depth leading to better liquidity and pricing.
109

36 New York City Employees’ Retirement System
Asset Allocation Education Knowledge. Experience. Integrity.
Hedge Funds
Ɣ Historical hedge fund returns have often been between the returns of stocks and bonds
Ɣ Hedge funds have not always preserved capital – Hedge funds were down almost 20% in 2008 but this was about half the loss of equities – Hedge funds also had a negative year in 2011
Ɣ Hedge funds with cash plus return goals challenged to perform well when cash yields near zero
Historical Calendar-Year Returns
2005 2006 2007 2008 2009 2010 2011 2012 2013 2014(60)
(40)
(20)
0
20
40
60
Calendar-Year Returns for10 Years Ended December 31, 2014
Retu
rns
HF HFRI Fund Weighted Composite US Eq R3000 NUS Eq ACWI ex USA US Fix BC Agg
9.312.9 10.0
(19.0)
20.0
10.2
(5.3)
6.4 9.13.06.1
15.7
5.1
(37.3)
28.3
16.9
1.0
16.4
33.6
12.617.1
27.2
17.1
(45.2)
42.1
11.6
(13.3)
17.4 15.8
(3.4)
2.4 4.3 7.0 5.2 5.9 6.5 7.84.2
(2.0)
6.0
110

37 New York City Employees’ Retirement System
Asset Allocation Education Knowledge. Experience. Integrity.
Hedge Funds
Ɣ Over rolling 5-year periods hedge funds have had consistently positive returns
Ɣ Performance experienced a fairly steady downward decline but seems to have stabilized after the financial crisis
Historical Rolling 5-Year Returns
1995
1996
1997
1998
1999
2000
2001
2002
2003
2004
2005
2006
2007
2008
2009
2010
2011
2012
2013
2014
2015
(15)(10)
(5)05
101520253035
for 20 Years Ended March 31, 2015Rolling 20 Quarter Returns
Retu
rns
HF HFRI Fund Weighted Composite
US Eq R3000
NUS Eq MSCI World ex USA
US Fix Core+5
111

38 New York City Employees’ Retirement System
Asset Allocation Education Knowledge. Experience. Integrity.
Hedge Funds
Ɣ Hedge fund risks tend to be between those of stocks and bonds
Ɣ Hedge fund standard deviations have varied over time – Standard deviations grew to about 10% after both the bursting of the tech bubble and the financial crisis – Observed volatility muted by the absence of public trades – Risks such as illiquidity are not reflected in standard deviations
Historical Rolling 5-Year Risks
1995
1996
1997
1998
1999
2000
2001
2002
2003
2004
2005
2006
2007
2008
2009
2010
2011
2012
2013
2014
2015
0
5
10
15
20
25
30
for 20 Years Ended March 31, 2015Rolling 20 Quarter Standard Deviation
Stan
dard
Dev
iatio
n
HF HFRI Fund Weighted Composite
US Eq R3000
NUS Eq MSCI World ex USA
US Fix Core+5
112

39 New York City Employees’ Retirement System
Asset Allocation Education Knowledge. Experience. Integrity.
Hedge Funds
Ɣ Hedge fund correlations with equity markets are high
Ɣ The overall ability of hedge funds to diversify equity has substantially diminished – Correlations calculated over shorter time periods show some decline over recent periods
Historical Rolling 5-Year Correlations
1995
1996
1997
1998
1999
2000
2001
2002
2003
2004
2005
2006
2007
2008
2009
2010
2011
2012
2013
2014
2015
(1.00)
(0.75)
(0.50)
(0.25)
0.00
0.25
0.50
0.75
1.00
for 20 Years Ended March 31, 2015Rolling 20 Quarter Correlation Relative To HF HFRI Fund Weighted Composite
Corr
elat
ion
US Eq R3000
NUS Eq MSCI World ex USA
US Fix Core+5
113

40 New York City Employees’ Retirement System
Asset Allocation Education Knowledge. Experience. Integrity.
Hedge Funds Portfolio Diversification
114

NYCERS Asset Allocation Preview and Sample Output
115

42 New York City Employees’ Retirement System
Asset Allocation Education Knowledge. Experience. Integrity.
Overview
Ɣ Current New York State law imposes a “basket clause” on NYCERS – The intent of the law is to prevent funds such as NYCERS from taking “too much” risk by limiting the
allocations to “risky” investments – The basket clause is complex so its description is relegated to the appendix – The law is counterproductive for 3 reasons
– It does not take into account the diversification benefits of the asset classes it restricts – It does not take into account the concentration in permitted assets that it creates – It does not recognize the potential for disproportionately higher returns from these “risky” assets
Ɣ The purpose of this study is three-fold – To the extent possible construct a well-diversified asset allocation with an expected return equal to the
actuarially-assumed expected return of 7% – Construct this asset allocation with the minimum amount of investment risk required to earn 7% – Comply with the basket clause
Ɣ The study begins with an asset allocation unconstrained by the basket clause – This makes explicit the limitations that are imposed by the basket clause
Ɣ The asset allocation is adjusted to reflect the basket clause and practical implementation limitations
Ɣ The asset mixes are reviewed to evaluate their performances under different market conditions
Study Objectives and Process
116
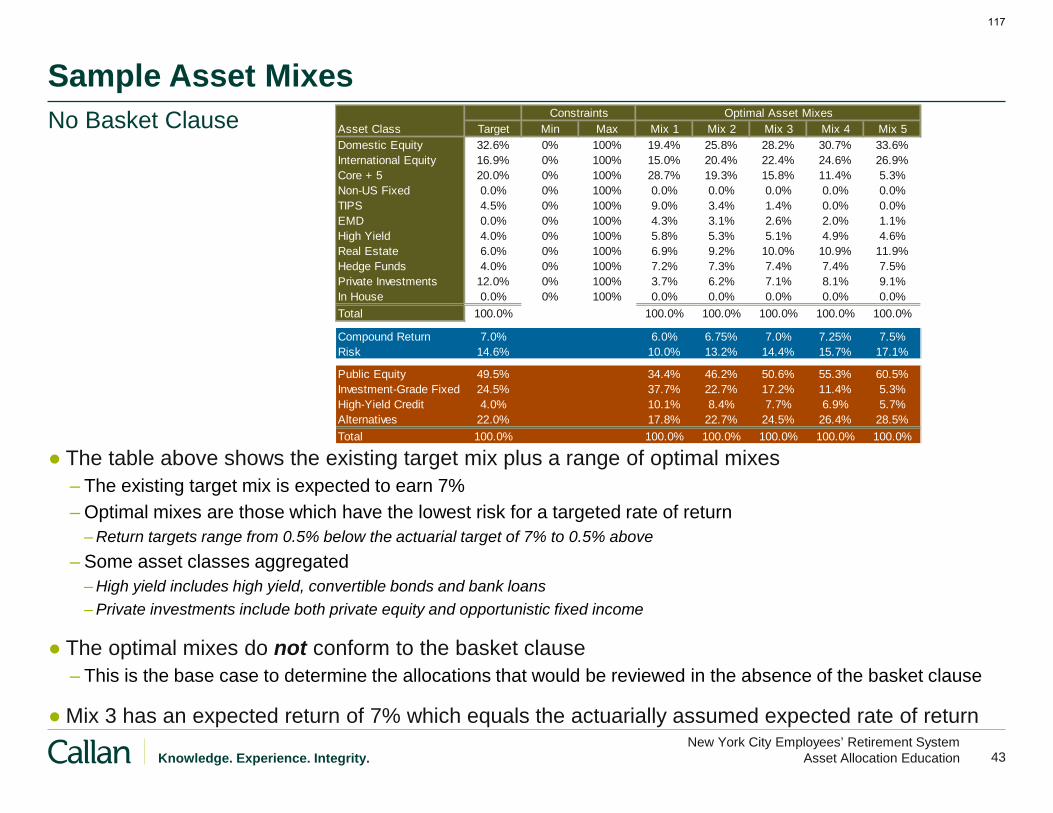
43 New York City Employees’ Retirement System
Asset Allocation Education Knowledge. Experience. Integrity.
Sample Asset Mixes
Ɣ The table above shows the existing target mix plus a range of optimal mixes – The existing target mix is expected to earn 7% – Optimal mixes are those which have the lowest risk for a targeted rate of return
– Return targets range from 0.5% below the actuarial target of 7% to 0.5% above – Some asset classes aggregated
– High yield includes high yield, convertible bonds and bank loans – Private investments include both private equity and opportunistic fixed income
Ɣ The optimal mixes do not conform to the basket clause – This is the base case to determine the allocations that would be reviewed in the absence of the basket clause
Ɣ Mix 3 has an expected return of 7% which equals the actuarially assumed expected rate of return
No Basket Clause Constraints Optimal Asset MixesAsset Class Target Min Max Mix 1 Mix 2 Mix 3 Mix 4 Mix 5Domestic Equity 32.6% 0% 100% 19.4% 25.8% 28.2% 30.7% 33.6%International Equity 16.9% 0% 100% 15.0% 20.4% 22.4% 24.6% 26.9%Core + 5 20.0% 0% 100% 28.7% 19.3% 15.8% 11.4% 5.3%Non-US Fixed 0.0% 0% 100% 0.0% 0.0% 0.0% 0.0% 0.0%TIPS 4.5% 0% 100% 9.0% 3.4% 1.4% 0.0% 0.0%EMD 0.0% 0% 100% 4.3% 3.1% 2.6% 2.0% 1.1%High Yield 4.0% 0% 100% 5.8% 5.3% 5.1% 4.9% 4.6%Real Estate 6.0% 0% 100% 6.9% 9.2% 10.0% 10.9% 11.9%Hedge Funds 4.0% 0% 100% 7.2% 7.3% 7.4% 7.4% 7.5%Private Investments 12.0% 0% 100% 3.7% 6.2% 7.1% 8.1% 9.1%In House 0.0% 0% 100% 0.0% 0.0% 0.0% 0.0% 0.0%Total 100.0% 100.0% 100.0% 100.0% 100.0% 100.0%
Compound Return 7.0% 6.0% 6.75% 7.0% 7.25% 7.5%Risk 14.6% 10.0% 13.2% 14.4% 15.7% 17.1%
Public Equity 49.5% 34.4% 46.2% 50.6% 55.3% 60.5%Investment-Grade Fixed 24.5% 37.7% 22.7% 17.2% 11.4% 5.3%High-Yield Credit 4.0% 10.1% 8.4% 7.7% 6.9% 5.7%Alternatives 22.0% 17.8% 22.7% 24.5% 26.4% 28.5%Total 100.0% 100.0% 100.0% 100.0% 100.0% 100.0%
117

APPENDICES:
118

Basket Clause
119

NYCERS - BASKET/NON BASKET SUMMARY
As of May 31st, 2015
Equity Non Basket* Basket* Total Non Basket* Basket* TotalDomestic Equity 33.5% 0.0% 33.5% 33.5% 0.0% 33.5%
Non-U.S. Equity 10.0% 7.0% 17.0% 10.0% 7.1% 17.1%
Private Equity 0.0% 7.0% 7.0% 0.0% 7.3% 7.3%
Real Assets 4.8% 0.0% 4.8% 4.8% 0.0% 4.8%
Hedge Funds 0.0% 3.1% 3.1% 0.0% 3.1% 3.1%
Total Equity 48.3% 17.1% 65.5% 48.3% 17.6% 65.9%
Fixed IncomeCore+5 20.8% 0.5% 21.3% 17.0% 0.5% 17.5%
U.S. Gov't Sector 4.3% 0.0% 4.3% 2.0% 0.0% 2.0%Mortgage Sector 7.8% 0.0% 7.8% 6.4% 0.0% 6.4%
Credit Sector 8.8% 0.5% 9.3% 7.7% 0.5% 8.2%
High Yield 2.7% 0.8% 3.5% 3.0% 0.8% 3.8%
Bank Loans 0.0% 1.8% 1.8% 0.0% 1.8% 1.8%
TIPS 4.1% 0.5% 4.5% 2.9% 0.3% 3.2%
Convertibles 1.0% 0.0% 1.0% 1.0% 0.0% 1.0%
Opportunistic Fixed Income 0.0% 2.4% 2.4% 0.0% 2.4% 2.4%
Other Fixed Income 0.0% 0.0% 0.0% 4.4% 0.0% 4.4%
Total Fixed Income 28.6% 5.9% 34.5% 28.3% 5.8% 34.1%
Total Fund 76.9% 23.1% 100.0% 76.6% 23.4% 100.0%
Remaining Capacity 1.9% 1.6%
* Note: Basket amounts are estimates
Adjusted Fund Policy Fund Actual (PE & RE on an invested basis)
120

Liquidity Analysis
121

NYCERS Liquidity Profile - Static Analysis
AUM as of May 31, 2015
Current MV Today 1 Year 2 Years
Domestic Equity $18,470 $18,470 $18,470 $18,470
International Equity 5,753 5,753 5,753 5,753
Emerging Markets 3,693 3,693 3,693 3,693
Hedge Funds 1,733 0 1,210 1,733
REITS 0 0 0 0
Private Equity 4,047 0 0 0
Private Real Estate 2,656 0 0 0
Core + 5 9,657 9,657 9,657 9,657
TIPS 1,778 1,778 1,778 1,778
Opportunistic Fixed Income 1,312 984 1,312 1,312
Enhanced Yield 2,101 2,101 2,101 2,101
Bank Loans 1,008 1,008 1,008 1,008
Convertible Bonds 550 550 550 550
ETI 645 125 363 363
Cash 1,757 1,757 1,757 1,757
Total Assets $55,160 $45,876 $47,652 $48,175
Total Illiquid $ $9,284 $7,508 $6,985Total Illiquid % 16.8% 13.6% 12.7%
Unfunded PE Commitments $2,100
Unfunded RE Commitments 788
Unfunded OFI Commitments 455
Total commitments $ $3,343Total commitments % 6.1%
Liquid Assets
6/30/15
122

NYCERS Liquidity Profile - Static Analysis
AUM as of May 31, 2015
Denominator Effect - Decrease AUM by One-ThirdTotal Illiquid $ $9,284 $7,508 $6,985Total Illiquid % 25.2% 20.4% 19.0%Note: Assumes zero realizations, no new commitments and a five-year investment period; funded out of liquids
Current MV Today 1 Year 2 YearsTotal Assets $55,160 $45,876 $47,652 $48,175
Private Equity, Real Estate and Opportunistic Fixed Income Stress CaseUnfunded PE Commitments Drawn $2,100 $420 $840Unfunded RE Commitments Drawn 788 158 315Unfunded OFI Commitments Drawn 455 227 0Total commitments $ $3,343 $805 $1,155Total commitments % 6.1% 1.5% 2.1%
Total Illiquid $ $8,313 $8,140Total Illiquid % 15.1% 14.8%Note: Assumes zero realizations, no new commitments and a five-year investment period; funded out of liquids
Denominator Effect - Decrease AUM by One-ThirdTotal Illiquid $ $9,284 $8,313 $8,140Total Illiquid % 25.2% 22.6% 22.1%Note: Assumes zero realizations, no new commitments and a five-year investment period; funded out of liquids
6/30/15
Liquid Assets
123


![Q1€¦ · Market segment (index representation) as follows: US Stock Market (Russell 3000 Index), International Developed Stocks (MSCI World ex USA Index [net div.]), Emerging Markets](https://img.pdfslide.net/doc/110x75/5f72bf310a58335cf94e071d/q1-market-segment-index-representation-as-follows-us-stock-market-russell-3000.jpg)