Embed Size (px)
Citation preview
NEW YORK CITY HOUSING AUTHORITY
NEW YORK, NEW YORK
COMPREHENSIVE
NNUAL FINANCIAL REPORT
FOR THE
YEAR ENDED
DECEMBER 31, 2003
COMPREHENSIVE ANNUAL FINANCIAL REPORT
FOR THE YEARS ENDED
DECEMBER 31, 2016 AND 2015


Shola Olatoye
Chair & Chief Executive Officer
Michael Kelly Karen Caldwell
General Manager Executive Vice President &
Chief Financial Officer


New York City Housing Authority
New York, New York
Comprehensive Annual Financial Report
For the Years Ended December 31, 2016 and 2015
TABLE OF CONTENTS
Page No.
INTRODUCTORY SECTION (UNAUDITED)
Letter of Transmittal ` 1
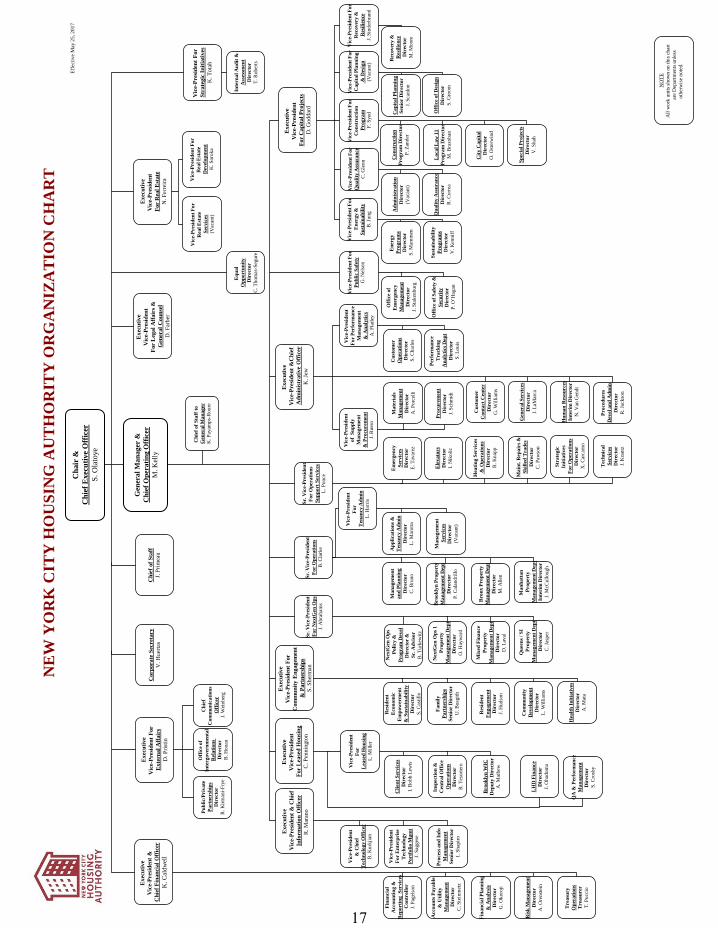
Organization Chart 17
List of Principal Officials 21
FINANCIAL SECTION
Report of Independent Auditors 27
Management’s Discussion and Analysis (Unaudited) 31
Basic Financial Statements
Statements of Net Position 41
Statements of Revenues, Expenses and Changes in Net Position 42
Statements of Cash Flows 43
Notes to the Financial Statements 45
Required Supplementary Information (Unaudited)
Other Postemployment Benefits Plan – Schedule of Funding Progress 111
Schedule of the Authority’s Contributions to the New York City
Employees’ Retirement System (NYCERS) 113
Schedule of the Authority’s Proportionate Share of the Net Pension
Liability of NYCERS 115
TABLE OF CONTENTS
(continued)
Page No.
STATISTICAL SECTION (UNAUDITED)
Financial Trends
Comparative Operating and Non-Operating Revenues and Expenses 125
Net Position by Category 127
Capital Assets by Category 129
Revenue Capacity
Revenue on a Gross Basis 133
Debt Capacity
Long Term Debt 137
Pledged Revenue Coverage 141
Historical Federal Operating Subsidy 145
Historical Federal Capital Fund Awards 147
Demographic and Economic Information
Resident Demographics – Operating Programs 151
Resident Demographics – Housing Choice Voucher Program 153
Demographic and Economic Statistics – Ten Year Trend 155
NYCHA Demographic and Economic Statistics – Ten Year Trend 157
City of New York – Persons Receiving Public Assistance – Ten
Year Trend 159
Nonagricultural Wage and Salary Employment – Ten Year Trend 161
Employment Status of the Resident Population – Ten Year Trend 163
Operating Information
Public Housing Assessment System (PHAS) – Interim Rule 167
Summary of Public Housing Developments 169
Lease Commitments 171
Employee Head Counts 173

Coney Island Groundbreaking, Borough of Brooklyn
August 3, 2016


New Roof at Queensbridge Houses, Borough of Queens
December 1, 2016

SHOLA OLATOYE CHAIR & CHIEF EXECUTIVE OFFICER
1
NEW YORK CITY HOUSING AUTHORITY 250 BROADWAY NEW YORK, NY 10007
TEL: (212) 306-3000 http://nyc.gov/nycha
June 14, 2017
Members of the Authority
New York City Housing Authority
New York, New York
The Real Estate Assessment Center (“REAC”) of the U.S. Department of Housing and Urban
Development (“HUD”) requires that all public housing authorities publish, within nine months of the
close of each fiscal year, a complete set of financial statements presented in conformity with accounting
principles generally accepted in the United States of America (“GAAP”) and audited in accordance with
auditing standards generally accepted in the United States of America and the standards applicable to
financial audits contained in Government Auditing Standards by a firm of independent certified public
accountants. Pursuant to that requirement, we hereby issue the Comprehensive Annual Financial Report
(“CAFR”) of the New York City Housing Authority (the “Authority” or “NYCHA”) for the year ended
December 31, 2016.
This report consists of management’s representations concerning the finances of the Authority.
Consequently, management is responsible for the completeness and reliability of all the information
presented in this report. To provide for a reasonable basis for making these representations,
management of the Authority has established a comprehensive internal control framework that is
designed both to protect its assets from loss, theft, or misuse and to compile sufficient reliable
information for the preparation of the Authority’s financial statements in conformity with GAAP.
Because the cost of internal controls should not outweigh its benefits, the Authority’s comprehensive
framework of internal controls has been designed to provide reasonable rather than absolute assurance
that the financial statements will be free of material misstatement. As management, we assert that to the
best of our knowledge and belief, this financial report is complete and reliable in all material respects.
The Authority’s 2016 financial statements have been audited by independent public accountants,
Deloitte & Touche, LLP. The purpose of the independent audit is to provide reasonable assurance that
the financial statements of the Authority present fairly, in all material respects, the financial position of
the Authority.
The independent audit involved performing procedures to obtain audit evidence about the amounts and
disclosures in the financial statements. The procedures selected depend on the auditors’ judgment,
including the assessment of the risks of material misstatement of the financial statements, whether due to
fraud or error. In making those risk assessments, the auditor considers internal control relevant to the
Authority’s preparation and fair presentation of the financial statements in order to design audit
procedures that are appropriate in the circumstances, but not for the purpose of expressing an opinion on
the effectiveness of the Authority’s internal control. An audit also includes evaluating the
2
appropriateness of accounting policies used and the reasonableness of significant accounting estimates
made by management, as well as evaluating the overall presentation of the financial statements.
The independent auditors issued an unmodified opinion on the Authority’s financial statements for the
years ended December 31, 2016 and December 31, 2015, indicating that they were fairly presented, in
all material respects, and in conformity with GAAP. The independent auditors’ report is presented as
the first component of the financial section of this CAFR.
GAAP requires that management provide a narrative introduction, overview, and analysis to accompany
the basic financial statements in the form of Management’s Discussion and Analysis (“MD&A”). This
letter of transmittal is designed to complement MD&A and should be read in conjunction with it. The
Authority’s MD&A can be found immediately following the independent auditors’ report.
Profile of the Authority
The Authority, created in 1934, is a public benefit corporation chartered under New York State Public
Housing Law. The Authority is a component unit of The City of New York.
The Authority provides affordable housing to approximately 400,000 low and moderate income New
York City residents in 326 housing developments with approximately 176,000 apartments in the five
boroughs, housing approximately 397,000 residents. Through the Section 8 Housing Choice Voucher
Program, the Authority assists approximately 85,000 families in locating and renting housing in
privately owned buildings, housing approximately 204,000 residents. Additionally, the Authority oversees
a network of over 400 community-based facilities that include community and senior centers, healthcare
terminals, day care centers, and Head Start educational centers.
The Authority’s basic financial statements consist of a single enterprise fund, which includes the
following programs:
Low Rent Housing Program
Public Housing Capital Fund Program
Section 8 Housing Choice Voucher Program
Section 8 Rental New Construction Program
Other Grant Programs
Please refer to Note 1 to the financial statements for a description of Authority programs. For further
analysis, we have also included supplemental financial schedules for the programs individually, which
can be found following the notes to the basic financial statements.
The Authority’s basic financial statements also include the following blended component units:
NYCHA Public Housing Preservation I, LLC
NYCHA Public Housing Preservation II, LLC
Please refer to Note 21 to the financial statements for a description of these component units.
3
Factors Affecting Financial Condition
To assess the Authority’s overall financial condition, the following information contained within the
Authority’s financial statements should be considered in connection with an understanding of the
following major factors affecting its financial condition:
Congressional Budget and HUD Policy. As a public housing authority (“PHA”), the Authority’s
primary source of funding is HUD. The amount of funding received from HUD is affected by
Congressional housing legislation and the federal budget. The Authority continually monitors changes
and trends in the Congressional Budget and HUD policy and adjusts its strategy and financial planning
accordingly.
Operating Fund Rule. HUD’s operating fund rule became effective on November 18, 2005. The rule
amended the Public Housing Operating Fund Program’s regulations and provided a new formula for the
distribution of operating subsidies to PHAs. This rule converted public housing to a development-based
system of management, accounting and funding. It also required PHAs to convert within five years of
the effective date. The change was driven by the real property concept of asset management, in which a
property manager considers both the short-term needs and the long-term positioning of real estate assets.
The rule was estimated to reduce the Authority’s annual funding by over $60 million. For PHAs which
would not benefit from the new formula funding, HUD provided additional incentive funding for early
conversion on a sliding scale over a five year period. On December 21, 2008, HUD approved the
Authority’s Year 2 “Stop-Loss” package, which has the effect of increasing NYCHA’s subsidy
eligibility by about $46 million annually.
2016 Subsidy. During 2016, the Authority was allocated $912 million or 90 percent of its eligible
operating subsidy from HUD, and $393 million in funding from HUD for the Public Housing Capital
Fund Program. Also during 2016, the Authority received $1,072 million in subsidies from HUD for the
Section 8 Housing Voucher Programs.
2016 Subsidy and the Impact of Proration. If NYCHA were to be awarded 100 percent of its total
subsidy eligibility, there would not be an operating deficit in the Authority’s Five Year Plan. In fact,
NYCHA would have additional resources to meet the needs of residents by supporting critically needed
frontline staff, such as maintenance workers, caretakers, and skilled trade persons. However,
appropriations have generally fallen short of the funding levels required to fully fund public housing
operations in accordance with HUD’s eligibility formula. Additionally, while HUD’s formula takes
location into account, New York City has long advocated that the system is inequitable when one
considers the City’s uniquely high construction costs as well as higher employment costs in comparison
to Authorities across the US. In FY 2016, PHAs nationwide were eligible to receive 4.9 billion.
However the amount available for distribution was $4.4 billion, which translates to 90 cents for every
dollar needed (effective proration of 90 percent). The FY 2017 Plan assumes a proration of 87 percent
with an expected loss of funding of approximately $123 million. Any adverse changes in funding
appropriation would have a negative impact on the Authority’s funding levels.
Capital Fund Financing Program. On September 10, 2013, the Authority entered into a Loan
Agreement with the New York City Housing Development Corporation (“HDC”), borrowing
4
approximately $701 million of bond proceeds issued under the Capital Fund Grant Revenue Bond
Program at a weighted average interest rate of 4.8%. The face amount of the bonds consisted of
$185,785,000 of Series 2013A bonds (“Series A bonds”) and $470,300,000 of Series 2013B (“Series B
bonds”). The Series B bonds had two sub-series: Series 2013B-1 $348,130,000 and Series 2013B-2
$122,170,000. The bond premiums were $15,020,118 and $29,695,129 on the Series A bonds and
Series B bonds, respectively.
The Series 2013A bonds proceeds were used together with other available funds in the prior Series
2005A bond program as an advance refund of the remaining balance of the pre-existing Series 2005A
bonds and to defease the existing debt. The Series 2013 B bond proceeds are available to be used to fund
acquisition, construction or rehabilitation, and make capital improvement at up to 39 specified Authority
developments. Capital improvements primarily include “building envelope” work on roofs, brickwork,
and windows, etc. The proceeds of these bonds that have been loaned to the Authority by HDC were
placed in escrow accounts with a Trustee bank. The Authority draws down funds from the Trustee by
means of capital fund requisitions as work is completed.
Federalization of New York State and City of New York Developments. Subsidy funding for 21
developments originally built by the State of New York and the City of New York was eliminated by the
State in 1998 and by the City in 2003. These unsubsidized public housing units have contributed
significantly to NYCHA’s structural operating deficit through the years.
A first step in addressing the funding shortfall for these 21 State and City-built developments was taken
on September 21, 2008, when the Authority received approval of its management plan for its Section 8
Voluntary Conversion Program. The Section 8 Voluntary Conversion program called for a total of
approximately 8,400 unfunded public housing units in the 21 State and City-built developments to be
transitioned into the federally subsidized Section 8 program. Through the end of 2016, the Authority
had converted over 4,000 units in the State and City-built developments to Section 8 funding. The
Authority’s 2016 Five Year Operating Plan contains an initiative to accelerate conversion of
approximately 300 units annually from 2016 to 2020.
The American Recovery and Reinvestment Act of 2009 (ARRA) presented PHAs across the country
with an opportunity to re-invest in and develop public housing units. NYCHA capitalized on this
opportunity to seek funding for the 21 State and City-built developments. On February 23, 2010, New
York State passed new legislation that authorized the Authority to transfer the 21 State and City-built
developments to two ownership entities (NYCHA Public Housing Preservation I, LLC and NYCHA
Public Housing Preservation II, LLC). This was a significant event in support of the Authority’s
Federalization effort. The Governor signed this bill on March 3, 2010.
On March 16, 2010, the Authority closed on the Federalization mixed-finance development plan,
through which it has received more than $400 million in public and private funds to address needed
capital improvements at the 21 developments. The majority of this funding has been invested in capital
improvements at these developments. Through 2015, the investors of NYCHA Public Housing
Preservation I, LLC (“LLC I”) have provided $228 million of this funding in equity payments in return
for low income housing tax credit benefits. The rehabilitation work was completed at all 21
developments during 2013. In addition to the capital funding, NYCHA became eligible to receive
approximately $65 million in recurring annual operating and capital subsidies for nearly 12,000 units at
5
these developments. The first operating subsidy payments for these units were effective October 2010,
and amounted to $15 million. During 2016, 2015, and 2014 the Authority received $62 million, $63
million, and $56 million, respectively, in operating subsidies for these units. These additional subsidies
for previously unfunded public housing units have helped to address NYCHA’s structural operating
needs.
Financial Results and Outlook
The Authority’s Loss before capital contributions for 2016 was $411 million, compared to a gain of $39
million for 2015. The increase in the loss for 2016 was mainly the result of an actuarial loss recognized
for Other Post-Employment Benefits (“OPEB”) due to a change in mortality assumptions and the
absence of actuarial gains from the prior year for lower than expected premium increases. Excluding the
impact of OPEB, the Authority’s loss before capital contributions increased by $134 million largely due
to additional maintenance and operations costs. While the Federalization of the State and City-built
developments has helped to reduce the Authority’s historical budget deficits, ongoing structural
operating deficits are projected to continue, primarily attributable to federal underfunding of public
housing and increased employee entitlement costs. NYCHA’s 2017-2021 Five Year Operating Plan
includes initiatives to increase income, contain costs, and reduce the operating deficit. These include:
Increased Revenue. Rent provides a significant portion of the Authority’s income. Beginning in 2006,
the Authority began phasing in a series of rent increases targeted to residents who were paying less than
30 percent of their income towards rent. In accordance with HUD requirements and changes in federal
law, NYCHA started increasing flat rent charged in 2014 to 80 percent of Fair Market Rent (FMR), up
to 30% of household income. Flat Rents are the maximum rents charged for rent and are based on rent
charged for similar units in the private non-subsidized rental market. It is expected that by the end of
2017 all the HUD-mandated flat rent increases will be completed.
Improve Central Office and Administrative Efficiency. Through the years, the Authority has taken
aggressive measures to contain spending through various workforce reduction programs. These actions
resulted in a year-end headcount of 11,027, a reduction of over 3,900 positions since 2001. The
reduction in headcount is the result of efforts to streamline and reduce redundancy in central office and
by working with the City to transition non-core housing functions to other City agencies that provide
similar services. During 2015, NYCHA transitioned 24 Community Centers along with 56 staff to our
sister agency, the Department of Youth and Community Development. The 2017-2021 Five Year
Operating Plan reflects continued City integration and our strategic hiring plan. Although the Authority
has been taking measures to control costs, savings have been offset by increases in certain other costs
such as employee entitlements including pension, and health insurance. The Authority’s OPEB liability
at December 31, 2016 is over $2.8 billion, and NYCHA continues to use a “pay-as-you-go” approach to
OPEB costs. Due to NYCHA’s funding challenges, as with many other governmental entities, this
liability remains unfunded, and there is no clear source of future funding.
Energy Conservation. As part of the Authority’s strategic capital plan to preserve the NYCHA
portfolio, and in support of the Authority’s comprehensive sustainability agenda, the Authority is
actively pursuing an ambitious, multi-phase energy-conservation program. As a key component of the
agenda, NYCHA has partnered with HUD and DOE on the Better Building Challenge and committed to
reduce its per-square-foot energy use by 20% by 2025, resulting in avoided emissions of 247,000 tons of
6
CO2e, equivalent to taking 52,500 cars off the road daily. To achieve this ambitious goal, the Authority
plans to perform energy and sustainability retrofits throughout the NYCHA portfolio through
private/public partnerships, including $300 million through Energy Performance Contracts and $30
million through other public/private subsidy programs by 2025.
$18 million Energy Performance Contract - In 2012 the Authority developed an $18 million Energy
Performance Contract (“EPC”) to upgrade lighting at 17 developments and to upgrade heating systems
at six developments. This EPC is in its fourth year of performance monitoring, and as in past years, is
performing satisfactorily. As of 2016, NYCHA received an additional EPC Rate Reduction Incentive,
which in 2016 totaled $1.7 million for the 17 sites.
$300 million Energy Performance Contract Series – In December 2016, NYCHA received HUD
approval for a series of large-scale EPCs. The first of the series, a $56 million EPC, “Ameresco-A”, is to
upgrade lighting at 16 developments, and to provide a comprehensive heating plant replacement and
control system upgrade at one development. Construction for Ameresco-A began this March. The
second EPC, “BQDM”, was submitted for HUD approval on March 31, 2017. Two “Sandy” EPCs are
planned to be submitted for HUD approval during the middle of 2017. NYCHA plans to submit
“Ameresco-B” to HUD during the third quarter of 2017.
The series of planned EPCs are intended to fund improvements that provide brighter and more efficient
lights, consistent and comfortable heating, and new water conserving fixtures. Through those EPCs,
NYCHA will:
1. Install indoor temperature controls and energy-efficient lighting fixtures in 75% of large-campus
developments by 2020.
2. Upgrade ventilation in all buildings with mechanical exhaust systems, ensuring that stale air and
excess moisture are removed from apartments.
3. Implement water conservation retrofits, with support from NYC Department of Environmental
Protection.
4. Install Exterior lighting and grounds lighting improvements
DOE Weatherization and Utility Programs - In 2015, NYCHA began to work with energy-efficiency
programs that specialize in upgrades to small buildings comprised of one to four family homes, walk-up
multifamily buildings, and small elevator buildings. NYCHA worked with the New York State
Weatherization Assistance Program (“WAP”) to extend the benefits of WAP to NYCHA buildings. As
of December 2016, NYCHA has pre-qualified 7,300 apartments, which translates to a multi-year total
potential subsidy of $40 million. The agreement for the first $1.3 million WAP pilot project of 222
apartments at two developments was executed in April 2016. NYCHA completed the first phase of
construction at Howard Houses and construction on the 2nd phase is anticipated tobegn in mid-2017.
As of March 2017, the program has scaled up for the 2017-2018 program year. Six WAP agencies are
conducting energy audits at 18 developments, with a total potential subsidy of $12.5 million for 2,338
apartments.
Resident Engagement Programs – The Authority has collaborated with Green City Force (“GCF”) to
create resident-to-resident engagement efforts to empower residents to save energy through friendly
7
competitions. GCF and their Corps Members, young NYCHA residents in training for careers in
sustainability, launched the “Love Where You Live Challenges.” GCF members educated residents
about energy conservation measures, installed CFLs, performed follow-up surveys and help conduct a
unique survey on air conditioning usage at one of our developments. Additionally, in partnership with
the NYC Department of Sanitation (DSNY) GCF has conducted outreach blitzes to engage residents
around recycling. On each blitz day, representatives from DSNY, Green City Force, and non-profit
partner GrowNYC lead door-to-door canvassing and other outreach and education activities to advance
the City’s waste reduction goals.
In 2015 and 2016, GCF partnered with NYCHA and the Mayor’s Office of Criminal Justice (MOCJ) to
target GCF training recruitment and service activities in the 15 sites that are the focus on the Mayor’s
Action Plan to reduce violence in NYCHA. Outside of this special initiative, NYCHA’s Office of
Resident Economic Empowerment & Sustainability (REES) continues to work closely with GCF on
recruiting NYCHA residents citywide into GCF Urban Farm and Energy Corp training opportunities.
Lastly, in 2016 Green City Force built and launched new Farms at NYCHA at three housing
developments in Brooklyn and East Harlem. The 2016 Corps Member cohort built on the experience of
the past Urban Farm Corps that constructed and managed the farm at Red Hook Houses in partnership
led collaboration with Added Value Farms. Farms at NYCHA is part of Building Healthy Communities,
a city-wide partnership led by the Mayor’s Office of Strategic Partnerships and the Fund for Public
Health NYC to improve opportunities for physical activity, expand access to healthy, affordable food,
and promote public safety in 12 priority neighborhoods.
Information Technology. In 2016, the Authority continued to advance in the area of information
technology to support its NextGeneration NYCHA business goals. These projects support NYCHA’s
efforts to achieve short term financial stability and diversify funding for the long term; operate as an
efficient and effective landlord; and develop best-in-class resident services and resident engagement
models. The projects below are examples of enabling information technology activities that the
Authority has deployed in support of its NextGen business goals in 2016:
Operate as an Efficient and Effective Landlord
Self Service Initiatives for Public Housing Residents
Public Housing Annual Reviews
Began phased deployment to NYCHA public housing residents the
online self-service Annual Review process developed in 2015
Online Self-Service Options
Expanded customer access to NYCHA online services by offering
these services in languages other than English, and by improving
accessibility for people with disabilities
8
Improve Back Office Operations – Developments
Tenant Management and Rent Collection System
Began replacement of NYCHA's legacy resident management and
rent collection systems.
Work Order Management
Implemented handheld devices for field work order management.
Storeroom Inventory
Implemented inventory management at development storerooms
through the integration of the work-order management system with
the materials management system.
Improve Back Office Operations – Central Office
HR Digital Files
Began digitizing NYCHA’s paper folders and files with a project to
image human resources records and implement a document
management for HR.
Improve Back Office Operations – Technology Infrastructure
On-Premises Systems to the Cloud
Migrated on-premises systems to the Cloud, beginning with
implementing Microsoft Office 365.
Wireless Devices
Upgraded obsolete wireless devices across the NYCHA campus,
thereby providing support for future Smart Buildings initiatives.
In 2017, the Authority will continue to leverage its investments in advanced technologies in support of
the NextGen NYCHA business vision, and to assist in reducing central office costs. Near-term projects
include extending NYCHA’s online self-service options for applicants, residents, and Section 8 voucher-
holders; bringing more services and Spanish language capability to the MyNYCHA mobile and web-
based app; and, strengthening the digital tools available to NYCHA’s field staff by deploying
approximately 3,500 handheld devices to maintenance workers, skilled trades workers, supers and
assistant supers. To continue to provide the best possible service to our field staff, to reduce maintenance
costs and manage risk, in 2017, the Authority will replace approximately 6,400 outdated and out-of-
warranty desktop computers across all field and central offices.

9
The following are the major initiatives that the Authority will undertake in 2017 in the area of
information technology:
Operate as an Efficient and Effective Landlord
Next Gen Office
New Computers Beginning in April 2017, IT will install new computers for all Field and Central Office users.
The computers will include new software such as Windows 10, Office 365 and the instant
messaging (IM) capability of Skype for Business.
Expand Bandwidth at Management Offices Several NYCHA field sites still use DSL or T1 and perform poorly when interacting with
NYCHA systems like Microsoft Exchange and Maximo. This project will track action plans
to ameliorate performance at those locations. Implement Verizon Ethernet Service (E-LAN) –
for improved communications links and faster performance. The increased bandwidth will
support video conferencing and online learning. Rollout begins February 2017.
VoIP Phones for Borough Management and Field Offices Field office users will have direct lines for desk phones, voicemail routed to their Outlook
inbox, and call forwarding, among other features.
Self Service Initiatives
Public Housing Annual Reviews
This ongoing project will complete deployment to all NYCHA public housing residents the
online self-service Annual Review process developed in 2015.
Tenant Management and Rent Collection System Replacement of NYCHA’s legacy tenant management and rent collection systems. Replace
antiquated NYCHA Project Information Management Systems (PIMS) with new technology
that will enable online self-service as well as improved reporting.
Online NYCHA Applications through Self-Service Portal In 2016, NYCHA migrated its Online Self-Service Portal to a new “Open” user interface that
enhances user experience and is easily accessible on a mobile platform. Migrate NYCHA’s
Online Application process to the Open user interface to improve user experience for its
applicants.
Section 8 Owner App
Currently, NYCHA’s Section 8 Owners transact a significant portion of their business with
NYCHA online. This project will create an app to streamline these transactions, much the
same way MyNYCHA has done for resident work requests.
10
Improve Back Office Operations
Resident Files Digitize existing resident paper folders and files; establish a system to continue storing all
future resident files electronically and reduce manual labor associated with hardcopy files.
Maximo Mobile
Complete rollout of handheld devices to skilled trade workers, supervisors of caretakers, and
supervisors of grounds workers.
Storeroom Inventory
Develop an inventory tracking system for materials at the development storerooms.
Maximo System Enhancements
Implement new functionality for apartments, move-outs and exterminator routine inspections;
Improving integration to NYCHA’s physical plant asset data with Maximo; and, facilitating
data capture for annual HUD-required Physical Needs Assessment.
Siebel System Enhancements
Various initiatives to support the Leased Housing Department, including Portability process
enhancements, streamlining the Transfer process, and processing of annual re-certifications
for Section 8 LLC cases.
Support for RAD Initiatives
In 2017, NYCHA will leverage HUD’s Rental Assistance Demonstration program (RAD), to
convert Ocean Bay to a Section 8 platform.
HR Digital Files
Complete the digitizing of HR employee paper folders and files and deploy a system to
continue storing all future HR employee files electronically reduce manual labor associated
with hardcopy files.
Later in 2017, NYCHA will begin integrating the “location files,” which are local copies of
the employee HR folders, which are maintained at the development offices.
Legal Case Management System
Project will implement a cloud-based case management to replace two systems that do not
meet the needs of the Law Department and are no longer supported by the vendors.
New Forms Management System
Project will replace NYCHA’s automated forms submission software (Movaris) with Adobe
Experience Manager.
11
Infrastructure to the Cloud (Infrastructure as a Service)
Project to analyze feasibility of outsourcing data center operations to a Cloud provider.
Floor Switches
Technology refresh of aging network switches on all floors at 90 church, 250 Broadway, LIC
and Borough Management Offices.
Wireless Bridges
Technology refresh to replace older models of wireless bridges to address Radio Frequency
(RF) saturation. The majority of bridges on the roof tops are over seven years old. They are
using outdated radio frequencies that are prone to saturation. The saturation is adversely
affecting the monitoring and managing of development building's facilities such as elevators,
boilers and CCTV.
Resident Broadband Initiatives
In collaboration with City Hall and DoITT, support mayoral initiative to bridge the digital
divide and provide broadband access to NYCHA residents.
Rebuild, expand, and preserve public and affordable housing stock
Primavera Replacement
Replaces project management software used by CPD and migrating functionality to a Cloud-
based solution.
Control Environment
Audit Committee. The Authority’s Audit Committee has been in existence since June 2003. Per the
amended and restated Charter, approved by the Board on September 25, 2013, the Committee consists of
at least two (2) and not more than seven (7) members. The Chair of NYCHA is responsible for
appointing two members of the Board annually, with the approval of a majority of the Board to the
Committee. The Chair may select up to five other (5) non-Board members, with the approval of a
majority of the Board, who are not NYCHA employees. The Chair of the Audit Committee is selected
by the Chair of NYCHA. The Audit Committee currently consists of four members: two are Board
members and the other two are independent members (neither NYCHA employees nor Board members).
The Audit Committee is co-chaired by two Board members, an independent Board member and a
resident Board member. As a result, the Audit Committee now consists of four highly accomplished
individuals from outside NYCHA with a diverse range of expertise including regulatory and
compliance, resident advocacy, finance, and policy making. Per its Board-approved Charter, the Audit
Committee is charged with assisting the Board in overseeing the reliability of financial reporting, the
adequacy of internal controls, and compliance with statutory and regulatory requirements. The Audit
Committee oversees external audits performed by the Independent Auditor, and reviews the internal
annual risk assessment/Annual Audit Plan, and through its co-chairs monitors the internal audit plan for
the Department of Internal Audit and Assessment.
12
Public Housing Assessment System. In 1999, HUD instituted the Public Housing Assessment System
(“PHAS”) process which measures the performance of PHAs in four categories: Physical Assessment,
Financial Condition, Management Operations, and Resident Satisfaction. The Financial component is
used to determine if the PHA has sufficient financial resources and is managing those resources
effectively to support its operations. During 2011, HUD issued the PHAS Interim Rule, which revised
the previous PHAS guidelines. Under the PHAS Interim Rule, the performance of PHAs is measured in
the following categories: Physical Assessment, Financial Condition, Management Operations, and
Capital Fund Program. One significant change pertains to the financial performance. Under the Interim
Rule, HUD will use indicators that cover both the Financial Condition and Management Operations
components to assess the financial performance of PHAs. The overall score for 2015, under the Interim
Rule, was 84, which designates the Authority as a Standard Performer. The score for the year 2016 will
not be received from HUD until after the submission of the audited Financial Data Schedule.
Risk Management. The Authority’s risk management program minimizes its exposure to potential
losses. The Risk Finance Department’s risk control efforts were developed to support the Authority’s
insurance program and to guard the health and safety of the Authority’s staff. Risk Finance and The
Office of Safety & Security work collaboratively to create and implement a multi-faceted safety strategy
through its efforts with stakeholders both inside and outside the Authority. Mitigation of hazards is
addressed through proper identification of high injury rate locations. Focus Groups and safety
committees help address safe work practices and ensure safe conditions within the workplace.
The 1,746 reported employee claims in 2016 was the lowest since Risk Finance began tracking this
statistic in 1995, when there were 3,520 claims. In 2016, the Authority finished the year with 895
injuries. The 2016 injury rate of 6.7 cases per 200,000 hours worked represents a 26% decrease from
2015.
Except for one significant snowstorm, the 2016 winter season was much milder than the prior year.
Furthermore, the Authority revised its snow removal policies and procedures in 2015. There were fewer
injuries in 2016 during snow removal operations. Additionally, increases in resident recycling efforts in
2016 reduced the amount of glass in the waste stream. Lacerations from broken glass are a frequent
source of injuries to the Authority’s Caretakers.
The Authority continues to enhance its Transitional Return to Work Program (“TRTW”). The goals of
the TRTW Program include accelerating an employee’s ability to return to work by focusing on post-
accident capabilities, facilitating transition from a temporary or a modified job assignment back to pre-
accident work abilities, increasing productivity by decreasing the number of lost workdays, increasing
employee morale by allowing the employee to return and remain at work, and decreasing overall
workers’ compensation costs. At the end of 2016, 33 employees have participated in this program, thus
saving 2,757 days.
Awards and Acknowledgements
GFOA. The Government Finance Officers Association of the United States and Canada (“GFOA”)
awarded a Certificate of Achievement for Excellence in Financial Reporting to the Authority for its
comprehensive annual financial report for the fiscal year ended December 31, 2015. This was the
thirteenth consecutive year that the Authority achieved this prestigious award. In order to be awarded a
Certificate of Achievement, a government unit must publish an easily readable and efficiently organized
13
comprehensive annual financial report that demonstrates a constructive “spirit of full disclosure.” This
report must satisfy both generally accepted accounting principles and applicable legal requirements. A
copy of the 2015 Certificate of Achievement for Excellence in Financial Reporting can be found at the
front of this CAFR.
The Authority has issued its audited financial statements for the year ended December 31, 2016 and
accompanying Single Audit Report three months earlier than required by HUD. This timely issuance
has once again afforded the Authority the opportunity to compete for the Government Finance Officers
Association’s Certificate of Achievement for Excellence in Financial Reporting. We believe that the
current comprehensive annual financial report continues to meet the Certificate of Achievement
Program’s rigorous requirements. NYCHA will submit the CAFR for the year ending December 31,
2016 to the GFOA for award consideration.
New York City Technology Forum and Government Technology Magazine. The New York City
Technology Forum is designed to spread best practices and spur innovation in the public sector. The
New York City Technology Forum and Government Technology Magazine summit has an advisory
board that gathers public sector and private sector leaders to create an agenda designed to make that
passion relevant and actionable to the state and local government organizations attending the summit.
MyNYCHA was selected as one of this year’s winners for Best Mobile Project.
Citizens Budget Commission (CBC). Through the Prize for Public Service Innovation, the Citizens
Budget Commission (CBC) seeks to identify and highlight a New York City or State government
agency that demonstrates an innovative approach to providing government services. The CBC awards
this prize both to celebrate creative thinking and to share government achievements with the public and
other agencies.
The CBC Prize for Public Service Innovation was established in 1997 to recognize and promote
successful innovations in the delivery of public services. The Trustees of the CBC instituted a prize
schedule that alternates annually between New York City and New York State agencies. Recognition
was given to NYCHA for the following initiatives:
MyNYCHA - NYCHA’s Mobile App
Mobile Workforce – NYCHA’s Handheld Maintenance Initiative
NYCHA Self Service Portal
Mobile Digital Vans for Public Housing
MyNYCHA – NYCHA's Mobile App: MyNYCHA is a free app that puts the repair process in
residents’ hands by empowering them to create service requests 24/7. MyNYCHA, which works on
mobile devices, smartphones, and tablets, can be used to manage work tickets, receive alerts for
development outages, select times for repairs, and reschedule repair dates – reducing calls to NYCHA’s
Customer Call Center (CCC). A web version of the app was deployed for residents seeking to utilize
MyNYCHA’s features from a computer in their homes, the library, or NYCHA’s Digital Vans
Mobile Workforce – NYCHA’s Handheld Maintenance Initiative: Digital technology also enables
NYCHA employees to spend less time on paperwork and more time assisting residents. The Authority is
currently piloting the use of a mobile app on Samsung Galaxy smartphones to better manage
maintenance and repairs. Staff are assigned work tickets via the smartphones and can update and close
work orders in real time. Full deployment of this mobile system is planned by the end of 2016.
14

Oceanbay Sandy Recovery Groundbreaking
June 24, 2016

Ch
air
&
Ch
ief
Exec
uti
ve
Off
icer
S. O
lato
ye
Gen
era
l M
an
ag
er &
Ch
ief
Op
era
tin
g O
ffic
er
M. K
elly
Ch
ief
Co
mm
un
ica
tio
ns
Off
icer
J. W
ein
ber
g
Off
ice o
f
Inte
rg
overn
men
tal
Rela
tio
ns
Dir
ecto
r
B. H
on
an
Eq
ua
l
Op
po
rtu
nit
y
Dir
ecto
r
C. T
hom
as-S
egu
re
Ex
ecu
tive
Vic
e-P
resi
den
t
For
Leg
al
Aff
air
s &
Gen
eral
Cou
nse
l
D.
Far
ber
Ex
ecu
tive
Vic
e-P
resi
den
t &
Ch
ief
Ad
min
istr
ati
ve
Off
icer
K.
Jew
Ex
ecu
tive
Vic
e-P
resi
den
t &
Ch
ief
Fin
an
cial
Off
icer
K.
Cal
dw
ell
Ex
ecu
tive
Vic
e-P
resi
den
t F
or
Com
mu
nit
y E
ng
ag
emen
t
& P
art
ner
ship
s
S. S
her
man
Ex
ecu
tive
Vic
e-P
resi
den
t &
Ch
ief
Info
rmati
on
Off
icer
R.
Mar
ano
Vic
e-P
resi
den
t
Fo
r E
nte
rp
ris
e
Tech
no
logy
Po
rtf
oli
o M
gm
t
J. S
agges
e
Vic
e-P
resi
den
t
& C
hie
f
Tech
no
logy O
ffic
er
R. K
urk
jian
Pro
cess
an
d I
nfo
Ma
na
gem
en
t
Sen
ior D
irecto
r
I. S
hap
iro
Co
mm
un
ity
Develo
pm
en
t
Dir
ecto
r
L.
Wil
liam
s
Sr. V
ice-P
resi
den
t
Fo
r O
pera
tio
ns
B. C
lark
e
Ma
nh
att
an
Pro
perty
Ma
na
gem
en
t D
ep
t
Inte
rim
Dir
ecto
r
J. M
cCull
ou
gh
Bro
nx P
ro
perty
Ma
na
gem
en
t D
ep
t
Dir
ecto
r
M. A
llen
Bro
ok
lyn
Pro
perty
Ma
na
gem
en
t D
ep
t
Dir
ecto
r
P.
Cal
andri
llo
NextG
en O
ps
Po
licy
&
Pro
gra
m D
evel
Dir
ecto
r &
Sr. A
dvis
or
B. T
urk
ewit
z
Em
erg
en
cy
Servic
es
Dir
ecto
r
E.
Tav
arez
Hea
tin
g S
ervic
es
& O
pera
tio
ns
Dir
ecto
r
R. K
nap
p
Ris
k M
an
ag
em
en
t
Dir
ecto
r
A.
Ore
nst
ein
Acco
un
ts P
ay
ab
le
& U
tili
ty
Ma
na
gem
en
t
Dir
ecto
r
C. S
tein
met
z
Fin
an
cia
l
Acco
un
tin
g &
Rep
orti
ng
S
ervic
es
Co
ntr
oll
er
J. P
agel
son
Hu
ma
n R
eso
urces
Inte
rim
Dir
ecto
r
N. V
an G
end
t
Pro
ced
ures
Devel
an
d A
dm
in
Dir
ecto
r
R. Ja
ckso
n
Treasu
ry
Op
era
tio
ns
Treasu
rer
T.
Pu
ccio
Off
ice o
f S
afe
ty &
Secu
rit
y
Dir
ecto
r
P.
O’H
agan
Fin
an
cia
l P
lan
nin
g
& A
na
lysi
s
Dir
ecto
r
G.
Ok
oro
ji
NO
TE
All
work
un
its
show
n o
n t
his
ch
art
a
re D
epar
tmen
ts u
nle
ss
oth
erw
ise
note
d.
Ex
ecu
tive
Vic
e-P
resi
den
t
For
Cap
ital
Pro
ject
s
D.
Go
dd
ard
Lo
ca
l L
aw
11
Pro
gra
m D
irecto
r
M. B
razo
ban
Ca
pit
al
Pla
nn
ing
Sen
ior D
irecto
r
J. S
can
lon
Off
ice o
f D
esi
gn
Dir
ecto
r
S.
Gro
om
Co
nst
ru
cti
on
Pro
gra
m D
irecto
r
P.
Zan
der
Vic
e-P
resi
den
t F
or
Qu
ali
ty A
ssu
ra
nce
C. G
len
n
Ad
min
istr
ati
on
Dir
ecto
r
(Vac
ant)
Cu
sto
mer
Co
nta
ct
Cen
ter
Dir
ecto
r
G.
Wil
liam
s
Pu
bli
c/P
riv
ate
Pa
rtn
ersh
ips
Dir
ecto
r
R. K
irm
ani-
Fry
e
Vic
e-P
resi
den
t F
or
Co
nst
ru
cti
on
Pro
gra
m
F.
Syed
B
ro
ok
lyn
WIC
Dep
uty
Dir
ecto
r
A.
Mat
hew
QA
& P
erfo
rm
an
ce
Ma
na
gem
en
t
Dir
ecto
r
S.
Cro
sby
Vic
e-P
resi
den
t F
or
Ca
pit
al
Pla
nn
ing
& D
esi
gn
(Vac
ant)
Eff
ecti
ve
May
25
, 2
01
7
Vic
e-P
resi
den
t F
or
Rea
l E
sta
te
Develo
pm
en
t
K.
Soro
ka
Resi
den
t
Eco
no
mic
Em
po
werm
en
t
& S
ust
ain
ab
ilit
y
Dir
ecto
r
S.
Cas
till
o
Resi
den
t
En
ga
gem
en
t
Dir
ecto
r
J. H
ud
son
Vic
e-P
resi
den
t
of
Su
pp
ly
Ma
na
gem
en
t
& P
ro
cu
rem
en
t
J. R
uss
o
Ma
teria
ls
Ma
na
gem
en
t
Dir
ecto
r
A.
Porc
elli
Sr. V
ice-P
resi
den
t
Fo
r O
pera
tio
ns
Su
pp
ort
Servic
es
L.
Pon
ce
Ma
int.
Rep
air
s &
Sk
ille
d T
ra
des
Dir
ecto
r
C. P
awso
n
Mix
ed
Fin
an
ce
Pro
perty
Ma
na
gem
en
t D
ep
t
Dir
ecto
r
D. L
aval
Ex
ecu
tive
Vic
e-P
resi
den
t
For
Lea
sed
Hou
sin
g
C.
Pen
nin
gto
n
E
xec
uti
ve
Vic
e-P
resi
den
t F
or
Ex
tern
al
Aff
air
s
D.
Pri
stin
Off
ice o
f
Em
erg
en
cy
Ma
na
gem
en
t
Dir
ecto
r
J. S
tak
enb
urg
Ele
va
tors
Dir
ecto
r
I. N
ikoli
c
Vic
e-P
resi
den
t F
or
Reco
very
&
Resi
lien
ce
J. S
ind
erb
ran
d
Qu
ali
ty A
ssu
ra
nce
Dir
ecto
r
R. C
orr
ea
Vic
e-P
resi
den
t
Fo
r P
erfo
rm
an
ce
Ma
na
gem
en
t
& A
na
lyti
cs
A.
Fla
tley
Ma
na
gem
en
t
an
d P
lan
nin
g
Dir
ecto
r
C. B
run
o
Insp
ecti
on
&
Cen
tra
l O
ffic
e
Op
era
tio
ns
Dir
ecto
r
R. T
esori
ero
Cli
en
t S
ervic
es
Dir
ecto
r
I. B
ob
b L
ewis
LH
D F
ina
nce
Dir
ecto
r
J. O
had
om
a
Ch
ief
of
Sta
ff t
o
Gen
era
l M
an
ag
er
K.
Pay
amp
s-R
ou
re
Cu
sto
mer
Op
era
tio
ns
Dir
ecto
r
S.
Ch
arle
s
Perfo
rm
an
ce
Tra
ckin
g
An
aly
tics
Dep
t
Dir
ecto
r
S.
Lou
is
Gen
era
l S
ervic
es
Dir
ecto
r
J. L
aMar
ca
Cit
y C
ap
ita
l
Dir
ecto
r
O. O
ster
win
d
Sp
ecia
l P
ro
jects
Dir
ecto
r
V. S
hah
Str
ate
gic
Init
iati
ves
Fo
r O
pera
tio
ns
Dir
ecto
r
X. C
arca
mo
Vic
e-P
resi
den
t F
or
En
erg
y &
Su
sta
ina
bil
ity
B. Ju
ng
Ma
na
gem
en
t
Servic
es
Dir
ecto
r
(Vac
ant)
Tech
nic
al
Servic
es
Dir
ecto
r
J. K
ran
tz
Inte
rn
al
Au
dit
&
Ass
essm
en
t
Dir
ecto
r
T.
Rob
erts
Pro
cu
rem
en
t
Dir
ecto
r
J. S
chm
idt
Vic
e-P
resi
den
t F
or
Pu
bli
c S
afe
ty
G.
Nel
son
Vic
e-P
resi
den
t
Fo
r
Lea
sed
Ho
usi
ng
L.
Mil
ler
E
xec
uti
ve
Vic
e-P
resi
den
t
For
Rea
l E
state
N.
Fer
reir
a
Vic
e-P
resi
den
t F
or
Rea
l E
sta
te
Servic
es
(Vac
ant)
Fa
mil
y
Pa
rtn
ersh
ips
Sen
ior D
irecto
r
U. B
usg
ith
Vic
e-P
resi
den
t F
or
Str
ate
gic
In
itia
tives
K.
To
tah
C
orp
ora
te S
ecre
tary
V. H
uer
tas
Qu
een
s /
SI
Pro
perty
Ma
na
gem
en
t D
ep
t
Dir
ecto
r
C. Ja
sper
En
erg
y
Pro
gra
ms
Dir
ecto
r
S.
Mam
men
NextG
en O
ps
1
Pro
perty
Ma
na
gem
en
t D
ep
t
Dir
ecto
r
O. H
ayw
ard
Ch
ief
of
Sta
ff
J. P
rim
eau
Ap
pli
ca
tio
ns
&
Ten
an
cy
Ad
min
Dir
ecto
r
L.
Mar
ott
a Vic
e-P
resi
den
t
Fo
r
Ten
an
cy
Ad
min
L.
Har
ris
Reco
very
&
Resi
lien
ce
Dir
ecto
r
M. M
oore
Sr. V
ice-P
resi
den
t
Fo
r N
extG
en O
ps
J. A
bra
ham
s
Su
sta
ina
bil
ity
Pro
gra
ms
Dir
ecto
r
V. K
enn
iff
Hea
lth
In
itia
tives
Dir
ecto
r
A.
Mat
a
NE
W Y
OR
K C
ITY
HO
US
ING
AU
TH
OR
ITY
OR
GA
NIZ
AT
ION
CH
AR
T
17

Soundview, Borough of The Bronx
January 18, 2016

21
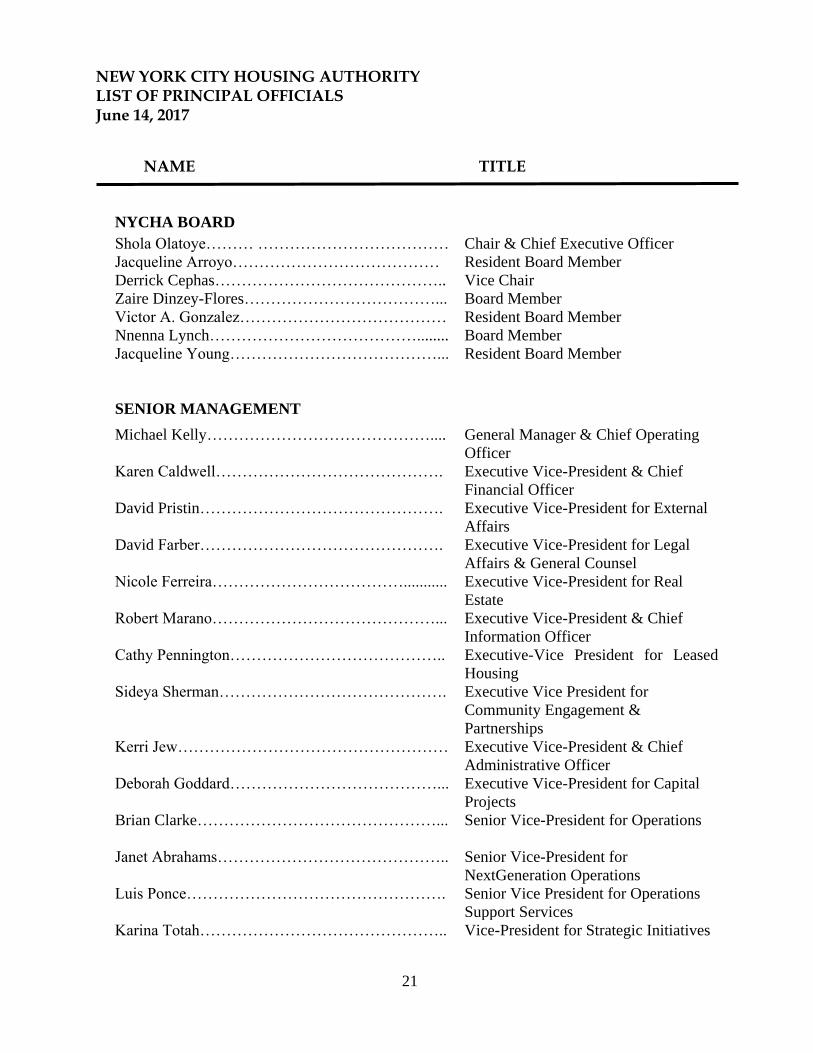
NEW YORK CITY HOUSING AUTHORITY LIST OF PRINCIPAL OFFICIALS June 14, 2017
NAME TITLE
NYCHA BOARD
Shola Olatoye……… ……………………………… Chair & Chief Executive Officer
Jacqueline Arroyo………………………………… Resident Board Member
Derrick Cephas……………………………………..
Zaire Dinzey-Flores………………………………...
Vice Chair
Board Member
Victor A. Gonzalez………………………………… Resident Board Member
Nnenna Lynch…………………………………........ Board Member
Jacqueline Young…………………………………... Resident Board Member
SENIOR MANAGEMENT
Michael Kelly……………………………………....
Karen Caldwell…………………………………….
General Manager & Chief Operating
Officer
Executive Vice-President & Chief
Financial Officer
David Pristin………………………………………. Executive Vice-President for External
Affairs
David Farber………………………………………. Executive Vice-President for Legal
Affairs & General Counsel
Nicole Ferreira………………………………...........
Robert Marano……………………………………...
Cathy Pennington…………………………………..
Executive Vice-President for Real
Estate
Executive Vice-President & Chief
Information Officer
Executive-Vice President for Leased
Housing
Sideya Sherman……………………………………. Executive Vice President for
Community Engagement &
Partnerships
Kerri Jew……………………………………………
Deborah Goddard…………………………………...
Executive Vice-President & Chief
Administrative Officer
Executive Vice-President for Capital
Projects
Brian Clarke………………………………………...
Janet Abrahams……………………………………..
Luis Ponce………………………………………….
Senior Vice-President for Operations
Senior Vice-President for
NextGeneration Operations
Senior Vice President for Operations
Support Services
Karina Totah………………………………………..
Vice-President for Strategic Initiatives

FINANCIAL SECTION
Highbridge, Borough of The Bronx
January 18, 2016

REPORT OF INDEPENDENT AUDITORS
YOMO TORO, BOROUGH OF MANHATTAN
JANUARY 18, 2016

INDEPENDENT AUDITORS’ REPORT Board of Directors and the Audit Committee of the New York City Housing Authority Report on the Financial Statements We have audited the accompanying statements of net position of the New York City Housing Authority (the “Authority”), a component unit of The City of New York, as of December 31, 2016 and 2015, and the related statements of revenues, expenses and changes in net position and cash flows for the years then ended, and the related notes to the financial statements, which collectively comprise the Authority’s basic financial statements as listed in the table of contents. Management’s Responsibility for the Financial Statements Management is responsible for the preparation and fair presentation of these financial statements in accordance with accounting principles generally accepted in the United States of America; this includes the design, implementation, and maintenance of internal control relevant to the preparation and fair presentation of the financial statements that are free from material misstatement, whether due to fraud or error. Auditors’ Responsibility Our responsibility is to express an opinion on these financial statements based on our audits. We conducted our audits in accordance with auditing standards generally accepted in the United States of America. Those standards require that we plan and perform the audits to obtain reasonable assurance about whether the financial statements are free from material misstatement. An audit involves performing procedures to obtain audit evidence about the amounts and disclosures in the financial statements. The procedures selected depend on the auditors’ judgment, including the assessment of the risks of material misstatement of the financial statements, whether due to fraud or error. In making those risk assessments, the auditor considers internal control relevant to the Authority’s preparation and fair presentation of the financial statements in order to design audit procedures that are appropriate in the circumstances, but not for the purpose of expressing an opinion on the effectiveness of the Authority’s internal control. Accordingly, we express no such opinion. An audit also includes evaluating the appropriateness of accounting policies used and the reasonableness of significant accounting estimates made by management, as well as evaluating the overall presentation of the financial statements. We believe that the audit evidence we have obtained is sufficient and appropriate to provide a basis for our audit opinion.
Deloitte & Touche LLP30 Rockefeller Plaza New York, NY 10112 USA Tel: +1-212-492-4000 Fax: +1-212-489-1687 www.deloitte.com
27
Opinion In our opinion, the financial statements referred to above present fairly, in all material respects, the financial position of the Authority as of December 31, 2016 and 2015, and the changes in financial position and cash flows thereof for the years then ended in accordance with accounting principles generally accepted in the United States of America. Other Matters Required Supplementary Information Accounting principles generally accepted in the United States of America require that the Management’s Discussion and Analysis on pages 31–38, Schedule of Funding Progress on page 111, Schedule of the Authority’s Contributions to the New York City Employees’ Retirement System (NYCERS) on page 113, and Schedule of the Authority’s Proportionate Share of the Net Pension Liability of NYCERS on page 115 be presented to supplement the basic financial statements. Such information, although not a part of the basic financial statements, is required by the Governmental Accounting Standards Board who considers it to be an essential part of financial reporting for placing the basic financial statements in an appropriate operational, economic, or historical context. We have applied certain limited procedures to the required supplementary information in accordance with auditing standards generally accepted in the United States of America, which consisted of inquiries of management about the methods of preparing the information and comparing the information for consistency with management’s responses to our inquiries, the basic financial statements, and other knowledge we obtained during our audits of the basic financial statements. We do not express an opinion or provide any assurance on the information because the limited procedures do not provide us with sufficient evidence to express an opinion or provide any assurance. Other Information Our audits were conducted for the purpose of forming an opinion on the financial statements that collectively comprise the Authority’s basic financial statements. The Introductory Section and Statistical Section, listed in the foregoing table of contents, are presented for purposes of additional analysis and are not a required part of the basic financial statements. The Introductory Section and Statistical Section have not been subjected to the auditing procedures applied in the audits of the basic financial statements, and accordingly, we do not express an opinion or provide any assurance on them.
June 14, 2017
28

MANAGEMENT’S DICUSSION AND ANALYSIS
(UNAUDITED)
Wyckoff Gardens Next Generation Neighborhood Meeting
February 24, 2016

31
NEW YORK CITY HOUSING AUTHORITY
MANAGEMENT’S DISCUSSION AND ANALYSIS FOR THE YEARS ENDED DECEMBER 31, 2016 AND 2015
The following is a narrative overview and analysis of the Authority’s financial activities for the years ended
December 31, 2016 and 2015. Please read it in conjunction with the transmittal letter at the beginning of this
report, the Authority’s financial statements following this section and the notes to the financial statements.
OVERVIEW OF THE BASIC FINANCIAL STATEMENTS
The Statements of Net Position present the Authority’s assets, deferred outflows, liabilities, and deferred
inflows at the end of the year. Net position is the difference between (a) assets and deferred outflows and (b)
liabilities and deferred inflows. Over time, increases or decreases in Net Position is a useful indicator as to
whether the Authority’s financial health is improving or deteriorating.
The Statements of Revenues, Expenses, and Changes in Net Position report the Authority’s operating
results and how its Net Position changed during the year. All Revenues, Expenses, and Changes in Net
Position are reported on an accrual basis of accounting, which reports events as they occur, rather than when
cash changes hands (cash basis of accounting).
The Statements of Cash Flows report how the Authority’s cash and cash equivalents increased or decreased
during the year. The statement reports how cash and cash equivalents were provided by and used in the
Authority’s operating, non-capital financing, capital and related financing, and investing activities. The
Authority uses the direct method of presenting cash flows, which includes a reconciliation of operating
income or loss to cash flows related to operating activities.
The Notes to the Financial Statements are an integral part of the financial statements, disclosing
information which is essential to a full understanding of the statements.
REQUIRED SUPPLEMENTARY AND STATISTICAL INFORMATION
The Required Supplementary Information presents information regarding: (1) the Authority’s progress in
funding its obligation to provide postemployment benefits other than pensions to its employees, (2) the
Authority’s contributions to the New York City Employees’ Retirement System (“NYCERS”), and (3) the
Authority’s proportionate share of the Net Pension Liability of NYCERS.
The Statistical Section provides information on the Authority’s overall economic condition. The major
categories presented are: (1) financial trends; (2) revenue capacity; (3) debt capacity; (4) demographic and
economic information; and (5) operating information.
32
FINANCIAL HIGHLIGHTS AND ANALYSIS
On December 29, 2016, the Authority completed a lease transaction involving the redevelopment of Ocean
Bay- Bayside (the “Project”), a former public housing property, comprised of 1,395 units, that converted to
the Section 8 project-based voucher funding platform and a community center pursuant to the Rental
Assistance Demonstration (“RAD”) program. The Authority is leasing Parcel A of the Project to Ocean Bay
RAD LLC, the tax credit owner, and Parcel B to Bayside Land Lease Corp. and has a 0.005% interest in
Parcel A and a 50% interest in Parcel B. The purchase price for Parcel A’s leasehold interest is $109 million.
The Authority received an upfront payment of $43 million at closing and the remaining $66 million is
financed through a Seller Note. The transaction is intended to enable the rehabilitation of the Project by the
tax credit owner, including resiliency measures that address damage caused by Superstorm Sandy (“Sandy”).
The Authority’s interest in the related entity that will perform this work is expected to generate $23 million in
developer fees.
On March 22, 2016, the State of New York appropriated $100 million for a modernization and improvement
program. This funding is planned to be used for security, quality of life improvements, and appliances at
various developments. The Authority has entered into a Construction Management Agreement with the
Dormitory Authority of the State of New York for the scope, procurement, and administration of all contracts
associated with this funding. Through December 31, 2016, approximately $3 million has been expended.
In December 2016, NYCHA entered into a 20 year Equipment Purchase/Lease Agreement with Banc of
America Public Capital Corp (“BAPCC”) in the amount of $52 million to finance an Energy Performance
Contract (“EPC”). This financing agreement and EPC have enabled NYCHA to upgrade common area
and apartment lighting at twenty-four (24) developments and to replace a boiler plant and upgrade a
comprehensive heating system at one development. The Equipment Purchase/Lease Agreement with
BAPCC will mature in June 2036. This EPC plan provides HUD-sponsored EPC funding at these
twenty-four developments, thereby enabling NYCHA to use its Federal Capital funds for other capital
improvements pursuant to NYCHA’s Five Year Capital Plan.
The Authority’s Loss before capital contributions for 2016 was $411 million. One of the leading factors in
the $451 million unfavorable variance, as compared to 2015, was the increase in Other post-employment
benefits (“OPEB”) of $316 million, due to a change in mortality assumptions and the absence of actuarial
gains from the prior year for lower than expected premium increases. Excluding the impact of OPEB, the
Authority’s Loss before capital contributions increased by $135 million.
Operating Expenses, excluding OPEB increased by $91 million. Maintenance and operations increased by
$88 million, mainly due to operations initiatives including work order reduction, exterminating and tree
pruning. General and administrative increased by $37 million, comprised of $30 million in pension costs and
$28 million due to the forgiveness of PILOT agreed to by The City of New York (“The City”) during the
prior year, partially offset by a decrease of $13 million in insurance costs, primarily for general liability
insurance and decreases of $9 million in Section 8 program housing portability costs. The increases in
Maintenance and operations and in General and administrative expenses are partially offset by a decrease of
$40 million in Utilities, primarily due to lower rates for heating gas and electricity.
Non-operating revenues and expenses, net, decreased by $95 million. Subsidies and grants made up $89
million of this decrease, primarily subsidy from The City to cover collective bargaining general wage
increases, due to non-recurring retroactive subsidies, and special initiatives.
33
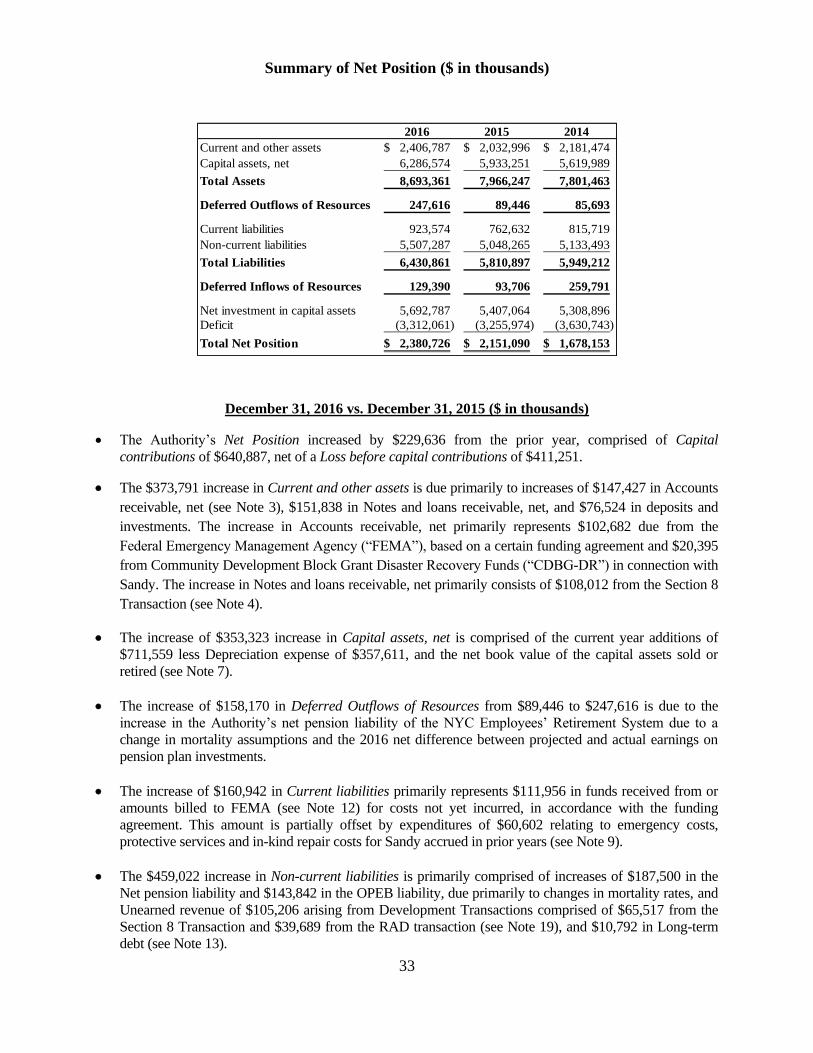
Summary of Net Position ($ in thousands)
2016 2015 2014
Current and other assets 2,406,787$ 2,032,996$ 2,181,474$
Capital assets, net 6,286,574 5,933,251 5,619,989
Total Assets 8,693,361 7,966,247 7,801,463
Deferred Outflows of Resources 247,616 89,446 85,693
Current liabilities 923,574 762,632 815,719
Non-current liabilities 5,507,287 5,048,265 5,133,493
Total Liabilities 6,430,861 5,810,897 5,949,212
Deferred Inflows of Resources 129,390 93,706 259,791
Net investment in capital assets 5,692,787 5,407,064 5,308,896
Deficit (3,312,061) (3,255,974) (3,630,743)
Total Net Position 2,380,726$ 2,151,090$ 1,678,153$
December 31, 2016 vs. December 31, 2015 ($ in thousands)
The Authority’s Net Position increased by $229,636 from the prior year, comprised of Capital
contributions of $640,887, net of a Loss before capital contributions of $411,251.
The $373,791 increase in Current and other assets is due primarily to increases of $147,427 in Accounts
receivable, net (see Note 3), $151,838 in Notes and loans receivable, net, and $76,524 in deposits and
investments. The increase in Accounts receivable, net primarily represents $102,682 due from the
Federal Emergency Management Agency (“FEMA”), based on a certain funding agreement and $20,395
from Community Development Block Grant Disaster Recovery Funds (“CDBG-DR”) in connection with
Sandy. The increase in Notes and loans receivable, net primarily consists of $108,012 from the Section 8
Transaction (see Note 4).
The increase of $353,323 increase in Capital assets, net is comprised of the current year additions of
$711,559 less Depreciation expense of $357,611, and the net book value of the capital assets sold or
retired (see Note 7).
The increase of $158,170 in Deferred Outflows of Resources from $89,446 to $247,616 is due to the
increase in the Authority’s net pension liability of the NYC Employees’ Retirement System due to a
change in mortality assumptions and the 2016 net difference between projected and actual earnings on
pension plan investments.
The increase of $160,942 in Current liabilities primarily represents $111,956 in funds received from or
amounts billed to FEMA (see Note 12) for costs not yet incurred, in accordance with the funding
agreement. This amount is partially offset by expenditures of $60,602 relating to emergency costs,
protective services and in-kind repair costs for Sandy accrued in prior years (see Note 9).
The $459,022 increase in Non-current liabilities is primarily comprised of increases of $187,500 in the
Net pension liability and $143,842 in the OPEB liability, due primarily to changes in mortality rates, and
Unearned revenue of $105,206 arising from Development Transactions comprised of $65,517 from the
Section 8 Transaction and $39,689 from the RAD transaction (see Note 19), and $10,792 in Long-term
debt (see Note 13).
34
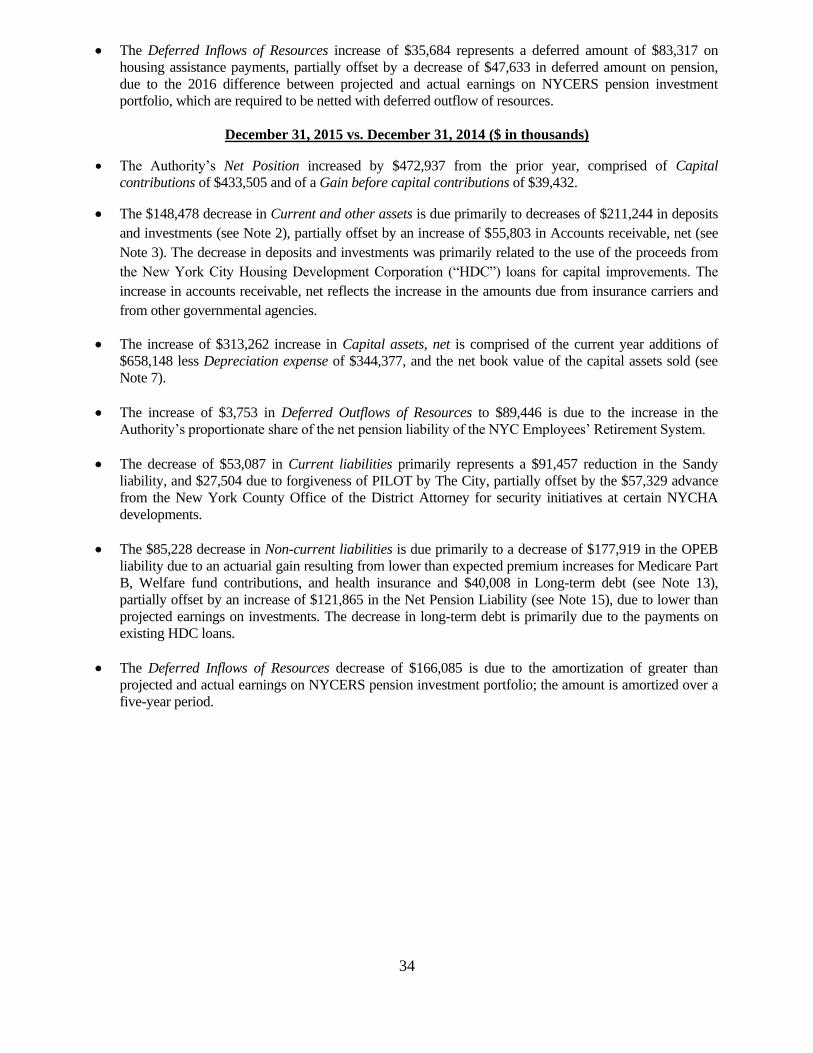
The Deferred Inflows of Resources increase of $35,684 represents a deferred amount of $83,317 on
housing assistance payments, partially offset by a decrease of $47,633 in deferred amount on pension,
due to the 2016 difference between projected and actual earnings on NYCERS pension investment
portfolio, which are required to be netted with deferred outflow of resources.
December 31, 2015 vs. December 31, 2014 ($ in thousands)
The Authority’s Net Position increased by $472,937 from the prior year, comprised of Capital
contributions of $433,505 and of a Gain before capital contributions of $39,432.
The $148,478 decrease in Current and other assets is due primarily to decreases of $211,244 in deposits
and investments (see Note 2), partially offset by an increase of $55,803 in Accounts receivable, net (see
Note 3). The decrease in deposits and investments was primarily related to the use of the proceeds from
the New York City Housing Development Corporation (“HDC”) loans for capital improvements. The
increase in accounts receivable, net reflects the increase in the amounts due from insurance carriers and
from other governmental agencies.
The increase of $313,262 increase in Capital assets, net is comprised of the current year additions of
$658,148 less Depreciation expense of $344,377, and the net book value of the capital assets sold (see
Note 7).
The increase of $3,753 in Deferred Outflows of Resources to $89,446 is due to the increase in the
Authority’s proportionate share of the net pension liability of the NYC Employees’ Retirement System.
The decrease of $53,087 in Current liabilities primarily represents a $91,457 reduction in the Sandy
liability, and $27,504 due to forgiveness of PILOT by The City, partially offset by the $57,329 advance
from the New York County Office of the District Attorney for security initiatives at certain NYCHA
developments.
The $85,228 decrease in Non-current liabilities is due primarily to a decrease of $177,919 in the OPEB
liability due to an actuarial gain resulting from lower than expected premium increases for Medicare Part
B, Welfare fund contributions, and health insurance and $40,008 in Long-term debt (see Note 13),
partially offset by an increase of $121,865 in the Net Pension Liability (see Note 15), due to lower than
projected earnings on investments. The decrease in long-term debt is primarily due to the payments on
existing HDC loans.
The Deferred Inflows of Resources decrease of $166,085 is due to the amortization of greater than
projected and actual earnings on NYCERS pension investment portfolio; the amount is amortized over a
five-year period.
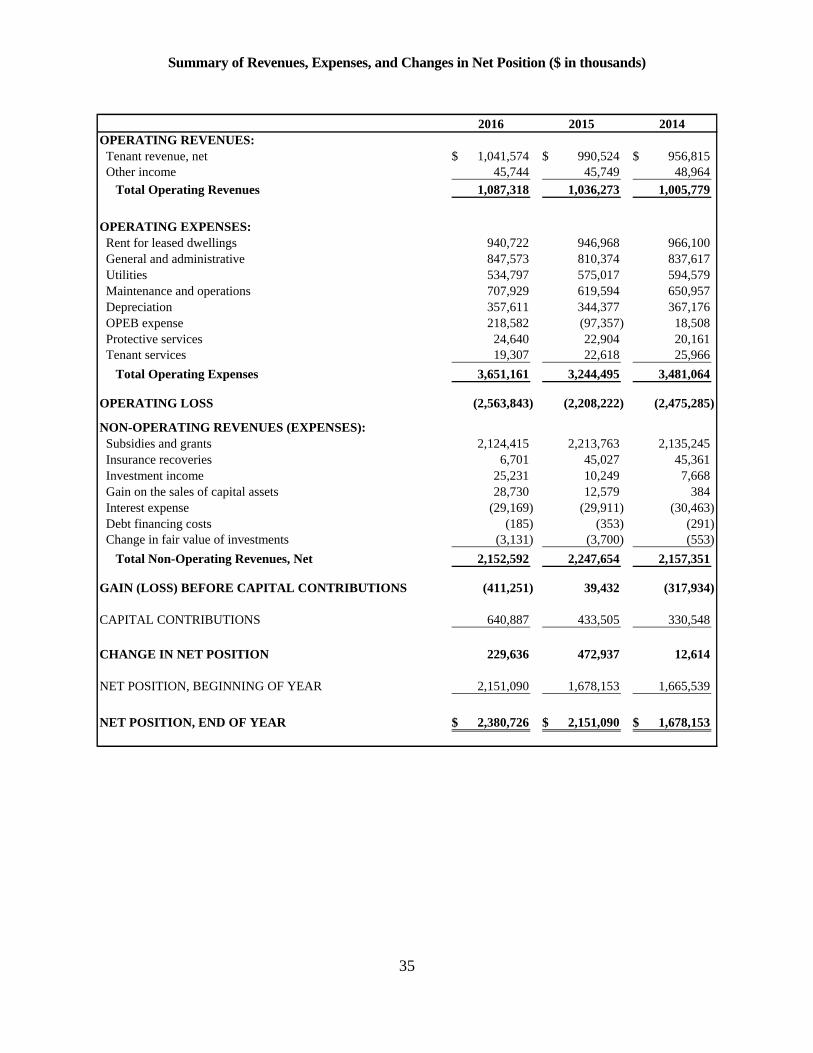
35
Summary of Revenues, Expenses, and Changes in Net Position ($ in thousands)
2016 2015 2014
OPERATING REVENUES:
Tenant revenue, net 1,041,574$ 990,524$ 956,815$
Other income 45,744 45,749 48,964
Total Operating Revenues 1,087,318 1,036,273 1,005,779
OPERATING EXPENSES:
Rent for leased dwellings 940,722 946,968 966,100
General and administrative 847,573 810,374 837,617
Utilities 534,797 575,017 594,579
Maintenance and operations 707,929 619,594 650,957
Depreciation 357,611 344,377 367,176
OPEB expense 218,582 (97,357) 18,508
Protective services 24,640 22,904 20,161
Tenant services 19,307 22,618 25,966
Total Operating Expenses 3,651,161 3,244,495 3,481,064
OPERATING LOSS (2,563,843) (2,208,222) (2,475,285)
NON-OPERATING REVENUES (EXPENSES):
Subsidies and grants 2,124,415 2,213,763 2,135,245
Insurance recoveries 6,701 45,027 45,361
Investment income 25,231 10,249 7,668
Gain on the sales of capital assets 28,730 12,579 384
Interest expense (29,169) (29,911) (30,463)
Debt financing costs (185) (353) (291)
Change in fair value of investments (3,131) (3,700) (553)
Total Non-Operating Revenues, Net 2,152,592 2,247,654 2,157,351
GAIN (LOSS) BEFORE CAPITAL CONTRIBUTIONS (411,251) 39,432 (317,934)
CAPITAL CONTRIBUTIONS 640,887 433,505 330,548
CHANGE IN NET POSITION 229,636 472,937 12,614
NET POSITION, BEGINNING OF YEAR 2,151,090 1,678,153 1,665,539
NET POSITION, END OF YEAR 2,380,726$ 2,151,090$ 1,678,153$
36
2016 vs. 2015 ($ in thousands)
The Operating Loss for the Authority increased $355,621, from $2,208,222 in 2015 to $2,563,843 in
2016, due to a $406,666 increase in Operating Expenses, partially offset by a $51,045 increase in
Operating Revenues.
The $51,045 increase in Operating Revenues is primarily due to an increase in the average rent per
unit including households required to pay 30 percent of family income towards rent.
The $406,666 increase in Operating Expenses is led by an increase of $315,939 in OPEB expense,
comprised of an actuarial loss during the current year due to a change in mortality assumptions plus a
gain during the prior year resulting from lower than expected premium increases for Medicare Part B,
Welfare fund contributions, and medical premiums (see Note 15). Maintenance and operations increased
by $88,335 million, mainly due to operations initiatives including work order reduction, exterminating
and tree pruning. General and administrative increased $37,199 of which $27,508 is due to the
forgiveness of PILOT agreed to by the City during the prior year and $29,863 in pension costs, partially
offset by a decrease of $12,894 in insurance costs, primarily for general liability insurance. These
increases are partially offset by a decrease of $40,220 in Utilities, primarily due to lower rates for
heating gas and electricity.
Non-operating revenues and expenses, net, decreased by $95,062, primarily representing a decrease of
$89,348 in Subsidies and grants, primarily subsidy from The City to cover collective bargaining general
wage increases due to non-recurring retroactive subsidies, and special initiatives.
Capital Contributions increased $207,382 to $640,887, primarily representing contributions from FEMA
and CDBG-DR relating to Sandy.
2015 vs. 2014 ($ in thousands)
The Operating Loss for the Authority decreased $267,063, from $2,475,285 in 2014 to $2,208,222 in
2015, due to a $236,569 decrease in Operating Expenses and a $30,494 increase in Operating Revenues.
The $30,494 increase in Operating Revenues is primarily due to an increase in the average rent per
unit including households required to pay 30 percent of family income towards rent.
The $236,569 decrease in Operating Expenses is led by a decrease of $115,865 in OPEB expense, due
primarily to an actuarial gain resulting from lower than expected premium increases for Medicare Part B,
Welfare fund contributions, and medical premiums (see Note 15). General and administrative followed
with a decrease of $27,243 of which $55,149 is due to forgiveness of PILOT by the City, and $23,090 is
due to a decrease in general liability and workers’ compensation insurance (see Note 11), partially offset
by an increase of $48,527 in employee benefits, due to increased pension costs. Maintenance and
operations decreased $31,363, primarily representing a reduction of $33,314 in pollution remediation
costs (see Note 10), and the absence of $15,997 in 2014 reductions in inventory related to an inventory
liquidation program, partially offset by an increase of $33,844 in labor costs due to collective
bargaining settlements. Utilities decreased $19,562 due primarily to lower heating costs, attributable
to the conversion of boilers from fuel oil to heating gas at Sandy locations, and to lower electricity
rates. Rent for Leased Dwellings decreased $19,132, reflecting a reduced number of units in the
Section 8 Housing Assistance Programs.
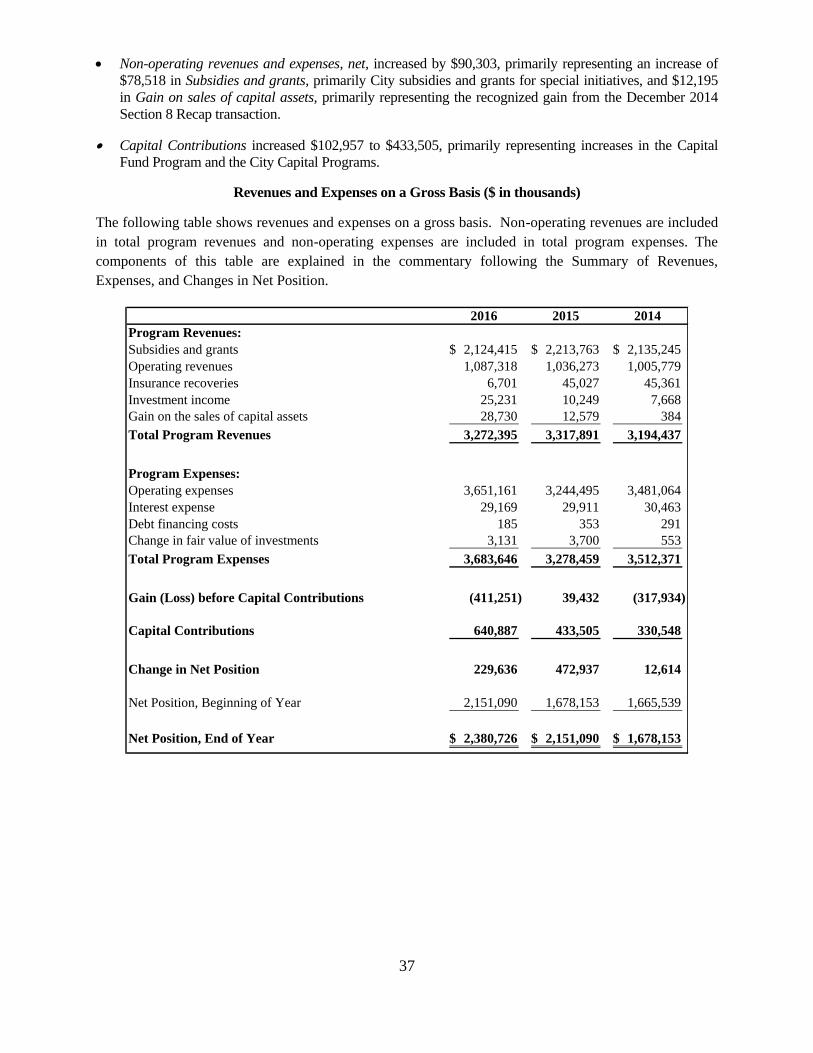
37
Non-operating revenues and expenses, net, increased by $90,303, primarily representing an increase of
$78,518 in Subsidies and grants, primarily City subsidies and grants for special initiatives, and $12,195
in Gain on sales of capital assets, primarily representing the recognized gain from the December 2014
Section 8 Recap transaction.
Capital Contributions increased $102,957 to $433,505, primarily representing increases in the Capital
Fund Program and the City Capital Programs.
Revenues and Expenses on a Gross Basis ($ in thousands)
The following table shows revenues and expenses on a gross basis. Non-operating revenues are included
in total program revenues and non-operating expenses are included in total program expenses. The
components of this table are explained in the commentary following the Summary of Revenues,
Expenses, and Changes in Net Position.
2016 2015 2014
Program Revenues:
Subsidies and grants 2,124,415$ 2,213,763$ 2,135,245$
Operating revenues 1,087,318 1,036,273 1,005,779
Insurance recoveries 6,701 45,027 45,361
Investment income 25,231 10,249 7,668
Gain on the sales of capital assets 28,730 12,579 384
Total Program Revenues 3,272,395 3,317,891 3,194,437
Program Expenses:
Operating expenses 3,651,161 3,244,495 3,481,064
Interest expense 29,169 29,911 30,463
Debt financing costs 185 353 291
Change in fair value of investments 3,131 3,700 553
Total Program Expenses 3,683,646 3,278,459 3,512,371
Gain (Loss) before Capital Contributions (411,251) 39,432 (317,934)
Capital Contributions 640,887 433,505 330,548
Change in Net Position 229,636 472,937 12,614
Net Position, Beginning of Year 2,151,090 1,678,153 1,665,539
Net Position, End of Year 2,380,726$ 2,151,090$ 1,678,153$
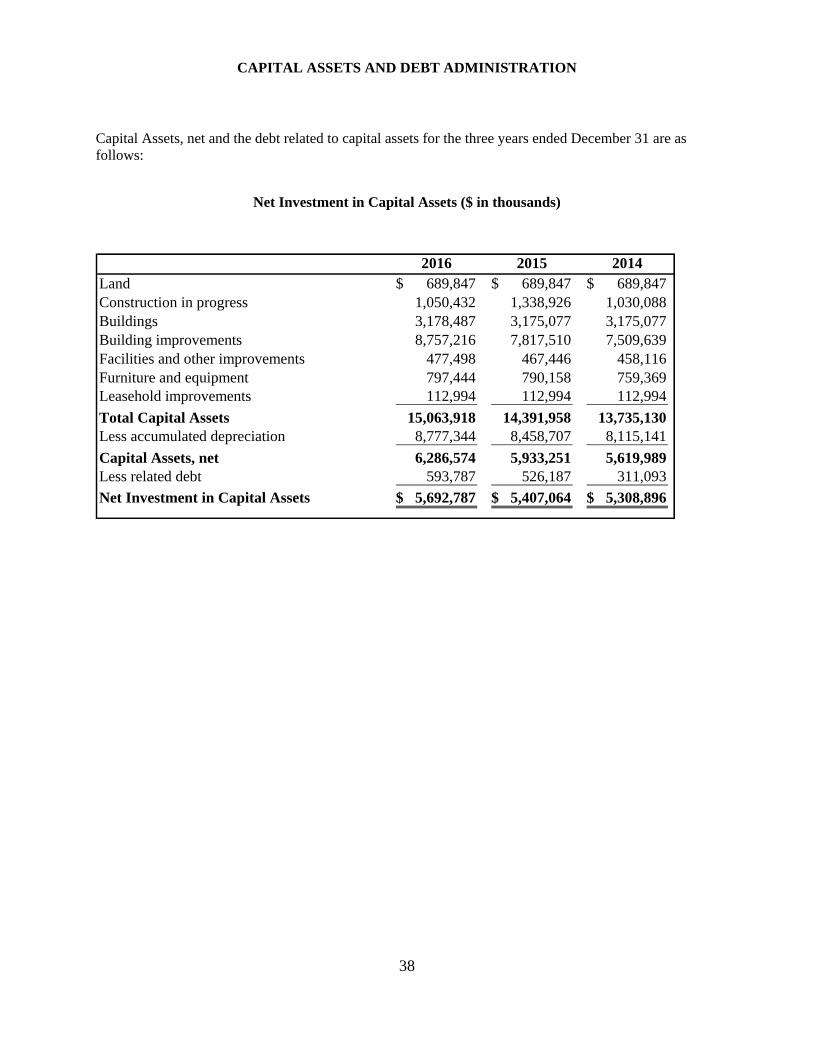
38
CAPITAL ASSETS AND DEBT ADMINISTRATION
Capital Assets, net and the debt related to capital assets for the three years ended December 31 are as
follows:
Net Investment in Capital Assets ($ in thousands)
2016 2015 2014
Land 689,847$ 689,847$ 689,847$
Construction in progress 1,050,432 1,338,926 1,030,088
Buildings 3,178,487 3,175,077 3,175,077
Building improvements 8,757,216 7,817,510 7,509,639
Facilities and other improvements 477,498 467,446 458,116
Furniture and equipment 797,444 790,158 759,369
Leasehold improvements 112,994 112,994 112,994
Total Capital Assets 15,063,918 14,391,958 13,735,130
Less accumulated depreciation 8,777,344 8,458,707 8,115,141
Capital Assets, net 6,286,574 5,933,251 5,619,989
Less related debt 593,787 526,187 311,093
Net Investment in Capital Assets 5,692,787$ 5,407,064$ 5,308,896$

BASIC FINANCIAL STATEMENTS
Tech Up ribbon cutting, Fulton Houses, Borough of Manhattan
February 17, 2016

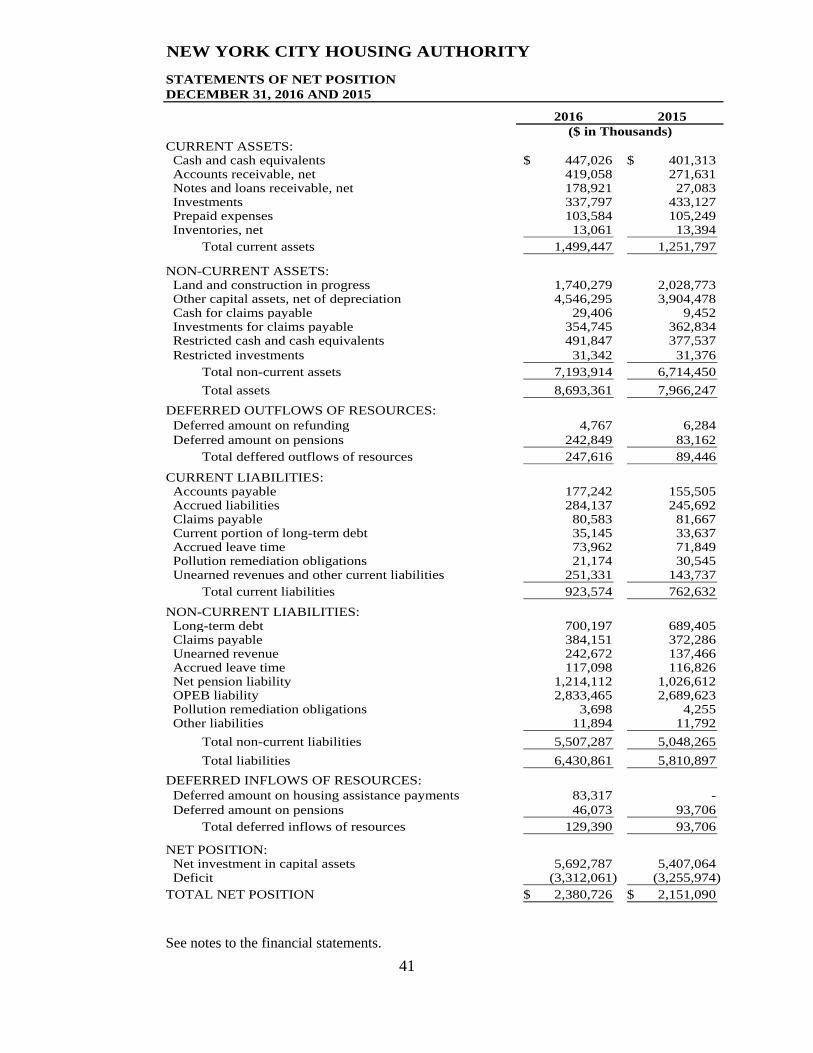
41
NEW YORK CITY HOUSING AUTHORITY
STATEMENTS OF NET POSITION
DECEMBER 31, 2016 AND 2015
2016 2015
($ in Thousands)
CURRENT ASSETS: Cash and cash equivalents 447,026$ 401,313$ Accounts receivable, net 419,058 271,631 Notes and loans receivable, net 178,921 27,083 Investments 337,797 433,127 Prepaid expenses 103,584 105,249 Inventories, net 13,061 13,394
Total current assets 1,499,447 1,251,797
NON-CURRENT ASSETS: Land and construction in progress 1,740,279 2,028,773 Other capital assets, net of depreciation 4,546,295 3,904,478 Cash for claims payable 29,406 9,452 Investments for claims payable 354,745 362,834 Restricted cash and cash equivalents 491,847 377,537
Restricted investments 31,342 31,376
Total non-current assets 7,193,914 6,714,450
Total assets 8,693,361 7,966,247
DEFERRED OUTFLOWS OF RESOURCES:
Deferred amount on refunding 4,767 6,284
Deferred amount on pensions 242,849 83,162
Total deffered outflows of resources 247,616 89,446
CURRENT LIABILITIES: Accounts payable 177,242 155,505 Accrued liabilities 284,137 245,692 Claims payable 80,583 81,667 Current portion of long-term debt 35,145 33,637 Accrued leave time 73,962 71,849 Pollution remediation obligations 21,174 30,545 Unearned revenues and other current liabilities 251,331 143,737
Total current liabilities 923,574 762,632
NON-CURRENT LIABILITIES: Long-term debt 700,197 689,405 Claims payable 384,151 372,286 Unearned revenue 242,672 137,466 Accrued leave time 117,098 116,826 Net pension liability 1,214,112 1,026,612 OPEB liability 2,833,465 2,689,623 Pollution remediation obligations 3,698 4,255 Other liabilities 11,894 11,792
Total non-current liabilities 5,507,287 5,048,265
Total liabilities 6,430,861 5,810,897
DEFERRED INFLOWS OF RESOURCES:
Deferred amount on housing assistance payments 83,317 -
Deferred amount on pensions 46,073 93,706
Total deferred inflows of resources 129,390 93,706
NET POSITION: Net investment in capital assets 5,692,787 5,407,064 Deficit (3,312,061) (3,255,974)
TOTAL NET POSITION 2,380,726$ 2,151,090$
See notes to the financial statements.
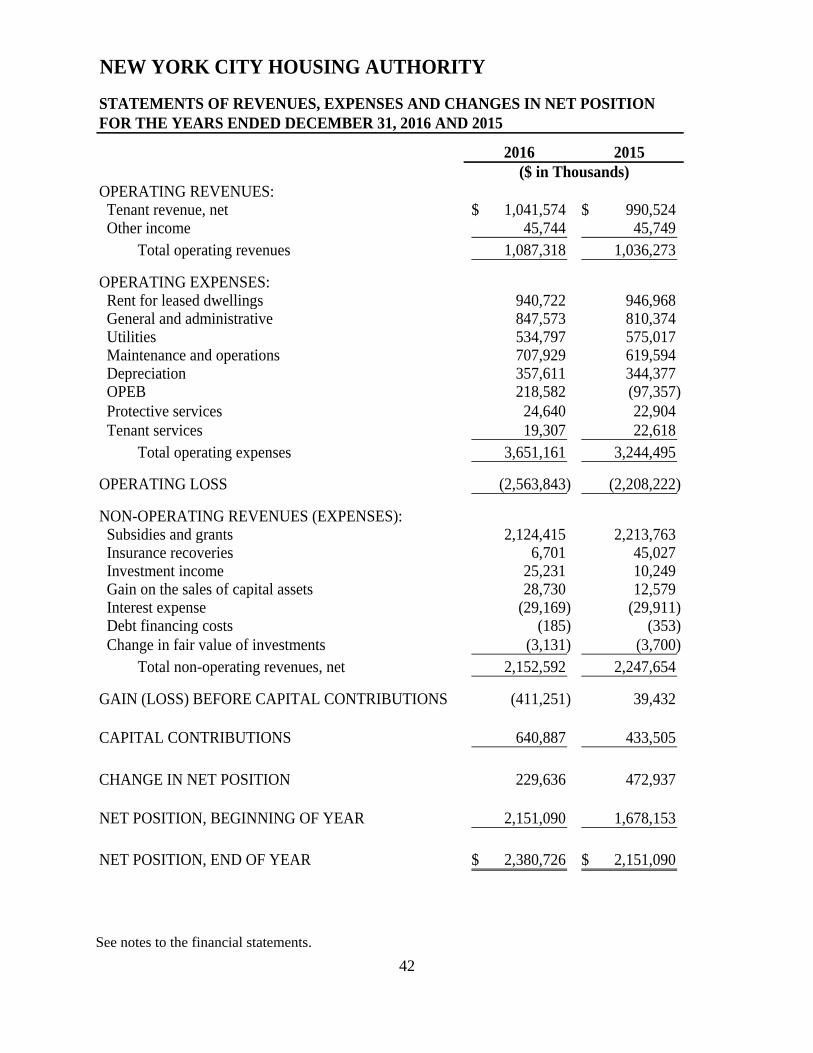
42
NEW YORK CITY HOUSING AUTHORITY
STATEMENTS OF REVENUES, EXPENSES AND CHANGES IN NET POSITION
FOR THE YEARS ENDED DECEMBER 31, 2016 AND 2015
2016 2015
($ in Thousands)
OPERATING REVENUES: Tenant revenue, net 1,041,574$ 990,524$ Other income 45,744 45,749
Total operating revenues 1,087,318 1,036,273
OPERATING EXPENSES: Rent for leased dwellings 940,722 946,968 General and administrative 847,573 810,374 Utilities 534,797 575,017 Maintenance and operations 707,929 619,594 Depreciation 357,611 344,377 OPEB 218,582 (97,357)
Protective services 24,640 22,904
Tenant services 19,307 22,618
Total operating expenses 3,651,161 3,244,495
OPERATING LOSS (2,563,843) (2,208,222)
NON-OPERATING REVENUES (EXPENSES): Subsidies and grants 2,124,415 2,213,763 Insurance recoveries 6,701 45,027 Investment income 25,231 10,249 Gain on the sales of capital assets 28,730 12,579 Interest expense (29,169) (29,911) Debt financing costs (185) (353)
Change in fair value of investments (3,131) (3,700)
Total non-operating revenues, net 2,152,592 2,247,654
GAIN (LOSS) BEFORE CAPITAL CONTRIBUTIONS (411,251) 39,432
CAPITAL CONTRIBUTIONS 640,887 433,505
CHANGE IN NET POSITION 229,636 472,937
NET POSITION, BEGINNING OF YEAR 2,151,090 1,678,153
NET POSITION, END OF YEAR 2,380,726$ 2,151,090$
See notes to the financial statements.
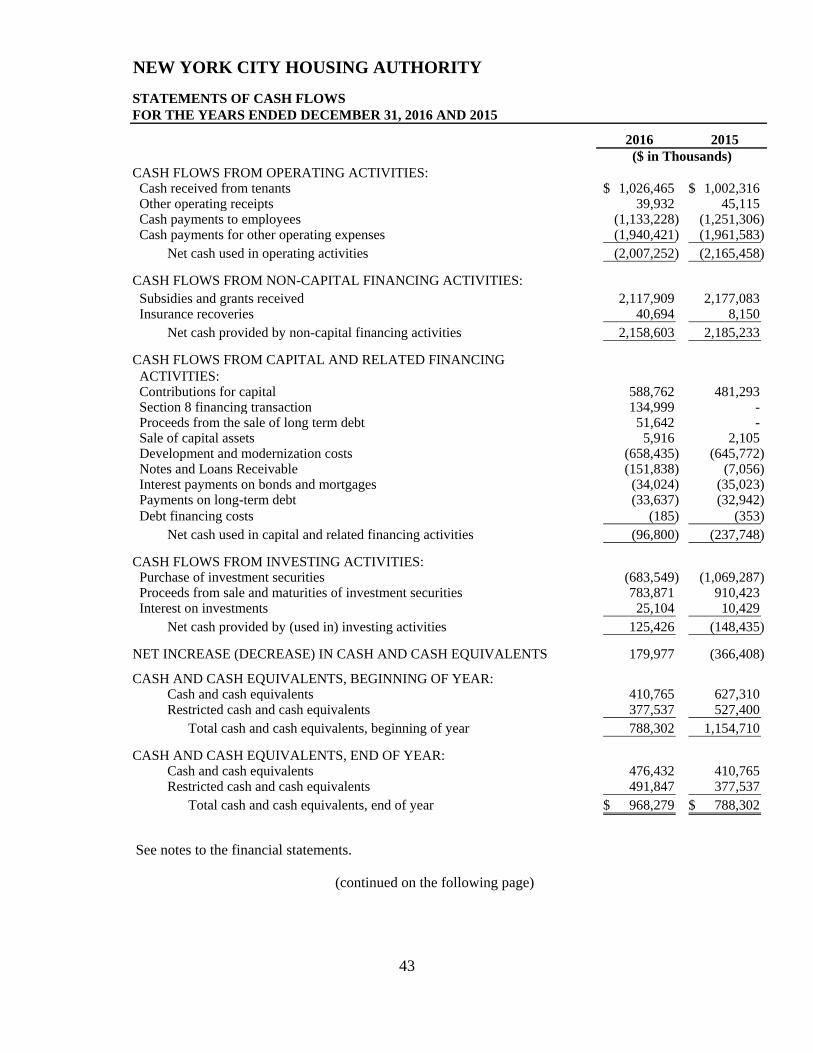
43
NEW YORK CITY HOUSING AUTHORITY
STATEMENTS OF CASH FLOWS
FOR THE YEARS ENDED DECEMBER 31, 2016 AND 2015
2016 2015
($ in Thousands)
CASH FLOWS FROM OPERATING ACTIVITIES: Cash received from tenants 1,026,465$ 1,002,316$ Other operating receipts 39,932 45,115 Cash payments to employees (1,133,228) (1,251,306) Cash payments for other operating expenses (1,940,421) (1,961,583)
Net cash used in operating activities (2,007,252) (2,165,458)
CASH FLOWS FROM NON-CAPITAL FINANCING ACTIVITIES:
Subsidies and grants received 2,117,909 2,177,083 Insurance recoveries 40,694 8,150
Net cash provided by non-capital financing activities 2,158,603 2,185,233
CASH FLOWS FROM CAPITAL AND RELATED FINANCING
ACTIVITIES: Contributions for capital 588,762 481,293 Section 8 financing transaction 134,999 - Proceeds from the sale of long term debt 51,642 - Sale of capital assets 5,916 2,105 Development and modernization costs (658,435) (645,772) Notes and Loans Receivable (151,838) (7,056) Interest payments on bonds and mortgages (34,024) (35,023) Payments on long-term debt (33,637) (32,942)
Debt financing costs (185) (353)
Net cash used in capital and related financing activities (96,800) (237,748)
CASH FLOWS FROM INVESTING ACTIVITIES: Purchase of investment securities (683,549) (1,069,287) Proceeds from sale and maturities of investment securities 783,871 910,423 Interest on investments 25,104 10,429
Net cash provided by (used in) investing activities 125,426 (148,435)
NET INCREASE (DECREASE) IN CASH AND CASH EQUIVALENTS 179,977 (366,408)
CASH AND CASH EQUIVALENTS, BEGINNING OF YEAR: Cash and cash equivalents 410,765 627,310 Restricted cash and cash equivalents 377,537 527,400
Total cash and cash equivalents, beginning of year 788,302 1,154,710
CASH AND CASH EQUIVALENTS, END OF YEAR: Cash and cash equivalents 476,432 410,765 Restricted cash and cash equivalents 491,847 377,537
Total cash and cash equivalents, end of year 968,279$ 788,302$
See notes to the financial statements.
(continued on the following page)
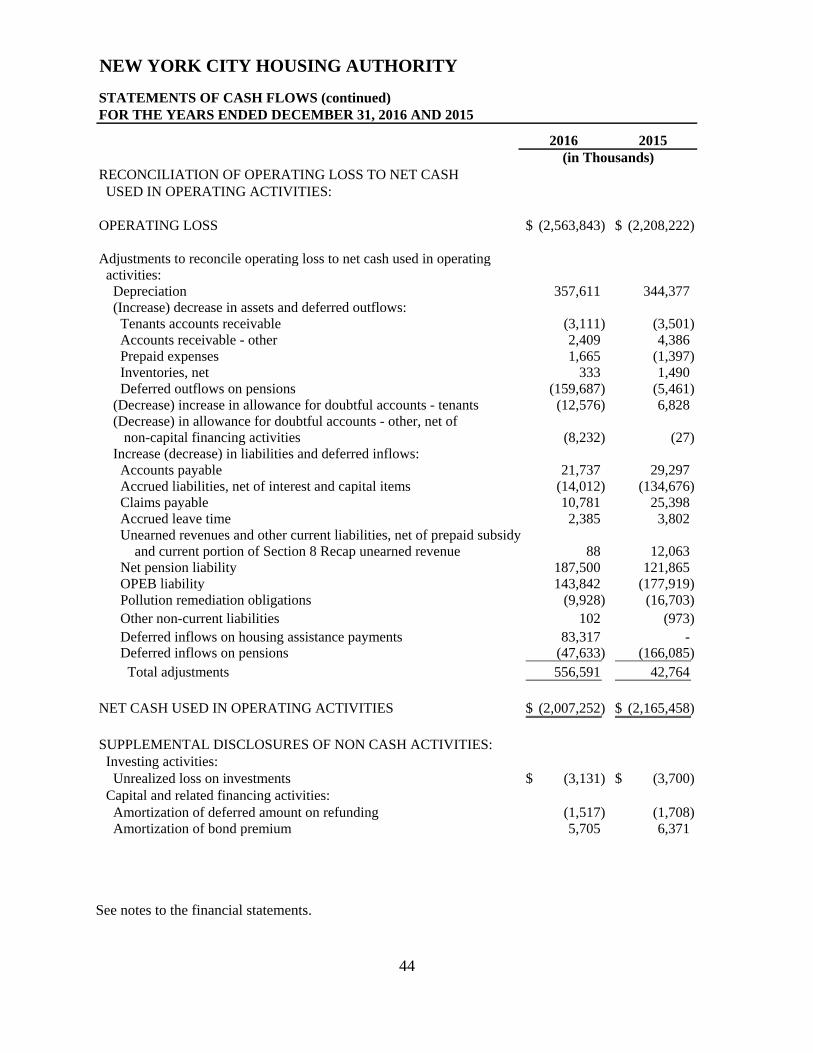
44
NEW YORK CITY HOUSING AUTHORITY
STATEMENTS OF CASH FLOWS (continued)
FOR THE YEARS ENDED DECEMBER 31, 2016 AND 2015
2016 2015
(in Thousands)
RECONCILIATION OF OPERATING LOSS TO NET CASH
USED IN OPERATING ACTIVITIES:
OPERATING LOSS (2,563,843)$ (2,208,222)$
Adjustments to reconcile operating loss to net cash used in operating
activities:
Depreciation 357,611 344,377
(Increase) decrease in assets and deferred outflows:
Tenants accounts receivable (3,111) (3,501)
Accounts receivable - other 2,409 4,386
Prepaid expenses 1,665 (1,397)
Inventories, net 333 1,490
Deferred outflows on pensions (159,687) (5,461)
(Decrease) increase in allowance for doubtful accounts - tenants (12,576) 6,828
(Decrease) in allowance for doubtful accounts - other, net of
non-capital financing activities (8,232) (27)
Increase (decrease) in liabilities and deferred inflows:
Accounts payable 21,737 29,297
Accrued liabilities, net of interest and capital items (14,012) (134,676)
Claims payable 10,781 25,398
Accrued leave time 2,385 3,802
Unearned revenues and other current liabilities, net of prepaid subsidy
and current portion of Section 8 Recap unearned revenue 88 12,063
Net pension liability 187,500 121,865
OPEB liability 143,842 (177,919)
Pollution remediation obligations (9,928) (16,703)
Other non-current liabilities 102 (973)
Deferred inflows on housing assistance payments 83,317 - Deferred inflows on pensions (47,633) (166,085)
Total adjustments 556,591 42,764
NET CASH USED IN OPERATING ACTIVITIES (2,007,252)$ (2,165,458)$
SUPPLEMENTAL DISCLOSURES OF NON CASH ACTIVITIES:
Investing activities:
Unrealized loss on investments (3,131)$ (3,700)$
Capital and related financing activities:
Amortization of deferred amount on refunding (1,517) (1,708)
Amortization of bond premium 5,705 6,371
See notes to the financial statements.
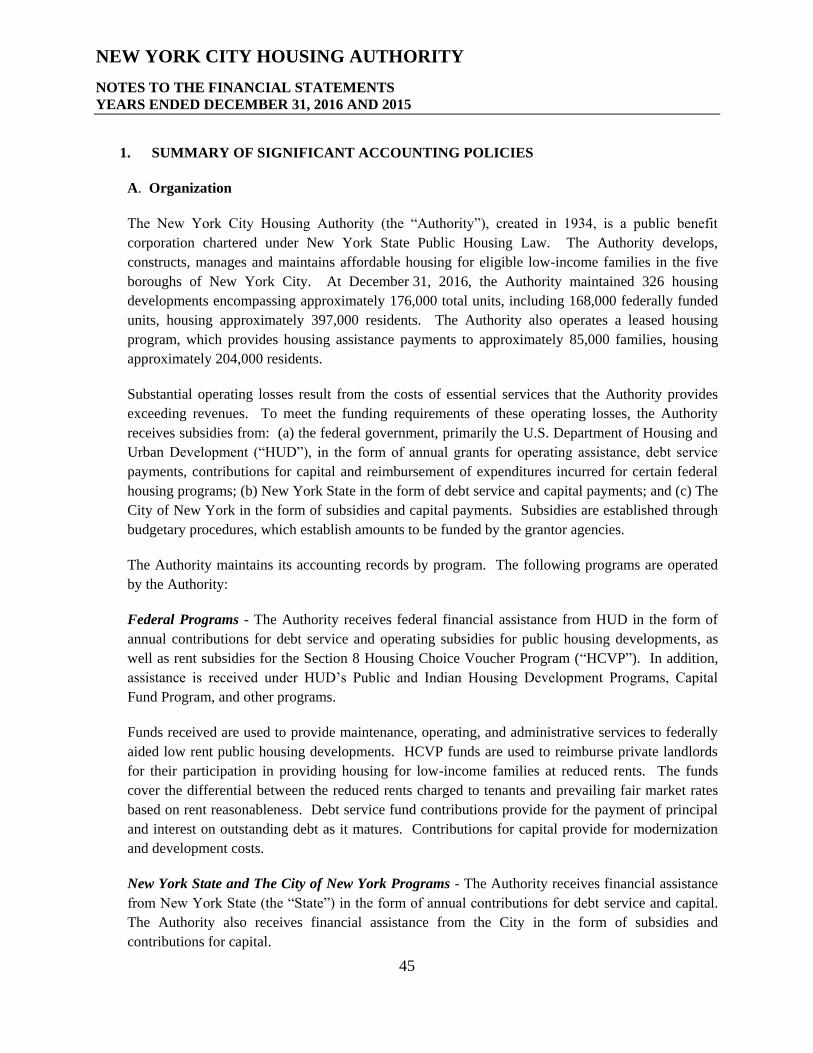
45
NEW YORK CITY HOUSING AUTHORITY
NOTES TO THE FINANCIAL STATEMENTS
YEARS ENDED DECEMBER 31, 2016 AND 2015
1. SUMMARY OF SIGNIFICANT ACCOUNTING POLICIES
A. Organization
The New York City Housing Authority (the “Authority”), created in 1934, is a public benefit
corporation chartered under New York State Public Housing Law. The Authority develops,
constructs, manages and maintains affordable housing for eligible low-income families in the five
boroughs of New York City. At December 31, 2016, the Authority maintained 326 housing
developments encompassing approximately 176,000 total units, including 168,000 federally funded
units, housing approximately 397,000 residents. The Authority also operates a leased housing
program, which provides housing assistance payments to approximately 85,000 families, housing
approximately 204,000 residents.
Substantial operating losses result from the costs of essential services that the Authority provides
exceeding revenues. To meet the funding requirements of these operating losses, the Authority
receives subsidies from: (a) the federal government, primarily the U.S. Department of Housing and
Urban Development (“HUD”), in the form of annual grants for operating assistance, debt service
payments, contributions for capital and reimbursement of expenditures incurred for certain federal
housing programs; (b) New York State in the form of debt service and capital payments; and (c) The
City of New York in the form of subsidies and capital payments. Subsidies are established through
budgetary procedures, which establish amounts to be funded by the grantor agencies.
The Authority maintains its accounting records by program. The following programs are operated
by the Authority:
Federal Programs - The Authority receives federal financial assistance from HUD in the form of
annual contributions for debt service and operating subsidies for public housing developments, as
well as rent subsidies for the Section 8 Housing Choice Voucher Program (“HCVP”). In addition,
assistance is received under HUD’s Public and Indian Housing Development Programs, Capital
Fund Program, and other programs.
Funds received are used to provide maintenance, operating, and administrative services to federally
aided low rent public housing developments. HCVP funds are used to reimburse private landlords
for their participation in providing housing for low-income families at reduced rents. The funds
cover the differential between the reduced rents charged to tenants and prevailing fair market rates
based on rent reasonableness. Debt service fund contributions provide for the payment of principal
and interest on outstanding debt as it matures. Contributions for capital provide for modernization
and development costs.
New York State and The City of New York Programs - The Authority receives financial assistance
from New York State (the “State”) in the form of annual contributions for debt service and capital.
The Authority also receives financial assistance from the City in the form of subsidies and
contributions for capital.
46
Other Programs - The Authority receives funding for other programs, including Federal assistance
from the U.S. Department of Agriculture for child and adult care food and summer food service
programs, and from HUD, the State, and the City for several other grant programs.
B. Reporting Entity
The Authority is a component unit of the City, based upon criteria for defining the reporting entity
as identified and described in the Governmental Accounting Standards Board’s (“GASB”)
Codification of Governmental Accounting and Financial Reporting Standards, Sections 2100 and
2600.
The Authority’s operations include two blended component units which are included in the
Authority’s basic financial statements, in compliance with GASB 61 The Financial Reporting
Entity: Omnibus – an amendment of GASB Statement No. 14 and No. 34. These are legally separate
entities with the same governing body as the Authority for which the Authority has operational
responsibility and are controlled by the Authority. There is a financial benefit/burden relationship
between the Authority and the component units since the Authority is responsible for providing
operating and capital subsidies to the component units. The blended component units include:
NYCHA Public Housing Preservation I, LLC
NYCHA Public Housing Preservation II, LLC
Additional information relating to these blended component units can be found in Note 24 to the
financial statements. NYCHA Public Housing Preservation I, LLC (“LLC I”) and NYCHA Public
Housing Preservation II, LLC (“LLC II”) both issue stand-alone financial reports. These reports can
be obtained from The New York City Housing Authority, 250 Broadway, New York, New York,
10007.
C. Basis of Accounting
The Authority’s financial statements are prepared in accordance with generally accepted accounting
principles as prescribed by the GASB, using the economic resources measurement focus and the
accrual basis of accounting wherein revenues are recognized when earned, and expenses are
recognized when the liability is incurred.
The Authority’s primary source of nonexchange revenue relates to subsidies and grants. Subsidies
and grants revenue is recognized at the time eligible program expenditures occur and/or the
Authority has complied with the grant and subsidy requirements, in accordance with GASB
Statement No. 33, Accounting and Financial Reporting for Nonexchange Transactions.
The Authority applies Governmental Accounting Standards Board (“GASB”) Codification of
Governmental Accounting and Financial Reporting Standards (“GASB Codification”) Section P80,
Proprietary Accounting and Financial Reporting.
47
Recently Adopted Accounting Standards
GASB Statement No. 73 (“GASB 73”), Accounting and Financial Reporting for Pensions and
Related Assets That Are Not within the Scope of GASB Statement 68, and Amendments to Certain
Provisions of GASB Statements 67 and 68. The objective of this Statement is to improve the
usefulness of information about pensions included in the general purpose external financial reports
of state and local governments for making decisions and assessing accountability. This Statement
results from a comprehensive review of the effectiveness of existing standards of accounting and
financial reporting for all postemployment benefits with regard to providing decision-useful
information, supporting assessments of accountability and interperiod equity, and creating additional
transparency.
This Statement establishes requirements for defined benefit pensions that are not within the scope of
Statement No. 68, Accounting and Financial Reporting for Pensions, as well as for the assets
accumulated for purposes of providing those pensions. In addition, it establishes requirements for
defined contribution pensions that are not within the scope of Statement No. 68. It also amends
certain provisions of Statement No. 67, Financial Reporting for Pension Plans and Statement No.
68 for pension plans and pensions that are within their respective scopes.
The requirements of GASB Statement No. 73, extend the approach to accounting and financial
reporting established in Statement No. 68 to all pensions, with modifications as necessary to reflect
that for accounting and financial reporting purposes, any assets accumulated for pensions that are
provided through pension plans that are not administered through trusts that meet the criteria
specified in Statement No. 68 should not be considered pension plan assets. It also requires that
information similar to that required by Statement No. 68 be included in notes to financial statements
and required supplementary information by all similarly situated employers and non-employer
contributing entities.
This Statement also clarifies the application of certain provisions of Statement Nos. 67 and 68 with
regard to the following issues: 1) Information that is required to be presented as notes to the 10-year
schedules of required supplementary information about investment-related factors that significantly
affect trends in the amounts reported. 2) Accounting and financial reporting for separately financed
specific liabilities of individual employers and non-employer contributing entities for defined
benefit pensions. 3) Timing of employer recognition of revenue for the support of non-employer
contributing entities not in a special funding situation.
The requirements of Statement No. 73 are effective for fiscal years beginning after June 15, 2016.
The Authority early adopted this Statement in December of 2016. The implementation of this
standard did not have a significant impact on the Authority’s financial statements.
48
Recently Adopted Accounting Standards (continued)
GASB Statement No. 76 (“GASB 76”), The Hierarchy of Generally Accepted Accounting Principles
for State and Local Governments. The objective of this Statement is to identify—in the context of
the current governmental financial reporting environment—the hierarchy of generally accepted
accounting principles (GAAP). The “GAAP hierarchy” consists of the sources of accounting
principles used to prepare financial statements of state and local governmental entities in conformity
with GAAP and the framework for selecting those principles. This Statement reduces the GAAP
hierarchy to two categories of authoritative GAAP and addresses the use of authoritative and
nonauthoritative literature in the event that the accounting treatment for a transaction or other event
is not specified within a source of authoritative GAAP.
This Statement supersedes Statement No. 55, The Hierarchy of Generally Accepted Accounting
Principles for State and Local Governments.
The requirements of Statement No. 76 are effective for financial statements for periods beginning
after June 15, 2015. The Authority adopted this Statement in December of 2016. The
implementation of this standard did not have a significant impact on the Authority’s financial
statements.
GASB Statement No. 77 (“GASB 77”), Tax Abatement Disclosures. Financial statements prepared
by state and local governments in conformity with generally accepted accounting principles provide
citizens and taxpayers, legislative and oversight bodies, municipal bond analysts, and others with
information they need to evaluate the financial health of governments, make decisions, and assess
accountability. This information is intended, among other things, to assist these users of financial
statements in assessing (1) whether a government’s current-year revenues were sufficient to pay for
current-year services (known as interperiod equity), (2) whether a government complied with
finance-related legal and contractual obligations, (3) where a government’s financial resources come
from and how it uses them, and (4) a government’s financial position and economic condition and
how they have changed over time.
Financial statement users need information about certain limitations on a government’s ability to
raise resources. This includes limitations on revenue raising capacity resulting from government
programs that use tax abatements to induce behavior by individuals and entities that is beneficial to
the government or its citizens. Tax abatements are widely used by state and local governments,
particularly to encourage economic development. For financial reporting purposes, this Statement
defines tax abatement as resulting from an agreement between a government and an individual or
entity in which the government promises to forgo tax revenues and the individual or entity promises
to subsequently take a specific action that contributes to economic development or otherwise
benefits the government or its citizens.
Although many governments offer tax abatements and provide information to the public about them,
they do not always provide the information necessary to assess how tax abatements affect their
financial position and results of operations, including their ability to raise resources in the future.
This Statement requires disclosure of tax abatement information about (1) a reporting government’s
own tax abatement agreements and (2) those that are entered into by other governments and that
reduce the reporting government’s tax revenues.
49
Recently Adopted Accounting Standards (continued)
The requirements of Statement No. 77 are effective for periods beginning after December 15, 2015.
The Authority adopted this Statement in December of 2016. The implementation of this standard
did not have a significant impact on the Authority’s financial statements.
GASB Statement No. 78 (“GASB 78”), Pensions Provided through Certain Multiple-Employer
Defined Benefit Pension Plans. The objective of GASB Statement No. 78 is to address a practice issue
regarding the scope and applicability of Statement No. 68, Accounting and Financial Reporting for
Pensions. This issue is associated with pensions provided through certain multiple-employer defined
benefit pension plans and to state or local governmental employers whose employees are provided
with such pensions.
Prior to the issuance of GASB Statement No. 78, the requirements of Statement No. 68 applied to the
financial statements of all state and local governmental employers whose employees are provided with
pensions through pension plans that are administered through trusts that meet the criteria in paragraph
4 of that Statement.
This Statement amends the scope and applicability of Statement No. 68 to exclude pensions
provided to employees of state or local governmental employers through a cost-sharing multiple-
employer defined benefit pension plan that (1) is not a state or local governmental pension plan, (2)
is used to provide defined benefit pensions both to employees of state or local governmental
employers and to employees of employers that are not state or local governmental employers, and
(3) has no predominant state or local governmental employer (either individually or collectively
with other state or local governmental employers that provide pensions through the pension plan).
This Statement establishes requirements for recognition and measurement of pension expense,
expenditures, and liabilities; note disclosures; and required supplementary information for pensions
that have the characteristics described above.
The requirements of Statement No. 78 are effective for periods beginning after December 15, 2015.
The Authority adopted this Statement in December of 2016. The implementation of this standard
did not have a significant impact on the Authority’s financial statements.
50
Recently Adopted Accounting Standards (continued)
GASB Statement No. 79 (“GASB 79”), Certain External Investment Pools and Pool Participants.
This Statement addresses accounting and financial reporting for certain external investment pools
and pool participants. Specifically, it establishes criteria for an external investment pool to qualify
for making the election to measure all of its investments at amortized cost for financial reporting
purposes. An external investment pool qualifies for that reporting if it meets all of the applicable
criteria established in this Statement. The specific criteria address (1) how the external investment
pool transacts with participants; (2) requirements for portfolio maturity, quality, diversification, and
liquidity; and (3) calculation and requirements of the net asset value per share of a qualifying
external investment pool price. Significant noncompliance prevents the external investment pool
from measuring all of its investments at amortized cost for financial reporting purposes. Professional
judgment is required to determine if instances of noncompliance with the criteria established by this
Statement during the reporting period, individually or in the aggregate, were significant.
If an external investment pool does not meet the criteria established by Statement No. 79, that pool
should apply the provisions in paragraph 16 of Statement No. 31, Accounting and Financial
Reporting for Certain Investments and for External Investment Pools, as amended. If an external
investment pool meets the criteria in this Statement and measures all of its investments at amortized
cost, the pool’s participants also should measure their investments in that external investment pool at
amortized cost for financial reporting purposes. If an external investment pool does not meet the
criteria in this Statement, the pool’s participants should measure their investments in that pool at fair
value, as provided in paragraph 11 of Statement No. 31, as amended.
This Statement establishes additional note disclosure requirements for qualifying external
investment pools that measure all of their investments at amortized cost for financial reporting
purposes and for governments that participate in those pools. Those disclosures for both the
qualifying external investment pools and their participants include information about any limitations
or restrictions on participant withdrawals.
The requirements of Statement No. 79 are effective for reporting periods beginning after June 15,
2015, except for certain provisions on portfolio quality, custodial credit risk, and shadow pricing.
Those provisions are effective for reporting periods beginning after December 15, 2015. The
Authority adopted this Statement in December of 2016. The implementation of this standard did not
have a significant impact on the Authority’s financial statements.
51
Recently Adopted Accounting Standards (continued)
GASB Statement No. 80 (“GASB 80”), Blending Requirements for Certain Component Units—An
Amendment of GASB Statement No. 14. The objective of GASB Statement No. 80 is to improve
financial reporting by clarifying the financial statement presentation requirements for certain
component units. This Statement amends the blending requirements established in paragraph 53 of
Statement No. 14, The Financial Reporting Entity, as amended.
This Statement amends the blending requirements for the financial statement presentation of
component units of all state and local governments. The additional criterion requires blending of a
component unit incorporated as a not-for-profit corporation in which the primary government is the
sole corporate member. The additional criterion does not apply to component units included in the
financial reporting entity pursuant to the provisions of Statement No. 39, Determining Whether
Certain Organizations Are Component Units.
The requirements of Statement No. 80 are effective for reporting periods beginning after June 15,
2016. The Authority early adopted this Statement in December of 2016. The implementation of this
standard did not have a significant impact on the Authority’s financial statements.
GASB Statement No. 81 (“GASB 81”), Irrevocable Split-Interest Agreements. The objective of
GASB Statement No. 81 is to improve accounting and financial reporting for irrevocable split-
interest agreements by providing recognition and measurement guidance for situations in which a
government is a beneficiary of the agreement. Split-interest agreements are a type of giving
agreement used by donors to provide resources to two or more beneficiaries, including governments.
Split-interest agreements can be created through trusts—or other legally enforceable agreements
with characteristics that are equivalent to split-interest agreements—in which a donor transfers
resources to an intermediary to hold and administer for the benefit of a government and at least one
other beneficiary. Examples of these types of agreements include charitable lead trusts, charitable
remainder trusts, and life-interests in real estate.
This Statement requires that a government that receives resources pursuant to an irrevocable split-
interest agreement recognize assets, liabilities, and deferred inflows of resources at the inception of
the agreement. Furthermore, this Statement requires that a government recognize assets
representing its beneficial interests in irrevocable split-interest agreements that are administered by a
third party, if the government controls the present service capacity of the beneficial interests. This
Statement requires that a government recognize revenue when the resources become applicable to
the reporting period.
The requirements of Statement No. 81 are effective for financial statements for periods beginning
after December 15, 2016. The Authority early adopted this Statement in December of 2016. The
implementation of this standard did not have a significant impact on the Authority’s financial
statements.
52
Accounting Standards Issued But Not Yet Adopted (continued)
GASB Statement No. 74 (“GASB 74”), Financial Reporting for Postemployment Benefit Plans
Other Than Pension Plans. The objective of this Statement is to improve the usefulness of
information about postemployment benefits other than pensions (other postemployment benefits or
OPEB) included in the general purpose external financial reports of state and local governmental
OPEB plans for making decisions and assessing accountability. This Statement results from a
comprehensive review of the effectiveness of existing standards of accounting and financial
reporting for all postemployment benefits (pensions and OPEB) with regard to providing decision-
useful information, supporting assessments of accountability and interperiod equity, and creating
additional transparency.
This Statement replaces Statements No. 43, Financial Reporting for Postemployment Benefit Plans
Other Than Pension Plans, as amended, and No. 57, OPEB Measurements by Agent Employers and
Agent Multiple-Employer Plans. It also includes requirements for defined contribution OPEB plans
that replace the requirements for those OPEB plans in Statement No. 25, Financial Reporting for
Defined Benefit Pension Plans and Note Disclosures for Defined Contribution Plans, as amended,
Statement No. 43, and Statement No. 50, Pension Disclosures.
Statement No. 75, Accounting and Financial Reporting for Postemployment Benefits Other Than
Pensions, establishes new accounting and financial reporting requirements for governments whose
employees are provided with OPEB, as well as for certain non-employer governments that have a
legal obligation to provide financial support for OPEB provided to the employees of other entities.
The scope of Statement No. 74 includes OPEB plans—defined benefit and defined contribution—
administered through trusts that meet the following criteria: 1) Contributions from employers and
non-employer contributing entities to the OPEB plan and earnings on those contributions are
irrevocable. 2) OPEB plan assets are dedicated to providing OPEB to plan members in accordance
with the benefit terms. 3) OPEB plan assets are legally protected from the creditors of employers,
non-employer contributing entities, and the OPEB plan administrator. If the plan is a defined benefit
OPEB plan, plan assets also are legally protected from creditors of the plan members. This
Statement also includes requirements to address financial reporting for assets accumulated for
purposes of providing defined benefit OPEB through OPEB plans that are not administered through
trusts that meet the specified criteria.
The requirements of this Statement are effective for fiscal years beginning after June 15, 2016. The
Authority has not completed the process of evaluating the impact of GASB 74.
53
Accounting Standards Issued But Not Yet Adopted (continued)
GASB Statement No. 75 (“GASB 75”), Accounting and Financial Reporting for Postemployment
Benefits Other Than Pensions. The primary objective of this Statement is to improve accounting and
financial reporting by state and local governments for postemployment benefits other than pensions
(other postemployment benefits or OPEB). It also improves information provided by state and local
governmental employers about financial support for OPEB that is provided by other entities. This
Statement results from a comprehensive review of the effectiveness of existing standards of
accounting and financial reporting for all postemployment benefits (pensions and OPEB) with
regard to providing decision-useful information, supporting assessments of accountability and
interperiod equity, and creating additional transparency.
This Statement replaces the requirements of Statements No. 45, Accounting and Financial Reporting
by Employers for Postemployment Benefits Other Than Pensions, as amended, and No. 57, OPEB
Measurements by Agent Employers and Agent Multiple-Employer Plans, for OPEB. Statement No.
74, Financial Reporting for Postemployment Benefit Plans Other Than Pension Plans, establishes
new accounting and financial reporting requirements for OPEB plans.
The scope of this Statement addresses accounting and financial reporting for OPEB that is provided
to the employees of state and local governmental employers. This Statement establishes standards
for recognizing and measuring liabilities, deferred outflows of resources, deferred inflows of
resources, and expense/expenditures. For defined benefit OPEB, Statement No. 75, identifies the
methods and assumptions that are required to be used to project benefit payments, discount
projected benefit payments to their actuarial present value, and attribute that present value to periods
of employee service. Note disclosure and required supplementary information requirements about
defined benefit OPEB also are addressed.
In addition, this Statement details the recognition and disclosure requirements for employers with
payables to defined benefit OPEB plans that are administered through trusts that meet the specified
criteria and for employers whose employees are provided with defined contribution OPEB. This
Statement also addresses certain circumstances in which a non-employer entity provides financial
support for OPEB of employees of another entity.
In this Statement, distinctions are made regarding the particular requirements depending upon
whether the OPEB plans through which the benefits are provided are administered through trusts
that meet the following criteria: 1) Contributions from employers and non-employer contributing
entities to the OPEB plan and earnings on those contributions are irrevocable. 2) OPEB plan assets
are dedicated to providing OPEB to plan members in accordance with the benefit terms. 3) OPEB
plan assets are legally protected from the creditors of employers, non-employer contributing entities,
the OPEB plan administrator, and the plan members.
The requirements of this Statement are effective for fiscal years beginning after June 15, 2017. The
Authority has not completed the process of evaluating the impact of GASB 75.
54
Accounting Standards Issued But Not Yet Adopted (continued)
GASB Statement No. 82 (“GASB 82”), Pension Issues. The objective of GASB Statement No. 82 is
to address certain issues that have been raised with respect to Statements No. 67, Financial
Reporting for Pension Plans, Statement No. 68, Accounting and Financial Reporting for Pensions,
and Statement No. 73, Accounting and Financial Reporting for Pensions and Related Assets That
Are Not within the Scope of GASB Statement 68, and Amendments to Certain Provisions of GASB
Statements 67 and 68. Specifically, this Statement addresses issues regarding (1) the presentation of
payroll-related measures in required supplementary information, (2) the selection of assumptions
and the treatment of deviations from the guidance in an Actuarial Standard of Practice for financial
reporting purposes, and (3) the classification of payments made by employers to satisfy plan
member contribution requirements.
The requirements of this Statement are effective for reporting periods beginning after June 15, 2016,
except for the requirements of this Statement for the selection of assumptions in a circumstance in
which an employer’s pension liability is measured as of a date other than the employer’s most recent
fiscal year-end. In that circumstance, the requirements for the selection of assumptions are effective
for that employer in the first reporting period in which the measurement date of the pension liability
is on or after June 15, 2017. The Authority has not completed the process of evaluating the impact of
GASB 82.
GASB Statement No. 83 (“GASB 83”), Certain Asset Retirement Obligations. The Statement
addresses accounting and financial reporting for certain asset retirement obligations (AROs). An
ARO is a legally enforceable liability associated with the retirement of a tangible capital asset. A
government that has legal obligations to perform future asset retirement activities related to its
tangible capital assets should recognize a liability based on the guidance in this Statement.
This Statement establishes criteria for determining the timing and pattern of recognition of a liability
and a corresponding deferred outflow of resources for AROs. This Statement requires that
recognition occur when the liability is both incurred and reasonably estimable. The determination of
when the liability is incurred should be based on the occurrence of external laws, regulations,
contracts, or court judgments, together with the occurrence of an internal event that obligates a
government to perform asset retirement activities. Laws and regulations may require governments to
take specific actions to retire certain tangible capital assets at the end of the useful lives of those
capital assets, such as decommissioning nuclear reactors and dismantling and removing sewage
treatment plants. Other obligations to retire tangible capital assets may arise from contracts or court
judgments. Internal obligating events include the occurrence of contamination, placing into
operation a tangible capital asset that is required to be retired, abandoning a tangible capital asset
before it is placed into operation, or acquiring a tangible capital asset that has an existing ARO.
The requirements of this Statement are effective for reporting periods beginning after June 15, 2018.
Earlier application is encouraged. The Authority has not completed the process of evaluating the
impact of GASB 83.
55
Accounting Standards Issued But Not Yet Adopted (continued)
GASB Statement No. 84 (“GASB 84”), “Fiduciary Activities”. The objective of this Statement is to
improve guidance regarding the identification of fiduciary activities for accounting and financial
reporting purposes and how those activities should be reported.
This Statement establishes criteria for identifying fiduciary activities of all state and local
governments. The focus of the criteria generally is on (1) whether a government is controlling the
assets of the fiduciary activity and (2) the beneficiaries with whom a fiduciary relationship exists.
Separate criteria are included to identify fiduciary component units and postemployment benefit
arrangements that are fiduciary activities.
An activity meeting the criteria should be reported in a fiduciary fund in the basic financial
statements. Governments with activities meeting the criteria should present a statement of fiduciary
net position and a statement of changes in fiduciary net position, An exception to that requirement
is provided for as a business-type activity that normally expects to hold custodial assets for three
months or less.
The requirements of this Statement are effective for reporting periods beginning after December 15,
2018. Earlier application is encouraged. The Authority has not completed the process of evaluating
the impact of GASB 84.
56
Accounting Standards Issued But Not Yet Adopted (continued)
GASB Statement No. 85 (“GASB 85”), Omnibus 2017. The objective of this Statement is to
address practice issues that have been identified during implementation and application of certain
GASB Statements. This Statement addresses a variety of topics including issues related to blending
component units, goodwill, fair value measurement and application, and postemployment benefits
(pensions and other postemployment benefits [OPEB]). Specifically, this Statement addresses the
following topics:
Blending a component unit in circumstances in which the primary government is a business-
type activity that reports in a single column for financial statement presentation.
Reporting amounts previously reported as goodwill and “negative” goodwill.
Classifying real estate held by insurance entities.
Measuring certain money market investments and participating interest-earning investment
contracts at amortized cost.
Timing of the measurement of pension or OPEAB liabilities and expenditures recognized in
financial statements prepared using the current financial resources measurement focus.
Recognizing on-behalf payments for pensions or OPEB in employer financial statements.
Presenting payroll-related measures in required supplementary information for purposes of
reporting by OPEB plans and employers that provide OPEB.
Classifying employee-paid member contributions for OPEB.
Simplifying certain aspects of the alternative measurement method for OPEB.
Accounting and financial reporting for OPEB provided through certain multiple-employer
defined benefit OPEB plans.
The requirements of this Statement are effective for reporting periods beginning after June 15, 2017.
Earlier application is encouraged. The Authority has not completed the process of evaluating the
impact of GASB 85.
57
D. Cash and Cash Equivalents
Cash includes amounts on deposit with financial institutions, including bank accounts and
certificates of deposit. The Authority considers investments in repurchase agreements and
investments with a maturity of less than 90 days as cash equivalents. The Authority considers cash
and cash equivalents held for the repayment of the non-current portion of Claims payable to be non-
current assets.
E. Accounts Receivable
Rents are due from tenants on the first day of each month. As a result, tenants receivable balances
primarily consist of rents past due and due from vacated tenants. An allowance for uncollectable
accounts is established to provide for accounts which may not be collected in the future for any
reason.
The Authority recognizes receivables from HUD and other governmental agencies for amounts
earned and billed but not received and for amounts earned but unbilled as of year-end.
F. Notes Receivable
Notes receivable are recorded based on the principal amount indicated in the underlying note
agreement. An allowance is established where there is uncertainty regarding the collection of the
note.
G. Investments
Investments with maturities of less than twelve months from the time of acquisition are carried at
cost. Investments in guaranteed investment contracts are reported at an amount equal to principal
and accrued interest. All other investments are recorded at fair value, which are based on quoted
market prices. Income from investments is recognized on the accrual basis. Realized gains or losses
on sales of investment securities are accounted for using the specific identification method. The
Authority combines realized and unrealized gains and losses on investments.
H. Prepaid Expenses
Prepaid expenses represent amounts paid as of year-end which will benefit future operations.
I. Inventories
Inventories consist of materials and supplies at the central warehouses, and fuel oil. Materials and
supplies are valued using the average moving cost method on a first in – first out basis. Fuel oil is
valued using weighted average cost. Materials and supplies are expensed when shipped from central
warehouses to the developments. The Authority maintains an allowance for obsolete inventory.
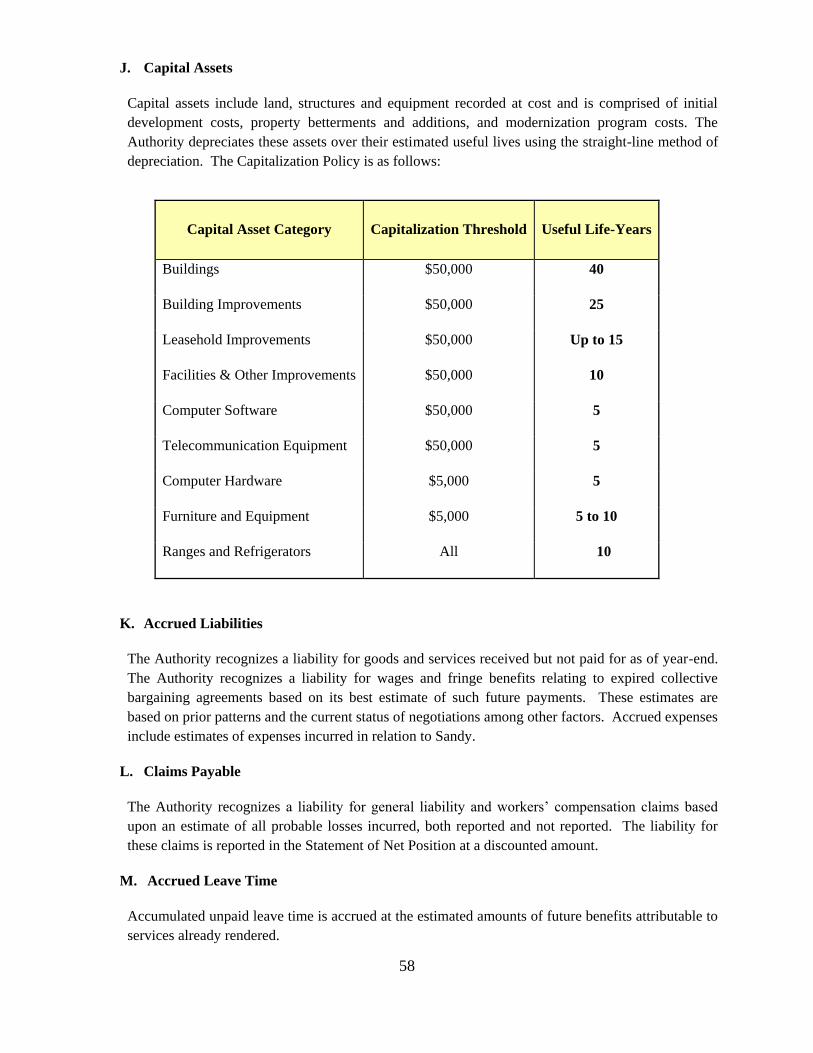
58
J. Capital Assets
Capital assets include land, structures and equipment recorded at cost and is comprised of initial
development costs, property betterments and additions, and modernization program costs. The
Authority depreciates these assets over their estimated useful lives using the straight-line method of
depreciation. The Capitalization Policy is as follows:
Capital Asset Category
Capitalization Threshold
Useful Life-Years
Buildings $50,000 40
Building Improvements $50,000 25
Leasehold Improvements $50,000 Up to 15
Facilities & Other Improvements $50,000 10
Computer Software $50,000 5
Telecommunication Equipment $50,000 5
Computer Hardware $5,000 5
Furniture and Equipment $5,000 5 to 10
Ranges and Refrigerators All 10
K. Accrued Liabilities
The Authority recognizes a liability for goods and services received but not paid for as of year-end.
The Authority recognizes a liability for wages and fringe benefits relating to expired collective
bargaining agreements based on its best estimate of such future payments. These estimates are
based on prior patterns and the current status of negotiations among other factors. Accrued expenses
include estimates of expenses incurred in relation to Sandy.
L. Claims Payable
The Authority recognizes a liability for general liability and workers’ compensation claims based
upon an estimate of all probable losses incurred, both reported and not reported. The liability for
these claims is reported in the Statement of Net Position at a discounted amount.
M. Accrued Leave Time
Accumulated unpaid leave time is accrued at the estimated amounts of future benefits attributable to
services already rendered.
59
N. Unearned Revenue
The Authority’s unearned revenue consists of the prepayment of rent by residents and the receipt of
governmental program funding where certain eligibility requirements have not been met. Unearned
revenue relating to the Section 8 Transaction and the Ocean Bayside RAD transaction are being
recognized over the fifteen year low income housing tax credit compliance period.
O. Premium Amortization
The Authority amortizes debt premium amounts over the life of the bonds using the effective interest
rate through maturity methodology.
P. Deferred Outflows and Inflows of Resources
In accordance with GASB 63, Financial Reporting of Deferred Outflows of Resources, Deferred
inflows of Resources, and Net Position, the Authority reports deferred outflows of resources in the
Statement of Financial Position in a separate section following Assets and deferred inflows of
resources in a separate section following liabilities. Gains and losses in connection with advanced
refunding of debt are recorded as either a deferred outflow (loss) or as a deferred inflow (gain) of
resources and amortized as a component of interest expense over the shorter of the remaining life of
the old or the new debt. Pension contributions made to NYCERS subsequent to the actuarial
measurement date and prior to the Authority’s fiscal year-end are reported as deferred outflows of
resources. Section 8 Housing Choice Voucher Subsidies received prior to the funding period are
reported as deferred inflow of resources.
Q. Use of Restricted Net Position
When both restricted and unrestricted resources are available for a particular restricted use, it is the
Authority’s policy to use restricted resources first, and then unrestricted resources as needed.
R. Operating Revenues and Expenses
The Authority defines its operating revenues as income derived from charges to residents and others
for rent and services provided. Its operating expenses are costs incurred in the operation of its
program activities to provide services to residents and others. The Authority classifies other
revenues and expenses as non-operating.
S. Capital Contributions
Capital Contributions are recognized at the time eligible program expenditures occur and/or the
Authority has complied with the grant requirements.
T. Taxes
The Authority is a public benefit corporation chartered under the New York State Public Housing
Law and as such is exempt from income taxes and certain other Federal, state and local taxes.
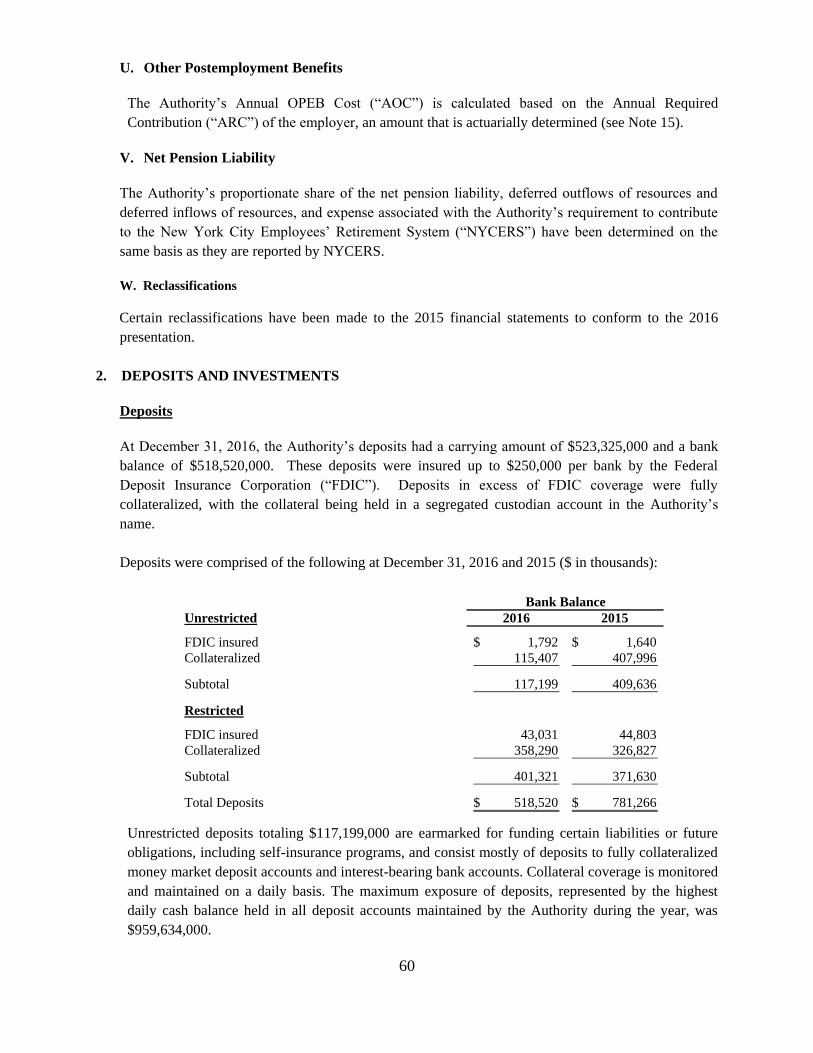
60
U. Other Postemployment Benefits
The Authority’s Annual OPEB Cost (“AOC”) is calculated based on the Annual Required
Contribution (“ARC”) of the employer, an amount that is actuarially determined (see Note 15).
V. Net Pension Liability
The Authority’s proportionate share of the net pension liability, deferred outflows of resources and
deferred inflows of resources, and expense associated with the Authority’s requirement to contribute
to the New York City Employees’ Retirement System (“NYCERS”) have been determined on the
same basis as they are reported by NYCERS.
W. Reclassifications
Certain reclassifications have been made to the 2015 financial statements to conform to the 2016
presentation.
2. DEPOSITS AND INVESTMENTS
Deposits
At December 31, 2016, the Authority’s deposits had a carrying amount of $523,325,000 and a bank
balance of $518,520,000. These deposits were insured up to $250,000 per bank by the Federal
Deposit Insurance Corporation (“FDIC”). Deposits in excess of FDIC coverage were fully
collateralized, with the collateral being held in a segregated custodian account in the Authority’s
name.
Deposits were comprised of the following at December 31, 2016 and 2015 ($ in thousands):
Bank Balance
Unrestricted 2016 2015
FDIC insured 1,792$ 1,640$
Collateralized 115,407 407,996
Subtotal 117,199 409,636
Restricted
FDIC insured 43,031 44,803
Collateralized 358,290 326,827
Subtotal 401,321 371,630
Total Deposits 518,520$ 781,266$
Unrestricted deposits totaling $117,199,000 are earmarked for funding certain liabilities or future
obligations, including self-insurance programs, and consist mostly of deposits to fully collateralized
money market deposit accounts and interest-bearing bank accounts. Collateral coverage is monitored
and maintained on a daily basis. The maximum exposure of deposits, represented by the highest
daily cash balance held in all deposit accounts maintained by the Authority during the year, was
$959,634,000.
61
2. DEPOSITS AND INVESTMENTS (continued)
At December 31, 2016, restricted deposits totaling $401,321,000 include funds held in depository
accounts on behalf of Sandy Recovery and escrowed vendor retention, federalization mixed-finance
funds held with the Authority, Certificates of Deposit for tenant security payments, and funds held
with fiscal agents related to the federalization mixed-finance transaction. The Certificates of
Deposits for tenant security maturing on March 31, 2017 are reinvested for one year through March
30, 2018. The liability related to these deposits is included in unearned revenues and other current
liabilities (see Note 12).
Investments
In accordance with GASB 72, NYCHA discloses its investments at fair market value. NYCHA
invests only in securities that fall under GASB’s Level 2 fair market valuation grouping (there are 3
levels in total), as there are comparable and observable traded securities that can be used to
accurately value NYCHA’s portfolio of securities. NYCHA uses the Bloomberg financial data
system to determine the fair market value of its entire portfolio of securities. As of December 31,
2016 and 2015, all of NYCHA’s long-term investment holdings were in U.S. agency bonds and
GASB 72 requires their fair market value be based on similar bonds that are being traded.
Unrestricted Investments
The Authority’s investment policies comply with HUD’s guidelines. These policies restrict the
Authority’s investments to obligations of the U.S. Treasury, U.S. Government agencies, and their
instrumentalities. All investments are held in a secured custody account in the name of the
Authority. All investments are publicly traded and the market value was based on published quoted
values. Accrued interest receivable on unrestricted investments was $1,785,000 and $1,987,000 at
December 31, 2016 and 2015.
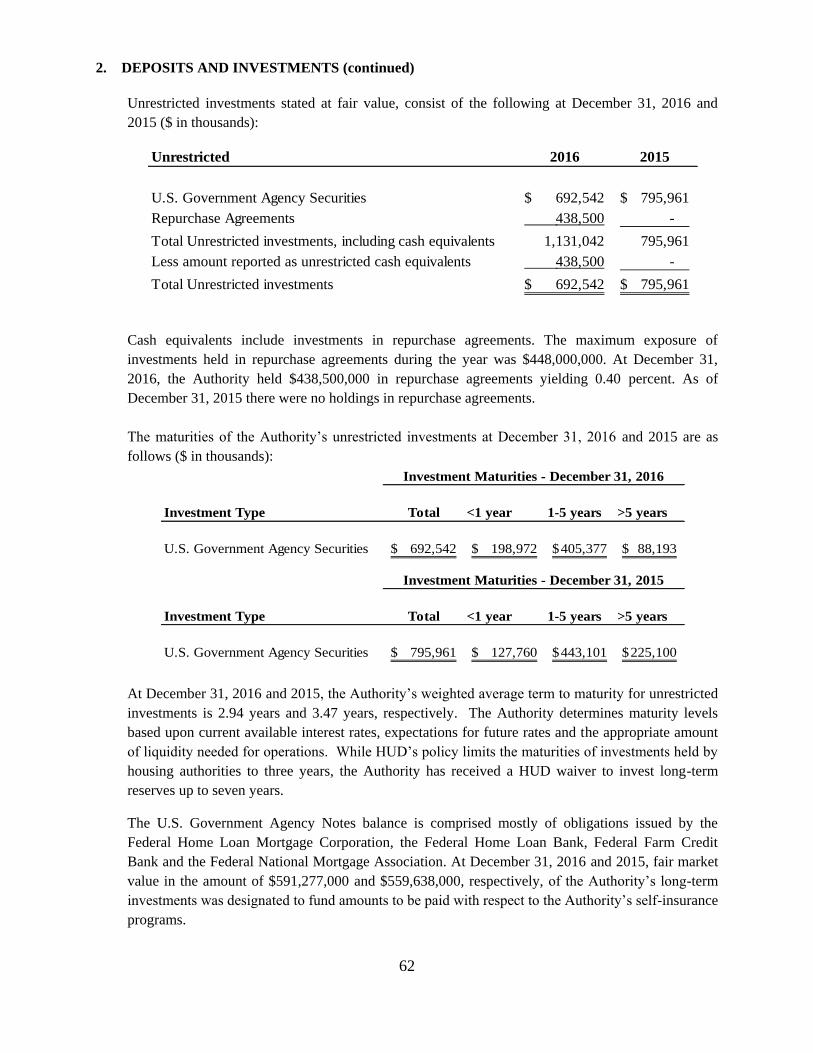
62
2. DEPOSITS AND INVESTMENTS (continued)
Unrestricted investments stated at fair value, consist of the following at December 31, 2016 and
2015 ($ in thousands):
Unrestricted 2016 2015
U.S. Government Agency Securities 692,542$ 795,961$
Repurchase Agreements 438,500 -
Total Unrestricted investments, including cash equivalents 1,131,042 795,961
Less amount reported as unrestricted cash equivalents 438,500 -
Total Unrestricted investments 692,542$ 795,961$
Cash equivalents include investments in repurchase agreements. The maximum exposure of
investments held in repurchase agreements during the year was $448,000,000. At December 31,
2016, the Authority held $438,500,000 in repurchase agreements yielding 0.40 percent. As of
December 31, 2015 there were no holdings in repurchase agreements.
The maturities of the Authority’s unrestricted investments at December 31, 2016 and 2015 are as
follows ($ in thousands):
Investment Maturities - December 31, 2016
Investment Type Total <1 year 1-5 years >5 years
U.S. Government Agency Securities 692,542$ 198,972$ 405,377$ 88,193$
Investment Maturities - December 31, 2015
Investment Type Total <1 year 1-5 years >5 years
U.S. Government Agency Securities 795,961$ 127,760$ 443,101$ 225,100$
At December 31, 2016 and 2015, the Authority’s weighted average term to maturity for unrestricted
investments is 2.94 years and 3.47 years, respectively. The Authority determines maturity levels
based upon current available interest rates, expectations for future rates and the appropriate amount
of liquidity needed for operations. While HUD’s policy limits the maturities of investments held by
housing authorities to three years, the Authority has received a HUD waiver to invest long-term
reserves up to seven years.
The U.S. Government Agency Notes balance is comprised mostly of obligations issued by the
Federal Home Loan Mortgage Corporation, the Federal Home Loan Bank, Federal Farm Credit
Bank and the Federal National Mortgage Association. At December 31, 2016 and 2015, fair market
value in the amount of $591,277,000 and $559,638,000, respectively, of the Authority’s long-term
investments was designated to fund amounts to be paid with respect to the Authority’s self-insurance
programs.
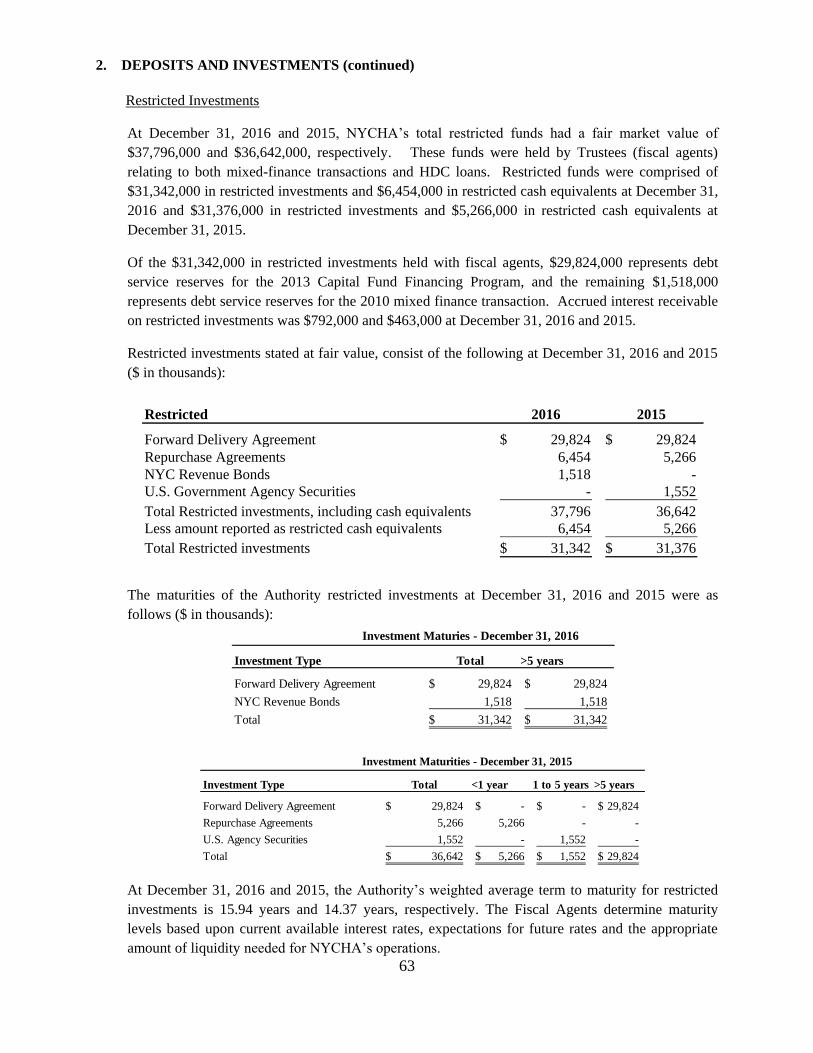
63
2. DEPOSITS AND INVESTMENTS (continued)
Restricted Investments
At December 31, 2016 and 2015, NYCHA’s total restricted funds had a fair market value of
$37,796,000 and $36,642,000, respectively. These funds were held by Trustees (fiscal agents)
relating to both mixed-finance transactions and HDC loans. Restricted funds were comprised of
$31,342,000 in restricted investments and $6,454,000 in restricted cash equivalents at December 31,
2016 and $31,376,000 in restricted investments and $5,266,000 in restricted cash equivalents at
December 31, 2015.
Of the $31,342,000 in restricted investments held with fiscal agents, $29,824,000 represents debt
service reserves for the 2013 Capital Fund Financing Program, and the remaining $1,518,000
represents debt service reserves for the 2010 mixed finance transaction. Accrued interest receivable
on restricted investments was $792,000 and $463,000 at December 31, 2016 and 2015.
Restricted investments stated at fair value, consist of the following at December 31, 2016 and 2015
($ in thousands):
Restricted 2016 2015
Forward Delivery Agreement 29,824$ 29,824$
Repurchase Agreements 6,454 5,266
NYC Revenue Bonds 1,518 -
U.S. Government Agency Securities - 1,552
Total Restricted investments, including cash equivalents 37,796 36,642
Less amount reported as restricted cash equivalents 6,454 5,266
Total Restricted investments 31,342$ 31,376$
The maturities of the Authority restricted investments at December 31, 2016 and 2015 were as
follows ($ in thousands):
Investment Maturies - December 31, 2016
Investment Type Total >5 years
Forward Delivery Agreement 29,824$ 29,824$
NYC Revenue Bonds 1,518 1,518
Total 31,342$ 31,342$
Investment Maturities - December 31, 2015
Investment Type Total <1 year 1 to 5 years >5 years
Forward Delivery Agreement 29,824$ -$ -$ 29,824$
Repurchase Agreements 5,266 5,266 - -
U.S. Agency Securities 1,552 - 1,552 -
Total 36,642$ 5,266$ 1,552$ 29,824$
At December 31, 2016 and 2015, the Authority’s weighted average term to maturity for restricted
investments is 15.94 years and 14.37 years, respectively. The Fiscal Agents determine maturity
levels based upon current available interest rates, expectations for future rates and the appropriate
amount of liquidity needed for NYCHA’s operations.
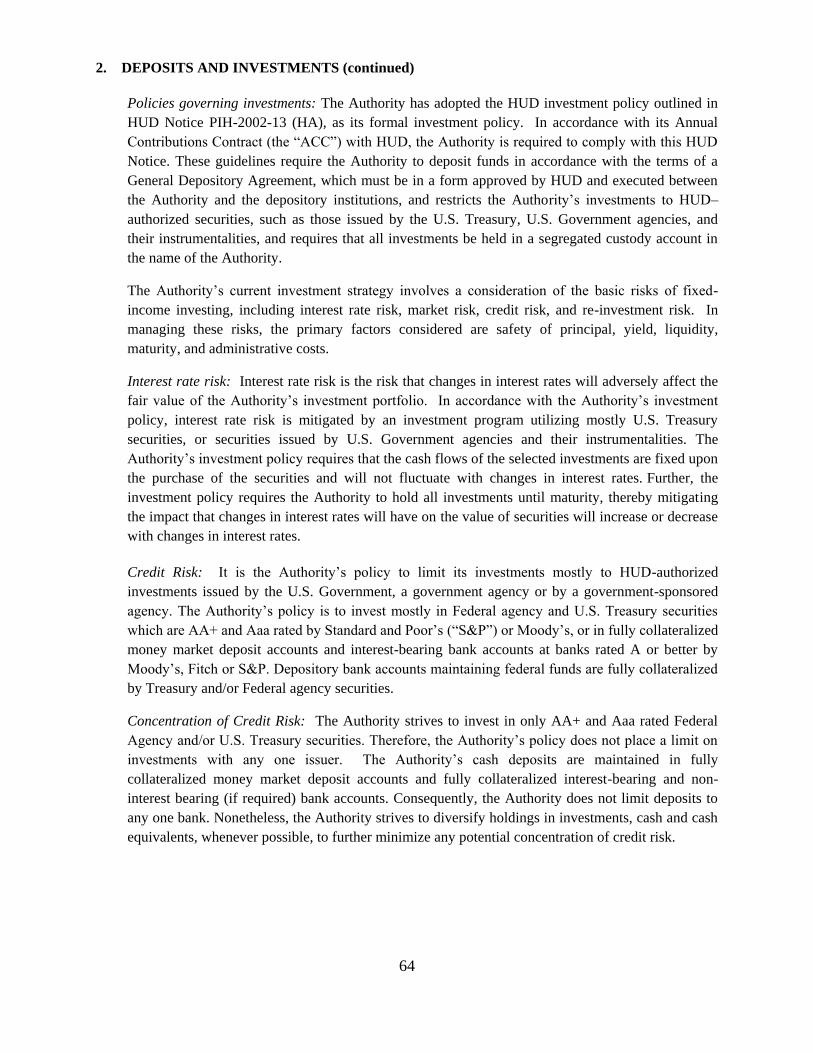
64
2. DEPOSITS AND INVESTMENTS (continued)
Policies governing investments: The Authority has adopted the HUD investment policy outlined in
HUD Notice PIH-2002-13 (HA), as its formal investment policy. In accordance with its Annual
Contributions Contract (the “ACC”) with HUD, the Authority is required to comply with this HUD
Notice. These guidelines require the Authority to deposit funds in accordance with the terms of a
General Depository Agreement, which must be in a form approved by HUD and executed between
the Authority and the depository institutions, and restricts the Authority’s investments to HUD–
authorized securities, such as those issued by the U.S. Treasury, U.S. Government agencies, and
their instrumentalities, and requires that all investments be held in a segregated custody account in
the name of the Authority.
The Authority’s current investment strategy involves a consideration of the basic risks of fixed-
income investing, including interest rate risk, market risk, credit risk, and re-investment risk. In
managing these risks, the primary factors considered are safety of principal, yield, liquidity,
maturity, and administrative costs.
Interest rate risk: Interest rate risk is the risk that changes in interest rates will adversely affect the
fair value of the Authority’s investment portfolio. In accordance with the Authority’s investment
policy, interest rate risk is mitigated by an investment program utilizing mostly U.S. Treasury
securities, or securities issued by U.S. Government agencies and their instrumentalities. The
Authority’s investment policy requires that the cash flows of the selected investments are fixed upon
the purchase of the securities and will not fluctuate with changes in interest rates. Further, the
investment policy requires the Authority to hold all investments until maturity, thereby mitigating
the impact that changes in interest rates will have on the value of securities will increase or decrease
with changes in interest rates.
Credit Risk: It is the Authority’s policy to limit its investments mostly to HUD-authorized
investments issued by the U.S. Government, a government agency or by a government-sponsored
agency. The Authority’s policy is to invest mostly in Federal agency and U.S. Treasury securities
which are AA+ and Aaa rated by Standard and Poor’s (“S&P”) or Moody’s, or in fully collateralized
money market deposit accounts and interest-bearing bank accounts at banks rated A or better by
Moody’s, Fitch or S&P. Depository bank accounts maintaining federal funds are fully collateralized
by Treasury and/or Federal agency securities.
Concentration of Credit Risk: The Authority strives to invest in only AA+ and Aaa rated Federal
Agency and/or U.S. Treasury securities. Therefore, the Authority’s policy does not place a limit on
investments with any one issuer. The Authority’s cash deposits are maintained in fully
collateralized money market deposit accounts and fully collateralized interest-bearing and non-
interest bearing (if required) bank accounts. Consequently, the Authority does not limit deposits to
any one bank. Nonetheless, the Authority strives to diversify holdings in investments, cash and cash
equivalents, whenever possible, to further minimize any potential concentration of credit risk.
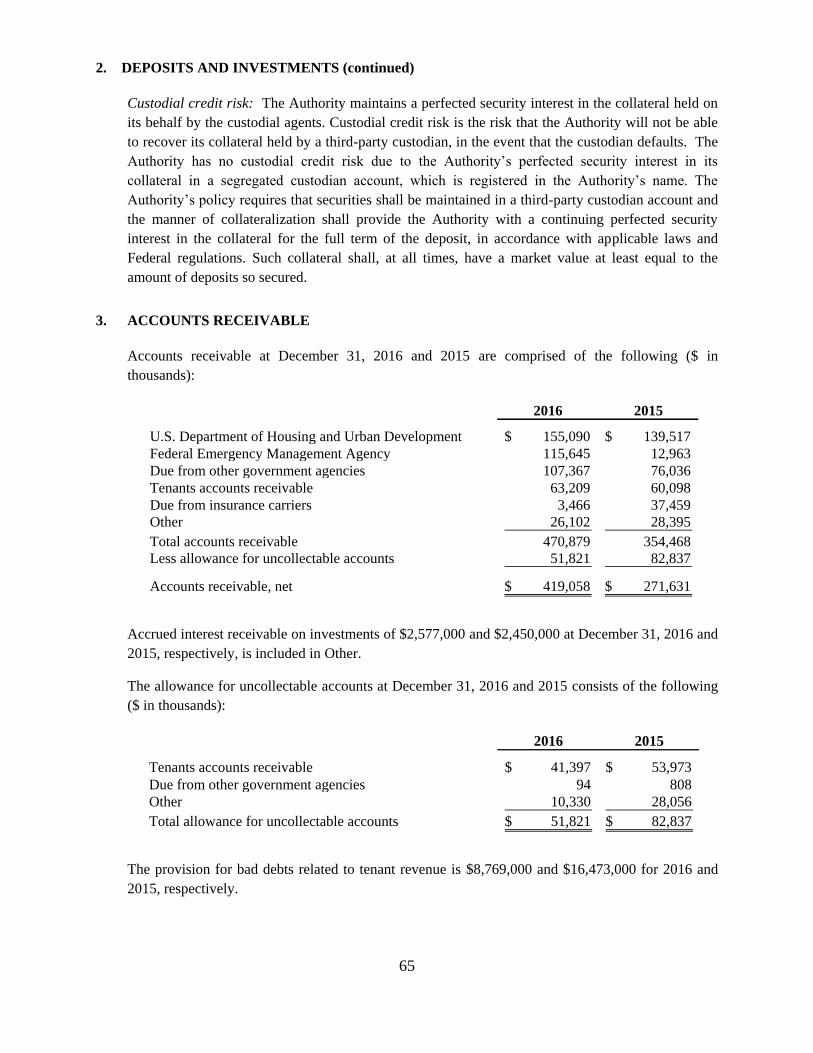
65
2. DEPOSITS AND INVESTMENTS (continued)
Custodial credit risk: The Authority maintains a perfected security interest in the collateral held on
its behalf by the custodial agents. Custodial credit risk is the risk that the Authority will not be able
to recover its collateral held by a third-party custodian, in the event that the custodian defaults. The
Authority has no custodial credit risk due to the Authority’s perfected security interest in its
collateral in a segregated custodian account, which is registered in the Authority’s name. The
Authority’s policy requires that securities shall be maintained in a third-party custodian account and
the manner of collateralization shall provide the Authority with a continuing perfected security
interest in the collateral for the full term of the deposit, in accordance with applicable laws and
Federal regulations. Such collateral shall, at all times, have a market value at least equal to the
amount of deposits so secured.
3. ACCOUNTS RECEIVABLE
Accounts receivable at December 31, 2016 and 2015 are comprised of the following ($ in
thousands):
2016 2015
U.S. Department of Housing and Urban Development 155,090$ 139,517$
Federal Emergency Management Agency 115,645 12,963
Due from other government agencies 107,367 76,036
Tenants accounts receivable 63,209 60,098
Due from insurance carriers 3,466 37,459
Other 26,102 28,395
Total accounts receivable 470,879 354,468
Less allowance for uncollectable accounts 51,821 82,837
Accounts receivable, net 419,058$ 271,631$
Accrued interest receivable on investments of $2,577,000 and $2,450,000 at December 31, 2016 and
2015, respectively, is included in Other.
The allowance for uncollectable accounts at December 31, 2016 and 2015 consists of the following
($ in thousands):
2016 2015
Tenants accounts receivable 41,397$ 53,973$
Due from other government agencies 94 808
Other 10,330 28,056
Total allowance for uncollectable accounts 51,821$ 82,837$
The provision for bad debts related to tenant revenue is $8,769,000 and $16,473,000 for 2016 and
2015, respectively.
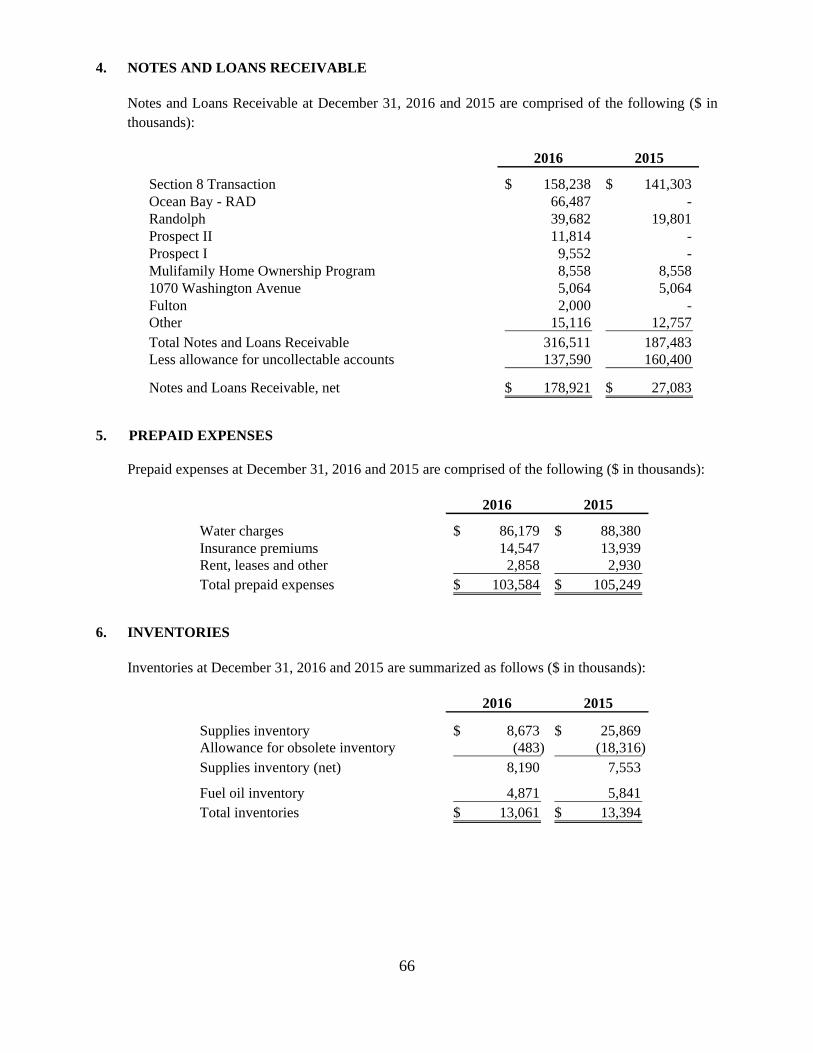
66
4. NOTES AND LOANS RECEIVABLE
Notes and Loans Receivable at December 31, 2016 and 2015 are comprised of the following ($ in
thousands):
2016 2015
Section 8 Transaction 158,238$ 141,303$
Ocean Bay - RAD 66,487 -
Randolph 39,682 19,801
Prospect II 11,814 -
Prospect I 9,552 -
Mulifamily Home Ownership Program 8,558 8,558
1070 Washington Avenue 5,064 5,064
Fulton 2,000 -
Other 15,116 12,757
Total Notes and Loans Receivable 316,511 187,483
Less allowance for uncollectable accounts 137,590 160,400
Notes and Loans Receivable, net 178,921$ 27,083$
5. PREPAID EXPENSES
Prepaid expenses at December 31, 2016 and 2015 are comprised of the following ($ in thousands):
2016 2015
Water charges 86,179$ 88,380$
Insurance premiums 14,547 13,939
Rent, leases and other 2,858 2,930
Total prepaid expenses 103,584$ 105,249$
6. INVENTORIES
Inventories at December 31, 2016 and 2015 are summarized as follows ($ in thousands):
2016 2015
Supplies inventory 8,673$ 25,869$
Allowance for obsolete inventory (483) (18,316)
Supplies inventory (net) 8,190 7,553
Fuel oil inventory 4,871 5,841
Total inventories 13,061$ 13,394$
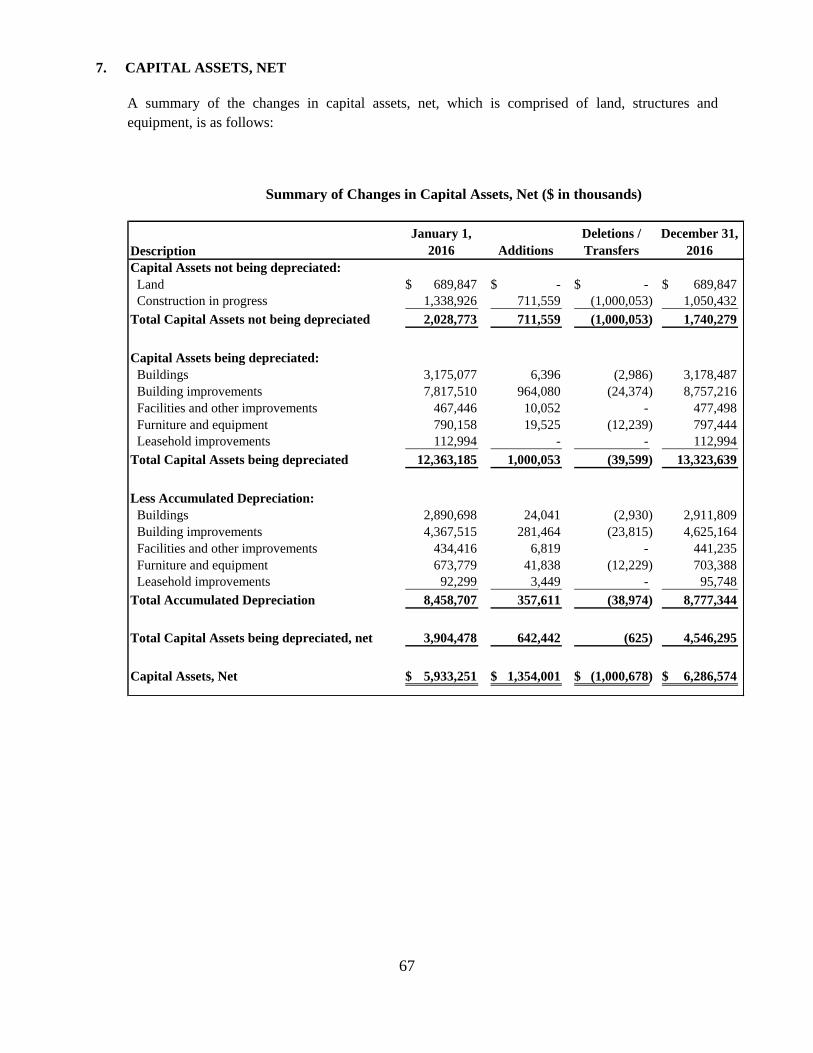
67
7. CAPITAL ASSETS, NET
A summary of the changes in capital assets, net, which is comprised of land, structures and
equipment, is as follows:
Summary of Changes in Capital Assets, Net ($ in thousands)
Description
January 1,
2016 Additions
Deletions /
Transfers
December 31,
2016
Capital Assets not being depreciated:
Land 689,847$ -$ -$ 689,847$
Construction in progress 1,338,926 711,559 (1,000,053) 1,050,432
Total Capital Assets not being depreciated 2,028,773 711,559 (1,000,053) 1,740,279
Capital Assets being depreciated:
Buildings 3,175,077 6,396 (2,986) 3,178,487
Building improvements 7,817,510 964,080 (24,374) 8,757,216
Facilities and other improvements 467,446 10,052 - 477,498
Furniture and equipment 790,158 19,525 (12,239) 797,444
Leasehold improvements 112,994 - - 112,994
Total Capital Assets being depreciated 12,363,185 1,000,053 (39,599) 13,323,639
Less Accumulated Depreciation:
Buildings 2,890,698 24,041 (2,930) 2,911,809
Building improvements 4,367,515 281,464 (23,815) 4,625,164
Facilities and other improvements 434,416 6,819 - 441,235
Furniture and equipment 673,779 41,838 (12,229) 703,388
Leasehold improvements 92,299 3,449 - 95,748
Total Accumulated Depreciation 8,458,707 357,611 (38,974) 8,777,344
Total Capital Assets being depreciated, net 3,904,478 642,442 (625) 4,546,295
Capital Assets, Net 5,933,251$ 1,354,001$ (1,000,678)$ 6,286,574$
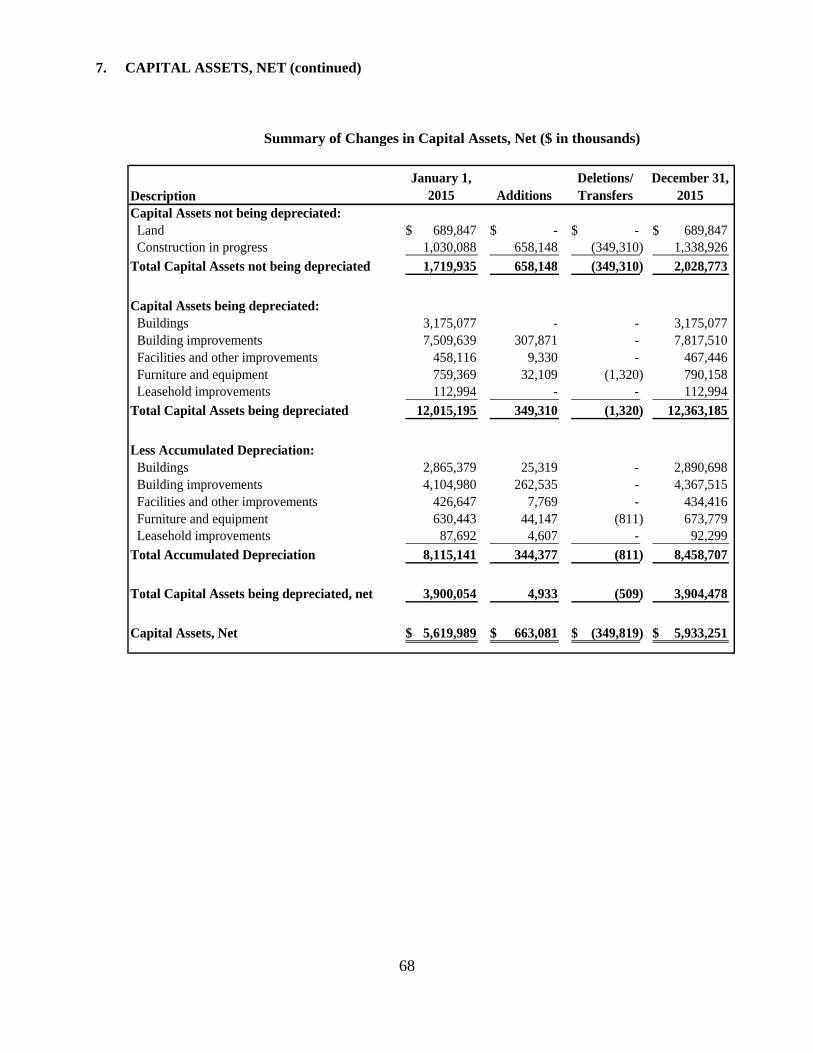
68
7. CAPITAL ASSETS, NET (continued)
Summary of Changes in Capital Assets, Net ($ in thousands)
Description
January 1,
2015 Additions
Deletions/
Transfers
December 31,
2015
Capital Assets not being depreciated:
Land 689,847$ -$ -$ 689,847$
Construction in progress 1,030,088 658,148 (349,310) 1,338,926
Total Capital Assets not being depreciated 1,719,935 658,148 (349,310) 2,028,773
Capital Assets being depreciated:
Buildings 3,175,077 - - 3,175,077
Building improvements 7,509,639 307,871 - 7,817,510
Facilities and other improvements 458,116 9,330 - 467,446
Furniture and equipment 759,369 32,109 (1,320) 790,158
Leasehold improvements 112,994 - - 112,994
Total Capital Assets being depreciated 12,015,195 349,310 (1,320) 12,363,185
Less Accumulated Depreciation:
Buildings 2,865,379 25,319 - 2,890,698
Building improvements 4,104,980 262,535 - 4,367,515
Facilities and other improvements 426,647 7,769 - 434,416
Furniture and equipment 630,443 44,147 (811) 673,779
Leasehold improvements 87,692 4,607 - 92,299
Total Accumulated Depreciation 8,115,141 344,377 (811) 8,458,707
Total Capital Assets being depreciated, net 3,900,054 4,933 (509) 3,904,478
Capital Assets, Net 5,619,989$ 663,081$ (349,819)$ 5,933,251$
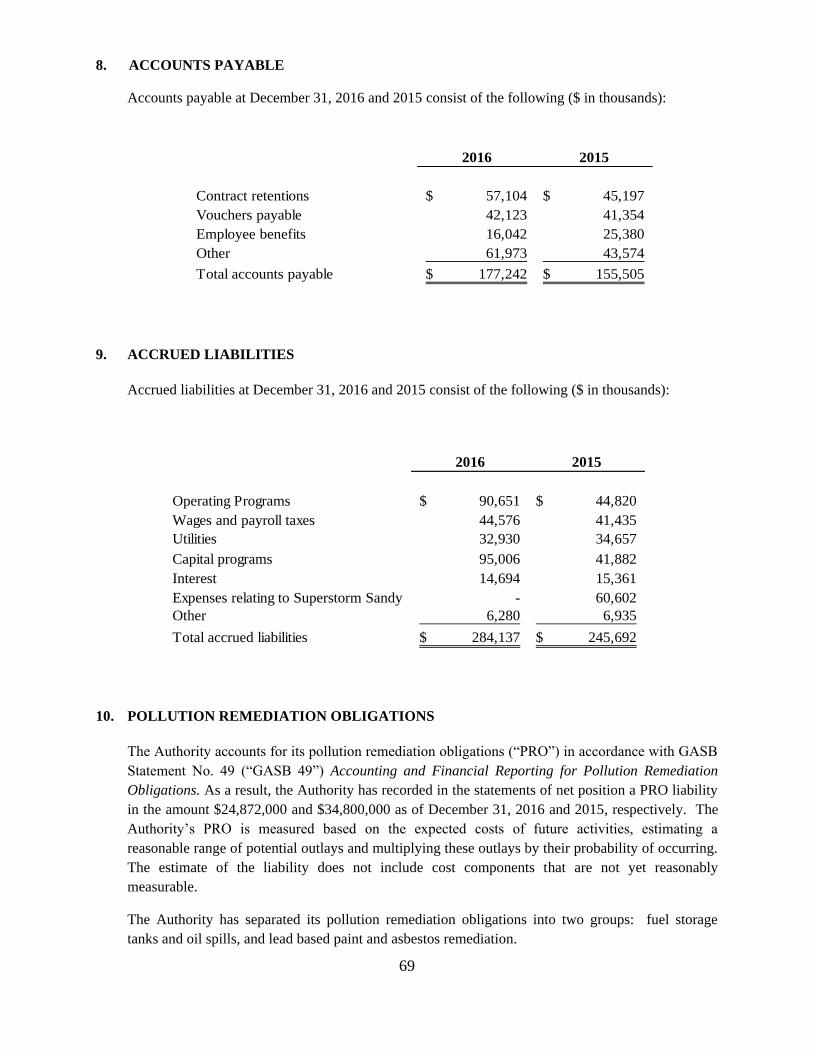
69
8. ACCOUNTS PAYABLE
Accounts payable at December 31, 2016 and 2015 consist of the following ($ in thousands):
2016 2015
Contract retentions 57,104$ 45,197$
Vouchers payable 42,123 41,354
Employee benefits 16,042 25,380
Other 61,973 43,574
Total accounts payable 177,242$ 155,505$
9. ACCRUED LIABILITIES
Accrued liabilities at December 31, 2016 and 2015 consist of the following ($ in thousands):
2016 2015
Operating Programs 90,651$ 44,820$
Wages and payroll taxes 44,576 41,435
Utilities 32,930 34,657
Capital programs 95,006 41,882
Interest 14,694 15,361
Expenses relating to Superstorm Sandy - 60,602
Other 6,280 6,935
Total accrued liabilities 284,137$ 245,692$
10. POLLUTION REMEDIATION OBLIGATIONS
The Authority accounts for its pollution remediation obligations (“PRO”) in accordance with GASB
Statement No. 49 (“GASB 49”) Accounting and Financial Reporting for Pollution Remediation
Obligations. As a result, the Authority has recorded in the statements of net position a PRO liability
in the amount $24,872,000 and $34,800,000 as of December 31, 2016 and 2015, respectively. The
Authority’s PRO is measured based on the expected costs of future activities, estimating a
reasonable range of potential outlays and multiplying these outlays by their probability of occurring.
The estimate of the liability does not include cost components that are not yet reasonably
measurable.
The Authority has separated its pollution remediation obligations into two groups: fuel storage
tanks and oil spills, and lead based paint and asbestos remediation.
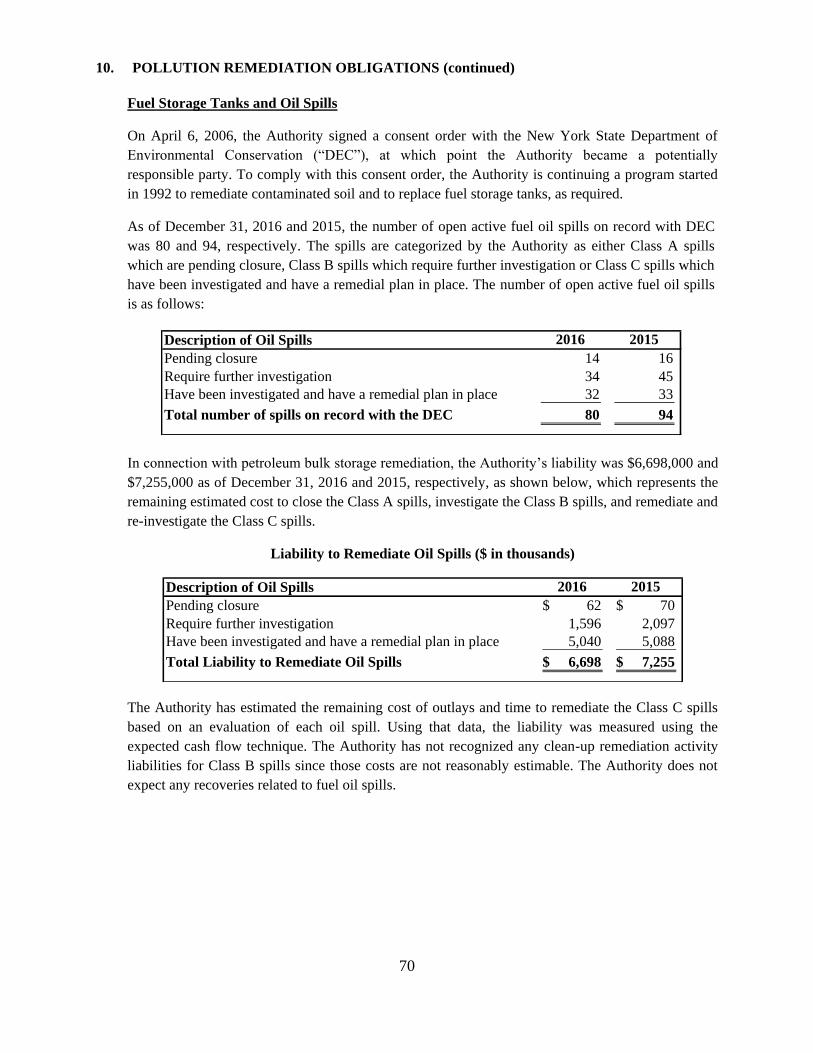
70
10. POLLUTION REMEDIATION OBLIGATIONS (continued)
Fuel Storage Tanks and Oil Spills
On April 6, 2006, the Authority signed a consent order with the New York State Department of
Environmental Conservation (“DEC”), at which point the Authority became a potentially
responsible party. To comply with this consent order, the Authority is continuing a program started
in 1992 to remediate contaminated soil and to replace fuel storage tanks, as required.
As of December 31, 2016 and 2015, the number of open active fuel oil spills on record with DEC
was 80 and 94, respectively. The spills are categorized by the Authority as either Class A spills
which are pending closure, Class B spills which require further investigation or Class C spills which
have been investigated and have a remedial plan in place. The number of open active fuel oil spills
is as follows:
Description of Oil Spills 2016 2015
Pending closure 14 16
Require further investigation 34 45
Have been investigated and have a remedial plan in place 32 33
Total number of spills on record with the DEC 80 94
In connection with petroleum bulk storage remediation, the Authority’s liability was $6,698,000 and
$7,255,000 as of December 31, 2016 and 2015, respectively, as shown below, which represents the
remaining estimated cost to close the Class A spills, investigate the Class B spills, and remediate and
re-investigate the Class C spills.
Liability to Remediate Oil Spills ($ in thousands)
Description of Oil Spills 2016 2015
Pending closure 62$ 70$
Require further investigation 1,596 2,097
Have been investigated and have a remedial plan in place 5,040 5,088
Total Liability to Remediate Oil Spills 6,698$ 7,255$
The Authority has estimated the remaining cost of outlays and time to remediate the Class C spills
based on an evaluation of each oil spill. Using that data, the liability was measured using the
expected cash flow technique. The Authority has not recognized any clean-up remediation activity
liabilities for Class B spills since those costs are not reasonably estimable. The Authority does not
expect any recoveries related to fuel oil spills.
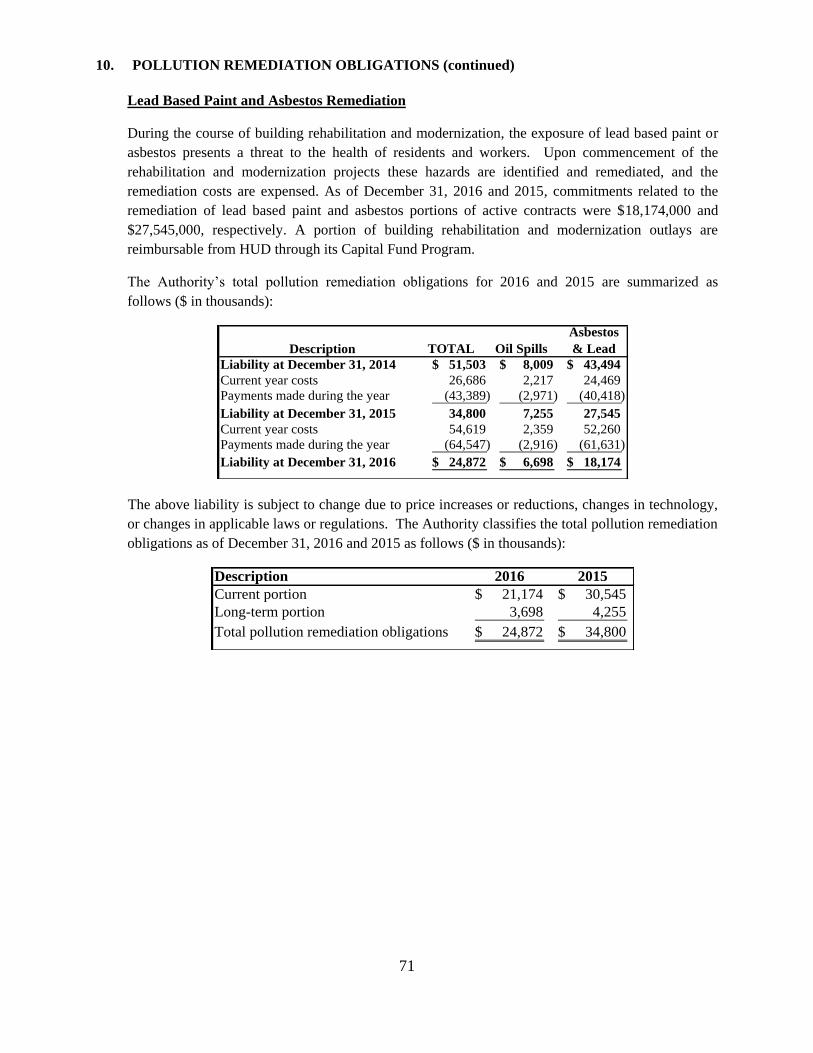
71
10. POLLUTION REMEDIATION OBLIGATIONS (continued)
Lead Based Paint and Asbestos Remediation
During the course of building rehabilitation and modernization, the exposure of lead based paint or
asbestos presents a threat to the health of residents and workers. Upon commencement of the
rehabilitation and modernization projects these hazards are identified and remediated, and the
remediation costs are expensed. As of December 31, 2016 and 2015, commitments related to the
remediation of lead based paint and asbestos portions of active contracts were $18,174,000 and
$27,545,000, respectively. A portion of building rehabilitation and modernization outlays are
reimbursable from HUD through its Capital Fund Program.
The Authority’s total pollution remediation obligations for 2016 and 2015 are summarized as
follows ($ in thousands):
Description TOTAL Oil Spills
Asbestos
& Lead
Liability at December 31, 2014 51,503$ 8,009$ 43,494$
Current year costs 26,686 2,217 24,469
Payments made during the year (43,389) (2,971) (40,418)
Liability at December 31, 2015 34,800 7,255 27,545
Current year costs 54,619 2,359 52,260
Payments made during the year (64,547) (2,916) (61,631)
Liability at December 31, 2016 24,872$ 6,698$ 18,174$
The above liability is subject to change due to price increases or reductions, changes in technology,
or changes in applicable laws or regulations. The Authority classifies the total pollution remediation
obligations as of December 31, 2016 and 2015 as follows ($ in thousands):
Description 2016 2015
Current portion 21,174$ 30,545$
Long-term portion 3,698 4,255
Total pollution remediation obligations 24,872$ 34,800$
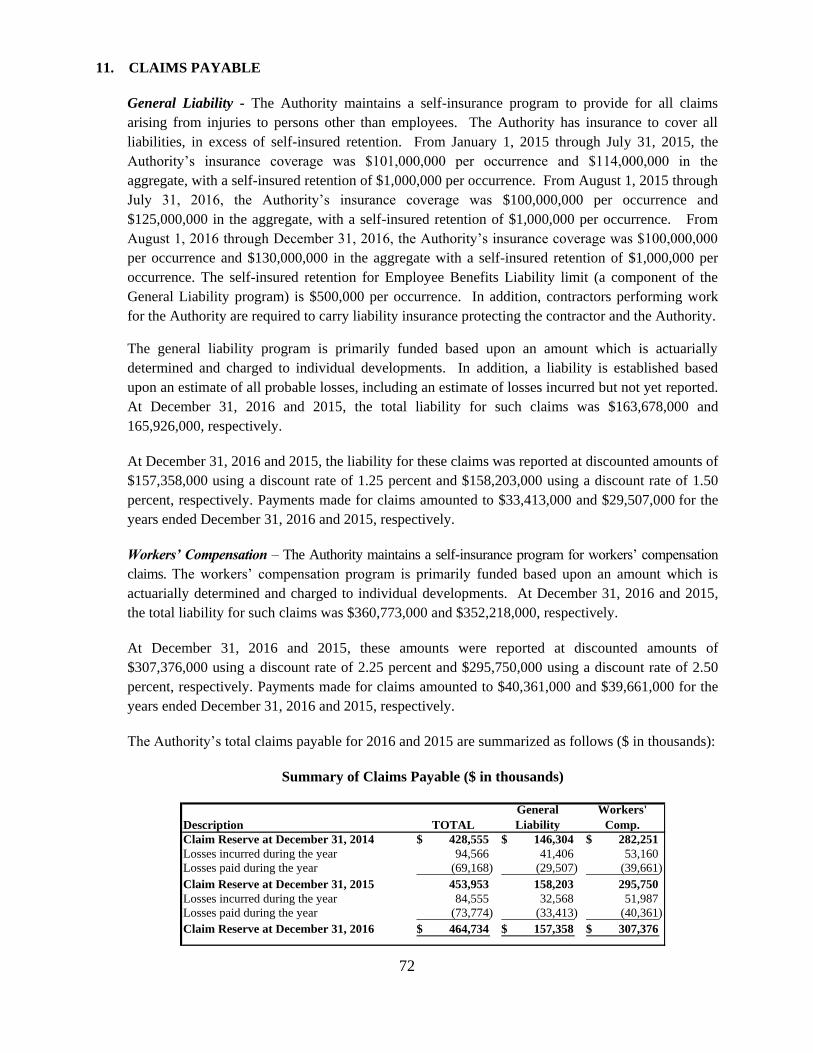
72
11. CLAIMS PAYABLE
General Liability - The Authority maintains a self-insurance program to provide for all claims
arising from injuries to persons other than employees. The Authority has insurance to cover all
liabilities, in excess of self-insured retention. From January 1, 2015 through July 31, 2015, the
Authority’s insurance coverage was $101,000,000 per occurrence and $114,000,000 in the
aggregate, with a self-insured retention of $1,000,000 per occurrence. From August 1, 2015 through
July 31, 2016, the Authority’s insurance coverage was $100,000,000 per occurrence and
$125,000,000 in the aggregate, with a self-insured retention of $1,000,000 per occurrence. From
August 1, 2016 through December 31, 2016, the Authority’s insurance coverage was $100,000,000
per occurrence and $130,000,000 in the aggregate with a self-insured retention of $1,000,000 per
occurrence. The self-insured retention for Employee Benefits Liability limit (a component of the
General Liability program) is $500,000 per occurrence. In addition, contractors performing work
for the Authority are required to carry liability insurance protecting the contractor and the Authority.
The general liability program is primarily funded based upon an amount which is actuarially
determined and charged to individual developments. In addition, a liability is established based
upon an estimate of all probable losses, including an estimate of losses incurred but not yet reported.
At December 31, 2016 and 2015, the total liability for such claims was $163,678,000 and
165,926,000, respectively.
At December 31, 2016 and 2015, the liability for these claims was reported at discounted amounts of
$157,358,000 using a discount rate of 1.25 percent and $158,203,000 using a discount rate of 1.50
percent, respectively. Payments made for claims amounted to $33,413,000 and $29,507,000 for the
years ended December 31, 2016 and 2015, respectively.
Workers’ Compensation – The Authority maintains a self-insurance program for workers’ compensation
claims. The workers’ compensation program is primarily funded based upon an amount which is
actuarially determined and charged to individual developments. At December 31, 2016 and 2015,
the total liability for such claims was $360,773,000 and $352,218,000, respectively.
At December 31, 2016 and 2015, these amounts were reported at discounted amounts of
$307,376,000 using a discount rate of 2.25 percent and $295,750,000 using a discount rate of 2.50
percent, respectively. Payments made for claims amounted to $40,361,000 and $39,661,000 for the
years ended December 31, 2016 and 2015, respectively.
The Authority’s total claims payable for 2016 and 2015 are summarized as follows ($ in thousands):
Summary of Claims Payable ($ in thousands)
Description TOTAL
General
Liability
Workers'
Comp.
Claim Reserve at December 31, 2014 428,555$ 146,304$ 282,251$
Losses incurred during the year 94,566 41,406 53,160
Losses paid during the year (69,168) (29,507) (39,661)
Claim Reserve at December 31, 2015 453,953 158,203 295,750
Losses incurred during the year 84,555 32,568 51,987
Losses paid during the year (73,774) (33,413) (40,361)
Claim Reserve at December 31, 2016 464,734$ 157,358$ 307,376$
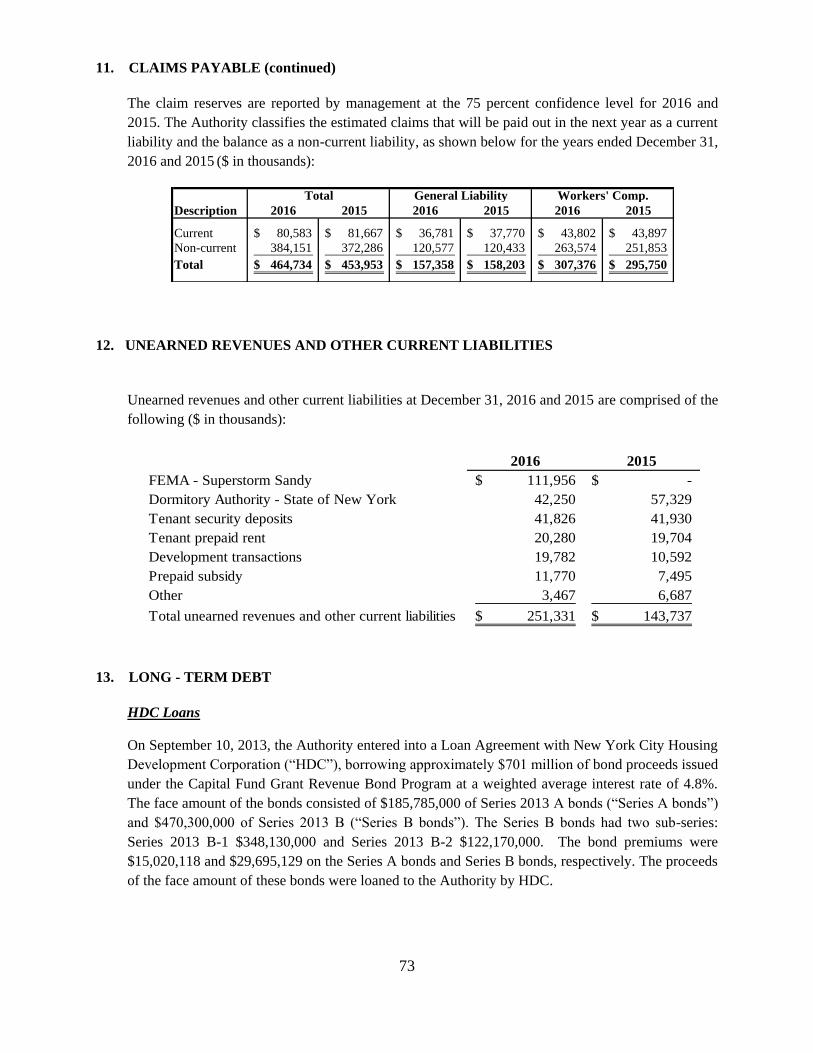
73
11. CLAIMS PAYABLE (continued)
The claim reserves are reported by management at the 75 percent confidence level for 2016 and
2015. The Authority classifies the estimated claims that will be paid out in the next year as a current
liability and the balance as a non-current liability, as shown below for the years ended December 31,
2016 and 2015 ($ in thousands):
Total General Liability Workers' Comp.
Description 2016 2015 2016 2015 2016 2015
Current 80,583$ 81,667$ 36,781$ 37,770$ 43,802$ 43,897$
Non-current 384,151 372,286 120,577 120,433 263,574 251,853
Total 464,734$ 453,953$ 157,358$ 158,203$ 307,376$ 295,750$
12. UNEARNED REVENUES AND OTHER CURRENT LIABILITIES
Unearned revenues and other current liabilities at December 31, 2016 and 2015 are comprised of the
following ($ in thousands):
2016 2015
FEMA - Superstorm Sandy 111,956$ -$
Dormitory Authority - State of New York 42,250 57,329
Tenant security deposits 41,826 41,930
Tenant prepaid rent 20,280 19,704
Development transactions 19,782 10,592
Prepaid subsidy 11,770 7,495
Other 3,467 6,687
Total unearned revenues and other current liabilities 251,331$ 143,737$
13. LONG - TERM DEBT
HDC Loans
On September 10, 2013, the Authority entered into a Loan Agreement with New York City Housing
Development Corporation (“HDC”), borrowing approximately $701 million of bond proceeds issued
under the Capital Fund Grant Revenue Bond Program at a weighted average interest rate of 4.8%.
The face amount of the bonds consisted of $185,785,000 of Series 2013 A bonds (“Series A bonds”)
and $470,300,000 of Series 2013 B (“Series B bonds”). The Series B bonds had two sub-series:
Series 2013 B-1 $348,130,000 and Series 2013 B-2 $122,170,000. The bond premiums were
$15,020,118 and $29,695,129 on the Series A bonds and Series B bonds, respectively. The proceeds
of the face amount of these bonds were loaned to the Authority by HDC.
74
13. LONG-TERM DEBT
HDC Loans (continued)
The Series 2013 A bonds proceeds were issued at a weighted average rate of 4.4% and were used
together with other available funds from the prior Series 2005 A bond issuance as an advance refund
of the remaining balance of the pre-existing Series 2005 A bonds and to defease the existing debt.
The bond proceeds of the new Series 2013 A bonds were deposited in an irrevocable trust with an
escrow agent to provide for all remaining debt service payments on the 2005 A Series bonds. The
advance refunding resulted in a difference between the reacquisition price and the net carrying
amount of the old debt of $10,388,000. This difference, a deferred amount on refunding, is being
amortized through the year 2025 using the effective-interest method. The Authority completed the
advance refunding to reduce total debt service payments over 11 years by $7.0 million and to obtain
an economic gain of $2.9 million.
The Series 2013 B bond proceeds were issued at a weighted average rate of 5.0% to fund
acquisition, construction or rehabilitation, and to make capital improvement at up to 39 specified
Authority developments. Capital improvements primarily include “building envelope” work on
roofs, brickwork, and windows, etc. The proceeds of these bonds that have been loaned to the
Authority by HDC were placed in escrow accounts with the Trustee banks. The Authority draws
down funds from the Trustee by means of capital fund requisitions as work is completed.
Certificates of Indebtedness
The State of New York has loaned the Authority funds to finance the construction of State-aided
developments from proceeds of State Housing Bonds. The Authority has acknowledged its
indebtedness for such loans by issuance of Certificates of Indebtedness. Debt service requirements
are made from funds provided by the State of New York.
Mortgage Loans
As part of the Authority’s March 16, 2010 mixed-finance transactions (see Note 21), HDC issued
bonds totaling $477,455,000. The bonds issued by HDC were comprised of seven different series as
follows: $23,590,000 2009 Series L-1, $68,000,000 2009 Series L-2, $150,000,000 2010 Series B
(Bridge Bonds), $140,000,000 2011 Series A (Bridge Bonds), $25,325,000 2010 Series A-1,
$3,000,000 2010 Series A-2 (Fixed-Rate Taxable Bonds), and $67,540,000 2012 Series A (Index
Floating Rate).
The bond proceeds were used to provide financing in the form of mortgage loans to LLC I and LLC
II. Of the seven different series of bonds issued as part of the mixed-finance transactions, three
series were outstanding and four series were paid in full during 2013. Specifically, 2009 Series L-1,
2010 Series A-1, and 2010 Series A-2 were outstanding as of December 31, 2016, while 2009 Series
L-2, 2010 Series B, 2011 Series A, and 2012 Series A were paid in full. In September 2013, the
three remaining loans were converted from construction to permanent loans, with principal and
interest payable monthly.
75
13. LONG-TERM DEBT
Mortgage Loans (continued)
For LLC I, the proceeds from the mortgage issued in connection with the $23,590,000 2009 Series
L-1 Bonds were used to finance the acquisition of the developments. These mortgage loans are
secured by the net operating income of the respective development’s Section 8 rental revenue.
The LLC II financing structure for rehabilitation provided private activity bond proceeds from a
long-term bond issue of $25,325,000 2010 Series A-1 Bonds. Similarly, acquisition funds were
provided from the proceeds of the $3,000,000 2010 Series A-2 Bonds. These mortgage loans are
secured by the net operating income of the respective development’s Section 8 rental revenue.
2013 Equipment Purchase/Lease Agreement
In January 2013, NYCHA entered into a 13 year Equipment Purchase/Lease Agreement with Banc
of America Public Capital Corp (“BAPCC”) in the amount of $18,046,000 to finance an Energy
Performance Contract (“EPC”). This financing agreement and EPC have enabled NYCHA to
upgrade or repair boilers, instantaneous hot water heaters, apartment temperature sensors, and
upgrade computerized heating automated systems at six developments, and upgrade an apartment
convector at one of these six developments. The Equipment Purchase/Lease Agreement with
BAPCC will mature in 2026. This EPC plan provides HUD-sponsored EPC funding for boiler
replacement projects at these six developments, which were previously earmarked to be funded with
Federal Capital subsidies, thereby enabling NYCHA to use its Federal Capital funds for other capital
improvements pursuant to NYCHA’s Five Year Capital Plan.
2016 Equipment Purchase/Lease Agreement
In December 2016, NYCHA entered into a 20 year Equipment Purchase/Lease Agreement with
Banc of America Public Capital Corp (“BAPCC”) in the amount of $51,548,000 to finance an
Energy Performance Contract (“EPC”). This financing agreement and EPC have enabled NYCHA
to upgrade common area and apartment lighting at twenty-four (24) developments and to replace a
boiler plant and upgrade a comprehensive heating system at one development. The Equipment
Purchase/Lease Agreement with BAPCC will mature in June 2036. This EPC plan provides HUD-
sponsored EPC funding at these twenty-four developments, thereby enabling NYCHA to use its
Federal Capital funds for other capital improvements pursuant to NYCHA’s Five Year Capital Plan.
2016 Unsecured Line of Credit / Loan Agreement
In December 2016, NYCHA enter into a Loan Agreement with the NY Green Bank, a division of
New York State Energy Research and Development Authority providing NYCHA with an $11
million unsecured line of credit. The term of the loan will be 12 months, with cumulative draws
totaling approximately $11 million, exclusive of interest and fees. The proceeds of this loan will be
used to partially finance energy efficiency upgrades at up to 25 developments associated with two
EPCs operated by HUD. This financing agreement will enable NYCHA to complete lighting
installations that reduce the Authority’s electricity demand in the Brooklyn and Queens boroughs of
New York. The installation and other associated work are scheduled to be completed and verified
by May 2017. In addition, the Authority is eligible to receive funds from Con Edison in the amount
of approximately $8 million based on energy savings. This loan matures on December 2017.
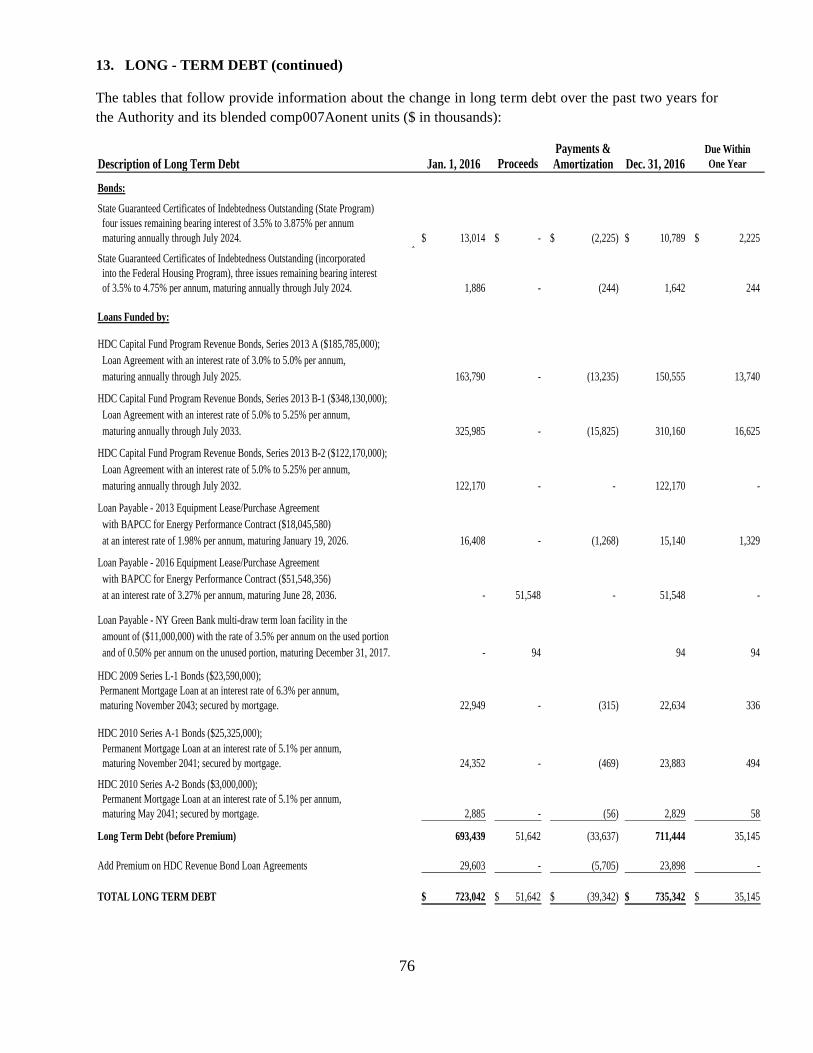
76
13. LONG - TERM DEBT (continued)
The tables that follow provide information about the change in long term debt over the past two years for
the Authority and its blended comp007Aonent units ($ in thousands):
Payments & Due Within
Description of Long Term Debt Jan. 1, 2016 Proceeds Amortization Dec. 31, 2016 One Year
Bonds:
State Guaranteed Certificates of Indebtedness Outstanding (State Program)
four issues remaining bearing interest of 3.5% to 3.875% per annum
maturing annually through July 2024. 13,014$ -$ (2,225)$ 10,789$ 2,225$ 1
State Guaranteed Certificates of Indebtedness Outstanding (incorporated
into the Federal Housing Program), three issues remaining bearing interest
of 3.5% to 4.75% per annum, maturing annually through July 2024. 1,886 - (244) 1,642 244
Loans Funded by:
HDC Capital Fund Program Revenue Bonds, Series 2013 A ($185,785,000);
Loan Agreement with an interest rate of 3.0% to 5.0% per annum,
maturing annually through July 2025. 163,790 - (13,235) 150,555 13,740 \
HDC Capital Fund Program Revenue Bonds, Series 2013 B-1 ($348,130,000);
Loan Agreement with an interest rate of 5.0% to 5.25% per annum,
maturing annually through July 2033. 325,985 - (15,825) 310,160 16,625
HDC Capital Fund Program Revenue Bonds, Series 2013 B-2 ($122,170,000);
Loan Agreement with an interest rate of 5.0% to 5.25% per annum,
maturing annually through July 2032. 122,170 - - 122,170 -
Loan Payable - 2013 Equipment Lease/Purchase Agreement
with BAPCC for Energy Performance Contract ($18,045,580)
at an interest rate of 1.98% per annum, maturing January 19, 2026. 16,408 - (1,268) 15,140 1,329
Loan Payable - 2016 Equipment Lease/Purchase Agreement
with BAPCC for Energy Performance Contract ($51,548,356)
at an interest rate of 3.27% per annum, maturing June 28, 2036. - 51,548 - 51,548 -
Loan Payable - NY Green Bank multi-draw term loan facility in the
amount of ($11,000,000) with the rate of 3.5% per annum on the used portion
and of 0.50% per annum on the unused portion, maturing December 31, 2017. - 94 94 94
HDC 2009 Series L-1 Bonds ($23,590,000);
Permanent Mortgage Loan at an interest rate of 6.3% per annum,
maturing November 2043; secured by mortgage. 22,949 - (315) 22,634 336
HDC 2010 Series A-1 Bonds ($25,325,000);
Permanent Mortgage Loan at an interest rate of 5.1% per annum,
maturing November 2041; secured by mortgage. 24,352 - (469) 23,883 494
HDC 2010 Series A-2 Bonds ($3,000,000);
Permanent Mortgage Loan at an interest rate of 5.1% per annum,
maturing May 2041; secured by mortgage. 2,885 - (56) 2,829 58
Long Term Debt (before Premium) 693,439 51,642 (33,637) 711,444 35,145
Add Premium on HDC Revenue Bond Loan Agreements 29,603 - (5,705) 23,898 -
TOTAL LONG TERM DEBT 723,042$ 51,642$ (39,342)$ 735,342$ 35,145$
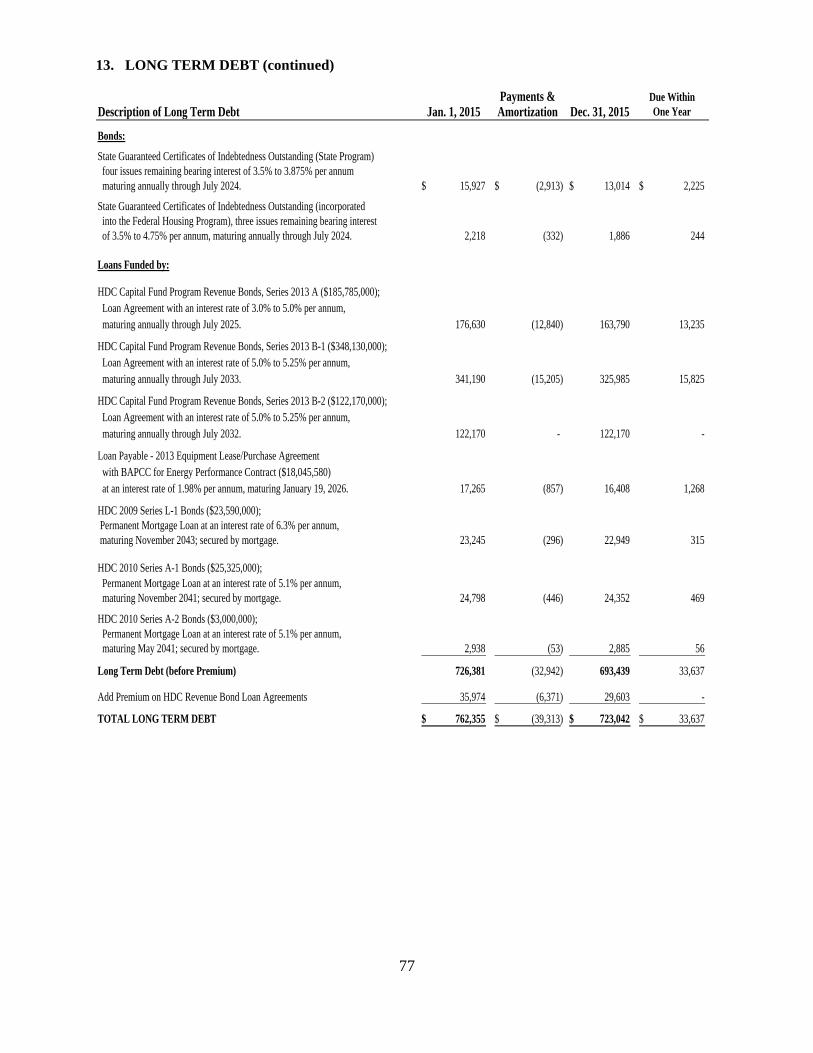
77
13. LONG TERM DEBT (continued)
Payments & Due Within
Description of Long Term Debt Jan. 1, 2015 Amortization Dec. 31, 2015 One Year
Bonds:
State Guaranteed Certificates of Indebtedness Outstanding (State Program)
four issues remaining bearing interest of 3.5% to 3.875% per annum
maturing annually through July 2024. 15,927$ (2,913)$ 13,014$ 2,225$
State Guaranteed Certificates of Indebtedness Outstanding (incorporated
into the Federal Housing Program), three issues remaining bearing interest
of 3.5% to 4.75% per annum, maturing annually through July 2024. 2,218 (332) 1,886 244
Loans Funded by:
HDC Capital Fund Program Revenue Bonds, Series 2013 A ($185,785,000);
Loan Agreement with an interest rate of 3.0% to 5.0% per annum,
maturing annually through July 2025. 176,630 (12,840) 163,790 13,235 \
HDC Capital Fund Program Revenue Bonds, Series 2013 B-1 ($348,130,000);
Loan Agreement with an interest rate of 5.0% to 5.25% per annum,
maturing annually through July 2033. 341,190 (15,205) 325,985 15,825
HDC Capital Fund Program Revenue Bonds, Series 2013 B-2 ($122,170,000);
Loan Agreement with an interest rate of 5.0% to 5.25% per annum,
maturing annually through July 2032. 122,170 - 122,170 -
Loan Payable - 2013 Equipment Lease/Purchase Agreement
with BAPCC for Energy Performance Contract ($18,045,580)
at an interest rate of 1.98% per annum, maturing January 19, 2026. 17,265 (857) 16,408 1,268
HDC 2009 Series L-1 Bonds ($23,590,000);
Permanent Mortgage Loan at an interest rate of 6.3% per annum,
maturing November 2043; secured by mortgage. 23,245 (296) 22,949 315
HDC 2010 Series A-1 Bonds ($25,325,000);
Permanent Mortgage Loan at an interest rate of 5.1% per annum,
maturing November 2041; secured by mortgage. 24,798 (446) 24,352 469
HDC 2010 Series A-2 Bonds ($3,000,000);
Permanent Mortgage Loan at an interest rate of 5.1% per annum,
maturing May 2041; secured by mortgage. 2,938 (53) 2,885 56
Long Term Debt (before Premium) 726,381 (32,942) 693,439 33,637
Add Premium on HDC Revenue Bond Loan Agreements 35,974 (6,371) 29,603 -
TOTAL LONG TERM DEBT 762,355$ (39,313)$ 723,042$ 33,637$
78
13. LONG TERM DEBT (continued)
Pledged Revenue
CFFP Series 2013A & B Bonds - As security for the Series 2013 A, B-1, and B-2 CFFP Bonds
which were issued by HDC, the Authority pledged future HUD Capital Fund Program grant revenue
to service the bond debt (thereby satisfying NYCHA’s loans payable to HDC). With HUD’s
approval, the Authority pledged as sole security for the bonds, a portion of its annual appropriation
from HUD. The bonds are payable with pledged revenue through 2033. The Authority has
committed to appropriate capital contributions of the Capital Fund Program in amounts sufficient to
cover the scheduled principal and interest requirements of the debt. Total principal and interest paid
for 2016 and 2015, by the Authority was $59,517,000 and $59,343,000, respectively. As of
December 31, 2016, total principal and interest remaining on the combined debt for Series 2013 A,
B-1, and B-2 are $582,885,000 and $263,397,000, respectively, with annual debt service ranging
from $59,529,000 in 2017 to $38,792,000 in 2033.
2013 Equipment Purchase/Lease Agreement - As security for the Equipment Purchase/Lease
Agreement with Banc of America Public Capital Corp, the Authority pledged HUD Operating
Subsidy revenue to service the loan debt. With HUD’s approval, the Authority pledged as sole
security, a portion of its annual appropriation from HUD that consists of HUD Financial Incentive
Payments. The loan is payable with pledged revenue through 2026. The Authority has committed
to appropriate HUD Operating Subsidy revenue in amounts sufficient to cover the scheduled
principal and interest requirements of the debt. Total principal and interest paid for 2016 and 2015,
by the Authority was $1,586,000 and $1,197,000 respectively. As of December 31, 2016, total
principal and interest remaining on the Equipment Purchase/Lease Agreement are $15,140,000 and
$1,578,000, with annual debt service ranging from $1,622,000 in 2017 to $853,000 in the final year,
2026.
2016 Equipment Purchase/Lease Agreement - As security for the Equipment Purchase/Lease
Agreement with Banc of America Public Capital Corp, the Authority pledged HUD Operating
Subsidy revenue to service the loan debt. With HUD’s approval, the Authority pledged as sole
security, a portion of its annual appropriation from HUD that consists of HUD Financial Incentive
Payments. The loan is payable with pledged revenue through 2036. The Authority has committed
to appropriate HUD Operating Subsidy revenue in amounts sufficient to cover the scheduled
principal and interest requirements of the debt. As of December 31, 2016, total principal and
interest remaining on the Equipment Purchase/Lease Agreement are $51,548,000 and $21,892,000,
with no annual debt service payments due during 2017 to $2,439,000 in the final year, 2036. Debt
service payments will begin in December 2018.
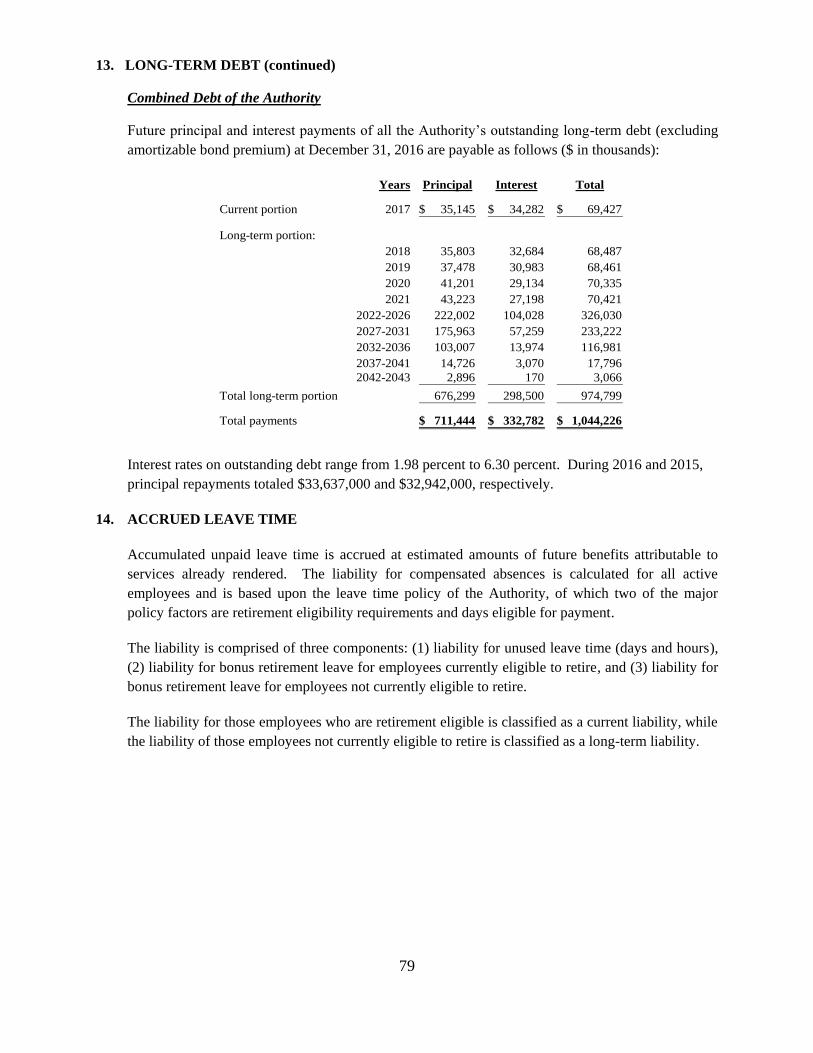
79
13. LONG-TERM DEBT (continued)
Combined Debt of the Authority
Future principal and interest payments of all the Authority’s outstanding long-term debt (excluding
amortizable bond premium) at December 31, 2016 are payable as follows ($ in thousands):
Years Principal Interest Total
Current portion 2017 35,145$ 34,282$ 69,427$
Long-term portion:
2018 35,803 32,684 68,487
2019 37,478 30,983 68,461
2020 41,201 29,134 70,335
2021 43,223 27,198 70,421
2022-2026 222,002 104,028 326,030
2027-2031 175,963 57,259 233,222
2032-2036 103,007 13,974 116,981
2037-2041 14,726 3,070 17,796
2042-2043 2,896 170 3,066
Total long-term portion 676,299 298,500 974,799
Total payments 711,444$ 332,782$ 1,044,226$
Interest rates on outstanding debt range from 1.98 percent to 6.30 percent. During 2016 and 2015,
principal repayments totaled $33,637,000 and $32,942,000, respectively.
14. ACCRUED LEAVE TIME
Accumulated unpaid leave time is accrued at estimated amounts of future benefits attributable to
services already rendered. The liability for compensated absences is calculated for all active
employees and is based upon the leave time policy of the Authority, of which two of the major
policy factors are retirement eligibility requirements and days eligible for payment.
The liability is comprised of three components: (1) liability for unused leave time (days and hours),
(2) liability for bonus retirement leave for employees currently eligible to retire, and (3) liability for
bonus retirement leave for employees not currently eligible to retire.
The liability for those employees who are retirement eligible is classified as a current liability, while
the liability of those employees not currently eligible to retire is classified as a long-term liability.
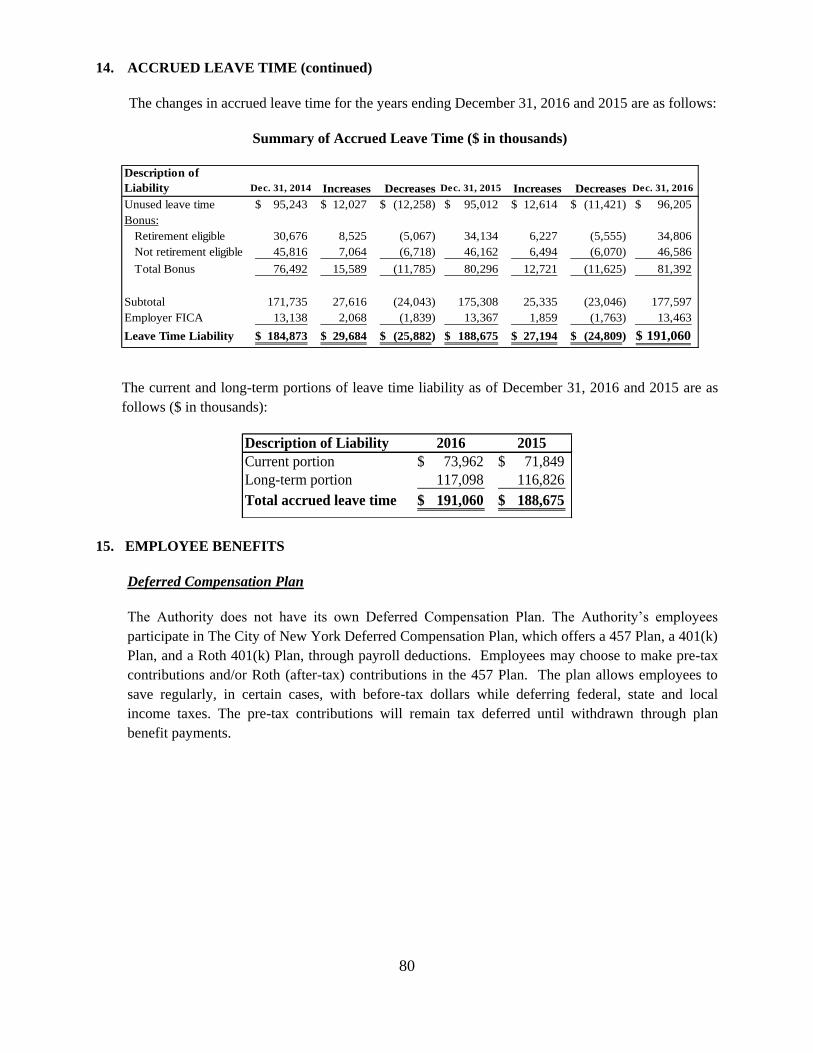
80
14. ACCRUED LEAVE TIME (continued)
The changes in accrued leave time for the years ending December 31, 2016 and 2015 are as follows:
Summary of Accrued Leave Time ($ in thousands)
Description of
Liability Dec. 31, 2014 Increases Decreases Dec. 31, 2015 Increases Decreases Dec. 31, 2016
Unused leave time 95,243$ 12,027$ (12,258)$ 95,012$ 12,614$ (11,421)$ 96,205$
Bonus:
Retirement eligible 30,676 8,525 (5,067) 34,134 6,227 (5,555) 34,806
Not retirement eligible 45,816 7,064 (6,718) 46,162 6,494 (6,070) 46,586
Total Bonus 76,492 15,589 (11,785) 80,296 12,721 (11,625) 81,392
Subtotal 171,735 27,616 (24,043) 175,308 25,335 (23,046) 177,597
Employer FICA 13,138 2,068 (1,839) 13,367 1,859 (1,763) 13,463
Leave Time Liability 184,873$ 29,684$ (25,882)$ 188,675$ 27,194$ (24,809)$ 191,060$
The current and long-term portions of leave time liability as of December 31, 2016 and 2015 are as
follows ($ in thousands):
Description of Liability 2016 2015
Current portion 73,962$ 71,849$
Long-term portion 117,098 116,826
Total accrued leave time 191,060$ 188,675$
15. EMPLOYEE BENEFITS
Deferred Compensation Plan
The Authority does not have its own Deferred Compensation Plan. The Authority’s employees
participate in The City of New York Deferred Compensation Plan, which offers a 457 Plan, a 401(k)
Plan, and a Roth 401(k) Plan, through payroll deductions. Employees may choose to make pre-tax
contributions and/or Roth (after-tax) contributions in the 457 Plan. The plan allows employees to
save regularly, in certain cases, with before-tax dollars while deferring federal, state and local
income taxes. The pre-tax contributions will remain tax deferred until withdrawn through plan
benefit payments.
81
Pension Plan
The Authority follows the provisions of GASB Statement No. 68 Accounting and Financial
Reporting for Pensions – an amendment of GASB Statement No. 27. This Statement establishes
financial reporting standards for state and local governments for pensions (see Note 1).
Plan Description. Authority employees are members of the New York City Employees’ Retirement
System, a multiple employer, cost-sharing, public employee retirement system. NYCERS provides
retirement, as well as death and disability benefits. The NYCERS plan combines the features of a
defined benefit pension plan with those of a defined contribution pension plan, but is considered a
defined benefit plan for financial reporting purposes. NYCERS administers the New York City
Employees Retirement System qualified pension plan.
NYCERS issues a stand-alone financial report, which is included in The City of New York
Comprehensive Annual Financial Report as a pension trust fund. This financial report may be
obtained from the New York City Employees’ Retirement System, 335 Adams Street, Suite 2300,
Brooklyn, N.Y. 11201-3724, or from the website of NYCERS at http://nycers.org.
All persons holding permanent civil service positions in the competitive or labor class are required
to become members of the system six months after their date of appointment, but may voluntarily
elect to join the system prior to their mandated membership date. All other eligible employees have
the option of joining the system upon appointment or anytime thereafter.
Tier 1 - All members who joined prior to July 1, 1973.
Tier 2 - All members who joined on or after July 1, 1973 and before July 27, 1976.
Tier 3 - Only certain members who joined on or after July 27, 1976 and prior to April 1, 2012.
Tier 4 - All members (with certain member exceptions) who joined on or after July 27, 1976 but
prior to April 1, 2012. Members who joined on or after July 27, 1976 but prior to September 1,
1983 retain all rights and benefits of Tier 3 membership.
Tier 6 – Members who joined on or after April 1, 2012.
The 63/10 Retirement Plan (“Tier 6 Basic Plan”), changed the vesting period from five years of
credited service to ten years of credited service.
NYCERS provides three main types of retirement benefits: Service Retirements, Ordinary Disability
Retirements, which are non-job-related disabilities, and Accident Disability Retirements, which are
job-related disabilities, to participants generally based on salary, length of service, and member
Tiers. The Service Retirement benefits provided to Tier 1 participants fall into four categories
according to the level of benefits provided and the years of service required. Three of the four
categories provide annual benefits of 50% to 55% of final salary after 20 or 25 years of service, with
additional benefits equal to a specified percentage per year of service, currently 1.2% to 1.7%, of
final salary. The fourth category has no minimum service requirement and instead provides an
annual benefit for each year of service equal to a specified percentage, currently 0.7% to 1.53%, of
final salary.
82
Pension Plan (continued)
Funding Policy. Benefit and contribution provisions, which are contingent upon the time at which
the employee last entered qualifying service, salary, and length of credited service, are established
by State law and may be amended only by the State Legislature. The plan has contributory and non-
contributory requirements, with retirement age of 55 or older depending upon when an employee
last entered qualifying service, except for employees in physically taxing titles and those who can
retire at age 50 with proper service.
Employees entering qualifying service on or before June 30, 1976 are enrolled in a non-contributory
plan. Employees entering qualifying service after June 30, 1976, but before June 29, 1995, are
enrolled in a plan which required a 3 percent contribution of their salary. This 3 percent required
contribution was eliminated for employees who reached 10 years of service, effective October 1,
2000. Employees entering qualifying service after June 28, 1995 are enrolled in a plan which
requires a 4.85 percent contribution of their salary, or a 6.83 percent contribution for physically
taxing positions.
Under the Tier 6 Basic Plan, employees who joined NYCERS between April 1, 2012 and March 31,
2013 are required to contribute 3 percent of gross wages. On April 1, 2013 a new contribution
structure took effect which ranges from 3 percent to 6 percent dependent upon annual wages earned
during the “plan year”. The Authority’s contributions for the years ended December 31, 2016 and
2015 were $174,206,763 and $159,265,987 respectively. The Authority’s contractually required
contributions for the years ended December 31, 2016 and 2015 as a percentage of covered payroll
were 22.86% and 20.17%, respectively.
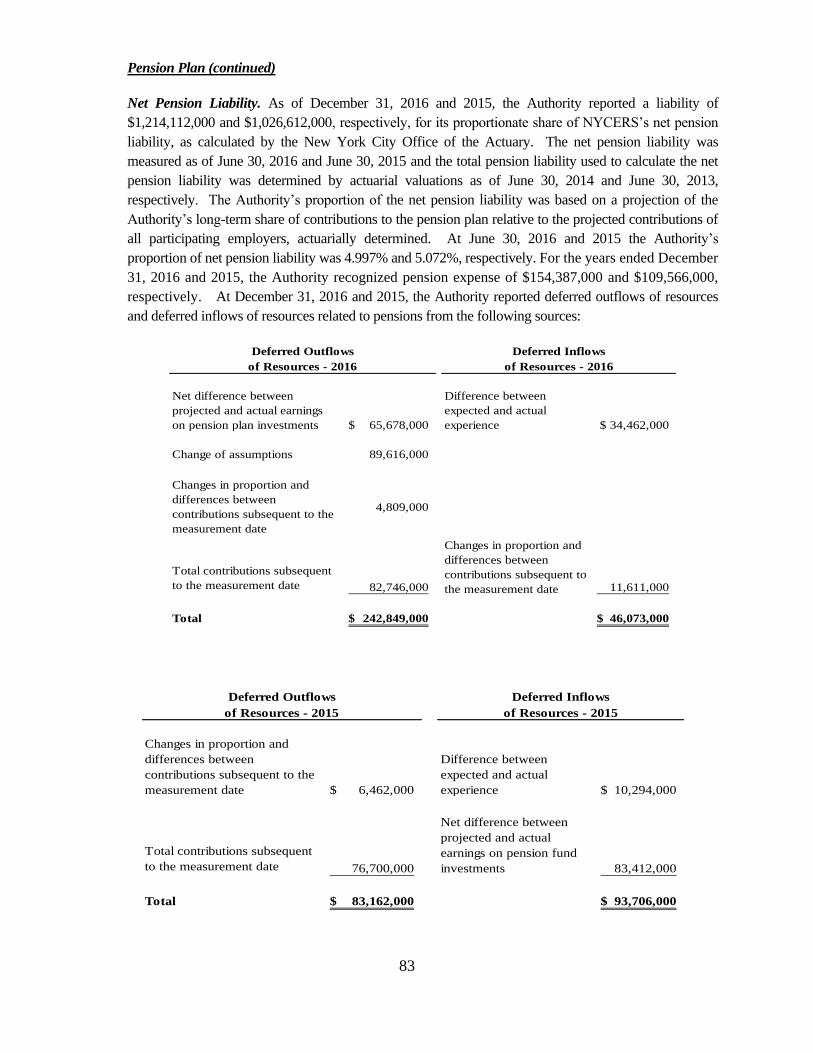
83
Pension Plan (continued)
Net Pension Liability. As of December 31, 2016 and 2015, the Authority reported a liability of
$1,214,112,000 and $1,026,612,000, respectively, for its proportionate share of NYCERS’s net pension
liability, as calculated by the New York City Office of the Actuary. The net pension liability was
measured as of June 30, 2016 and June 30, 2015 and the total pension liability used to calculate the net
pension liability was determined by actuarial valuations as of June 30, 2014 and June 30, 2013,
respectively. The Authority’s proportion of the net pension liability was based on a projection of the
Authority’s long-term share of contributions to the pension plan relative to the projected contributions of
all participating employers, actuarially determined. At June 30, 2016 and 2015 the Authority’s
proportion of net pension liability was 4.997% and 5.072%, respectively. For the years ended December
31, 2016 and 2015, the Authority recognized pension expense of $154,387,000 and $109,566,000,
respectively. At December 31, 2016 and 2015, the Authority reported deferred outflows of resources
and deferred inflows of resources related to pensions from the following sources:
Net difference between
projected and actual earnings
on pension plan investments 65,678,000$
Difference between
expected and actual
experience 34,462,000$
Change of assumptions 89,616,000
Changes in proportion and
differences between
contributions subsequent to the
measurement date
4,809,000
Total contributions subsequent
to the measurement date 82,746,000
Changes in proportion and
differences between
contributions subsequent to
the measurement date 11,611,000
Total 242,849,000$ 46,073,000$
Deferred Outflows
of Resources - 2016
Deferred Inflows
of Resources - 2016
Changes in proportion and
differences between
contributions subsequent to the
measurement date 6,462,000$
Difference between
expected and actual
experience 10,294,000$
Total contributions subsequent
to the measurement date 76,700,000
Net difference between
projected and actual
earnings on pension fund
investments 83,412,000
Total 83,162,000$ 93,706,000$
Deferred Outflows
of Resources - 2015
Deferred Inflows
of Resources - 2015
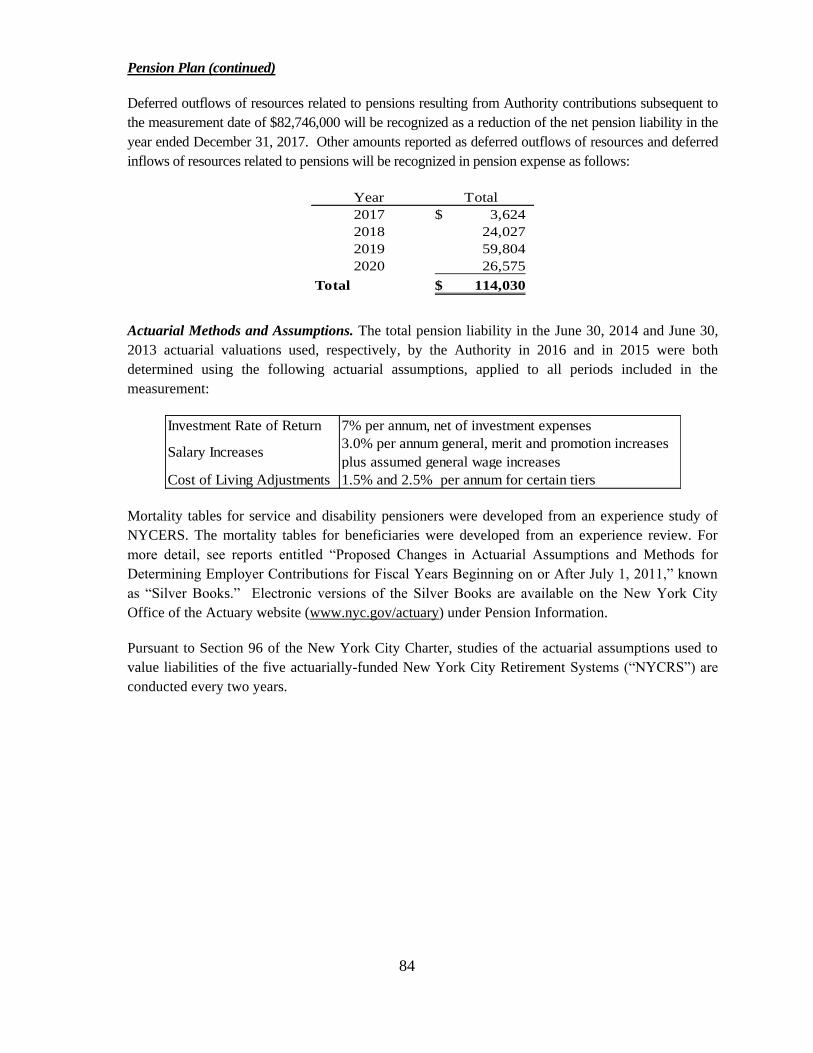
84
Pension Plan (continued)
Deferred outflows of resources related to pensions resulting from Authority contributions subsequent to
the measurement date of $82,746,000 will be recognized as a reduction of the net pension liability in the
year ended December 31, 2017. Other amounts reported as deferred outflows of resources and deferred
inflows of resources related to pensions will be recognized in pension expense as follows:
Year Total
2017 3,624$
2018 24,027
2019 59,804
2020 26,575
Total 114,030$
Actuarial Methods and Assumptions. The total pension liability in the June 30, 2014 and June 30,
2013 actuarial valuations used, respectively, by the Authority in 2016 and in 2015 were both
determined using the following actuarial assumptions, applied to all periods included in the
measurement:
Investment Rate of Return 7% per annum, net of investment expenses
Salary Increases3.0% per annum general, merit and promotion increases
plus assumed general wage increases
Cost of Living Adjustments 1.5% and 2.5% per annum for certain tiers
Mortality tables for service and disability pensioners were developed from an experience study of
NYCERS. The mortality tables for beneficiaries were developed from an experience review. For
more detail, see reports entitled “Proposed Changes in Actuarial Assumptions and Methods for
Determining Employer Contributions for Fiscal Years Beginning on or After July 1, 2011,” known
as “Silver Books.” Electronic versions of the Silver Books are available on the New York City
Office of the Actuary website (www.nyc.gov/actuary) under Pension Information.
Pursuant to Section 96 of the New York City Charter, studies of the actuarial assumptions used to
value liabilities of the five actuarially-funded New York City Retirement Systems (“NYCRS”) are
conducted every two years.
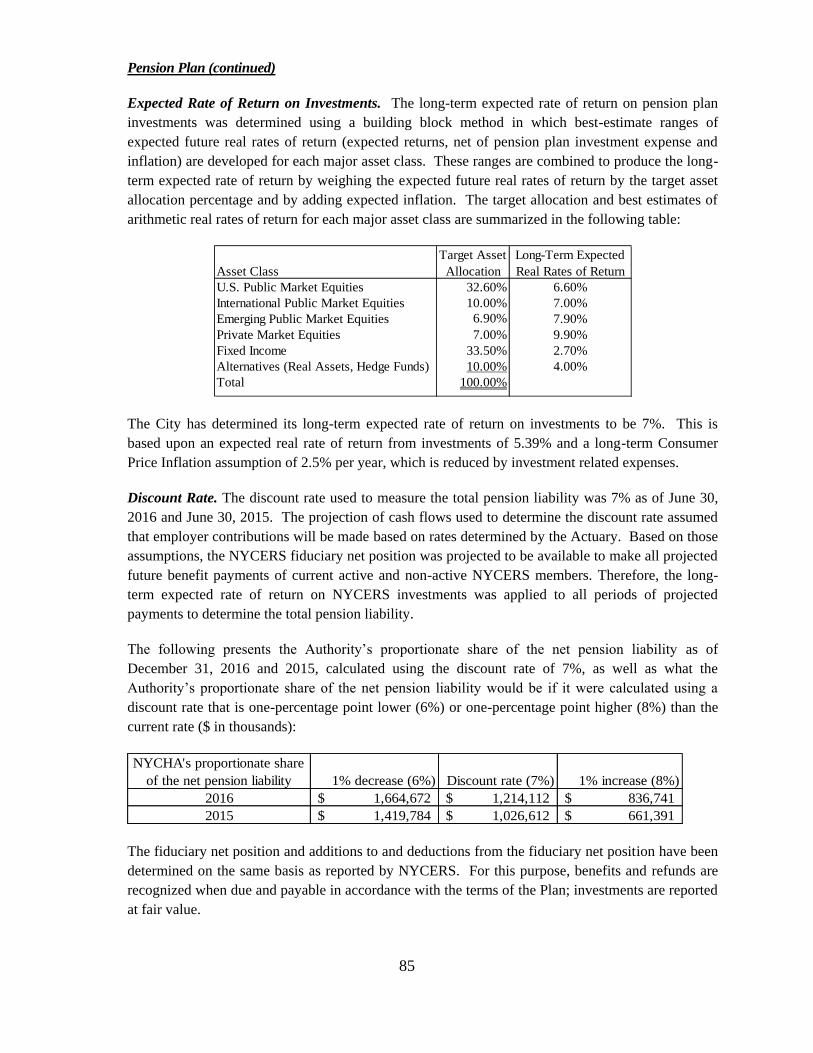
85
Pension Plan (continued)
Expected Rate of Return on Investments. The long-term expected rate of return on pension plan
investments was determined using a building block method in which best-estimate ranges of
expected future real rates of return (expected returns, net of pension plan investment expense and
inflation) are developed for each major asset class. These ranges are combined to produce the long-
term expected rate of return by weighing the expected future real rates of return by the target asset
allocation percentage and by adding expected inflation. The target allocation and best estimates of
arithmetic real rates of return for each major asset class are summarized in the following table:
Asset Class
Target Asset
Allocation
Long-Term Expected
Real Rates of Return
U.S. Public Market Equities 32.60% 6.60%
International Public Market Equities 10.00% 7.00%
Emerging Public Market Equities 6.90% 7.90%
Private Market Equities 7.00% 9.90%
Fixed Income 33.50% 2.70%
Alternatives (Real Assets, Hedge Funds) 10.00% 4.00%
Total 100.00%
The City has determined its long-term expected rate of return on investments to be 7%. This is
based upon an expected real rate of return from investments of 5.39% and a long-term Consumer
Price Inflation assumption of 2.5% per year, which is reduced by investment related expenses.
Discount Rate. The discount rate used to measure the total pension liability was 7% as of June 30,
2016 and June 30, 2015. The projection of cash flows used to determine the discount rate assumed
that employer contributions will be made based on rates determined by the Actuary. Based on those
assumptions, the NYCERS fiduciary net position was projected to be available to make all projected
future benefit payments of current active and non-active NYCERS members. Therefore, the long-
term expected rate of return on NYCERS investments was applied to all periods of projected
payments to determine the total pension liability.
The following presents the Authority’s proportionate share of the net pension liability as of
December 31, 2016 and 2015, calculated using the discount rate of 7%, as well as what the
Authority’s proportionate share of the net pension liability would be if it were calculated using a
discount rate that is one-percentage point lower (6%) or one-percentage point higher (8%) than the
current rate ($ in thousands):
NYCHA's proportionate share
of the net pension liability 1% decrease (6%) Discount rate (7%) 1% increase (8%)
2016 1,664,672$ 1,214,112$ 836,741$
2015 1,419,784$ 1,026,612$ 661,391$
The fiduciary net position and additions to and deductions from the fiduciary net position have been
determined on the same basis as reported by NYCERS. For this purpose, benefits and refunds are
recognized when due and payable in accordance with the terms of the Plan; investments are reported
at fair value.
86
Other Postemployment Benefits
The Authority follows the provisions of GASB Statement No. 45 (“GASB 45”) Accounting and
Financial Reporting by Employers for Postemployment Benefits Other Than Pensions. The
Statement established standards for the measurement, recognition, and display of OPEB
costs/contributions and related liabilities (assets), note disclosures, and, if applicable, required
supplementary information in the financial reports of state and local governmental employers (see
Note 1).
Plan Description. The Authority is a component unit of The City and a member of the New York
City Health Benefits Program. The New York City Health Benefits Program (the “Plan”) is a
single-employer defined benefit healthcare plan which provides OPEB to eligible retirees and
beneficiaries. OPEB includes health insurance, Medicare Part B reimbursements, and welfare fund
contributions.
Funding Policy. The Administrative Code of The City of New York (“ACNY”) defines OPEB to
include Health Insurance and Medicare Part B reimbursements; Welfare Benefits stem from the
Authority’s many collective bargaining agreements. The Authority is not required by law or
contractual agreement to provide funding for OPEB other than the pay-as-you go amount necessary
to provide current benefits to retirees and eligible beneficiaries/dependents. For the calendar years
ended December 31, 2016 and 2015, the Authority paid $74.7 million and $80.6 million,
respectively, to the Plan. Based on current practice, (the Substantive Plan which is derived from
ACNY), the Authority pays the full cost of basic coverage for non-Medicare-eligible/Medicare-
eligible retiree participants. The costs of these benchmark plans are reflected in the annual June 30th
actuarial valuations by using age-adjusted premium amounts. Plan retiree participants who opt for
other basic or enhanced coverage must contribute 100% of the incremental costs above the
premiums for the benchmark plans. The Authority also reimburses covered employees 100% of the
Medicare Part B premium rate applicable to a given year. The Authority pays per capita
contributions to the welfare funds the amounts of which are based on negotiated contract provisions.
There is no retiree contribution to the welfare funds.
Annual OPEB Cost and Net OPEB Obligation. The Authority’s annual OPEB cost is calculated
based on the annual required contribution of the employer, an amount that was actuarially
determined by using the Entry Age Actuarial Cost Method. Under this method, the actuarial present
value of the projected benefits of each individual is allocated on a level basis over the earnings of
each individual from hire through age of exit. This method is unchanged from the actuarial cost
method used in the prior OPEB actuarial valuation.
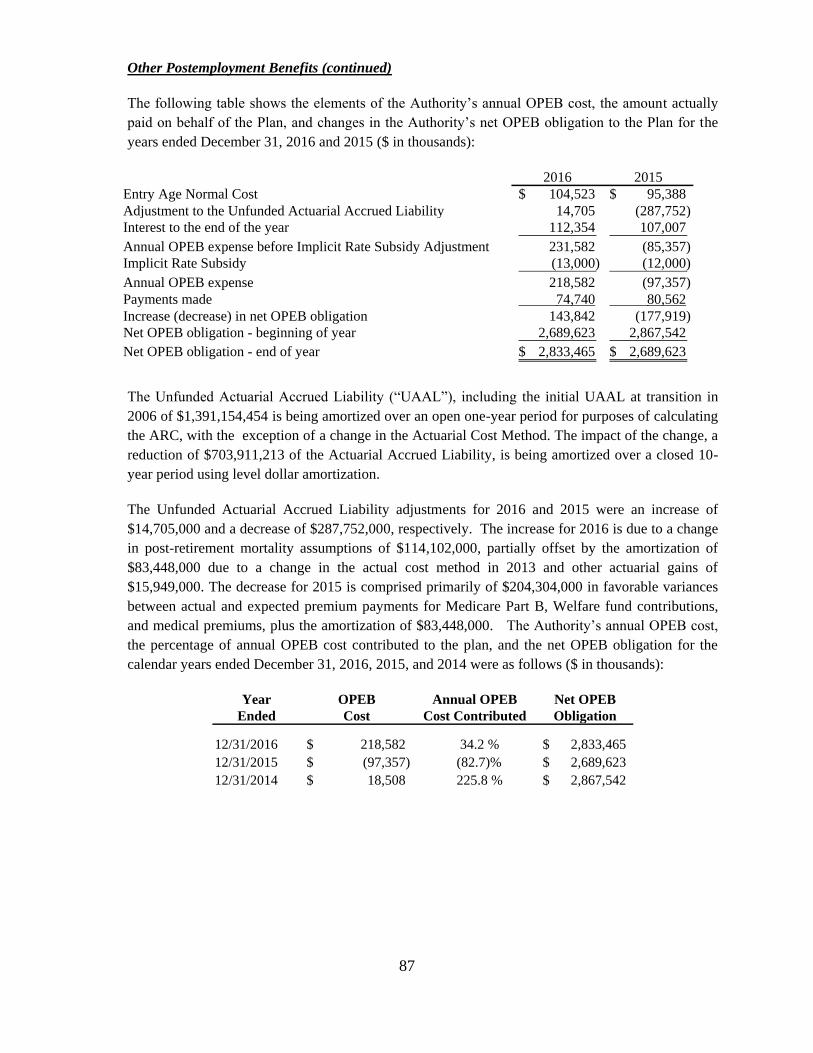
87
Other Postemployment Benefits (continued)
The following table shows the elements of the Authority’s annual OPEB cost, the amount actually
paid on behalf of the Plan, and changes in the Authority’s net OPEB obligation to the Plan for the
years ended December 31, 2016 and 2015 ($ in thousands):
2016 2015
Entry Age Normal Cost 104,523$ 95,388$
Adjustment to the Unfunded Actuarial Accrued Liability 14,705 (287,752)
Interest to the end of the year 112,354 107,007
Annual OPEB expense before Implicit Rate Subsidy Adjustment 231,582 (85,357)
Implicit Rate Subsidy (13,000) (12,000)
Annual OPEB expense 218,582 (97,357)
Payments made 74,740 80,562
Increase (decrease) in net OPEB obligation 143,842 (177,919)
Net OPEB obligation - beginning of year 2,689,623 2,867,542
Net OPEB obligation - end of year 2,833,465$ 2,689,623$
The Unfunded Actuarial Accrued Liability (“UAAL”), including the initial UAAL at transition in
2006 of $1,391,154,454 is being amortized over an open one-year period for purposes of calculating
the ARC, with the exception of a change in the Actuarial Cost Method. The impact of the change, a
reduction of $703,911,213 of the Actuarial Accrued Liability, is being amortized over a closed 10-
year period using level dollar amortization.
The Unfunded Actuarial Accrued Liability adjustments for 2016 and 2015 were an increase of
$14,705,000 and a decrease of $287,752,000, respectively. The increase for 2016 is due to a change
in post-retirement mortality assumptions of $114,102,000, partially offset by the amortization of
$83,448,000 due to a change in the actual cost method in 2013 and other actuarial gains of
$15,949,000. The decrease for 2015 is comprised primarily of $204,304,000 in favorable variances
between actual and expected premium payments for Medicare Part B, Welfare fund contributions,
and medical premiums, plus the amortization of $83,448,000. The Authority’s annual OPEB cost,
the percentage of annual OPEB cost contributed to the plan, and the net OPEB obligation for the
calendar years ended December 31, 2016, 2015, and 2014 were as follows ($ in thousands):
Year OPEB Annual OPEB Net OPEB
Ended Cost Cost Contributed Obligation
12/31/2016 218,582$ 34.2 % 2,833,465$
12/31/2015 (97,357)$ (82.7)% 2,689,623$
12/31/2014 18,508$ 225.8 % 2,867,542$
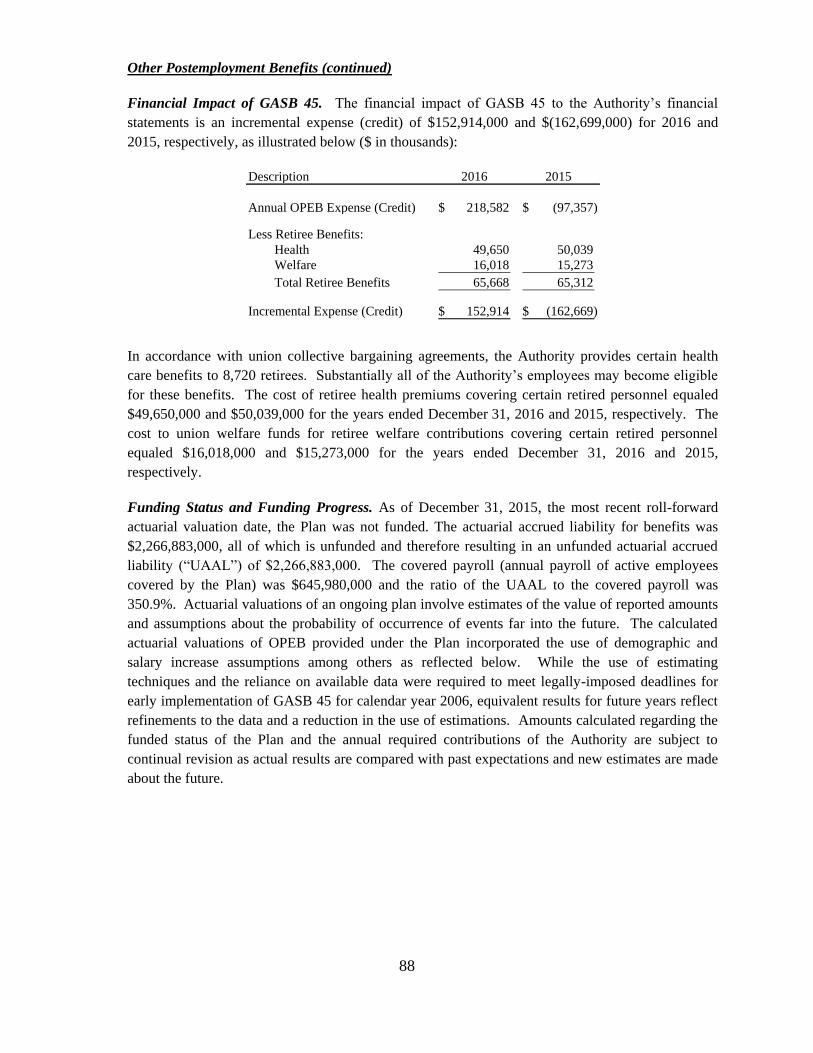
88
Other Postemployment Benefits (continued)
Financial Impact of GASB 45. The financial impact of GASB 45 to the Authority’s financial
statements is an incremental expense (credit) of $152,914,000 and $(162,699,000) for 2016 and
2015, respectively, as illustrated below ($ in thousands):
Description 2016 2015
Annual OPEB Expense (Credit) 218,582$ (97,357)$
Less Retiree Benefits:
Health 49,650 50,039
Welfare 16,018 15,273
Total Retiree Benefits 65,668 65,312
Incremental Expense (Credit) 152,914$ (162,669)$
In accordance with union collective bargaining agreements, the Authority provides certain health
care benefits to 8,720 retirees. Substantially all of the Authority’s employees may become eligible
for these benefits. The cost of retiree health premiums covering certain retired personnel equaled
$49,650,000 and $50,039,000 for the years ended December 31, 2016 and 2015, respectively. The
cost to union welfare funds for retiree welfare contributions covering certain retired personnel
equaled $16,018,000 and $15,273,000 for the years ended December 31, 2016 and 2015,
respectively.
Funding Status and Funding Progress. As of December 31, 2015, the most recent roll-forward
actuarial valuation date, the Plan was not funded. The actuarial accrued liability for benefits was
$2,266,883,000, all of which is unfunded and therefore resulting in an unfunded actuarial accrued
liability (“UAAL”) of $2,266,883,000. The covered payroll (annual payroll of active employees
covered by the Plan) was $645,980,000 and the ratio of the UAAL to the covered payroll was
350.9%. Actuarial valuations of an ongoing plan involve estimates of the value of reported amounts
and assumptions about the probability of occurrence of events far into the future. The calculated
actuarial valuations of OPEB provided under the Plan incorporated the use of demographic and
salary increase assumptions among others as reflected below. While the use of estimating
techniques and the reliance on available data were required to meet legally-imposed deadlines for
early implementation of GASB 45 for calendar year 2006, equivalent results for future years reflect
refinements to the data and a reduction in the use of estimations. Amounts calculated regarding the
funded status of the Plan and the annual required contributions of the Authority are subject to
continual revision as actual results are compared with past expectations and new estimates are made
about the future.
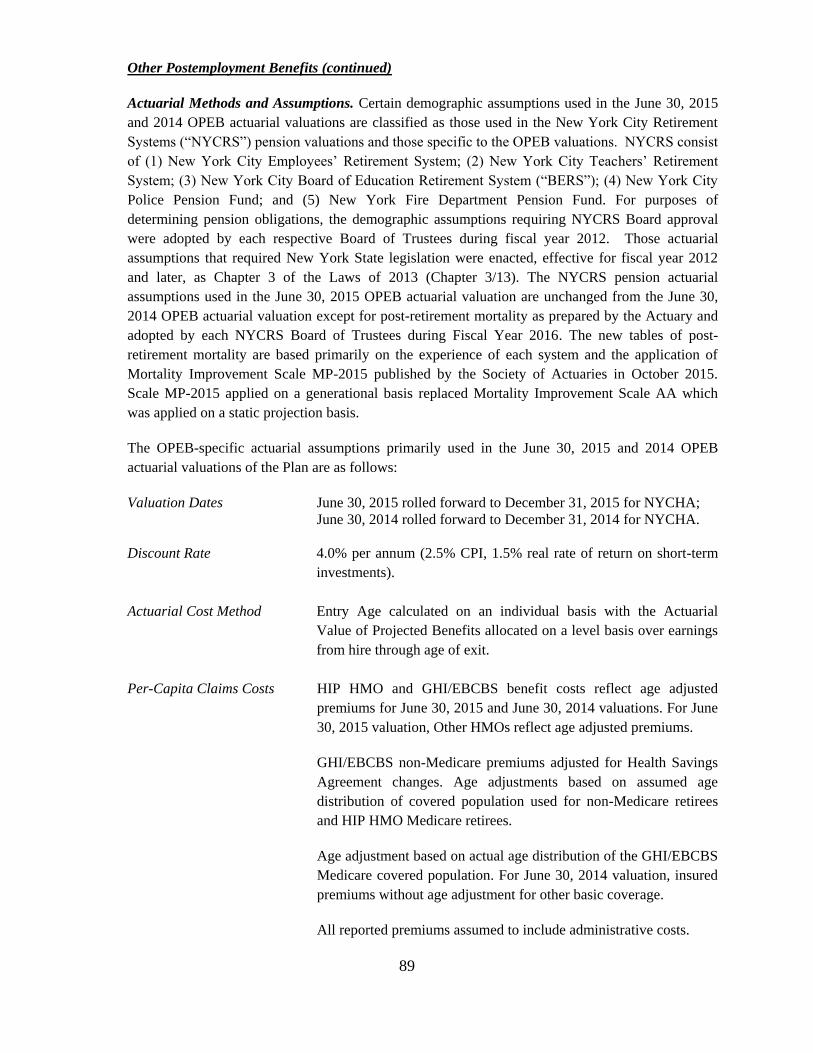
89
Other Postemployment Benefits (continued)
Actuarial Methods and Assumptions. Certain demographic assumptions used in the June 30, 2015
and 2014 OPEB actuarial valuations are classified as those used in the New York City Retirement
Systems (“NYCRS”) pension valuations and those specific to the OPEB valuations. NYCRS consist
of (1) New York City Employees’ Retirement System; (2) New York City Teachers’ Retirement
System; (3) New York City Board of Education Retirement System (“BERS”); (4) New York City
Police Pension Fund; and (5) New York Fire Department Pension Fund. For purposes of
determining pension obligations, the demographic assumptions requiring NYCRS Board approval
were adopted by each respective Board of Trustees during fiscal year 2012. Those actuarial
assumptions that required New York State legislation were enacted, effective for fiscal year 2012
and later, as Chapter 3 of the Laws of 2013 (Chapter 3/13). The NYCRS pension actuarial
assumptions used in the June 30, 2015 OPEB actuarial valuation are unchanged from the June 30,
2014 OPEB actuarial valuation except for post-retirement mortality as prepared by the Actuary and
adopted by each NYCRS Board of Trustees during Fiscal Year 2016. The new tables of post-
retirement mortality are based primarily on the experience of each system and the application of
Mortality Improvement Scale MP-2015 published by the Society of Actuaries in October 2015.
Scale MP-2015 applied on a generational basis replaced Mortality Improvement Scale AA which
was applied on a static projection basis.
The OPEB-specific actuarial assumptions primarily used in the June 30, 2015 and 2014 OPEB
actuarial valuations of the Plan are as follows:
Valuation Dates June 30, 2015 rolled forward to December 31, 2015 for NYCHA;
June 30, 2014 rolled forward to December 31, 2014 for NYCHA.
Discount Rate 4.0% per annum (2.5% CPI, 1.5% real rate of return on short-term
investments).
Actuarial Cost Method Entry Age calculated on an individual basis with the Actuarial
Value of Projected Benefits allocated on a level basis over earnings
from hire through age of exit.
Per-Capita Claims Costs HIP HMO and GHI/EBCBS benefit costs reflect age adjusted
premiums for June 30, 2015 and June 30, 2014 valuations. For June
30, 2015 valuation, Other HMOs reflect age adjusted premiums.
GHI/EBCBS non-Medicare premiums adjusted for Health Savings
Agreement changes. Age adjustments based on assumed age
distribution of covered population used for non-Medicare retirees
and HIP HMO Medicare retirees.
Age adjustment based on actual age distribution of the GHI/EBCBS
Medicare covered population. For June 30, 2014 valuation, insured
premiums without age adjustment for other basic coverage.
All reported premiums assumed to include administrative costs.
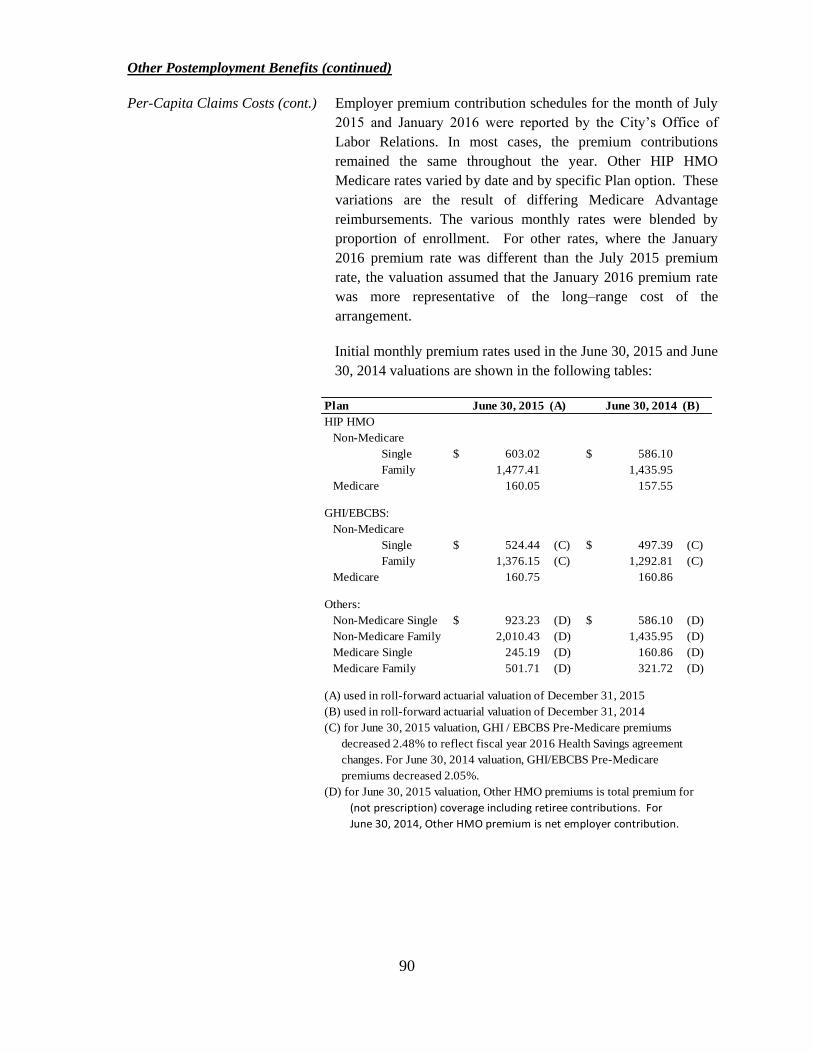
90
Other Postemployment Benefits (continued)
Per-Capita Claims Costs (cont.) Employer premium contribution schedules for the month of July
2015 and January 2016 were reported by the City’s Office of
Labor Relations. In most cases, the premium contributions
remained the same throughout the year. Other HIP HMO
Medicare rates varied by date and by specific Plan option. These
variations are the result of differing Medicare Advantage
reimbursements. The various monthly rates were blended by
proportion of enrollment. For other rates, where the January
2016 premium rate was different than the July 2015 premium
rate, the valuation assumed that the January 2016 premium rate
was more representative of the long–range cost of the
arrangement.
Initial monthly premium rates used in the June 30, 2015 and June
30, 2014 valuations are shown in the following tables:
Plan June 30, 2015 (A) June 30, 2014 (B)
HIP HMO
Non-Medicare
Single 603.02$ 586.10$
Family 1,477.41 1,435.95
Medicare 160.05 157.55
GHI/EBCBS:
Non-Medicare
Single 524.44$ (C) 497.39$ (C)
Family 1,376.15 (C) 1,292.81 (C)
Medicare 160.75 160.86
Others:
Non-Medicare Single 923.23$ (D) 586.10$ (D)
Non-Medicare Family 2,010.43 (D) 1,435.95 (D)
Medicare Single 245.19 (D) 160.86 (D)
Medicare Family 501.71 (D) 321.72 (D)
(A) used in roll-forward actuarial valuation of December 31, 2015
(B) used in roll-forward actuarial valuation of December 31, 2014
(C) for June 30, 2015 valuation, GHI / EBCBS Pre-Medicare premiums
decreased 2.48% to reflect fiscal year 2016 Health Savings agreement
changes. For June 30, 2014 valuation, GHI/EBCBS Pre-Medicare
premiums decreased 2.05%.
(D) for June 30, 2015 valuation, Other HMO premiums is total premium for
(not prescription) coverage including retiree contributions. For
June 30, 2014, Other HMO premium is net employer contribution.
91
Other Postemployment Benefits (continued)
Welfare Funds For the June 30, 2015 and June 30, 2014 valuation, the Welfare
Fund contribution reported for Fiscal Year 2016 (including any
reported retroactive amounts) was used as the per capita cost for
valuation purposes. The amount used included the $25 increase
effective July 1, 2015 under the 2014 MLC-NYC Health Savings
Agreement, $100 for Fiscal Year 2016 under further negotiations
(reflected in the June 30, 2015 valuation) as well as further $25
annual increases effective July 1, 2016 and July 1, 2017. It is
assumed that all Welfare Funds will ultimately be subject to those
agreements, whether or not the union running the particular Welfare
Fund has currently signed.
Reported annual contribution amounts for the last three years are
shown in Appendix B, Tables 2a to 2e of the Eleventh Annual
Actuarial Valuation of Other Postemployment Benefits Provided
under the New York City Health Benefits Program, dated
September 23, 2016. The amounts shown for Fiscal Year 2016 as of
June 30, 2015, increased by $25 as of July 1, 2015, plus an
additional $100, are used for current retirees. For current retirees in
the June 30, 2014 valuation, the valuation reflected the Fiscal Year
2015 values shown as of June 30, 2014 increased by $25 as of July
1, 2014.
Welfare Fund rates based on actual reported Union Welfare Fund
code for current retirees. Where Union Welfare Fund code was
missing, the most recently reported union code was reflected.
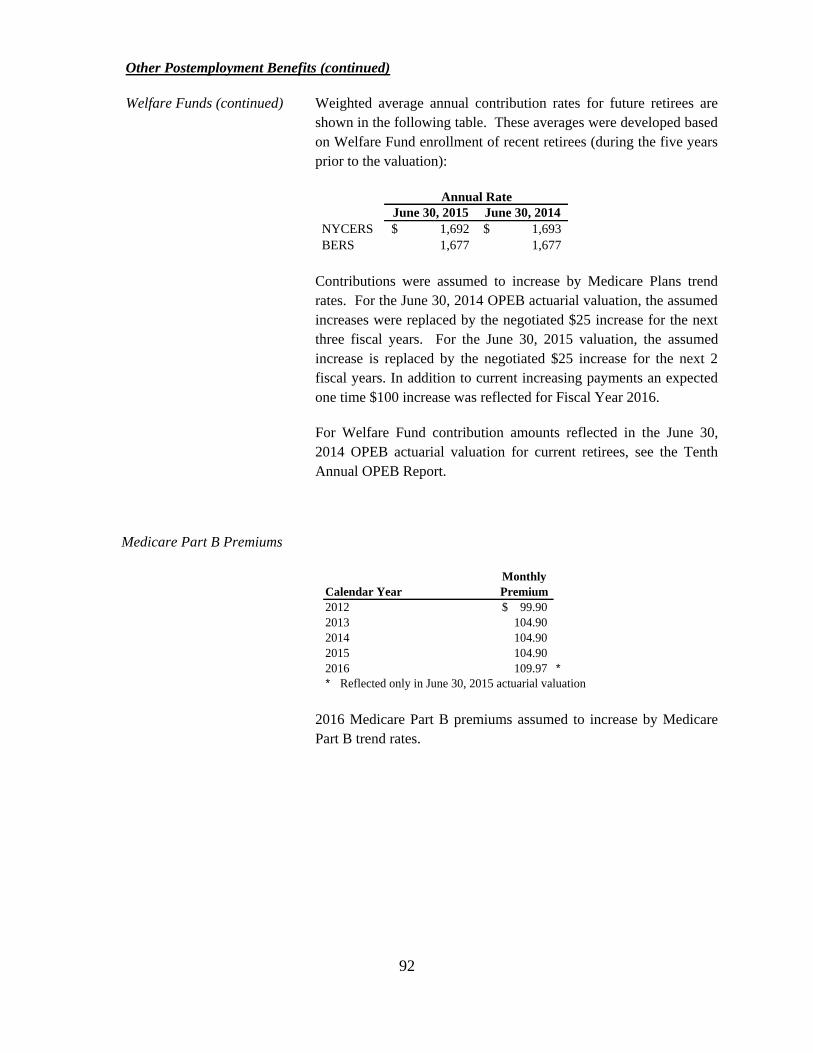
92
Other Postemployment Benefits (continued)
Welfare Funds (continued) Weighted average annual contribution rates for future retirees are
shown in the following table. These averages were developed based
on Welfare Fund enrollment of recent retirees (during the five years
prior to the valuation):
Annual Rate
June 30, 2015 June 30, 2014
NYCERS 1,692$ 1,693$
BERS 1,677 1,677
Contributions were assumed to increase by Medicare Plans trend
rates. For the June 30, 2014 OPEB actuarial valuation, the assumed
increases were replaced by the negotiated $25 increase for the next
three fiscal years. For the June 30, 2015 valuation, the assumed
increase is replaced by the negotiated $25 increase for the next 2
fiscal years. In addition to current increasing payments an expected
one time $100 increase was reflected for Fiscal Year 2016.
For Welfare Fund contribution amounts reflected in the June 30,
2014 OPEB actuarial valuation for current retirees, see the Tenth
Annual OPEB Report.
Medicare Part B Premiums
Monthly
Calendar Year Premium
2012 99.90$
2013 104.90
2014 104.90
2015 104.90
2016 109.97 *
* Reflected only in June 30, 2015 actuarial valuation
2016 Medicare Part B premiums assumed to increase by Medicare
Part B trend rates.
93
Other Postemployment Benefits
Medicare Part B Prem. (cont.)
Medicare Part B Premium reimbursement amounts have been
updated to reflect actual premium rates announced for calendar
years through 2016, including changes adopted as of the Bipartisan
Budget Act of 2015. Due to there being no cost-of-living increase in
Social Security benefits for Calendar Year 2016, most Medicare
Part B participants will not be charged the Medicare Part B premium
original projected or ultimately announced for 2016. The initially
projected Medicare Part B premium was artificially increased so that
the overall amount collected by the Center for Medicare and
Medicaid Services (CMS) would be sufficient for the needs of the
Medicare Part B program. The Bipartisan Budget Act allowed for
certain borrowing of funds, but still resulted in a stated Part B
premium amount in excess of the amount sufficient for the Part B
Program if collected for all participants. These changes for
Calendar Year 2016 are reflected in the valuation. Thus, for the
June 30, 2015 OPEB actuarial valuation the annual premium used of
$1,289.22 equals six months of the Calendar Year 2015 premium
plus six months of:
70% of the Calendar Year 2015 monthly premium (i.e.
$104.90), representing the approximate percentage of the
overall U.S. Medicare population that will pay the frozen
amount, and
30% of the announced Calendar Year 2016 monthly
premium (i.e., $121.80), representing the approximate
percentage of the overall U.S. Medicare population that will
pay the Calendar Year 2016 amount.
Future Calendar Year Medicare Part B Premium rates are predicted
from the Calendar Year 2016 rate of $121.80 using the assumed
Medicare Part B Premium trend.
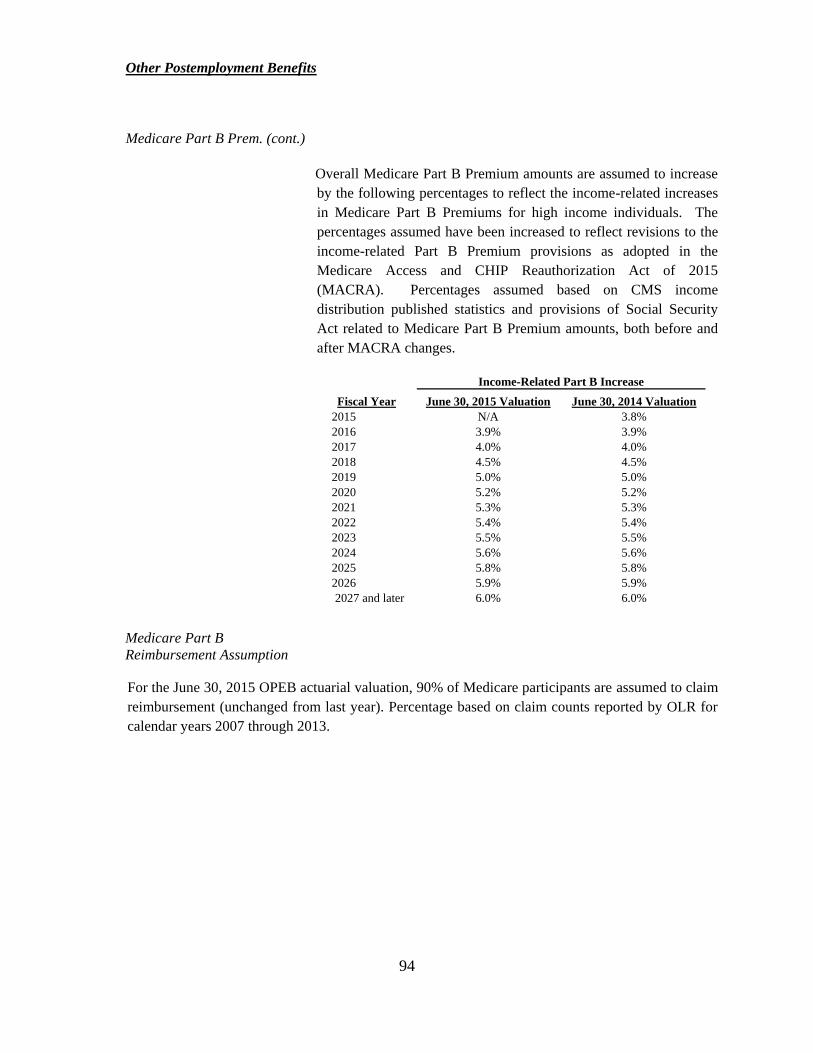
94
Other Postemployment Benefits
Medicare Part B Prem. (cont.)
Overall Medicare Part B Premium amounts are assumed to increase
by the following percentages to reflect the income-related increases
in Medicare Part B Premiums for high income individuals. The
percentages assumed have been increased to reflect revisions to the
income-related Part B Premium provisions as adopted in the
Medicare Access and CHIP Reauthorization Act of 2015
(MACRA). Percentages assumed based on CMS income
distribution published statistics and provisions of Social Security
Act related to Medicare Part B Premium amounts, both before and
after MACRA changes.
Income-Related Part B Increase
Fiscal Year June 30, 2015 Valuation June 30, 2014 Valuation
2015 N/A 3.8%
2016 3.9% 3.9%
2017 4.0% 4.0%
2018 4.5% 4.5%
2019 5.0% 5.0%
2020 5.2% 5.2%
2021 5.3% 5.3%
2022 5.4% 5.4%
2023 5.5% 5.5%
2024 5.6% 5.6%
2025 5.8% 5.8%
2026 5.9% 5.9%
2027 and later 6.0% 6.0%
Medicare Part B
Reimbursement Assumption
For the June 30, 2015 OPEB actuarial valuation, 90% of Medicare participants are assumed to claim
reimbursement (unchanged from last year). Percentage based on claim counts reported by OLR for
calendar years 2007 through 2013.
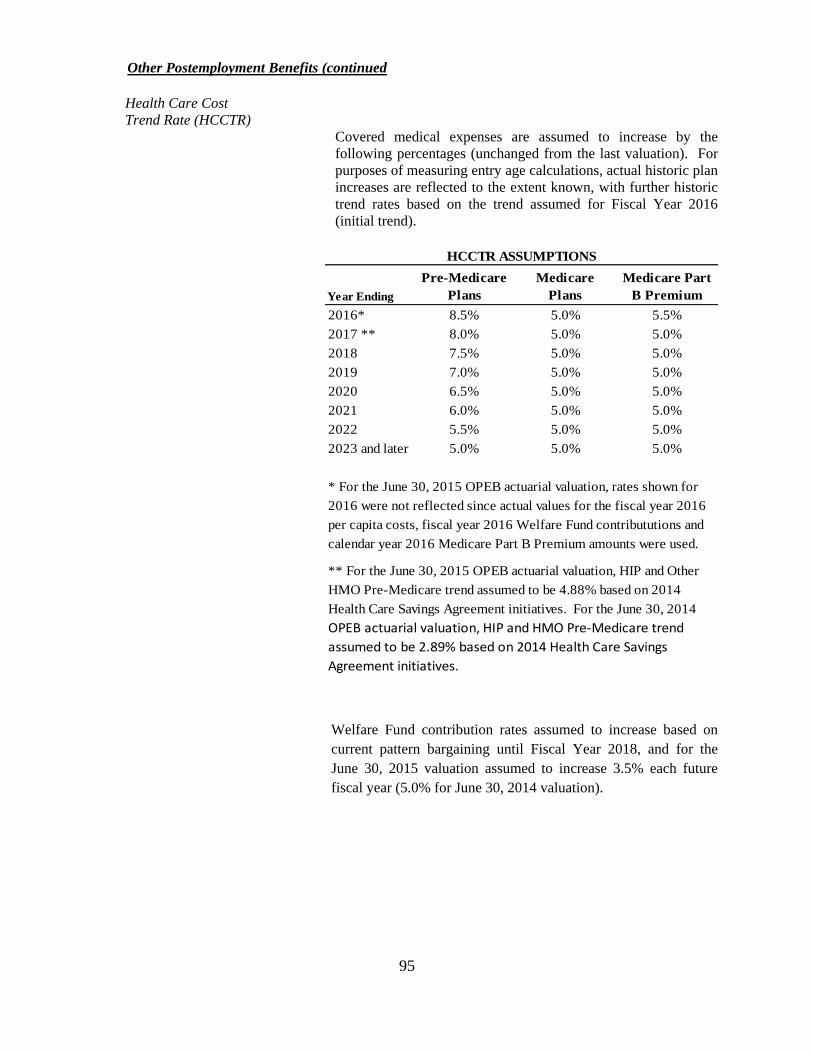
95
Other Postemployment Benefits (continued
Health Care Cost
Trend Rate (HCCTR)
Covered medical expenses are assumed to increase by the
following percentages (unchanged from the last valuation). For
purposes of measuring entry age calculations, actual historic plan
increases are reflected to the extent known, with further historic
trend rates based on the trend assumed for Fiscal Year 2016
(initial trend).
HCCTR ASSUMPTIONS
Year Ending
Pre-Medicare
Plans
Medicare
Plans
Medicare Part
B Premium
2016* 8.5% 5.0% 5.5%
2017 ** 8.0% 5.0% 5.0%
2018 7.5% 5.0% 5.0%
2019 7.0% 5.0% 5.0%
2020 6.5% 5.0% 5.0%
2021 6.0% 5.0% 5.0%
2022 5.5% 5.0% 5.0%
2023 and later 5.0% 5.0% 5.0%
* For the June 30, 2015 OPEB actuarial valuation, rates shown for
2016 were not reflected since actual values for the fiscal year 2016
per capita costs, fiscal year 2016 Welfare Fund contribututions and
calendar year 2016 Medicare Part B Premium amounts were used.
** For the June 30, 2015 OPEB actuarial valuation, HIP and Other
HMO Pre-Medicare trend assumed to be 4.88% based on 2014
Health Care Savings Agreement initiatives. For the June 30, 2014
OPEB actuarial valuation, HIP and HMO Pre-Medicare trend
assumed to be 2.89% based on 2014 Health Care Savings
Agreement initiatives.
Welfare Fund contribution rates assumed to increase based on
current pattern bargaining until Fiscal Year 2018, and for the
June 30, 2015 valuation assumed to increase 3.5% each future
fiscal year (5.0% for June 30, 2014 valuation).
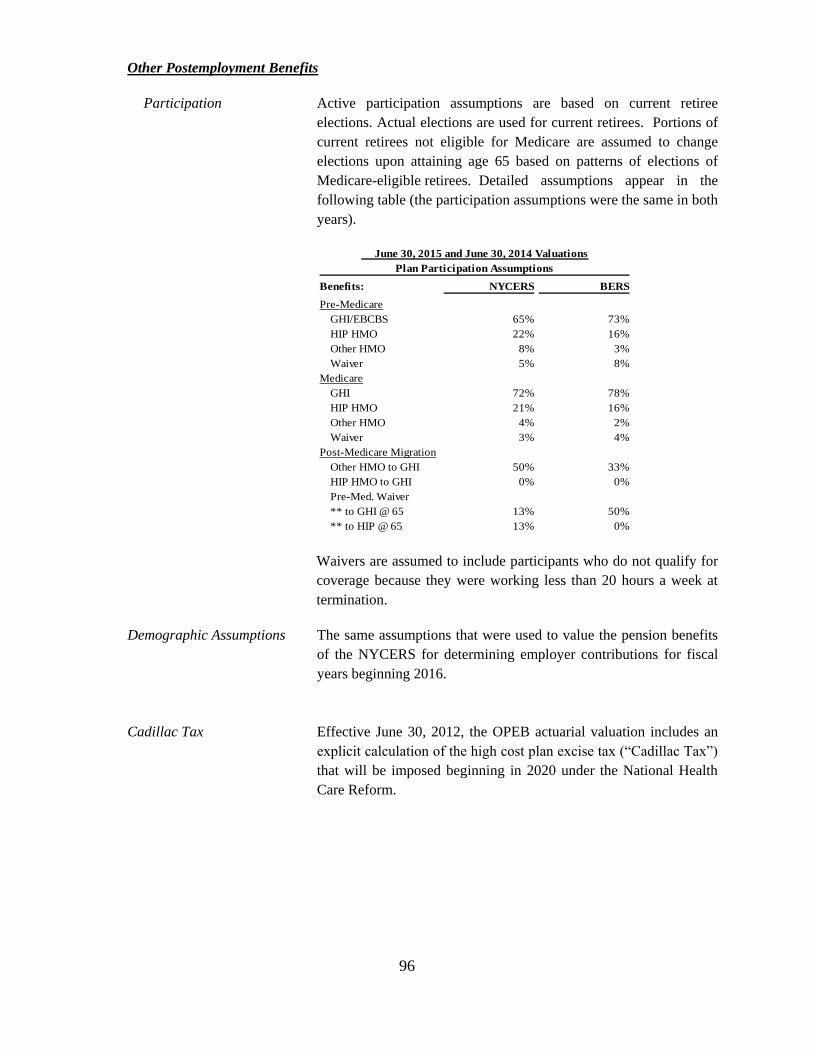
96
Other Postemployment Benefits
Participation Active participation assumptions are based on current retiree
elections. Actual elections are used for current retirees. Portions of
current retirees not eligible for Medicare are assumed to change
elections upon attaining age 65 based on patterns of elections of
Medicare-eligible retirees. Detailed assumptions appear in the
following table (the participation assumptions were the same in both
years).
June 30, 2015 and June 30, 2014 Valuations
Plan Participation Assumptions
Benefits: NYCERS BERS
Pre-Medicare
GHI/EBCBS 65% 73%
HIP HMO 22% 16%
Other HMO 8% 3%
Waiver 5% 8%
Medicare
GHI 72% 78%
HIP HMO 21% 16%
Other HMO 4% 2%
Waiver 3% 4%
Post-Medicare Migration
Other HMO to GHI 50% 33%
HIP HMO to GHI 0% 0%
Pre-Med. Waiver
** to GHI @ 65 13% 50%
** to HIP @ 65 13% 0%
Waivers are assumed to include participants who do not qualify for
coverage because they were working less than 20 hours a week at
termination.
Demographic Assumptions The same assumptions that were used to value the pension benefits
of the NYCERS for determining employer contributions for fiscal
years beginning 2016.
Cadillac Tax Effective June 30, 2012, the OPEB actuarial valuation includes an
explicit calculation of the high cost plan excise tax (“Cadillac Tax”)
that will be imposed beginning in 2020 under the National Health
Care Reform.
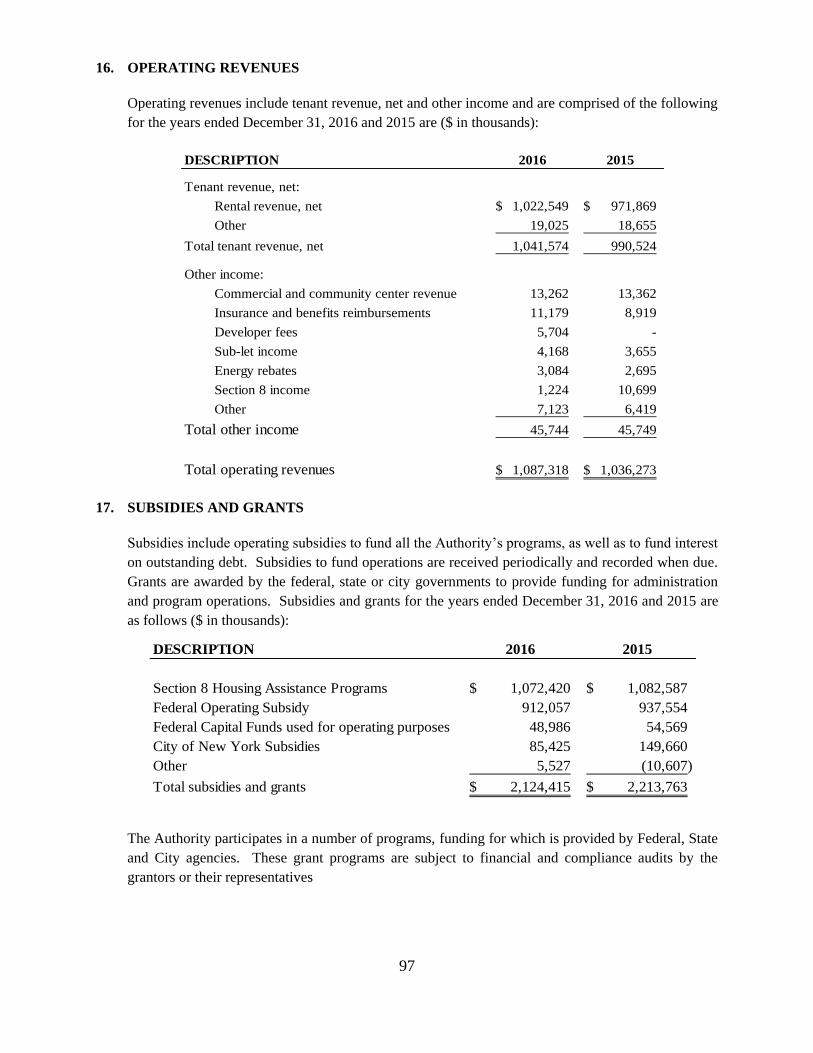
97
16. OPERATING REVENUES
Operating revenues include tenant revenue, net and other income and are comprised of the following
for the years ended December 31, 2016 and 2015 are ($ in thousands):
DESCRIPTION 2016 2015
Tenant revenue, net:
Rental revenue, net 1,022,549$ 971,869$
Other 19,025 18,655
Total tenant revenue, net 1,041,574 990,524
Other income:
Commercial and community center revenue 13,262 13,362
Insurance and benefits reimbursements 11,179 8,919
Developer fees 5,704 -
Sub-let income 4,168 3,655
Energy rebates 3,084 2,695
Section 8 income 1,224 10,699
Other 7,123 6,419
Total other income 45,744 45,749
Total operating revenues 1,087,318$ 1,036,273$
17. SUBSIDIES AND GRANTS
Subsidies include operating subsidies to fund all the Authority’s programs, as well as to fund interest
on outstanding debt. Subsidies to fund operations are received periodically and recorded when due.
Grants are awarded by the federal, state or city governments to provide funding for administration
and program operations. Subsidies and grants for the years ended December 31, 2016 and 2015 are
as follows ($ in thousands):
DESCRIPTION 2016 2015
Section 8 Housing Assistance Programs 1,072,420$ 1,082,587$
Federal Operating Subsidy 912,057 937,554
Federal Capital Funds used for operating purposes 48,986 54,569
City of New York Subsidies 85,425 149,660
Other 5,527 (10,607)
Total subsidies and grants 2,124,415$ 2,213,763$
The Authority participates in a number of programs, funding for which is provided by Federal, State
and City agencies. These grant programs are subject to financial and compliance audits by the
grantors or their representatives
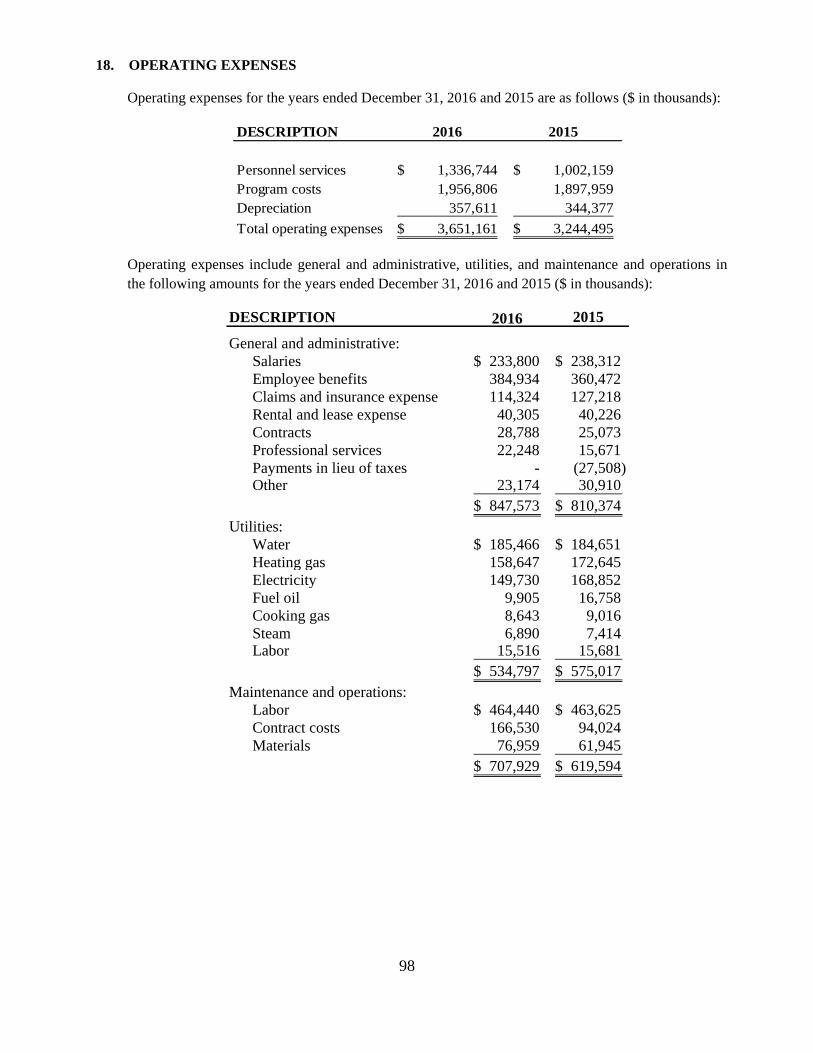
98
18. OPERATING EXPENSES
Operating expenses for the years ended December 31, 2016 and 2015 are as follows ($ in thousands):
DESCRIPTION 2016 2015
Personnel services 1,336,744$ 1,002,159$
Program costs 1,956,806 1,897,959
Depreciation 357,611 344,377
Total operating expenses 3,651,161$ 3,244,495$
Operating expenses include general and administrative, utilities, and maintenance and operations in
the following amounts for the years ended December 31, 2016 and 2015 ($ in thousands):
DESCRIPTION 2016 2015
General and administrative:
Salaries 233,800$ 238,312$
Employee benefits 384,934 360,472
Claims and insurance expense 114,324 127,218
Rental and lease expense 40,305 40,226
Contracts 28,788 25,073
Professional services 22,248 15,671
Payments in lieu of taxes - (27,508) Other 23,174 30,910
847,573$ 810,374$
Utilities:
Water 185,466$ 184,651$
Heating gas 158,647 172,645
Electricity 149,730 168,852
Fuel oil 9,905 16,758
Cooking gas 8,643 9,016
Steam 6,890 7,414 Labor 15,516 15,681
534,797$ 575,017$
Maintenance and operations:
Labor 464,440$ 463,625$
Contract costs 166,530 94,024
Materials 76,959 61,945
707,929$ 619,594$
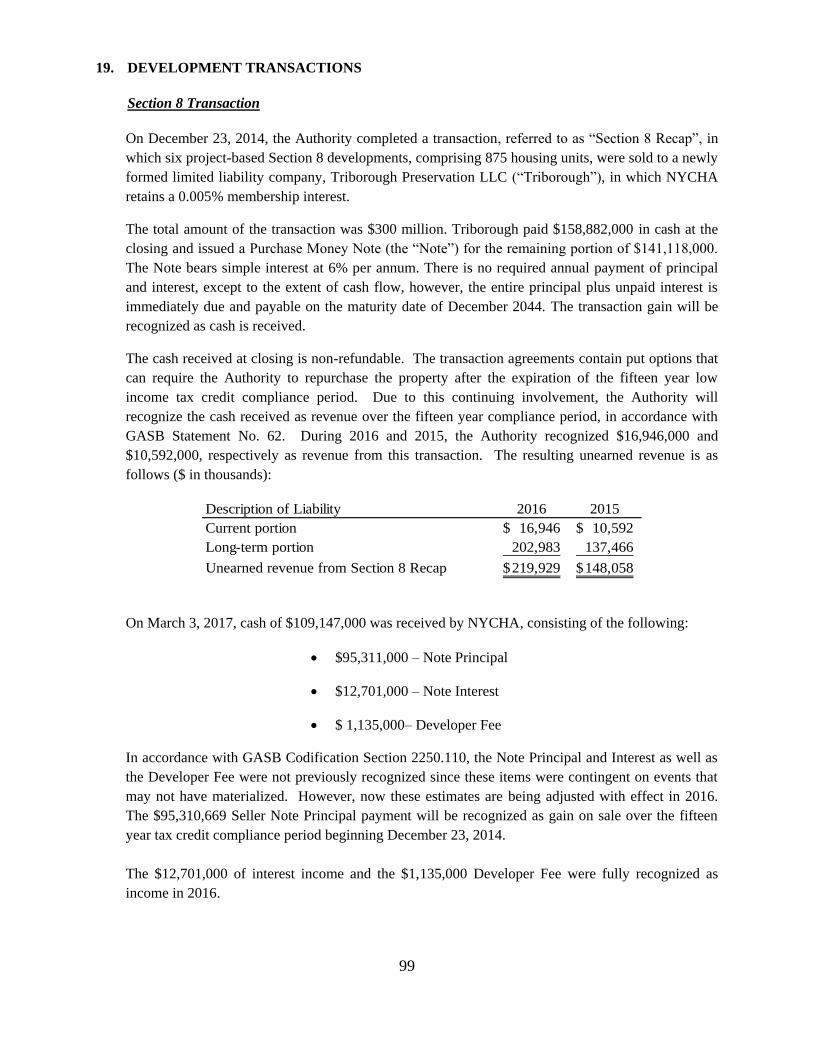
99
19. DEVELOPMENT TRANSACTIONS
Section 8 Transaction
On December 23, 2014, the Authority completed a transaction, referred to as “Section 8 Recap”, in
which six project-based Section 8 developments, comprising 875 housing units, were sold to a newly
formed limited liability company, Triborough Preservation LLC (“Triborough”), in which NYCHA
retains a 0.005% membership interest.
The total amount of the transaction was $300 million. Triborough paid $158,882,000 in cash at the
closing and issued a Purchase Money Note (the “Note”) for the remaining portion of $141,118,000.
The Note bears simple interest at 6% per annum. There is no required annual payment of principal
and interest, except to the extent of cash flow, however, the entire principal plus unpaid interest is
immediately due and payable on the maturity date of December 2044. The transaction gain will be
recognized as cash is received.
The cash received at closing is non-refundable. The transaction agreements contain put options that
can require the Authority to repurchase the property after the expiration of the fifteen year low
income tax credit compliance period. Due to this continuing involvement, the Authority will
recognize the cash received as revenue over the fifteen year compliance period, in accordance with
GASB Statement No. 62. During 2016 and 2015, the Authority recognized $16,946,000 and
$10,592,000, respectively as revenue from this transaction. The resulting unearned revenue is as
follows ($ in thousands):
Description of Liability 2016 2015
Current portion 16,946$ 10,592$
Long-term portion 202,983 137,466
Unearned revenue from Section 8 Recap 219,929$ 148,058$
On March 3, 2017, cash of $109,147,000 was received by NYCHA, consisting of the following:
$95,311,000 – Note Principal
$12,701,000 – Note Interest
$ 1,135,000– Developer Fee
In accordance with GASB Codification Section 2250.110, the Note Principal and Interest as well as
the Developer Fee were not previously recognized since these items were contingent on events that
may not have materialized. However, now these estimates are being adjusted with effect in 2016.
The $95,310,669 Seller Note Principal payment will be recognized as gain on sale over the fifteen
year tax credit compliance period beginning December 23, 2014.
The $12,701,000 of interest income and the $1,135,000 Developer Fee were fully recognized as
income in 2016.
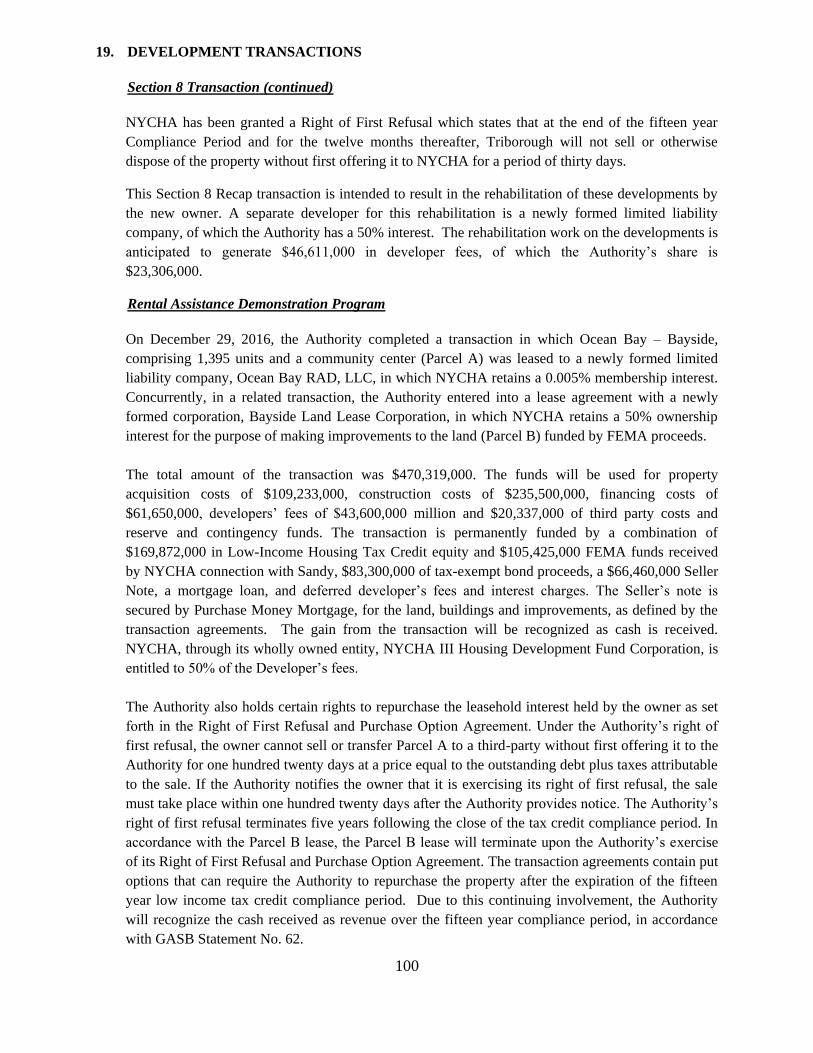
100
19. DEVELOPMENT TRANSACTIONS
Section 8 Transaction (continued)
NYCHA has been granted a Right of First Refusal which states that at the end of the fifteen year
Compliance Period and for the twelve months thereafter, Triborough will not sell or otherwise
dispose of the property without first offering it to NYCHA for a period of thirty days.
This Section 8 Recap transaction is intended to result in the rehabilitation of these developments by
the new owner. A separate developer for this rehabilitation is a newly formed limited liability
company, of which the Authority has a 50% interest. The rehabilitation work on the developments is
anticipated to generate $46,611,000 in developer fees, of which the Authority’s share is
$23,306,000.
Rental Assistance Demonstration Program
On December 29, 2016, the Authority completed a transaction in which Ocean Bay – Bayside,
comprising 1,395 units and a community center (Parcel A) was leased to a newly formed limited
liability company, Ocean Bay RAD, LLC, in which NYCHA retains a 0.005% membership interest.
Concurrently, in a related transaction, the Authority entered into a lease agreement with a newly
formed corporation, Bayside Land Lease Corporation, in which NYCHA retains a 50% ownership
interest for the purpose of making improvements to the land (Parcel B) funded by FEMA proceeds.
The total amount of the transaction was $470,319,000. The funds will be used for property
acquisition costs of $109,233,000, construction costs of $235,500,000, financing costs of
$61,650,000, developers’ fees of $43,600,000 million and $20,337,000 of third party costs and
reserve and contingency funds. The transaction is permanently funded by a combination of
$169,872,000 in Low-Income Housing Tax Credit equity and $105,425,000 FEMA funds received
by NYCHA connection with Sandy, $83,300,000 of tax-exempt bond proceeds, a $66,460,000 Seller
Note, a mortgage loan, and deferred developer’s fees and interest charges. The Seller’s note is
secured by Purchase Money Mortgage, for the land, buildings and improvements, as defined by the
transaction agreements. The gain from the transaction will be recognized as cash is received.
NYCHA, through its wholly owned entity, NYCHA III Housing Development Fund Corporation, is
entitled to 50% of the Developer’s fees.
The Authority also holds certain rights to repurchase the leasehold interest held by the owner as set
forth in the Right of First Refusal and Purchase Option Agreement. Under the Authority’s right of
first refusal, the owner cannot sell or transfer Parcel A to a third-party without first offering it to the
Authority for one hundred twenty days at a price equal to the outstanding debt plus taxes attributable
to the sale. If the Authority notifies the owner that it is exercising its right of first refusal, the sale
must take place within one hundred twenty days after the Authority provides notice. The Authority’s
right of first refusal terminates five years following the close of the tax credit compliance period. In
accordance with the Parcel B lease, the Parcel B lease will terminate upon the Authority’s exercise
of its Right of First Refusal and Purchase Option Agreement. The transaction agreements contain put
options that can require the Authority to repurchase the property after the expiration of the fifteen
year low income tax credit compliance period. Due to this continuing involvement, the Authority
will recognize the cash received as revenue over the fifteen year compliance period, in accordance
with GASB Statement No. 62.
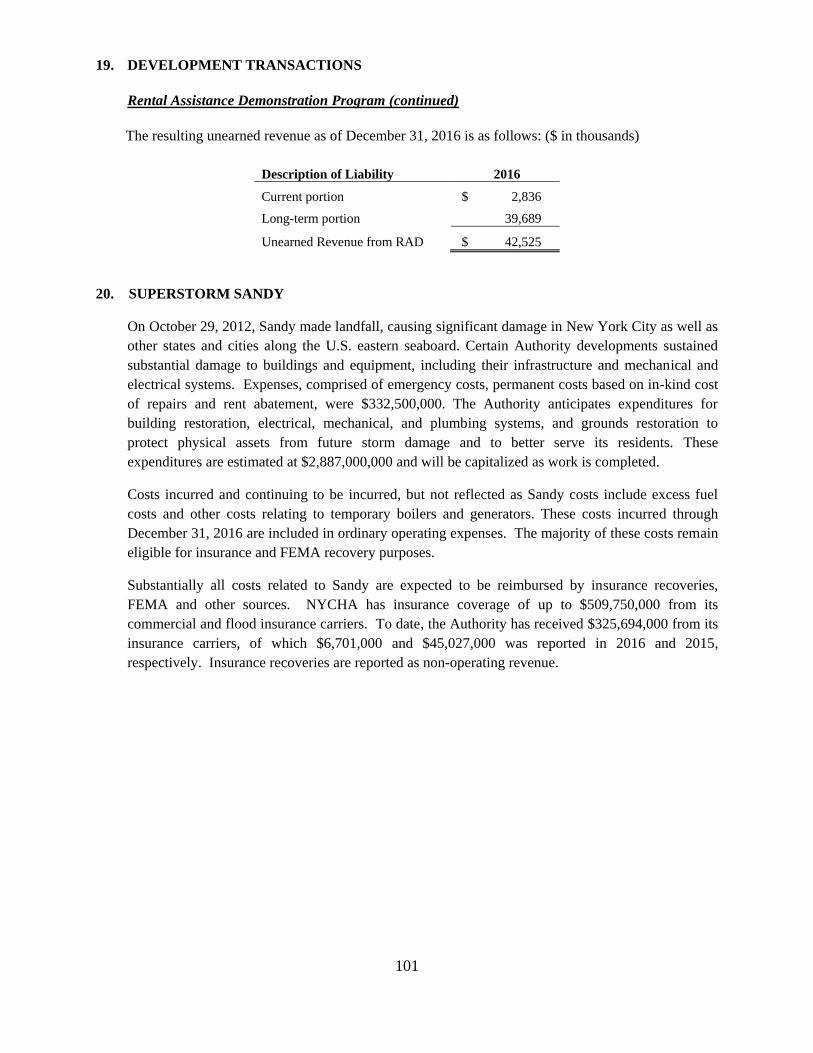
101
19. DEVELOPMENT TRANSACTIONS
Rental Assistance Demonstration Program (continued)
The resulting unearned revenue as of December 31, 2016 is as follows: ($ in thousands)
Description of Liability 2016
Current portion $ 2,836
Long-term portion 39,689
Unearned Revenue from RAD $ 42,525
20. SUPERSTORM SANDY
On October 29, 2012, Sandy made landfall, causing significant damage in New York City as well as
other states and cities along the U.S. eastern seaboard. Certain Authority developments sustained
substantial damage to buildings and equipment, including their infrastructure and mechanical and
electrical systems. Expenses, comprised of emergency costs, permanent costs based on in-kind cost
of repairs and rent abatement, were $332,500,000. The Authority anticipates expenditures for
building restoration, electrical, mechanical, and plumbing systems, and grounds restoration to
protect physical assets from future storm damage and to better serve its residents. These
expenditures are estimated at $2,887,000,000 and will be capitalized as work is completed.
Costs incurred and continuing to be incurred, but not reflected as Sandy costs include excess fuel
costs and other costs relating to temporary boilers and generators. These costs incurred through
December 31, 2016 are included in ordinary operating expenses. The majority of these costs remain
eligible for insurance and FEMA recovery purposes.
Substantially all costs related to Sandy are expected to be reimbursed by insurance recoveries,
FEMA and other sources. NYCHA has insurance coverage of up to $509,750,000 from its
commercial and flood insurance carriers. To date, the Authority has received $325,694,000 from its
insurance carriers, of which $6,701,000 and $45,027,000 was reported in 2016 and 2015,
respectively. Insurance recoveries are reported as non-operating revenue.
102
21. RELATED PARTY TRANSACTIONS
Mixed-Finance Transactions
On March 16, 2010, the Authority closed two mixed-finance transactions in which 21 NYCHA
developments, comprising 20,139 housing units, were sold to two newly-created, limited liability
companies. Thirteen developments, containing 14,465 dwelling units, were sold to NYCHA Public
Housing Preservation I, LLC, in which NYCHA I Housing Development Fund Corporation, a
component unit of NYCHA, is the sole managing member and has a 0.01% membership interest in
LLC I. LLC I is a Low Income Housing Tax Credit LLC. Eight developments, containing 5,674
dwelling units, were sold to NYCHA Public Housing Preservation II, in which NYCHA II Housing
Development Fund Corporation, a component unit of NYCHA, is the sole managing member and
has a 49.9% membership interest in LLC II.
The LLCs were created in connection with the mixed-finance transactions and are considered
blended component units for financial reporting purposes. The Authority served as developer and
continues to be the property manager for both LLCs.
The total acquisition price for the developments sold to LLC I was $590,250,000. At closing, LLC I
paid $53,733,000 in cash using a combination of mortgage proceeds of $32,809,000 and equity
contributions of $20,924,000 from the equity investor limited partner. NYCHA issued a Seller Note
to LLC I for the remaining portion of $536,517,000, with interest on the Note accruing at 2.69%. As
of December 31, 2016 there is an outstanding balance of $57,045,000, including interest of
$32,799,000 on the Seller Note, which has been reported as a Note receivable in the Condensed
Combining Information (see Note 24).
The total acquisition price for the developments sold to LLC II was $3,000,000, which was paid
entirely at the closing using the proceeds from a $3,000,000 mortgage.
The two mixed-finance transactions were structured and closed in a manner which allowed the
Authority to utilize financing opportunities available under the provisions of the American Recovery
and Reinvestment Act of 2009 (“ARRA”) in order to qualify for certain federal funding. At the time of
the closing, NYCHA qualified to receive an annual allocation of HUD federal operating and capital
funding for a portion of the dwelling units. Additional HUD federal operating subsidies for 2016 and
2015 were $61,720,000 and $62,938,000, respectively.
Financing Summary - As a result of the transactions, the LLCs have received more than $400
million in permanent public and private funding from ARRA funds (the “ARRA loans”), State of
New York modernization funds, and the sale of long-term bonds and tax credits. The majority of
this funding has been invested in capital improvements at the 21 developments and for funding
operating reserves. The LLC I transaction also included approximately $360 million of short-term
bridge financing to fund the acquisition price and rehabilitation costs, all of which was prepaid in
July 2013.
103
21. RELATED PARTY TRANSACTIONS
Mixed-Finance Transactions (continued)
LLC I was structured to provide its 99.99% investor member the benefit of the low-income housing
tax credits. The investor members provided $228 million in equity payments through December 31,
2016, in return for tax credit benefits.
NYCHA holds a substantial amount of indebtedness from the LLCs upon completion of the
rehabilitation of the developments. Funds received from the ARRA loans were provided to the LLCs
as permanent loans from NYCHA. At December 31, 2016, outstanding ARRA loans payable to
NYCHA from LLC I and LLC II, respectively, are $75,780,000 and $32,077,000.
In addition to the ARRA loans, the Authority provided additional loans (“Loan A”) and (“Loan C”)
to the LLC’s, to enable them to carry out rehabilitation work at the developments and to provide a
source of funding to redeem the Bridge Bonds at maturity. As of December 31, 2016, outstanding
Loan A payable to NYCHA from LLC I was $476,956,000 and from LLC II was $2,681,000. Loan
A interest from LLC I, charged at a rate of 2.69% per annum, was $61,364,000. Outstanding Loan
C payable to NYCHA as of December 31, 2016 was $42,000,000.
In September 2013, NYCHA converted the remaining construction-period financing for both LLC I
and LLC II from construction loans to permanent loans due to HDC. The permanent loans for LLC I
and LLC II are $22,634,000 and $26,712,000, respectively, as of December 31, 2016 (see Note 13).
Responsibilities and Obligations – NYCHA has certain responsibilities and obligations under
separate agreements with the LLCs including (i) continuing to manage the operations of the
developments; (ii) served as developer for the rehabilitation work at the developments; (iii)
providing operating and capital subsidies to the LLCs; and (iv) providing operating deficit and
completion guarantees. The operating deficit guarantee will terminate if specified operating income
conditions are met.
As of December 31, 2016, the balance due to NYCHA from LLC I and LLC2 was $7,976,000 and
$6,907,000 for reimbursable costs in managing the operation of the developments. In 2016,
NYCHA provided operating subsidies and capital contributions of $20,568,000 to LLC I and
$32,644,000 to LLC II under the mixed -finance transaction agreements.
NYCHA has retained the right to reacquire the developments of LLC I in the future. The right of
first refusal terminates fifteen (15) years after the first day following the expiration of the final year
of the tax credit period with respect to each development.
For LLC II, NYCHA was granted a call option (the “Call Option”) with respect to the membership
interest of the other participating member on the following terms: (i) the Call Option is exercisable
by notice from the managing member to the other participating member; (ii) the closing date shall be
the date selected by the managing member, provided that such date must be on or after the date
which is the five (5) year anniversary of the admission of the other participating member to the
Company; (iii) the purchase price under the Call Option shall equal fifty percent (50%) of the
distributions made to the other participating member during the calendar year preceding the closing
under the Call Option; and (iv) such purchase price shall be paid in immediately available funds.
The Authority has not exercised the Call Option as of December 31, 2016.
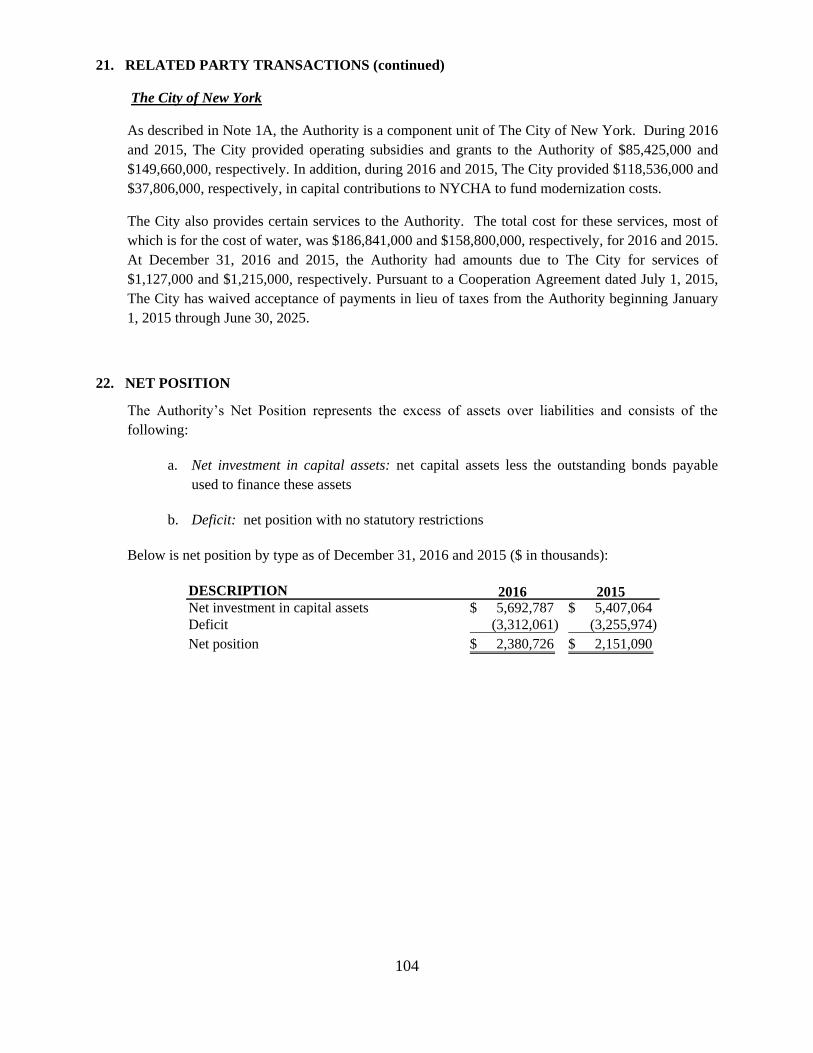
104
21. RELATED PARTY TRANSACTIONS (continued)
The City of New York
As described in Note 1A, the Authority is a component unit of The City of New York. During 2016
and 2015, The City provided operating subsidies and grants to the Authority of $85,425,000 and
$149,660,000, respectively. In addition, during 2016 and 2015, The City provided $118,536,000 and
$37,806,000, respectively, in capital contributions to NYCHA to fund modernization costs.
The City also provides certain services to the Authority. The total cost for these services, most of
which is for the cost of water, was $186,841,000 and $158,800,000, respectively, for 2016 and 2015.
At December 31, 2016 and 2015, the Authority had amounts due to The City for services of
$1,127,000 and $1,215,000, respectively. Pursuant to a Cooperation Agreement dated July 1, 2015,
The City has waived acceptance of payments in lieu of taxes from the Authority beginning January
1, 2015 through June 30, 2025.
22. NET POSITION
The Authority’s Net Position represents the excess of assets over liabilities and consists of the
following:
a. Net investment in capital assets: net capital assets less the outstanding bonds payable
used to finance these assets
b. Deficit: net position with no statutory restrictions
Below is net position by type as of December 31, 2016 and 2015 ($ in thousands):
DESCRIPTION 2016 2015Net investment in capital assets 5,692,787$ 5,407,064$
Deficit (3,312,061) (3,255,974)
Net position 2,380,726$ 2,151,090$
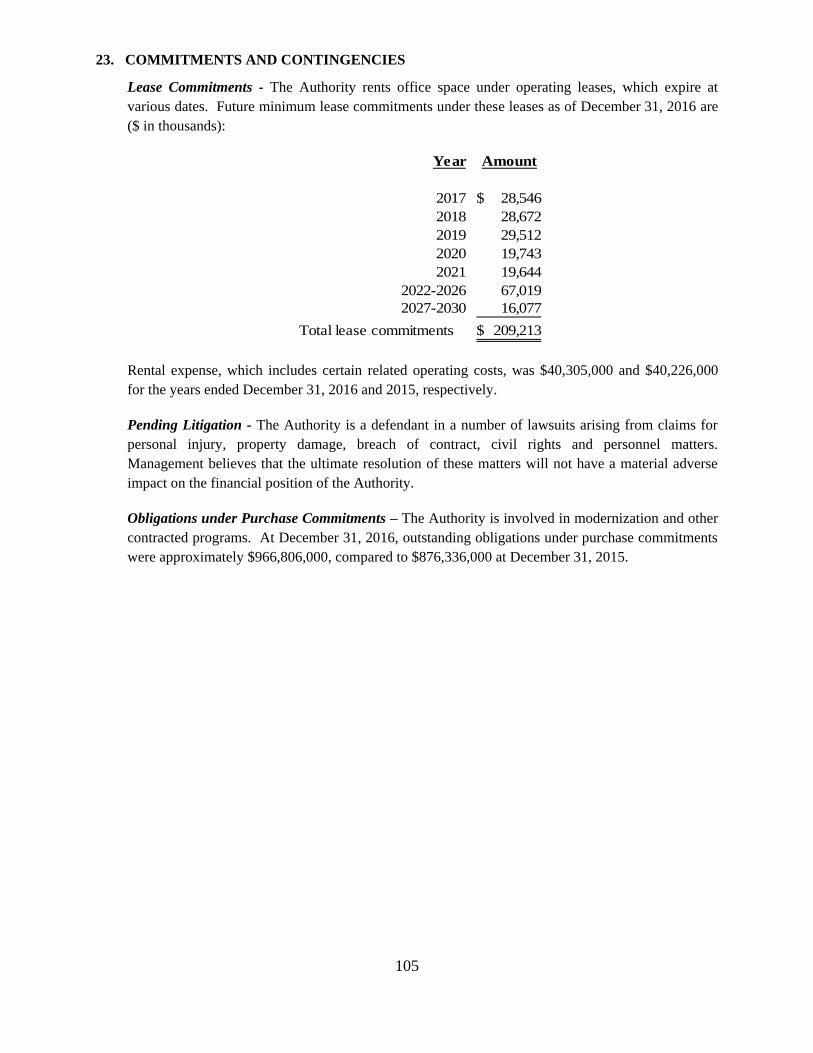
105
23. COMMITMENTS AND CONTINGENCIES
Lease Commitments - The Authority rents office space under operating leases, which expire at
various dates. Future minimum lease commitments under these leases as of December 31, 2016 are
($ in thousands):
Year Amount
2017 28,546$
2018 28,672
2019 29,512
2020 19,743
2021 19,644
2022-2026 67,019
2027-2030 16,077
Total lease commitments 209,213$
Rental expense, which includes certain related operating costs, was $40,305,000 and $40,226,000
for the years ended December 31, 2016 and 2015, respectively.
Pending Litigation - The Authority is a defendant in a number of lawsuits arising from claims for
personal injury, property damage, breach of contract, civil rights and personnel matters.
Management believes that the ultimate resolution of these matters will not have a material adverse
impact on the financial position of the Authority.
Obligations under Purchase Commitments – The Authority is involved in modernization and other
contracted programs. At December 31, 2016, outstanding obligations under purchase commitments
were approximately $966,806,000, compared to $876,336,000 at December 31, 2015.
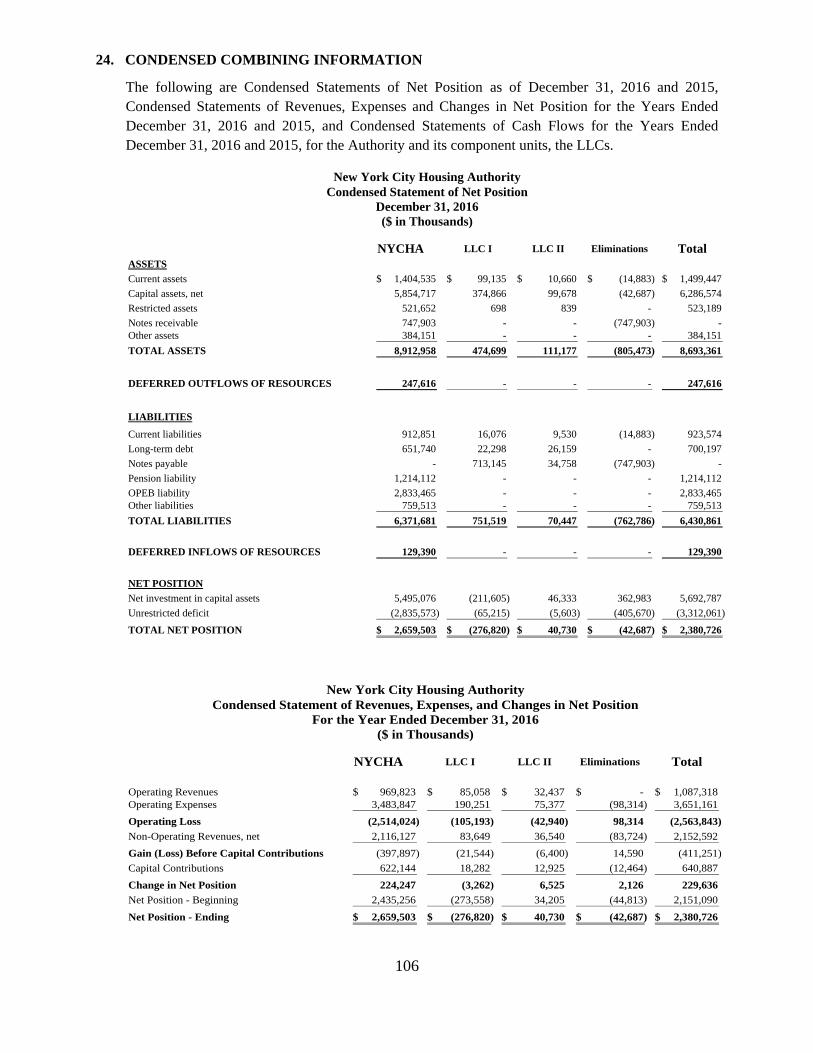
106
24. CONDENSED COMBINING INFORMATION
The following are Condensed Statements of Net Position as of December 31, 2016 and 2015,
Condensed Statements of Revenues, Expenses and Changes in Net Position for the Years Ended
December 31, 2016 and 2015, and Condensed Statements of Cash Flows for the Years Ended
December 31, 2016 and 2015, for the Authority and its component units, the LLCs.
New York City Housing Authority
Condensed Statement of Net Position
December 31, 2016
($ in Thousands)
NYCHA LLC I LLC II Eliminations Total
ASSETS
Current assets 1,404,535$ 99,135$ 10,660$ (14,883)$ 1,499,447$
Capital assets, net 5,854,717 374,866 99,678 (42,687) 6,286,574
Restricted assets 521,652 698 839 - 523,189
Notes receivable 747,903 - - (747,903) -
Other assets 384,151 - - - 384,151
TOTAL ASSETS 8,912,958 474,699 111,177 (805,473) 8,693,361
DEFERRED OUTFLOWS OF RESOURCES 247,616 - - - 247,616
LIABILITIES
Current liabilities 912,851 16,076 9,530 (14,883) 923,574
Long-term debt 651,740 22,298 26,159 - 700,197
Notes payable - 713,145 34,758 (747,903) -
Pension liability 1,214,112 - - - 1,214,112
OPEB liability 2,833,465 - - - 2,833,465
Other liabilities 759,513 - - - 759,513
TOTAL LIABILITIES 6,371,681 751,519 70,447 (762,786) 6,430,861
DEFERRED INFLOWS OF RESOURCES 129,390 - - - 129,390
NET POSITION
Net investment in capital assets 5,495,076 (211,605) 46,333 362,983 5,692,787
Unrestricted deficit (2,835,573) (65,215) (5,603) (405,670) (3,312,061)
TOTAL NET POSITION 2,659,503$ (276,820)$ 40,730$ (42,687)$ 2,380,726$
New York City Housing Authority
Condensed Statement of Revenues, Expenses, and Changes in Net Position
For the Year Ended December 31, 2016
($ in Thousands)
NYCHA LLC I LLC II Eliminations Total
Operating Revenues 969,823$ 85,058$ 32,437$ -$ 1,087,318$
Operating Expenses 3,483,847 190,251 75,377 (98,314) 3,651,161
Operating Loss (2,514,024) (105,193) (42,940) 98,314 (2,563,843)
Non-Operating Revenues, net 2,116,127 83,649 36,540 (83,724) 2,152,592
Gain (Loss) Before Capital Contributions (397,897) (21,544) (6,400) 14,590 (411,251)
Capital Contributions 622,144 18,282 12,925 (12,464) 640,887
Change in Net Position 224,247 (3,262) 6,525 2,126 229,636
Net Position - Beginning 2,435,256 (273,558) 34,205 (44,813) 2,151,090
Net Position - Ending 2,659,503$ (276,820)$ 40,730$ (42,687)$ 2,380,726$
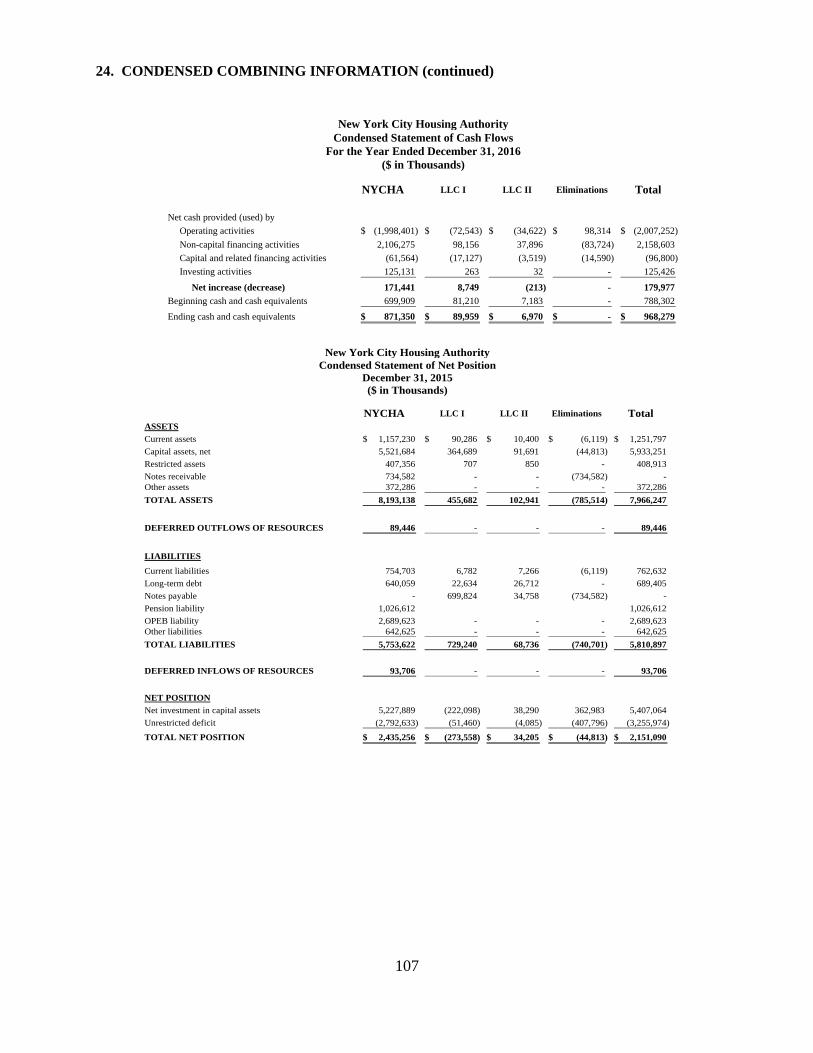
107
24. CONDENSED COMBINING INFORMATION (continued)
New York City Housing Authority
Condensed Statement of Cash Flows
For the Year Ended December 31, 2016
($ in Thousands)
NYCHA LLC I LLC II Eliminations Total
Net cash provided (used) by
Operating activities (1,998,401)$ (72,543)$ (34,622)$ 98,314$ (2,007,252)$
Non-capital financing activities 2,106,275 98,156 37,896 (83,724) 2,158,603
Capital and related financing activities (61,564) (17,127) (3,519) (14,590) (96,800)
Investing activities 125,131 263 32 - 125,426
Net increase (decrease) 171,441 8,749 (213) - 179,977
Beginning cash and cash equivalents 699,909 81,210 7,183 - 788,302
Ending cash and cash equivalents 871,350$ 89,959$ 6,970$ -$ 968,279$
New York City Housing Authority
Condensed Statement of Net Position
December 31, 2015
($ in Thousands)
NYCHA LLC I LLC II Eliminations Total
ASSETS
Current assets 1,157,230$ 90,286$ 10,400$ (6,119)$ 1,251,797$
Capital assets, net 5,521,684 364,689 91,691 (44,813) 5,933,251
Restricted assets 407,356 707 850 - 408,913
Notes receivable 734,582 - - (734,582) -
Other assets 372,286 - - - 372,286
TOTAL ASSETS 8,193,138 455,682 102,941 (785,514) 7,966,247
DEFERRED OUTFLOWS OF RESOURCES 89,446 - - - 89,446
LIABILITIES
Current liabilities 754,703 6,782 7,266 (6,119) 762,632
Long-term debt 640,059 22,634 26,712 - 689,405
Notes payable - 699,824 34,758 (734,582) -
Pension liability 1,026,612 1,026,612
OPEB liability 2,689,623 - - - 2,689,623
Other liabilities 642,625 - - - 642,625
TOTAL LIABILITIES 5,753,622 729,240 68,736 (740,701) 5,810,897
DEFERRED INFLOWS OF RESOURCES 93,706 - - - 93,706
NET POSITION
Net investment in capital assets 5,227,889 (222,098) 38,290 362,983 5,407,064
Unrestricted deficit (2,792,633) (51,460) (4,085) (407,796) (3,255,974)
TOTAL NET POSITION 2,435,256$ (273,558)$ 34,205$ (44,813)$ 2,151,090$
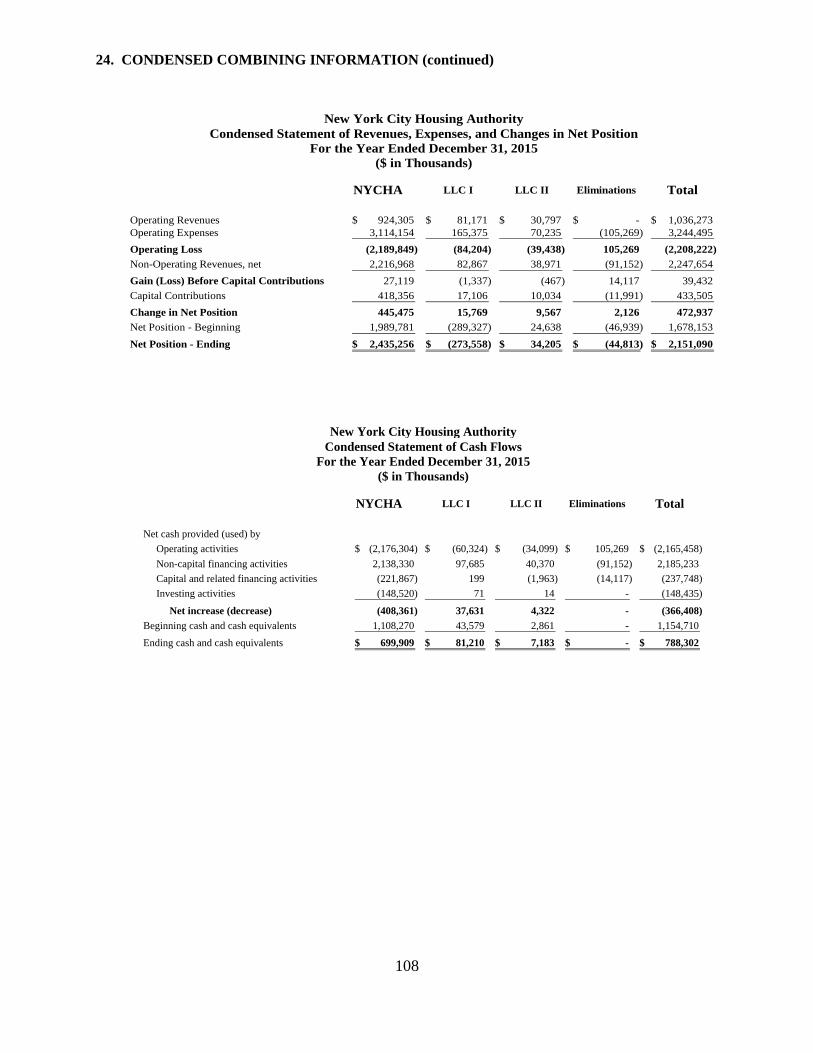
108
24. CONDENSED COMBINING INFORMATION (continued)
New York City Housing Authority
Condensed Statement of Revenues, Expenses, and Changes in Net Position
For the Year Ended December 31, 2015
($ in Thousands)
NYCHA LLC I LLC II Eliminations Total
Operating Revenues 924,305$ 81,171$ 30,797$ -$ 1,036,273$
Operating Expenses 3,114,154 165,375 70,235 (105,269) 3,244,495
Operating Loss (2,189,849) (84,204) (39,438) 105,269 (2,208,222)
Non-Operating Revenues, net 2,216,968 82,867 38,971 (91,152) 2,247,654
Gain (Loss) Before Capital Contributions 27,119 (1,337) (467) 14,117 39,432
Capital Contributions 418,356 17,106 10,034 (11,991) 433,505
Change in Net Position 445,475 15,769 9,567 2,126 472,937
Net Position - Beginning 1,989,781 (289,327) 24,638 (46,939) 1,678,153
Net Position - Ending 2,435,256$ (273,558)$ 34,205$ (44,813)$ 2,151,090$
New York City Housing Authority
Condensed Statement of Cash Flows
For the Year Ended December 31, 2015
($ in Thousands)
NYCHA LLC I LLC II Eliminations Total
Net cash provided (used) by
Operating activities (2,176,304)$ (60,324)$ (34,099)$ 105,269$ (2,165,458)$
Non-capital financing activities 2,138,330 97,685 40,370 (91,152) 2,185,233
Capital and related financing activities (221,867) 199 (1,963) (14,117) (237,748)
Investing activities (148,520) 71 14 - (148,435)
Net increase (decrease) (408,361) 37,631 4,322 - (366,408)
Beginning cash and cash equivalents 1,108,270 43,579 2,861 - 1,154,710
Ending cash and cash equivalents 699,909$ 81,210$ 7,183$ -$ 788,302$
REQUIRED SUPPLEMENTARY INFORMATION
(UNAUDITED)
Woodlands and Council Towers VII Ribbon Cutting
May 31, 2016

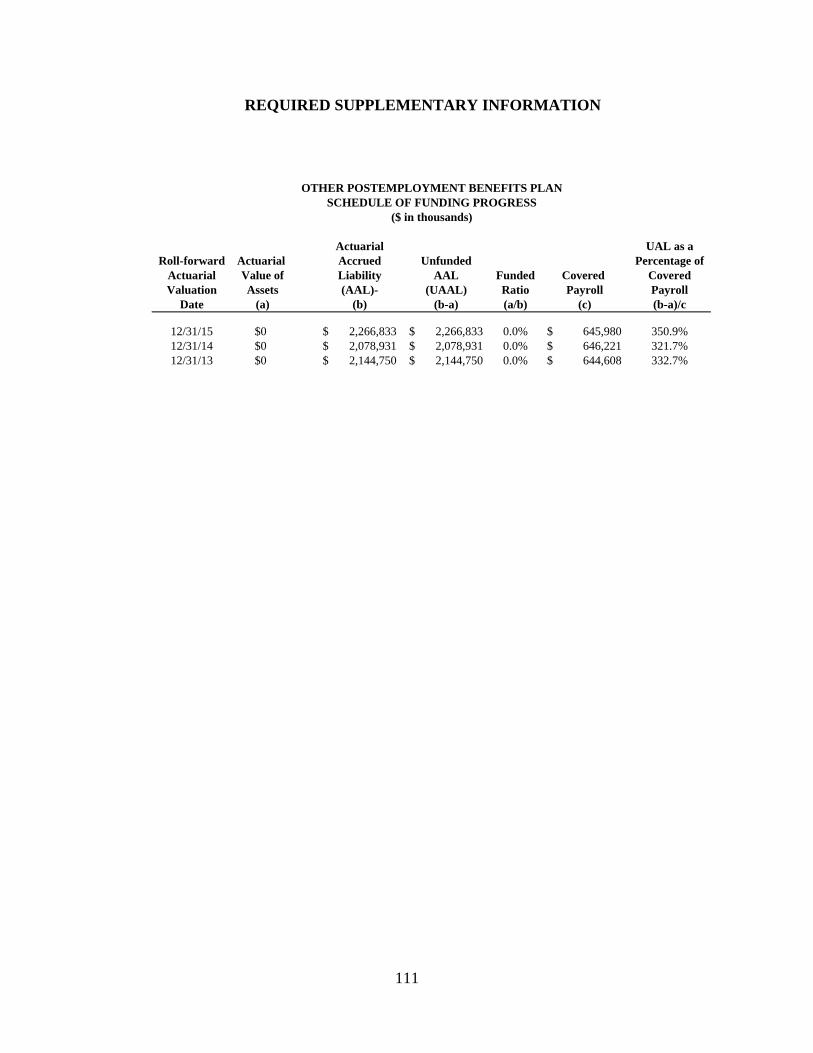
111
REQUIRED SUPPLEMENTARY INFORMATION
OTHER POSTEMPLOYMENT BENEFITS PLAN
SCHEDULE OF FUNDING PROGRESS
Actuarial UAL as a
Roll-forward Actuarial Accrued Unfunded Percentage of
Actuarial Value of Liability AAL Funded Covered Covered
Valuation Assets (AAL)- (UAAL) Ratio Payroll Payroll
Date (a) (b) (b-a) (a/b) (c) (b-a)/c
12/31/15 $0 2,266,833$ 2,266,833$ 0.0% 645,980$ 350.9%
12/31/14 $0 2,078,931$ 2,078,931$ 0.0% 646,221$ 321.7%
12/31/13 $0 2,144,750$ 2,144,750$ 0.0% 644,608$ 332.7%
($ in thousands)

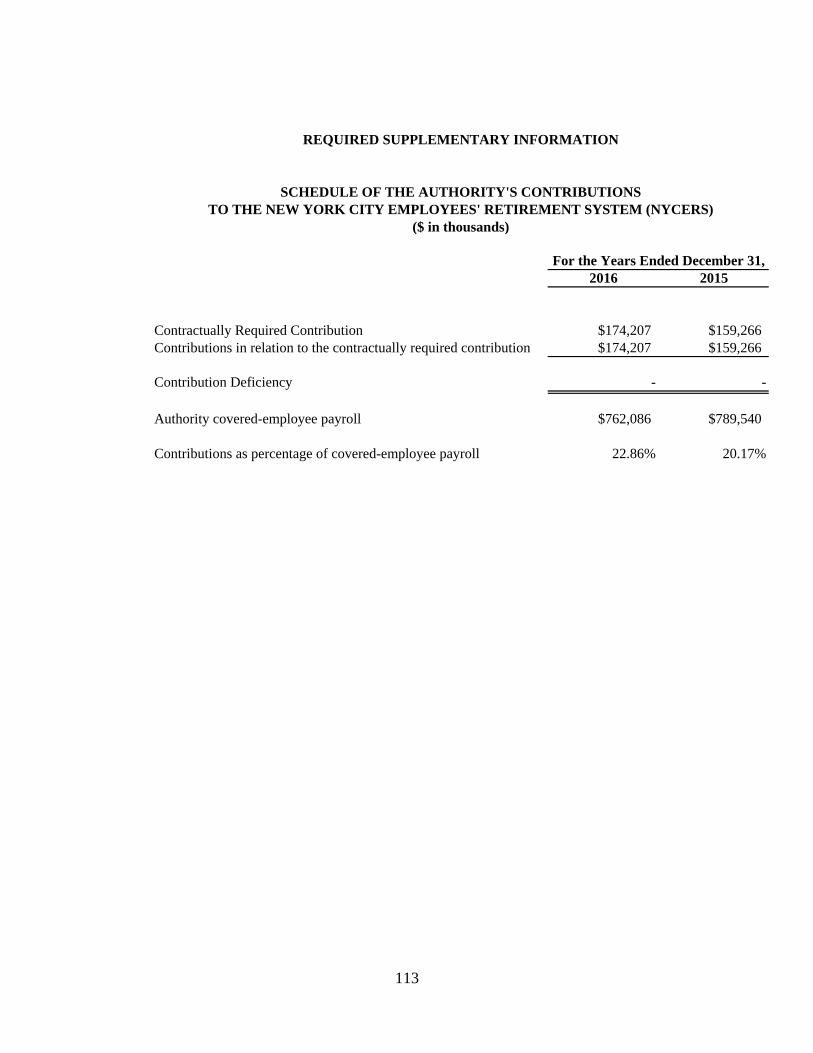
113
REQUIRED SUPPLEMENTARY INFORMATION
SCHEDULE OF THE AUTHORITY'S CONTRIBUTIONS
TO THE NEW YORK CITY EMPLOYEES' RETIREMENT SYSTEM (NYCERS)
($ in thousands)
For the Years Ended December 31,
2016 2015
Contractually Required Contribution $174,207 $159,266
Contributions in relation to the contractually required contribution $174,207 $159,266
Contribution Deficiency - -
Authority covered-employee payroll $762,086 $789,540
Contributions as percentage of covered-employee payroll 22.86% 20.17%

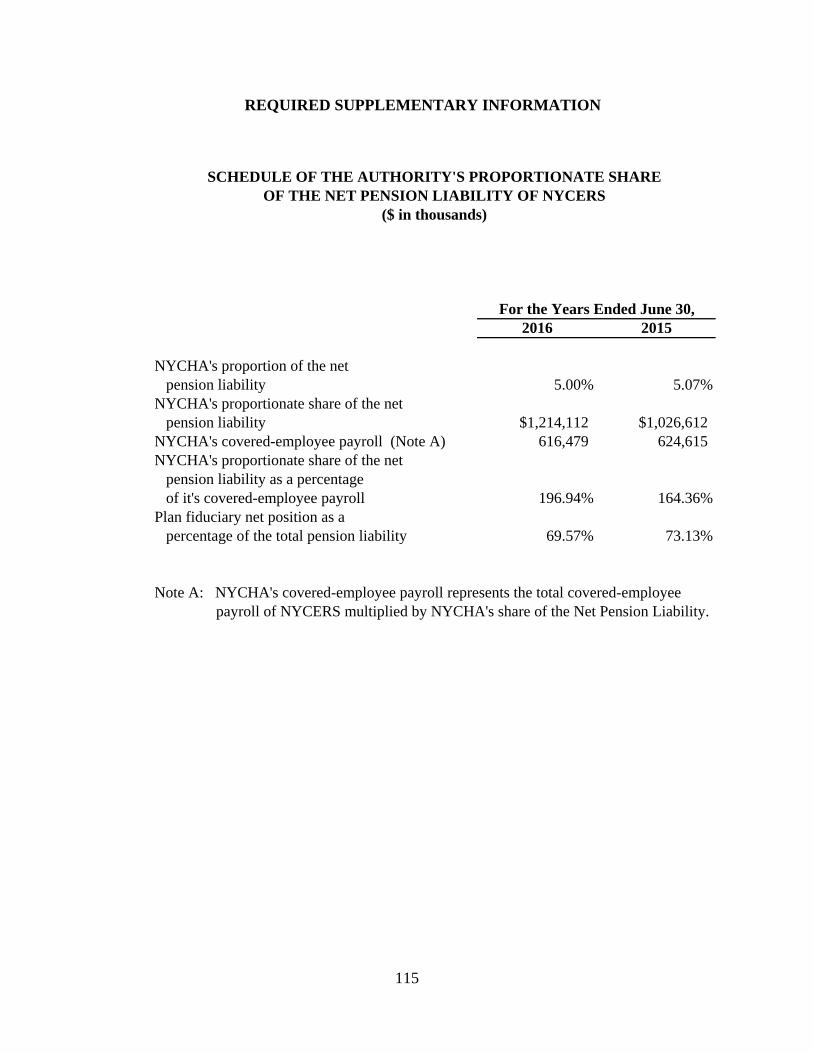
115
REQUIRED SUPPLEMENTARY INFORMATION
SCHEDULE OF THE AUTHORITY'S PROPORTIONATE SHARE
OF THE NET PENSION LIABILITY OF NYCERS
($ in thousands)
For the Years Ended June 30,
2016 2015
NYCHA's proportion of the net
pension liability 5.00% 5.07%
NYCHA's proportionate share of the net
pension liability $1,214,112 $1,026,612
NYCHA's covered-employee payroll (Note A) 616,479 624,615
NYCHA's proportionate share of the net
pension liability as a percentage
of it's covered-employee payroll 196.94% 164.36%
Plan fiduciary net position as a
percentage of the total pension liability 69.57% 73.13%
Note A: NYCHA's covered-employee payroll represents the total covered-employee
payroll of NYCERS multiplied by NYCHA's share of the Net Pension Liability.

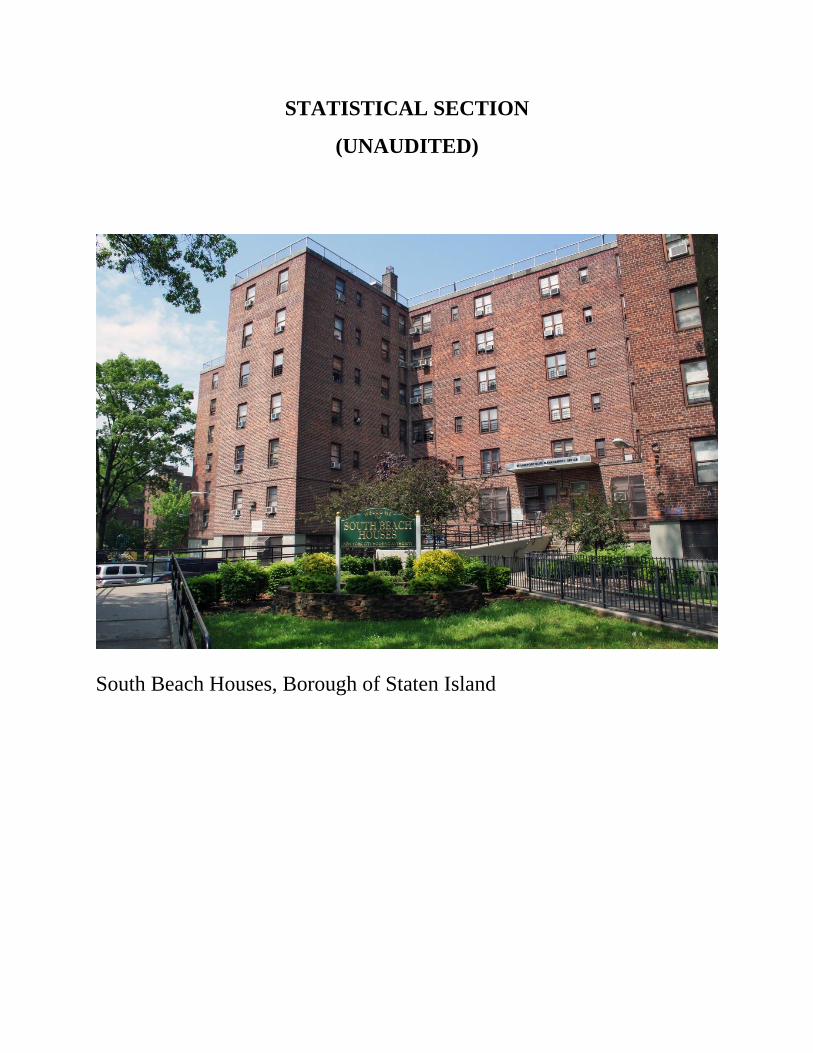
STATISTICAL SECTION
(UNAUDITED)
South Beach Houses, Borough of Staten Island

Smith Houses, Borough of Manhattan

121
New York City Housing Authority
STATISTICAL SECTION (UNAUDITED) This part of the Comprehensive Annual Financial Report presents detailed information as a
context for understanding what the information in the financial statements, note disclosures, and
required supplementary information says about the Authority's overall financial health. The
following are the categories of the schedules that are included in this Section:
Financial Trends
These schedules contain trend information to help the reader understand how the
Authority's financial performance and well-being have changed over time.
Revenue Capacity
This schedule contains information to help the reader assess the Authority's most
significant revenue source.
Debt Capacity
This schedule presents information to help the reader assess the affordability of
the Authority's current levels of outstanding debt and the Authority's ability to
issue additional debt in the future.
Demographic and Economic Information
These schedules offer demographic and economic indicators to help the reader
understand the environment within which the Authority's financial activities take
place.
Operating Information
These schedules contain service and infrastructure data to help the reader
understand how the information in the Authority's financial report relates to the
services the Authority provides and the activities it performs.

STATISTICAL SECTION (UNAUDITED)
SCHEDULES OF
FINANCIAL TRENDS

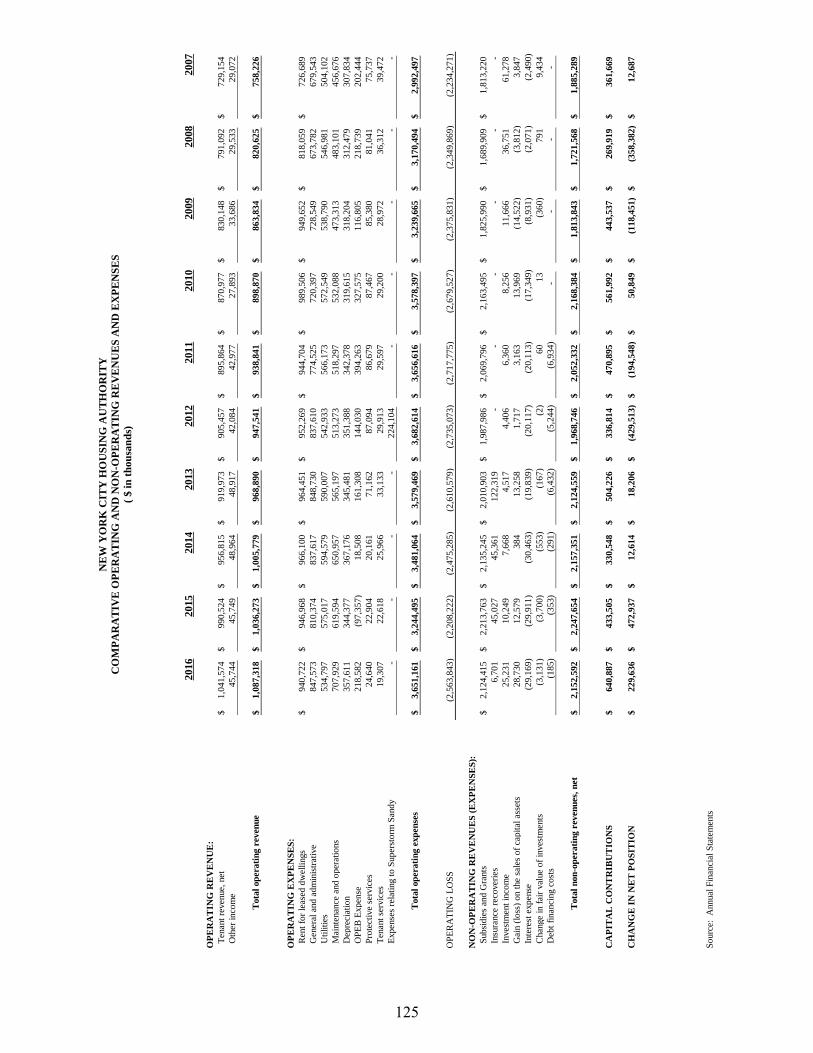
NE
W Y
OR
K C
ITY
HO
US
ING
AU
TH
OR
ITY
CO
MP
AR
AT
IVE
OP
ER
AT
ING
AN
D N
ON
-OP
ER
AT
ING
RE
VE
NU
ES
AN
D E
XP
EN
SE
S
( $ i
n t
hou
san
ds)
2016
2015
2014
2013
2012
20
11
20
10
20
09
20
08
20
07
OP
ER
AT
ING
RE
VE
NU
E:
T
enan
t re
ven
ue,
net
1,0
41
,57
4$
99
0,5
24
$
95
6,8
15
$
91
9,9
73
$
90
5,4
57
$
895,8
64
$
870,9
77
$
830,1
48
$
791,0
92
$
729,1
54
$
O
ther
inco
me
45
,74
4
4
5,7
49
48
,96
4
4
8,9
17
42
,08
4
42,9
77
27,8
93
33,6
86
29,5
33
29,0
72
Tota
l op
erati
ng r
even
ue
1,0
87
,31
8$
1,0
36
,27
3$
1
,00
5,7
79
$
96
8,8
90
$
94
7,5
41
$
93
8,8
41
$
898,8
70
$
863,8
34
$
820,6
25
$
758,2
26
$
OP
ER
AT
ING
EX
PE
NS
ES
:
R
ent
for
leas
ed d
wel
lings
94
0,7
22
$
94
6,9
68
$
96
6,1
00
$
96
4,4
51
$
95
2,2
69
$
944,7
04
$
989,5
06
$
949,6
52
$
818,0
59
$
726,6
89
$
G
ener
al a
nd
ad
min
istr
ativ
e8
47
,57
3
81
0,3
74
8
37
,61
7
84
8,7
30
8
37
,61
0
774,5
25
720,3
97
728,5
49
673,7
82
679,5
43
U
tili
ties
53
4,7
97
5
75
,01
7
59
4,5
79
5
90
,00
7
54
2,9
33
5
66,1
73
572,5
49
538,7
90
546,9
81
504,1
02
M
ainte
nan
ce a
nd
oper
atio
ns
70
7,9
29
6
19
,59
4
65
0,9
57
5
65
,19
7
51
3,2
73
5
18,2
97
532,0
88
473,3
13
483,1
01
456,6
76
D
epre
ciat
ion
35
7,6
11
3
44
,37
7
36
7,1
76
3
45
,48
1
35
1,3
88
3
42,3
78
319,6
15
318,2
04
312,4
79
307,8
34
O
PE
B E
xp
ense
21
8,5
82
(9
7,3
57
)
1
8,5
08
16
1,3
08
1
44
,03
0
39
4,2
63
327,5
75
116,8
05
218,7
39
202,4
44
P
rote
ctiv
e se
rvic
es2
4,6
40
22
,90
4
2
0,1
61
71
,16
2
8
7,0
94
86,6
79
87,4
67
85,3
80
81,0
41
75,7
37
T
enan
t se
rvic
es1
9,3
07
22
,61
8
2
5,9
66
33
,13
3
2
9,9
13
29,5
97
29,2
00
28,9
72
36,3
12
39,4
72
E
xp
ense
s re
lati
ng t
o S
uper
storm
San
dy
-
-
-
-
22
4,1
04
-
-
-
-
-
Tota
l op
erati
ng e
xp
en
ses
3,6
51
,16
1$
3,2
44
,49
5$
3
,48
1,0
64
$
3,5
79
,46
9$
3
,68
2,6
14
$
3,6
56,6
16
$
3,5
78,3
97
$
3,2
39,6
65
$
3,1
70,4
94
$
2,9
92,4
97
$
OP
ER
AT
ING
LO
SS
(2,5
63
,84
3)
(2,2
08
,22
2)
(2,4
75
,28
5)
(2,6
10
,57
9)
(2,7
35
,07
3)
(2,7
17,7
75)
(2,6
79,5
27)
(2,3
75,8
31)
(2,3
49,8
69)
(2,2
34,2
71)
NO
N-O
PE
RA
TIN
G R
EV
EN
UE
S (
EX
PE
NS
ES
):
S
ub
sid
ies
and
Gra
nts
2,1
24
,41
5$
2,2
13
,76
3$
2
,13
5,2
45
$
2,0
10
,90
3$
1
,98
7,9
86
$
2,0
69,7
96
$
2,1
63,4
95
$
1,8
25,9
90
$
1,6
89,9
09
$
1,8
13,2
20
$
In
sura
nce
rec
over
ies
6,7
01
4
5,0
27
45
,36
1
1
22
,31
9
-
-
-
-
-
-
In
ves
tmen
t in
com
e2
5,2
31
10
,24
9
7
,66
8
4,5
17
4
,40
6
6,3
60
8,2
56
11,6
66
36,7
51
61,2
78
G
ain (
loss
) o
n t
he
sale
s of
capit
al a
sset
s2
8,7
30
12
,57
9
3
84
1
3,2
58
1,7
17
3,1
63
13,9
69
(14,5
22)
(3,8
12)
3,8
47
In
tere
st e
xp
ense
(29
,16
9)
(29
,91
1)
(30
,46
3)
(19
,83
9)
(20
,11
7)
(20,1
13)
(17,3
49)
(8,9
31)
(2
,071)
(2
,490)
C
han
ge
in f
air
val
ue
of
inves
tmen
ts(3
,13
1)
(3
,70
0)
(5
53
)
(1
67
)
(2
)
60
13
(360)
791
9,4
34
D
ebt
finan
cing c
ost
s(1
85
)
(3
53
)
(2
91
)
(6
,43
2)
(5
,24
4)
(6
,934)
-
-
-
-
Tota
l n
on
-op
erati
ng r
even
ues,
net
2,1
52
,59
2$
2,2
47
,65
4$
2
,15
7,3
51
$
2,1
24
,55
9$
1
,96
8,7
46
$
2,0
52,3
32
$
2,1
68,3
84
$
1,8
13,8
43
$
1,7
21,5
68
$
1,8
85,2
89
$
CA
PIT
AL
CO
NT
RIB
UT
ION
S6
40
,88
7$
43
3,5
05
$
33
0,5
48
$
50
4,2
26
$
33
6,8
14
$
470,8
95
$
561,9
92
$
443,5
37
$
269,9
19
$
361,6
69
$
CH
AN
GE
IN
NE
T P
OS
ITIO
N2
29
,63
6$
47
2,9
37
$
12
,61
4$
1
8,2
06
$
(42
9,5
13
)$
(194,5
48)
$
50,8
49
$
(118,4
51)
$
(3
58,3
82)
$
12,6
87
$
So
urc
e:
Annual
Fin
anci
al S
tate
men
ts
125

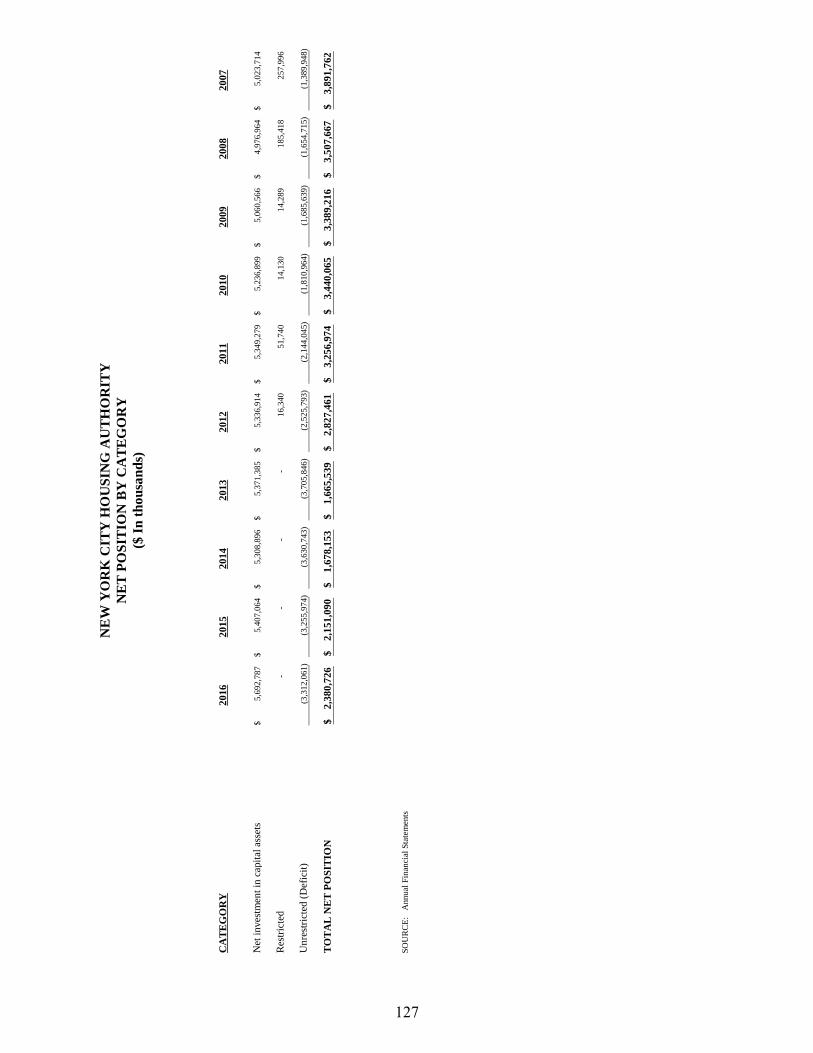
NE
W Y
OR
K C
ITY
HO
US
ING
AU
TH
OR
ITY
NE
T P
OS
ITIO
N B
Y C
AT
EG
OR
Y
($ I
n t
ho
usa
nd
s)
CA
TE
GO
RY
20
16
20
15
20
14
20
13
20
12
20
11
20
10
20
09
20
08
20
07
Net
in
ves
tmen
t in
cap
ital
ass
ets
5,6
92,7
87
$
5,4
07,0
64
$
5,3
08,8
96
$
5,3
71,3
85
$
5,3
36,9
14
$
5,3
49,2
79
$
5,2
36,8
99
$
5,0
60,5
66
$
4,9
76,9
64
$
5,0
23,7
14
$
Res
tric
ted
-
-
-
-
16,3
40
51,7
40
14,1
30
14,2
89
185,4
18
257,9
96
Un
rest
rict
ed (
Def
icit
)(3
,312,0
61)
(3
,255,9
74)
(3
,630,7
43)
(3
,705,8
46)
(2
,525,7
93)
(2
,144,0
45)
(1
,810,9
64)
(1
,685,6
39)
(1
,654,7
15)
(1
,389,9
48)
TO
TA
L N
ET
PO
SIT
ION
2,3
80
,72
6$
2,1
51
,09
0$
1,6
78
,15
3$
1,6
65
,53
9$
2,8
27
,46
1$
3,2
56
,97
4$
3,4
40
,06
5$
3,3
89
,21
6$
3,5
07
,66
7$
3,8
91
,76
2$
SO
UR
CE
:
Annual
Fin
anci
al S
tate
men
ts
127

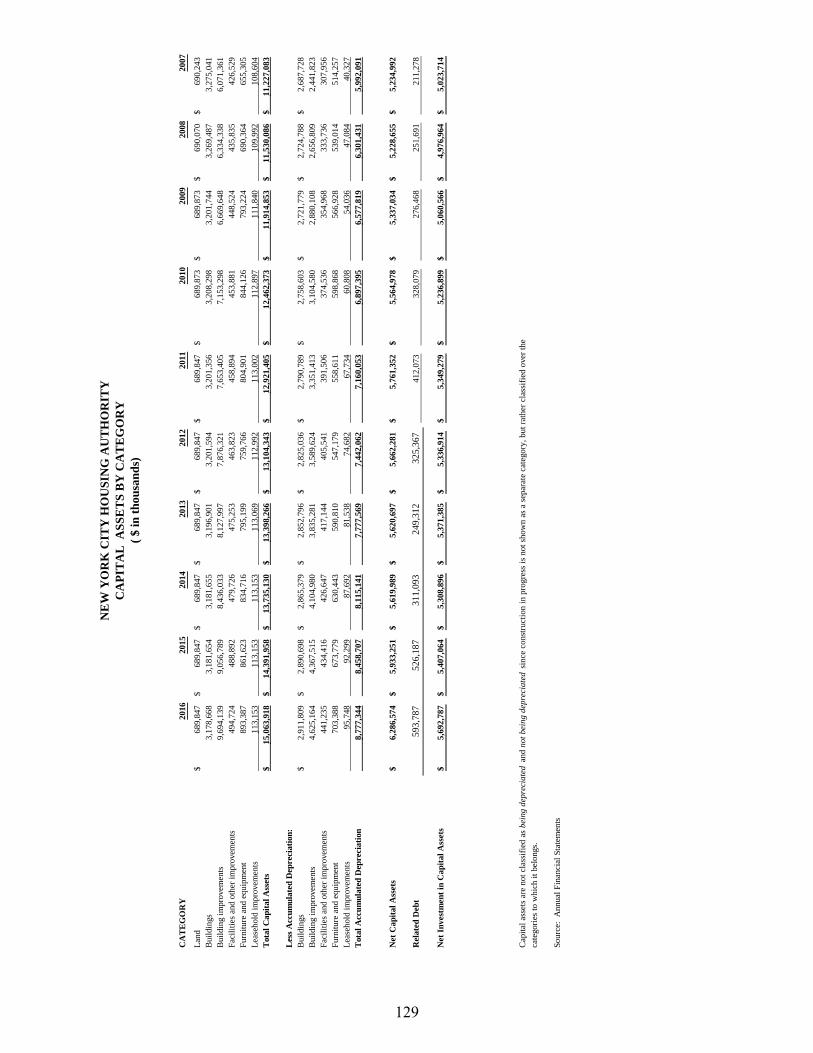
CA
TE
GO
RY
20
16
2015
2014
2013
2012
2011
2010
2009
2008
2007
Lan
d6
89
,847
$
689,8
47
$
689,8
47
$
689,8
47
$
689,8
47
$
689,8
47
$
689,8
73
$
689,8
73
$
690,0
70
$
690,2
43
$
Buil
din
gs
3,1
78
,668
3,1
81,6
54
3,1
81,6
55
3,1
96,9
01
3,2
01,5
94
3,2
01,3
56
3,2
08,2
98
3,2
01,7
44
3,2
69,4
87
3,2
75,0
41
Buil
din
g i
mpro
vem
ents
9,6
94
,139
9,0
56,7
89
8,4
36,0
33
8,1
27,9
97
7,8
76,3
21
7,6
53,4
05
7,1
53,2
98
6,6
69,6
48
6,3
34,3
38
6,0
71,3
61
Fac
ilit
ies
and o
ther
im
pro
vem
ents
49
4,7
24
488,8
92
479,7
26
475,2
53
463,8
23
458,8
94
453,8
81
448,5
24
435,8
35
426,5
29
Furn
iture
and e
quip
men
t8
93
,38
7
861,6
23
834,7
16
795,1
99
759,7
66
804,9
01
844,1
26
793,2
24
690,3
64
655,3
05
Lea
sehold
im
pro
vem
ents
11
3,1
53
113,1
53
113,1
53
113,0
69
112,9
92
113,0
02
112,8
97
111,8
40
109,9
92
108,6
04
Tota
l C
ap
ital
Ass
ets
15
,06
3,9
18
$
14,3
91,9
58
$
13,7
35,1
30
$
13,3
98,2
66
$
13,1
04,3
43
$
12,9
21,4
05
$
12,4
62,3
73
$
11,9
14,8
53
$
11,5
30,0
86
$
11,2
27,0
83
$
Les
s A
ccu
mu
late
d D
epre
cia
tion
:
Buil
din
gs
2,9
11
,80
9$
2,8
90,6
98
$
2,8
65,3
79
$
2,8
52,7
96
$
2,8
25,0
36
$
2,7
90,7
89
$
2,7
58,6
03
$
2,7
21,7
79
$
2,7
24,7
88
$
2,6
87,7
28
$
Buil
din
g i
mpro
vem
ents
4,6
25
,164
4,3
67,5
15
4,1
04,9
80
3,8
35,2
81
3,5
89,6
24
3,3
51,4
13
3,1
04,5
80
2,8
80,1
08
2,6
56,8
09
2,4
41,8
23
Fac
ilit
ies
and o
ther
im
pro
vem
ents
44
1,2
35
434,4
16
426,6
47
417,1
44
405,5
41
391,5
06
374,5
36
354,9
68
333,7
36
307,9
56
Furn
iture
and e
quip
men
t7
03
,38
8
673,7
79
630,4
43
590,8
10
547,1
79
558,6
11
598,8
68
566,9
28
539,0
14
514,2
57
Lea
sehold
im
pro
vem
ents
95
,748
92,2
99
87,6
92
81,5
38
74,6
82
67,7
34
60,8
08
54,0
36
47,0
84
40,3
27
Tota
l A
ccu
mu
late
d D
epre
cia
tion
8,7
77
,34
4
8,4
58,7
07
8,1
15,1
41
7,7
77,5
69
7,4
42,0
62
7,1
60,0
53
6,8
97,3
95
6,5
77,8
19
6,3
01,4
31
5,9
92,0
91
Net
Cap
ital
Ass
ets
6,2
86
,57
4$
5,9
33,2
51
$
5,6
19,9
89
$
5,6
20,6
97
$
5,6
62,2
81
$
5,7
61,3
52
$
5,5
64,9
78
$
5,3
37,0
34
$
5,2
28,6
55
$
5,2
34,9
92
$
Rel
ate
d D
ebt
59
3,7
87
52
6,1
87
3
11
,09
3
24
9,3
12
32
5,3
67
412,0
73
328,0
79
276,4
68
251,6
91
211,2
78
Net
In
ves
tmen
t in
Ca
pit
al
Ass
ets
5,6
92
,78
7$
5,4
07,0
64
$
5,3
08,8
96
$
5,3
71,3
85
$
5,3
36,9
14
$
5,3
49,2
79
$
5,2
36,8
99
$
5,0
60,5
66
$
4,9
76,9
64
$
5,0
23,7
14
$
Cap
ital
ass
ets
are
not
clas
sifi
ed a
s b
ein
g d
epre
cia
ted
an
d n
ot
bei
ng
dep
reci
ate
d s
ince
const
ruct
ion i
n p
rogre
ss i
s not
show
n a
s a
separ
ate
cate
gory
, but
rath
er c
lass
ifie
d o
ver
the
cate
gori
es t
o w
hic
h i
t b
elo
ngs.
Sourc
e:
Annual
Fin
anci
al S
tate
men
ts
CA
PIT
AL
A
SS
ET
S B
Y C
AT
EG
OR
Y
( $ i
n t
hou
san
ds)
NE
W Y
OR
K C
ITY
HO
US
ING
AU
TH
OR
ITY
129

STATISTICAL SECTION (UNAUDITED)
SCHEDULE OF
REVENUE CAPACITY

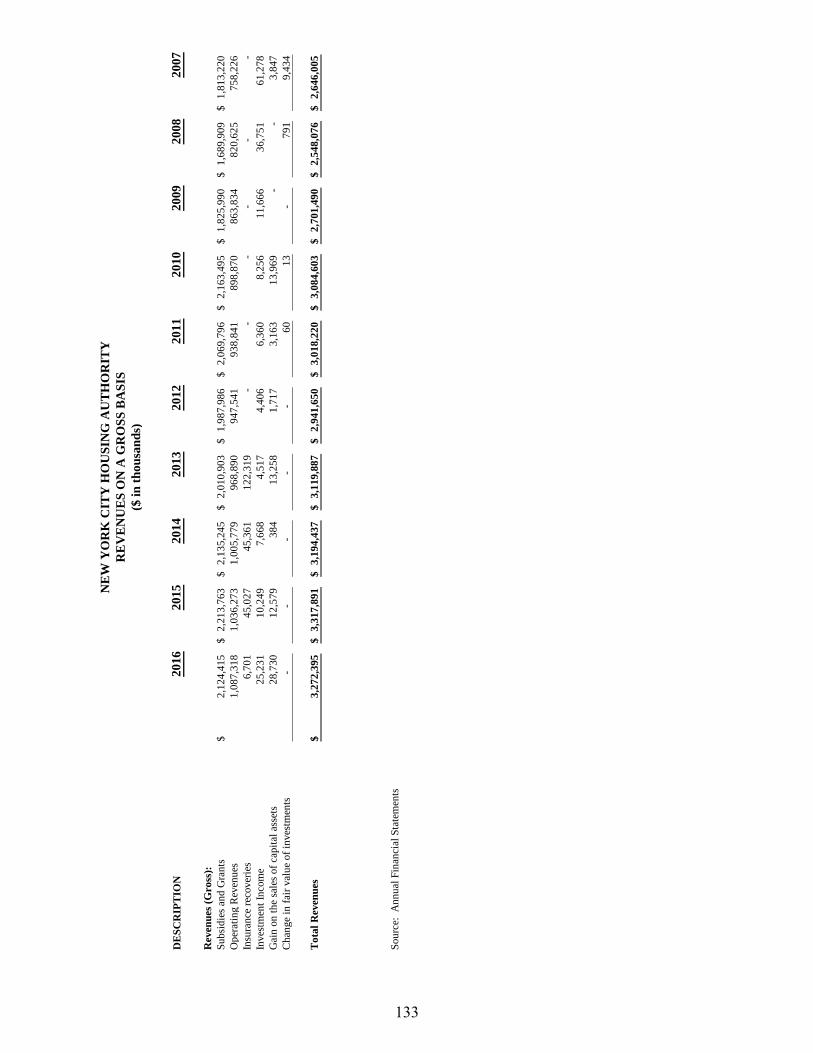
NE
W Y
OR
K C
ITY
HO
US
ING
AU
TH
OR
ITY
RE
VE
NU
ES
ON
A G
RO
SS
BA
SIS
($ i
n t
hou
san
ds)
DE
SC
RIP
TIO
N2016
2015
2014
2013
2012
2011
2010
2009
2008
2007
Reven
ues
(Gro
ss):
Su
bsi
die
s an
d G
ran
ts2
,12
4,4
15
$
2
,21
3,7
63
$
2
,13
5,2
45
$
2
,01
0,9
03
$
1
,98
7,9
86
$
2
,06
9,7
96
$
2
,16
3,4
95
$
1
,82
5,9
90
$
1
,68
9,9
09
$
1
,81
3,2
20
$
Op
erat
ing R
even
ues
1,0
87
,31
8
1,0
36
,27
3
1,0
05
,77
9
96
8,8
90
94
7,5
41
93
8,8
41
89
8,8
70
86
3,8
34
82
0,6
25
75
8,2
26
Insu
ran
ce r
ecover
ies
6,7
01
45
,02
74
5,3
61
12
2,3
19
-
-
-
-
-
-
Inves
tmen
t In
com
e2
5,2
31
10
,24
97
,66
84
,51
74
,40
6
6
,36
0
8
,25
6
1
1,6
66
3
6,7
51
6
1,2
78
Gai
n o
n t
he
sale
s of
cap
ital
ass
ets
28
,73
01
2,5
79
38
41
3,2
58
1,7
17
3,1
63
13
,96
9-
-
3
,84
7
Ch
ange
in f
air
val
ue
of
inves
tmen
ts-
-
-
-
-
6
0
13
-
7
91
9,4
34
To
tal
Reven
ues
3,2
72
,39
5$
3,3
17
,89
1$
3,1
94
,43
7$
3,1
19
,88
7$
2,9
41
,65
0$
3,0
18
,22
0$
3,0
84
,60
3$
2,7
01
,49
0$
2,5
48
,07
6$
2,6
46
,00
5$
Sou
rce:
A
nn
ual
Fin
anci
al S
tate
men
ts
133

STATISTICAL SECTION (UNAUDITED)
SCHEDULE OF
DEBT CAPACITY

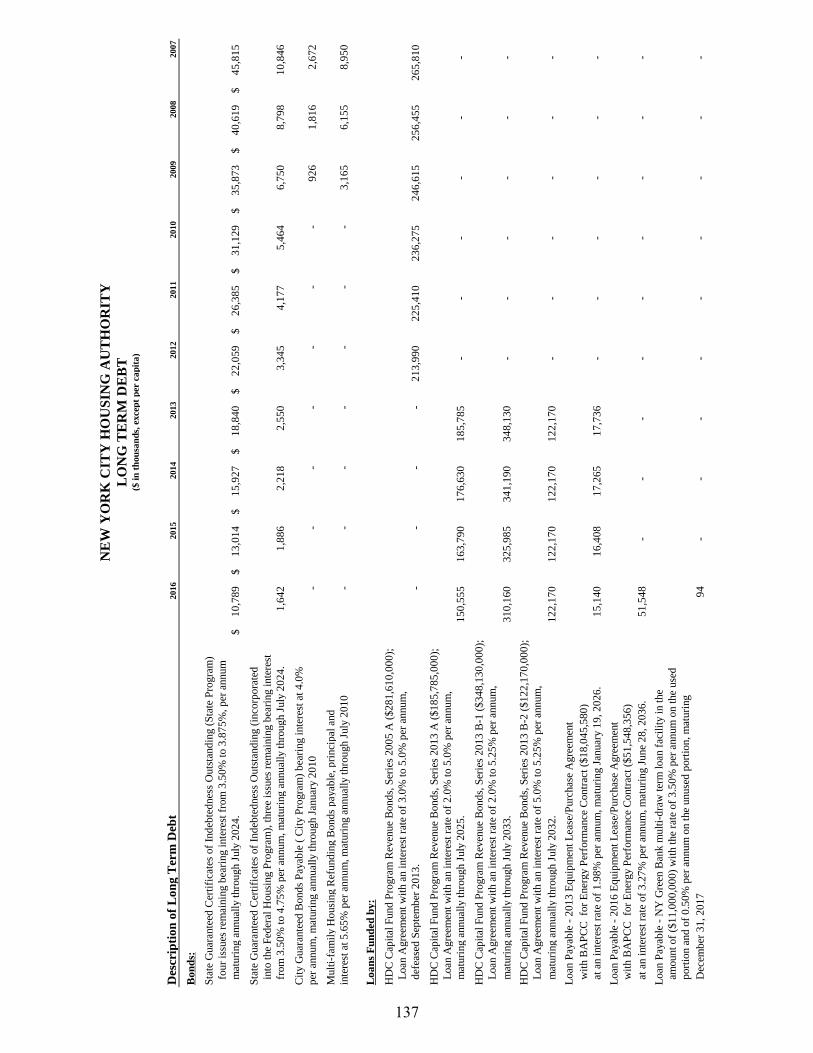
NE
W Y
OR
K C
ITY
HO
US
ING
AU
TH
OR
ITY
LO
NG
TE
RM
DE
BT
($ i
n t
hou
san
ds,
exce
pt
per
ca
pit
a)
Des
crip
tio
n o
f L
on
g T
erm
Deb
t2016
2015
2014
2013
2012
2011
2010
2009
2008
2007
Bo
nd
s:
Sta
te G
uar
ante
ed C
erti
fica
tes
of
Ind
ebte
dnes
s O
uts
tand
ing (
Sta
te P
rogra
m)
fo
ur
issu
es r
emai
nin
g b
eari
ng i
nte
rest
fro
m 3
.50
% t
o 3
.87
5%
, p
er a
nnum
m
aturi
ng a
nnual
ly t
hro
ugh J
uly
20
24
.1
0,7
89
$
13
,01
4$
15
,92
7$
18
,84
0$
22
,05
9$
26
,38
5$
31
,12
9$
35
,87
3$
40
,61
9$
45
,81
5$
Sta
te G
uar
ante
ed C
erti
fica
tes
of
Ind
ebte
dnes
s O
uts
tand
ing (
inco
rpora
ted
in
to t
he
Fed
eral
Housi
ng P
rogra
m),
thre
e is
sues
rem
ainin
g b
eari
ng i
nte
rest
fr
om
3.5
0%
to 4
.75
% p
er a
nnum
, m
aturi
ng a
nnual
ly t
hro
ugh J
uly
20
24
.1
,64
2
1,8
86
2,2
18
2,5
50
3,3
45
4,1
77
5,4
64
6,7
50
8,7
98
10
,84
6
Cit
y G
uar
ante
ed B
ond
s P
ayab
le (
Cit
y P
rogra
m)
bea
ring i
nte
rest
at
4.0
%
per
annum
, m
aturi
ng a
nnual
ly t
hro
ugh J
anuar
y 2
01
0-
-
-
-
-
-
-
92
6
1,8
16
2,6
72
Mult
i-fa
mil
y H
ousi
ng R
efund
ing B
ond
s p
ayab
le, p
rinci
pal
and
inte
rest
at
5.6
5%
per
annum
, m
aturi
ng a
nnual
ly t
hro
ugh J
uly
20
10
-
-
-
-
-
-
-
3,1
65
6,1
55
8,9
50
Lo
an
s F
un
ded
by
:
HD
C C
apit
al F
und
Pro
gra
m R
even
ue
Bond
s, S
erie
s 2
00
5 A
($
28
1,6
10
,00
0);
L
oan
Agre
emen
t w
ith a
n i
nte
rest
rat
e of
3.0
% t
o 5
.0%
per
annum
,
d
efea
sed
Sep
tem
ber
20
13
.-
-
-
-
21
3,9
90
22
5,4
10
23
6,2
75
24
6,6
15
25
6,4
55
26
5,8
10
HD
C C
apit
al F
und
Pro
gra
m R
even
ue
Bond
s, S
erie
s 2
01
3 A
($
18
5,7
85
,00
0);
L
oan
Agre
emen
t w
ith a
n i
nte
rest
rat
e of
2.0
% t
o 5
.0%
per
annum
,
m
aturi
ng a
nnual
ly t
hro
ugh J
uly
20
25
.1
50
,55
5
16
3,7
90
17
6,6
30
18
5,7
85
-
-
-
-
-
-
HD
C C
apit
al F
und
Pro
gra
m R
even
ue
Bond
s, S
erie
s 2
01
3 B
-1 (
$3
48
,13
0,0
00
);
L
oan
Agre
emen
t w
ith a
n i
nte
rest
rat
e of
2.0
% t
o 5
.25
% p
er a
nnum
,
m
aturi
ng a
nnual
ly t
hro
ugh J
uly
20
33
.3
10
,16
0
32
5,9
85
34
1,1
90
34
8,1
30
-
-
-
-
-
-
HD
C C
apit
al F
und
Pro
gra
m R
even
ue
Bond
s, S
erie
s 2
01
3 B
-2 (
$1
22
,17
0,0
00
);
L
oan
Agre
emen
t w
ith a
n i
nte
rest
rat
e of
5.0
% t
o 5
.25
% p
er a
nnum
,
m
aturi
ng a
nnual
ly t
hro
ugh J
uly
20
32
.1
22
,17
0
12
2,1
70
12
2,1
70
12
2,1
70
-
-
-
-
-
-
Loan
Pay
able
- 2
01
3 E
quip
men
t L
ease
/Purc
has
e A
gre
emen
t
w
ith B
AP
CC
fo
r E
ner
gy P
erfo
rman
ce C
ontr
act
($1
8,0
45
,58
0)
at
an i
nte
rest
rat
e of
1.9
8%
per
annum
, m
aturi
ng J
anuar
y 1
9, 2
02
6.
15
,14
0
16
,40
8
17
,26
5
17
,73
6
-
-
-
-
-
-
Loan
Pay
able
- 2
01
6 E
quip
men
t L
ease
/Purc
has
e A
gre
emen
t
w
ith B
AP
CC
fo
r E
ner
gy P
erfo
rman
ce C
ontr
act
($5
1,5
48
,35
6)
at
an i
nte
rest
rat
e of
3.2
7%
per
annum
, m
aturi
ng J
une
28
, 2
03
6.
51
,54
8
-
-
-
-
-
-
-
-
-
Loan
Pay
able
- N
Y G
reen
Ban
k m
ult
i-d
raw
ter
m l
oan
fac
ilit
y i
n t
he
am
ount
of
($1
1,0
00
,00
0)
wit
h t
he
rate
of
3.5
0%
per
annum
on t
he
use
d
p
ort
ion a
nd
of
0.5
0%
per
annum
on t
he
unuse
d p
ort
ion, m
aturi
ng
D
ecem
ber
31
, 2
01
79
4
-
-
-
-
-
-
-
-
-
137

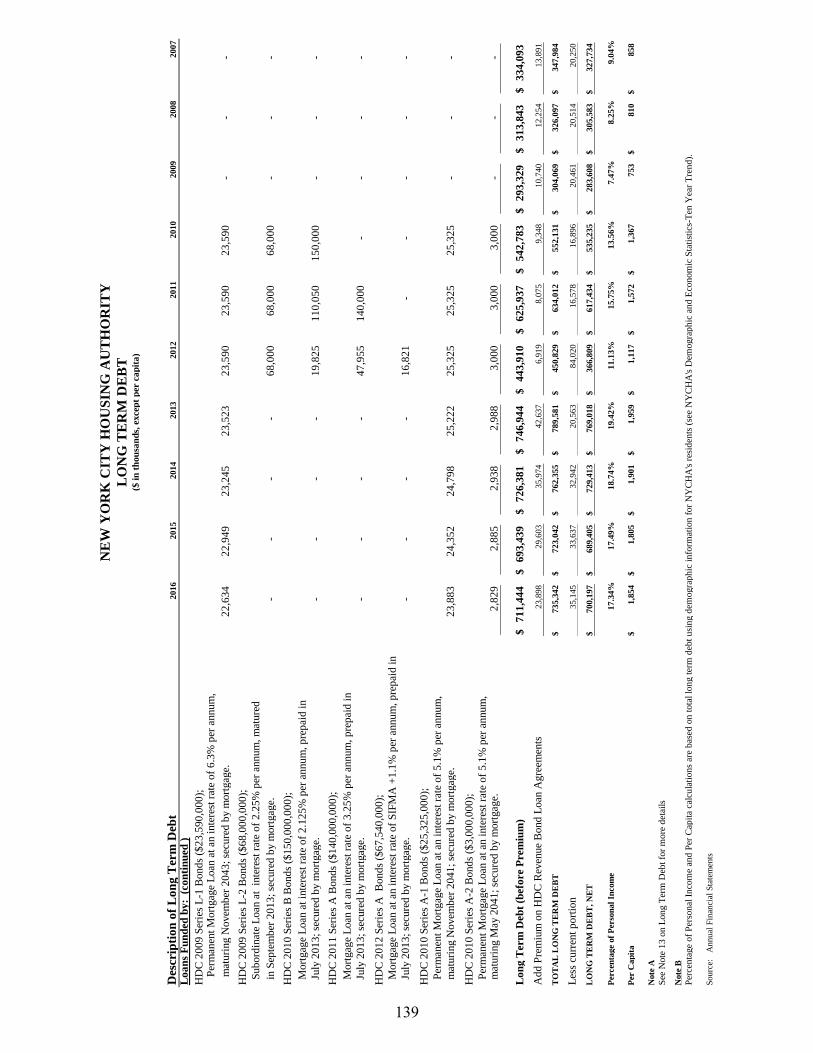
NE
W Y
OR
K C
ITY
HO
US
ING
AU
TH
OR
ITY
LO
NG
TE
RM
DE
BT
($ i
n t
hou
san
ds,
exce
pt
per
ca
pit
a)
Des
crip
tio
n o
f L
on
g T
erm
Deb
t2016
2015
2014
2013
2012
2011
2010
2009
2008
2007
Lo
an
s F
un
ded
by
: (
co
nti
nu
ed
)
HD
C 2
00
9 S
erie
s L
-1 B
ond
s ($
23
,59
0,0
00
); P
erm
anen
t M
ort
gag
e L
oan
at
an i
nte
rest
rat
e of
6.3
% p
er a
nnum
,
m
aturi
ng N
ovem
ber
20
43
; se
cure
d b
y m
ort
gag
e.2
2,6
34
22
,94
9
23
,24
5
23
,52
3
23
,59
0
23
,59
0
23
,59
0
-
-
-
HD
C 2
00
9 S
erie
s L
-2 B
ond
s ($
68
,00
0,0
00
);
S
ub
ord
inat
e L
oan
at
inte
rest
rat
e of
2.2
5%
per
annum
, m
ature
d
in
Sep
tem
ber
20
13
; se
cure
d b
y m
ort
gag
e.-
-
-
-
68
,00
0
68
,00
0
68
,00
0
-
-
-
HD
C 2
01
0 S
erie
s B
Bond
s ($
15
0,0
00
,00
0);
M
ort
gag
e L
oan
at
inte
rest
rat
e of
2.1
25
% p
er a
nnum
, p
rep
aid
in
Ju
ly 2
01
3;
secu
red
by m
ort
gag
e.-
-
-
-
19
,82
5
11
0,0
50
15
0,0
00
-
-
-
HD
C 2
01
1 S
erie
s A
Bond
s ($
14
0,0
00
,00
0);
M
ort
gag
e L
oan
at
an i
nte
rest
rat
e of
3.2
5%
per
annum
, p
rep
aid
in
Ju
ly 2
01
3;
secu
red
by m
ort
gag
e.-
-
-
-
47
,95
5
14
0,0
00
-
-
-
-
HD
C 2
01
2 S
erie
s A
B
ond
s ($
67
,54
0,0
00
);
M
ort
gag
e L
oan
at
an i
nte
rest
rat
e of
SIF
MA
+1
.1%
per
annum
, p
rep
aid
in
Ju
ly 2
01
3;
secu
red
by m
ort
gag
e.-
-
-
-
16
,82
1
-
-
-
-
-
HD
C 2
01
0 S
erie
s A
-1 B
ond
s ($
25
,32
5,0
00
);
P
erm
anen
t M
ort
gag
e L
oan
at
an i
nte
rest
rat
e of
5.1
% p
er a
nnum
,
m
aturi
ng N
ovem
ber
20
41
; se
cure
d b
y m
ort
gag
e.2
3,8
83
24
,35
2
24
,79
8
25
,22
2
25
,32
5
25
,32
5
25
,32
5
-
-
-
HD
C 2
01
0 S
erie
s A
-2 B
ond
s ($
3,0
00
,00
0);
P
erm
anen
t M
ort
gag
e L
oan
at
an i
nte
rest
rat
e of
5.1
% p
er a
nnum
, m
aturi
ng M
ay 2
04
1;
secu
red
by m
ort
gag
e.2
,82
9
2,8
85
2,9
38
2,9
88
3,0
00
3,0
00
3,0
00
-
-
-
Lo
ng
Term
Deb
t (b
efo
re P
rem
ium
)7
11
,44
4$
69
3,4
39
$
72
6,3
81
$
74
6,9
44
$
44
3,9
10
$
62
5,9
37
$
54
2,7
83
$
29
3,3
29
$
31
3,8
43
$
33
4,0
93
$
Ad
d P
rem
ium
on H
DC
Rev
enue
Bond
Loan
Agre
emen
ts23,8
98
29,6
03
35,9
74
42,6
37
6,9
19
8,0
75
9,3
48
10,7
40
12,2
54
13,8
91
TO
TA
L L
ON
G T
ER
M D
EB
T735,3
42
$
723,0
42
$
762,3
55
$
789,5
81
$
450,8
29
$
634,0
12
$
552,1
31
$
304,0
69
$
326,0
97
$
347,9
84
$
Les
s cu
rren
t p
ort
ion
35,1
45
33,6
37
32,9
42
20,5
63
84,0
20
16,5
78
16,8
96
20,4
61
20,5
14
20,2
50
LO
NG
TE
RM
DE
BT
, N
ET
700,1
97
$
689,4
05
$
729,4
13
$
769,0
18
$
366,8
09
$
617,4
34
$
535,2
35
$
283,6
08
$
305,5
83
$
327,7
34
$
Per
cen
tage
of
Per
son
al
Inco
me
17.3
4%
17.4
9%
18.7
4%
19.4
2%
11.1
3%
15.7
5%
13.5
6%
7.4
7%
8.2
5%
9.0
4%
Per
Cap
ita
1,8
54
$
1,8
05
$
1,9
01
$
1,9
59
$
1,1
17
$
1,5
72
$
1,3
67
$
753
810
$
858
$
Note
A
Note
B
Per
cen
tage
of
Per
son
al I
nco
me
and
Per
Cap
ita
calc
ula
tion
s ar
e b
ased
on
tota
l lo
ng t
erm
deb
t u
sin
g d
emogra
ph
ic i
nfo
rmat
ion
for
NY
CH
A's
res
iden
ts (
see
NY
CH
A's
Dem
ogra
ph
ic a
nd
Eco
nom
ic S
tati
stic
s-T
en Y
ear
Tre
nd
).
So
urc
e:
Annual
Fin
anci
al S
tate
men
ts
See
Note
13
on
Lon
g T
erm
Deb
t fo
r m
ore
det
ails
139

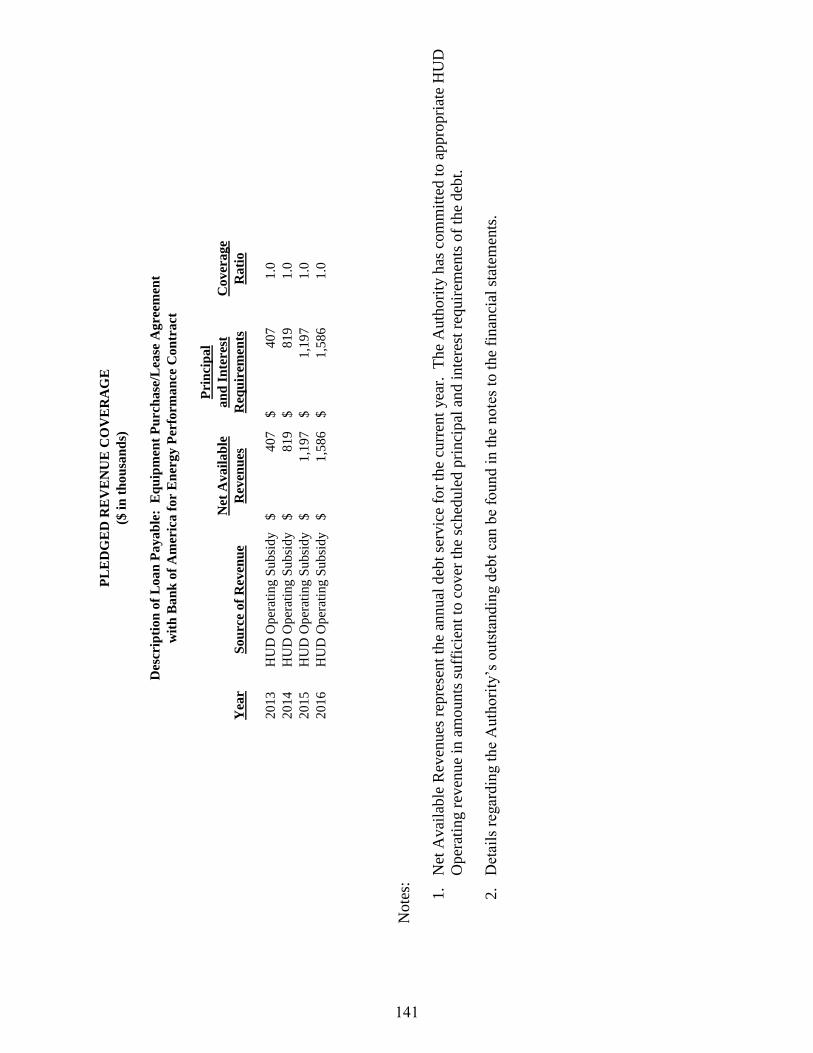
PL
ED
GE
D R
EV
EN
UE
CO
VE
RA
GE
($ i
n t
hou
san
ds)
Pri
nci
pal
Net
Avail
ab
lean
d I
nte
rest
Cover
age
Yea
rS
ou
rce
of
Rev
enu
eR
even
ues
Req
uir
emen
tsR
ati
o
2013
HU
D O
per
atin
g S
ubsi
dy
407
$
407
$
1.0
2014
HU
D O
per
atin
g S
ubsi
dy
819
$
819
$
1.0
2015
HU
D O
per
atin
g S
ubsi
dy
1,1
97
$
1,1
97
$
1.0
2016
HU
D O
per
atin
g S
ubsi
dy
1,5
86
$
1,5
86
$
1.0
Des
crip
tion
of
Loan
Payab
le:
Eq
uip
men
t P
urc
hase
/Lea
se A
gre
emen
t
wit
h B
an
k o
f A
mer
ica f
or
En
ergy P
erfo
rman
ce C
on
tract
Note
s:
1.
Net
Avai
lable
Rev
enues
rep
rese
nt
the
annual
deb
t se
rvic
e fo
r th
e cu
rren
t yea
r.
Th
e A
uth
ori
ty h
as c
om
mit
ted t
o a
ppro
pri
ate
HU
D
Oper
atin
g r
even
ue
in a
mounts
suff
icie
nt
to c
over
the
sched
ule
d p
rinci
pal
an
d i
nte
rest
req
uir
emen
ts o
f th
e deb
t.
2.
Det
ails
reg
ardin
g t
he
Auth
ori
ty’s
outs
tandin
g d
ebt
can b
e fo
und i
n t
he
note
s to
the
finan
cial
sta
tem
ents
.
141

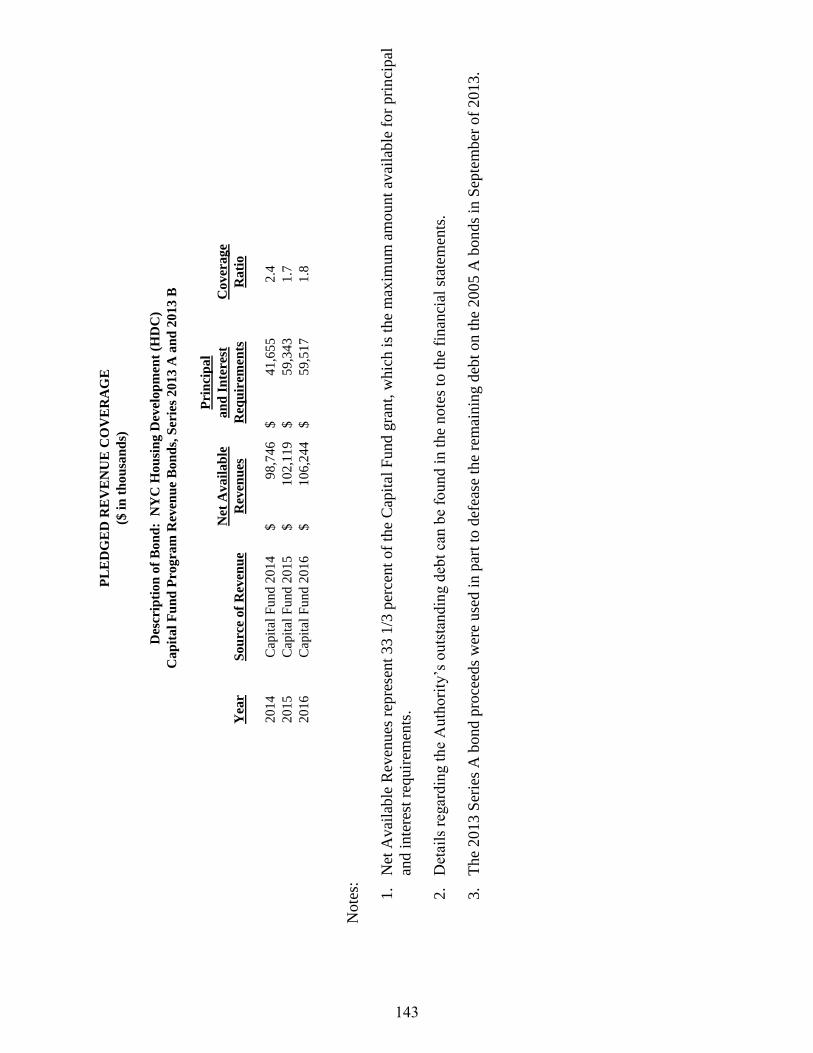
PL
ED
GE
D R
EV
EN
UE
CO
VE
RA
GE
($ i
n t
hou
san
ds)
Pri
nci
pal
Net
Avail
ab
lean
d I
nte
rest
Cover
age
Yea
rS
ou
rce
of
Rev
enu
eR
even
ues
Req
uir
emen
tsR
ati
o
2014
Cap
ital
Fund 2
014
98,7
46
$
41,6
55
$
2.4
2015
Cap
ital
Fund 2
015
102,1
19
$
59,3
43
$
1.7
2016
Cap
ital
Fund 2
016
106,2
44
$
59,5
17
$
1.8
Des
crip
tion
of
Bon
d:
NY
C H
ou
sin
g D
evel
op
men
t (H
DC
)
Cap
ital
Fu
nd
Pro
gra
m R
even
ue
Bon
ds,
Ser
ies
2013 A
an
d 2
013 B
Note
s:
1.
Net
Avai
lable
Rev
enues
rep
rese
nt
33 1
/3 p
erce
nt
of
the
Cap
ital
Fund g
rant,
whic
h i
s th
e m
axim
um
am
ount
avai
lable
fo
r pri
nci
pal
and i
nte
rest
req
uir
emen
ts.
2.
Det
ails
reg
ardin
g t
he
Auth
ori
ty’s
outs
tandin
g d
ebt
can b
e fo
und i
n t
he
note
s to
the
finan
cial
sta
tem
ents
.
3.
The
2013 S
erie
s A
bond p
roce
eds
wer
e use
d i
n p
art
to d
efea
se t
he
rem
ainin
g d
ebt
on t
he
2005
A b
on
ds
in S
epte
mber
of
2013.
143

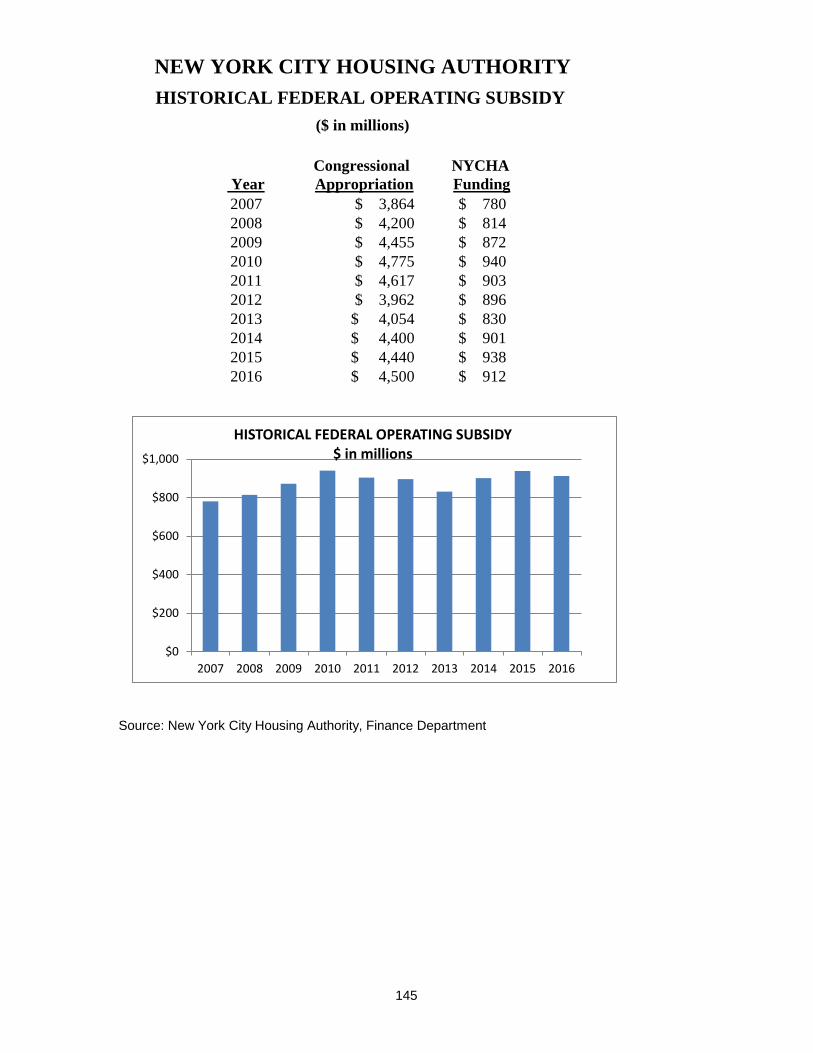
Congressional NYCHA
Year Appropriation Funding
2007 $ 3,864 780$
2008 $ 4,200 814$
2009 $ 4,455 872$
2010 $ 4,775 940$
2011 $ 4,617 903$
2012 $ 3,962 896$
2013 $ 4,054 830$
2014 $ 4,400 901$
2015 $ 4,440 938$
2016 $ 4,500 912$
Source: New York City Housing Authority, Finance Department
NEW YORK CITY HOUSING AUTHORITY
HISTORICAL FEDERAL OPERATING SUBSIDY
($ in millions)
$0
$200
$400
$600
$800
$1,000
2007 2008 2009 2010 2011 2012 2013 2014 2015 2016
HISTORICAL FEDERAL OPERATING SUBSIDY $ in millions
145

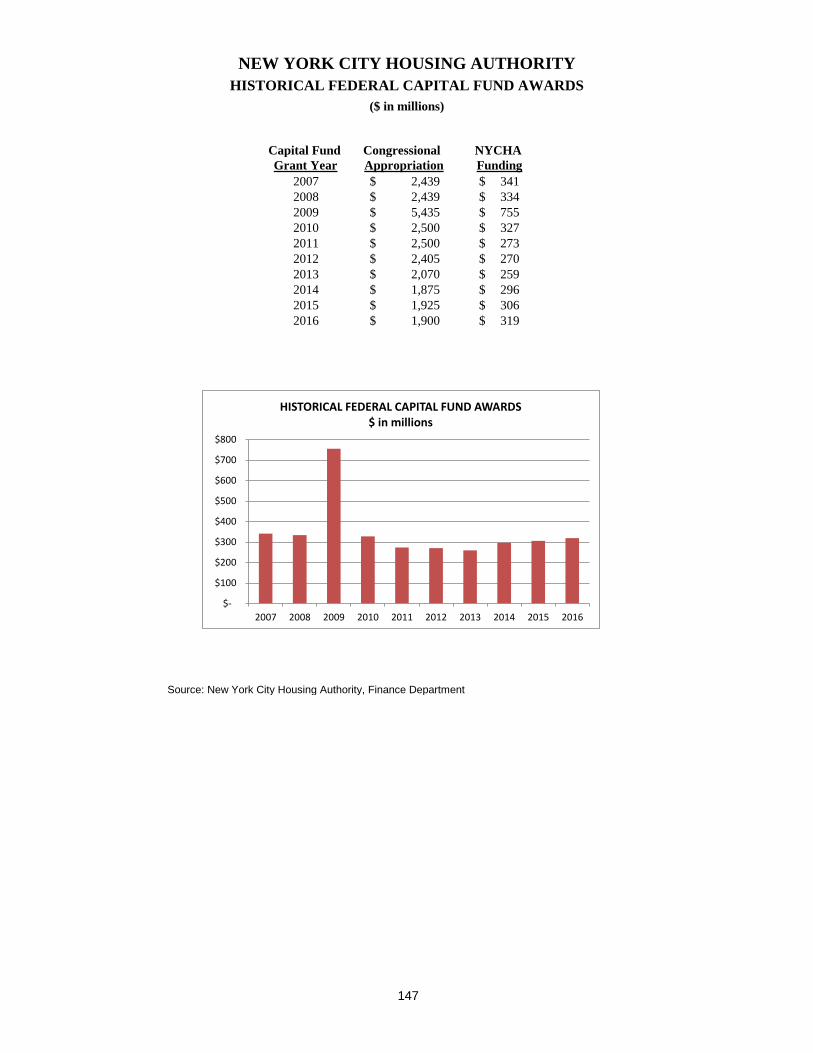
Capital Fund Congressional NYCHA
Grant Year Appropriation Funding
2007 2,439$ 341$
2008 2,439$ 334$
2009 5,435$ 755$
2010 2,500$ 327$
2011 2,500$ 273$
2012 2,405$ 270$
2013 2,070$ 259$
2014 1,875$ 296$
2015 1,925$ 306$
2016 1,900$ 319$
Source: New York City Housing Authority, Finance Department
NEW YORK CITY HOUSING AUTHORITY
HISTORICAL FEDERAL CAPITAL FUND AWARDS
($ in millions)
$-
$100
$200
$300
$400
$500
$600
$700
$800
2007 2008 2009 2010 2011 2012 2013 2014 2015 2016
HISTORICAL FEDERAL CAPITAL FUND AWARDS $ in millions
147

STATISTICAL SECTION (UNAUDITED)
SCHEDULES OF DEMOGRAPHIC
AND ECONOMIC INFORMATION

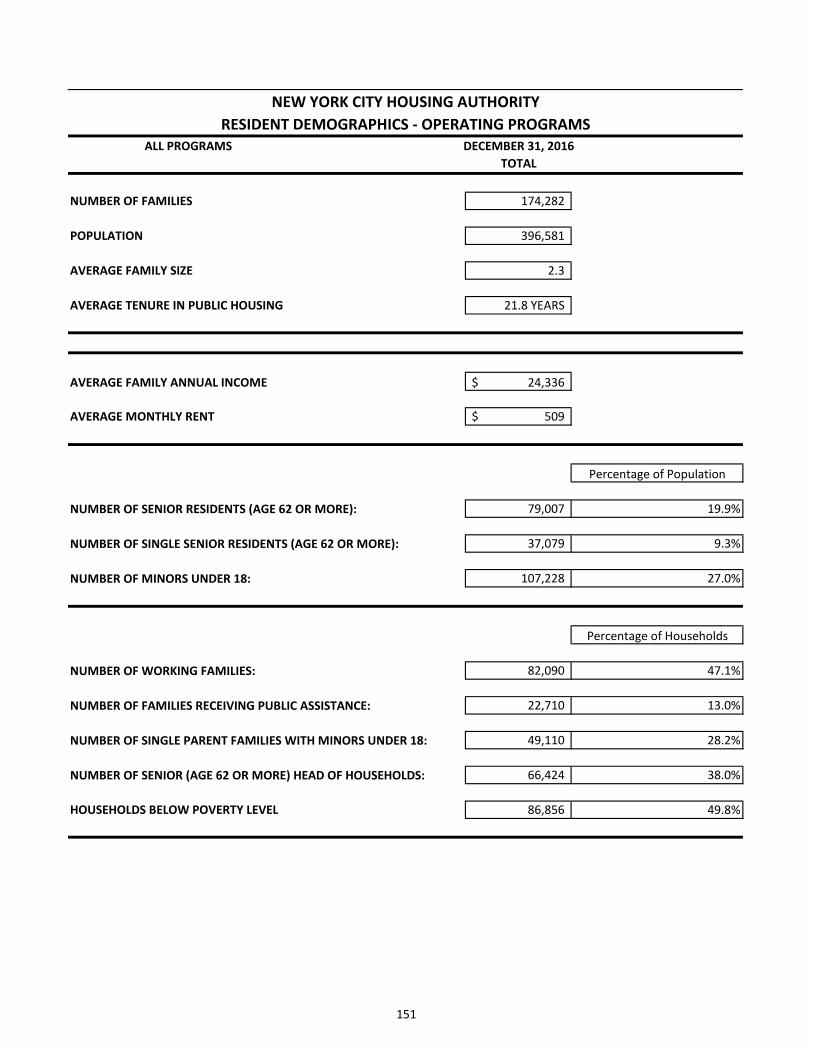
ALL PROGRAMS DECEMBER 31, 2016
TOTAL
NUMBER OF FAMILIES 174,282
POPULATION 396,581
AVERAGE FAMILY SIZE 2.3
AVERAGE TENURE IN PUBLIC HOUSING 21.8 YEARS
AVERAGE FAMILY ANNUAL INCOME 24,336$
AVERAGE MONTHLY RENT 509$
Percentage of Population
NUMBER OF SENIOR RESIDENTS (AGE 62 OR MORE): 79,007 19.9%
NUMBER OF SINGLE SENIOR RESIDENTS (AGE 62 OR MORE): 37,079 9.3%
NUMBER OF MINORS UNDER 18: 107,228 27.0%
Percentage of Households
NUMBER OF WORKING FAMILIES: 82,090 47.1%
NUMBER OF FAMILIES RECEIVING PUBLIC ASSISTANCE: 22,710 13.0%
NUMBER OF SINGLE PARENT FAMILIES WITH MINORS UNDER 18: 49,110 28.2%
NUMBER OF SENIOR (AGE 62 OR MORE) HEAD OF HOUSEHOLDS: 66,424 38.0%
HOUSEHOLDS BELOW POVERTY LEVEL 86,856 49.8%
NEW YORK CITY HOUSING AUTHORITY
RESIDENT DEMOGRAPHICS - OPERATING PROGRAMS
151

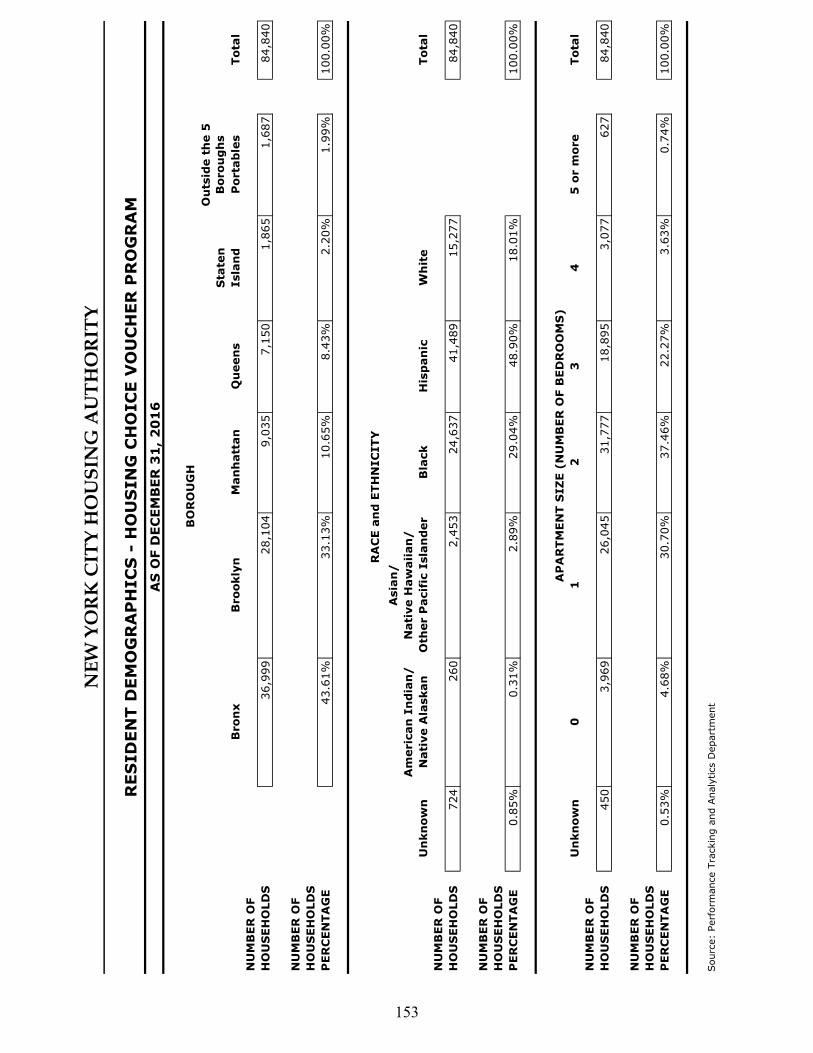
RES
ID
EN
T D
EM
OG
RA
PH
IC
S -
HO
US
IN
G C
HO
IC
E V
OU
CH
ER
PR
OG
RA
M
AS
OF D
EC
EM
BER
31
, 2
01
6
BO
RO
UG
H
Sta
ten
Ou
tsid
e t
he 5
Borou
gh
s
B
ron
xB
rookly
nM
an
hatt
an
Qu
een
sIsla
nd
Porta
ble
sTota
l
NU
MB
ER
OF
HO
US
EH
OLD
S
36,9
99
28,1
04
9,0
35
7,1
50
1,8
65
1,6
87
84,8
40
NU
MB
ER
OF
HO
US
EH
OLD
S
PER
CEN
TA
GE
43.6
1%
33.1
3%
10.6
5%
8.4
3%
2.2
0%
1.9
9%
100.0
0%
Asia
n/
Am
eric
an
In
dia
n/
Nati
ve H
aw
aii
an
/
Un
kn
ow
nN
ati
ve A
laskan
Oth
er P
acif
ic I
sla
nd
er
Bla
ck
His
pan
icW
hit
eTota
l
NU
MB
ER
OF
HO
US
EH
OLD
S724
260
2,4
53
24,6
37
41,4
89
15,2
77
84,8
40
NU
MB
ER
OF
HO
US
EH
OLD
S
PER
CEN
TA
GE
0.8
5%
0.3
1%
2.8
9%
29.0
4%
48.9
0%
18.0
1%
100.0
0%
AP
AR
TM
EN
T S
IZ
E (
NU
MB
ER
OF B
ED
RO
OM
S)
Un
kn
ow
n0
12
34
5 o
r m
ore
Tota
l
NU
MB
ER
OF
HO
US
EH
OLD
S450
3,9
69
26,0
45
31,7
77
18,8
95
3,0
77
627
84,8
40
NU
MB
ER
OF
HO
US
EH
OLD
S
PER
CEN
TA
GE
0.5
3%
4.6
8%
30.7
0%
37.4
6%
22.2
7%
3.6
3%
0.7
4%
100.0
0%
Sourc
e:
Perf
orm
ance T
rackin
g a
nd A
naly
tics D
epart
ment
NE
W Y
OR
K C
ITY
HO
US
ING
AU
TH
OR
ITY
RA
CE a
nd
ETH
NIC
ITY
153

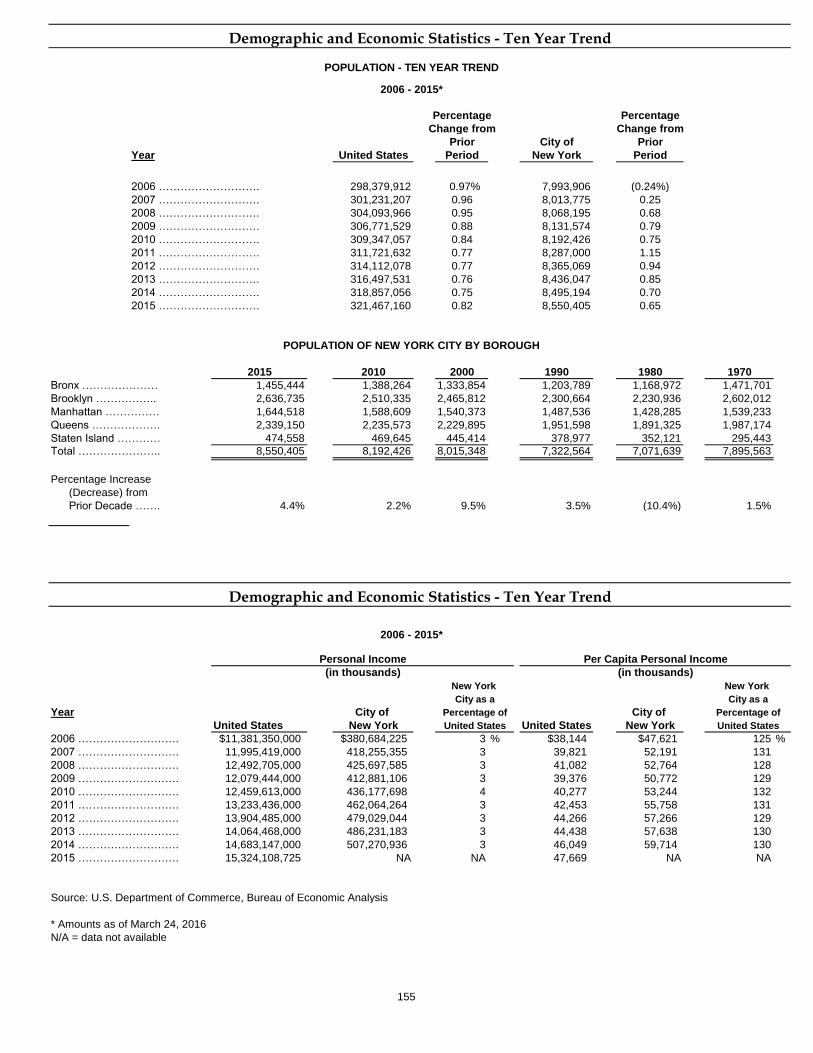
Percentage Percentage
Change from Change from
Prior City of Prior
Year United States Period New York Period
2006 ………………………. 298,379,912 0.97% 7,993,906 (0.24%)
2007 ………………………. 301,231,207 0.96 8,013,775 0.25
2008 ………………………. 304,093,966 0.95 8,068,195 0.68
2009 ………………………. 306,771,529 0.88 8,131,574 0.79
2010 ………………………. 309,347,057 0.84 8,192,426 0.75
2011 ………………………. 311,721,632 0.77 8,287,000 1.15
2012 ………………………. 314,112,078 0.77 8,365,069 0.94
2013 ………………………. 316,497,531 0.76 8,436,047 0.85
2014 ………………………. 318,857,056 0.75 8,495,194 0.70
2015 ………………………. 321,467,160 0.82 8,550,405 0.65
2015 2010 2000 1990 1980 1970
Bronx ………………… 1,455,444 1,388,264 1,333,854 1,203,789 1,168,972 1,471,701
Brooklyn …………….. 2,636,735 2,510,335 2,465,812 2,300,664 2,230,936 2,602,012
Manhattan …………… 1,644,518 1,588,609 1,540,373 1,487,536 1,428,285 1,539,233
Queens ………………. 2,339,150 2,235,573 2,229,895 1,951,598 1,891,325 1,987,174
Staten Island ………… 474,558 469,645 445,414 378,977 352,121 295,443
Total ………………….. 8,550,405 8,192,426 8,015,348 7,322,564 7,071,639 7,895,563
Percentage Increase
(Decrease) from
Prior Decade ……. 4.4% 2.2% 9.5% 3.5% (10.4%) 1.5%
Year City of City of
United States New York United States New York
2006 ………………………. $11,381,350,000 $380,684,225 3 % $38,144 $47,621 125 %
2007 ………………………. 11,995,419,000 418,255,355 3 39,821 52,191 131
2008 ………………………. 12,492,705,000 425,697,585 3 41,082 52,764 128
2009 ………………………. 12,079,444,000 412,881,106 3 39,376 50,772 129
2010 ………………………. 12,459,613,000 436,177,698 4 40,277 53,244 132
2011 ………………………. 13,233,436,000 462,064,264 3 42,453 55,758 131
2012 ………………………. 13,904,485,000 479,029,044 3 44,266 57,266 129
2013 ………………………. 14,064,468,000 486,231,183 3 44,438 57,638 130
2014 ………………………. 14,683,147,000 507,270,936 3 46,049 59,714 130
2015 ………………………. 15,324,108,725 NA NA 47,669 NA NA
Source: U.S. Department of Commerce, Bureau of Economic Analysis
* Amounts as of March 24, 2016
N/A = data not available
Demographic and Economic Statistics - Ten Year Trend
New York
City as a
Percentage of
Demographic and Economic Statistics - Ten Year Trend
POPULATION OF NEW YORK CITY BY BOROUGH
POPULATION - TEN YEAR TREND
2006 - 2015*
United States
2006 - 2015*
Personal Income
(in thousands)
New York
City as a
Percentage of
United States
Per Capita Personal Income
(in thousands)
155

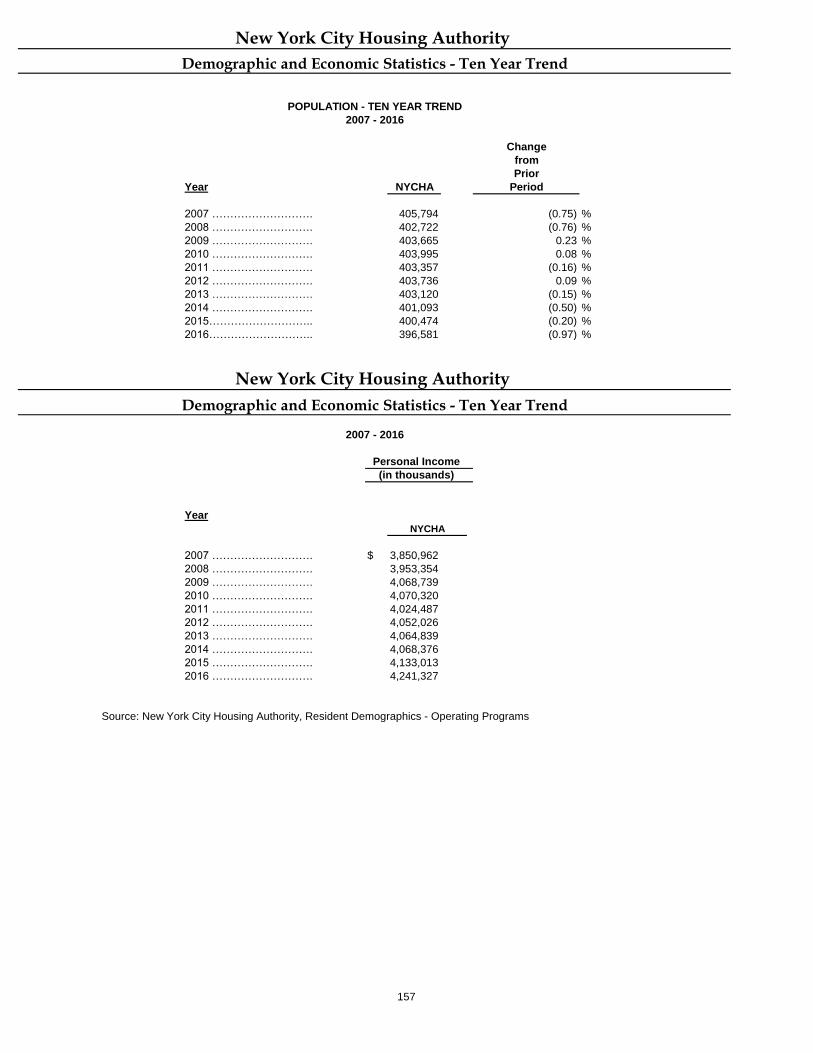
Change
from
Prior
Year NYCHA Period
2007 ………………………. 405,794 (0.75) %
2008 ………………………. 402,722 (0.76) %
2009 ………………………. 403,665 0.23 %
2010 ………………………. 403,995 0.08 %
2011 ………………………. 403,357 (0.16) %
2012 ………………………. 403,736 0.09 %
2013 ………………………. 403,120 (0.15) %
2014 ………………………. 401,093 (0.50) %
2015……………………….. 400,474 (0.20) %
2016……………………….. 396,581 (0.97) %
Year
2007 ………………………. $ 3,850,962
2008 ………………………. 3,953,354
2009 ………………………. 4,068,739
2010 ………………………. 4,070,320
2011 ………………………. 4,024,487
2012 ………………………. 4,052,026
2013 ………………………. 4,064,839
2014 ………………………. 4,068,376
2015 ………………………. 4,133,013
2016 ………………………. 4,241,327
Source: New York City Housing Authority, Resident Demographics - Operating Programs
Demographic and Economic Statistics - Ten Year Trend
New York City Housing Authority
Demographic and Economic Statistics - Ten Year Trend
NYCHA
New York City Housing Authority
2007 - 2016
2007 - 2016
POPULATION - TEN YEAR TREND
Personal Income
(in thousands)
157

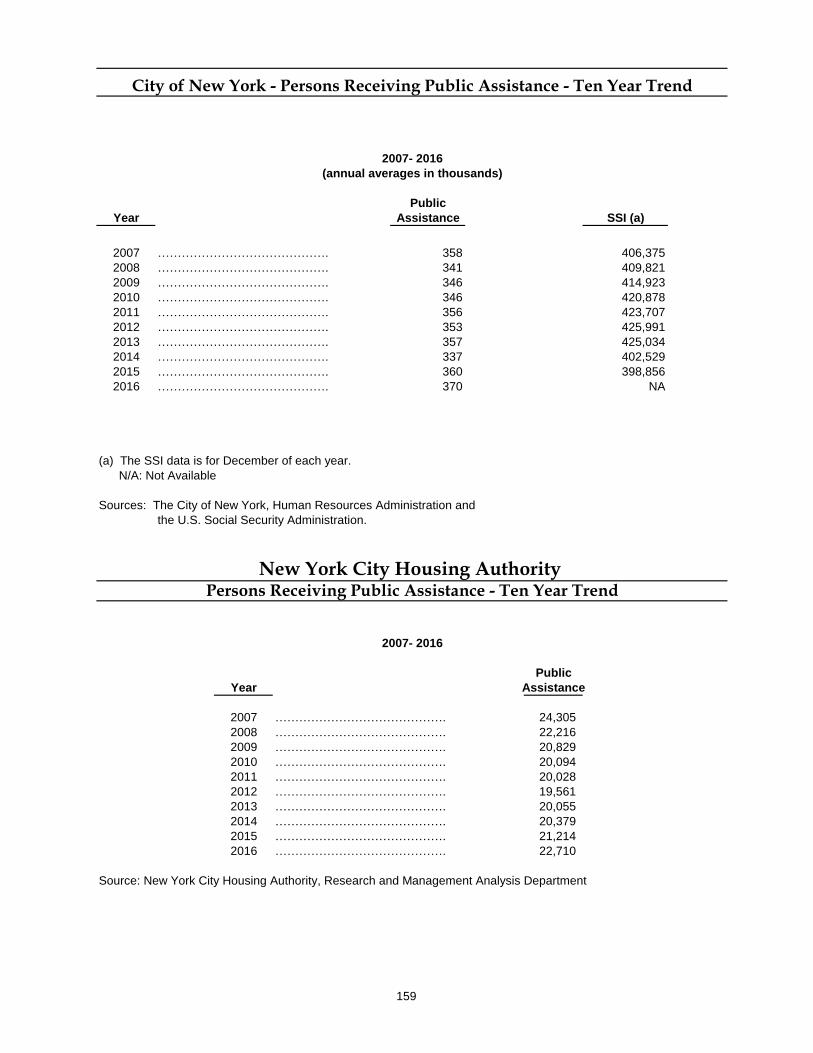
Public
Year Assistance SSI (a)
2007 ……………………………………. 358 406,375
2008 ……………………………………. 341 409,821
2009 ……………………………………. 346 414,923
2010 ……………………………………. 346 420,878
2011 ……………………………………. 356 423,707
2012 ……………………………………. 353 425,991
2013 ……………………………………. 357 425,034
2014 ……………………………………. 337 402,529
2015 ……………………………………. 360 398,856
2016 ……………………………………. 370 NA
(a) The SSI data is for December of each year.
N/A: Not Available
Sources: The City of New York, Human Resources Administration and
the U.S. Social Security Administration.
Public
Year Assistance
2007 ……………………………………. 24,305
2008 ……………………………………. 22,216
2009 ……………………………………. 20,829
2010 ……………………………………. 20,094
2011 ……………………………………. 20,028
2012 ……………………………………. 19,561
2013 ……………………………………. 20,055
2014 ……………………………………. 20,379
2015 ……………………………………. 21,214
2016 ……………………………………. 22,710
Source: New York City Housing Authority, Research and Management Analysis Department
City of New York - Persons Receiving Public Assistance - Ten Year Trend
2007- 2016
(annual averages in thousands)
2007- 2016
Persons Receiving Public Assistance - Ten Year Trend
New York City Housing Authority
159

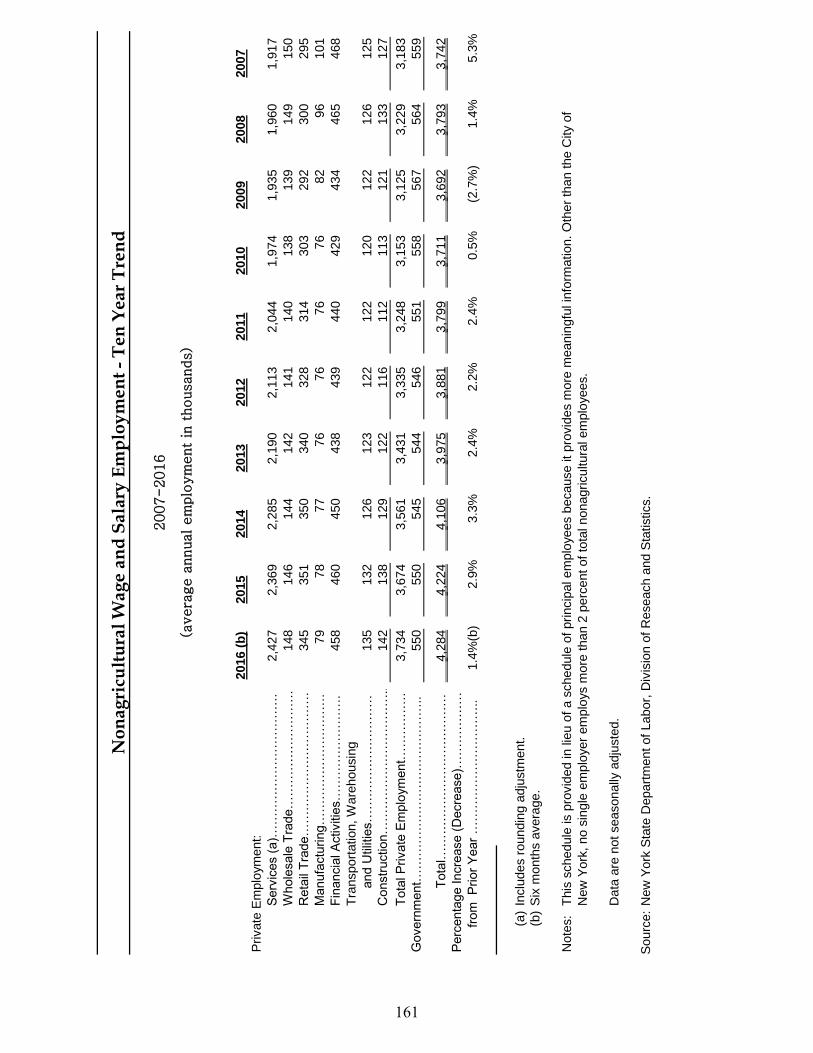
2016 (
b)
2015
2014
2013
2012
2011
2010
2009
2008
2007
Pri
vate
Em
plo
ym
ent:
Serv
ices (
a)…
……
……
……
……
……
.2,4
27
2,3
69
2,2
85
2,1
90
2,1
13
2,0
44
1,9
74
1,9
35
1,9
60
1,9
17
Whole
sale
Tra
de…
……
……
……
……
.148
146
144
142
141
140
138
139
149
150
Reta
il T
rade…
……
……
……
……
……
.345
351
350
340
328
314
303
292
300
295
Manufa
ctu
ring…
……
……
……
……
….
79
78
77
76
76
76
76
82
96
101
Fin
ancia
l A
ctivitie
s…
……
……
……
….
458
460
450
438
439
440
429
434
465
468
Tra
nsport
ation, W
are
housin
g
a
nd U
tilit
ies…
……
……
……
……
…135
132
126
123
122
122
120
122
126
125
Constr
uction…
……
……
……
……
……
..142
138
129
122
116
112
113
121
133
127
Tota
l P
rivate
Em
plo
ym
ent…
……
……
.3,7
34
3,6
74
3,5
61
3,4
31
3,3
35
3,2
48
3,1
53
3,1
25
3,2
29
3,1
83
Govern
ment…
……
……
……
……
……
……
…..
550
550
545
544
546
551
558
567
564
559
T
ota
l……
……
……
……
……
……
…4,2
84
4,2
24
4,1
06
3,9
75
3,8
81
3,7
99
3,7
11
3,6
92
3,7
93
3,7
42
Perc
enta
ge Incre
ase (
Decre
ase)…
……
……
…
f
rom
P
rior
Year
……
……
……
……
……
..1.4
%(b
)2.9
%3.3
%2.4
%2.2
%2.4
%0.5
%(2
.7%
)1.4
%5.3
%
(a)
Inclu
des r
oundin
g a
dju
stm
ent.
(b)
Six
month
s a
vera
ge.
Note
s:
This
schedule
is p
rovid
ed in lie
u o
f a s
chedule
of
pri
ncip
al em
plo
yees b
ecause it pro
vid
es m
ore
meanin
gfu
l in
form
ation. O
ther
than the C
ity o
f
New
York
, no s
ingle
em
plo
yer
em
plo
ys m
ore
than 2
perc
ent of
tota
l nonagri
cultura
l em
plo
yees.
Data
are
not seasonally
adju
ste
d.
Sourc
e:
New
York
Sta
te D
epart
ment of
Labor,
Div
isio
n o
f R
eseach a
nd S
tatistics.
(avera
ge a
nnual em
plo
ym
ent
in t
housands)
No
na
gri
cult
ura
l W
ag
e a
nd
Sa
lary
Em
plo
ym
en
t -
Ten
Year
Tre
nd
2007-2016
161

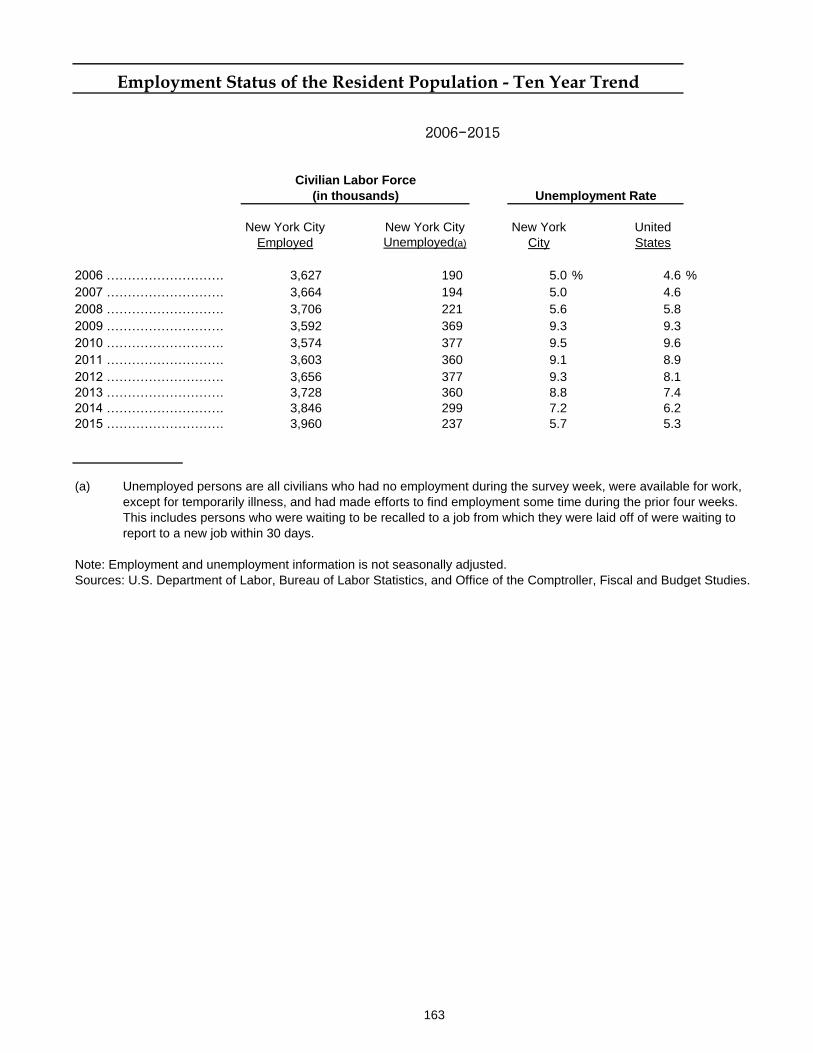
New York City New York City New York United
Employed Unemployed(a) City States
2006 ………………………. 3,627 190 5.0 % 4.6 %
2007 ………………………. 3,664 194 5.0 4.6
2008 ………………………. 3,706 221 5.6 5.8
2009 ………………………. 3,592 369 9.3 9.3
2010 ………………………. 3,574 377 9.5 9.6
2011 ………………………. 3,603 360 9.1 8.9
2012 ………………………. 3,656 377 9.3 8.1
2013 ………………………. 3,728 360 8.8 7.4
2014 ………………………. 3,846 299 7.2 6.2
2015 ………………………. 3,960 237 5.7 5.3
(a) Unemployed persons are all civilians who had no employment during the survey week, were available for work,
except for temporarily illness, and had made efforts to find employment some time during the prior four weeks.
This includes persons who were waiting to be recalled to a job from which they were laid off of were waiting to
report to a new job within 30 days.
Note: Employment and unemployment information is not seasonally adjusted.
Sources: U.S. Department of Labor, Bureau of Labor Statistics, and Office of the Comptroller, Fiscal and Budget Studies.
Employment Status of the Resident Population - Ten Year Trend
Civilian Labor Force
2006-2015
(in thousands) Unemployment Rate
163

STATISTICAL SECTION (UNAUDITED)
SCHEDULES OF
OPERATING INFORMATION

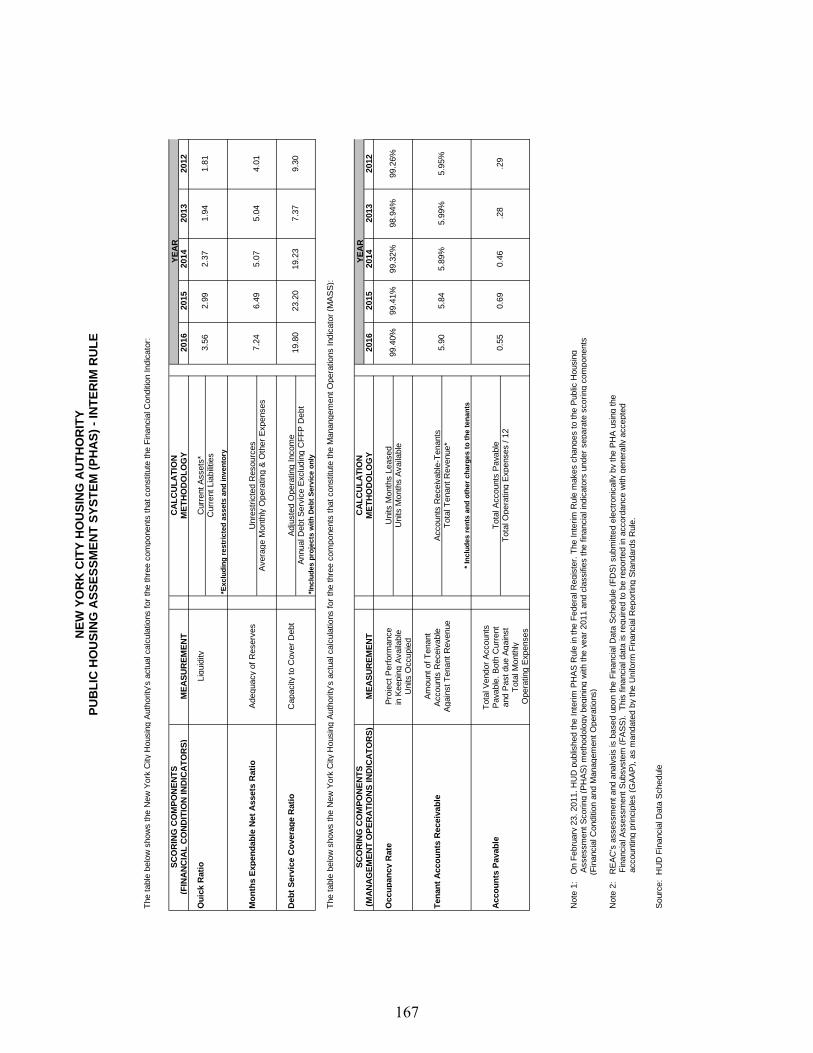
The t
able
belo
w s
how
s t
he N
ew
York
City H
ousin
g A
uth
ority
's a
ctu
al calc
ula
tions f
or
the t
hre
e c
om
ponents
that
constitu
te t
he F
inancia
l C
onditio
n I
ndic
ato
r:
SC
OR
ING
CO
MP
ON
EN
TS
CA
LC
UL
AT
ION
(FIN
AN
CIA
L C
ON
DIT
ION
IN
DIC
AT
OR
S)
ME
AS
UR
EM
EN
TM
ET
HO
DO
LO
GY
2016
2015
2014
2013
2012
Qu
ick R
ati
oLiq
uid
ity
Curr
ent
Assets
*C
urr
ent
Lia
bili
ties
*Ex
clu
din
g r
es
tric
ted
as
se
ts a
nd
in
ve
nto
ry
Mo
nth
s E
xp
en
dab
le N
et
Assets
Rati
oA
deq
uacy o
f R
eserv
es
Unre
str
icte
d R
esourc
es
Avera
ge M
onth
ly O
pera
ting
& O
ther
Expenses
Deb
t S
erv
ice C
overa
ge R
ati
oC
apacity t
o C
over
Debt
Adju
ste
d O
pera
ting
Incom
eA
nnual D
ebt
Serv
ice E
xclu
din
g C
FF
P D
ebt
*In
clu
de
s p
roje
cts
wit
h D
eb
t S
erv
ice
on
ly
The t
able
belo
w s
how
s t
he N
ew
York
City H
ousin
g A
uth
ority
's a
ctu
al calc
ula
tions f
or
the t
hre
e c
om
ponents
that
constitu
te t
he M
anang
em
ent
Opera
tions I
ndic
ato
r (M
AS
S):
SC
OR
ING
CO
MP
ON
EN
TS
CA
LC
UL
AT
ION
(MA
NA
GE
ME
NT
OP
ER
AT
ION
S I
ND
ICA
TO
RS
)M
EA
SU
RE
ME
NT
ME
TH
OD
OL
OG
Y2016
2015
2014
2013
2012
Occu
pan
cy R
ate
Pro
ject
Perf
orm
ance
Units M
onth
s L
eased
in K
eepin
g A
vaila
ble
U
nits M
onth
s A
vaila
ble
Units O
ccupie
d
Am
ount
of
Tenant
Ten
an
t A
cco
un
ts R
eceiv
ab
leA
ccounts
Receiv
able
A
ccounts
Receiv
able
-Tenants
Ag
ain
st
Tenant
Revenue
Tota
l T
enant
Revenue*
* In
clu
de
s r
en
ts a
nd
oth
er
ch
arg
es
to
th
e t
en
an
ts
Tota
l V
endor
Accounts
A
cco
un
ts P
ayab
leP
ayable
, B
oth
Curr
ent
Tota
l A
ccounts
Payable
and P
ast
due A
gain
st
Tota
l O
pera
ting
Expenses /
12
Tota
l M
onth
ly
Opera
ting
Expenses
Note
1:
O
n F
ebru
ary
23,
2011,
HU
D p
ublis
hed t
he I
nte
rim
PH
AS
Rule
in t
he F
edera
l R
eg
iste
r. T
he I
nte
rim
Rule
makes c
hang
es t
o t
he P
ublic
Housin
g
A
ssessm
ent
Scoring
(P
HA
S)
meth
odolo
gy b
eg
inin
g w
ith t
he y
ear
2011 a
nd c
lassifie
s t
he f
inancia
l in
dic
ato
rs u
nder
separa
te s
coring
com
ponents
(F
inancia
l C
onditio
n a
nd M
anag
em
ent
Opera
tions)
Note
2:
R
EA
C's
assessm
ent
and a
naly
sis
is b
ased u
pon t
he F
inancia
l D
ata
Schedule
(F
DS
) subm
itte
d e
lectr
onic
ally
by t
he P
HA
usin
g t
he
F
inancia
l A
ssessm
ent
Subsyste
m (
FA
SS
).
This
fin
ancia
l data
is r
eq
uired t
o b
e r
eport
ed in a
ccord
ance w
ith g
enera
lly a
ccepte
d
a
ccounting
princip
les (
GA
AP
), a
s m
andate
d b
y t
he U
niform
Fin
ancia
l R
eport
ing
Sta
ndard
s R
ule
.
Sourc
e:
HU
D F
inancia
l D
ata
Schedule
0.5
5
YE
AR
YE
AR
3.5
6
7.2
4
19.8
0
99.4
0%
5.9
0
99.4
1%
5.8
4
0.6
9
2.9
9
6.4
9
23.2
019.2
3
.28
99.2
6%
5.9
5%
99.3
2%
5.8
9%
98.9
4%
5.9
9%
.29
0.4
6
NE
W Y
OR
K C
ITY
HO
US
ING
AU
TH
OR
ITY
PU
BL
IC H
OU
SIN
G A
SS
ES
SM
EN
T S
YS
TE
M (
PH
AS
) -
INT
ER
IM R
UL
E
5.0
4
1.9
4
7.3
7
1.8
1
4.0
1
9.3
0
2.3
7
5.0
7
167

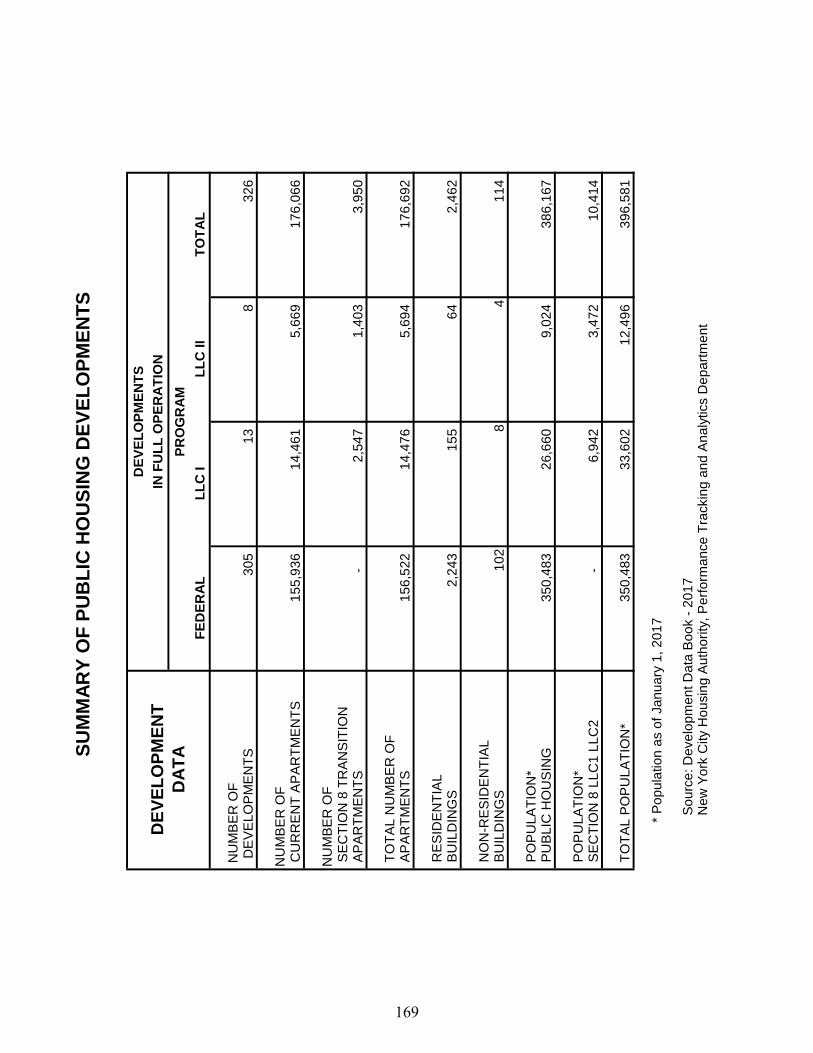
SU
MM
AR
Y O
F P
UB
LIC
HO
US
ING
DE
VE
LO
PM
EN
TS
DE
VE
LO
PM
EN
T
DA
TA
FE
DE
RA
LL
LC
IL
LC
II
TO
TA
L
NU
MB
ER
OF
DE
VE
LO
PM
EN
TS
30
5
13
8
32
6
NU
MB
ER
OF
CU
RR
EN
T A
PA
RT
ME
NT
S1
55
,93
6
14
,46
1
5,6
69
17
6,0
66
NU
MB
ER
OF
SE
CT
ION
8 T
RA
NS
ITIO
NA
PA
RT
ME
NT
S-
2,5
47
1,4
03
3,9
50
TO
TA
L N
UM
BE
R O
F
AP
AR
TM
EN
TS
15
6,5
22
14
,47
6
5,6
94
17
6,6
92
RE
SID
EN
TIA
LB
UIL
DIN
GS
2,2
43
15
5
64
2,4
62
NO
N-R
ES
IDE
NT
IAL
BU
ILD
ING
S1
02
84
11
4
PO
PU
LA
TIO
N*
PU
BL
IC H
OU
SIN
G3
50
,48
3
26
,66
0
9,0
24
38
6,1
67
PO
PU
LA
TIO
N*
SE
CT
ION
8 L
LC
1 L
LC
2-
6,9
42
3,4
72
10
,41
4
TO
TA
L P
OP
UL
AT
ION
*3
50
,48
3
33
,60
2
12
,49
6
39
6,5
81
*
Po
pu
latio
n a
s o
f Ja
nu
ary
1, 2
01
7
S
ou
rce
: D
eve
lop
me
nt D
ata
Bo
ok -
20
17
N
ew
Yo
rk C
ity H
ou
sin
g A
uth
ori
ty, P
erf
orm
an
ce
Tra
ckin
g a
nd
An
aly
tics D
ep
art
me
nt
DE
VE
LO
PM
EN
TS
IN F
UL
L O
PE
RA
TIO
N
PR
OG
RA
M
169

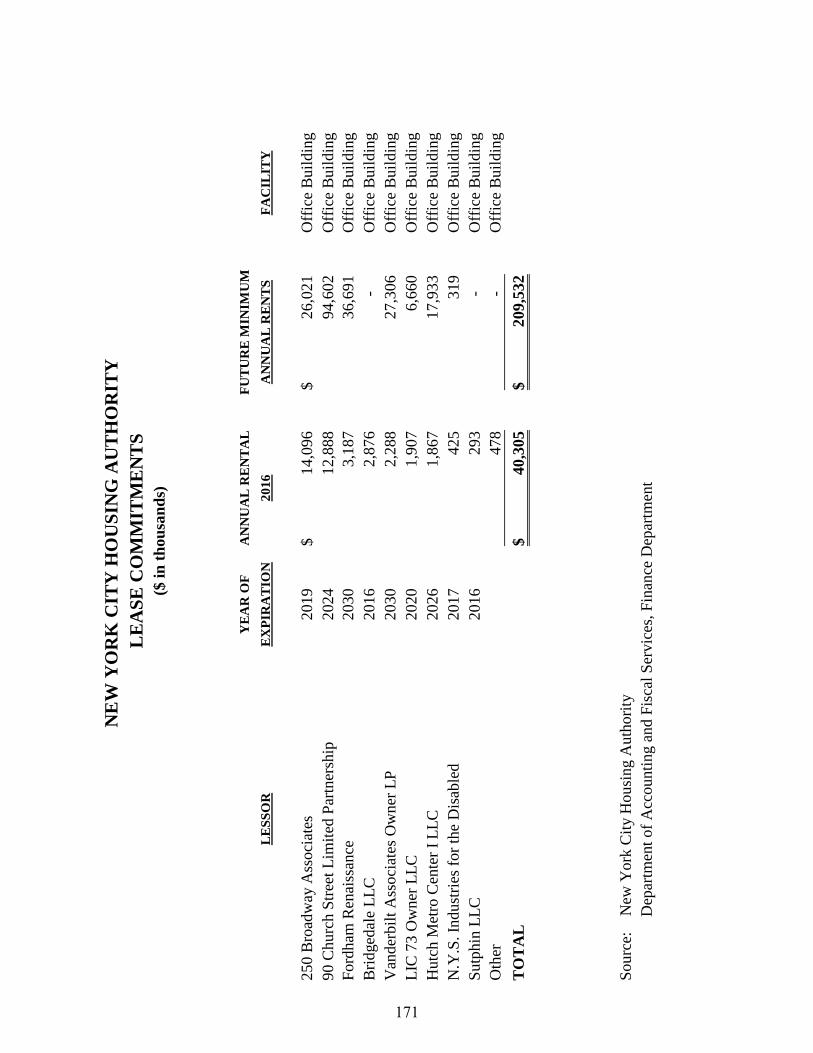
YE
AR
OF
AN
NU
AL
RE
NT
AL
FU
TU
RE
MIN
IMU
M
LE
SS
OR
EX
PIR
AT
ION
20
16
AN
NU
AL
RE
NT
SF
AC
ILIT
Y
250 B
road
way
Ass
oci
ates
2019
14,0
96
$
26,0
21
$
Off
ice
Buil
din
g
90 C
hurc
h S
tree
t L
imit
ed P
artn
ersh
ip2024
12,8
88
94,6
02
Off
ice
Buil
din
g
Fo
rdham
Ren
aiss
ance
2030
3,1
87
36,6
91
Off
ice
Buil
din
g
Bri
dged
ale
LL
C2016
2,8
76
-
Off
ice
Buil
din
g
Van
der
bil
t A
ssoci
ates
Ow
ner
LP
2030
2,2
88
27,3
06
Off
ice
Buil
din
g
LIC
73 O
wner
LL
C2020
1,9
07
6,6
60
Off
ice
Buil
din
g
Hutc
h M
etro
Cen
ter
I L
LC
2026
1,8
67
17,9
33
Off
ice
Buil
din
g
N.Y
.S. In
dust
ries
for
the
Dis
able
d2017
425
319
O
ffic
e B
uil
din
g
Sutp
hin
LL
C2016
293
-
Off
ice
Buil
din
g
Oth
er478
-
Off
ice
Buil
din
g
TO
TA
L40,3
05
$
209,5
32
$
Sourc
e: N
ew Y
ork
Cit
y H
ousi
ng A
uth
ori
ty
D
epar
tmen
t of
Acc
ounti
ng a
nd F
isca
l S
ervic
es, F
inan
ce D
epar
tmen
t
NE
W Y
OR
K C
ITY
HO
US
ING
AU
TH
OR
ITY
LE
AS
E C
OM
MIT
ME
NT
S
($ i
n t
hou
san
ds)
171

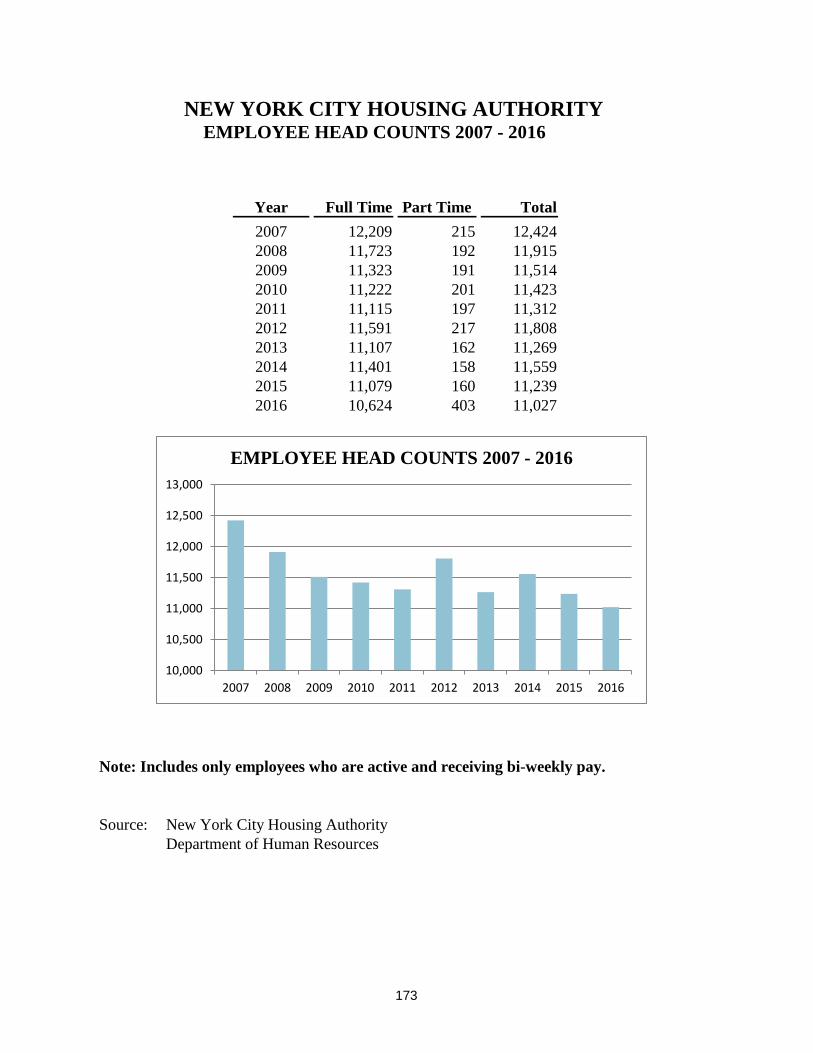
NEW YORK CITY HOUSING AUTHORITY EMPLOYEE HEAD COUNTS 2007 - 2016
Year Full Time Part Time Total
2007 12,209 215 12,424
2008 11,723 192 11,915
2009 11,323 191 11,514
2010 11,222 201 11,423
2011 11,115 197 11,312
2012 11,591 217 11,808
2013 11,107 162 11,269
2014 11,401 158 11,559
2015 11,079 160 11,239
2016 10,624 403 11,027
Note: Includes only employees who are active and receiving bi-weekly pay.
Source: New York City Housing Authority
Department of Human Resources
10,000
10,500
11,000
11,500
12,000
12,500
13,000
2007 2008 2009 2010 2011 2012 2013 2014 2015 2016
EMPLOYEE HEAD COUNTS 2007 - 2016
173