Embed Size (px)
Citation preview

December 2010 E.B. 2010-17
New York
Economic Handbook
2011
Charles H. Dyson School of Applied Economics and Management
College of Agriculture and Life Sciences
Cornell University
Ithaca, NY 14853-7801

It is the Policy of Cornell University actively to
support equality of educational and employment
opportunity. No person shall be denied admission to
any educational program or activity or be denied
employment on the basis of any legally prohibited
discrimination involving, but not limited to, such
factors as race, color, creed, religion, national or
ethnic origin, sex, age or handicap. The University is
committed to the maintenance of affirmative action
programs which will assure the continuation of such
equality of opportunity.
This material is based upon work supported by Smith
Lever funds from the Cooperative State Research,
Education, and Extension Service, U.S. Department of
Agriculture. Any opinions, findings, conclusions, or
recommendations expressed in this publication are those of
the author(s) and do not necessarily reflect the view of the
U.S. Department of Agriculture.
Publication Price Per Copy: $10.00
For additional copies, contact:
Carol Thomson
Charles H. Dyson School of
Applied Economics and Management
106 Warren Hall
Cornell University
Ithaca, New York 14853-7801
E-mail: [email protected]
Phone: 607-255-5464
Fax: 607-255-9984
Or visit: http://dyson.cornell.edu/outreach/

i
Table of Contents
Chapter Topic Author(s)* Page
1 Websites for Economic Information
and Commentary
William Schulze 1-1
2 The Marketing System Kristen Park 2-1
3 Cooperatives Brian Henehan and Todd Schmit 3-1
4 Finance Calum Turvey 4-1
5 Grain and Feed Todd Schmit and William Tomek 5-1
6 Dairy – Markets and Policy Mark Stephenson 6-1
7 Dairy – Farm Management Wayne Knoblauch, George Conneman
and Linda Putnam
7-1
8 Current Labor Issues and Their
Impact on New York Agriculture
Thomas Maloney and Marc Smith 8-1
9 Agriculture and the Environment Antonio Bento 9-1
10 Specialty Crops Miguel Gómez and Bradley Rickard 10-1
____________________ *Faculty or staff in the Charles H. Dyson School of Applied Economics and Management, Cornell University.
This publication contains information pertaining to the general economic situation and New York
agriculture. It is prepared primarily for use by professional agricultural workers in New York State. USDA
reports provide current reference material pertaining to the nation’s agricultural situation. Many of these
reports are available on the internet. Click on “Newsroom” at the following website:
http://www.usda.gov/wps/portal/usdahome
The chapters in this handbook are available in PDF format on the Applied Economics and
Management outreach website:
http://aem.cornell.edu/outreach/publications.htm

ii

W. Schulze Websites for Economic Information and Commentary
Chapter 1. Websites for Economic Information and
Commentary William Schulze, Professor
1. http://rfe.org Resources for Economists
This American Economics Association website has an encyclopedic list of all sorts of web-based
economics sites.
2. http://www.economagic.com/ Economagic -- Economic Times Series Page
Economagic is an excellent site for all kinds of U.S. economic data, including national income
accounts, the Federal Reserve, the Bureau of Labor Statistics and more. The site includes a very
useful graphing function and allows downloads to excel worksheets as well as simple statistical
functions.
3. http://www.econstats.com/ Economic Statistics
EconStats is another site with links to all kinds of US data. It also has links to data for
many other countries.
4. http://www.whitehouse.gov/issues/economy/ Economics Statistics Briefing Room
This is the White House site for overall economics statistics. This also includes links to other
parts of the government.
5. http://www.cbpp.org/ Center on Budget and Policy Priorities
The Center on Budget and Policy Priorities is a non-partisan web site that focuses on economic
policies related to the budget and their effects on low- and moderate-income people.
6. http://www.argmax.com/ ArgMax
This is an excellent site for economic news, data links and analysis.
7. http://www.econlib.org/ Library of Economics and Liberty
The Library of Economics and Liberty web site features articles and links to many books and
other economics related resources.
8. http://www.heritage.org/ Heritage Foundation
The Heritage Foundation comments on economic policy from a conservative viewpoint. This
link takes you to a very useful federal budget calculator that will help you understand what the
federal government spends its money on and where they get the money from.
9. http://www.kowaldesign.com/budget/ Budget Explorer
This site contains a budget explorer which I like because it allows you not only to calculate your
own budget but also links to the various executive branch departments with spending authority,
so you can see exactly where the money is going.
10. http://www.concordcoalition.org/ The Concord Coalition
The Concord Coalition is a non-partisan group advocating a balanced budget. Their site contains
very useful graphs and projections showing what current taxing and spending proposals mean for
the federal budget in the years ahead.
11. http://www.economy.com/dismal/ The Dismal Scientist
This is a very good web site for evaluations of current statistics and policy.

Page 1-2 2011 Outlook Handbook
Websites for Economic Information and Commentary W. Schulze
12. http://www.federalbudget.com/ National Debt Awareness Center
The National Debt Awareness Center has a useful graph providing up to date information on the
size of the national debt and what the Federal Government is spending money on.
13. http://www.ombwatch.org/ OMB Watch
OMB Watch is another web site devoted to information on what is happening to the federal
budget.
14. http://www.brook.edu/default.htm The Brookings Institution
The Brookings Institution publishes lots of good articles on current economic and political
policy.
15. http://www.realtor.org National Assoc. of Realtors
Check this site if you want information on real estate.
16. http://www.census.gov/ U.S. Census Bureau
The U.S. Census Bureau web site provides demographic and population numbers.
17. http://www.briefing.com/Investor/Index.htm Briefing.com
For a more in-depth analysis of stock and bond markets and the factors that influence them,
check out Briefing.com.
18. http://www.imf.org/ International Monetary Fund
The International Monetary Fund is an excellent site for data on all member countries, with a
particular emphasis on balance of payments, exchange rate and financial/monetary data.
19. http://worldbank.org/ The World Bank Group
The World Bank has cross country data on a wide variety of subjects.
20. http://www.undp.org/ United Nations Development Programme
The UNDP has cross country data with a particular focus on measures of human welfare and
poverty.
21. http://www.fao.org/ Food and Agriculture Organization of the UN
The Food and Agriculture Organization of the UN has cross country information on food and
agriculture.
22. http://datacentre2.chass.utoronto.ca/pwt/ Penn World Tables
The Penn World Tables are a useful source for a variety of economic data series not available
from other sources.
23. http://www.bls.gov/fls/ U.S. Department of Labor, Foreign Labor Statistics
The Foreign Labor Statistics program provides international comparisons of hourly compensation
costs; productivity and unit labor costs; labor force, employment and unemployment rates; and
consumer prices. The comparisons relate primarily to the major industrial countries, but other
countries are included in certain measures.
24. http://aem.cornell.edu/people/profiles/schulze.php Professor Schulze’s webpage
Visit my faculty page on the Dyson School website at Cornell University.
K. S. Park The Marketing System
Chapter 2. The Marketing System Kristen S. Park, Extension Associate
Special Topic – Understanding Food Deserts and the Larger Issues of Accessibility and Demand The food production and distribution system in the United States is believed to be one of the most
efficient worldwide. It produces the most inexpensive food to its population when measured by food expenditures as a percent of disposable income. It is also true that many people in the United States go hungry, unable to afford food. At the same time, it is also true that obesity and diet-related diseases are growing and are a major public health dilemma.
In addition to battling hunger and obesity by changing individual behaviors, focus has been
directed toward changing factors that can be influenced by public policy. One such focus has been a focus on “food deserts,” a term used to describe areas or communities with limited access to healthy, nutritious food. But what is a food desert, and what, if any, impact does it have on public health?
The 2008 Farm Bill defines a food desert as, “an area in the United States with limited access to
affordable and nutritious food, particularly an area composed of predominantly lower income neighborhoods and communities.” And Congress directed the United States Department of Agriculture (USDA) to conduct a study to analyze the extent of limited access, identify characteristics and causes of lack of access, and the effects on the population.
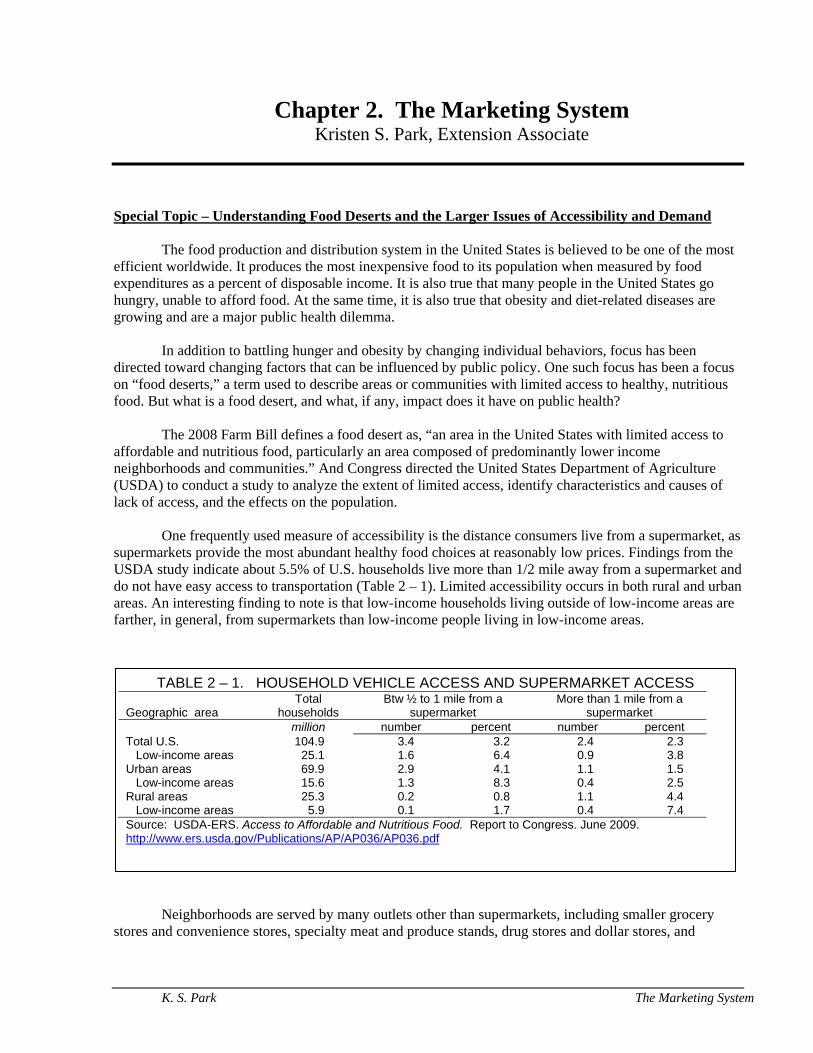
One frequently used measure of accessibility is the distance consumers live from a supermarket, as
supermarkets provide the most abundant healthy food choices at reasonably low prices. Findings from the USDA study indicate about 5.5% of U.S. households live more than 1/2 mile away from a supermarket and do not have easy access to transportation (Table 2 – 1). Limited accessibility occurs in both rural and urban areas. An interesting finding to note is that low-income households living outside of low-income areas are farther, in general, from supermarkets than low-income people living in low-income areas.
Neighborhoods are served by many outlets other than supermarkets, including smaller grocery
stores and convenience stores, specialty meat and produce stands, drug stores and dollar stores, and
TABLE 2 – 1. HOUSEHOLD VEHICLE ACCESS AND SUPERMARKET ACCESS Geographic area
Total households
Btw ½ to 1 mile from a supermarket
More than 1 mile from a supermarket
million number percent number percent Total U.S. 104.9 3.4 3.2 2.4 2.3 Low-income areas 25.1 1.6 6.4 0.9 3.8 Urban areas 69.9 2.9 4.1 1.1 1.5 Low-income areas 15.6 1.3 8.3 0.4 2.5 Rural areas 25.3 0.2 0.8 1.1 4.4 Low-income areas 5.9 0.1 1.7 0.4 7.4 Source: USDA-ERS. Access to Affordable and Nutritious Food. Report to Congress. June 2009. http://www.ers.usda.gov/Publications/AP/AP036/AP036.pdf
Page 2-2 2011 Outlook Handbook
The Marketing System K. S. Park
restaurants and fast food establishments. What may be more interesting when looking at causes of obesity, is easy access and affordability to all (too many) foods.
Does better accessibility to supermarkets, and presumably a healthy food selection, cause healthier
populations? The USDA report conducted a literature review to try to assess this. The literature appears to show a positive impact of better access to healthier foods and increases in these food purchases; however, when researchers try to link this to better health outcomes, such as lower Body Mass Indices (BMIs) and sustainability of better diets, they have been unable to do so. One researcher (Rose et al. 2009) has coined the phrase “food swamps” in describing areas where unhealthy foods are abundant.
Spatial proximity to healthy food is understood to be only one factor of consumer food demand.
Affordability and convenience impact access to food. The demand for foods is impacted by food preparation abilities, food preferences and eating habits, awareness and knowledge about food system attributes, decision-making about access and related family and community dynamics, consumer health, capacities for growing and processing food, and others.
While it is uncertain what the real impacts and solutions are to food deserts, food system players need to be engaged in this area of social need. Actions by the food system can help find solutions by changing supply chain management to get healthy foods into communities of special need; we can work with economic development and city government to develop and/or modify retail formats; we can develop healthy and popular food assortments for ethnic or cultural communities to fit into community retail outlets; and we can help educate consumers and increase their awareness of healthy food choices.
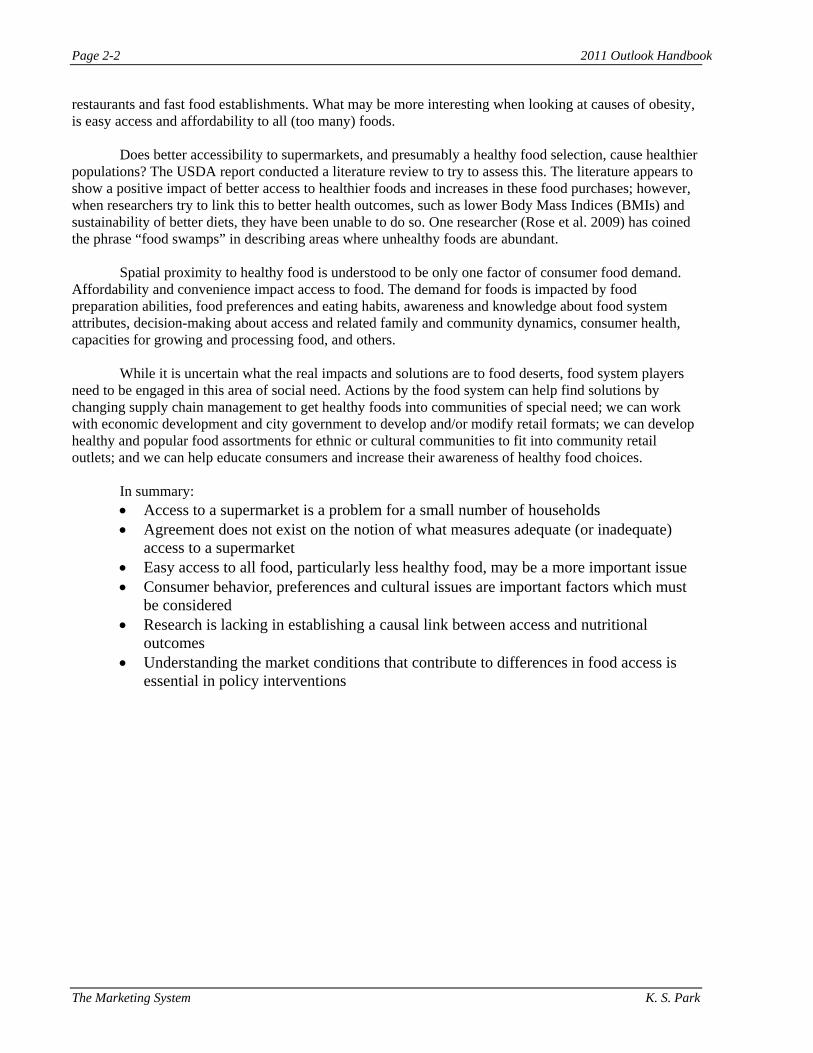
In summary: • Access to a supermarket is a problem for a small number of households • Agreement does not exist on the notion of what measures adequate (or inadequate)
access to a supermarket • Easy access to all food, particularly less healthy food, may be a more important issue • Consumer behavior, preferences and cultural issues are important factors which must
be considered • Research is lacking in establishing a causal link between access and nutritional
outcomes • Understanding the market conditions that contribute to differences in food access is
essential in policy interventions
2011 Outlook Handbook Page 2-3
K. S. Park The Marketing System
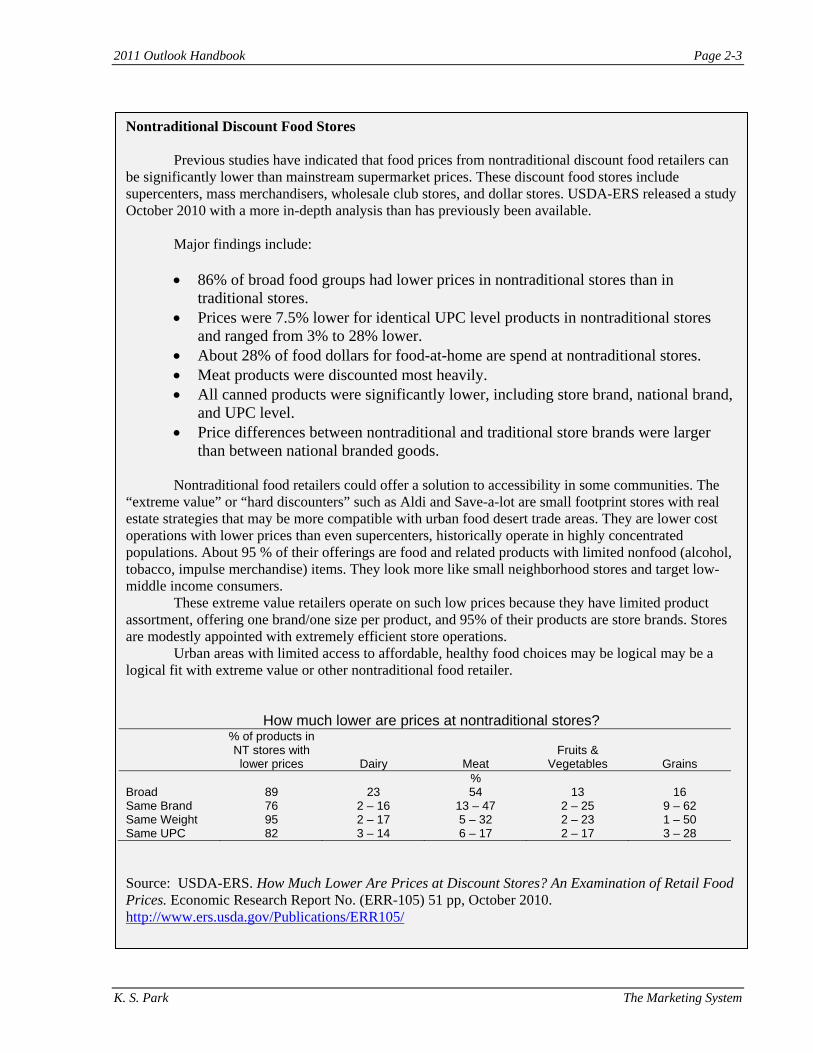
Nontraditional Discount Food Stores Previous studies have indicated that food prices from nontraditional discount food retailers can
be significantly lower than mainstream supermarket prices. These discount food stores include supercenters, mass merchandisers, wholesale club stores, and dollar stores. USDA-ERS released a study October 2010 with a more in-depth analysis than has previously been available.
Major findings include: • 86% of broad food groups had lower prices in nontraditional stores than in
traditional stores. • Prices were 7.5% lower for identical UPC level products in nontraditional stores
and ranged from 3% to 28% lower. • About 28% of food dollars for food-at-home are spend at nontraditional stores. • Meat products were discounted most heavily. • All canned products were significantly lower, including store brand, national brand,
and UPC level. • Price differences between nontraditional and traditional store brands were larger
than between national branded goods. Nontraditional food retailers could offer a solution to accessibility in some communities. The
“extreme value” or “hard discounters” such as Aldi and Save-a-lot are small footprint stores with real estate strategies that may be more compatible with urban food desert trade areas. They are lower cost operations with lower prices than even supercenters, historically operate in highly concentrated populations. About 95 % of their offerings are food and related products with limited nonfood (alcohol, tobacco, impulse merchandise) items. They look more like small neighborhood stores and target low-middle income consumers.
These extreme value retailers operate on such low prices because they have limited product assortment, offering one brand/one size per product, and 95% of their products are store brands. Stores are modestly appointed with extremely efficient store operations.
Urban areas with limited access to affordable, healthy food choices may be logical may be a logical fit with extreme value or other nontraditional food retailer.
How much lower are prices at nontraditional stores? % of products in
NT stores with lower prices
Dairy
Meat
Fruits &
Vegetables
Grains % Broad 89 23 54 13 16 Same Brand 76 2 – 16 13 – 47 2 – 25 9 – 62 Same Weight 95 2 – 17 5 – 32 2 – 23 1 – 50 Same UPC 82 3 – 14 6 – 17 2 – 17 3 – 28
Source: USDA-ERS. How Much Lower Are Prices at Discount Stores? An Examination of Retail Food Prices. Economic Research Report No. (ERR-105) 51 pp, October 2010. http://www.ers.usda.gov/Publications/ERR105/

Page 2-4 2011 Outlook Handbook
The Marketing System K. S. Park
The U.S. Food Marketing System Update
The Producer Price Index
The Producer Price Index has demonstrated its propensity for volatility. The PPI in 2007 first started increasing for most major production groups, then plummeted in 2009. In 2010 it has now started recovering to 2007 levels (Figure 2 – 1).
FIGURE 2 – 1. PRODUCER PRICE INDICES, FARM PRODUCTS
Base Year = 1982
Note: The Producer Price Index (PPI), unlike the CPI, is based on prices received by producers from first point of sale. This index is based off the year 1982. For example, a PPI of 100.0 reflects a farm price equal to that of the base year, 1982.
Source: USDA-ERS, Agricultural Outlook http://www.ers.usda.gov/publications/Agoutlook/AOTables/ last updated October 2010.
80
100
120
140
160
180
200
220
2006 2007 2008 2009 Jul-10
Inde
x, 1
00=1
982
Fresh fruits and melons
Fresh vegetables except potatoes
Irish potatoes for consumer use
Eggs for fresh use
Beef/veal products, fresh or frozen
Pork prods., fresh, froz. or processed
Processed poultry
Dairy products
Processed fruits and vegetables
2011 Outlook Handbook Page 2-5
K. S. Park The Marketing System
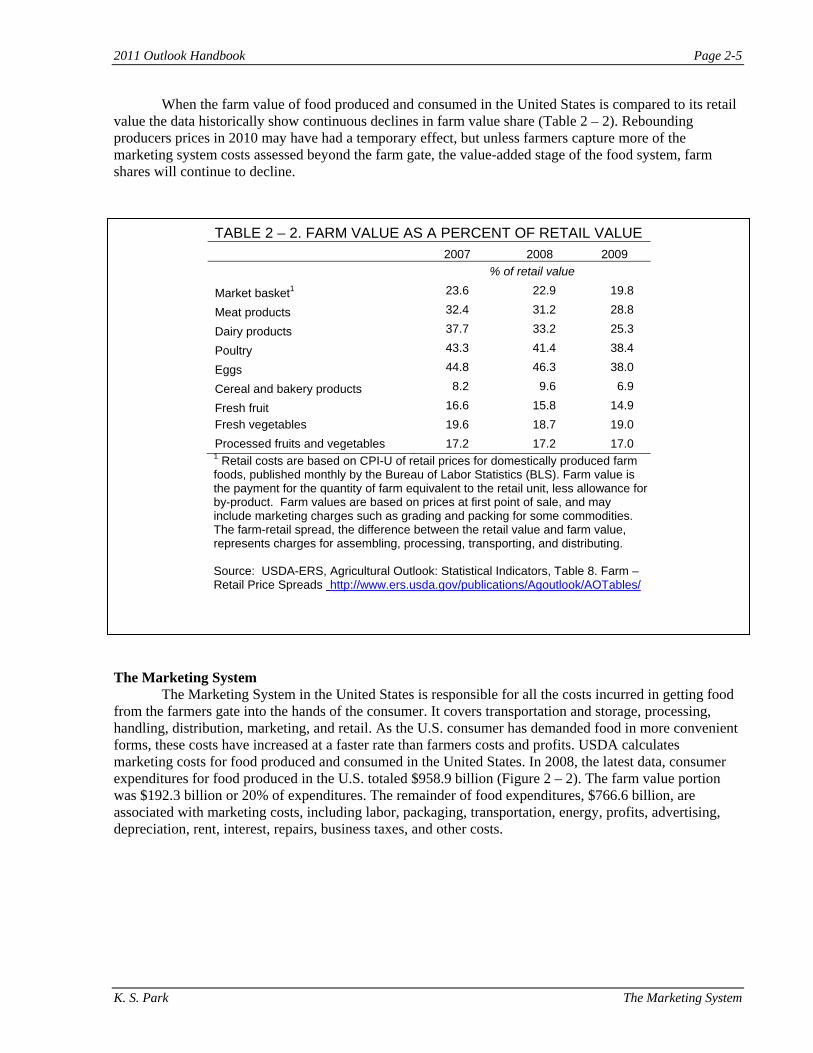
When the farm value of food produced and consumed in the United States is compared to its retail value the data historically show continuous declines in farm value share (Table 2 – 2). Rebounding producers prices in 2010 may have had a temporary effect, but unless farmers capture more of the marketing system costs assessed beyond the farm gate, the value-added stage of the food system, farm shares will continue to decline.
The Marketing System The Marketing System in the United States is responsible for all the costs incurred in getting food
from the farmers gate into the hands of the consumer. It covers transportation and storage, processing, handling, distribution, marketing, and retail. As the U.S. consumer has demanded food in more convenient forms, these costs have increased at a faster rate than farmers costs and profits. USDA calculates marketing costs for food produced and consumed in the United States. In 2008, the latest data, consumer expenditures for food produced in the U.S. totaled $958.9 billion (Figure 2 – 2). The farm value portion was $192.3 billion or 20% of expenditures. The remainder of food expenditures, $766.6 billion, are associated with marketing costs, including labor, packaging, transportation, energy, profits, advertising, depreciation, rent, interest, repairs, business taxes, and other costs.
TABLE 2 – 2. FARM VALUE AS A PERCENT OF RETAIL VALUE 2007 2008 2009
% of retail value
Market basket1 23.6 22.9 19.8
Meat products 32.4 31.2 28.8
Dairy products 37.7 33.2 25.3
Poultry 43.3 41.4 38.4
Eggs 44.8 46.3 38.0
Cereal and bakery products 8.2 9.6 6.9
Fresh fruit 16.6 15.8 14.9 Fresh vegetables 19.6 18.7 19.0 Processed fruits and vegetables 17.2 17.2 17.0 1 Retail costs are based on CPI-U of retail prices for domestically produced farm foods, published monthly by the Bureau of Labor Statistics (BLS). Farm value is the payment for the quantity of farm equivalent to the retail unit, less allowance for by-product. Farm values are based on prices at first point of sale, and may include marketing charges such as grading and packing for some commodities. The farm-retail spread, the difference between the retail value and farm value, represents charges for assembling, processing, transporting, and distributing. Source: USDA-ERS, Agricultural Outlook: Statistical Indicators, Table 8. Farm – Retail Price Spreads http://www.ers.usda.gov/publications/Agoutlook/AOTables/

Page 2-6 2011 Outlook Handbook
The Marketing System K. S. Park
Labor costs are the greatest portion of all marketing system costs, roughly 38%. Wage rates in the food marketing industries drive the labor costs. Apparently, wholesale wage rates indexed off of 1987 rates show actual increases in the last 2 years, although processing and retail wage rates remain relatively stagnant (Figure 2 – 2). Energy costs are roughly only 4% of marketing costs, yet have shown extreme volatility in the past. Energy costs have risen sharply this quarter which are not reflected in Figure 2 – 3.
FIGURE 2 – 2. MARKETING COSTS: FARM BILL AND CONSUMER EXPENDITURES
Source: USDA-ERS. Briefing Room, Food Marketing System in the U.S. Price Spreads from Farm to Consumer, http://www.ers.usda.gov/Data/FarmToConsumer/marketingbill.htm. updated November 29, 2010.
Farm Price
Marketing Costs
0.0
200.0
400.0
600.0
800.0
1000.0
1200.0
1998 1999 2000 2001 2002 2003 2004 2005 2006 2007 2008
$ billion
$465.4
$119.6
$766.6
$192.3
Consumer Expenditures

2011 Outlook Handbook Page 2-7
K. S. Park The Marketing System
The Consumer Price Index The recession hit every household income bracket in 2009. While 2008 may have seen the greatest
food inflation in recent decades, 2009 saw food sales slip in several prime food store departments. In 2010 food inflation is anticipated to return to about 2.0% – 3.0%, levels normally seen from 1997 – 2007.
Two major factors contributing to a return to food price inflation are an increase in commodity prices for grains and a sharp increase in energy prices. While inflation is not necessarily bad, unemployment levels and wage rates may not be in line with anticipated inflation rates, especially in energy prices.
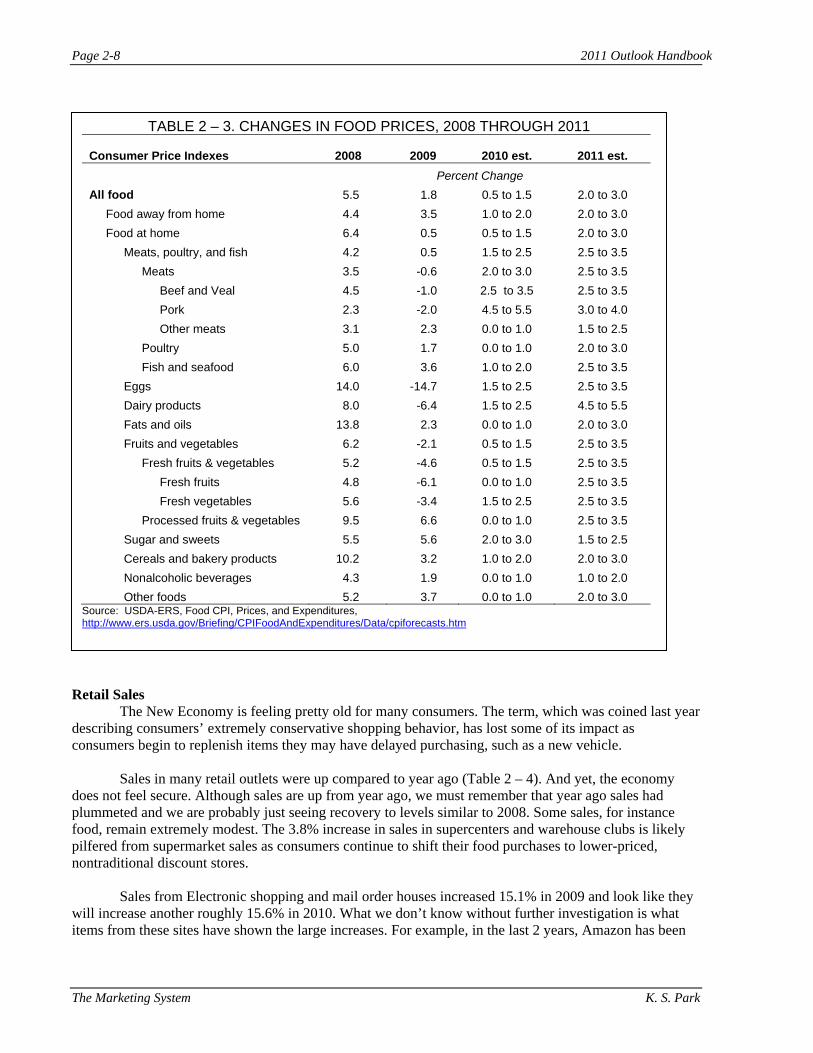
In 2011, fruits and vegetables, both processed and fresh, as well as meats and eggs should see retail
price increases on average of 2.5%-3.5% (Table 2 – 3). Dairy prices at retail are estimated to have the highest CPI of the major food groups, 4.5%-5.5%.
FIGURE 2 – 3. PRICE INDEXES OF SELECTED FOOD MARKETING COSTS
Source: USDA-ERS, Agricultural Outlook: Statistical Indicators, Farm-Retail Spreads, Table 9 http://www.ers.usda.gov/Publications/AgOutlook/AOTables/
500550600650700750800850
IV I II III IV I II
Inde
x, 1
00=1
987
Labor, Hourly Earnings and Benefits
Processing
Wholesaling
Retailing
2008 2009 2010
500700900
11001300150017001900
IV I II III IV I II
Inde
x, 1
00-1
987
Fuel & Power
Electric
Petroleum
Natural gas
2008 2009 2010
Page 2-8 2011 Outlook Handbook
The Marketing System K. S. Park
Retail Sales The New Economy is feeling pretty old for many consumers. The term, which was coined last year
describing consumers’ extremely conservative shopping behavior, has lost some of its impact as consumers begin to replenish items they may have delayed purchasing, such as a new vehicle.
Sales in many retail outlets were up compared to year ago (Table 2 – 4). And yet, the economy
does not feel secure. Although sales are up from year ago, we must remember that year ago sales had plummeted and we are probably just seeing recovery to levels similar to 2008. Some sales, for instance food, remain extremely modest. The 3.8% increase in sales in supercenters and warehouse clubs is likely pilfered from supermarket sales as consumers continue to shift their food purchases to lower-priced, nontraditional discount stores.
Sales from Electronic shopping and mail order houses increased 15.1% in 2009 and look like they
will increase another roughly 15.6% in 2010. What we don’t know without further investigation is what items from these sites have shown the large increases. For example, in the last 2 years, Amazon has been
TABLE 2 – 3. CHANGES IN FOOD PRICES, 2008 THROUGH 2011 Consumer Price Indexes 2008 2009 2010 est. 2011 est.
Percent Change All food 5.5 1.8 0.5 to 1.5 2.0 to 3.0
Food away from home 4.4 3.5 1.0 to 2.0 2.0 to 3.0 Food at home 6.4 0.5 0.5 to 1.5 2.0 to 3.0
Meats, poultry, and fish 4.2 0.5 1.5 to 2.5 2.5 to 3.5 Meats 3.5 -0.6 2.0 to 3.0 2.5 to 3.5
Beef and Veal 4.5 -1.0 2.5 to 3.5 2.5 to 3.5 Pork 2.3 -2.0 4.5 to 5.5 3.0 to 4.0 Other meats 3.1 2.3 0.0 to 1.0 1.5 to 2.5
Poultry 5.0 1.7 0.0 to 1.0 2.0 to 3.0 Fish and seafood 6.0 3.6 1.0 to 2.0 2.5 to 3.5
Eggs 14.0 -14.7 1.5 to 2.5 2.5 to 3.5 Dairy products 8.0 -6.4 1.5 to 2.5 4.5 to 5.5 Fats and oils 13.8 2.3 0.0 to 1.0 2.0 to 3.0 Fruits and vegetables 6.2 -2.1 0.5 to 1.5 2.5 to 3.5
Fresh fruits & vegetables 5.2 -4.6 0.5 to 1.5 2.5 to 3.5 Fresh fruits 4.8 -6.1 0.0 to 1.0 2.5 to 3.5 Fresh vegetables 5.6 -3.4 1.5 to 2.5 2.5 to 3.5
Processed fruits & vegetables 9.5 6.6 0.0 to 1.0 2.5 to 3.5 Sugar and sweets 5.5 5.6 2.0 to 3.0 1.5 to 2.5 Cereals and bakery products 10.2 3.2 1.0 to 2.0 2.0 to 3.0 Nonalcoholic beverages 4.3 1.9 0.0 to 1.0 1.0 to 2.0 Other foods 5.2 3.7 0.0 to 1.0 2.0 to 3.0
Source: USDA-ERS, Food CPI, Prices, and Expenditures, http://www.ers.usda.gov/Briefing/CPIFoodAndExpenditures/Data/cpiforecasts.htm

2011 Outlook Handbook Page 2-9
K. S. Park The Marketing System
expanding the assortment of food available off its site. Have increases in electronic sales been for traditional clothing, electronics, or books, or maybe food?
Although food inflation is forecast for 2011 at relatively normal levels, food retailers’ pricing
strategies as a reaction to food inflation will be difficult. The factors driving the food inflation are increases in food costs and not increases in consumer wages or spending. The combination equals higher costs and weak demand.
Discount retailers, such as Wal-Mart and Target as well as Aldi, will continue with highly
competitive pricing strategies. Supermarkets will also have to price competitively and will likely not be allowed to pass on all of the higher food commodity and production costs to consumers.
Because of weak demand, consumers will not increase purchasing in reaction to sales but will shop
conservatively and shop multiple locations in order to find the best buys. Because food retailers will likely price very competitively and on small margins, therefore, some speculate that the CPI will not reflect all of the inflation taking place in the supply chain.
Consumer Food Expenditure Metrics
Food and beverage sales from retail outlets in 2009 were stagnant. While growth in sales is usually around 3%, total food and beverage sales grew less than 1% (Table 2 – 5). Food away from home and alcoholic beverage sales even slipped and experienced negative growth.
TABLE 2 – 4. ANNUAL RETAIL AND FOOD SERVICE SALES, PERCENT CHANGE FROM YEAR AGO
Kind of Business % change from year ago
2007 2008 2009 2010 est.
year to date Retail and food services sales, total 3.4 -0.4 -6.4 6.2 Automobile dealers 0.8 -14.9 -13.4 10.3 Building mat. and supplies dealers -4.0 -6.5 -15.8 0.0
Supermarkets and other grocery (except convenience) stores 4.7 5.1 -0.8 1.6 Beer, wine, and liquor stores 5.9 6.3 -2.2 2.6 Pharmacies and drug stores 4.9 3.1 7.1 2.2 Gasoline stations 5.9 9.6 -22.1 17.9 Clothing stores 4.8 -2.2 -4.0 4.0 Hobby, toy, and game stores 3.5 6.7 -6.4 11.2 Department stores(excl. discount department stores) -3.0 -7.0 -17.2 0.7 Warehouse clubs and superstores 9.1 8.5 1.7 3.8 Used merchandise stores 7.4 5.3 -7.6 15.5 Electronic shopping and mail-order houses 8.7 2.5 15.1 15.6 Food services and drinking places 4.8 3.5 1.4 2.5
Source: US Department of Commerce, Census Bureau. Monthly Retail Trade and Food Service Survey, October 2010. http://www.census.gov/mrts/www/mrts.html
Page 2-10 2011 Outlook Handbook
The Marketing System K. S. Park
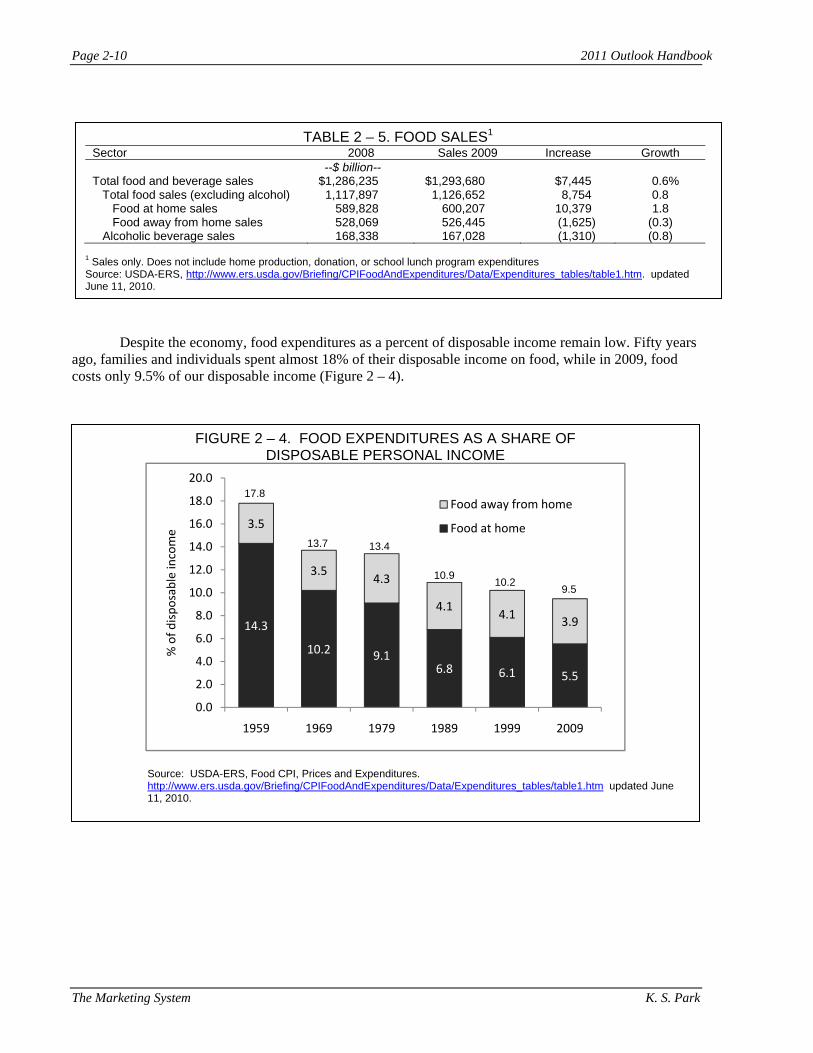
Despite the economy, food expenditures as a percent of disposable income remain low. Fifty years
ago, families and individuals spent almost 18% of their disposable income on food, while in 2009, food costs only 9.5% of our disposable income (Figure 2 – 4).
TABLE 2 – 5. FOOD SALES1
Sector 2008 Sales 2009 Increase Growth --$ billion-- Total food and beverage sales $1,286,235 $1,293,680 $7,445 0.6% Total food sales (excluding alcohol) 1,117,897 1,126,652 8,754 0.8 Food at home sales 589,828 600,207 10,379 1.8 Food away from home sales 528,069 526,445 (1,625) (0.3) Alcoholic beverage sales 168,338 167,028 (1,310) (0.8)
1 Sales only. Does not include home production, donation, or school lunch program expenditures Source: USDA-ERS, http://www.ers.usda.gov/Briefing/CPIFoodAndExpenditures/Data/Expenditures_tables/table1.htm. updated June 11, 2010.
FIGURE 2 – 4. FOOD EXPENDITURES AS A SHARE OF DISPOSABLE PERSONAL INCOME
Source: USDA-ERS, Food CPI, Prices and Expenditures. http://www.ers.usda.gov/Briefing/CPIFoodAndExpenditures/Data/Expenditures_tables/table1.htm updated June 11, 2010.
14.3
10.2 9.16.8 6.1 5.5
3.5
3.54.3
4.14.1 3.9
0.0
2.0
4.0
6.0
8.0
10.0
12.0
14.0
16.0
18.0
20.0
1959 1969 1979 1989 1999 2009
% of d
ispo
sable income
Food away from home
Food at home13.7 13.4
10.9 10.2 9.5
17.8

B.M. Henehan and T.M Schmit Cooperatives
Chapter 3. Cooperatives
Brian M. Henehan, Sr. Extension Associate, and Todd M. Schmit, Assistant Professor
U.S. Situation – Farmer Cooperatives
The current distribution of farmer cooperatives (excluding Farm Credit System cooperatives) is shown
in Figure 3-1. As of 2009, 2,389 farmer cooperatives in the United States employed 122,600 full-time
employees. By number of firms, farm supply (40.6%), grain and oilseed (23.7%), and service (10.5%) were the
most abundant. However, when viewed from a size point of view (here, full-time employees), farm supply
(35.5%), dairy (20.4%), and grain and oilseed (17.4%) make up the top three. The number of full-time
employees should represent a reasonable proxy for business volume. Farm supply cooperatives are prevalent
throughout the U.S.; however, grain and oilseed cooperatives are more prominent in the central plains, and
dairy cooperatives in the Midwest and Northeast.
FIGURE 3-1. DISTRIBUTION OF NUMBER OF COOPERATIVES AND NUMBER OF FULL-TIME EMPLOYEES, BY COOPERATIVE TYPE, UNITED STATES, 2009.
Source: Cooperative Statistics 2009, USDA Rural Development, Service Report 70, November 2010.
Although 2009 brought lower commodity and input prices, U. S. farmer, rancher and fishery
cooperatives still experienced the second highest sales and net income below the previous record highs in
2008 (Table 3-1). Gross business volume of $170 billion in 2009 was down 11 percent from the previous
year. Net income of $4.4 billion was also the second best showing ever for farmer cooperatives.
Gross marketings of U.S. cooperatives in 2009 were down 13 percent from the previous year. Dairy
product sales had the largest decline down more than $9 billion from 2008; followed by declines in grain and
oilseed marketing by almost $3 billion; and cotton sales declined by more than $1 billion. A major reason for
the decreased value of sales was due to decreased prices for dairy, grain and oilseed products, as well as a
decline in total cotton production. However, there were increased cooperative marketings of processed fruits
and vegetables, sugar, and tobacco.
Appendix Figure 3—Distribution of Full-Time Employees by Cooperative Type, 2009
Other Marketing1
5.7%
Supply
35.5%
Service
3.2%
Cotton
1.2%
Fruit & Vegetable
11.1%Livestock &
Poultry
1.9%
Sugar
4.7%
Grain & Oilseed
17.4%
Dairy
20.4%
Rice
2.1%
Percentages are based on a total of 122.6 thousand full-time employees.1 Includes dry bean and pea, nut, wool and mohair, tobacco, fishery, and other product marketing cooperatives.
Appendix Figure 1—Distribution of Cooperatives by Type, 2009
Supply
40.6%
Dairy
6.5%
Fruit & Vegetable
7.0%
Other Marketing
8.5%
Livestock &
Poultry
2.9%
Cotton
0.5%
Grain & Oilseed
23.7%
Service
10.5%
Percentages are based on a total of 2,389 cooperatives.1 Includes dry bean and pea, nut, wool and mohair, tobacco, rice, sugar, fishery, and other product marketing cooperatives.
1

Page 3-2 2011 Outlook Handbook
Cooperatives B.M. Henehan and T.M. Schmit
Across all cooperatives, the value of total assets decreased by 11 percent, with much of the decrease
reflecting lower priced inventory values and receivables. Liabilities fell by 19 percent, while equity capital
held by cooperatives increased 4 percent to nearly $24 billion, financing 39 percent of all assets. Patronage
income, which is total refunds received from doing business with other cooperatives, grew almost 5 percent to
$904 million from $864 million in 2008. In many U.S. rural communities, cooperatives represent the largest
employer. The total number of full time employees decreased slightly in 2009 to 123,000 while the use of
part-time and seasonal employees increased 7 percent to 58,000.
Memberships in cooperatives decreased 6 percent from 2.4 million in 2008 to 2.2 million in 2009.
The decline in memberships has followed an ongoing decline in the number of farms operating in the U.S.
Many farmers belong to more than one cooperative, and so farms numbers and memberships are not strictly
comparable. The number of cooperatives declined 3 percent from the previous year, continuing a long term
trend in mergers and consolidations resulting in larger-sized cooperatives.
Importantly, these statistics do not include cooperative contributions from the Farm Credit System
(FCS). As of 2007, the FCS accounted for 37% of total farm debt with 42% in real estate and 31% in non-real
estate activities (Deller et al. 2009). Each bank and association of the FCS is its own cooperative, and thus has
its own member-elected board of directors. As of 2007, the FCS had over $186 billion in assets, nearly $12
billion in sales revenue, and over $1 billion in wages in benefits. There are approximately 400,000
memberships and 11,000 employees (Deller et al. 2009).
TABLE 3-1. U.S. FARMER COOPERATIVES, COMPARISON OF 2008 AND 2009.
Item
Gross Business Volume Marketing Farm Supplies Services
Total
Balance sheet Assets Liabilities Equity
Income Statement Sales (Gross) Patronage income Net income before taxes
Employees Full-time Part-time, seasonal
Total
Membership
Cooperatives
2008
($ billion)
116.8 70.2 4.8
191.9 69.1 46.1 23.0 191.9 0.9 4.8 (Thousand) 124.4 53.8
178.2
(Million) 2.4
(Number)
2,473
2009
($ billion)
102.1 63.2 5.0
170.2
61.2 37.3 23.8
170.2 0.9 4.4
(Thousand) 122.6 57.8
180.4
(Million) 2.2
(Number) 2,389
Change
percent
-12.6 -10.1 3.4
-11.3 -11.4 -18.9 3.7 -11.3 4.6 -8.9 -1.5 7.5
1.2 -6.0 -3.4
Source: Cooperative Statistics 2009, USDA Rural Development, Service Report 70, November 2010.
2011 Outlook Handbook Page 3-3
B.M. Henehan and T.M. Schmit Cooperatives
New York State Situation
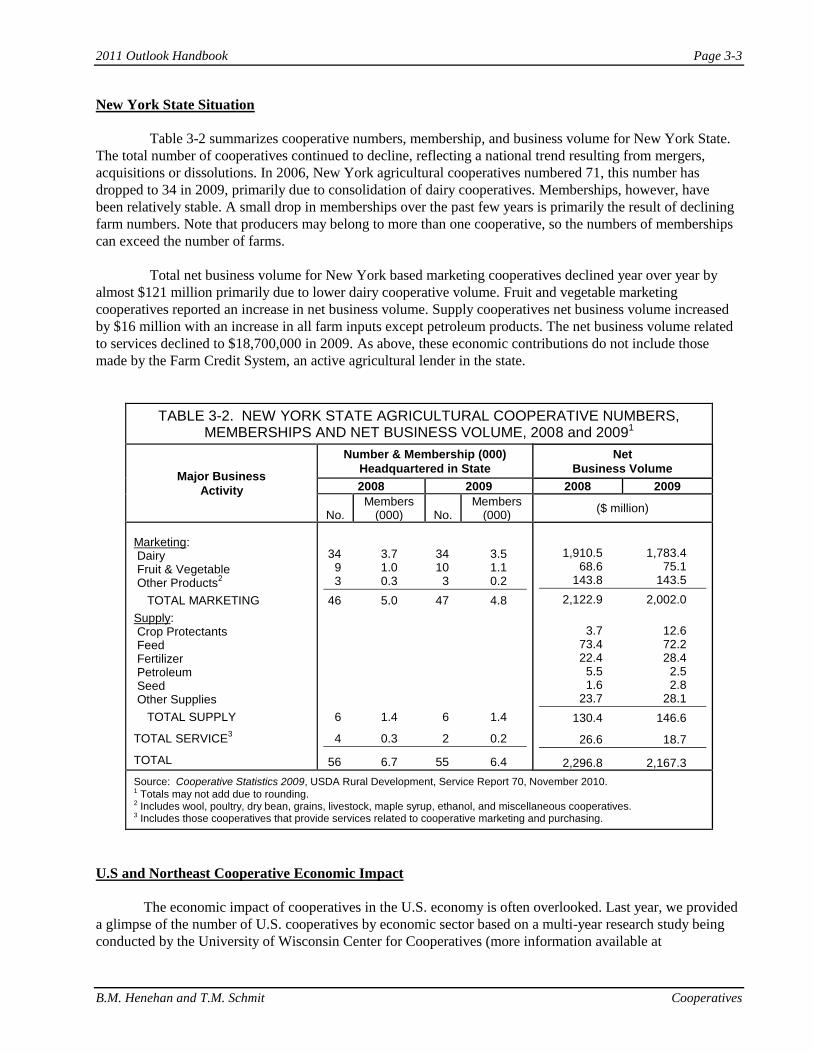
Table 3-2 summarizes cooperative numbers, membership, and business volume for New York State.
The total number of cooperatives continued to decline, reflecting a national trend resulting from mergers,
acquisitions or dissolutions. In 2006, New York agricultural cooperatives numbered 71, this number has
dropped to 34 in 2009, primarily due to consolidation of dairy cooperatives. Memberships, however, have
been relatively stable. A small drop in memberships over the past few years is primarily the result of declining
farm numbers. Note that producers may belong to more than one cooperative, so the numbers of memberships
can exceed the number of farms.
Total net business volume for New York based marketing cooperatives declined year over year by
almost $121 million primarily due to lower dairy cooperative volume. Fruit and vegetable marketing
cooperatives reported an increase in net business volume. Supply cooperatives net business volume increased
by $16 million with an increase in all farm inputs except petroleum products. The net business volume related
to services declined to $18,700,000 in 2009. As above, these economic contributions do not include those
made by the Farm Credit System, an active agricultural lender in the state.
TABLE 3-2. NEW YORK STATE AGRICULTURAL COOPERATIVE NUMBERS, MEMBERSHIPS AND NET BUSINESS VOLUME, 2008 and 20091
Major Business
Activity
Number & Membership (000)
Headquartered in State
Net
Business Volume
2008 2009 2008 2009
No.
Members (000)
No.
Members (000)
($ million)
Marketing: Dairy Fruit & Vegetable Other Products
2
TOTAL MARKETING
Supply: Crop Protectants Feed Fertilizer Petroleum Seed Other Supplies
TOTAL SUPPLY
TOTAL SERVICE3
TOTAL
34 3.7 34 3.5 9 1.0 10 1.1 3 0.3 3 0.2
46 5.0 47 4.8
6 1.4 6 1.4
4 0.3 2 0.2
56 6.7 55 6.4
1,910.5 1,783.4 68.6 75.1 143.8 143.5
2,122.9 2,002.0
3.7 12.6 73.4 72.2 22.4 28.4 5.5 2.5 1.6 2.8 23.7 28.1
130.4 146.6
26.6 18.7
2,296.8 2,167.3
Source: Cooperative Statistics 2009, USDA Rural Development, Service Report 70, November 2010.
1 Totals may not add due to rounding. 2 Includes wool, poultry, dry bean, grains, livestock, maple syrup, ethanol, and miscellaneous cooperatives. 3 Includes those cooperatives that provide services related to cooperative marketing and purchasing.
U.S and Northeast Cooperative Economic Impact
The economic impact of cooperatives in the U.S. economy is often overlooked. Last year, we provided
a glimpse of the number of U.S. cooperatives by economic sector based on a multi-year research study being
conducted by the University of Wisconsin Center for Cooperatives (more information available at
Page 3-4 2011 Outlook Handbook
Cooperatives B.M. Henehan and T.M. Schmit
http://uwcc.wisc.edu). The Wisconsin study identified the revenue generated; income paid to owners and
workers (wages, benefits, patronage refunds, and dividends); and numbers of jobs. They then used input-output
analysis to examine how these direct economic impacts ripple through the economy to generate additional
indirect and induced impacts. Indirect impacts measure the ripple effect that results from connections with
other businesses, while the induced impacts measure spending by the cooperative’s labor force (and related
industries) and its owners with the wages and dividends (or "patronage refunds") earned.
At Cornell, we have begun to collect and assess the data generated from this research study, with
particular emphasis on cooperative activity in New York State and the Northeast. This year, we highlight the
economic impacts by farm supply and marketing cooperatives (FSMCs). Understanding the true value of
agricultural cooperatives is difficult, given contributions beyond the more straightforward metrics of output,
income, and employment. While we ignore these important attributes for this chapter, the benefits are
described succinctly in the Wisconsin report:
“Cooperatives play a key role in agricultural markets not only because they account for a significant fraction of
economic activity in this sector, but also because they are believed to generate a pro-competitive effect in
imperfectly competitive markets. Cooperatives play other socially beneficial roles in the agricultural sector.
They provide an opportunity for farmers to share risk and to control managerial decision-making for their direct
benefit. Additionally, they offer a credence attribute—farmer ownership—which can be attached to farm
commodities, thus providing additional value to some consumers.” (Deller et al. 2009)
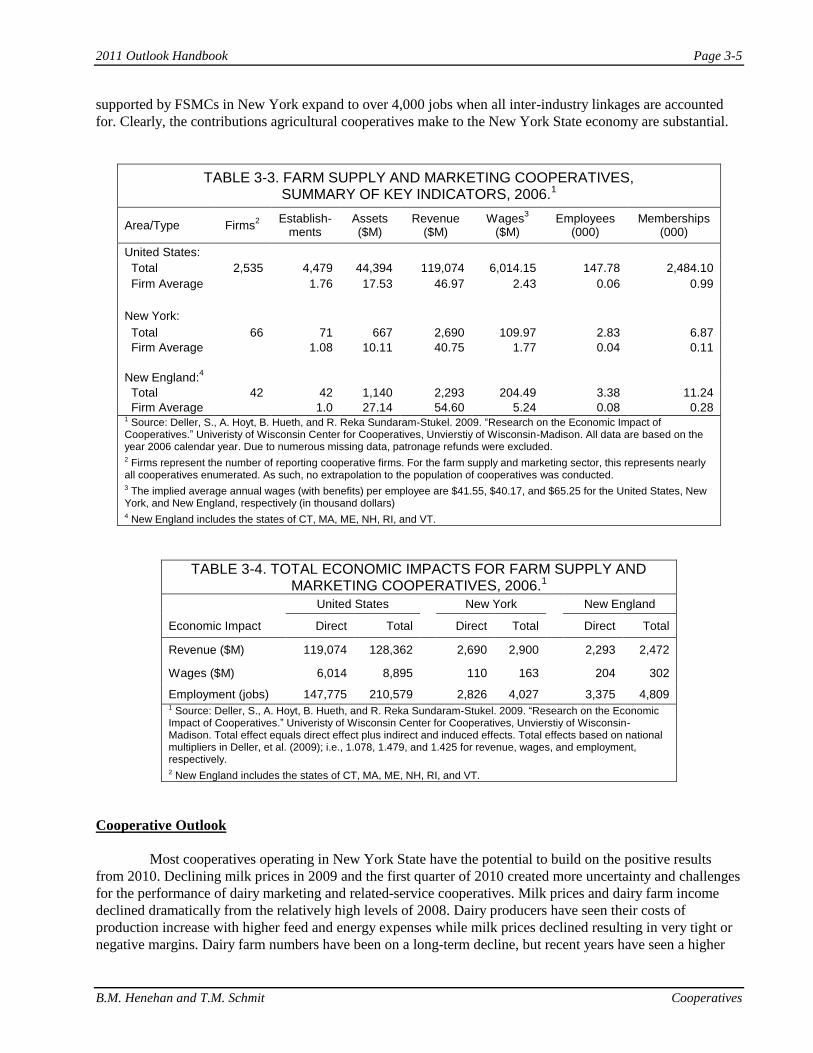
Table 3-3 provides a summary of economic indicators for FSMCs in the United States, New York, and
New England (CT, MA, ME, NH, RI, and VT), based on 2006 data. For purposes of definition, marketing
cooperatives generally provide processing and/or marketing services to farmers, along with logistical support to
aggregate farm supply. Supply cooperatives provide services and inputs to famers needed for the production of
their goods. In this way, farmers can collectively negotiate better terms of purchase. Also included in this
category are cooperatives providing information services (e.g., record keeping) to farmers.
Over 2,500 U.S. FSMCs had nearly 2.5 million farmer members with nearly $45 billion in assets and
produced $119 billion in annual revenues. Supporting nearly 148,000 employees, over $6 billion in wages and
benefits were distributed, or $41,550 per employee. The average cooperative had nearly $50 million in
revenue, with about 100 members and 60 employees. There was a wide distribution in sizes from rather small
to very large; e.g., less than one full time employee to a workforce of over 7,500 employees.
FSMCs were, on average, smaller in New York than the national average, but New England
cooperatives were larger (Table 3-3). On average, the number of employees per cooperative was nearly twice
as large in New England as in New York. However, in total, both areas support substantial jobs, about 6,200
combined. Total memberships were 6,870 and 11,240 in New York and New England, respectively.
Combined, these FSMCs produced nearly $5 billion revenues/output in 2006.
By using multipliers we can assess the level of linkages between cooperatives and the larger economy,
and identify the additional impacts reverberated through the economy based on the direct contributions
illustrated in Table 3-1. In other words, this rippling effect can be measured and applied to assess how a
change in one part of the economy affects the whole of the economy. These economy-wide impacts by FSMCs
on total revenues, wages, and employment are summarized in Table 3-4.
Focusing on New York, the $2.7 billion in revenue generated in 2006 by FSMCs expands to $2.9
billion when indirect contributions of up-stream suppliers and spending are accounted for. Similarly, the $110
million in directs wages and benefits provided to employees, when rippled through the economy, represents a
total contribution of $163 million in wages supported by this cooperative sector. The nearly 2,900 jobs directly
2011 Outlook Handbook Page 3-5
B.M. Henehan and T.M. Schmit Cooperatives
supported by FSMCs in New York expand to over 4,000 jobs when all inter-industry linkages are accounted
for. Clearly, the contributions agricultural cooperatives make to the New York State economy are substantial.
TABLE 3-3. FARM SUPPLY AND MARKETING COOPERATIVES, SUMMARY OF KEY INDICATORS, 2006.1
Area/Type Firms2
Establish-ments
Assets ($M)
Revenue ($M)
Wages3
($M) Employees
(000) Memberships
(000)
United States:
Total 2,535 4,479 44,394 119,074 6,014.15 147.78 2,484.10
Firm Average 1.76 17.53 46.97 2.43 0.06 0.99
New York:
Total 66 71 667 2,690 109.97 2.83 6.87
Firm Average 1.08 10.11 40.75 1.77 0.04 0.11
New England:4
Total 42 42 1,140 2,293 204.49 3.38 11.24
Firm Average 1.0 27.14 54.60 5.24 0.08 0.28 1 Source: Deller, S., A. Hoyt, B. Hueth, and R. Reka Sundaram-Stukel. 2009. “Research on the Economic Impact of Cooperatives.” Univeristy of Wisconsin Center for Cooperatives, Unvierstiy of Wisconsin-Madison. All data are based on the year 2006 calendar year. Due to numerous missing data, patronage refunds were excluded. 2 Firms represent the number of reporting cooperative firms. For the farm supply and marketing sector, this represents nearly all cooperatives enumerated. As such, no extrapolation to the population of cooperatives was conducted. 3 The implied average annual wages (with benefits) per employee are $41.55, $40.17, and $65.25 for the United States, New York, and New England, respectively (in thousand dollars) 4 New England includes the states of CT, MA, ME, NH, RI, and VT.
TABLE 3-4. TOTAL ECONOMIC IMPACTS FOR FARM SUPPLY AND MARKETING COOPERATIVES, 2006.1
United States New York New England
Economic Impact Direct Total Direct Total Direct Total
Revenue ($M) 119,074 128,362 2,690 2,900 2,293 2,472
Wages ($M) 6,014 8,895 110 163 204 302
Employment (jobs) 147,775 210,579 2,826 4,027 3,375 4,809 1 Source: Deller, S., A. Hoyt, B. Hueth, and R. Reka Sundaram-Stukel. 2009. “Research on the Economic Impact of Cooperatives.” Univeristy of Wisconsin Center for Cooperatives, Unvierstiy of Wisconsin-Madison. Total effect equals direct effect plus indirect and induced effects. Total effects based on national multipliers in Deller, et al. (2009); i.e., 1.078, 1.479, and 1.425 for revenue, wages, and employment, respectively. 2 New England includes the states of CT, MA, ME, NH, RI, and VT.
Cooperative Outlook
Most cooperatives operating in New York State have the potential to build on the positive results
from 2010. Declining milk prices in 2009 and the first quarter of 2010 created more uncertainty and challenges
for the performance of dairy marketing and related-service cooperatives. Milk prices and dairy farm income
declined dramatically from the relatively high levels of 2008. Dairy producers have seen their costs of
production increase with higher feed and energy expenses while milk prices declined resulting in very tight or
negative margins. Dairy farm numbers have been on a long-term decline, but recent years have seen a higher

Page 3-6 2011 Outlook Handbook
Cooperatives B.M. Henehan and T.M. Schmit
number of exits. Dairy cooperatives are experiencing a loss of farmer-members as some farmers cease farming
due to increased financial stress.
The cooperative bank that is a primary lender to rural cooperatives in the U.S. and New York
continued to report record results again during the most recent year that data are available. Net income, cash
patronage distributions, and member equity all increased from the previous record year. That strong
performance is expected to continue into 2011, although recent fluctuations in commodity markets, ethanol
prices, and capital markets have created a higher level of financial uncertainty.
Dairy cooperatives with value-added operations have experienced increasing costs for processing
milk, packaging, transportation, and some ingredients. However, lower prices for milk can result in improved
margins for these types of cooperatives as milk itself is a major expense for cooperatives involved in dairy
product manufacturing. It remains to be seen how milk and energy prices unfold in 2011, but demand for most
of the dairy products produced in the Northeast remain high.
Domestic consumer concerns over rising food prices and an economic recession have shifted
purchasing to lower priced food product outlets, as well as resulted in less food consumed away from home. As
the impact of the recession lessens, demand for dairy products should strengthen. On the export side, as the
global economy recovers and the value of the dollar remains competitive, there appear to be opportunities for
increased exports in 2011. The dairy industry and dairy marketing cooperatives have relied on increasing
exports to help bolster domestic farm prices and overall cooperative sales and margins.
Relatively new management in the marketing arm of the major grape juice processing cooperative
continues to develop strategies to grow patronage proceeds to grape grower members. Initial signs point toward
improved performance for this commodity. Significant changes have occurred in the processed fruit and
vegetable industry as a major cooperative who partnered with a private equity firm have sold their interest in a
major brand and marketing operations. The proceeds of the sale will generate significant gains to both the
private equity firm and the cooperative. Cooperative members that had an equity position in the company will
reap capital gains through the sale. The exact level of returns is yet to be determined.
Although 2010 has brought a number of challenges for cooperatives operating in New York State -
declining milk prices, downward pressure on farm income, shifting consumer purchasing patterns and an
ongoing slow recovery from the recession, most cooperatives operating in New York State remain well
positioned for solid performance in 2011.
C.G. Turvey Finance
Chapter 4. Finance Calum G. Turvey, Professor
2009 and 2010 have seen considerable deterioration in the quality of agricultural credit held by banks and the farm credit system and by the deteriorating financial condition of certain sectors of the farm economy. A classical cost-price squeeze is at play with milk prices on futures exchanges largely staying below $15.20/cwt for much of the year and rising above $16/cwt for only a few weeks. Meanwhile corn which languished below $4 for much of the year suddenly rose in mid- summer to nose up against $6/bu. Meanwhile soybeans which remained below $10 for much of the year rose in unison with corn to touch $13.50. While this is great for grain and oilseed farmers, stagnation in milk prices combined with rising feed costs on dairy farms is putting many farmers under pressure.
The relationship between the business risks faced by farmers and the financial risks that they entail are well defined, but in the past few years these risks have not been so easily overcome. Indeed, the September 2010 Annual Report of Farm Credit East1 reported not only fairly flat sales but also an increase of $12.5 million in loan loss provisions to deal with a weakening credit market. Potential losses are mostly coming from the dairy sector (about 25%) but other stresses including nurseries are also present. All told Farm Credit East is reporting on accrual loans of about 1.5% of its portfolio representing about $60.2 million. To put this in perspective, First Pioneer Farm Credit reported non accruing loans of 1.3% in 2009, 0.9% in 2008 and 0.4% in 2007. About 42% of First Pioneer’s loans were issued to New York farmers. Likewise, Farm Credit of Western New York reported non accruing loans of 1.33% in 2009, 1.01% in 2008 and 0.49% in 20072.While much of these loans are collateralized, that is little comfort to those farmers in trouble. On the other hand, what is occurring in the agricultural sector pales in comparison to the unfolding disaster in the sub-prime home mortgage market for which the Farm Credit System emerged largely unscathed. However, many rural banks that served farmers went under.
It is difficult to fully comprehend what is actually happening in the farm sector beyond the abstract. To glimpse at the outlook for dairy farmer in 2010 we built a farm simulation model that would not be untypical in New York. The representation we use is found in Figures 4-1 and 4-2 for the income statement and balance sheet. We then added risk to the model to examine how randomness in milk prices, corn and soybeans affected farm performance. Corn and soybeans entered the model to build the feed costs. We were particularly interested in the relationship between the price of milk and financial risk.
1 https://www.farmcrediteast.com/About-Us/Inside-Farm-Credit-East/~/media/092010Quarterly.ashx 2 https://www.farmcrediteast.com/About-Us/Inside-Farm-Credit-East/~/media/Files/AboutUs/Financials/FCWNY09ARFinal.ashx

Page 4-2 2011 Outlook Handbook
Finance C.G. Turvey
FIGURE 4-1: INCOME STATEMENT FOR TYPICAL 50-COW DAIRY IN NEW YORK
2010Sales
Milk Sale 195,291Option Payout 138cull cow sale 9,630calf Sale 1,389crop sale 0other income 6,150
total 212,598
Expenseoperating expense
Fertilizer & Lime 7289Seed & Plants 4311.24Spray 3068.04Professional Fee 440da i ry gra in & concentra tion(corn,soybean, other m $31,382.15Dairy roughage(hay,corn silage) $16,938.37Fuel & Oil 13878.24breeding costs 3200vet and medicine 8200supplies 4750land rent 3850utility 43calf start cost 771.4285714other expense $2,700.00
administrate expensehired labor cost 18701.76insurance 3793.515repair 22039
deprieciation30025
Tax7270
interest$11,600.66
Net Income 18,347

2011 Outlook Handbook Page 4-3
C. G. Turvey Finance
FIGURE 4-2: FARM BALANCE SHEET B a l a n ce S h e e t
2010 b e g i n n i 2 010 e n dcu rre n t a s s e t s
ca s h & e q u i v l e n t 1 ,200 30 ,612a cco u n t s re ce i v a b l e 10 ,000 12 ,756
l o n g te rmL i v e s to ck 103 ,350 103 ,350M a ch i n a ry 204 ,300 183 ,870B u i l d i n g 191 ,900 182 ,305La n d 171 ,600 171 ,600
to ta l 682 ,350 684 ,493cu rre n t l i a b i l i t y 0
a c co u n t s p a y a b l e 2 ,700 2 ,838o p e ra t i n g l o a n 4 ,000 0
i n te rm e d i a tes t ru c tu re d d e b t 75 ,800 69 ,432
l o n g te rmlo n g te rm d e b t 192 ,500 186 ,526
to ta l 275 ,000 258 ,796f a rm n e tw o rth
N e t I n co m e 407 ,350 425 ,697
o th e r co m p re h e n s i v e i n co m e ( n a tu ra l g ro w th i n l i v e s to c407 ,350 425 ,697
We simulated the farm cash flows, taking into account for production seasonality and responsiveness of feed cost to corn and soybean prices. It was assumed from the historical record that the yearly standard deviation of the percentage change in prices was 29%, 34.2% and 37.95% for Class III milk, corn and soybeans respectively. We then simulated the path of prices on a monthly basis for 2010.
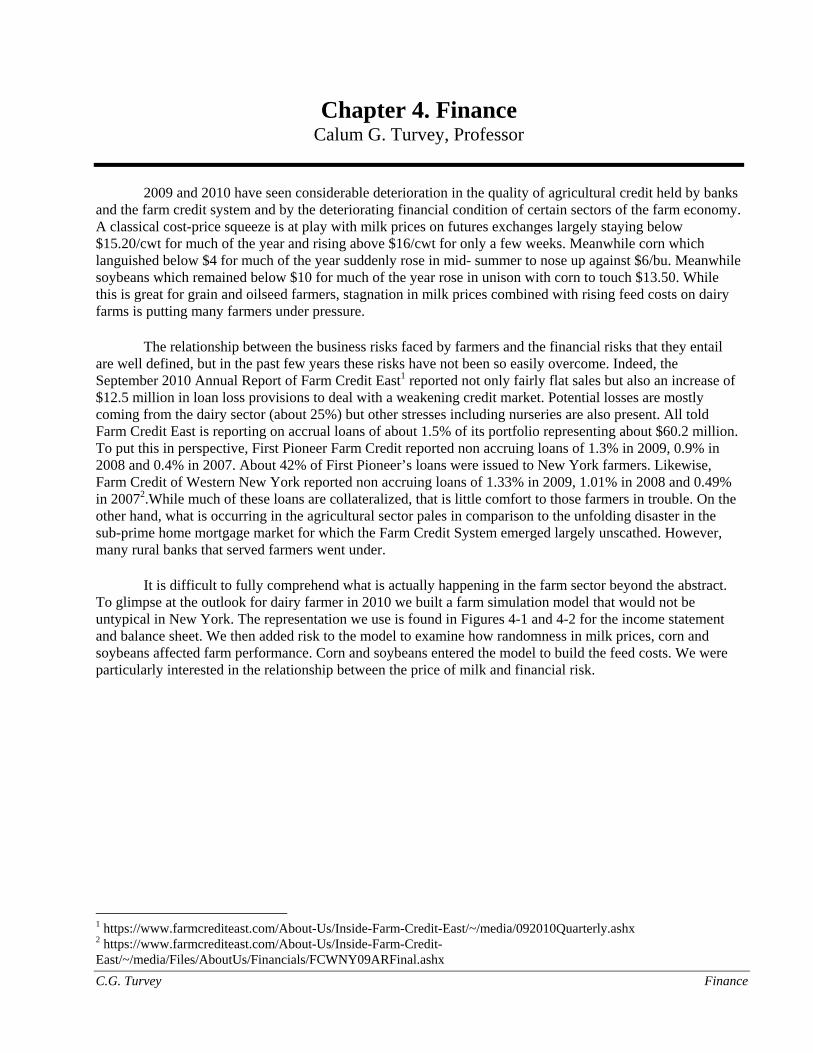
Figure 4-3 shows the probability distributions of Class III milk prices and the NY All-Milk spot price. It represents an anything-can-happen approach. For example it is possible that milk prices could hit $45 but this would be highly unlikely, There was a 50% chance that the Class III milk price would fall between $12.48 and $18.40 and a 55.2% chance that the All-Milk price would fall in the same range.
Page 4-4 2011 Outlook Handbook
Finance C.G. Turvey
FIGURE 4-3: PROBABILITY DISTRIBUTION OF AVERAGE MILK PRICES, 2010
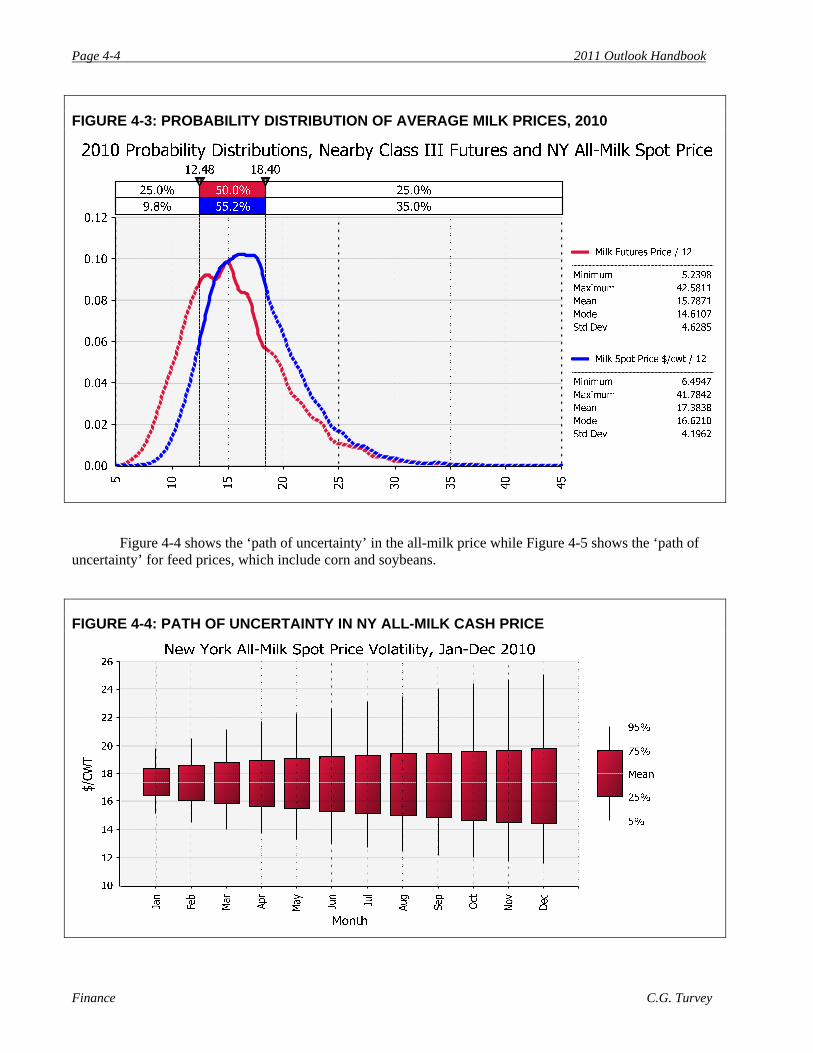
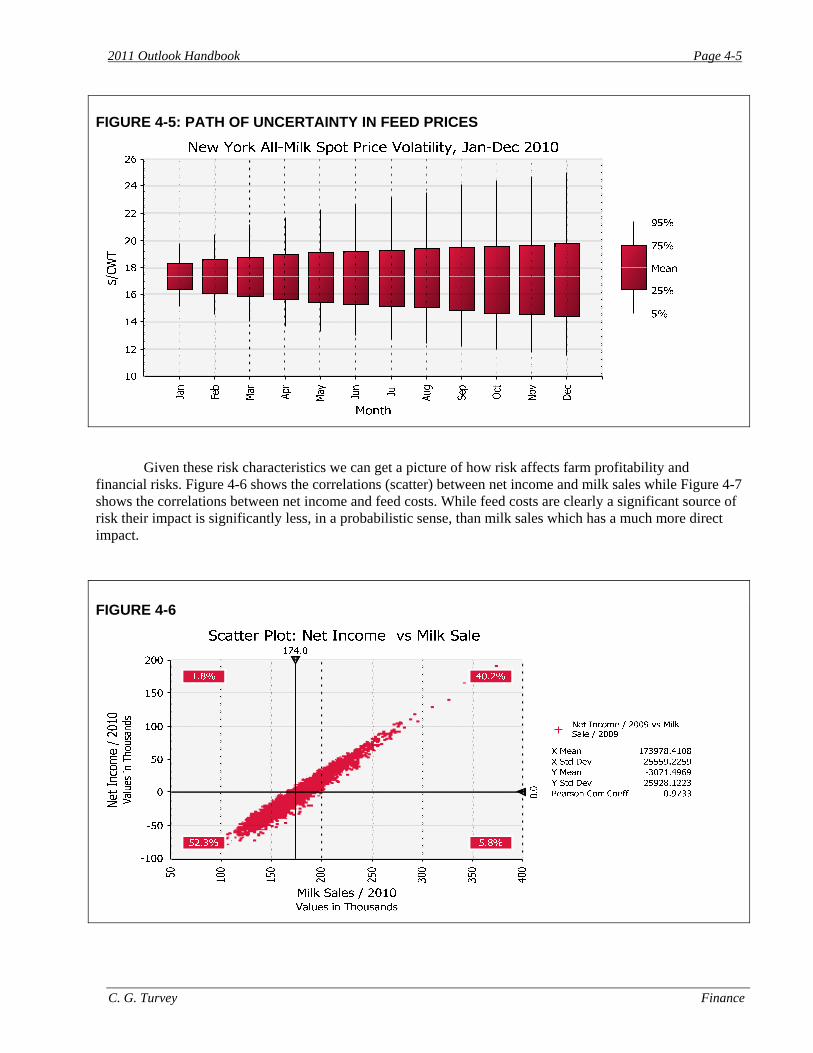
Figure 4-4 shows the ‘path of uncertainty’ in the all-milk price while Figure 4-5 shows the ‘path of uncertainty’ for feed prices, which include corn and soybeans. FIGURE 4-4: PATH OF UNCERTAINTY IN NY ALL-MILK CASH PRICE
2011 Outlook Handbook Page 4-5
C. G. Turvey Finance
FIGURE 4-5: PATH OF UNCERTAINTY IN FEED PRICES
Given these risk characteristics we can get a picture of how risk affects farm profitability and financial risks. Figure 4-6 shows the correlations (scatter) between net income and milk sales while Figure 4-7 shows the correlations between net income and feed costs. While feed costs are clearly a significant source of risk their impact is significantly less, in a probabilistic sense, than milk sales which has a much more direct impact. FIGURE 4-6

Page 4-6 2011 Outlook Handbook
Finance C.G. Turvey
FIGURE 4-7
How these sources of risk might have created hardship for New York dairy farmer in 2010 can be seen by defining what I refer to as the critical return on assets (CROA). The CROA is simply the average interest rate on loans times the debt to asset ratio. It measures the point of breakeven, below which a loan might become non-accruing and above which at least interest expenses can be paid in full. Table 4-1 shows the CROA for a number of different debt structures ranging from $1,000/cow to $6,000/cow. TABLE 4-1: CRITICAL RETURNS ON ASSETS FOR DIFFERENT LEVERAGE
Debt/Cow Critical ROA
1,000 0.439%
2,000 0.874%
3,000 1.318%
4,000 1.759%
5,000 2.198%
5,500 2.418%
6,000 2.638%
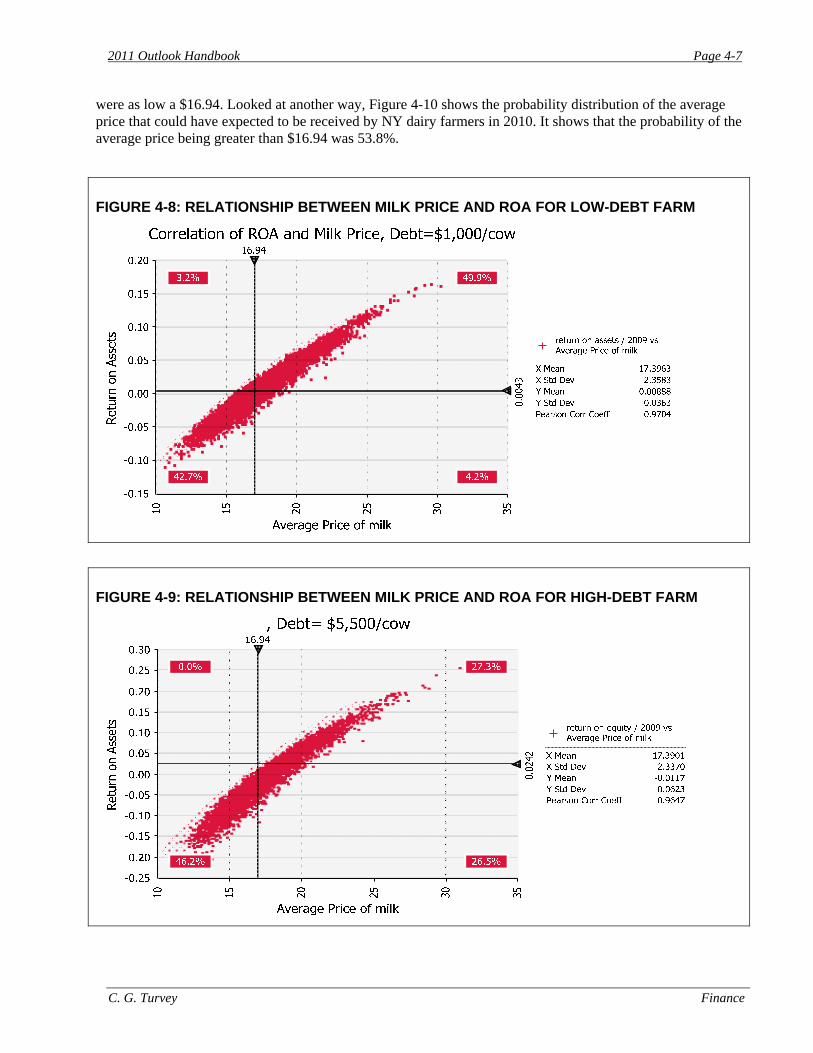
What is so critical about Table 4-1 is that it shows that the greater amount of debt the greater is demanded by the return on assets to meet debt obligations. The low debt farm will survive as long as profitability results in an ROA greater than 0.439%. The high debt farm requires an ROA in excess of 2.638%. Figures 4-8 and 4-9 show the relationship between ROA and the price of milk. As would be expected the ROA increases with the price of milk. To see why increasing numbers of NY dairy farmers are facing financial stress we note that the low debt farm had a 50% chance of a ROA greater than its CROA when the price of milk was as low as $16.94. But the farm leveraged to $5,500 had only a 27.3% chance when prices
2011 Outlook Handbook Page 4-7
C. G. Turvey Finance
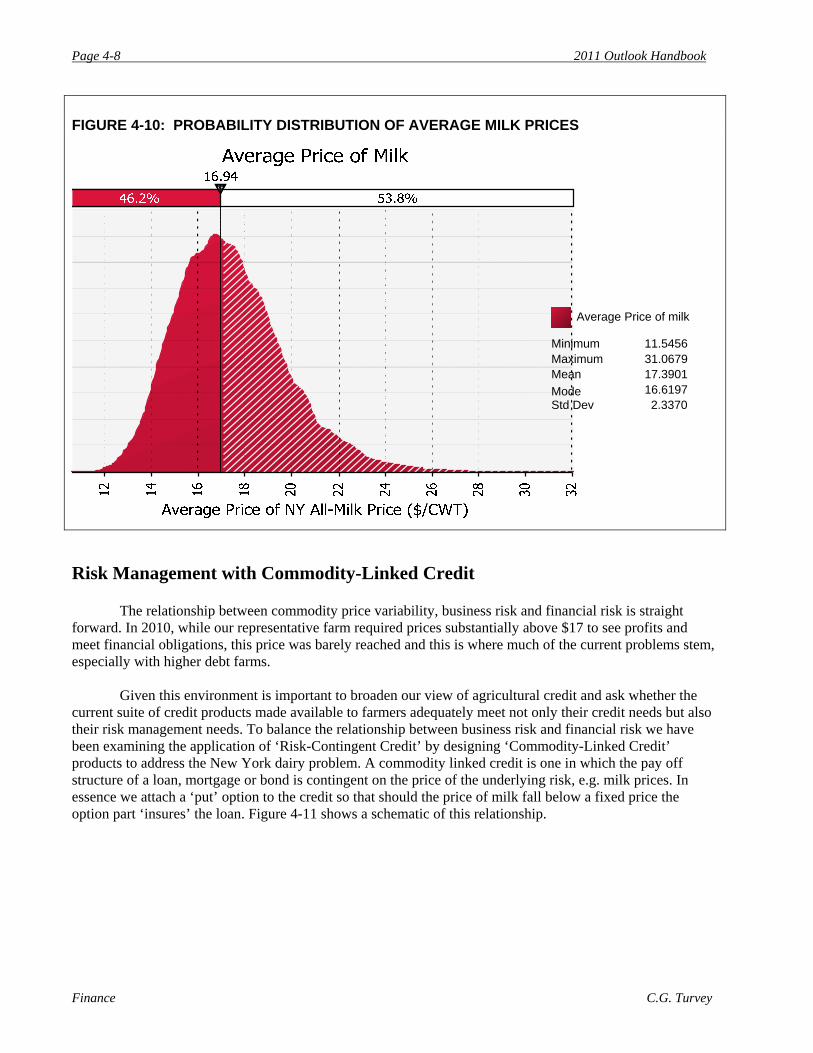
were as low a $16.94. Looked at another way, Figure 4-10 shows the probability distribution of the average price that could have expected to be received by NY dairy farmers in 2010. It shows that the probability of the average price being greater than $16.94 was 53.8%. FIGURE 4-8: RELATIONSHIP BETWEEN MILK PRICE AND ROA FOR LOW-DEBT FARM
FIGURE 4-9: RELATIONSHIP BETWEEN MILK PRICE AND ROA FOR HIGH-DEBT FARM
Page 4-8 2011 Outlook Handbook
Finance C.G. Turvey
FIGURE 4-10: PROBABILITY DISTRIBUTION OF AVERAGE MILK PRICES
Risk Management with Commodity-Linked Credit
The relationship between commodity price variability, business risk and financial risk is straight forward. In 2010, while our representative farm required prices substantially above $17 to see profits and meet financial obligations, this price was barely reached and this is where much of the current problems stem, especially with higher debt farms.
Given this environment is important to broaden our view of agricultural credit and ask whether the current suite of credit products made available to farmers adequately meet not only their credit needs but also their risk management needs. To balance the relationship between business risk and financial risk we have been examining the application of ‘Risk-Contingent Credit’ by designing ‘Commodity-Linked Credit’ products to address the New York dairy problem. A commodity linked credit is one in which the pay off structure of a loan, mortgage or bond is contingent on the price of the underlying risk, e.g. milk prices. In essence we attach a ‘put’ option to the credit so that should the price of milk fall below a fixed price the option part ‘insures’ the loan. Figure 4-11 shows a schematic of this relationship.
Mode
Average Price of milk
Minimum 11.5456Maximum 31.0679Mean 17.3901
16.6197Std Dev 2.3370

2011 Outlook Handbook Page 4-9
C. G. Turvey Finance
FIGURE 4-11: SCHEMATIC OF PAYOFF STRUCTURE OF RISK-CONTINGENT CREDIT Periodic LoanPmt
Futures Price
Milk Sales
Scaled Option Payout
Statistical Price to Sales Relationship
OptionPays loan short‐fall
Option premium reflected in loan interest rate
Premiums collected by lender; risk sold to integrator
Non‐accruingloan
To illustrate how this works we designed a mortgage contract with an imbedded put option that would pay the loan down if prices fell below $15.70. We used a base mortgage rate of 3.75% on a $192,000, 20 year mortgage for the high risk farmer. The average monthly value of the put options on Class III milk as of January 1, 2010 was $1.284. Using these numbers we calculated that the interest rate on the risk-contingent mortgage would have to increase from 3.75% to 4.66% to reflect the market risks. This increase is quite small and the monthly mortgage increased from $1,141 to $1,234 as a result.
Figure 4-12 shows the mortgage repayment structure for a simulated sequence of milk prices. In fact this graph was selected because the pattern of prices is very similar to what was observed throughout 2010. It can be seen that as the futures price falls below $15.70 the option part kicks in. For example in month 8 (August) when the price bottomed at about $13.75 the farmer would only have had to pay less than 88% of that month’s mortgage with the remaining 22% being paid from the option. Since the option part, by design, is applied directly to the mortgage payment, at no time should the loan fall into arrears. The lender gets paid with virtual certainty and the farmer, facing low prices gets some financial relief. Although the cost of the loan is higher, this is more easily affordable at higher prices.

Page 4-10 2011 Outlook Handbook
Finance C.G. Turvey
FIGURE 4-12: LOAN REPAYMENT WITH A COMMODITY-LINKED MORTGAGE
We also investigated linkage to operating loan. The simplest and least costly structure is for a lump-sum loan that a farmer would borrow in full and repay at a prescribed date, say in one year. Operating lines of credit are more difficult because the operating line balance is not known in advance so establishing a pricing mechanism to protect balances when both prices and line balances are moving is very costly and sometimes requires monthly interest rates that would be unacceptable to any farmer or lender. However the fixed amount, fixed term periodic loan works nicely, although it is more expensive than an amortized mortgage loan.
We assume in Figure 4-13 a $100,000 operating loan with a one year duration and a base interest rate of 6%. To imbed an option the interest rate would have to rise to 16.36%. This is higher than an unsecured loan, but lower than most credit card rates. Nonetheless, it has the advantage that if prices fall the farmer does not have to pay the operating loan in full while the lender receives full payment. In addition, the embedded ‘insurance’ can act as a substitute for collateral. Figure 4-13 shows the distribution of loan repayment and option payment side by side. The symmetry is clear.

2011 Outlook Handbook Page 4-11
C. G. Turvey Finance
In all likelihood the most frequent outcome is that the farmer pays the loan in full, but as prices fall it
can be seen that in the worst case scenario the option part pays $68,518 while the farmer pays only $31,481. Given outcomes like this an interest rate of 16-17% may not seem so unreasonable. Indeed when one looks at the difference in the means, on a $100,000 loan the farmer would expect to pay only $88,440. The expected or average option payment of $11,599 is almost equal to the 10.36% additional interest on the base loan. (In fact when the interest rates are continuously compounded the annualized effective interest rates are 6.183% and 17.774%. The difference of 11.590% applied to $100,000 is $11,590.) FIGURE 4-13: LOAN REPAYMENT AND OPTION PAYMENT ON OPERATING LOAN
-20 0 20 40 60 80 100
120
Prob
abili
tyVa
lues
x 1
0^-4
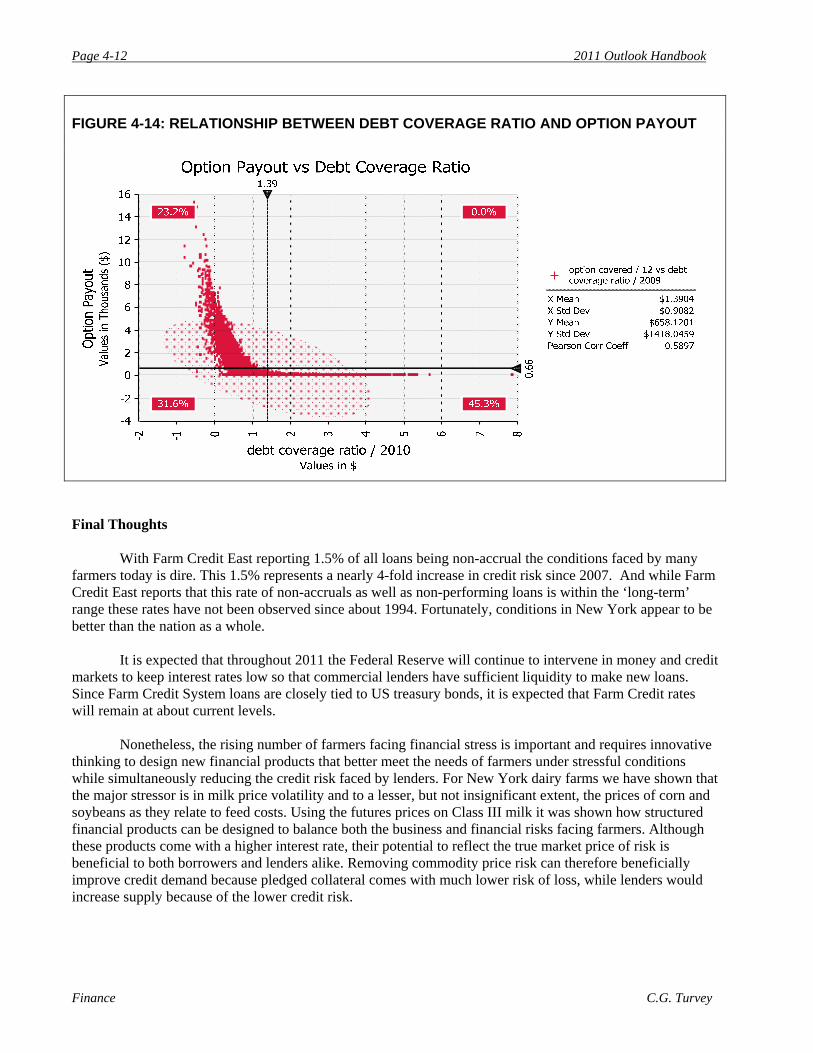
What this means in terms of debt repayment is illustrated in Figure 4-14 which shows the statistical relationship between the debt coverage ratio and the option payout. What can be seen is that the debt coverage ratio would fall well below 1.0 when milk prices fall, but when the risk contingent credit is applied it is precisely in these risky states that the option part kicks in. Consequently the chance that the farms debt coverage ratio falls below 1.0 is greatly reduced. This added certainty to repayment should be very attractive to lenders while relieving farmers from undue stress when commodity markets fail them.
Page 4-12 2011 Outlook Handbook
Finance C.G. Turvey
FIGURE 4-14: RELATIONSHIP BETWEEN DEBT COVERAGE RATIO AND OPTION PAYOUT
Final Thoughts
With Farm Credit East reporting 1.5% of all loans being non-accrual the conditions faced by many farmers today is dire. This 1.5% represents a nearly 4-fold increase in credit risk since 2007. And while Farm Credit East reports that this rate of non-accruals as well as non-performing loans is within the ‘long-term’ range these rates have not been observed since about 1994. Fortunately, conditions in New York appear to be better than the nation as a whole.
It is expected that throughout 2011 the Federal Reserve will continue to intervene in money and credit markets to keep interest rates low so that commercial lenders have sufficient liquidity to make new loans. Since Farm Credit System loans are closely tied to US treasury bonds, it is expected that Farm Credit rates will remain at about current levels.
Nonetheless, the rising number of farmers facing financial stress is important and requires innovative thinking to design new financial products that better meet the needs of farmers under stressful conditions while simultaneously reducing the credit risk faced by lenders. For New York dairy farms we have shown that the major stressor is in milk price volatility and to a lesser, but not insignificant extent, the prices of corn and soybeans as they relate to feed costs. Using the futures prices on Class III milk it was shown how structured financial products can be designed to balance both the business and financial risks facing farmers. Although these products come with a higher interest rate, their potential to reflect the true market price of risk is beneficial to both borrowers and lenders alike. Removing commodity price risk can therefore beneficially improve credit demand because pledged collateral comes with much lower risk of loss, while lenders would increase supply because of the lower credit risk.
T.M. Schmit and W.G. Tomek Grain and Feed
Chapter 5. Grain and Feed Todd M. Schmit, Assistant Professor, and William G. Tomek, Professor Emeritus
High and volatile grain and oilseed prices have been a feature of commodity markets since this past
summer, with the potential for even more volatility and higher prices in 2011 if production concerns and
tightening world stocks materialize. While the ability of markets to ration supplies with volatile and growing
demands has garnered much attention in recent years, production problems abroad and unexpected reductions
in domestic supplies have been key drivers in more recent volatility and price increases. That said, a U.S.
economy that has shown signs of a rebound from the economic recession, more favorable exchange rates, and
higher energy/oil prices are improving demand prospects and raising concerns about whether growing
demands can be met without continued increases in commodity prices.
The outlook for the coming year is still one of considerable uncertainty about economic conditions,
and prices continue to vary from day to day as news arrives in the market. Thus, this Chapter should be viewed
as a status report as of mid-November 2010. After reviewing the wheat, corn, and soybean markets, we discuss
the implications for feed prices in 2011.
Wheat
U.S. wheat acres continue a downward trend since the early 1980s, ending at 47.6 million acres
harvested in 2010 (Table 5-1). However, higher forecasted yields leave total production reasonably unchanged
from the previous year and within the range of experience for the last eight years. Global wheat supplies
(production plus carry-in) are projected to be about 9.7 million metric tons below last year, reflecting poorer
growing conditions and reduced supplies in former Soviet Union countries and parts of the European Union,
among a few other countries. In terms of annual production, the U.S. produces less than 10% of total world
supplies (around 9% for 2010/11).
U.S. carry-in stocks in 2010 were well above year-ago levels, and this higher carry-in drove the
increase in total domestic supplies of 301 million bushels. Domestic use is in line with historical experience
(primarily for food use), but particularly strong U.S. exports, nearly 400 million bushels above last year‟s
pace, will result in lower expected carry-out and a drop in the stocks-to-use ratio to 34.7%. While lower,
stocks are still much higher than in 2006/07 and 2007/08, when the ratios were both below 20 percent. World
wheat stocks are also diminished, but still above the record low ending stock levels in 2007/08. Stronger U.S.
exports are supported by lower global production and strong early-season export sales.
Continued wheat production and quality problems in key production areas abroad, combined with
dryer soil conditions for winter wheat production in the Great Plains, provide ongoing support for wheat prices
going into 2011. Tightening world stocks and strong U.S. export markets are expected to push farm prices
well above levels in 2009/10, although still moderated from those experienced in 2008/09. Stronger energy/oil
prices this year are another key factor in this year‟s outlook report, but are generally reflected more directly in
the corn and soybean sectors. Futures markets‟ prices imply strong concerns about the ability of future
supplies to meet growing demands. Given current and expected supply and demand levels, as of 17 November
2010, December 2010 futures contracts show strong year-over-year gains trading at over $6.50 per bushel,
with one- and two-year-out contracts trading in excess of the $7.50 mark (Table 5-2). Of course, expectations
can change quickly with new market information. In short, keep your eyes on growing conditions and wheat
quality in major world wheat producing areas for 2011, as further tightening in stocks could make this an even
more volatile market in the months ahead.

Page 5-2 2011 Outlook Handbook
Grain and Feed T.M. Schmit and W.G. Tomek
TABLE 5-1. U.S. SUPPLY AND DEMAND BALANCE SHEET FOR WHEATa
2008-09 2009-10E 2010-11F
Supply:
Harvested Acres (million) 55.7 49.9 47.6
Yield (bushels per acre) 44.9 44.5 46.4
(Million bushels)
Beginning Stocks 306 657 976
Production 2,499 2,218 2,208
Imports 127 119 110
Total Supply 2,932 2,993 3,294
Use:
Food
Seed
Feed & Residual
927
78
255
917
69
150
940
76
180
Total Domestic Use 1,260 1,137 1,196
Exports 1,015 881 1,250
Total Use 2,275 2,018 2,446
Ending Stocks 657 976 848
Stocks/Use Ratio 28.9% 48.4% 34.7%
Avg. farm price, U.S., $ per bushel 6.78 4.87 5.50
Avg. farm price, NYS, $ per bushel 6.16 4.84 --
Note : Totals may not add due to rounding; marketing year beginning June 1. aData from USDA, “World Agricultural Supply and Demand Estimates,” (November 9, 2010) WASDE-488, P.11.
TABLE 5-2. FUTURES PRICES FOR WHEAT,
CHICAGO MERCANTILE EXCHANGE,
17 NOVEMBER 2010
Contract Month $ per bushel
December 2010 6.512
March 2011 6.904
May 2011 7.164
July 2011 7.284
September 2011 7.454
December 2011 7.654
December 2012 7.586
Corn
The U.S. is the world‟s dominant producer of corn (i.e., nearly 40% of forecast world production in
2010/11). Table 5-3 provides a supply-demand balance sheet for corn in the U.S. as of 9 November 2010.
This year, U.S. corn acreage is expected to push beyond the 80 million acre threshold to settle at 81.3 million
2011 Outlook Handbook Page 5-3
T.M. Schmit and W.G. Tomek Grain and Feed
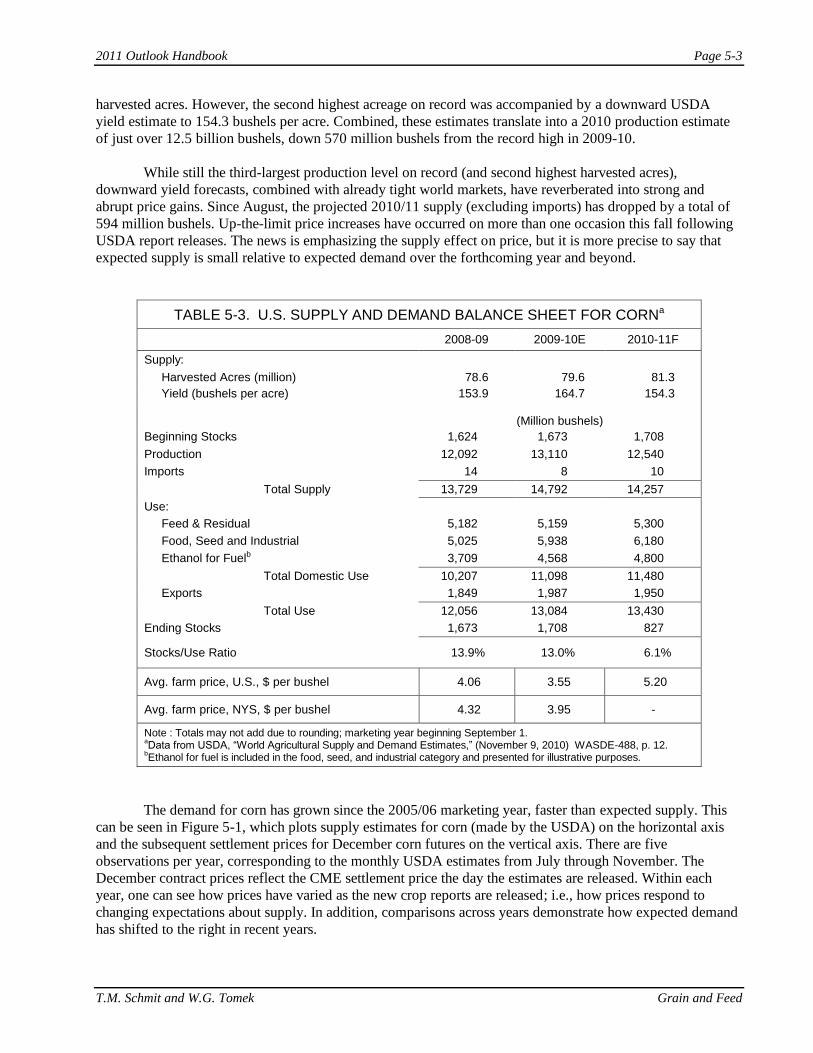
harvested acres. However, the second highest acreage on record was accompanied by a downward USDA
yield estimate to 154.3 bushels per acre. Combined, these estimates translate into a 2010 production estimate
of just over 12.5 billion bushels, down 570 million bushels from the record high in 2009-10.
While still the third-largest production level on record (and second highest harvested acres),
downward yield forecasts, combined with already tight world markets, have reverberated into strong and
abrupt price gains. Since August, the projected 2010/11 supply (excluding imports) has dropped by a total of
594 million bushels. Up-the-limit price increases have occurred on more than one occasion this fall following
USDA report releases. The news is emphasizing the supply effect on price, but it is more precise to say that
expected supply is small relative to expected demand over the forthcoming year and beyond.
TABLE 5-3. U.S. SUPPLY AND DEMAND BALANCE SHEET FOR CORNa
2008-09 2009-10E 2010-11F
Supply:
Harvested Acres (million) 78.6 79.6 81.3
Yield (bushels per acre) 153.9 164.7 154.3
(Million bushels)
Beginning Stocks 1,624 1,673 1,708
Production 12,092 13,110 12,540
Imports 14 8 10
Total Supply 13,729 14,792 14,257
Use:
Feed & Residual 5,182 5,159 5,300
Food, Seed and Industrial 5,025 5,938 6,180
Ethanol for Fuelb 3,709 4,568 4,800
Total Domestic Use 10,207 11,098 11,480
Exports 1,849 1,987 1,950
Total Use 12,056 13,084 13,430
Ending Stocks 1,673 1,708 827
Stocks/Use Ratio 13.9% 13.0% 6.1%
Avg. farm price, U.S., $ per bushel 4.06 3.55 5.20
Avg. farm price, NYS, $ per bushel 4.32 3.95 -
Note : Totals may not add due to rounding; marketing year beginning September 1. aData from USDA, “World Agricultural Supply and Demand Estimates,” (November 9, 2010) WASDE-488, p. 12.
bEthanol for fuel is included in the food, seed, and industrial category and presented for illustrative purposes.
The demand for corn has grown since the 2005/06 marketing year, faster than expected supply. This
can be seen in Figure 5-1, which plots supply estimates for corn (made by the USDA) on the horizontal axis
and the subsequent settlement prices for December corn futures on the vertical axis. There are five
observations per year, corresponding to the monthly USDA estimates from July through November. The
December contract prices reflect the CME settlement price the day the estimates are released. Within each
year, one can see how prices have varied as the new crop reports are released; i.e., how prices respond to
changing expectations about supply. In addition, comparisons across years demonstrate how expected demand
has shifted to the right in recent years.

Page 5-4 2011 Outlook Handbook
Grain and Feed T.M. Schmit and W.G. Tomek
To help isolate price effects from changes in expected supply and expected demand, Chua and Tomek
have estimated the relationship of expected supply and demand to futures prices (AEM staff paper available at
http://www.dyson.cornell.edu/research/researchpdf/sp/2010/Cornell_Dyson_sp1001.pdf). By using their
model, we estimated the price for December futures that accounts for the November supply and is consistent
with demand levels experienced in 2008. This price was $3.89 per bushel, well below the quoted settlement
price on 9 November 2010 of over $5.76 per bushel. The 2010 prices for September through November are
outliers relative to the 2009 experience; i.e., prices for December delivery are high given the estimated supply.
Qualitatively this appears as a positive shift in expected demand, but it could also reflect, to some degree,
concern about expected supply in the next crop year.
FIGURE 5-1. EXPECTED SUPPLY ESTIMATES, DECEMBER
FUTURES PRICE, CORN, JULY-NOVEMBER, 1989-2010.
Indeed, the demand for corn is expected to be larger in 2010/11, with gains in all domestic use
categories (Table 5-3). With improved livestock commodity prices, feed use is expected to remain strong
despite a large price increase in corn, presumably reflecting price appreciation in other feed commodities.
However, extended increases in feed commodity prices will reduce livestock margins if not compensated by
output price enhancements. Should this occur, expect lower derived demands for feed next year and an
accompanying reduction in livestock output, eventually putting downward pressure on feed crop prices.
2011 Outlook Handbook Page 5-5
T.M. Schmit and W.G. Tomek Grain and Feed
Higher energy/oil prices are providing support for maintaining improved ethanol returns in the face of
rising corn prices. Corn for ethanol is expected to utilize 4.8 billion bushels, or over 38% of total production.
While ethanol production growth is tempering, modest annual increases in the U.S. mandate for renewable
fuels should provide a base of support moving forward, along with government policy support to increase the
mandated blend rate to 15% ethanol. However, continued corn price increases could have similar related-
market effects for ethanol producers if energy and ethanol prices soften in 2011.
While wheat and soybean exports are well ahead of last year‟s pace, higher prices are a limiting factor
for exports, especially for corn. Assuming export shipments in 2010/11 remain near 2009/10 levels, carry-in
stocks at the end of this marketing year will be less than half of the 31 August 2010 level. The forecast stocks-
to-use ratio is 6.1% (Table 5-3). This compares with the historic low of 5.0% in 1995/96. Should production
expectations decline further, corn prices could become even higher and more volatile. One wild card is China,
which has not historically been a significant buyer of U.S. corn, but has already made some purchases in the
2010/11 marketing year. With projected increases in China‟s corn production to all time highs, only time will
tell if these purchases will continue to any significant degree.
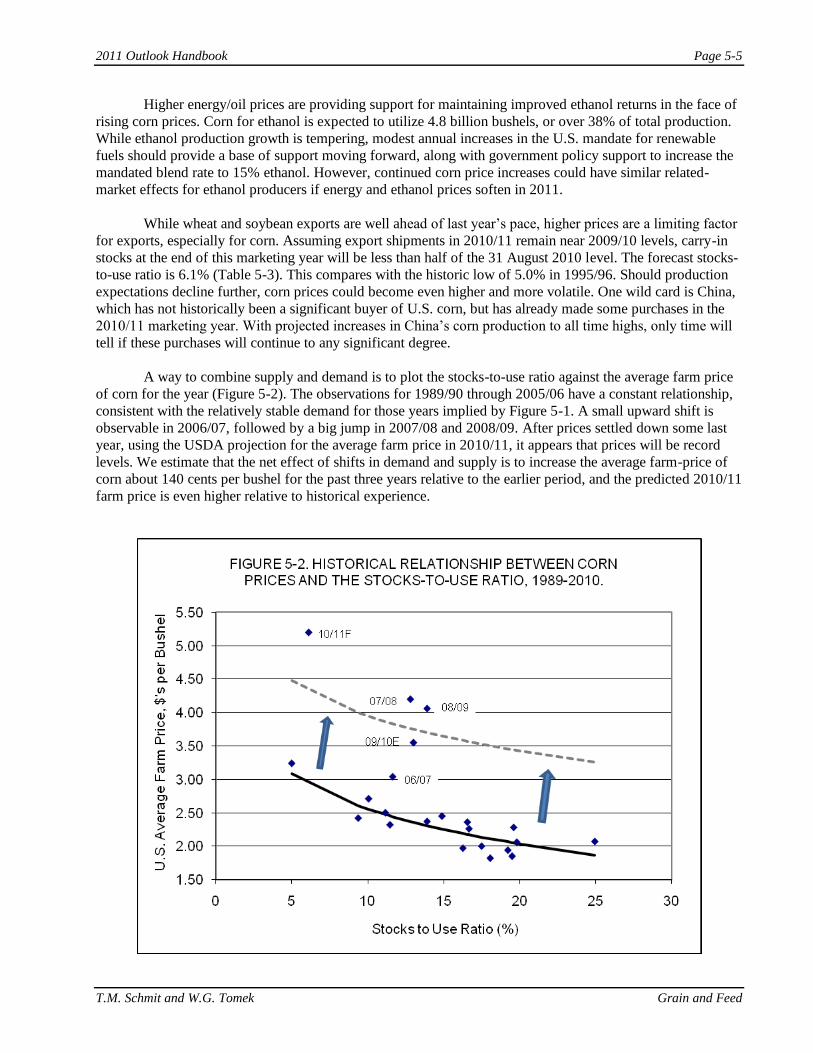
A way to combine supply and demand is to plot the stocks-to-use ratio against the average farm price
of corn for the year (Figure 5-2). The observations for 1989/90 through 2005/06 have a constant relationship,
consistent with the relatively stable demand for those years implied by Figure 5-1. A small upward shift is
observable in 2006/07, followed by a big jump in 2007/08 and 2008/09. After prices settled down some last
year, using the USDA projection for the average farm price in 2010/11, it appears that prices will be record
levels. We estimate that the net effect of shifts in demand and supply is to increase the average farm-price of
corn about 140 cents per bushel for the past three years relative to the earlier period, and the predicted 2010/11
farm price is even higher relative to historical experience.
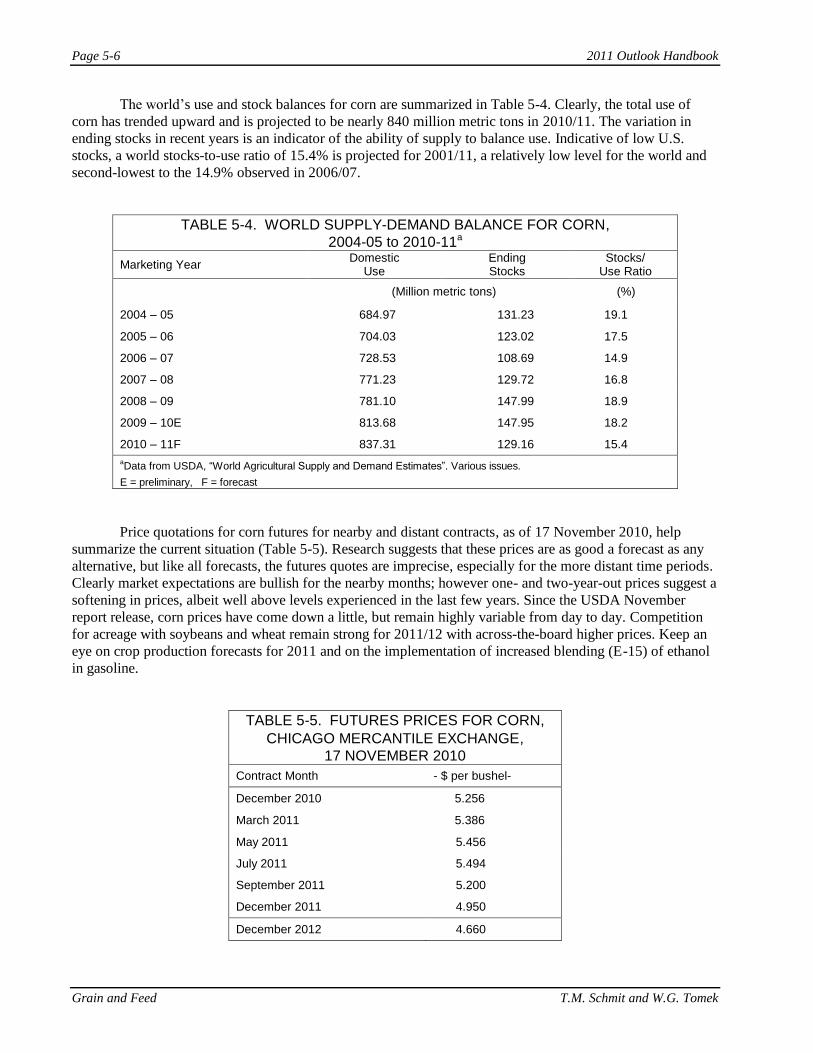
Page 5-6 2011 Outlook Handbook
Grain and Feed T.M. Schmit and W.G. Tomek
The world‟s use and stock balances for corn are summarized in Table 5-4. Clearly, the total use of
corn has trended upward and is projected to be nearly 840 million metric tons in 2010/11. The variation in
ending stocks in recent years is an indicator of the ability of supply to balance use. Indicative of low U.S.
stocks, a world stocks-to-use ratio of 15.4% is projected for 2001/11, a relatively low level for the world and
second-lowest to the 14.9% observed in 2006/07.
TABLE 5-4. WORLD SUPPLY-DEMAND BALANCE FOR CORN,
2004-05 to 2010-11a
Marketing Year Domestic
Use Ending Stocks
Stocks/ Use Ratio
(Million metric tons) (%)
2004 – 05 684.97 131.23 19.1
2005 – 06 704.03 123.02 17.5
2006 – 07 728.53 108.69 14.9
2007 – 08 771.23 129.72 16.8
2008 – 09 781.10 147.99 18.9
2009 – 10E 813.68 147.95 18.2
2010 – 11F 837.31 129.16 15.4
aData from USDA, “World Agricultural Supply and Demand Estimates”. Various issues.
E = preliminary, F = forecast
Price quotations for corn futures for nearby and distant contracts, as of 17 November 2010, help
summarize the current situation (Table 5-5). Research suggests that these prices are as good a forecast as any
alternative, but like all forecasts, the futures quotes are imprecise, especially for the more distant time periods.
Clearly market expectations are bullish for the nearby months; however one- and two-year-out prices suggest a
softening in prices, albeit well above levels experienced in the last few years. Since the USDA November
report release, corn prices have come down a little, but remain highly variable from day to day. Competition
for acreage with soybeans and wheat remain strong for 2011/12 with across-the-board higher prices. Keep an
eye on crop production forecasts for 2011 and on the implementation of increased blending (E-15) of ethanol
in gasoline.
TABLE 5-5. FUTURES PRICES FOR CORN,
CHICAGO MERCANTILE EXCHANGE,
17 NOVEMBER 2010
Contract Month - $ per bushel-
December 2010 5.256
March 2011 5.386
May 2011 5.456
July 2011 5.494
September 2011 5.200
December 2011 4.950
December 2012 4.660
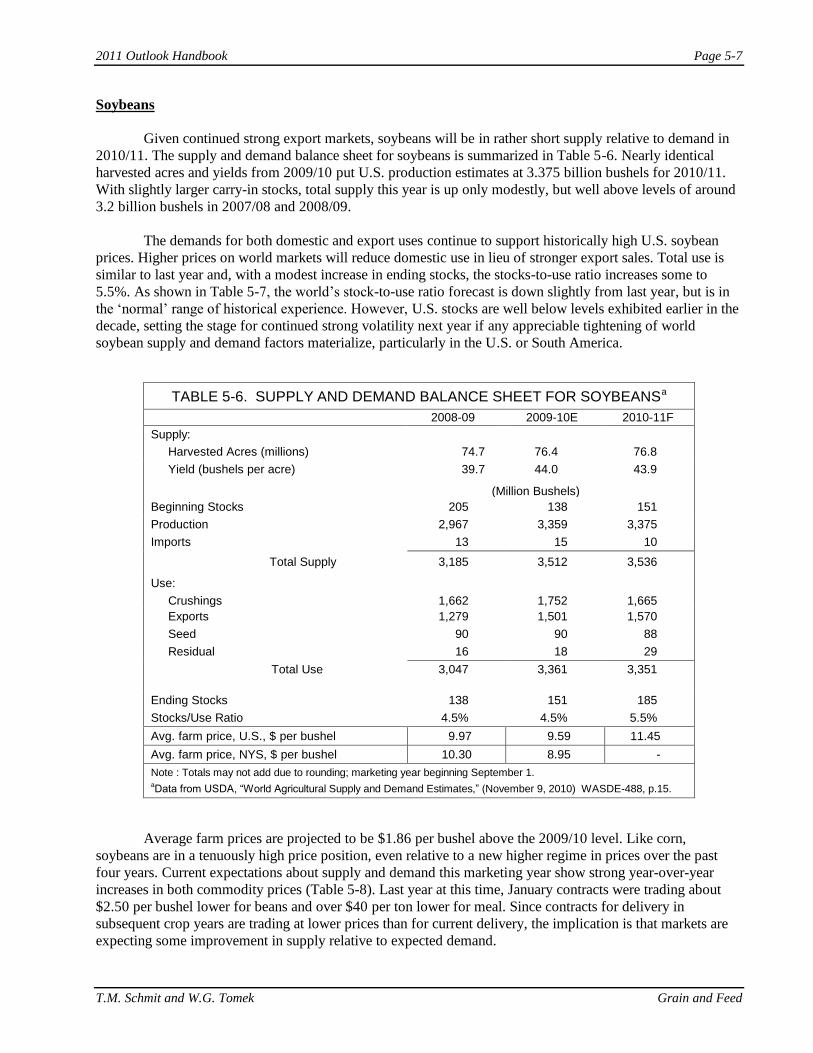
2011 Outlook Handbook Page 5-7
T.M. Schmit and W.G. Tomek Grain and Feed
Soybeans
Given continued strong export markets, soybeans will be in rather short supply relative to demand in
2010/11. The supply and demand balance sheet for soybeans is summarized in Table 5-6. Nearly identical
harvested acres and yields from 2009/10 put U.S. production estimates at 3.375 billion bushels for 2010/11.
With slightly larger carry-in stocks, total supply this year is up only modestly, but well above levels of around
3.2 billion bushels in 2007/08 and 2008/09.
The demands for both domestic and export uses continue to support historically high U.S. soybean
prices. Higher prices on world markets will reduce domestic use in lieu of stronger export sales. Total use is
similar to last year and, with a modest increase in ending stocks, the stocks-to-use ratio increases some to
5.5%. As shown in Table 5-7, the world‟s stock-to-use ratio forecast is down slightly from last year, but is in
the „normal‟ range of historical experience. However, U.S. stocks are well below levels exhibited earlier in the
decade, setting the stage for continued strong volatility next year if any appreciable tightening of world
soybean supply and demand factors materialize, particularly in the U.S. or South America.
TABLE 5-6. SUPPLY AND DEMAND BALANCE SHEET FOR SOYBEANSa
2008-09 2009-10E 2010-11F
Supply:
Harvested Acres (millions) 74.7 76.4 76.8
Yield (bushels per acre) 39.7 44.0 43.9
(Million Bushels)
Beginning Stocks 205 138 151
Production 2,967 3,359 3,375
Imports 13 15 10
Total Supply 3,185 3,512 3,536
Use:
Crushings 1,662 1,752 1,665
Exports 1,279 1,501 1,570
Seed 90 90 88
Residual 16 18 29
Total Use 3,047 3,361 3,351
Ending Stocks 138 151 185
Stocks/Use Ratio 4.5% 4.5% 5.5%
Avg. farm price, U.S., $ per bushel 9.97 9.59 11.45
Avg. farm price, NYS, $ per bushel 10.30 8.95 -
Note : Totals may not add due to rounding; marketing year beginning September 1. aData from USDA, “World Agricultural Supply and Demand Estimates,” (November 9, 2010) WASDE-488, p.15.
Average farm prices are projected to be $1.86 per bushel above the 2009/10 level. Like corn,
soybeans are in a tenuously high price position, even relative to a new higher regime in prices over the past
four years. Current expectations about supply and demand this marketing year show strong year-over-year
increases in both commodity prices (Table 5-8). Last year at this time, January contracts were trading about
$2.50 per bushel lower for beans and over $40 per ton lower for meal. Since contracts for delivery in
subsequent crop years are trading at lower prices than for current delivery, the implication is that markets are
expecting some improvement in supply relative to expected demand.

Page 5-8 2011 Outlook Handbook
Grain and Feed T.M. Schmit and W.G. Tomek
TABLE 5-7. WORLD SUPPLY-DEMAND BALANCE FOR SOYBEANS,
2004-05 to 2010-11a
Marketing Year Domestic
Use Ending Stocks
Stocks/ Use Ratio
(Million Metric Tons) (%)
2004 – 05 205.39 48.18 23.5
2005 – 06 215.21 52.94 24.6
2006 - 07 225.28 62.68 27.8
2007 – 08 229.75 52.91 23.0
2008 – 09 221.13 44.02 19.9
2009 – 10E 239.49 60.40 25.2
2010 – 11F 254.67 61.41 24.1
aData from USDA, “World Agricultural Supply and Demand Estimates.” Various issues.
E = preliminary, F = forecast
TABLE 5-8. FUTURES PRICES FOR SOYBEANS AND SOYBEAN MEAL,
CHICAGO MERCANTILE EXCHANGE, 17 NOVEMBER 2010
Contract Month Beans Meal
$ per bushel $ per ton
January 2011 12.050 329.8
March 2011 12.150 331.9
May 2011 12.106 330.7
July 2011 12.110 330.0
September 2011 11.594 213.2
November 2011 11.280 293.9 (Dec 2011)
November 2012 10.682 281.5 (Dec 2012)
Strong demand from China continues to underpin the market. China is the dominant buyer in world
soybean and soybean oil markets. Traders are wary about possible interest rate hikes in China after news about
credit tightening there to calm inflation fears, but good news entered the markets recently after Ireland has
accepted economic assistance from the European Union, giving the euro a boost and pressuring the U.S.
dollar. Recent dry conditions in key Brazilian soybean production regions may delay their 2011 harvest,
bringing additional supply-side uncertainty to the markets.
With uncertainty abound in expected demands abroad (seemingly changing on a daily basis), look for
continued wide price swings over the next several months. Continued strong export demand and a weakening
dollar could sustain soybean prices at high levels going into the next marketing year, but with the risk of
volatile world economic conditions, forecasting anything with confidence remains elusive.
Feeds
Reduced production estimates for corn and strong export markets have increased prices of feed-based
commodities, with damaging repercussions to U.S. livestock industries that are just recently showing signs of
recovery in output product prices. USDA forecasted prices for 2011 steers and broilers are currently 4.9% and

2011 Outlook Handbook Page 5-9
T.M. Schmit and W.G. Tomek Grain and Feed
3.1% above 2010 estimates, respectively. Hog prices, which showed strong increases in 2010, are expected to
increase modestly (about 1.3%) in 2011, while average all-milk prices for 2011 are similar to the 2010
average estimate. The egg industry, suffering from recent food safety issues and product recalls, will work to
regain lost returns with prices projected to remain below 2010 levels.
The reprieve in high feed costs in 2010 improved livestock returns in 2009, but given current
commodity prices, increased feed costs are expected in 2011. For farmers purchasing most of their feed
inputs, tight and possibly negative margins may occur as we get into 2011. If output prices fail to respond
proportionally, livestock and milk production may be curtailed as we get into next spring/summer and
eventually lead to higher product prices in the second half of the year. The USDA projected index of grain-
consuming animal units (GCAU) in 2010/11 is 92.3 million units, up from 91.6 million in the previous year,
with modest increases in feed fed per GCAU. As of 9 November 2010, USDA is expecting modest reductions
in red meat production in 2011, and modest increases in poultry and milk production.
Corn and soybean meal futures prices as of 17 November 2010 (Tables 5-5 and 5-8) are used, along
with other information, in a model to project selected mixed feed costs. One set of estimates for dairy, hog,
and layer feeds over the next two years is shown in Table 5-9. They suggest, for example, that 18% protein
dairy feed could be about $30 per ton higher this coming spring than a year earlier. Hog feed costs have an
even larger projected feed cost increase relative to 2010 actual feed costs, while layer feed costs are predicted
to soften.
As noted in the table‟s footnote, these particular results assume, among other things, that corn prices
will be $5.39 per bushel and soybean meal will be $332 per ton for 2011. These prices are consistent with
recent quotes for corn and soybean meal futures contracts for March delivery (and exclude basis adjustments).
All predictions are conditional on the assumed information. Obviously, actual ingredient prices next March
may be higher or lower than the quotes used in our analysis, and it is the volatility in the underlying ingredient
prices that makes feed costs difficult to forecast.
TABLE 5-9. APRIL COMPLETE FEED PRICES FOR DAIRY AND
LAYERS, NORTHEAST U.S., 2006-2010.a
Year Dairy (18%) Hog (14-18%) Layer
2006 217 290 237
2007 259 330 288
2008 312 376 332
2009 285 352 330 2010 272 284 368 2011F 302 372 333 a Historical prices from USDA Agricultural Prices. Authors’ 2011 forecasts are based on CME March 2011
contract settlement prices (17 November 2010) for corn and soybean meal, and assumed price correlations for corn and distillers dried grains with solubles of 0.70 and corn and meat and bone meal of 0.80. Specifically, assumed prices are respectively: corn $5.386 per bushel, soybean meal $331.9 per ton, distillers dried grains with solubles $174.0 per ton, and meat & bone meal $315.0 per ton.
Hedging Examples
A number of different risk management strategies are available to producers looking to assure a
positive expected return in volatile markets, e.g., by using forward contracts or futures and options contracts.
The right marketing/pricing strategy for the individual producer, however, depends on the individual‟s
attitudes towards risk, the firm‟s equity, and business management goals. Setting a price floor on output prices,
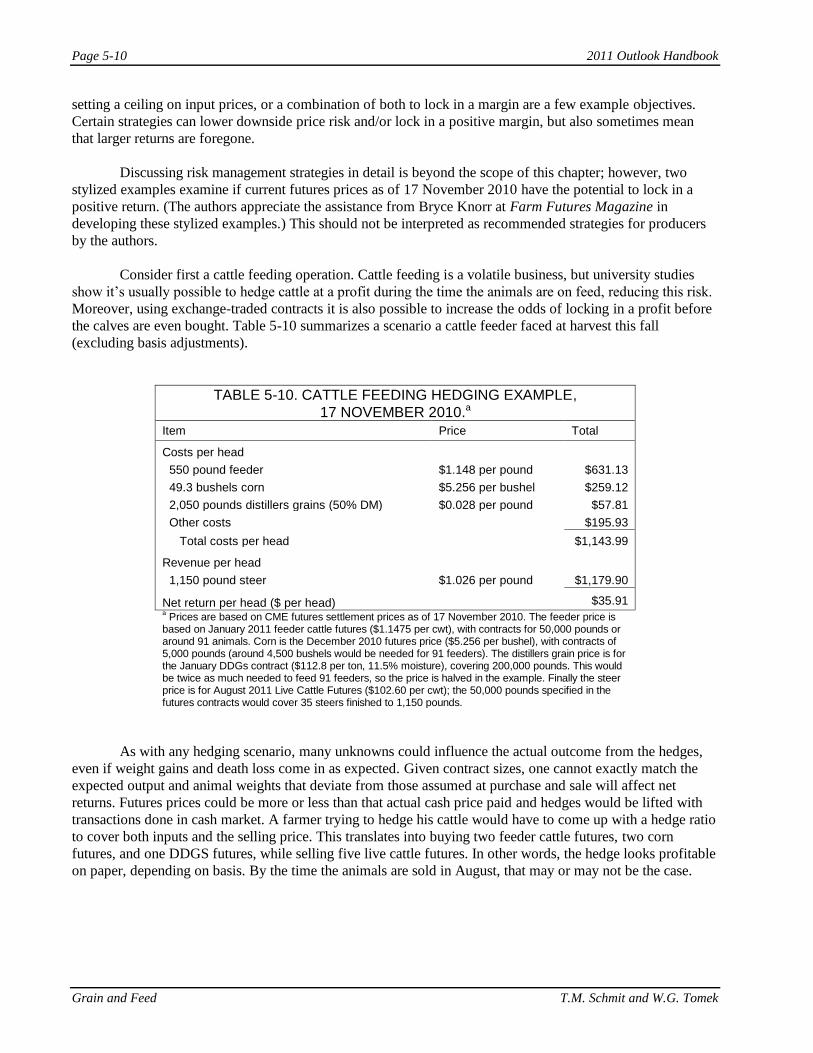
Page 5-10 2011 Outlook Handbook
Grain and Feed T.M. Schmit and W.G. Tomek
setting a ceiling on input prices, or a combination of both to lock in a margin are a few example objectives.
Certain strategies can lower downside price risk and/or lock in a positive margin, but also sometimes mean
that larger returns are foregone.
Discussing risk management strategies in detail is beyond the scope of this chapter; however, two
stylized examples examine if current futures prices as of 17 November 2010 have the potential to lock in a
positive return. (The authors appreciate the assistance from Bryce Knorr at Farm Futures Magazine in
developing these stylized examples.) This should not be interpreted as recommended strategies for producers
by the authors.
Consider first a cattle feeding operation. Cattle feeding is a volatile business, but university studies
show it‟s usually possible to hedge cattle at a profit during the time the animals are on feed, reducing this risk.
Moreover, using exchange-traded contracts it is also possible to increase the odds of locking in a profit before
the calves are even bought. Table 5-10 summarizes a scenario a cattle feeder faced at harvest this fall
(excluding basis adjustments).
TABLE 5-10. CATTLE FEEDING HEDGING EXAMPLE,
17 NOVEMBER 2010.a Item Price Total
Costs per head
550 pound feeder $1.148 per pound $631.13
49.3 bushels corn $5.256 per bushel $259.12
2,050 pounds distillers grains (50% DM) $0.028 per pound $57.81
Other costs $195.93
Total costs per head $1,143.99
Revenue per head
1,150 pound steer $1.026 per pound $1,179.90
Net return per head ($ per head) $35.91 a Prices are based on CME futures settlement prices as of 17 November 2010. The feeder price is
based on January 2011 feeder cattle futures ($1.1475 per cwt), with contracts for 50,000 pounds or around 91 animals. Corn is the December 2010 futures price ($5.256 per bushel), with contracts of 5,000 pounds (around 4,500 bushels would be needed for 91 feeders). The distillers grain price is for the January DDGs contract ($112.8 per ton, 11.5% moisture), covering 200,000 pounds. This would be twice as much needed to feed 91 feeders, so the price is halved in the example. Finally the steer price is for August 2011 Live Cattle Futures ($102.60 per cwt); the 50,000 pounds specified in the futures contracts would cover 35 steers finished to 1,150 pounds.
As with any hedging scenario, many unknowns could influence the actual outcome from the hedges,
even if weight gains and death loss come in as expected. Given contract sizes, one cannot exactly match the
expected output and animal weights that deviate from those assumed at purchase and sale will affect net
returns. Futures prices could be more or less than that actual cash price paid and hedges would be lifted with
transactions done in cash market. A farmer trying to hedge his cattle would have to come up with a hedge ratio
to cover both inputs and the selling price. This translates into buying two feeder cattle futures, two corn
futures, and one DDGS futures, while selling five live cattle futures. In other words, the hedge looks profitable
on paper, depending on basis. By the time the animals are sold in August, that may or may not be the case.

2011 Outlook Handbook Page 5-11
T.M. Schmit and W.G. Tomek Grain and Feed
The second example considers a dairy farm operation with 1,000 cows and comparable replacement
heifer complement. The average milk production per cow per month is 2,000 pounds. The farm manager is
contemplating hedging an individual month‟s production (here November 2011) and locking in an associated
milk-feed (concentrate) margin. Table 5-11 summarizes the scenario. It assumes pricing feed inputs at
contemporary futures prices for nearby contracts while pricing milk for a distant delivery month (see footnote
for details). Clearly, other prices can be used, depending on the individual farm situation.
TABLE 5-11. MILK PRODUCTION HEDGING EXAMPLE,
17 NOVEMBER 2010.a Item Price Total
Monthly costs per cow
5.0 bushels corn grain $5.256 per bushel $26.28
0.2 ton soybean meal $328.3 per ton $65.66
Other feed costs:
Roughages (grass, alfalfa, corn silage) $97.67
Other costs (minerals, vitamins, etc.) $33.85
Total feed cost $11.17 per cwt milk $223.46
Monthly revenue per cow
2000 pounds milk sales $15.47 per cwt milk $309.40
Producer price differential (Syracuse, NY) $2.50 per cwt milk $50.00
Total revenue $359.40
Net return per cow $6.80 per cwt milk $135.94 a Feed costs per cow include dry cow and replacement heifer costs. The corn price is based on
December 2010 corn futures ($5.256 per bushel), with 5,000 bushel contracts. Soybean meal is the December 2010 futures price ($328.3 per ton), with 100 ton contracts. Finally, the milk price is for November 2011 Class III Milk Futures (latest date with current trading), with 200,000 pounds per contract, plus an average producer price differential for Syracuse, NY in the Northeast Marketing Order.
Roughages are typically produced on the farm in New York, but are priced here at opportunity cost.
The milk producer trying to hedge his milk-feed margin for November 2011 would buy two soybean meal
contracts and one corn futures, while selling ten Class III milk futures. Again, the hedge looks profitable on
paper based on settlement prices 17 November 2010, depending on basis, leaving $6.80/cwt to cover other
variable production costs, including labor and management. Whether that is sufficient will depend on the
individual farm‟s operating costs, including those represented above as „other feed costs.
The important thing for producers is to have these types of models built to their own specific
circumstances, so they can look at hedge profitability. Tracking these returns can help the producer learn when
it‟s a “good” time to hedge, regardless of attempts to time the market. Our general point is current prices for
nearby and more distant contracts can be used to evaluate whether a hedge will assure a sufficient margin to
consider placing a hedge. There certainly will be times when relative prices will not assure a positive return,
but other periods when relative prices will make hedging profitable.

Notes
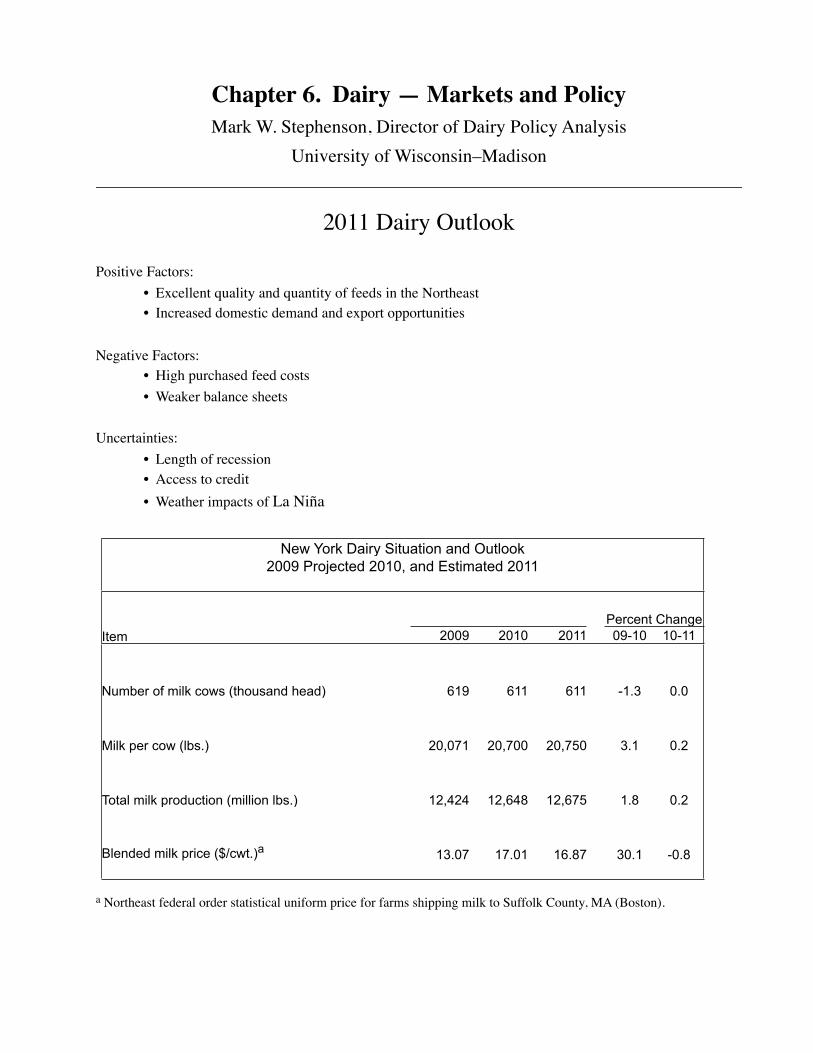
Chapter 6. Dairy — Markets and PolicyMark W. Stephenson, Director of Dairy Policy Analysis
University of Wisconsin–Madison!
2011 Dairy Outlook
Positive Factors:• Excellent quality and quantity of feeds in the Northeast• Increased domestic demand and export opportunities
Negative Factors:• High purchased feed costs• Weaker balance sheets
Uncertainties:• Length of recession• Access to credit• Weather impacts of La Niña
New York Dairy Situation and OutlookNew York Dairy Situation and OutlookNew York Dairy Situation and OutlookNew York Dairy Situation and OutlookNew York Dairy Situation and OutlookNew York Dairy Situation and OutlookNew York Dairy Situation and Outlook2009 Projected 2010, and Estimated 20112009 Projected 2010, and Estimated 20112009 Projected 2010, and Estimated 20112009 Projected 2010, and Estimated 20112009 Projected 2010, and Estimated 20112009 Projected 2010, and Estimated 20112009 Projected 2010, and Estimated 2011
Percent ChangePercent ChangeItem 2009 2010 2011 09-10 10-11
Number of milk cows (thousand head) 619 611 611 -1.3 0.0
Milk per cow (lbs.) 20,071 20,700 20,750 3.1 0.2
Total milk production (million lbs.) 12,424 12,648 12,675 1.8 0.2
Blended milk price ($/cwt.)a 13.07 17.01 16.87 30.1 -0.8
a Northeast federal order statistical uniform price for farms shipping milk to Suffolk County, MA (Boston).
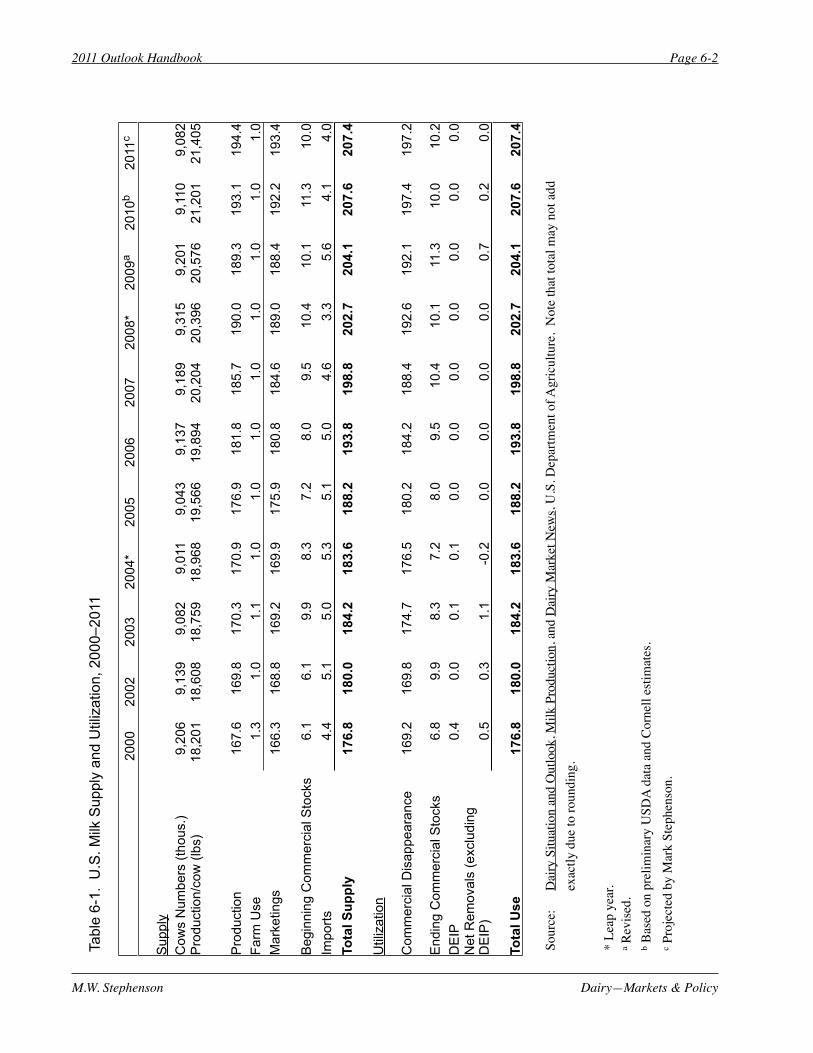
2011 Outlook Handbook Page 6-2
M.W. Stephenson Dairy—Markets & Policy
Sour
ce:
Dai
ry S
ituat
ion
and
Out
look
, Milk
Pro
duct
ion,
and
Dai
ry M
arke
t New
s, U
.S. D
epar
tmen
t of A
gric
ultu
re.
Not
e th
at to
tal m
ay n
ot a
dd
exac
tly d
ue to
roun
ding
.
* Le
ap y
ear.
a Rev
ised.
b Bas
ed o
n pr
elim
inar
y U
SDA
data
and
Cor
nell
estim
ates
.c P
roje
cted
by
Mar
k St
ephe
nson
.
20
0020
0220
0320
04*
2005
2006
2007
2008
*20
09a
2010
b20
11c
Sup
ply
C
ows
Num
bers
(tho
us.)
9,20
6 9,
139
9,08
2 9,
011
9,04
3 9,
137
9,18
9 9,
315
9,20
1 9,
110
9,08
2 P
rodu
ctio
n/co
w (l
bs)
18,2
01
18,6
08
18,7
59
18,9
68
19,5
66
19,8
94
20,2
04
20,3
96
20,5
76
21,2
01
21,4
05
P
rodu
ctio
n16
7.6
169.
8 17
0.3
170.
9 17
6.9
181.
8 18
5.7
190.
0 18
9.3
193.
1 19
4.4
Farm
Use
1.3
1.0
1.1
1.0
1.0
1.0
1.0
1.0
1.0
1.0
1.0
Mar
ketin
gs16
6.3
168.
8 16
9.2
169.
9 17
5.9
180.
8 18
4.6
189.
0 18
8.4
192.
2 19
3.4
Beg
inni
ng C
omm
erci
al S
tock
s6.
1 6.
1 9.
9 8.
3 7.
2 8.
0 9.
5 10
.4
10.1
11
.3
10.0
Im
ports
4.4
5.1
5.0
5.3
5.1
5.0
4.6
3.3
5.6
4.1
4.0
Tota
l Sup
ply
176.
8 18
0.0
184.
2 18
3.6
188.
2 19
3.8
198.
8 20
2.7
204.
1 20
7.6
207.
4
Util
izat
ion
Com
mer
cial
Dis
appe
aran
ce16
9.2
169.
8 17
4.7
176.
5 18
0.2
184.
2 18
8.4
192.
6 19
2.1
197.
4 19
7.2
End
ing
Com
mer
cial
Sto
cks
6.8
9.9
8.3
7.2
8.0
9.5
10.4
10
.1
11.3
10
.0
10.2
D
EIP
0.4
0.0
0.1
0.1
0.0
0.0
0.0
0.0
0.0
0.0
0.0
Net
Rem
oval
s (e
xclu
ding
D
EIP
)0.
5 0.
3 1.
1 -0
.2
0.0
0.0
0.0
0.0
0.7
0.2
0.0
Tota
l Use
176.
8 18
0.0
184.
2 18
3.6
188.
2 19
3.8
198.
8 20
2.7
204.
1 20
7.6
207.
4
Tabl
e 6-
1. U
.S. M
ilk S
uppl
y an
d U
tiliz
atio
n, 2
000–
2011

The Dairy Situation
2010 provided some price relief from the devastating milk prices of 2009. At it’s low in 2009, the All Milk price hit $11.30 per hundredweight and averaged $12.83 for the year. This value contrasted with the $18.33 that the All Milk price averaged in 2008. For 2010, the all milk price is forecast to average about $16.26 with a high price of $18.30 in October. The chart below shows the U.S. All Milk price calculated as an index with the average value over the years 1990-92 equal to 100. This is the same time period that the Livestock Expense Index uses as a base. Over the years, the Livestock Expense Index has trended higher than the All Milk Index. The chart would suggest that over time, dairy producers are finding ways to produce milk using less inputs. The chart also shows just how large the gap between input and milk prices was in 2009. Even though the gap was reduced, most dairy producers will not have gained any ground on equity that was lost in 2009.
80
100
120
140
160
180
200
Jan-
90
Aug
-90
Mar
-91
Oct
-91
May
-92
Dec
-92
Jul-9
3 Fe
b-94
S
ep-9
4 A
pr-9
5 N
ov-9
5 Ju
n-96
Ja
n-97
A
ug-9
7 M
ar-9
8 O
ct-9
8 M
ay-9
9 D
ec-9
9 Ju
l-00
Feb-
01
Sep
-01
Apr
-02
Nov
-02
Jun-
03
Jan-
04
Aug
-04
Mar
-05
Oct
-05
May
-06
Dec
-06
Jul-0
7 Fe
b-08
S
ep-0
8 A
pr-0
9 N
ov-0
9 Ju
n-10
INDICIES OF LIVESTOCK EXPENSES AND ALL MILK PRICE
Livestock Index
All Milk Price Index
The Milk Supply
Dairy producers had responded to the extraordinary high milk prices of 2007-08 by adding cows. Increased milk production is exactly the market response that high prices are calling for but, the milk production response hit the market about the same time as the world slid into economic recession.
2011 Outlook Handbook Page 6-3
M.W. Stephenson Dairy—Markets & Policy

The milk price collapse in 2009 was the result of high domestic milk production coupled with a decline in domestic and export demand for dairy products. It was the first year since 1991 that we have seen a decline in commercial disappearance of dairy products.
The milk price was so low that many dairy producers faced variable costs of production that were not covered by their milk price. In fact, many producers who purchase all of their feed found that in several months, not even the feed costs were covered by their milk price. Under these circumstances, an economist would suggest that the only rational solution is to stop production until prices recover—a feat that isn’t easy to do with milk cows.
Many milk producers did go out of business as a result of 2009’s low milk prices. But, many more producers in the situation of not covering their variable costs of production looked at each animal in their herd to see if they were covering their individual costs. As a result, a large number of cows were culled from the national herd as seen in the chart below. The majority of the culled cows came out of western states where purchased feeds were much more prevalent. The moderating milk prices in 2010 stopped the cow loss and actually increased numbers somewhat.
8,950
9,000
9,050
9,100
9,150
9,200
9,250
9,300
9,350
9,400
Jan Feb Mar Apr May Jun Jul Aug Sep Oct Nov Dec
1,00
0s o
f Cow
s
U.S. NUMBER OF DAIRY COWS
2007 2008 2009 2010
The other factor in milk production is the production per cow. In 2007, feed prices began to increase following corn prices up, in part because of new demand for ethanol production. Feed prices hit a peak in 2008 and, although they moderated, they seemed to find a new and higher plateau. Milk per cow had only modest gains from 2007 through 2009. However, genetic gains continued to accrue over that time period and when milk prices increased somewhat in 2010, milk per cow exploded to nearly 3% over 2009 levels.
2011 Outlook Handbook Page 6-4
M.W. Stephenson Dairy—Markets & Policy

Taken together, increased cow numbers coupled with increased milk per cow has reversed the loss in milk production that was seen in 2009. Western states, like California, Arizona and Idaho, increased milk production dramatically from 7% to more than 13% in September from year earlier levels.
-3.00%
-2.00%
-1.00%
0.00%
1.00%
2.00%
3.00%
4.00%
5.00%
6.00%
7.00%
Jan-01 Jan-02 Jan-03 Jan-04 Jan-05 Jan-06 Jan-07 Jan-08 Jan-09 Jan-10
PERCENT CHANGE IN U.S. MILK PRODUCTION
Dairy Product Demand
The recession, which began in 2009, was global in nature and had a great impact on the U.S. dairy industry. In the United States, unemployment rose to more than 10% in the last quarter of 2009 and has persisted at well more than 9% in 2010. Out-of-home eating had diminished significantly and many manufactured dairy products experienced lost or stagnant sales. There were however a few bright spots, such as fluid milk sales in 2009. Many folks attributed the increase in fluid milk consumption to families who were rediscovering their dining room table. When they were eating at home, they picked up an extra gallon of milk and additional fluid milk was consumed. However, it may be the case that the low milk price was also appreciated by consumers and that spurred greater consumption. In 2010, the higher milk price seems to brought fluid consumption back to lower pre-2009 levels.
The Restaurant Performance Index (RPI) certainly tells us something about dairy product consumption but it may also be a leading indicator of the general economy. The index is compiled by the National Restaurant Association from their members. Thousands of restaurants, from fine dining to fast food, respond to questions about the volume of customers in each month, the value of the meals purchased, number of employees, capital investments, etc. and the index is formulated such that a value of more than 100 indicates expansion of the restaurant industry and less than 100 is
2011 Outlook Handbook Page 6-5
M.W. Stephenson Dairy—Markets & Policy

suggestive of contraction. The RPI began to slide in 2007, long before the general population was aware that we were moving into recession. People simply were not eating out much as their incomes were becoming stretched. Currently, the RPI has been increasing and has experienced a few months above the 100 level indicating some expansion. This is good for dairy as is suggests that consumers are beginning to spend more and perhaps that we are climbing out of the recession.
95
96
97
98
99
100
101
102
103
Jan-05 Jan-06 Jan-07 Jan-08 Jan-09 Jan-10
RESTAURANT PERFORMANCE INDEX
Domestic markets are very important for product sales but increasingly, the U.S. dairy industry has embraced exports. Domestic growth in sales are likely to be limited to modest increases in per capita consumption and very stable but slow population growth. Exports are our portal for significant growth in sales. For many years, export sales accounted for 3-4 percent of our total milk supply—only slightly more than our imports of dairy products. In 2007-08 there were several reasons for increased export opportunities but, the bottom line is that our exports surged to 10-12 percent of our milk production and the value of exports for the first time ever was greater than imports. Exports collapsed in 2009 as the soft economies in other countries would not allow them the luxury of importing as much dairy product. These same economies have rebounded from the world wide recession more rapidly than our own and in 2010, exports have once again nearly reached the high levels of 2008.
2011 Outlook Handbook Page 6-6
M.W. Stephenson Dairy—Markets & Policy
Dairy Stocks
Commercial stocks of butter reached some of the lowest levels that we have seen since 2001 while natural cheese stocks were among the highest levels since the mid-1980s. Several factors account for this discrepancy.
Butterfat production was depressed in this country and across the globe. Feed quality probably had something to do with butterfat depression but so did unusually high global temperatures. The September year-to-date globally averaged temperature was virtually tied with 1988 as the warmest such period (January through September) on record. September also marked the first time in modern history that the Northwest Passage and the Northern Sea Route were ice free. Here in the U.S., temperature anomalies showed that several summer months were the hottest on record for states east of the Continental Divide. Still, Eastern Europe and Russia suffered more. Excessive heat in those areas caused widespread drought and crop failure and, milk production in those regions suffered as well. Russia imported a significant amount of butter—much of it from the U.S.—to make up for a shortfall in their production. The combination of less butterfat being produced and greater demand for butter exports increased the price of butter dramatically.
As we headed into 2010, milk production levels were strong but domestic and export demand was weak. Much of the extra milk production found it’s way into a cheese vat and we observed the largest growth in cheese production since 2006. A significant amount of cheese was exported but not enough to keep stocks at a comfortable level. In spite of high stocks, cheese prices remained strong for much of 2010 but have fallen off in the last quarter.
The Dairy Outlook
We can’t begin to forecast milk prices without acknowledging the severe impact that feed prices will have on the dairy industry in 2011. At an estimated 12.7 billion bushels, the 2010 U.S. corn crop was the third largest in history. However, the corn stocks-to-use ratio is estimated to be the smallest in 14 years. In part, the drought in Russia is to blame as they have not be selling wheat and other grains into world markets and worldwide demand for corn has been very strong. Ethanol production is also expected to use more corn this year as standards for inclusion into gasoline have increased from 10% to 15%. The futures markets have reacted to this information with corn prices over $6.00 a bushel in some months of the year ahead. Soybean markets have also been impacted and hay prices are expected to follow.
The chart below shows the National Agricultural Statistics Service (NASS) value of the dairy ration from 2000 and forecast through 2011. The increase in dairy feed prices are forecast to be as high as they were during their previous peak in 2008 but are expected to stay there for a longer time period. The futures markets are also forecasting a somewhat lower milk price in 2011 than we have seen in 2010. This will have a devastating impact on dairy farms who purchase the majority of their feed.
2011 Outlook Handbook Page 6-7
M.W. Stephenson Dairy—Markets & Policy

$0.00
$2.00
$4.00
$6.00
$8.00
$10.00
$12.00 Ja
n-20
00
Jan-
2001
Jan-
2002
Jan-
2003
Jan-
2004
Jan-
2005
Jan-
2006
Jan-
2007
Jan-
2008
Jan-
2009
Jan-
2010
Jan-
2011
NASS VALUE OF THE DAIRY RATION
Soybean Value
Corn Value
Alfalfa Value
Fore
cast
Farms who drew on credit reserves and whose equity position was greatly diminished in 2009 will face a most difficult year. Banks and input suppliers will look very carefully at the borrowing capacity of all requests and many farms will find that their credit capacity is not large enough for the need this year. If an unusual number of these farms are forced to terminate their businesses, the additional cows and facilities on the market will lower those asset values across the country putting additional stress on balance sheets.
Looking forward to 2011, I expect global demand for dairy products to remain strong. Asian economies have recovered more quickly than our own and exports to countries such as China have been strong. This would also be the case for our major export destination, Mexico, but trade south of the border may be hampered by a NAFTA dispute. The U.S. was supposed to lower the hurdle for long-haul trucks originating in that country with goods bound for the United States. We have not done that and Mexico has retaliated by holding up trucks with perishable dairy products bound for sale in Mexico or by including a penalty tariff on those goods. This is a small dispute and it will probably be cleared up in 2011 but it is putting pressure on dairy trade with Mexico.
The U.S. dollar has weakened against most major currencies. In particular, developing countries have seen their economies rebound while the European Union and the United States have been lackluster. Although this sounds like a problem, for U.S. exporters it is a boon making our goods look relatively less expensive. It also makes the United States look like a less attractive destination
2011 Outlook Handbook Page 6-8
M.W. Stephenson Dairy—Markets & Policy
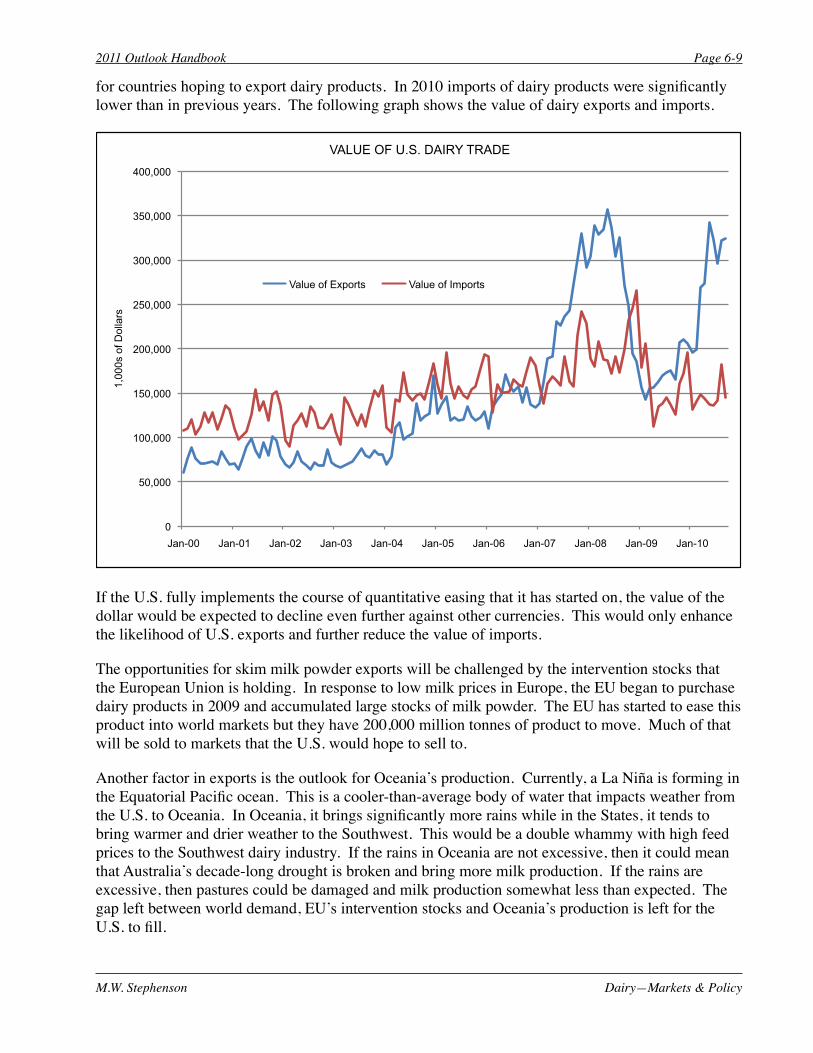
for countries hoping to export dairy products. In 2010 imports of dairy products were significantly lower than in previous years. The following graph shows the value of dairy exports and imports.
0
50,000
100,000
150,000
200,000
250,000
300,000
350,000
400,000
Jan-00 Jan-01 Jan-02 Jan-03 Jan-04 Jan-05 Jan-06 Jan-07 Jan-08 Jan-09 Jan-10
1,00
0s o
f Dol
lars
VALUE OF U.S. DAIRY TRADE
Value of Exports Value of Imports
If the U.S. fully implements the course of quantitative easing that it has started on, the value of the dollar would be expected to decline even further against other currencies. This would only enhance the likelihood of U.S. exports and further reduce the value of imports.
The opportunities for skim milk powder exports will be challenged by the intervention stocks that the European Union is holding. In response to low milk prices in Europe, the EU began to purchase dairy products in 2009 and accumulated large stocks of milk powder. The EU has started to ease this product into world markets but they have 200,000 million tonnes of product to move. Much of that will be sold to markets that the U.S. would hope to sell to.
Another factor in exports is the outlook for Oceania’s production. Currently, a La Niña is forming in the Equatorial Pacific ocean. This is a cooler-than-average body of water that impacts weather from the U.S. to Oceania. In Oceania, it brings significantly more rains while in the States, it tends to bring warmer and drier weather to the Southwest. This would be a double whammy with high feed prices to the Southwest dairy industry. If the rains in Oceania are not excessive, then it could mean that Australia’s decade-long drought is broken and bring more milk production. If the rains are excessive, then pastures could be damaged and milk production somewhat less than expected. The gap left between world demand, EU’s intervention stocks and Oceania’s production is left for the U.S. to fill.
2011 Outlook Handbook Page 6-9
M.W. Stephenson Dairy—Markets & Policy
Currently, I am forecasting a New York All Milk price that would average about 40¢ less than 2010. In particular, the first have of the year will experience lower prices with a significant rebound in the latter half. I also think that there is more upside potential in milk prices in the last two quarters than there is downside potential. It is my belief that milk futures markets are currently undervaluing milk prices in the latter half of the year. I would use caution in locking in second half prices and wait for opportunities to put a floor under them with options if desired.
The forecast for 2011 would not generate a Class I milk price in Boston lower than $16.94 which is the unadjusted trigger price for Milk Income Loss Contract (MILC) payments to producers. However, the projected high feed prices would adjust the $16.94 trigger to levels that would yield MILC payments in every month of 2011. The average MILC payment is projected to be about 60¢ per hundredweight reaching peak payments in July, 2011. MILC payments are currently capped at 2.985 million pounds of milk production.
Dairy Policy
We are looking forward to the 2012 Farm Bill. 2011 would normally be when serious discussions begin on the bill. Several dairy producer groups have been working on policy ideas to mitigate some of the milk price volatility that we have seen in the last few years. Price volatility appears to have two primary causes. One cause is internal to the dairy industry and seems to derive from lags along the supply chain. This volatility has several cycles but the predominant one is about 36 months in frequency (peak to peak) and is getting larger in magnitude over the last decade. The other source of volatility are economic shocks to the industry. We had a feed shock in 2008 and we are probably headed into another one in 2011. We also had a demand shock in 2009 with the economic recession.
Two bills have been introduced, H.R.5288 and S.3531 in the House and Senate respectively. The bills are very similar and have been referred to as the Costa-Sanders bills or the Dairy Price/Market Stabilization Program. These bills would seek to modify producer incentives to expand milk production at times when either milk prices are low and/or feed prices are high. They would implement market access fees for milk production that exceeds year earlier production levels by an allowable level of growth. The collected fees would be returned to dairy producers who did not exceed allowed growth levels effectively forming a price wedge between producers with rapid growth and those willing to grow more slowly.
National Milk Producers Federation has also been busy drafting their Foundation for the Future (FFTF)—a suite of policy changes that they would like to see implemented. FFTF would discard the venerable Dairy Product Price Support Program and the Milk Income Loss Contracts and replace them with a new safety net. The Dairy Producer Margin Protection Program would act as an insurance program. The margin is calculated as the difference between the All Milk Price and a Ration Value. The premium for a base level of protection at $4.00 would be completely paid for by taxpayer funds. A dairy producer would be able to buy higher levels of protection at decreasingly subsidized premiums. Under FFTF, several Federal Milk Marketing Order reforms would also take place, the most notable of which is the replacement of dairy product price formulas by a competitive pay price determined from all class III plants buying more than 500,000 pounds of milk a day. Arguably, the most potent part of the FFTF is the Dairy Market Stabilization Program which seeks to
2011 Outlook Handbook Page 6-10
M.W. Stephenson Dairy—Markets & Policy
incentivize dairy producers to manage their milk production. Using the same margin calculation as the Margin Protection Program, dairy producers would only be paid for 98% of their milk base calculated as the most recent rolling average 3 months of production if the margin was less than $6 for a consecutive two months. The penalty would increase to production above 97% or 96% of base if the margin was $5 or $4 respectively. The money from penalty milk that was marketed would be used for demand enhancing programs (for instance, purchase of dairy products to be given away through non-commercial channels).
In-depth analyses of these proposals and AgriMark’s Marginal Milk Pricing plan can be found at http://dairy.wisc.edu/ The analyses indicate that all three programs would significantly reduce milk price volatility and also indicate that government expenditures under all of the programs would be greatly reduced. If milk prices don’t go to the deep low’s of 2009 or don’t stay there for as long, the safety net programs are seldom invoked.
The mid-term elections of 2010 showed just how dissatisfied voters were with the state of the economy. Republicans gained 6 seats in the Senate but the majority was retained by the Democrats. Republicans gained 60 seats in the House and more than enough to take control. All of this has implications for dairy policy. In recent years, the House has taken the lead on drafting Farm Bill policy and, prior to the election, Collin Peterson, the House Agricultural Committee Chairman, had already begun holding listening sessions in preparation for the legislation.
The new incoming Chair of the House Agriculture committee will be Republican Frank Lucas of the 3rd Congressional District in Oklahoma. The Chairperson of the Senate Agriculture Committee, Blanche Lincoln, lost her bid for re-election. It is likely that Debbie Stabenow, from Michigan, will take over that position. Changes in leadership in both committees presents a continuity challenge but there are greater challenges than leadership.
Many of the Republicans elected into Congress were supported by Tea Party—a very conservative group. These freshman Congress men and women feel as though they have a mandate for significant change and many are not prepared to be guided by senior members of their own party. In effect, we could have a three party system for a period of time until, or if, Republicans can pull together and this could take at least a year. By that time, we will be into the next election cycle including the Presidential race. It isn’t hard to imagine that the Farm Bill gets put off until 2013.
It will be hard to know what the primary drivers and motivation will be for the next Farm Bill, but it is safe to say that there will be much less money to be spent on programs. That favors policy like the three proposals discussed earlier. They are very low-cost to operate and dramatically reduce taxpayer support by keeping milk prices above safety net levels most of the time.
2011 Outlook Handbook Page 6-11
M.W. Stephenson Dairy—Markets & Policy
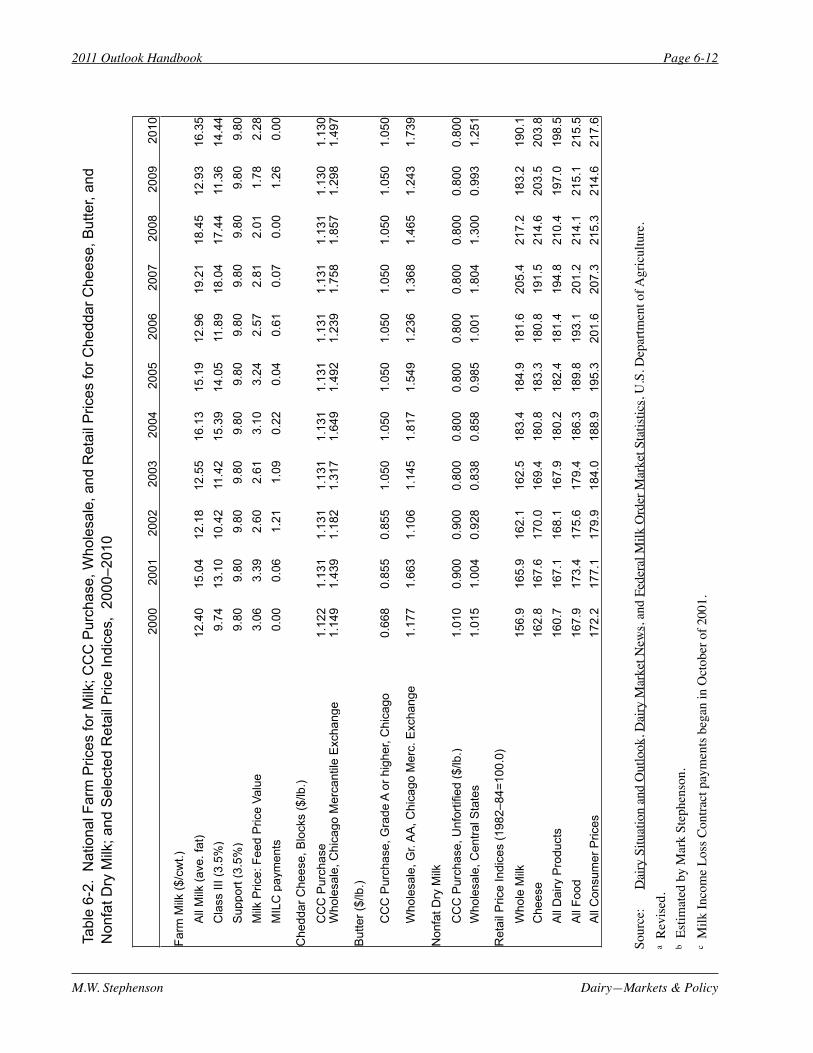
2011 Outlook Handbook Page 6-12
M.W. Stephenson Dairy—Markets & Policy
2000
2001
2002
2003
2004
2005
2006
2007
2008
2009
2010
Farm
Milk
($/c
wt.)
Farm
Milk
($/c
wt.)
A
ll M
ilk (a
ve. f
at)
12.4
015
.04
12.1
812
.55
16.1
315
.19
12.9
619
.21
18.4
512
.93
16.3
5
Cla
ss II
I (3.
5%)
9.74
13.1
010
.42
11.4
215
.39
14.0
511
.89
18.0
417
.44
11.3
614
.44
S
uppo
rt (3
.5%
)9.
809.
809.
809.
809.
809.
809.
809.
809.
809.
809.
80
Milk
Pric
e: F
eed
Pric
e Va
lue
3.06
3.39
2.60
2.61
3.10
3.24
2.57
2.81
2.01
1.78
2.28
M
ILC
pay
men
ts0.
000.
061.
211.
090.
220.
040.
610.
070.
001.
260.
00
Che
ddar
Che
ese,
Blo
cks
($/lb
.)C
hedd
ar C
hees
e, B
lock
s ($
/lb.)
C
CC
Pur
chas
e1.
122
1.13
11.
131
1.13
11.
131
1.13
11.
131
1.13
11.
131
1.13
01.
130
W
hole
sale
, Chi
cago
Mer
cant
ile E
xcha
nge
1.14
91.
439
1.18
21.
317
1.64
91.
492
1.23
91.
758
1.85
71.
298
1.49
7
But
ter (
$/lb
.)B
utte
r ($/
lb.)
C
CC
Pur
chas
e, G
rade
A o
r hig
her,
Chi
cago
0.66
80.
855
0.85
51.
050
1.05
01.
050
1.05
01.
050
1.05
01.
050
1.05
0
W
hole
sale
, Gr.
AA
, Chi
cago
Mer
c. E
xcha
nge
1.17
71.
663
1.10
61.
145
1.81
71.
549
1.23
61.
368
1.46
51.
243
1.73
9
Non
fat D
ry M
ilkN
onfa
t Dry
Milk
C
CC
Pur
chas
e, U
nfor
tifie
d ($
/lb.)
1.01
00.
900
0.90
00.
800
0.80
00.
800
0.80
00.
800
0.80
00.
800
0.80
0
Who
lesa
le, C
entra
l Sta
tes
1.01
51.
004
0.92
80.
838
0.85
80.
985
1.00
11.
804
1.30
00.
993
1.25
1
Ret
ail P
rice
Indi
ces
(198
2–84
=100
.0)
Ret
ail P
rice
Indi
ces
(198
2–84
=100
.0)
2000
2001
2002
2003
2004
2005
W
hole
Milk
156.
916
5.9
162.
116
2.5
183.
418
4.9
181.
620
5.4
217.
218
3.2
190.
1
Che
ese
162.
816
7.6
170.
016
9.4
180.
818
3.3
180.
819
1.5
214.
620
3.5
203.
8
All
Dai
ry P
rodu
cts
160.
716
7.1
168.
116
7.9
180.
218
2.4
181.
419
4.8
210.
419
7.0
198.
5
All
Food
167.
917
3.4
175.
617
9.4
186.
318
9.8
193.
120
1.2
214.
121
5.1
215.
5
All
Con
sum
er P
rices
172.
217
7.1
179.
918
4.0
188.
919
5.3
201.
620
7.3
215.
321
4.6
217.
6
Tabl
e 6-
2. N
atio
nal F
arm
Pric
es fo
r Milk
; CC
C P
urch
ase,
Who
lesa
le, a
nd R
etai
l Pric
es fo
r Che
ddar
Che
ese,
But
ter,
and
Non
fat D
ry M
ilk; a
nd S
elec
ted
Ret
ail P
rice
Indi
ces,
200
0–20
10
Sour
ce:
Dai
ry S
ituat
ion
and
Out
look
, Dai
ry M
arke
t New
s, an
d Fe
dera
l Milk
Ord
er M
arke
t Sta
tistic
s, U
.S. D
epar
tmen
t of A
gric
ultu
re.
a Re
vise
d.b
Estim
ated
by
Mar
k St
ephe
nson
.c
Milk
Inco
me
Loss
Con
tract
pay
men
ts be
gan
in O
ctob
er o
f 200
1.

MILK PRICE PROJECTIONS*MILK PRICE PROJECTIONS*MILK PRICE PROJECTIONS*MILK PRICE PROJECTIONS*MILK PRICE PROJECTIONS*MILK PRICE PROJECTIONS*MILK PRICE PROJECTIONS*MILK PRICE PROJECTIONS*Northeast Federal Order Blend PriceNortheast Federal Order Blend PriceNortheast Federal Order Blend PriceNortheast Federal Order Blend PriceNortheast Federal Order Blend PriceNortheast Federal Order Blend PriceNortheast Federal Order Blend PriceNortheast Federal Order Blend Price
3.5 Percent, Suffolk County, Massachusetts3.5 Percent, Suffolk County, Massachusetts3.5 Percent, Suffolk County, Massachusetts3.5 Percent, Suffolk County, Massachusetts3.5 Percent, Suffolk County, Massachusetts3.5 Percent, Suffolk County, Massachusetts3.5 Percent, Suffolk County, Massachusetts3.5 Percent, Suffolk County, MassachusettsLast Quarter 2009-2010, Four Quarters 2010-2011Last Quarter 2009-2010, Four Quarters 2010-2011Last Quarter 2009-2010, Four Quarters 2010-2011Last Quarter 2009-2010, Four Quarters 2010-2011Last Quarter 2009-2010, Four Quarters 2010-2011Last Quarter 2009-2010, Four Quarters 2010-2011Last Quarter 2009-2010, Four Quarters 2010-2011Last Quarter 2009-2010, Four Quarters 2010-2011
Month 2009 2010 Difference (dollars per hundredweight)(dollars per hundredweight)(dollars per hundredweight)(dollars per hundredweight)(dollars per hundredweight) October 14.06 18.61 4.55NovemberNovember 15.81 18.90a 3.09DecemberDecember 16.11 17.30a 1.19Fourth Quarter AverageFourth Quarter AverageFourth Quarter Average 15.33 18.27a 2.94 Annual AverageAnnual Average 19.85 18.76 -1.09 Month 2010 2011a Difference (dollars per hundredweight)(dollars per hundredweight)(dollars per hundredweight)(dollars per hundredweight)(dollars per hundredweight)January 16.26 16.51 0.25February 16.30 16.26 -0.04March 15.54 16.51 0.97First Quarter AverageFirst Quarter AverageFirst Quarter Average 16.03 16.43 0.39 April 15.11 16.51 1.40May 15.91 16.49 0.58June 16.73 16.57 -0.16Second Quarter AverageSecond Quarter AverageSecond Quarter Average 15.92 16.52 0.61 July 17.43 16.70 -0.73August 17.74 17.02 -0.72SeptemberSeptember 18.33 17.29 -1.04Third Quarter AverageThird Quarter AverageThird Quarter Average 17.83 17.00 -0.83 October 18.61 17.48 -1.13NovemberNovember 18.90a 17.58 -1.32DecemberDecember 17.30a 17.50 0.20Fourth Quarter AverageFourth Quarter AverageFourth Quarter Average 18.27a 17.52 -0.75 Annual AverageAnnual Average 17.01a 16.87a -0.15
* Averages may not add due to rounding.a Projected.
2011 Outlook Handbook Page 6-13
M.W. Stephenson Dairy—Markets & Policy

Notes
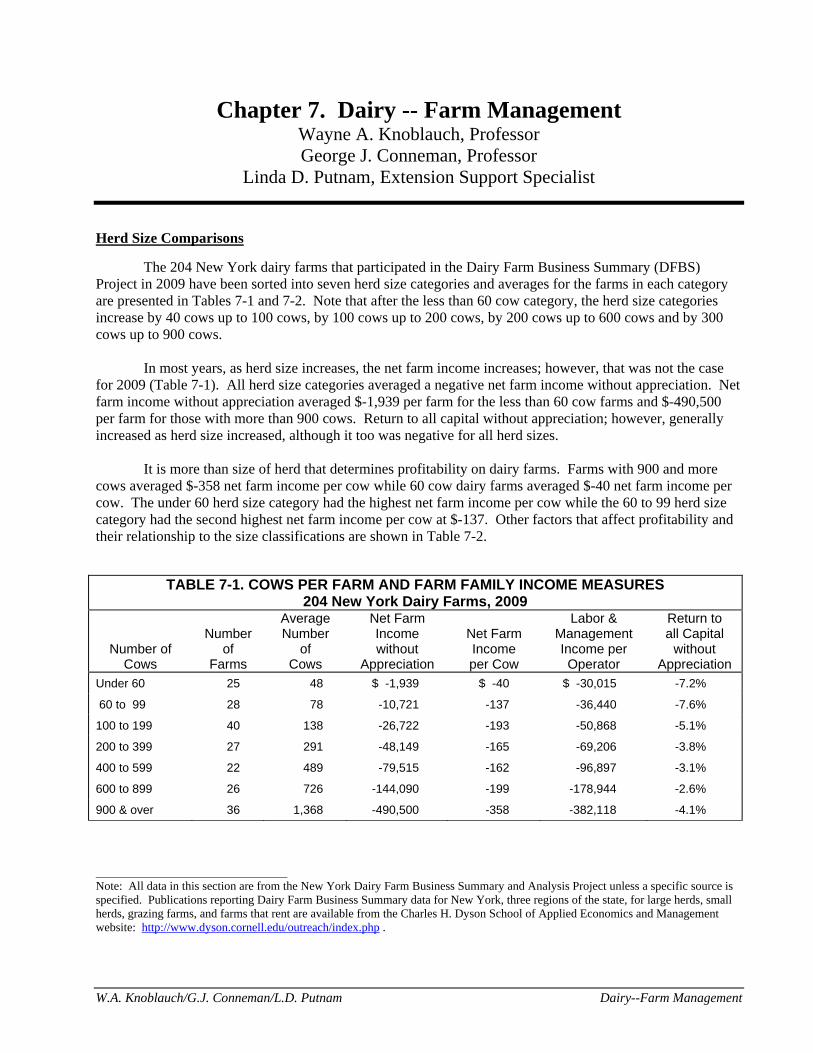
W.A. Knoblauch/G.J. Conneman/L.D. Putnam Dairy--Farm Management
Chapter 7. Dairy -- Farm Management Wayne A. Knoblauch, Professor George J. Conneman, Professor
Linda D. Putnam, Extension Support Specialist
Herd Size Comparisons The 204 New York dairy farms that participated in the Dairy Farm Business Summary (DFBS) Project in 2009 have been sorted into seven herd size categories and averages for the farms in each category are presented in Tables 7-1 and 7-2. Note that after the less than 60 cow category, the herd size categories increase by 40 cows up to 100 cows, by 100 cows up to 200 cows, by 200 cows up to 600 cows and by 300 cows up to 900 cows. In most years, as herd size increases, the net farm income increases; however, that was not the case for 2009 (Table 7-1). All herd size categories averaged a negative net farm income without appreciation. Net farm income without appreciation averaged $-1,939 per farm for the less than 60 cow farms and $-490,500 per farm for those with more than 900 cows. Return to all capital without appreciation; however, generally increased as herd size increased, although it too was negative for all herd sizes. It is more than size of herd that determines profitability on dairy farms. Farms with 900 and more cows averaged $-358 net farm income per cow while 60 cow dairy farms averaged $-40 net farm income per cow. The under 60 herd size category had the highest net farm income per cow while the 60 to 99 herd size category had the second highest net farm income per cow at $-137. Other factors that affect profitability and their relationship to the size classifications are shown in Table 7-2.
TABLE 7-1. COWS PER FARM AND FARM FAMILY INCOME MEASURES 204 New York Dairy Farms, 2009
Number of Cows
Number
of Farms
Average Number
of Cows
Net Farm Income without
Appreciation
Net Farm Income per Cow
Labor & Management Income per Operator
Return to all Capital
without Appreciation
Under 60 25 48 $ -1,939 $ -40 $ -30,015 -7.2%
60 to 99 28 78 -10,721 -137 -36,440 -7.6%
100 to 199 40 138 -26,722 -193 -50,868 -5.1%
200 to 399 27 291 -48,149 -165 -69,206 -3.8%
400 to 599 22 489 -79,515 -162 -96,897 -3.1%
600 to 899 26 726 -144,090 -199 -178,944 -2.6%
900 & over 36 1,368 -490,500 -358 -382,118 -4.1% Note: All data in this section are from the New York Dairy Farm Business Summary and Analysis Project unless a specific source is specified. Publications reporting Dairy Farm Business Summary data for New York, three regions of the state, for large herds, small herds, grazing farms, and farms that rent are available from the Charles H. Dyson School of Applied Economics and Management website: http://www.dyson.cornell.edu/outreach/index.php .

2011 Outlook Handbook
Dairy--Farm Management W.A. Knoblauch/G.J. Conneman/L.D. Putnam
Page 7-2
This year, net farm income per cow did not exhibit the usual increase as herd size increased. All herd size categories saw a decrease in operating cost of producing milk from a year earlier (Table 7-2). Net farm income per cow will increase as farms become larger if the costs of increased purchased inputs are offset by greater and more efficient output. The farms with more than 900 cows averaged more milk sold per cow than any other size category (Table 7-2). With 25,229 pounds of milk sold per cow, farms in the largest herd size group averaged 9.1 percent more milk output per cow than the average of all herds in the summary with less than 900 cows. The ability to reach high levels of milk output per cow with a large herd is a major key to profitability. Three times a day milking (3X) and supplementing with bST are herd management practices commonly used to increase milk output per cow in large herds. Many dairy farmers who have been willing and able to employ and manage the labor required to milk 3 times per day have been successful. Only 2 percent of the 53 DFBS farms with less than 100 cows used a milking frequency greater than 2 times per day. As herd size increased, the percent of herds using a higher milking frequency increased. Farms with 100 to 200 cows reported 8 percent of the herds milking more often than 2 times per day, the 200-399 cow herds reported 74 percent, 400-599 cow herds reported 77 percent, 600-899 cow herds reported 81 percent, and the 900 cow and larger herds reported 89 percent exceeding the 2 times per day milking frequency.
TABLE 7-2. COWS PER FARM AND RELATED FARM FACTORS 204 New York Dairy Farms, 2009
Number
Average Number
of
Milk Sold
Per Cow
Milk Sold Per Worker
Till- able
Acres
Forage DM Per
Cow
Farm Capital
Per
Cost of Producing Milk/Cwt.
of Cows Cows (lbs.) (cwt.) Per Cow (tons) Cow Operating Total Under 60 48 17,805 4,533 3.4 8.2 $11,742 $12.08 $21.42
60 to 99 78 18,114 5,350 3.2 8.2 10,420 12.83 20.66
100 to 199 138 19,978 6,683 2.9 8.2 10,292 13.21 18.79
200 to 399 291 23,702 9,865 2.3 8.0 8,420 13.25 16.62
400 to 599 489 23,118 9,492 2.5 8.0 9,492 13.47 17.25
600 to 899 726 24,729 10,800 1.9 8.1 8,833 13.56 16.59
900 & over 1,368 25,229 12,174 1.9 8.3 8,890 13.98 16.90 Milk output per worker has always shown a strong correlation with herd size. The farms with 100 cows or more averaged over 1,089,695 pounds of milk sold per worker while the farms with less than 100 cows averaged less than 503,050 pounds per worker. In achieving the highest productivity per cow and per worker, the largest farms had the fewest crop acres per cow and above average forage dry matter harvested per cow. However, the larger farms generally purchased more roughage per cow. The 200 to 399 herd size group had the more efficient use of farm capital with an average investment of $8,420 per cow. The 26 farms with 600 to 899 cows had the lowest total cost of producing milk at $16.59 per hundredweight. This is $2.02 below the $18.61 average for the remaining 178 dairy farms. The lower average costs of production plus a similar milk price gave the managers of these large dairy farms profit margins (milk price less total cost of producing milk) that averaged $2.30 per hundredweight above the average of the other 178 DFBS farms. All herd size categories averaged a negative profit margin in 2009.

2011 Outlook Handbook
W.A. Knoblauch/G.J. Conneman/L.D. Putnam Dairy--Farm Management
Page 7-3
Dairy Operations and Milk Cow Inventory
TABLE 7-3. NUMBER OF DAIRY FARMS AND MILK COWS BY SIZE OF HERD New York State, 2009 a, b
Size of Herd
Farms
Milk Cows
Number of Cows
Number
% of Total
Number
% of Total
1 – 29
1,050
19.8%
10,500
1.7%
30 – 49
1,000
18.9%
35,000
5.7%
50 – 99
1,800
34.0%
131,000
21.2%
100 – 199
858
16.1%
111,500
18.0%
200 – 499
385
7.3%
121,000
19.5%
500 – 749
105
1.98%
65,000
10.5%
750 – 999
35
0.66%
31,000
5.0%
1,000 – 1,499
37
0.70%
44,000
7.1%
1,500 – 1,999
15
0.28%
26,500
4.3%
2,000 or more
15
0.28%
43,500
7.0%
Total
5,300
100.0%
619,000
100.0%
aThis information on number of farms and number of cows by size of herd is derived from several sources: - Dairy Statistics as published by the New York Agricultural Statistics Services for 2009. - CAFO (Concentrated Animal Feeding Operations) permit reports for 2009. Some small CAFO farms (farms with 200
to 700 milk cows) have not applied for or updated the permit. Estimates for these farms were made so as to reflect the total number of dairy farms in New York State; revision from Census in certain size categories.
b The author wishes to thank everyone who provided some data as well as providing valuable advice and perspectives. However, any errors, omissions or misstatements are solely the responsibility of the author, Professor George Conneman, e-mail [email protected].
In 2009, there were 5,300 dairy farms in New York State, and 619,000 milk cows. The table
above was prepared based on the NYASS data plus the CAFO permit filing for additional herd size categories, and estimates from the 2007 Census.
Eighty-nine percent of the farms (less than 200 cows per farm) had 47 percent of the milk cows.
The remaining eleven percent of the farms had 53 percent of the cows. About 4 percent of the farms (those with 500 or more cows) had 34 percent of the cows. Farms with less than 50 cows represent 39 percent of all farms but kept only 7 percent of the
cows. Farms with 1,000 or more cows represent about 1.25 percent of the farms but kept over 18 percent
of the cows.
Ten-Year Comparisons The total cost of producing milk on DFBS farms has increased $2.55 per hundredweight over the past 10 years (Table 7-4). In the intervening years, total cost of production increased in 2001, fell in 2002, again increased in 2003 and 2004, decreased in 2005 and 2006, increased in 2007 and 2008, and decreased in 2009. It is interesting to note that costs of production decrease in low milk price years and increase in high milk price years. Over the 10 years, milk sold per cow increased 13 percent and cows per worker increased 10 percent on DFBS farms (Table 7-5). Farm net worth has increased significantly, while percent equity has been fairly stable.
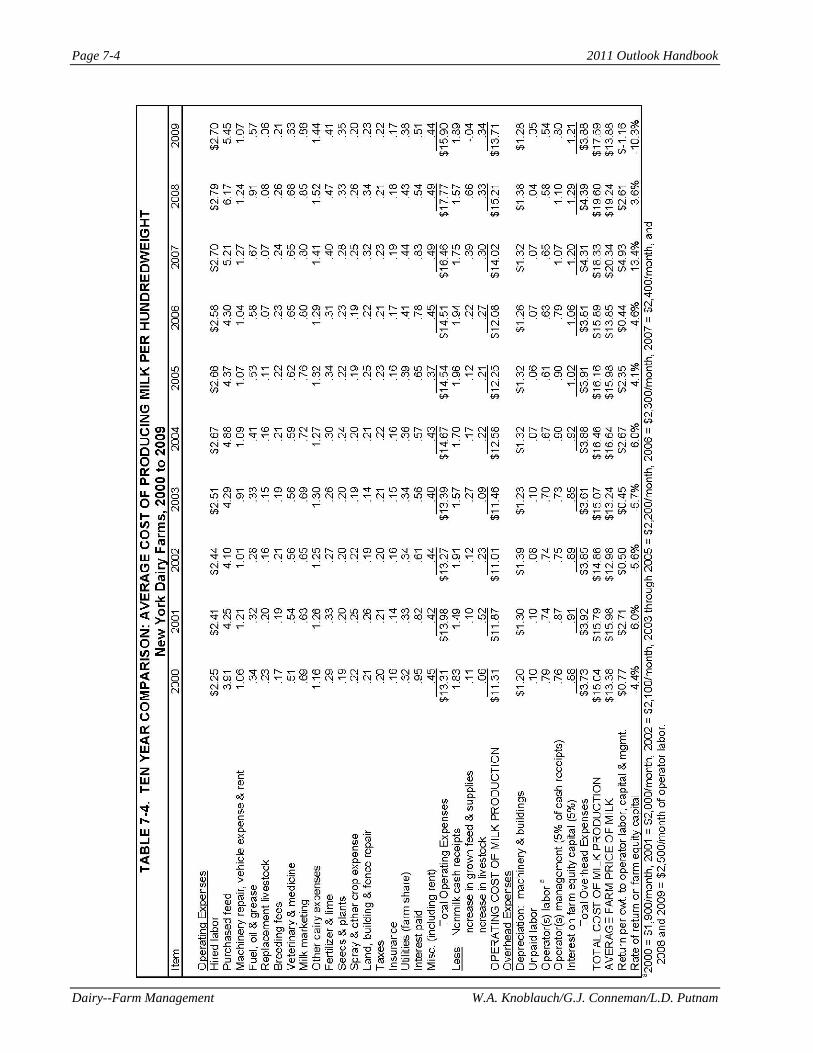
2011 Outlook Handbook
Dairy--Farm Management W.A. Knoblauch/G.J. Conneman/L.D. Putnam
Page 7-4

2011 Outlook Handbook
W.A. Knoblauch/G.J. Conneman/L.D. Putnam Dairy--Farm Management
Page 7-5

2011 Outlook Handbook
Dairy--Farm Management W.A. Knoblauch/G.J. Conneman/L.D. Putnam
Page 7-6
TABLE 7-6. COMPARISON OF FARM BUSINESS SUMMARY DATA Same 79 New York Dairy Farms, 2000 - 2009
Selected Factors
2000
2001
2002
2003
Milk receipts per cwt. milk $13.58 $16.05 $13.01 $13.31 Size of Business Average number of cows 348 377 403 422 Average number of heifers 262 280 310 324 Milk sold, cwt. 78,771 85,907 93,622 97,400 Worker equivalent 8.17 8.79 9.33 9.87 Total tillable acres 711 740 783 828 Rates of Production Milk sold per cow, lbs. 22,610 22,792 23,255 23,075 Hay DM per acre, tons 3.7 3.2 3.4 3.4 Corn silage per acre, tons 16 17 15 18 Labor Efficiency Cows per worker 43 43 43 43 Milk sold per worker, lbs. 964,151 977,327 1,003,454 986,830 Cost Control Grain & concentrate purchased as % of milk sales 27% 25% 30% 31% Dairy feed & crop expense per cwt. milk $4.61 $5.01 $4.82 $5.03 Operating cost of producing cwt. milk $11.05 $11.92 $11.00 $11.43 Total cost of producing cwt. milk $13.96 $14.94 $14.03 $14.32 Hired labor cost per cwt. $2.40 $2.55 $2.56 $2.62 Interest paid per cwt. $0.88 $0.76 $0.55 $0.52 Labor & machinery costs per cow $1,190 $1,263 $1,244 $1,238 Replacement livestock expense $17,400 $14,326 $14,105 $15,192 Expansion livestock expense $26,100 $27,898 $26,598 $23,210 Capital Efficiency Farm capital per cow $6,295 $6,490 $6,615 $6,626 Machinery & equipment per cow $1,175 $1,161 $1,178 $1,135 Real estate per cow $2,372 $2,471 $2,489 $2,561 Livestock investment per cow $1,574 $1,680 $1,787 $1,816 Asset turnover ratio 0.59 0.69 0.57 0.57 Profitability Net farm income without appreciation $90,365 $243,210 $54,902 $57,058 Net farm income with appreciation $134,822 $365,375 $131,048 $132,636 Labor & management income per operator/manager
$14,519
$94,752
$-14,915
$-17,291
Rate return on: Equity capital with appreciation 5.2% 20.3% 3.6% 3.6% All capital with appreciation 6.1% 14.5% 4.1% 3.9% All capital without appreciation 4.2% 9.5% 1.2% 1.2% Financial Summary, End Year Farm net worth $1,253,444 $1,552,665 $1,566,194 $1,622,416 Change in net worth with appreciation $32,179 $247,636 $9,211 $49,590 Debt to asset ratio 0.44 0.40 0.42 0.44 Farm debt per cow $2,723 $2,691 $2,773 $2,937 Farms participating in the DFBS each of the last 10 years have increased size of business, labor efficiency and milk sold per cow (Table 7-6). All measures of profitability exhibit wide variability from year-to-year and are highly correlated with milk price received.
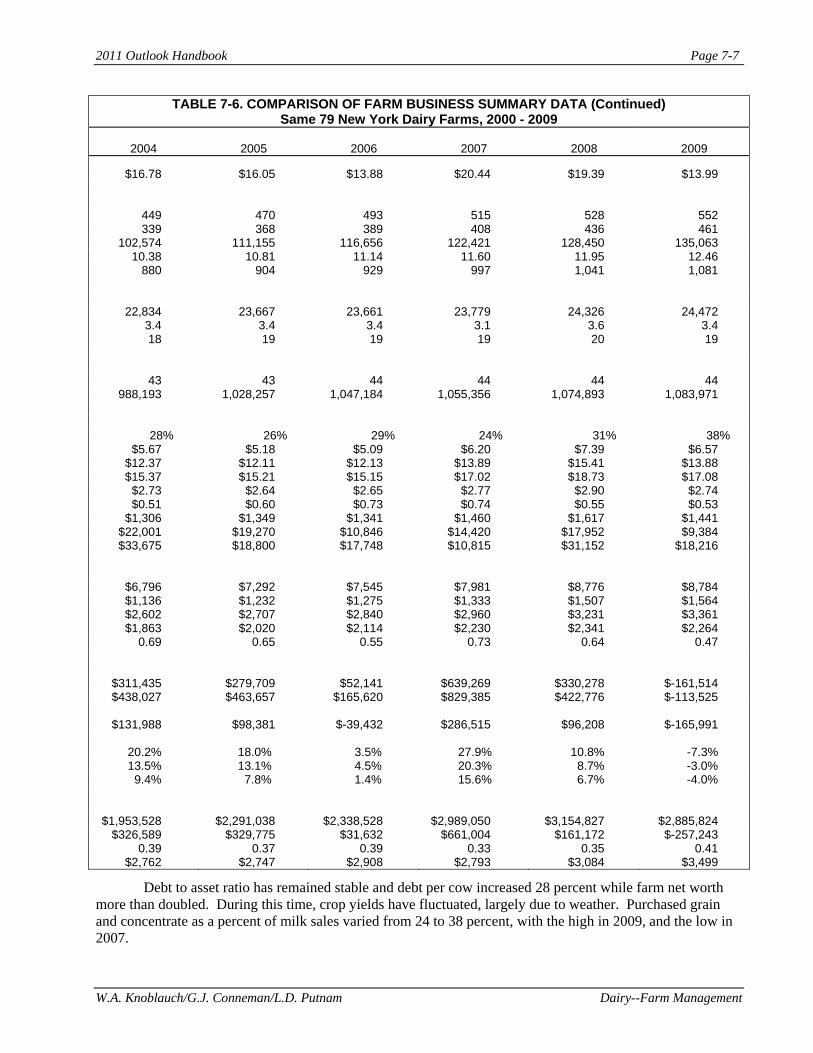
2011 Outlook Handbook
W.A. Knoblauch/G.J. Conneman/L.D. Putnam Dairy--Farm Management
Page 7-7
TABLE 7-6. COMPARISON OF FARM BUSINESS SUMMARY DATA (Continued) Same 79 New York Dairy Farms, 2000 - 2009
2004
2005
2006
2007
2008
2009
$16.78 $16.05 $13.88 $20.44 $19.39 $13.99 449 470 493 515 528 552 339 368 389 408 436 461 102,574 111,155 116,656 122,421 128,450 135,063 10.38 10.81 11.14 11.60 11.95 12.46 880 904 929 997 1,041 1,081 22,834 23,667 23,661 23,779 24,326 24,472 3.4 3.4 3.4 3.1 3.6 3.4 18 19 19 19 20 19 43 43 44 44 44 44 988,193 1,028,257 1,047,184 1,055,356 1,074,893 1,083,971 28% 26% 29% 24% 31% 38% $5.67 $5.18 $5.09 $6.20 $7.39 $6.57 $12.37 $12.11 $12.13 $13.89 $15.41 $13.88 $15.37 $15.21 $15.15 $17.02 $18.73 $17.08 $2.73 $2.64 $2.65 $2.77 $2.90 $2.74 $0.51 $0.60 $0.73 $0.74 $0.55 $0.53 $1,306 $1,349 $1,341 $1,460 $1,617 $1,441 $22,001 $19,270 $10,846 $14,420 $17,952 $9,384 $33,675 $18,800 $17,748 $10,815 $31,152 $18,216 $6,796 $7,292 $7,545 $7,981 $8,776 $8,784 $1,136 $1,232 $1,275 $1,333 $1,507 $1,564 $2,602 $2,707 $2,840 $2,960 $3,231 $3,361 $1,863 $2,020 $2,114 $2,230 $2,341 $2,264 0.69 0.65 0.55 0.73 0.64 0.47 $311,435 $279,709 $52,141 $639,269 $330,278 $-161,514 $438,027 $463,657 $165,620 $829,385 $422,776 $-113,525 $131,988
$98,381
$-39,432
$286,515
$96,208
$-165,991
20.2%
18.0%
3.5%
27.9%
10.8%
-7.3%
13.5% 13.1% 4.5% 20.3% 8.7% -3.0% 9.4% 7.8% 1.4% 15.6% 6.7% -4.0%
$1,953,528 $2,291,038 $2,338,528 $2,989,050 $3,154,827 $2,885,824 $326,589 $329,775 $31,632 $661,004 $161,172 $-257,243 0.39 0.37 0.39 0.33 0.35 0.41 $2,762 $2,747 $2,908 $2,793 $3,084 $3,499
Debt to asset ratio has remained stable and debt per cow increased 28 percent while farm net worth more than doubled. During this time, crop yields have fluctuated, largely due to weather. Purchased grain and concentrate as a percent of milk sales varied from 24 to 38 percent, with the high in 2009, and the low in 2007.
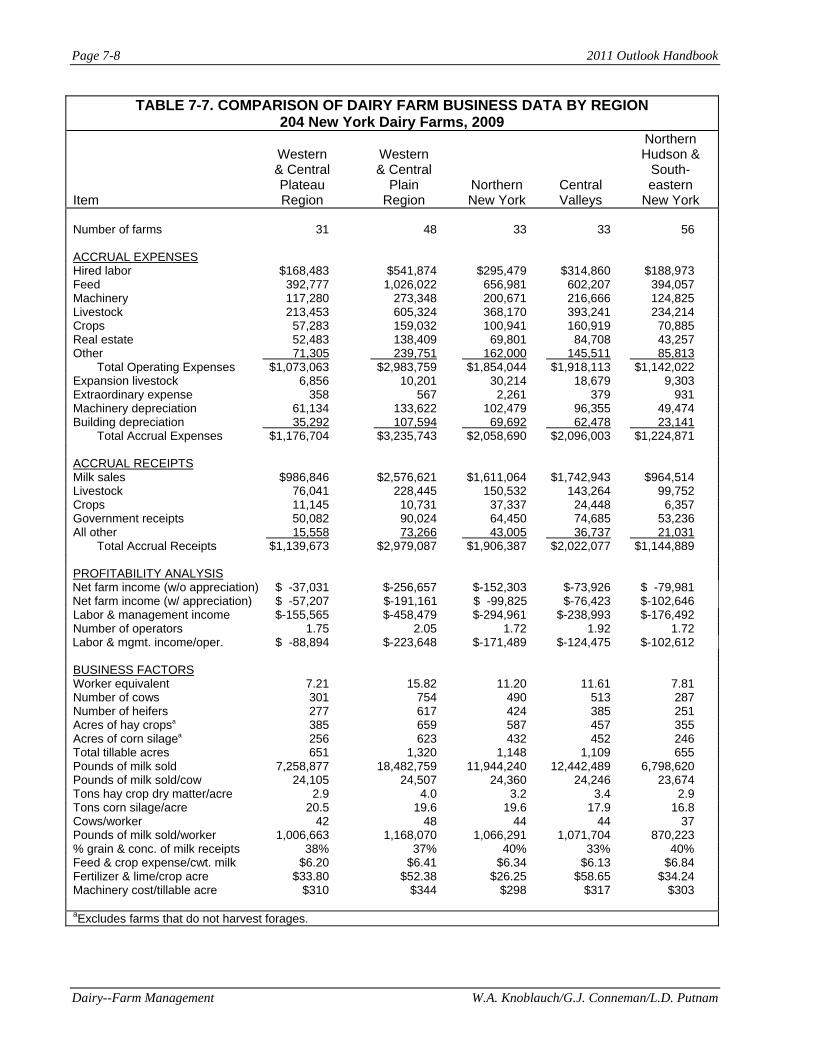
2011 Outlook Handbook
Dairy--Farm Management W.A. Knoblauch/G.J. Conneman/L.D. Putnam
Page 7-8
TABLE 7-7. COMPARISON OF DAIRY FARM BUSINESS DATA BY REGION 204 New York Dairy Farms, 2009
Item
Western & Central Plateau Region
Western & Central
Plain Region
Northern New York
Central Valleys
Northern Hudson &
South-eastern
New York Number of farms 31 48 33 33 56 ACCRUAL EXPENSES Hired labor $168,483 $541,874 $295,479 $314,860 $188,973 Feed 392,777 1,026,022 656,981 602,207 394,057 Machinery 117,280 273,348 200,671 216,666 124,825 Livestock 213,453 605,324 368,170 393,241 234,214 Crops 57,283 159,032 100,941 160,919 70,885 Real estate 52,483 138,409 69,801 84,708 43,257 Other 71,305 239,751 162,000 145,511 85,813 Total Operating Expenses $1,073,063 $2,983,759 $1,854,044 $1,918,113 $1,142,022 Expansion livestock 6,856 10,201 30,214 18,679 9,303 Extraordinary expense 358 567 2,261 379 931 Machinery depreciation 61,134 133,622 102,479 96,355 49,474 Building depreciation 35,292 107,594 69,692 62,478 23,141 Total Accrual Expenses $1,176,704 $3,235,743 $2,058,690 $2,096,003 $1,224,871 ACCRUAL RECEIPTS Milk sales $986,846 $2,576,621 $1,611,064 $1,742,943 $964,514 Livestock 76,041 228,445 150,532 143,264 99,752 Crops 11,145 10,731 37,337 24,448 6,357 Government receipts 50,082 90,024 64,450 74,685 53,236 All other 15,558 73,266 43,005 36,737 21,031 Total Accrual Receipts $1,139,673 $2,979,087 $1,906,387 $2,022,077 $1,144,889 PROFITABILITY ANALYSIS
Net farm income (w/o appreciation) $ -37,031 $-256,657 $-152,303 $-73,926 $ -79,981 Net farm income (w/ appreciation) $ -57,207 $-191,161 $ -99,825 $-76,423 $-102,646 Labor & management income $-155,565 $-458,479 $-294,961 $-238,993 $-176,492 Number of operators 1.75 2.05 1.72 1.92 1.72
Labor & mgmt. income/oper. $ -88,894 $-223,648 $-171,489 $-124,475 $-102,612 BUSINESS FACTORS Worker equivalent 7.21 15.82 11.20 11.61 7.81 Number of cows 301 754 490 513 287 Number of heifers 277 617 424 385 251 Acres of hay cropsa 385 659 587 457 355 Acres of corn silagea 256 623 432 452 246 Total tillable acres 651 1,320 1,148 1,109 655 Pounds of milk sold 7,258,877 18,482,759 11,944,240 12,442,489 6,798,620 Pounds of milk sold/cow 24,105 24,507 24,360 24,246 23,674 Tons hay crop dry matter/acre 2.9 4.0 3.2 3.4 2.9 Tons corn silage/acre 20.5 19.6 19.6 17.9 16.8 Cows/worker 42 48 44 44 37 Pounds of milk sold/worker 1,006,663 1,168,070 1,066,291 1,071,704 870,223 % grain & conc. of milk receipts 38% 37% 40% 33% 40% Feed & crop expense/cwt. milk $6.20 $6.41 $6.34 $6.13 $6.84 Fertilizer & lime/crop acre $33.80 $52.38 $26.25 $58.65 $34.24 Machinery cost/tillable acre $310 $344 $298 $317 $303 aExcludes farms that do not harvest forages.
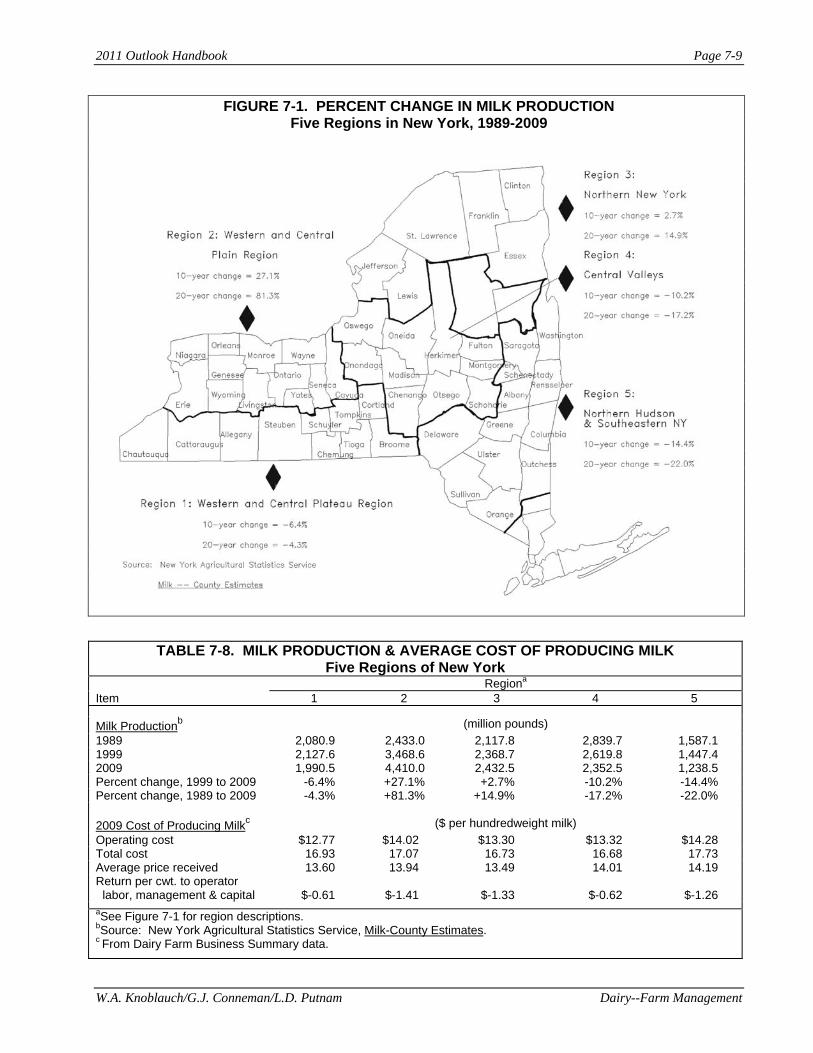
2011 Outlook Handbook
W.A. Knoblauch/G.J. Conneman/L.D. Putnam Dairy--Farm Management
Page 7-9
FIGURE 7-1. PERCENT CHANGE IN MILK PRODUCTION Five Regions in New York, 1989-2009
TABLE 7-8. MILK PRODUCTION & AVERAGE COST OF PRODUCING MILK
Five Regions of New York Regiona Item 1 2 3 4 5 Milk Productionb (million pounds) 1989 2,080.9 2,433.0 2,117.8 2,839.7 1,587.1 1999 2,127.6 3,468.6 2,368.7 2,619.8 1,447.4 2009 1,990.5 4,410.0 2,432.5 2,352.5 1,238.5 Percent change, 1999 to 2009 -6.4% +27.1% +2.7% -10.2% -14.4% Percent change, 1989 to 2009 -4.3% +81.3% +14.9% -17.2% -22.0% 2009 Cost of Producing Milkc ($ per hundredweight milk) Operating cost $12.77 $14.02 $13.30 $13.32 $14.28 Total cost 16.93 17.07 16.73 16.68 17.73 Average price received 13.60 13.94 13.49 14.01 14.19 Return per cwt. to operator labor, management & capital
$-0.61
$-1.41
$-1.33
$-0.62
$-1.26
aSee Figure 7-1 for region descriptions. bSource: New York Agricultural Statistics Service, Milk-County Estimates. c From Dairy Farm Business Summary data.
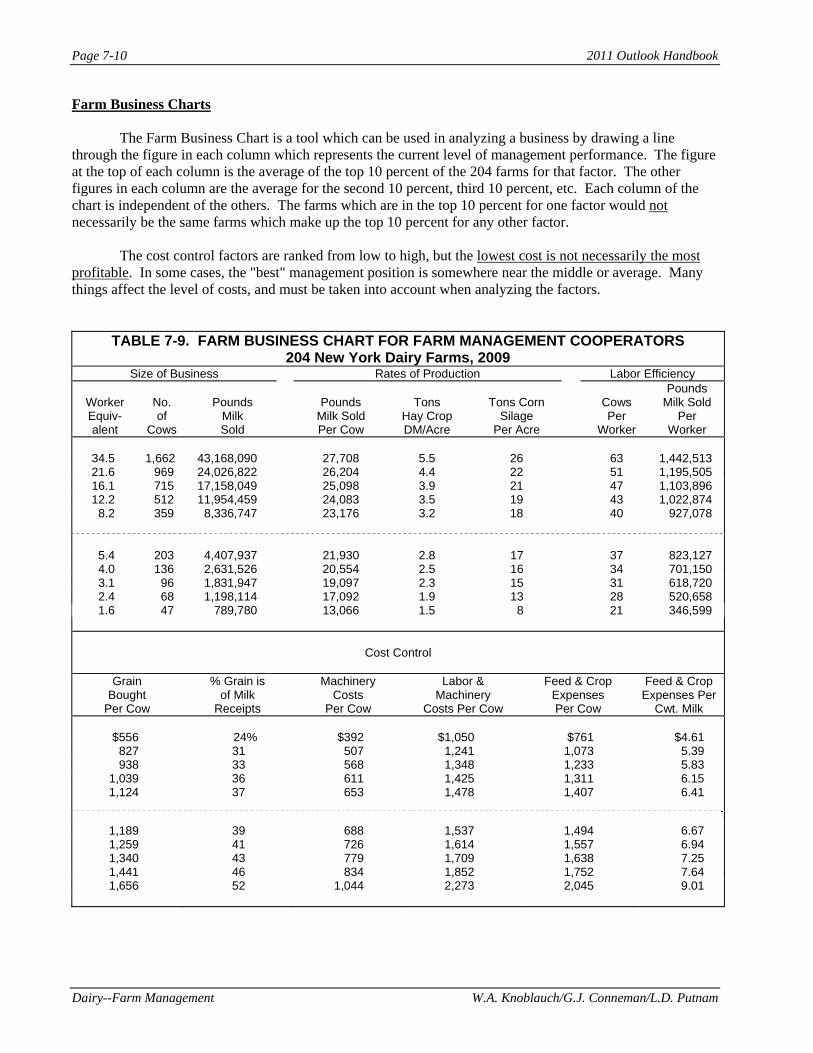
2011 Outlook Handbook
Dairy--Farm Management W.A. Knoblauch/G.J. Conneman/L.D. Putnam
Page 7-10
Farm Business Charts The Farm Business Chart is a tool which can be used in analyzing a business by drawing a line through the figure in each column which represents the current level of management performance. The figure at the top of each column is the average of the top 10 percent of the 204 farms for that factor. The other figures in each column are the average for the second 10 percent, third 10 percent, etc. Each column of the chart is independent of the others. The farms which are in the top 10 percent for one factor would not necessarily be the same farms which make up the top 10 percent for any other factor. The cost control factors are ranked from low to high, but the lowest cost is not necessarily the most profitable. In some cases, the "best" management position is somewhere near the middle or average. Many things affect the level of costs, and must be taken into account when analyzing the factors.
TABLE 7-9. FARM BUSINESS CHART FOR FARM MANAGEMENT COOPERATORS
204 New York Dairy Farms, 2009 Size of Business Rates of Production Labor Efficiency
Worker Equiv- alent
No. of
Cows
Pounds
Milk Sold
Pounds
Milk Sold Per Cow
Tons
Hay Crop DM/Acre
Tons Corn
Silage Per Acre
Cows Per
Worker
Pounds Milk Sold
Per Worker
34.5 1,662 43,168,090 27,708 5.5 26 63 1,442,513 21.6 969 24,026,822 26,204 4.4 22 51 1,195,505 16.1 715 17,158,049 25,098 3.9 21 47 1,103,896 12.2 512 11,954,459 24,083 3.5 19 43 1,022,874 8.2 359 8,336,747 23,176 3.2 18 40 927,078 5.4 203 4,407,937 21,930 2.8 17 37 823,127 4.0 136 2,631,526 20,554 2.5 16 34 701,150 3.1 96 1,831,947 19,097 2.3 15 31 618,720 2.4 68 1,198,114 17,092 1.9 13 28 520,658 1.6 47 789,780 13,066 1.5 8 21 346,599
Cost Control
Grain
Bought Per Cow
% Grain is of Milk
Receipts
Machinery Costs
Per Cow
Labor & Machinery
Costs Per Cow
Feed & Crop Expenses Per Cow
Feed & Crop Expenses Per
Cwt. Milk $556 24% $392 $1,050 $761 $4.61 827 31 507 1,241 1,073 5.39 938 33 568 1,348 1,233 5.83 1,039 36 611 1,425 1,311 6.15 1,124 37 653 1,478 1,407 6.41 1,189 39 688 1,537 1,494 6.67 1,259 41 726 1,614 1,557 6.94 1,340 43 779 1,709 1,638 7.25 1,441 46 834 1,852 1,752 7.64 1,656 52 1,044 2,273 2,045 9.01
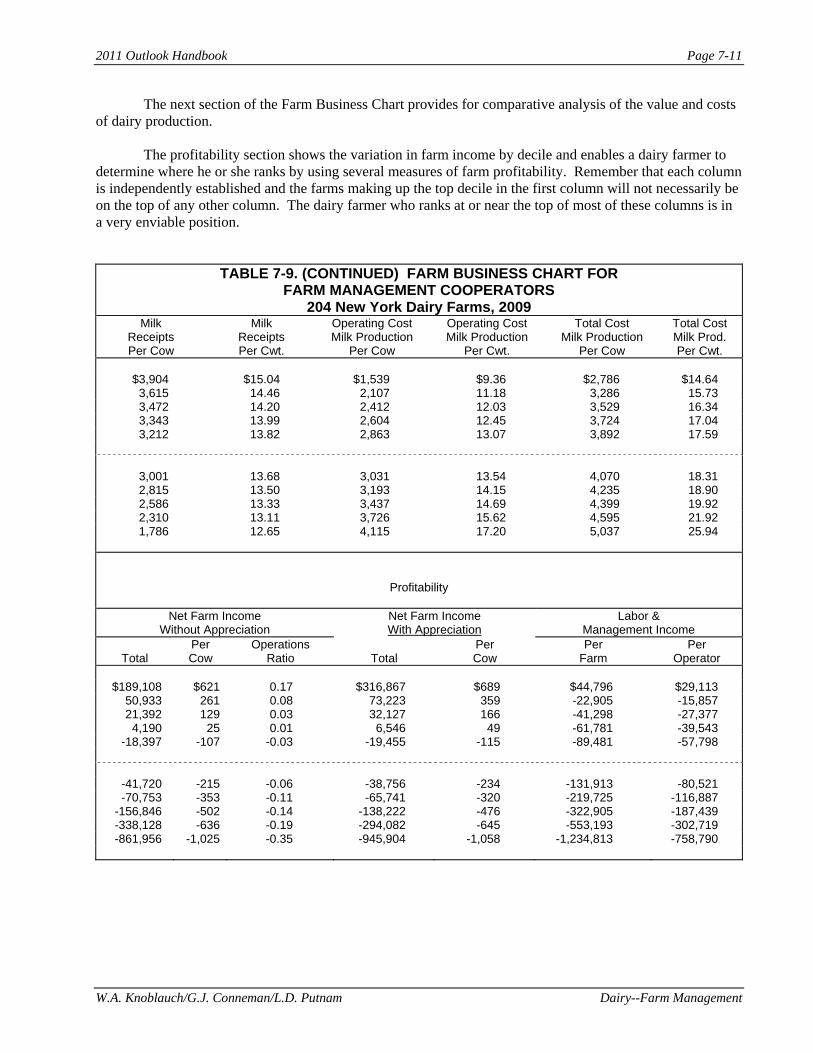
2011 Outlook Handbook
W.A. Knoblauch/G.J. Conneman/L.D. Putnam Dairy--Farm Management
Page 7-11
The next section of the Farm Business Chart provides for comparative analysis of the value and costs of dairy production. The profitability section shows the variation in farm income by decile and enables a dairy farmer to determine where he or she ranks by using several measures of farm profitability. Remember that each column is independently established and the farms making up the top decile in the first column will not necessarily be on the top of any other column. The dairy farmer who ranks at or near the top of most of these columns is in a very enviable position.
TABLE 7-9. (CONTINUED) FARM BUSINESS CHART FOR
FARM MANAGEMENT COOPERATORS 204 New York Dairy Farms, 2009
Milk Receipts Per Cow
Milk Receipts Per Cwt.
Operating Cost Milk Production
Per Cow
Operating Cost Milk Production
Per Cwt.
Total Cost Milk Production
Per Cow
Total Cost Milk Prod. Per Cwt.
$3,904 $15.04 $1,539 $9.36 $2,786 $14.64 3,615 14.46 2,107 11.18 3,286 15.73 3,472 14.20 2,412 12.03 3,529 16.34 3,343 13.99 2,604 12.45 3,724 17.04 3,212 13.82 2,863 13.07 3,892 17.59 3,001 13.68 3,031 13.54 4,070 18.31 2,815 13.50 3,193 14.15 4,235 18.90 2,586 13.33 3,437 14.69 4,399 19.92 2,310 13.11 3,726 15.62 4,595 21.92 1,786 12.65 4,115 17.20 5,037 25.94
Profitability
Net Farm Income Without Appreciation
Net Farm Income With Appreciation
Labor & Management Income
Total
Per Cow
Operations Ratio
Total
Per Cow
Per Farm
Per Operator
$189,108 $621 0.17 $316,867 $689 $44,796 $29,113
50,933 261 0.08 73,223 359 -22,905 -15,857 21,392 129 0.03 32,127 166 -41,298 -27,377
4,190 25 0.01 6,546 49 -61,781 -39,543 -18,397 -107 -0.03 -19,455 -115 -89,481 -57,798
-41,720 -215 -0.06 -38,756 -234 -131,913 -80,521 -70,753 -353 -0.11 -65,741 -320 -219,725 -116,887
-156,846 -502 -0.14 -138,222 -476 -322,905 -187,439 -338,128 -636 -0.19 -294,082 -645 -553,193 -302,719 -861,956 -1,025 -0.35 -945,904 -1,058 -1,234,813 -758,790

2011 Outlook Handbook
Dairy--Farm Management W.A. Knoblauch/G.J. Conneman/L.D. Putnam
Page 7-12
Financial Analysis Chart The farm financial analysis chart is designed just like the farm business chart on the previous pages and may be used to measure the financial health of the farm business.
TABLE 7-10. FINANCIAL ANALYSIS CHART 204 New York Dairy Farms, 2009
Liquidity (repayment)
Planned Debt
Payments Per Cow
Available for
Debt Service Per Cow
Cash Flow Coverage
Ratio
Debt Coverage
Ratio
Debt Payments as Percent
of Milk Sales
Debt Per Cow
Working
Capital as % of Total Expenses
Current Ratio
$129 $869 4.73 2.73 4% $207 48% 24.00 265 536 1.30 1.07 7 1,172 29 3.80 320 425 0.90 0.68 10 1,925 22 2.67 388 334 0.64 0.39 12 2,513 19 2.09 448 225 0.37 0.13 14 2,914 15 1.75
512 81 0.14 -0.03 17 3,517 11 1.48 592 -6 -0.06 -0.29 19 4,048 6 1.17 684 -132 -0.42 -0.57 22 4,632 0 0.94 841 -278 -0.73 -1.04 25 5,166 -6 0.72 1,321 -587 -1.87 -2.34 38 6,688 -25 0.30
Solvency Operational Ratios Debt/Asset Ratio Operating Interest Depreciation
Leverage Percent Current & Long Expense Expense Expense Ratioa Equity Intermediate Term Ratio Ratio Ratio 0.08 98% 0.02 0.00 0.73 0.00 0.02 0.19 88 0.11 0.00 0.83 0.01 0.04 0.28 81 0.22 0.03 0.86 0.02 0.05 0.39 75 0.27 0.11 0.89 0.02 0.06 0.53 69 0.35 0.22 0.91 0.03 0.07
0.73 60 0.42 0.33 0.95 0.04 0.08 0.87 55 0.47 0.44 0.98 0.04 0.09 1.06 49 0.56 0.53 1.03 0.05 0.11 1.39 43 0.67 0.64 1.07 0.06 0.13 3.03 26 0.89 0.98 1.19 0.11 0.18
Efficiency (Capital) Profitability Asset
Turnover (ratio)
Real Estate Investment Per Cow
Machinery Investment Per Cow
Total Farm Assets
Per Cow
Change in Net Worth
With Appreciation
Percent Rate of Return with Appreciation on:
Equity Investmentb 0.63 $1,882 $607 $6,103 $130,552 4% 4% 0.52 2,558 968 7,394 20,677 -1 1 0.48 2,940 1,229 7,972 -8,052 -3 -1 0.44 3,319 1,456 8,730 -30,384 -5 -2 0.40 3,639 1,618 9,230 -54,874 -7 -4
0.37 4,097 1,803 9,754 -91,665 -10 -5 0.34 4,625 2,036 10,312 -168,225 -12 -7 0.30 5,339 2,255 11,366 -272,257 -15 -8 0.26 6,375 2,560 12,448 -460,184 -21 -10 0.19 8,932 3,659 15,218 -1,243,274 -46 -16
aDollars of debt per dollar of equity, computed by dividing total liabilities by total equity. bReturn on all farm capital (no deduction for interest paid) divided by total farm assets.
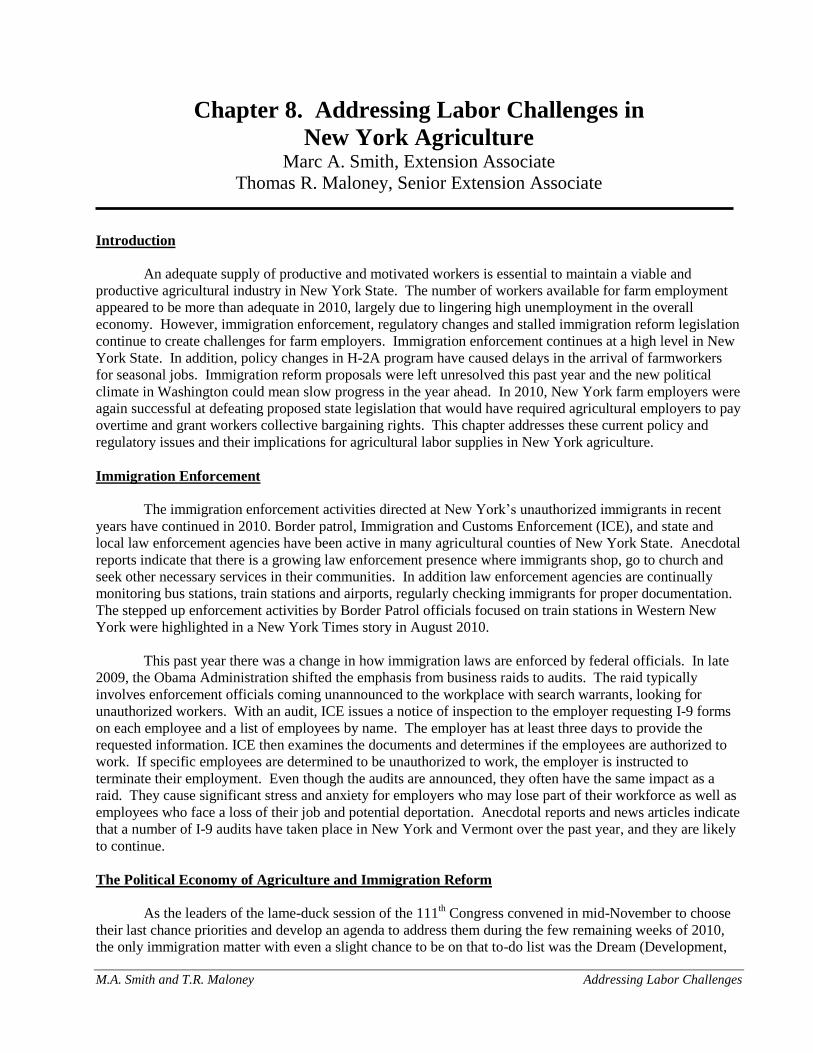
M.A. Smith and T.R. Maloney Addressing Labor Challenges
Chapter 8. Addressing Labor Challenges in
New York Agriculture Marc A. Smith, Extension Associate
Thomas R. Maloney, Senior Extension Associate
Introduction
An adequate supply of productive and motivated workers is essential to maintain a viable and
productive agricultural industry in New York State. The number of workers available for farm employment
appeared to be more than adequate in 2010, largely due to lingering high unemployment in the overall
economy. However, immigration enforcement, regulatory changes and stalled immigration reform legislation
continue to create challenges for farm employers. Immigration enforcement continues at a high level in New
York State. In addition, policy changes in H-2A program have caused delays in the arrival of farmworkers
for seasonal jobs. Immigration reform proposals were left unresolved this past year and the new political
climate in Washington could mean slow progress in the year ahead. In 2010, New York farm employers were
again successful at defeating proposed state legislation that would have required agricultural employers to pay
overtime and grant workers collective bargaining rights. This chapter addresses these current policy and
regulatory issues and their implications for agricultural labor supplies in New York agriculture.
Immigration Enforcement
The immigration enforcement activities directed at New York’s unauthorized immigrants in recent
years have continued in 2010. Border patrol, Immigration and Customs Enforcement (ICE), and state and
local law enforcement agencies have been active in many agricultural counties of New York State. Anecdotal
reports indicate that there is a growing law enforcement presence where immigrants shop, go to church and
seek other necessary services in their communities. In addition law enforcement agencies are continually
monitoring bus stations, train stations and airports, regularly checking immigrants for proper documentation.
The stepped up enforcement activities by Border Patrol officials focused on train stations in Western New
York were highlighted in a New York Times story in August 2010.
This past year there was a change in how immigration laws are enforced by federal officials. In late
2009, the Obama Administration shifted the emphasis from business raids to audits. The raid typically
involves enforcement officials coming unannounced to the workplace with search warrants, looking for
unauthorized workers. With an audit, ICE issues a notice of inspection to the employer requesting I-9 forms
on each employee and a list of employees by name. The employer has at least three days to provide the
requested information. ICE then examines the documents and determines if the employees are authorized to
work. If specific employees are determined to be unauthorized to work, the employer is instructed to
terminate their employment. Even though the audits are announced, they often have the same impact as a
raid. They cause significant stress and anxiety for employers who may lose part of their workforce as well as
employees who face a loss of their job and potential deportation. Anecdotal reports and news articles indicate
that a number of I-9 audits have taken place in New York and Vermont over the past year, and they are likely
to continue.
The Political Economy of Agriculture and Immigration Reform
As the leaders of the lame-duck session of the 111th Congress convened in mid-November to choose
their last chance priorities and develop an agenda to address them during the few remaining weeks of 2010,
the only immigration matter with even a slight chance to be on that to-do list was the Dream (Development,

2011 Outlook Handbook
Addressing Labor Challenges M.A. Smith and T.R. Maloney
Page 8-2
Relief, and Education for Alien Minors; S.729 and H.R.1751) Act. This latest version of a long-standing
proposal would repeal provisions of a 1996 law prohibiting certain educational benefits to unauthorized
foreign students; and define a path to legal permanent residency for those individuals. Political surveys
conducted before and after the November elections indicate that, while large majorities of Americans support
the provisions of previously introduced immigration reform measures, the issue was a mere afterthought for
voters. “The economy” overwhelmed all other issues as the factor that motivated voting choices on Election
Day. Nevertheless, as elections have come and gone and political winds have shifted back and forth for
almost 25 years, the need to find better policies to govern the movement of working people and their diverse
skills across U.S. borders remains a critical economic issue for nearly 500,000 diverse businesses that employ
people to do the work of American agriculture.
Agriculture and Immigration Policy Reform: State of the State
In 2010 the United States wrestled with many of the serious consequences of a broken immigration
system, but the status quo remains largely unchanged. The enactment of Arizona law SB1070, which
empowers local police to participate in the enforcement of federal laws, energized activists on all sides of the
immigration debate. It also prompted the U.S. Department of Justice to sue the State of Arizona and elicited
congressional pronouncements about the need to move forward with reform legislation. But the major debate
over health care reform didn’t conclude until late March and subsequent legislative battles over financial
market reform carried on into the summer, even as the mid-term elections loomed. Time on the legislative
calendar ran out and the political will to take on comprehensive immigration reform evaporated. Advocates
for seemingly less controversial, “down payment” legislation such as the Dream Act and, of critical interest to
farmers, AgJOBS, were left hoping to squeeze legislative action on these measures into perceived small
windows of opportunity that never materialized. Late in September, Senators Kirsten Gillibrand and Charles
Schumer of New York and Patrick Leahy of Vermont introduced the H-2A Improvement Act, designed to
allow previously excluded dairy farmers to hire workers under the provisions of the existing H-2A program.
At the National Milk Producers Federation (NMPF) Annual Meeting in November, NMPF Board
Chairman Randy Mooney reflected significantly diminished hopes for action on immigration reform in his
comments, “Another issue where we need Congress to do the right thing is on immigration reform. This has
been one of NMPF’s key priorities during the past five years. Unfortunately, the momentum is on the side of
those who don’t want to consider any type of reform addressing the real-world issues of our labor force. And
while NMPF still supports the AgJOBS bill that would provide a broader reform of immigration laws, we’re
always looking for any possible improvements. That’s why we were encouraged to see legislation introduced
just last month in the Senate to expand the H-2A visa program to the dairy sector. Right now, only seasonal
farm operators can use H-2A visas to bring in immigrant workers. If the Senate bill can be adopted, dairy
farmers will be able to use it as well. It’s not a perfect solution, but it represents progress.” No Senate action
has been taken on H-2A Improvement as of this writing.
H-2A: Politics, Bureaucracy and Economic Consequences
In the United States, Congress enacts laws and the executive branch of the federal government,
through its many agencies, interprets and develops rules and regulations to implement those laws. Frequently,
the implementation of federal law requires resources, input and cooperation from state and local agencies as
well. In 2010, requests for offshore workers made by farmers through the federal H-2A program were held
up, with serious consequences, by the complicated machinery of this process.
H-2A legislation was first passed by Congress in 1986 as part of the last significant reform of the
nation’s immigration system, the Immigration Reform and Control Act, under President Ronald Reagan.
H-2A defines the process through which farm businesses are allowed to hire temporary offshore workers to
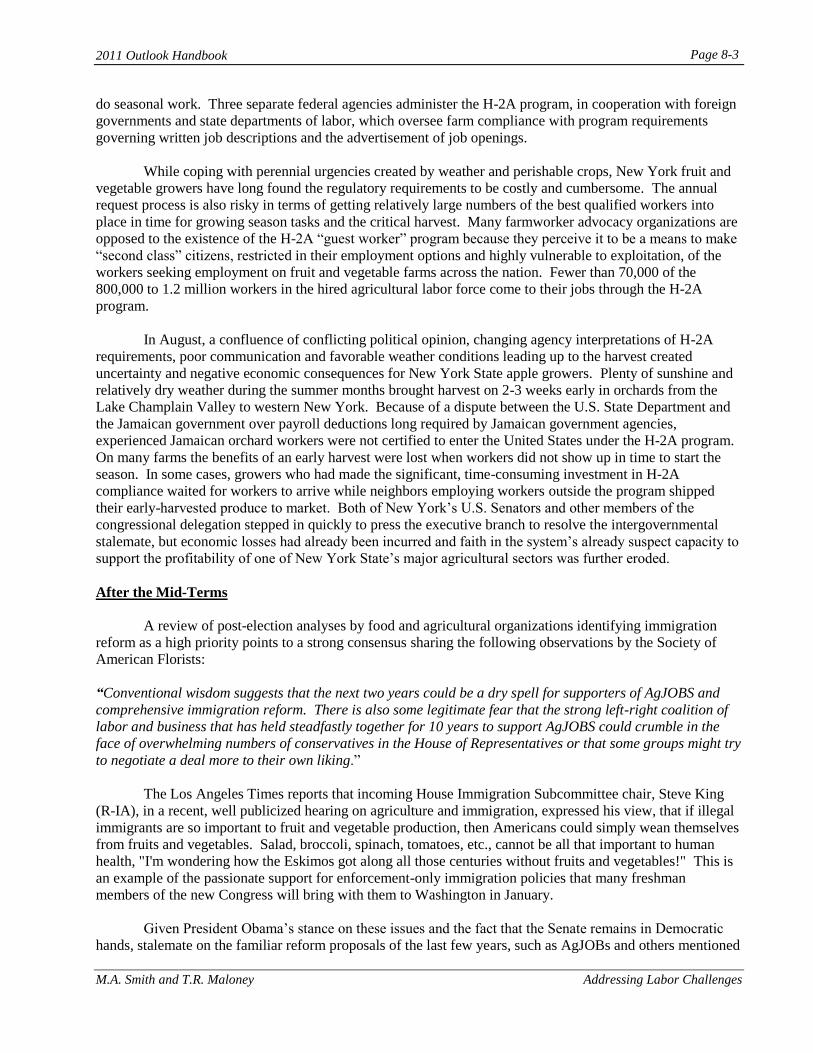
2011 Outlook Handbook
M.A. Smith and T.R. Maloney Addressing Labor Challenges
Page 8-3
do seasonal work. Three separate federal agencies administer the H-2A program, in cooperation with foreign
governments and state departments of labor, which oversee farm compliance with program requirements
governing written job descriptions and the advertisement of job openings.
While coping with perennial urgencies created by weather and perishable crops, New York fruit and
vegetable growers have long found the regulatory requirements to be costly and cumbersome. The annual
request process is also risky in terms of getting relatively large numbers of the best qualified workers into
place in time for growing season tasks and the critical harvest. Many farmworker advocacy organizations are
opposed to the existence of the H-2A “guest worker” program because they perceive it to be a means to make
“second class” citizens, restricted in their employment options and highly vulnerable to exploitation, of the
workers seeking employment on fruit and vegetable farms across the nation. Fewer than 70,000 of the
800,000 to 1.2 million workers in the hired agricultural labor force come to their jobs through the H-2A
program.
In August, a confluence of conflicting political opinion, changing agency interpretations of H-2A
requirements, poor communication and favorable weather conditions leading up to the harvest created
uncertainty and negative economic consequences for New York State apple growers. Plenty of sunshine and
relatively dry weather during the summer months brought harvest on 2-3 weeks early in orchards from the
Lake Champlain Valley to western New York. Because of a dispute between the U.S. State Department and
the Jamaican government over payroll deductions long required by Jamaican government agencies,
experienced Jamaican orchard workers were not certified to enter the United States under the H-2A program.
On many farms the benefits of an early harvest were lost when workers did not show up in time to start the
season. In some cases, growers who had made the significant, time-consuming investment in H-2A
compliance waited for workers to arrive while neighbors employing workers outside the program shipped
their early-harvested produce to market. Both of New York’s U.S. Senators and other members of the
congressional delegation stepped in quickly to press the executive branch to resolve the intergovernmental
stalemate, but economic losses had already been incurred and faith in the system’s already suspect capacity to
support the profitability of one of New York State’s major agricultural sectors was further eroded.
After the Mid-Terms
A review of post-election analyses by food and agricultural organizations identifying immigration
reform as a high priority points to a strong consensus sharing the following observations by the Society of
American Florists:
“Conventional wisdom suggests that the next two years could be a dry spell for supporters of AgJOBS and
comprehensive immigration reform. There is also some legitimate fear that the strong left-right coalition of
labor and business that has held steadfastly together for 10 years to support AgJOBS could crumble in the
face of overwhelming numbers of conservatives in the House of Representatives or that some groups might try
to negotiate a deal more to their own liking.”
The Los Angeles Times reports that incoming House Immigration Subcommittee chair, Steve King
(R-IA), in a recent, well publicized hearing on agriculture and immigration, expressed his view, that if illegal
immigrants are so important to fruit and vegetable production, then Americans could simply wean themselves
from fruits and vegetables. Salad, broccoli, spinach, tomatoes, etc., cannot be all that important to human
health, "I'm wondering how the Eskimos got along all those centuries without fruits and vegetables!" This is
an example of the passionate support for enforcement-only immigration policies that many freshman
members of the new Congress will bring with them to Washington in January.
Given President Obama’s stance on these issues and the fact that the Senate remains in Democratic
hands, stalemate on the familiar reform proposals of the last few years, such as AgJOBs and others mentioned

2011 Outlook Handbook
Addressing Labor Challenges M.A. Smith and T.R. Maloney
Page 8-4
above, is almost certain to continue. Farmers will be more concerned about the way in which enforcement of
current laws will unfold. The 112th Congress is not likely to pass legislation authorizing workers now
employed by U.S. farms to be in this country. At the same time, there will be pressure from newly-elected
representatives to expand the number of I-9 audits on farms and make E-Verify, the federal electronic system
developed to determine immigration status, mandatory. If reforms materialize as more stringent enforcement
only, farmers will have to make some very hard decisions about if, how and where they will continue to grow
their labor-intensive crops and milk their cows. The evolution of the enforcement approach taken by the
Administration in the near future will significantly influence such economic decisions.
Agricultural Economics
The political debate over immigration reform will continue to play out on television screens, in print
and on the internet as the Administration and the 112th Congress set policy and legislative priorities, do
partisan battle and seek compromise in carrying out what they see to be the people’s business. New York
agricultural producers and their counterparts throughout the nation will continue to face the economic realities
that stem from the uncertainties surrounding their work force. Uncertainty about the impact of national policy
and immigration enforcement practices on the availability of workers manifests itself in the cost, real or
perceived, of labor needed to grow and harvest our state’s fruit and vegetable crops as well as to produce
dairy products on our farms. Migrants seek out jobs on New York State farms because of the relative level of
wages, the state of the economy and the relative absence of opportunities in their home countries. They are
recruited by farm employers because of the severe scarcity of local individuals capable and willing to milk
cows, prune grapevines, harvest apples and cherries, cut cabbage or cucumbers, plant onions, feed calves or
perform other necessary farm tasks. Myriad social and political issues, perceptions and concerns surround
these basic economic forces, but the financial health of farm family businesses, rural prosperity and the cost
and reliability of our food supply are all functions of the costs, benefits, incentives and disincentives related to
the economics of agricultural labor and its impact on production.
A 2007 National Milk Producers Federation analysis of these economic factors estimated and
summarized the consequences of doing without migrant workers on dairy farms. This drastic economic shift
would:
Reduce the U.S. dairy herd by 1.34 million head, milk production by 29.5 billion pounds and the
number of farms by 4,532
Increase retail milk prices by an estimated 61%
Cause 133,000 workers, both immigrant and native-born, in dairy production, input and service
sectors to lose their jobs
Authors of studies of the fruit and vegetable sectors that assume a similar premise reach comparable
conclusions with respect to the availability of fresh fruits and vegetables to consumers, changes in the mix of
labor-intensive and row crops that would be grown and the likelihood of moving operations to Mexico.
The Way Forward
By itself, the decades-long impasse over immigration reform has caused many New York growers to
take a deeply pessimistic view of what the future holds. The political prospects for positive changes in policy
in the near future have not brightened this outlook. Opportunities, however, for positive, albeit limited
change on policy and economic fronts do exist. Farm employers and their advocates can help create this
change by:
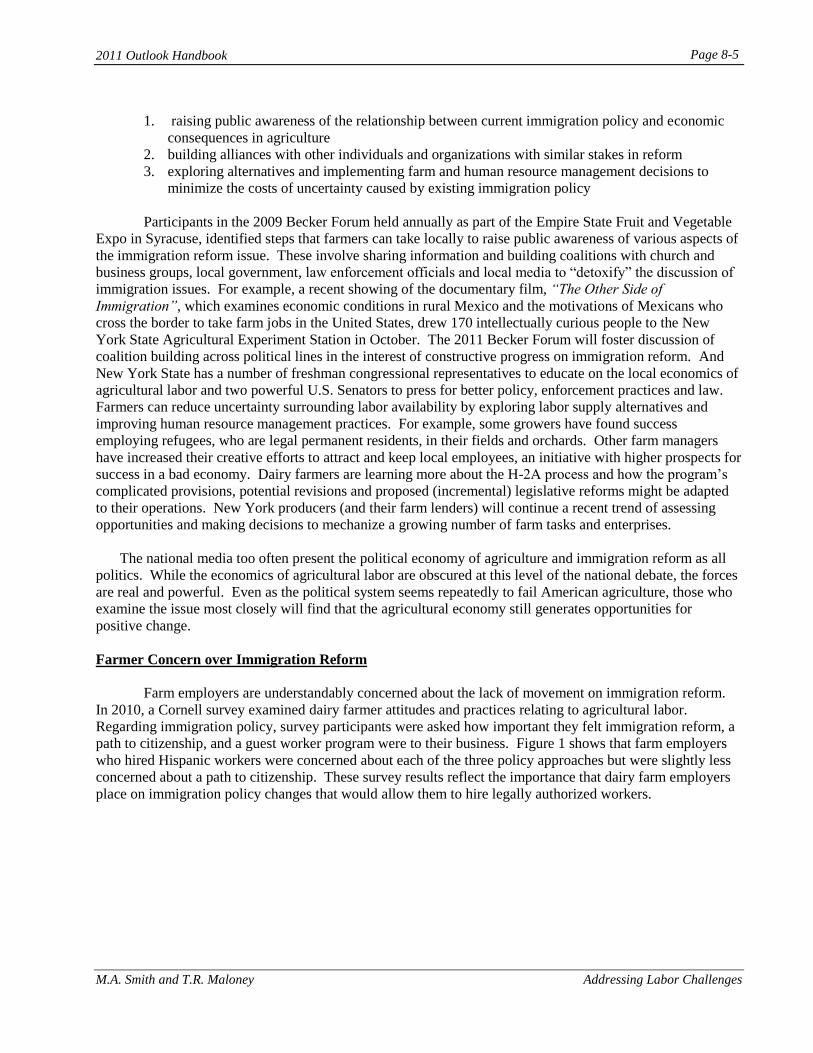
2011 Outlook Handbook
M.A. Smith and T.R. Maloney Addressing Labor Challenges
Page 8-5
1. raising public awareness of the relationship between current immigration policy and economic
consequences in agriculture
2. building alliances with other individuals and organizations with similar stakes in reform
3. exploring alternatives and implementing farm and human resource management decisions to
minimize the costs of uncertainty caused by existing immigration policy
Participants in the 2009 Becker Forum held annually as part of the Empire State Fruit and Vegetable
Expo in Syracuse, identified steps that farmers can take locally to raise public awareness of various aspects of
the immigration reform issue. These involve sharing information and building coalitions with church and
business groups, local government, law enforcement officials and local media to “detoxify” the discussion of
immigration issues. For example, a recent showing of the documentary film, “The Other Side of
Immigration”, which examines economic conditions in rural Mexico and the motivations of Mexicans who
cross the border to take farm jobs in the United States, drew 170 intellectually curious people to the New
York State Agricultural Experiment Station in October. The 2011 Becker Forum will foster discussion of
coalition building across political lines in the interest of constructive progress on immigration reform. And
New York State has a number of freshman congressional representatives to educate on the local economics of
agricultural labor and two powerful U.S. Senators to press for better policy, enforcement practices and law.
Farmers can reduce uncertainty surrounding labor availability by exploring labor supply alternatives and
improving human resource management practices. For example, some growers have found success
employing refugees, who are legal permanent residents, in their fields and orchards. Other farm managers
have increased their creative efforts to attract and keep local employees, an initiative with higher prospects for
success in a bad economy. Dairy farmers are learning more about the H-2A process and how the program’s
complicated provisions, potential revisions and proposed (incremental) legislative reforms might be adapted
to their operations. New York producers (and their farm lenders) will continue a recent trend of assessing
opportunities and making decisions to mechanize a growing number of farm tasks and enterprises.
The national media too often present the political economy of agriculture and immigration reform as all
politics. While the economics of agricultural labor are obscured at this level of the national debate, the forces
are real and powerful. Even as the political system seems repeatedly to fail American agriculture, those who
examine the issue most closely will find that the agricultural economy still generates opportunities for
positive change.
Farmer Concern over Immigration Reform
Farm employers are understandably concerned about the lack of movement on immigration reform.
In 2010, a Cornell survey examined dairy farmer attitudes and practices relating to agricultural labor.
Regarding immigration policy, survey participants were asked how important they felt immigration reform, a
path to citizenship, and a guest worker program were to their business. Figure 1 shows that farm employers
who hired Hispanic workers were concerned about each of the three policy approaches but were slightly less
concerned about a path to citizenship. These survey results reflect the importance that dairy farm employers
place on immigration policy changes that would allow them to hire legally authorized workers.
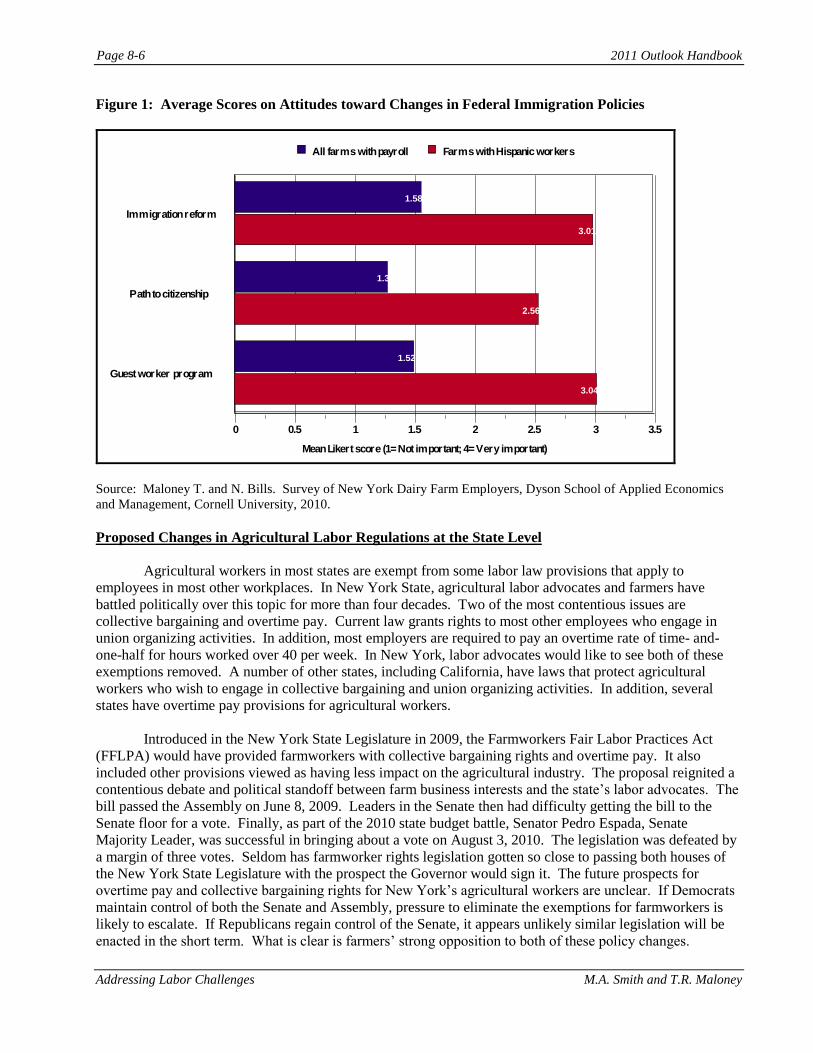
2011 Outlook Handbook
Addressing Labor Challenges M.A. Smith and T.R. Maloney
Page 8-6
Figure 1: Average Scores on Attitudes toward Changes in Federal Immigration Policies
3.01
2.56
3.04
1.58
1.3
1.52
Immigration reform
Path to citizenship
Guest worker program
0 0.5 1 1.5 2 2.5 3 3.5
Mean Likert score (1= Not important; 4= Very important)
All farms with payroll Farms with Hispanic workers
Source: Maloney T. and N. Bills. Survey of New York Dairy Farm Employers, Dyson School of Applied Economics
and Management, Cornell University, 2010.
Proposed Changes in Agricultural Labor Regulations at the State Level
Agricultural workers in most states are exempt from some labor law provisions that apply to
employees in most other workplaces. In New York State, agricultural labor advocates and farmers have
battled politically over this topic for more than four decades. Two of the most contentious issues are
collective bargaining and overtime pay. Current law grants rights to most other employees who engage in
union organizing activities. In addition, most employers are required to pay an overtime rate of time- and-
one-half for hours worked over 40 per week. In New York, labor advocates would like to see both of these
exemptions removed. A number of other states, including California, have laws that protect agricultural
workers who wish to engage in collective bargaining and union organizing activities. In addition, several
states have overtime pay provisions for agricultural workers.
Introduced in the New York State Legislature in 2009, the Farmworkers Fair Labor Practices Act
(FFLPA) would have provided farmworkers with collective bargaining rights and overtime pay. It also
included other provisions viewed as having less impact on the agricultural industry. The proposal reignited a
contentious debate and political standoff between farm business interests and the state’s labor advocates. The
bill passed the Assembly on June 8, 2009. Leaders in the Senate then had difficulty getting the bill to the
Senate floor for a vote. Finally, as part of the 2010 state budget battle, Senator Pedro Espada, Senate
Majority Leader, was successful in bringing about a vote on August 3, 2010. The legislation was defeated by
a margin of three votes. Seldom has farmworker rights legislation gotten so close to passing both houses of
the New York State Legislature with the prospect the Governor would sign it. The future prospects for
overtime pay and collective bargaining rights for New York’s agricultural workers are unclear. If Democrats
maintain control of both the Senate and Assembly, pressure to eliminate the exemptions for farmworkers is
likely to escalate. If Republicans regain control of the Senate, it appears unlikely similar legislation will be
enacted in the short term. What is clear is farmers’ strong opposition to both of these policy changes.
2011 Outlook Handbook
M.A. Smith and T.R. Maloney Addressing Labor Challenges
Page 8-7
Figure 2 shows the level of concern New York’s dairy farm employers have regarding changes in laws
affecting collective bargaining and overtime pay. Survey participants expressed the greatest concern over a
provision that would allow overtime pay after 40 hours. Changes in collective bargaining laws were the
second greatest concern. Even provisions that would allow overtime after 55 hours or 60 hours per week
were opposed by many farm employers. If similar legislation is proposed in the future it is very likely that
New York farmers will continue their strong opposition.
Figure 2: Average Scores on Attitudes Toward Proposed Changes in State Law - 2,100 New York
dairy farms, 2009
3.26
3.38
3.12
2.85
Collective bargaining
Overtime after 40 hrs.
Overtime after 50 hrs.
Overtime after 60 hrs.
0 1 2 3 4
Mean Likert score (1= Not concerned; 4= Very concerned)
Source: Maloney T. and N. Bills. Survey of New York Dairy Farm Employers, Dyson School of Applied Economics
and Management, Cornell University, 2010.
The New York Agricultural Labor Outlook for 2011
Labor supplies for agricultural jobs are likely to continue to be more than adequate in 2011.
However, labor supply uncertainty resulting from policy and regulatory issues, especially on the federal level,
is likely to continue. We anticipate the following conditions as we look ahead to 2011.
1) Aggressive immigration enforcement activities are expected to continue. Local law enforcement
officials in cooperation with Border Patrol and ICE officials are likely to be highly visible in many
agricultural counties of New York State. Surveillance at supermarkets and other places of business
frequented by immigrants is also likely to continue. It is expected that the Department of Homeland
Security will continue to emphasize immigration audits of employer records and that traditional
immigration raids will diminish. Anxiety on the part of agricultural employers and immigrant
workers’ concerned about the prospects of deportation will likely remain at high levels.
2) In an attempt to secure a legally authorized workforce, employers will continue to be interested in
acquiring workers through the H-2A program, although they are concerned about the chronic delays
in the system and the difficulties with the Jamaican Embassy experienced last season. Farm Bureau

2011 Outlook Handbook
Addressing Labor Challenges M.A. Smith and T.R. Maloney
Page 8-8
and other organizations representing agricultural employers are expected to put strong pressure on the
appropriate government agencies in the months ahead to avoid a recurrence of problems in the next
growing season.
3) Farm employers in New York will continue to insist that their elected officials in Washington take up
immigration reform in the next Congress. Farm employers will push hard for immigration policy
changes that will allow them to hire guest workers, create a path to legal residency for their
immigrant employees and reform current immigration laws. Changes in the political climate in
Washington, DC as a result of Republican gains in Congress during the midterm elections could slow
the immigration reform process and lead to higher levels of enforcement at the border and in the
workplace. In the face of strong opposition to comprehensive immigration reform, organizations
representing farm employers may attempt to pass smaller pieces of legislation such as AgJOBS or
H-2A reform that would include the dairy industry.
4) In 2010 farm employers were successful at having the Farmworkers Fair Labor Practices Act voted
down. If the Republicans regain control of the New York State Senate and influence redistricting, it
is highly likely that similar legislation would be forestalled indefinitely. On the other hand, if the
Democrats gain control of the Senate, employers could expect a strong push in future years to pass
legislation similar to the FFLPA.
5) Given the tenuous outlook for national immigration policy reform, farmers in New York’s dairy, fruit
and vegetable sectors will continue to revisit their farm management options to reduce the costs of
labor uncertainty in their business operations. Exploring alternative pools of labor and learning to
adapt staffing, work scheduling, and job description on the farm to existing policy and programs
could produce positive results. Farmers will also continue to incorporate new machines into their
operations to save labor and improve the safety and efficiency of those operations. Well considered
decisions to substitute capital for labor, in milking parlors, orchards, or fresh and processed vegetable
enterprises will benefit the farm businesses making those decisions. Finally, there will be news
stories about business decisions in New York and across the nation to move production of labor
intensive crops across the border, as well as trends toward growing crops that require less labor to
produce.

Chapter 9 - Agriculture and the Environment: Highlights of the Recent NY Climate Change Action Plan
Recommendations for Agriculture and Forestry Antonio M. Bento, Associate Professor
1. Introduction
In August 2009 former Governor David Paterson signed Executive Order number 24 which put forward the goal of reducing greenhouse gas (GHG) emissions in NYS by 80 percent below 1990 levels by the year 2050. As part of this executive order, the New York Action Council was charged to develop an Action Plan that would examine all economic sectors in NY and identify the various options available to reduce GHG emissions and adapt to climate change. Technical working groups focusing on (a) Agriculture, Forestry and Waste, (b) Power Supply and Delivery, (c) Residential, Commercial and Industrial, (d) Transportation and Land Use and (e) Adaptation were to develop a vision of a low carbon economy and put forward a set of public policies to achieve the targeted goal by 2050. These working groups consisted of stakeholders from government agencies, industry, academia and non-profit organizations.
The purpose of this year’s chapter on Agriculture and the Environment is to highlight the main
findings of the NYS climate change action plan for the Agriculture and Forestry sectors. I was fortunate to be part of this working group. Therefore, this chapter follows closely the recent Climate Change Action Plan report for Agriculture and Forestry, highlighting its key findings. I refer the reader to the actual report for further discussion and information related to options for all other sectors of the economy (Power, Residential, Commercial, Industrial and Transportation). The full report can be found at: http://www.nyclimatechange.us/index.cfm .
This chapter is organized as follows: First, based on EPA and NYS’s GHG emissions and sinks inventories, I report on the sources and extent of GHG emissions from agriculture and forestry. Second, I briefly outline the vision statement developed by the Action Council group for the Agriculture sector, discussing issues related to energy independence at the farm, agricultural practices and technology, land use, production of food, fiber and feedstocks, and adaptation. Third, I summarize the vision statement developed by the Action Council group for the Forestry sector focusing on management of forest lands, carbon sequestration, fuel substitution, and adaptation. Sections two and three of this chapter should therefore be interpreted as highly speculative and represent the vision put forward by the Climate Change Action group. The purpose here is not to quantify the economic feasibility to these visions – since we are limited in data available to provide such credible quantifications - but rather just present a descriptive summary of these visions. Forth, I will present the various public policy options identified by the Climate Change Action Plan to promote the target goals of the plan. The group outlined several policies based on a series of brainstorm sessions; the list of policies outlined is by no means complete and the cost-effectiveness of each of the policy options has not been calculated. Again, the only purpose here is to give a flavor of the types of potential policies to be potentially implemented. Finally, I will provide some concluding remarks.
________________________________________________________________________________________ A.M. Bento Agriculture and Environment
Page 9-2 2011 Outlook Handbook
2. Sources and Extent of GHG Emissions from Agriculture and Forestry in NYS A. Agriculture Sector
Agricultural Emissions in Relation to the Overall Economy – Reporting of emissions and carbon sinks in NYS follows the US EPA methods and international reporting conventions. The agriculture sector is a minor contributor of GHG emissions in NYS. In 2008, this sector accounted for 2 percent of NYS total gross emissions. The climate change action plan estimates that in 2030 the contribution of this sector will be of similar magnitude.
Sources of Agricultural Emissions in 2008 - Agricultural emissions include methane (CH4) and nitrous oxide (N2O) emissions from enteric fermentation, manure management, and agriculture soils. Emissions from livestock (primarily dairy cows) make significant contributions to the sector totals in both manure management and enteric fermentation. Sector emissions also include N2O emissions resulting from activities that increase nitrogen in the soil, including fertilizer (synthetic and livestock manure) applications and production of nitrogen-fixing crops (legumes). Projection of Emissions in 2030 - The CH4 emissions occurring from enteric fermentation are a large contributor to the state’s total agricultural GHG emissions by 2030, the contribution from this source is estimated to be about 48 percent of the total agriculture emissions. The next-highest contributor in 2030 is forecasted to be agricultural soil management, at about 39 percent. Methane emissions from manure management are declining slightly due to lower animal populations; however, they are forecasted to contribute around 13 percent in 2030. B. Forest Sector
Sources of Emissions and Carbon Sinks - The forestry and land-use sector can include both emissions sources and carbon sinks. Following the US EPA guidelines, these are calculated from estimates of the net CO2 flux from forested lands, urban trees, and landfilled yard trimmings in New York. The inventory is divided into two primary subsectors: the forested landscape and urban trees/land use. Both subsectors capture net carbon sequestered in forest biomass, urban trees, landfills, and harvested wood products. USFS data suggest that New York’s forests sequestered about 19.5 MMtCO2e per year in 2005 (this excludes estimates of carbon flux from forest soils based on recommendations from the USFS). Emissions of CH4 and N2O during forest wildfires and prescribed burns were not estimated due to a lack of data; however, it is not expected that these emissions will contribute substantially to Forestry sector totals. This expectation is based on work in other states, as well as wildfire activity in New York. The forecast for the sector to 2030 remains a net sequestration of 19.5 MMtCO2e.
________________________________________________________________________________________ A.M. Bento Agriculture and Environment

2011 Outlook Handbook
Page 9‐3
3. Summary of the Vision Statement for a Low Carbon Agriculture Sector in NYS by 2050 The Climate Change Action Plan identified the following key characteristics for NYS’ Agriculture
sector by 2050. These were broad goals, achieved through brainstorm sessions and consensus building:
(a) Energy Independence and Low Energy Intensity – The vision for 2050 consists of integrating the agriculture sector with the other energy producing sectors of the economy. Specifically, at least medium and large-scale farms should have the ability to become next exporters of electricity and biogas. While integrated with surrounding communities, farms will provide power to the grid from on-farm anaerobic digestion of organic wastes and waste heat for onsite and offsite use. Less productive lands could also potentially supply feedstocks for transportation fuels or direct power combustion. Research at Cornell and other land grant universities suggests tremendous increases in yields of dedicated bio-energy crops, removing pressure from land and competition away from food production (NY Biofuels Roadmap, 2010). Such research has yet to be linked with data on costs of providing these various feedstocks and market value.
(b) Farms Should be Recognized as Ecosystem Services Providers - The 2050 vision consists of re-
coupling animal and crop production, and maximization of carbon flows through nutrient management, soil conservation, and water quality protection. Green payments should be put in place to maximize the value of ecosystem services provided by farms.
(c) Integration of Smart Growth Policies with Farmland Preservation – It is well documented that smart
growth policies have prevented the loss of agricultural lands by promoting in-fill development, revitalization of city cores and increased costs of land conversion (Bento et al. 2006, Bento et al. 2011). The vision of 2050 consists of removing as many pre-existing subsidies to land conversion as possible to facilitate a better management of lands. Farms should be seen as systems where selective decisions of use for intensive cultivation for crop production and for carbon storage can be made. Carbon storage can be achieved either through soil compost or biochar.
(d) Adaptation – The vision for 2050 is that the agriculture sector will have adopted management
strategies and technologies that support adaptation to unavoidable changes in climate and enable agricultural and economic success in a carbon-constrained environment.
4. Summary of the Vision Statement for the Forestry Sector in NYS by 2050
The Climate Change Action Plan report identified the following key characteristics for NYS forests by 2050. Again, similar to the vision for agriculture, the vision presented here represents the results of a series of brainstorm sessions and consensus building: (a) Better Management towards carbon sequestration – The vision for 2050 is to promote the
management of forest lands to increase biomass production and carbon sequestration. Public Policies will be developed that aim to motivate retention, expansion, and better management of forest lands, while discouraging deforestation. Integrated land-use policies will maximize various ecosystem services and carbon benefits.
(b) Carbon Sequestration – Advances in geographical information systems and statistical methods allows
for a better monitoring of carbon sequestration. The vision for 2050 is to achieve optimal carbon storage on all forest lands. An effective monitoring system will track forest carbon pools.
(c) Promotion of Fuel Substitution – The vision for 2050 is that NYS’s large amounts of idle agricultural
land will be brought back into tillage or will be dedicated for the production of woody biomass crops
________________________________________________________________________________________ A.M. Bento Agriculture and Environment
Page 9‐4 2011 Outlook Handbook
for energy. At the present time such options are not cost-effective, requiring serious public policy support. As outlined in the 2010 Biofuels Roadmap (NYSERDA, 2010), if indeed these idle lands could be brought into production of energy feedstocks, NYS could consider becoming a large producer of biofuels and bio-power.
(d) Climate Change Adaptation – Forest-based policies should be put in place so that the capacity of the
state’s forest lands to both mitigate and adapt to climate change is maximized. Potential attention to forest pest invasions must be considered.
5. Policy Options
As discussed in section 2, the combined emissions from agriculture and forestry represent a rather
small portion of overall NYS GHG emissions. However, many of the mitigation and sequestration options available to these sectors can be cost-effective. The climate change action plan working group argues that, if implemented correctly, such policies can also offer significant environmental, economic, and social benefits beyond GHG reductions. Such benefits include improved air and water quality and increased agricultural and forest products. The climate change action plan report identified the following broad goals for policy options: (a) Reduce Energy-related Emissions – Policies should promote the development of renewable energy
technologies, including bio-based technologies, and energy efficiency policies; (b) Reduce Methane emissions and Nitrous Oxide - Reduce methane (global warming potential (GWP)
=21-25) and nitrous oxide (GWP=296-310), the predominant agriculturally generated and waste-related GHGs, through the deployment of a combination of systems;
(c) Capitalize on agriculture and forestry’s ability to store carbon in natural systems; (d) Incorporate adaptation strategies wherever possible.
Proponents of biofuels argue that energy from biomass represents an opportunity to reduce GHGs through the displacement of higher-carbon fossil-based energy sources while at the same time increasing in-state circulation of energy dollars and providing significant economic opportunities. There is no agreement amongst researchers of the validity of this statement. For at least corn-based ethanol, recent studies document that, at the margin, the expansion of ethanol can actually contribute to a reduction of blended fuel prices and at the margin increased vehicle miles travelled. Therefore, while it is true that per gallon the fuel becomes cleaner, overall fuel consumption increases. As a consequence, it is not clear whether GHG emissions will reduce. The prospects for second generation biofuels are much higher, although at today’s technologies this sector will not be competitive. Direct combustion of biomass is another option, often thought to be more cost-effective.
Properly managed biomass production systems may therefore offer an opportunity to realize net
carbon benefits. The proposed set policies – ranging from mandates for bio-energy production to tax credits for liquid biofuels and bio-power - seek to capitalize on the state’s ability to achieve GHG reductions through sustainable production and wise use of this renewable resource.
Our existing landscape is a critical component of the carbon cycle. Several of the policy options seek
to enhance the state’s existing carbon sinks through a combination of improved land management and land-use protection measures.
A.M. Bento Agriculture and Environment
2011 Outlook Handbook Page 9-5
________________________________________________________________________________________ A. M. Bento Agriculture and the Environment
All of the policy options presented below in Table 1 rely on management system changes at the most basic level on the farm or the forest. Incorporating GHG reduction and sequestration strategies into existing management systems and stewardship principles will require a high degree of behavioral change. Developing the education, outreach, job training and decision-making tools necessary to engender this level of behavioral change is an immediate challenge.
Table 1 presents a summary of the policy options for agriculture and forestry examined by the climate
change action plan. The table reports the policy options, the amount of in-state GHG reductions, the net present value of cost savings (2011-2030) and the cost/savings per avoided emissions. These were calculated based on engineering-type cost calculations. We refer the reader to the climate change action report to further discussion on the underlying assumptions used to calculate each of the cost cells in the table. As discussed in the concluding remarks, most of the numbers displayed below should be interpreted with great caution.

I
::.:... ~ Fl' g. ~ § l::l...
~ ~
~.
~
~ £l ......
Table 9.1. Policy Options to Agriculture and Forestry (source: Climate Change Action Plan Report, 2010)
In-State GHG Reductions(MMtC02e)
2020 2030 Total 2011-2030 I I I
Policy Option
Production of Sustainable Feedstock for Electricity, Heat, Steam Production, and
Liquid/Gaseous Biofuels
Conversion of Sustainable Feedstock to Electricity, Heat, Steam Production, and
Liquid/Gaseous Biofuels
Maximize Waste Reduction, Recycling, and Composting-In-State Only
Integrated Farm Management Planning and Application
Conserve Open Space, Agricultural Land and Wetlands
Increase On-Farm Energy Efficiency and Production of Renewable Energy
Forest Restoration
Urban Forestry
Reforestation
'1:l
~ IQ
'"
$35
-$31
$16
$1
w <::> ......$6 ......
$140 a l::: ::::t$36 o o
"'" ~ ;:::
~ o o
"'"
Net Present Value:
Cost/Savings 2011-2030
(Million 2008$)
Net Cost/Savings per Avoided Emissions ($/tC02e)
Not available
Not available
$280
-$201
$1,500
$3.0
$290
$3,200
$1,200
0.5
0.3
4.5
0.2
2.3
1.0
1.8
0.7
0.6
5.5
0.4
4.7
2.0
2.4
8.0
6.5
95
3.8
49
22
34 ~
~ b::l (1:l ~
0'

2011 Outlook Handbook
Page 9‐7
A.M. Bento Agriculture and Environment
6. Concluding Remarks
We conclude this chapter by offering some caveats when interpreting the magnitudes of emissions
savings and costs reported in Table 1. Like many state climate change action plans, NYS climate change action plan is mostly motivated by the failure of higher levels of government (i.e. the federal government) to develop comprehensive climate legislation. However, one should not forget that GHG emissions are global in nature. As a consequence, one should question the role of state government to attempt to reduce GHG emission in isolation. Our concern is that many of the emissions reductions reported in table 1 may not fully materialize simply because, while there could be in-state emissions reductions resulting from state level climate plans, such emissions will probably take place elsewhere. In fact, recent academic literature (e.g. Stavins and Goulder, 2010; Bento and Msaid, 2010) points to the simple fact that there are leakages whenever a regulation is incomplete. Global pollutants, such as GHG emissions, require global regulations. State level attempts may be frustrated in part because emissions saving in the state that introduces the regulation will leak into unregulated states, as capital ‘flies’. In the context of biofuels policies, for example, it is well documented that expansion of biofuels production at the expanse of crop production will result in increased crop production elsewhere. This leakage creates additional agricultural emissions (potential increased emissions if forest lands get converted) that must be deducted from the direct fuel emissions savings when a biofuel replaces a traditional source of fuel. As a consequence, the costs presented in table 1 should be taken with caution, as they ignore all potential sources of leakages.
At the same time, it is important to note that we are not saying that there is no room for state level intervention to reduce GHG emissions. State level policies that do not lead to leakages can effectively reduce GHG emissions and increase the productivity of the state. For example, reductions in emissions at the farm that are a result of cleaner technology adoption or on-farm production of energy have the potential to become serious options, as they are less likely to create leakages. Future analysis should re-evaluate the costs of emissions savings achieved by state level interventions in a system where not all states have regulations in place.
References Bento, A., D. Kaffine and Sofia Franco. 2006. The Efficiency and Distributional Impacts of Anti-Sprawl Policies. Journal of Urban Economics Bento, A., D. Kaffine and Sofia Franco. 2010. Is there a Double-Dividend from Anti-Sprawl Policies? Journal of Environmental Economics and Management. Forthcoming. Bento, A. and Y. Msaid. 2010. How do State Level Climate Policy Alter the costs of Federal Cap-and-Trade Programs? Charles H. Dyson School of Applied Economics and Management, Working paper Goulder, L. and R. Stavins. 2010. Interactions between State and Federal Climate Change Policies. National Bureau of Economic Research, Working Paper 16123 New York State Climate Action Council. 2010. Climate Action Plan Interim Report. http://www.nyclimatechange.us/ewebeditpro/items/O109F24147.pdf NYSERDA. 2010. NYS Renewable Fuels Roadmap. http://www.nyserda.org/publications/renewablefuelsroadmap/

Notes

M.I. Gómez and B.J. Rickard Specialty Crops
Chapter 10. Specialty Crops Miguel I. Gómez, Assistant Professor and Bradley J. Rickard, Assistant Professor
Specialty crops are an important component of New York State’s agricultural economy. In 2009 the
total farm value of all agricultural products produced in New York was approximately $4.7 billion, which changed little from the total farm value in 2008. Fruit and vegetable crops accounted for nearly 14% of the total value of agricultural production in New York State and another 4% was generated from production of ornamental crops. Horticultural commodities are an important component of agriculture in New York State and we continue to see a significant quantity of fruits and vegetables produced in the State, and marketed to consumers through various channels. Apples and grapes are the two highest revenue fruit crops in New York while cabbage, sweet corn, and onions have been the three highest revenue vegetable crops in recent years; the value of production for all five commodities has typically exceeded $50 million per year.
Below we divide specialty crop markets into four categories and take a closer look at market
conditions in each category. We examine patterns, and provide an outlook, for fruit and berries, vegetables (fresh and processing) grapes and wine, and ornamental products in New York. In each case we review production and price data between 2006 and 2010, give an economic outlook on expected market conditions in 2011, and also provide some thoughts on the long term potential for horticultural crops produced in New York State. 10.1 Fruit and Berry Situation and Outlook
Market conditions for major fruit crops in New York State were, overall, less favorable in 2009 compared to 2008. Here we take a closer look at domestic prices and production values, consumption patterns, and international market conditions for major fruit crops in 2009. Similar to last year, we examine grapes as a separate fruit category and discuss market conditions for grapes in section 10.3. Overall, the total value of fruit (including grapes) in New York in 2009 was $305 million, down 11% from the value in 2008. Prices for all of the major fruit crops in New York State were lower in 2009 compared to 2008, and this is, in a large part, a key driver of the lower total values of fruit crops in 2009. Once the data from 2010 are released, we expect to see annual aggregate statistics that show an increase in the total value of fruit produced in New York in 2010 compared to 2009. Much of the decrease in crop values in 2009 is related to lower prices that were driven by excess inventory. Fruit crop prices have rebounded in 2010 due to reduced quantities produced in the eastern states and due to reduced carryover from the 2009 crop.
Table 10-1 shows that New York apple production in 2009 was 680 thousand tons and valued at
$208.9 million. The overall value of the 2009 crop was down relative to the 2008 crop; values of both the fresh and processing crops were down in 2009 compared to 2008. Table 10-1 also indicates that the average price of New York apples fell in 2009 compared to 2008; the price of apples fell for apples used in the fresh and processing markets. The average price for New York apples used in processing market was $166 per ton in 2009, and although this is lower than the prices in 2007 and 2008, it remains higher than the five-year average of $147 per ton between 2003 and 2007. Prices in 2009 were also significantly lower in the fresh apple market, yet they are expected to be higher in 2010. Early evidence from the USDA Fruit and Tree Nuts Outlook shows that retail apple prices are 8% higher in 2010 compared to 2009.
Relative to other states, New York continued to be a major national producer of apples in 2009. As shown in Table 10-2, the value of U.S. apple production in 2009 was $2,290 million based on production of 9,915 million pounds and an average price of $0.231 per pound. In 2010, total apple production is expected

Page 10-2 2011 Outlook Handbook
Specialty Crops M.I. Gómez and B.J. Rickard
to fall by about 4% to approximately 9,476 million pounds. Prices would need to increase by at least 8% to maintain the value of the total crop in 2010. Washington State typically produces approximately 55 to 60% of the U.S. apple crop and New York State is the second largest producing state growing about 15% of the national crop. Production in Washington State in 2010 is forecasted to increase relative to 2009, while production in New York State, and many other eastern states, is expected to be less in 2010 than it was in 2009 due to unfavorable weather conditions.
In addition to apples, New York State is also a top producer of several other tree fruit and berry crops.
Table 10-1 shows that pear and stone fruit (cherry and peach) production increased in 2009 versus 2008; crop values increased for pears and peaches but fell for cherries. In 2009 New York produced approximately $4.8 million in cherries ($2.5 million was tart cherries and $2.3 was sweet cherries), $5.4 million in peaches, and $4.9 million in pears. Although not shown in Table 10-1, berry production (including strawberries, blueberries, and red raspberries) was slightly lower in 2009 versus 2008, yet the total value of berries produced in New York State increased by approximately 10.9% in 2009 compared to 2008. The USDA Fruit and Tree Nuts Outlook reports lower prices for peaches in 2010 yet higher prices for the other key fruit crops grown in New York State.
TABLE 10-1. COMMERCIAL NONCITRUS AND NONGRAPE FRUIT PRODUCTION
AND PRICES IN NEW YORK STATE
Production Prices 2007 2008 2009 2007 2008 2009
------ Thousand tons ------ ------ Dollars per ton ------ Apples 635 625 680 426 418 308 Fresh 340 265 338 682 624 450 Processed 310 345 342 174 260 166 Tart Cherries 6.5 4.8 5.1 672 826 486 Pears 11.2 10.3 9.9 497 504 490 Peaches 6.3 5.5 6.5 634 922 845 Sweet Cherries 1.2 1.1 1.2 2980 3520 2440
Sources: New York Agricultural Statistics, 2010.
Table 10-2 highlights the values of tree fruit crops in New York between 2007 and 2009; we also show the total value of these crops nationally in 2007 and 2008 (USDA Agricultural Statistics data for 2009 had not been released when the Outlook Handbook was being prepared). The information in Table 10-2 highlights that New York apples and tart cherries are important nationally, pears and peaches are important for New York State but have less of an impact on those markets nationally, and sweet cherries are a relatively small industry in New York State. The value of both the U.S. and New York’s apple crop decreased in 2009 relative to 2008. The value of tart cherries, pears, and peaches increased nationally in 2009, yet the changes in New York State were more subtle. The smaller changes in production in New York State are likely due to the regional marketing of these products that is more typical in the Northeast.
In addition to the differences in production and intra-national trade within the United States,
international trade continues to be an important factor in fresh and processed fruit markets. Imports of fresh apples in the United States reached a high of 472 million pounds in 2003/04 but have fallen recently; U.S. imported 361 million pounds of fresh apples in 2009/10 and is expected to import approximately 377 million pounds in 2010/11.
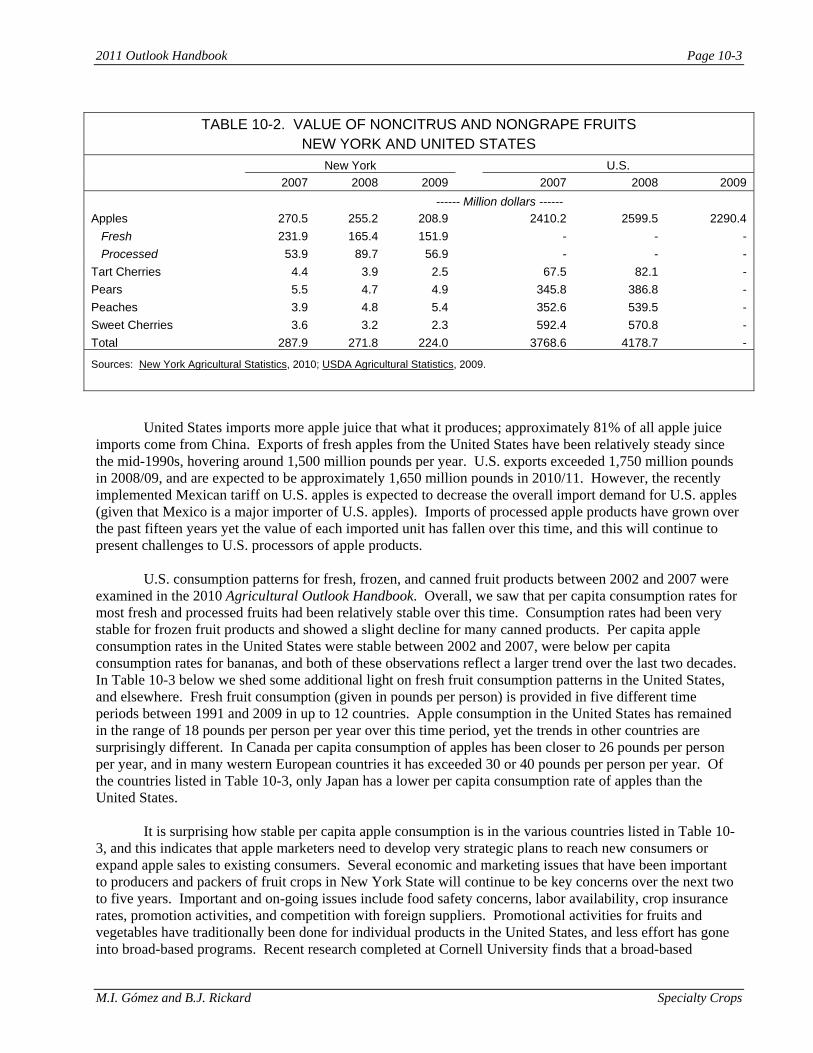
2011 Outlook Handbook Page 10-3
M.I. Gómez and B.J. Rickard Specialty Crops
TABLE 10-2. VALUE OF NONCITRUS AND NONGRAPE FRUITS
NEW YORK AND UNITED STATES
New York U.S. 2007 2008 2009 2007 2008 2009
------ Million dollars ------Apples 270.5 255.2 208.9 2410.2 2599.5 2290.4 Fresh 231.9 165.4 151.9 - - - Processed 53.9 89.7 56.9 - - - Tart Cherries 4.4 3.9 2.5 67.5 82.1 - Pears 5.5 4.7 4.9 345.8 386.8 - Peaches 3.9 4.8 5.4 352.6 539.5 - Sweet Cherries 3.6 3.2 2.3 592.4 570.8 - Total 287.9 271.8 224.0 3768.6 4178.7 -
Sources: New York Agricultural Statistics, 2010; USDA Agricultural Statistics, 2009.
United States imports more apple juice that what it produces; approximately 81% of all apple juice imports come from China. Exports of fresh apples from the United States have been relatively steady since the mid-1990s, hovering around 1,500 million pounds per year. U.S. exports exceeded 1,750 million pounds in 2008/09, and are expected to be approximately 1,650 million pounds in 2010/11. However, the recently implemented Mexican tariff on U.S. apples is expected to decrease the overall import demand for U.S. apples (given that Mexico is a major importer of U.S. apples). Imports of processed apple products have grown over the past fifteen years yet the value of each imported unit has fallen over this time, and this will continue to present challenges to U.S. processors of apple products.
U.S. consumption patterns for fresh, frozen, and canned fruit products between 2002 and 2007 were
examined in the 2010 Agricultural Outlook Handbook. Overall, we saw that per capita consumption rates for most fresh and processed fruits had been relatively stable over this time. Consumption rates had been very stable for frozen fruit products and showed a slight decline for many canned products. Per capita apple consumption rates in the United States were stable between 2002 and 2007, were below per capita consumption rates for bananas, and both of these observations reflect a larger trend over the last two decades. In Table 10-3 below we shed some additional light on fresh fruit consumption patterns in the United States, and elsewhere. Fresh fruit consumption (given in pounds per person) is provided in five different time periods between 1991 and 2009 in up to 12 countries. Apple consumption in the United States has remained in the range of 18 pounds per person per year over this time period, yet the trends in other countries are surprisingly different. In Canada per capita consumption of apples has been closer to 26 pounds per person per year, and in many western European countries it has exceeded 30 or 40 pounds per person per year. Of the countries listed in Table 10-3, only Japan has a lower per capita consumption rate of apples than the United States.
It is surprising how stable per capita apple consumption is in the various countries listed in Table 10-
3, and this indicates that apple marketers need to develop very strategic plans to reach new consumers or expand apple sales to existing consumers. Several economic and marketing issues that have been important to producers and packers of fruit crops in New York State will continue to be key concerns over the next two to five years. Important and on-going issues include food safety concerns, labor availability, crop insurance rates, promotion activities, and competition with foreign suppliers. Promotional activities for fruits and vegetables have traditionally been done for individual products in the United States, and less effort has gone into broad-based programs. Recent research completed at Cornell University finds that a broad-based

Page 10-4 2011 Outlook Handbook
Specialty Crops M.I. Gómez and B.J. Rickard
TABLE 10-3. CONSUMPTION PATTERNS FOR SELECTED FRESH FRUITS
IN VARIOUS COUNTRIES Consumption
1991-93 2001-03 2004-06 2007-09 2009 ------ pounds per capita ------- Apples United States 18.92 15.84 18.04 17.82 18.04 United Kingdom 24.64 20.46 22 22.22 22.66 Japan 12.32 12.76 11.22 12.54 12.76 Canada 26.4 25.08 29.48 28.6 28.82 Germany 52.36 40.26 41.8 42.9 42.9 France 30.8 35.64 35.64 33.22 33.88 Spain 38.94 41.14 33.88 30.36 27.94 Italy 46.64 44 37.84 37.84 38.94 New Zealand 32.34 35.64 29.92 29.04 28.82 China 11.88 28.38 29.04 36.3 43.34 Japan 12.32 12.76 11.22 12.54 12.76 Turkey 71.06 72.6 64.68 69.96 69.52 Bananas United States 24.42 28.38 25.08 25.08 - United Kingdom 14.3 24.42 25.74 26.4 - Japan 15.4 14.52 16.28 17.6 - Oranges United States 12.32 8.36 11.88 11.88 - United Kingdom 6.38 7.26 6.82 6.16 - Japan 15.84 15.18 14.08 13.2 -
Source: World Apple Review, Belrose Inc., 2010.
program (e.g., Eat 5-A-Day) has the capacity to be very effective in increasing consumers’ willing to pay, and their demand, for fresh fruits and vegetables. This project brought approximately 300 people into the Lab for Experimental Economics and Decision Research at Cornell University, and tested consumer response to various advertising efforts. This research found that consumers’ willingness to pay for fruits and vegetables increased by as much as 20% after being exposed to broad-based advertising, and also found very little response to advertising efforts that were directed towards a single commodity.
Two other important issues that have received less attention, but may have strategic implications for fruit growers in New York State, include i) the role of sanitary and phytosanitary (SPS) barriers in international markets for apples, and ii) the market potential for “club” apple varieties. SPS measures have become a topic of much concern among apple exporters and public policy officials in the United States and in other apple producing countries. The World Trade Organization (WTO) case that examined the trade dispute concerning apples imported into Japan from the United States generated much debate about the existence of SPS barriers, and the economic impact of such measures. Recent research done at Cornell examines the consequences of SPS measures in global markets for apples, and compares the effects to those from traditional tariffs that are still widely used by many apple importing countries. The results show that SPS barriers are important for certain exporting countries; removing such barriers would generate up to $27
2011 Outlook Handbook Page 10-5
M.I. Gómez and B.J. Rickard Specialty Crops
million of additional income globally. However, reducing global tariffs by 36% would generate approximately $135 million in additional income globally. Furthermore, reductions in tariffs of this magnitude were introduced under the Uruguay Round Agreement in Agriculture, under the auspices of the WTO, and it is not unreasonable to think that similar reductions will be imposed in subsequent rounds of the WTO. Reforms to SPS measures have not previously been included on the negotiating table at the WTO, and may be more difficult to implement.
Producing the so-called “club” or managed apple varieties provides an interesting opportunity for
growers to market new and exciting apple varieties. The producers’ objective here is to stimulate additional demand for new apple products, manage the supply of these varieties such that price premiums can be achieved, and receive higher net returns per acre. However, the management of “club” varieties is not a straightforward marketing exercise and much thought needs to be spent regarding market size, pricing strategies, and promotional efforts. The 2010 World Apple Review points to the following eight new apples that have the best chance of becoming commercial varieties by 2015: Pinova (or Piñata), Ambrosia, Envy, Kanzi, Belchard, Junami, Rubens, and Tentation. Several growers in New York State have also committed acreage for producing two new varieties developed by Cornell’s plant breeding program, currently named NY1 and NY2. Whether any of these apples can be successfully grown and marketed in New York State is an important marketing question. Preliminary research shows that consumers are willing to pay for the new varieties developed by Cornell, and future work will develop a framework to understand the consumer segments that are most likely to purchase these varieties.

Page 10-6 2011 Outlook Handbook
Specialty Crops M.I. Gómez and B.J. Rickard
10.2 Vegetable Situation and Outlook
Total land planted to vegetables in New York State fell from 129,300 acres in 2008 to 119,700 acres in 2009; planted and harvested acres of fresh vegetables were down slightly while planted and harvested acres of processing vegetables were down significantly in 2009. The value of New York vegetable production (including principal vegetables for fresh and processing markets but not including potatoes and dry beans) decreased from $468 million in 2008 to $325 million in 2009; the value of fresh vegetables fell by over $100 million in 2009 compared to 2008. In 2009 fresh market vegetables contributed $278 million to the total (down from $384 million in 2008) while processed market vegetables contributed $46.6 million in 2009 (again, down from 2008 when the total value was $62 million). The decrease in planted acreage of vegetables in 2009 was partly due to prices for other competing field crops such as corn and soybeans, and also due to poor weather conditions in the spring of 2009.
Preliminary market conditions reported in the USDA Vegetables and Melons Outlook suggest that
prices for most fresh vegetables will be up slightly in 2010 compared to levels observed in 2009. The same Outlook report shows that total acreage of fresh and processing vegetables in the United States is down slightly in 2010 compared to the average between 2007 and 2009. However, good harvest weather coupled with increased yields in 2010 may bring average prices in 2010 similar to those experienced in 2009. Demand and prices for processing vegetables in 2010 are expected to be similar to conditions in 2009. Producer Price Indexes indicate that grower prices in mid-2010 were up overall for fresh vegetables, and notably up for cabbage, greens, peppers, and tomatoes. Exports of fresh vegetables have been up in 2010 in the key international markets; they were up 8% to Canada, up 34% in Mexico, up 38% in Japan, up 21% in Taiwan, and up 20% in the United Kingdom. Similar to the case for U.S. apples being subjected to a Mexican tariff, U.S. onions shipped to Mexico are facing a similar retaliatory tariff of between 10% and 20%. However, the overall volume of exports for most vegetables (including onions) is up in 2010 compared to 2009. Tomatoes and greens have faced weather-related issues in 2010, and therefore U.S. exports of both products are down in 2010 relative to 2009. Canada remains as the major export destination for U.S. fresh vegetables; in 2010 they are expected to import over 75% of the volume of total U.S. exports of fresh vegetables. The continued strength of the Canadian dollar in 2010 has not largely dampened vegetable exports to this important market, and this has improved revenues for the volume of vegetable exports to Canada.
New York continues to be a significant producer of onions, cabbage, and sweet corn; for each of these
commodities, New York State has consistently produced crops that have a value of $50 million or more. Historically New York State has produced a snap bean crop that had a value exceeding $50 million, but the snap bean crop in 2009 fell short of this mark. In the tables and discussion that follow, we focus on recent economic conditions, and provide some outlook, for nine fresh vegetable products and four processed vegetable products that are important markets in New York. Table 10-4 shows production patterns for key vegetables in New York between 2007 and 2009. Data describing trends in fresh vegetable markets are shown at the top of Table 10-4 and trends for processing vegetables are shown on the bottom portion of Table 10-4. Much of the most recent information for processing vegetables is not available from New York State Agriculture and Markets due to the small number of producers involved and the proprietary nature of the data.
Production of most fresh vegetable products in New York State was down in 2009 relative to 2008; in
some cases production was down significantly. Onions were the one crop listed in Table 10-4 that showed an increase in production in 2009 compared to 2008. Prices for sweet corn, onions, snap beans, cucumbers, and tomatoes were up in 2009 compared to 2008. Recent USDA information indicates that national production levels were higher again in 2010 while prices are expected to remain relatively similar to levels observed in 2009. Given the trends in production and prices in Tables 10-4, it should come as no surprise that the values for most of the fresh vegetable products were lower, and in some cases substantially lower, in 2009 relative to 2008 (see Table 10-5). The total value of the cabbage crop dropped significantly in 2009, as did the value of
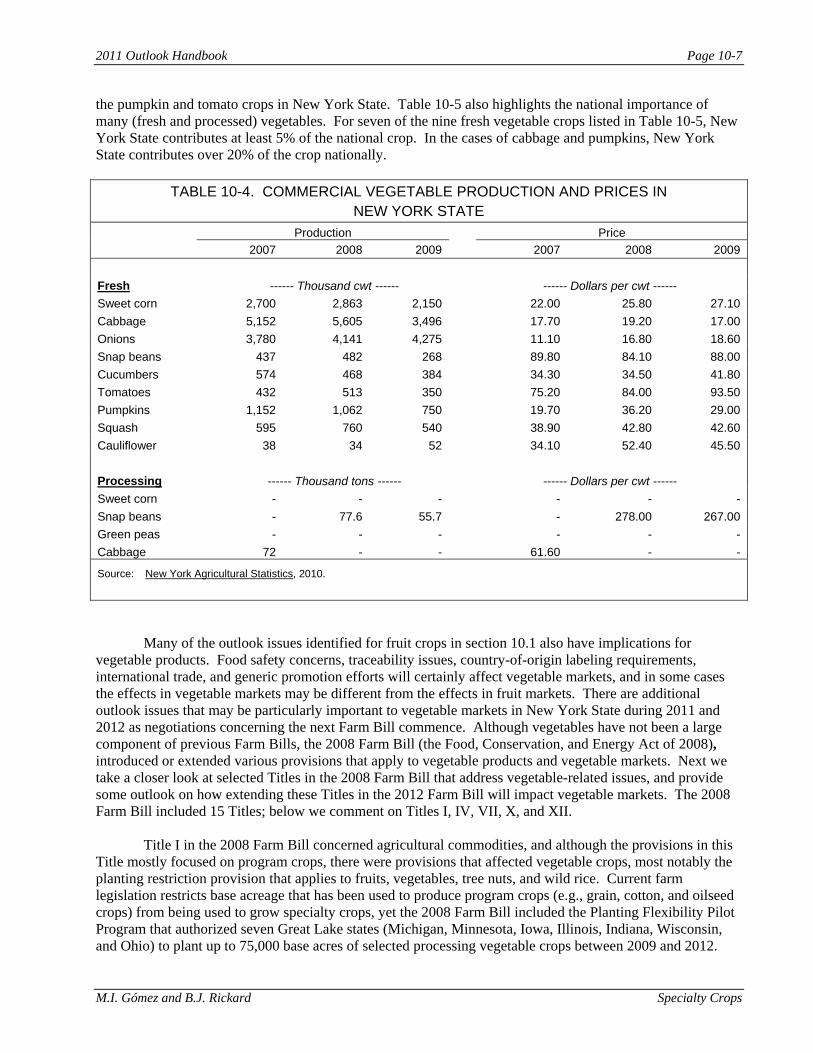
2011 Outlook Handbook Page 10-7
M.I. Gómez and B.J. Rickard Specialty Crops
the pumpkin and tomato crops in New York State. Table 10-5 also highlights the national importance of many (fresh and processed) vegetables. For seven of the nine fresh vegetable crops listed in Table 10-5, New York State contributes at least 5% of the national crop. In the cases of cabbage and pumpkins, New York State contributes over 20% of the crop nationally.
TABLE 10-4. COMMERCIAL VEGETABLE PRODUCTION AND PRICES IN
NEW YORK STATE
Production Price 2007 2008 2009 2007 2008 2009
Fresh ------ Thousand cwt ------ ------ Dollars per cwt ------Sweet corn 2,700 2,863 2,150 22.00 25.80 27.10 Cabbage 5,152 5,605 3,496 17.70 19.20 17.00 Onions 3,780 4,141 4,275 11.10 16.80 18.60 Snap beans 437 482 268 89.80 84.10 88.00 Cucumbers 574 468 384 34.30 34.50 41.80 Tomatoes 432 513 350 75.20 84.00 93.50 Pumpkins 1,152 1,062 750 19.70 36.20 29.00 Squash 595 760 540 38.90 42.80 42.60 Cauliflower 38 34 52 34.10 52.40 45.50 Processing ------ Thousand tons ------ ------ Dollars per cwt ------Sweet corn - - - - - - Snap beans - 77.6 55.7 - 278.00 267.00 Green peas - - - - - - Cabbage 72 - - 61.60 - -
Source: New York Agricultural Statistics, 2010.
Many of the outlook issues identified for fruit crops in section 10.1 also have implications for
vegetable products. Food safety concerns, traceability issues, country-of-origin labeling requirements, international trade, and generic promotion efforts will certainly affect vegetable markets, and in some cases the effects in vegetable markets may be different from the effects in fruit markets. There are additional outlook issues that may be particularly important to vegetable markets in New York State during 2011 and 2012 as negotiations concerning the next Farm Bill commence. Although vegetables have not been a large component of previous Farm Bills, the 2008 Farm Bill (the Food, Conservation, and Energy Act of 2008), introduced or extended various provisions that apply to vegetable products and vegetable markets. Next we take a closer look at selected Titles in the 2008 Farm Bill that address vegetable-related issues, and provide some outlook on how extending these Titles in the 2012 Farm Bill will impact vegetable markets. The 2008 Farm Bill included 15 Titles; below we comment on Titles I, IV, VII, X, and XII.
Title I in the 2008 Farm Bill concerned agricultural commodities, and although the provisions in this
Title mostly focused on program crops, there were provisions that affected vegetable crops, most notably the planting restriction provision that applies to fruits, vegetables, tree nuts, and wild rice. Current farm legislation restricts base acreage that has been used to produce program crops (e.g., grain, cotton, and oilseed crops) from being used to grow specialty crops, yet the 2008 Farm Bill included the Planting Flexibility Pilot Program that authorized seven Great Lake states (Michigan, Minnesota, Iowa, Illinois, Indiana, Wisconsin, and Ohio) to plant up to 75,000 base acres of selected processing vegetable crops between 2009 and 2012.

Page 10-8 2011 Outlook Handbook
Specialty Crops M.I. Gómez and B.J. Rickard
TABLE 10-5. VALUE OF COMMERCIAL VEGETABLE PRODUCTION
NEW YORK AND UNITED STATES
New York U.S. 2007 2008 2009 2007 2008 2009
Fresh ------ Million dollars ------ Sweet corn 59.4 73.9 58.3 626.8 752.6 - Cabbage 84.8 79.1 54.5 423.5 366.6 - Onions 38.6 58.9 67.6 816.1 865.4 - Snap beans 39.2 40.5 23.6 391.1 331.2 - Cucumbers 19.7 16.1 16.1 228.2 242.7 - Tomatoes 32.5 43.1 32.7 1,277.6 1414.1 - Pumpkins 22.7 38.4 21.8 117.2 140.8 - Squash 23.2 32.5 23.0 227.2 204.3 - Cauliflower 1.3 1.8 2.4 237.7 261.1 - Processing Sweet corn - - - 237.0 330.3 - Snap beans - 21.5 14.9 129.8 177.3 - Green peas - - - 111.6 148.1 - Cabbage 4.5 - - - - -
Sources: New York Agricultural Statistics, 2010; USDA Agricultural Statistics, 2009.
The conventional wisdom is that the planting restrictions have had negligible effects on fruit and
vegetable markets in the United States and abroad, but recently a complaint about this policy was introduced to the WTO. Members of the WTO claimed that the planting restrictions provide an incentive for U.S. farmers to overproduce program crops and this leads to lower prices of program crops in outside markets. As a result, there has been pressure to introduce reform to this provision from grain producers outside the United States and vegetable processors in the United States. The Pilot Program is a small-scale test of the implications from the planting restrictions for processing vegetable growers in the Great Lakes region. Early analysis of the Pilot Program suggests that lifting the planting restrictions would have important effects for producers that have the capacity to produce and market processing vegetables, but would have limited effects on global production and prices of processing vegetables or program crops. It is widely expected that this policy issue will be carefully reviewed prior to the 2012 Farm Bill.
Title IV includes various nutrition programs and it includes over 65% of the total Farm Bill budget.
This Title includes many different programs, but the major ones are the Supplemental Nutrition Assistance Program (SNAP), formerly known as the Food Stamp Program, Women, Infants, and Children (WIC), and the National School Lunch Program. Many of the programs and provisions within Title IV focus on the nutritional benefits of eating a diet rich in fruits and vegetables, and recent changes to these programs have further emphasized this message. Programs within this Title appeal to a wide audience and therefore it is expected that future Farm Bills will place a greater focus on consuming (and producing) fruits and vegetables. The discussion leading up to the 2012 Farm Bill will include ideas that propose various ways to increase consumption of healthy foods made from specialty crops, and additional research is needed here to assess how such policies will influence produce consumption. Research is also needed here to consider the efficacy of various mechanisms that might be used to stimulate demand.

2011 Outlook Handbook Page 10-9
M.I. Gómez and B.J. Rickard Specialty Crops
Title VII in the 2008 Farm Bill focused on research, and one important (and new) program in this Title was the Specialty Crop Research Initiative (SCRI) that introduced a substantial amount of funds for research and extension activities that directly examined production, processing, and marketing topics facing fruit and vegetable industries. The benefit-cost ratio of public research investments has been estimated to exceed 10:1, yet there had been an underinvestment of public research for specialty crops in the United States prior to the SCRI program. The role of traditional public research in agriculture is uncertain in future Farm Bills, yet there appears to be momentum to maintain and even expand the SCRI program given its early success and its links to programs in Title IV. Related to this is the research programs related specifically to horticulture and organic markets within Title X.
Lastly, Title XII focuses on crop insurance and other risk management strategies for agricultural
producers. There is building consensus that the future of agricultural policy will be centered around risk management programs rather than traditional safety net programs, and that risk management programs will be extended to a wider range of agricultural commodities. The recent boom and bust in global agricultural markets dramatically illustrated the importance of risk management for U.S. farmers, and put risk management policy at the forefront of the debate surrounding the 2012 Farm Bill. These events have increased of a gradual re-shaping of U.S. farm policy towards insurance, countercyclical payments, and other risk management-type policy mechanisms.
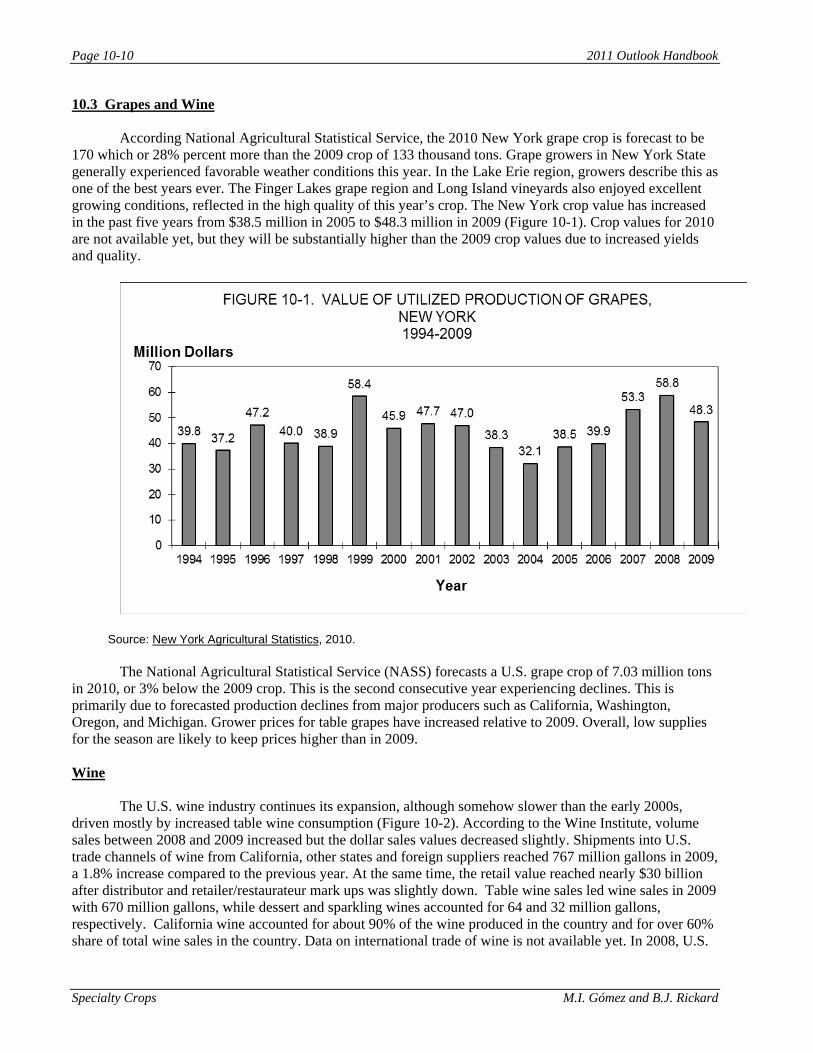
Page 10-10 2011 Outlook Handbook
Specialty Crops M.I. Gómez and B.J. Rickard
10.3 Grapes and Wine
According National Agricultural Statistical Service, the 2010 New York grape crop is forecast to be 170 which or 28% percent more than the 2009 crop of 133 thousand tons. Grape growers in New York State generally experienced favorable weather conditions this year. In the Lake Erie region, growers describe this as one of the best years ever. The Finger Lakes grape region and Long Island vineyards also enjoyed excellent growing conditions, reflected in the high quality of this year’s crop. The New York crop value has increased in the past five years from $38.5 million in 2005 to $48.3 million in 2009 (Figure 10-1). Crop values for 2010 are not available yet, but they will be substantially higher than the 2009 crop values due to increased yields and quality.
Source: New York Agricultural Statistics, 2010.
The National Agricultural Statistical Service (NASS) forecasts a U.S. grape crop of 7.03 million tons in 2010, or 3% below the 2009 crop. This is the second consecutive year experiencing declines. This is primarily due to forecasted production declines from major producers such as California, Washington, Oregon, and Michigan. Grower prices for table grapes have increased relative to 2009. Overall, low supplies for the season are likely to keep prices higher than in 2009. Wine The U.S. wine industry continues its expansion, although somehow slower than the early 2000s, driven mostly by increased table wine consumption (Figure 10-2). According to the Wine Institute, volume sales between 2008 and 2009 increased but the dollar sales values decreased slightly. Shipments into U.S. trade channels of wine from California, other states and foreign suppliers reached 767 million gallons in 2009, a 1.8% increase compared to the previous year. At the same time, the retail value reached nearly $30 billion after distributor and retailer/restaurateur mark ups was slightly down. Table wine sales led wine sales in 2009 with 670 million gallons, while dessert and sparkling wines accounted for 64 and 32 million gallons, respectively. California wine accounted for about 90% of the wine produced in the country and for over 60% share of total wine sales in the country. Data on international trade of wine is not available yet. In 2008, U.S.

2011 Outlook Handbook Page 10-11
M.I. Gómez and B.J. Rickard Specialty Crops
wine exports continue expanding and reached 130 million gallons, an increase of 8% relative to 2007. These exports represented $1 billion an increase of 6% compared to 2007. The fastest growing export market is Canada with an increase of 11% in volume between 2007 and 2008.
Source: Wine Institute; Department of Commerce; Gomberg, Fredrickson and Associates, 2010 Grapes and Prices in New York State
Relative to 2008, grape prices changes were up for the most important native varieties, down for most French-American hybrids (except for Cayuga White and Seyval Blanc), and lower for Vitis Vinifera (Table 10-9). Average listed prices for major native varieties such as Concord and Catawa increased by 4.3% and 9.5% between 2008 and 2009, respectively. In contrast, the average list price for Vitis Vinifera varieties dropped from $1,581 per ton in 2008 to $1,304 per ton in 2009, a reduction of about 17.5%. The average price for Vitis Vinifera varieties in 2009 is lower than the 2007-2009 average. Between 2008 and 2009 there were price increases for Cayuga White (3.7%) and Seyval Blanc (4.8%). On the other hand, substantial price declines were recorded for Baco Noir (3.1%), de Chaunac (11.3%) and Rougeon (6.4%).
Although in creal decline, concords are still the predominant variety grown and processed in New York (Table 10-10). There were 84,900 tons of Concords New York-grown grapes processed in 2009, down 33.1% from 2008 and substantially below the 2004-2008 average. Over the past five years, in average Concords comprised 73.8% of total tonnage utilized in the state. The second leading variety is Niagara followed by Catawba. About one fifth of the total tonnage of Concord and Niagara grapes is used for wine production. Vitis Vinifera, with an annual average of 5,904 tons utilized over the past five years, accounted for 3.7% of the NY crush over the last five years. However, Vitis Vinifera production has increased substantially in the past four years, from 3.5 thousand tons in 2005 to 7.9 thousand tons in 2009.
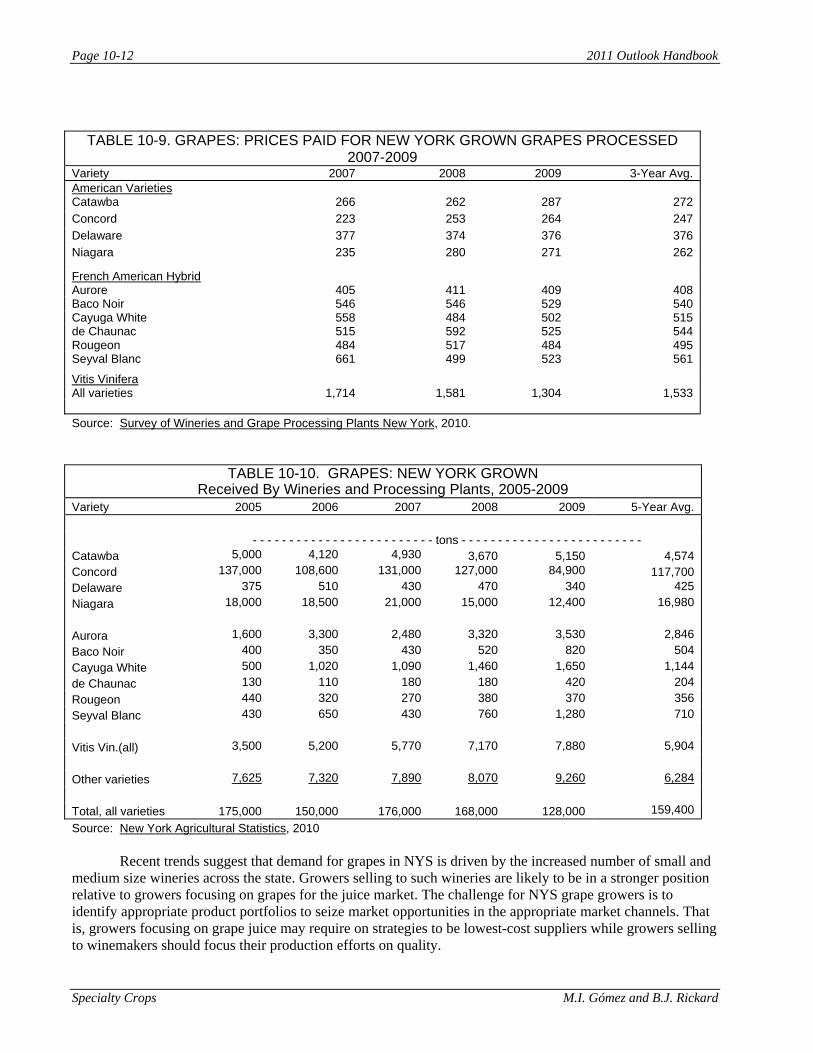
Page 10-12 2011 Outlook Handbook
Specialty Crops M.I. Gómez and B.J. Rickard
TABLE 10-9. GRAPES: PRICES PAID FOR NEW YORK GROWN GRAPES PROCESSED 2007-2009
Variety 2007 2008 2009 3-Year Avg. American Varieties Catawba 266 262 287 272 Concord 223 253 264 247 Delaware 377 374 376 376 Niagara 235 280 271 262
French American Hybrid Aurore 405 411 409 408 Baco Noir 546 546 529 540 Cayuga White 558 484 502 515 de Chaunac 515 592 525 544 Rougeon 484 517 484 495 Seyval Blanc 661 499 523 561
Vitis Vinifera All varieties 1,714 1,581 1,304 1,533 Source: Survey of Wineries and Grape Processing Plants New York, 2010.
TABLE 10-10. GRAPES: NEW YORK GROWNReceived By Wineries and Processing Plants, 2005-2009
Variety 2005 2006 2007 2008 2009 5-Year Avg. - - - - - - - - - - - - - - - - - - - - - - - - - tons - - - - - - - - - - - - - - - - - - - - - - - - - Catawba 5,000 4,120 4,930 3,670 5,150 4,574 Concord 137,000 108,600 131,000 127,000 84,900 117,700 Delaware 375 510 430 470 340 425 Niagara 18,000 18,500 21,000 15,000 12,400 16,980 Aurora 1,600 3,300 2,480 3,320 3,530 2,846 Baco Noir 400 350 430 520 820 504 Cayuga White 500 1,020 1,090 1,460 1,650 1,144 de Chaunac 130 110 180 180 420 204 Rougeon 440 320 270 380 370 356 Seyval Blanc 430 650 430 760 1,280 710 Vitis Vin.(all) 3,500 5,200 5,770 7,170 7,880 5,904 Other varieties 7,625 7,320 7,890 8,070 9,260 6,284 Total, all varieties 175,000 150,000 176,000 168,000 128,000 159,400 Source: New York Agricultural Statistics, 2010
Recent trends suggest that demand for grapes in NYS is driven by the increased number of small and
medium size wineries across the state. Growers selling to such wineries are likely to be in a stronger position relative to growers focusing on grapes for the juice market. The challenge for NYS grape growers is to identify appropriate product portfolios to seize market opportunities in the appropriate market channels. That is, growers focusing on grape juice may require on strategies to be lowest-cost suppliers while growers selling to winemakers should focus their production efforts on quality.

2011 Outlook Handbook Page 10-13
M.I. Gómez and B.J. Rickard Specialty Crops
Outlook
New York grapes are employed mostly in either wine of juice production, while a very small percentage is allocated to table grapes. According to USDA’s Economic Research Service, the quantity of grapes to be crushed for wine is likely to go down in 2010-2011, mostly driven by the smaller wine grape crop in California. This may drive up prices growers will receive for grapes sold to wineries this season. Production increases in such states as Washington New York, Pennsylvania, Texas and North Carolina will offset some of the decline in grape production experienced in California. At the same time, grower prices for all grapes utilized for wine production along with increased grape production for wine. Grower prices have increased consecutively in the past three years.
Considering the grape fruit market, New York, Michigan and Washington produce over 85% of grapes employed by the juice industry. The Economic Research Service forecasts suggest a drop in quantity of grapes crushed for juice. Smaller juice-grape crop in Washington and lower production in Michigan, less domestic grapes are anticipated to be available to juice processors in 2010-2011. Lower supplies for crushing are likely to increase the farm gate price during the period 2010-2011. Prices in 2009-2010 averaged $264 per ton, only slightly above the average price in the 2008-1009 marketing season although the domestic grape output for juice dropped by 9%. To some extent, this output decline was due to high grape demand from wineries in 2009-2010. Reduced imports in the past two years and declining juice-grape output are expected to drive down U.S. grape-juice inventories. Additional decreases in juice-grape output and rising farm gate prices for juice grapes in 2010-2011, could put additional downward pressure on domestic inventories in the U.S. grape juice industry.
Table grape production is forecasted to drop again during the 2010-2011marketing season. Along
with smaller output in states like Ohio and Michigan, about 4% of California’s table grapes come from the wine-grape crop which is forecasted smaller this season. ERS projects a reduction of about 1% in fresh-market grape production in 2010-2011, for a total of 1.86 billion pounds. If this is accurate, this amount of production would be above the average fresh-market output during the past five years by 2%, suggesting that there will be enough supplies of U.S. grapes this season to meet export and domestic demand for fresh-market grapes.
Table 10-11 shows forecasts for the period 2011- 2013 from the National Food and Agricultural Policy Project (NFAPP), prepared in 2010. According to NFAPP, total grape output will grow steadily driven primarily by increased acreage. The additional output is likely to be for wine and table grapes, as indicated by moderate increases in per capita consumption of these two items. The juice grape projections present a pretty stable outlook, perhaps due to the fact that the projections do not take into account the cycles that exist in the processing sector, as explained earlier.
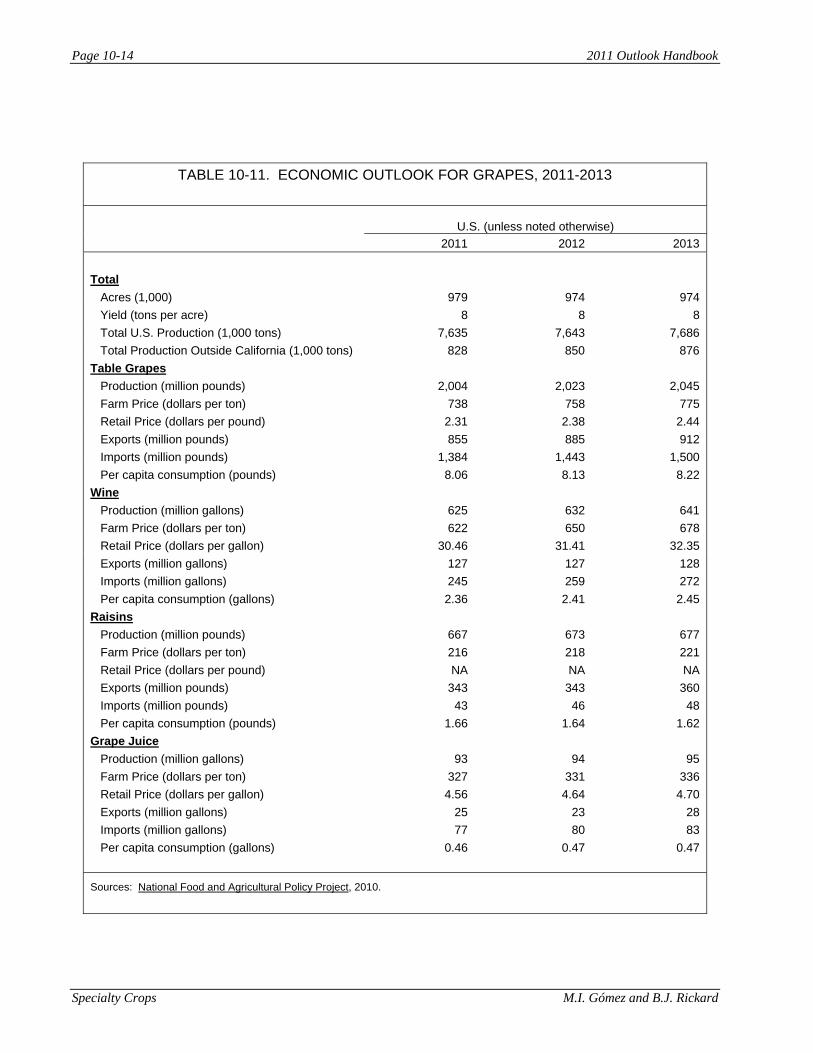
Page 10-14 2011 Outlook Handbook
Specialty Crops M.I. Gómez and B.J. Rickard
TABLE 10-11. ECONOMIC OUTLOOK FOR GRAPES, 2011-2013
U.S. (unless noted otherwise) 2011 2012 2013
Total Acres (1,000) 979 974 974 Yield (tons per acre) 8 8 8 Total U.S. Production (1,000 tons) 7,635 7,643 7,686 Total Production Outside California (1,000 tons) 828 850 876 Table Grapes Production (million pounds) 2,004 2,023 2,045 Farm Price (dollars per ton) 738 758 775 Retail Price (dollars per pound) 2.31 2.38 2.44 Exports (million pounds) 855 885 912 Imports (million pounds) 1,384 1,443 1,500 Per capita consumption (pounds) 8.06 8.13 8.22 Wine Production (million gallons) 625 632 641 Farm Price (dollars per ton) 622 650 678 Retail Price (dollars per gallon) 30.46 31.41 32.35 Exports (million gallons) 127 127 128 Imports (million gallons) 245 259 272 Per capita consumption (gallons) 2.36 2.41 2.45 Raisins Production (million pounds) 667 673 677 Farm Price (dollars per ton) 216 218 221 Retail Price (dollars per pound) NA NA NA Exports (million pounds) 343 343 360 Imports (million pounds) 43 46 48 Per capita consumption (pounds) 1.66 1.64 1.62 Grape Juice Production (million gallons) 93 94 95 Farm Price (dollars per ton) 327 331 336 Retail Price (dollars per gallon) 4.56 4.64 4.70 Exports (million gallons) 25 23 28 Imports (million gallons) 77 80 83 Per capita consumption (gallons) 0.46 0.47 0.47
Sources: National Food and Agricultural Policy Project, 2010.

2011 Outlook Handbook Page 10-15
M.I. Gómez and B.J. Rickard Specialty Crops
10.4 Ornamentals
The 2007 Agricultural Census shows a decrease in the number of nursery, greenhouse, floriculture, and sod farms in New York, while the value of sales increased. This indicates an increase in concentration in the ornamental sector. According to the Census, in 2007, there were 2,009 farms that reported growing nursery, greenhouse, floriculture, or sod crops in New York, down 21 percent from the 2002 level of 2,552 farms. In contrast, the value of sales increased by 13 percent between 2002 and 2007.
TABLE 10-12. GROWER CASH RECEIPTS OF FLORICULTURE AND NURSERY
CROPS, NEW YORK, 2004-2009
2004 2005 2006 2007 2008 2009 --- Million dollars --- Floriculturea, b
183.0 200.6 203.5 209.1 202.1 170.5 Nurseryc 172.4 181.3 205.5 NA NA NA Floriculture and nursery crops 355.4 381.9 409.0 NA NA NA a Includes growers with $10,000 or more in floriculture sales. b Includes ornamental plants without woody stems, grouped into bedding/garden plants, cut cultivated greens, cut
flowers, potted flowering plants, indoor foliage plants, and propagative floriculture material. c Includes ornamental plants and trees with woody stems, including broadleaf evergreens, coniferous evergreens,
deciduous shade trees, deciduous flowering trees, deciduous shrubs and other ornamentals, fruit and nut plants for home use, cut and to-be-cut Christmas trees, and propagation material or lining-out stock. Also includes other ornamental crops not classified as floriculture.
NA Not available
Source: Floriculture and Nursery Crops Situation and Outlook Yearbook, Economic Research Service, USDA, various years; Floriculture Crops 2009 Summary, National Agricultural Statistical Service
TABLE 10-13. GROWING AREA FOR FLORICULTURE CROPS IN NEW YORKa, 2005-2009
Year
Total greenhouse
cover
Shade and temporary
cover
Total covered
area Open
ground
Total covered &
open ground
-- 1,000 square feet -- --- acres --- 2005 24,743 573 25,320 800 1,382 2006 25,121 507 25,628 942 1,531 2007 25,619 705 26,324 1,068 1,673 2008 23,473 531 24,404 1,382 1,943 2009 23,042 405 23,447 2,589 2,127
a Includes operations with $10,000+ in annual floriculture sales. Crops include cut flowers, cut cultivated greens, potted flowering plants, potted foliage plants, bedding and garden plants, and propagative materials. Total may not add due to rounding.
Source: Floriculture Crops, NASS, USDA, various years.
In 2009, the commercial sales value of New York floriculture production totaled $170.5 million, a
15.6% decrease from the year before, ranking New York 7th in the nation (Table 10-12). Unfortunately, data on nurseries is not available after 2006, due to changes in data collection procedures at USDA’s National Agricultural Statistical Service, thus this situation analysis considers only floriculture. Table 10-15 indicates that bedding and garden plants are the number one component with total value of sales at $98.6 million in
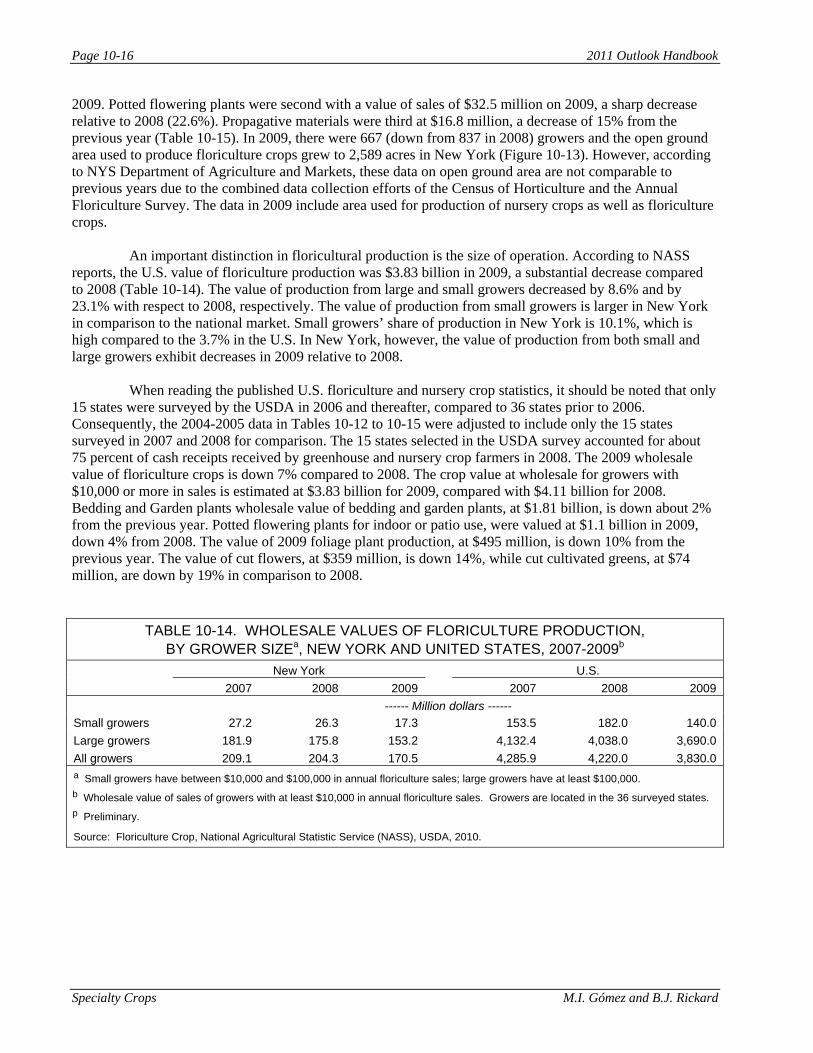
Page 10-16 2011 Outlook Handbook
Specialty Crops M.I. Gómez and B.J. Rickard
2009. Potted flowering plants were second with a value of sales of $32.5 million on 2009, a sharp decrease relative to 2008 (22.6%). Propagative materials were third at $16.8 million, a decrease of 15% from the previous year (Table 10-15). In 2009, there were 667 (down from 837 in 2008) growers and the open ground area used to produce floriculture crops grew to 2,589 acres in New York (Figure 10-13). However, according to NYS Department of Agriculture and Markets, these data on open ground area are not comparable to previous years due to the combined data collection efforts of the Census of Horticulture and the Annual Floriculture Survey. The data in 2009 include area used for production of nursery crops as well as floriculture crops.
An important distinction in floricultural production is the size of operation. According to NASS reports, the U.S. value of floriculture production was $3.83 billion in 2009, a substantial decrease compared to 2008 (Table 10-14). The value of production from large and small growers decreased by 8.6% and by 23.1% with respect to 2008, respectively. The value of production from small growers is larger in New York in comparison to the national market. Small growers’ share of production in New York is 10.1%, which is high compared to the 3.7% in the U.S. In New York, however, the value of production from both small and large growers exhibit decreases in 2009 relative to 2008.
When reading the published U.S. floriculture and nursery crop statistics, it should be noted that only
15 states were surveyed by the USDA in 2006 and thereafter, compared to 36 states prior to 2006. Consequently, the 2004-2005 data in Tables 10-12 to 10-15 were adjusted to include only the 15 states surveyed in 2007 and 2008 for comparison. The 15 states selected in the USDA survey accounted for about 75 percent of cash receipts received by greenhouse and nursery crop farmers in 2008. The 2009 wholesale value of floriculture crops is down 7% compared to 2008. The crop value at wholesale for growers with $10,000 or more in sales is estimated at $3.83 billion for 2009, compared with $4.11 billion for 2008. Bedding and Garden plants wholesale value of bedding and garden plants, at $1.81 billion, is down about 2% from the previous year. Potted flowering plants for indoor or patio use, were valued at $1.1 billion in 2009, down 4% from 2008. The value of 2009 foliage plant production, at $495 million, is down 10% from the previous year. The value of cut flowers, at $359 million, is down 14%, while cut cultivated greens, at $74 million, are down by 19% in comparison to 2008.
TABLE 10-14. WHOLESALE VALUES OF FLORICULTURE PRODUCTION, BY GROWER SIZEa, NEW YORK AND UNITED STATES, 2007-2009b
New York U.S. 2007 2008 2009 2007 2008 2009
------ Million dollars ------Small growers 27.2 26.3 17.3 153.5 182.0 140.0 Large growers 181.9 175.8 153.2 4,132.4 4,038.0 3,690.0 All growers 209.1 204.3 170.5 4,285.9 4,220.0 3,830.0 a Small growers have between $10,000 and $100,000 in annual floriculture sales; large growers have at least $100,000. b Wholesale value of sales of growers with at least $10,000 in annual floriculture sales. Growers are located in the 36 surveyed states. p Preliminary.
Source: Floriculture Crop, National Agricultural Statistic Service (NASS), USDA, 2010.
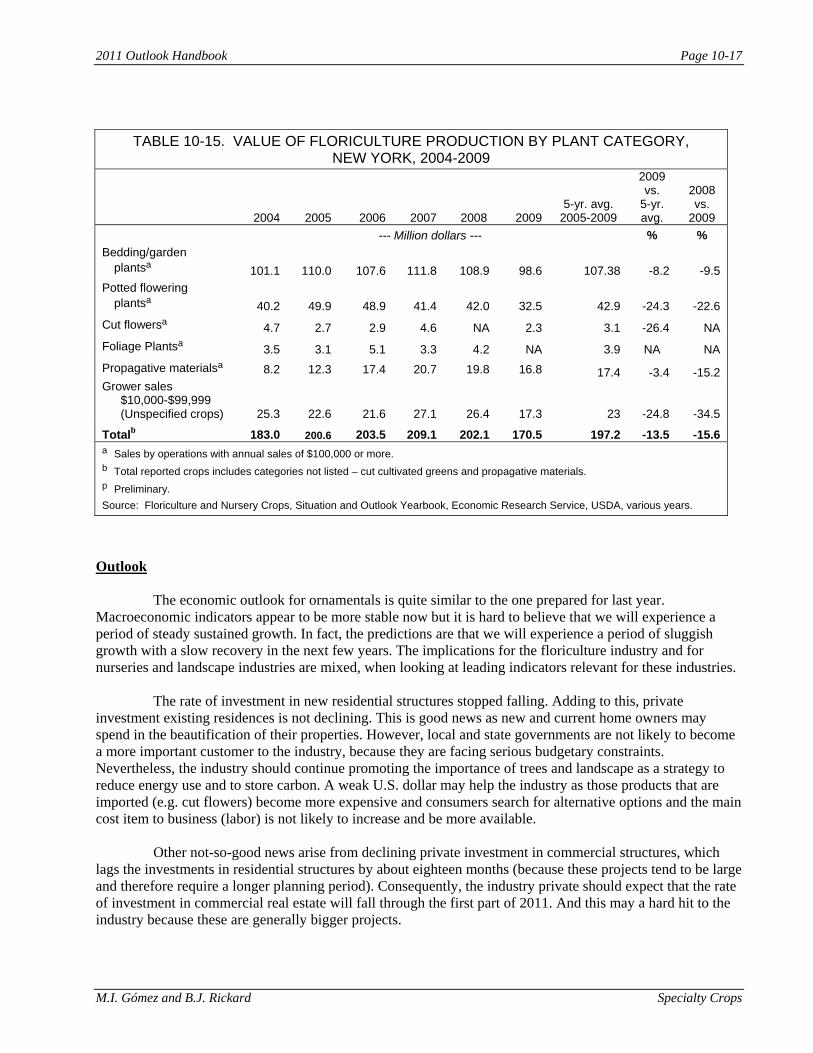
2011 Outlook Handbook Page 10-17
M.I. Gómez and B.J. Rickard Specialty Crops
TABLE 10-15. VALUE OF FLORICULTURE PRODUCTION BY PLANT CATEGORY, NEW YORK, 2004-2009
2004 2005 2006 2007 2008 2009 5-yr. avg.
2005-2009
2009 vs.
5-yr. avg.
2008 vs.
2009 --- Million dollars --- % % Bedding/garden
plantsa 101.1 110.0 107.6 111.8 108.9 98.6 107.38 -8.2 -9.5 Potted flowering
plantsa 40.2 49.9 48.9 41.4 42.0 32.5 42.9 -24.3 -22.6 Cut flowersa
4.7 2.7 2.9 4.6 NA 2.3 3.1 -26.4 NA Foliage Plantsa
3.5 3.1 5.1 3.3 4.2 NA 3.9 NA NA Propagative materialsa 8.2 12.3 17.4 20.7 19.8 16.8 17.4 -3.4 -15.2 Grower sales
$10,000-$99,999 (Unspecified crops) 25.3 22.6 21.6 27.1 26.4 17.3 23 -24.8 -34.5
Totalb 183.0 200.6 203.5 209.1 202.1 170.5 197.2 -13.5 -15.6 a Sales by operations with annual sales of $100,000 or more. b Total reported crops includes categories not listed – cut cultivated greens and propagative materials. p Preliminary. Source: Floriculture and Nursery Crops, Situation and Outlook Yearbook, Economic Research Service, USDA, various years.
Outlook
The economic outlook for ornamentals is quite similar to the one prepared for last year. Macroeconomic indicators appear to be more stable now but it is hard to believe that we will experience a period of steady sustained growth. In fact, the predictions are that we will experience a period of sluggish growth with a slow recovery in the next few years. The implications for the floriculture industry and for nurseries and landscape industries are mixed, when looking at leading indicators relevant for these industries.
The rate of investment in new residential structures stopped falling. Adding to this, private
investment existing residences is not declining. This is good news as new and current home owners may spend in the beautification of their properties. However, local and state governments are not likely to become a more important customer to the industry, because they are facing serious budgetary constraints. Nevertheless, the industry should continue promoting the importance of trees and landscape as a strategy to reduce energy use and to store carbon. A weak U.S. dollar may help the industry as those products that are imported (e.g. cut flowers) become more expensive and consumers search for alternative options and the main cost item to business (labor) is not likely to increase and be more available.
Other not-so-good news arise from declining private investment in commercial structures, which
lags the investments in residential structures by about eighteen months (because these projects tend to be large and therefore require a longer planning period). Consequently, the industry private should expect that the rate of investment in commercial real estate will fall through the first part of 2011. And this may a hard hit to the industry because these are generally bigger projects.
Page 10-18 2011 Outlook Handbook
Specialty Crops M.I. Gómez and B.J. Rickard
Floriculture, Landscape and Nursery managers should re-think the scope of their business: they are not in the business of selling plant and landscapes, but rather in the business of providing enjoyment to consumers and important environmental services, all at the same time. Such broader scope of the business can allow firms to seek and focus on emerging consumers and to solve two conundrums. How to strengthen retail operations; how to increase business with younger consumers that are likely to increase consumption in the near future; and how to promote their products and services to local, state and federal government agencies.
EB No Title Author(s)
OTHER A.E.M. EXTENSION BULLETINS
Fee(if applicable)
A Compilation of Smart Marketing Articles,January 2008-October 2010
Park, K. and T. M. Schmit2010-16
Economic Analysis of the Financial Impact of theGrape Leafroll Virus (GLRV) in the Finger LakesRegion of New York
Gomez, M., S. Atallah, T. Martinson, M.Fuchs, and G. White
2010-15
An Economic Examination of Alternative OrganicCropping Systems in New York State
Chan, S., Caldwell, B. and B. Rickard2010-14
Organic Agriculture in New York State Henehan, B. and J. Li2010-13
2010 Federal Reference Manual for RegionalSchools, Income Tax Management and Reportingfor Small Businesses and Farms
Bouchard G. and J. Bennett2010-12 ($25.00)
2010 New York State Reference Manual forRegional Schools, Income Tax Management andReporting for Small Businesses and Farms.
Bennett, J. and K. Bennett2010-11 ($25.00)
Dairy Farm Business Summary, Intensive GrazingFarms, New York, 2009
Conneman, G., Karszes, J., Grace, J.,Murray, P., Carlberg, V., Benson, A.,Staehr, A., Ames, M., Glazier, N.,Anderson, J. and L. Putnam
2010-10
Profiles of Successful Farm Transfers on LongIsland
Staehr, A.2010-09
Dairy Farm Business Summary, New York SmallHerd Farms, 80 Cows or Fewer, 2009
Knoblauch, W., Putnam, L., Kiraly, M.and J. Karszes
2010-08 ($16.00)
Dairy Farm Business Summary, Hudson andCentral New York Region, 2009
Knoblauch, W., Putnam, L., Karszes, J.,Buxton, S., Shoen, K., Hadcock, S.,Kiraly, M., Hulle, L., Smith, R, Skellie,K., Conneman, G. and R. Overton
2010-07 ($12.00)
Dairy Farm Business Summary, Northern NYRegion, 2009
Knoblauch, W., Putnam, L., Karszes, J.,Murray, P., Vokey, F., Prosper, J.,Deming, A., Balbian, D., Buxton, S.,Manning, J., Collins, B. and R. Overton
2010-06 ($12.00)
Paper copies are being replaced by electronic Portable Document Files (PDFs). To request PDFs of AEM publications, write to (be sure toinclude your e-mail address): Publications, Department of Applied Economics and Management, Warren Hall, Cornell University, Ithaca,NY 14853-7801. If a fee is indicated, please include a check or money order made payable to Cornell University for the amount of yourpurchase. Visit our Web site (http:/ /aem.cornell.edu/outreach/materials.htm) for a more complete list of recent bulletins.