Embed Size (px)
Citation preview
BASE PROSPECTUS SUPPLEMENT
New York Life Global Funding$7,000,000,000
GLOBAL DEBT ISSUANCE PROGRAM
This supplement (“Base Prospectus Supplement”) is supplemental to and must be read in conjunction with the Offering Memorandum dated November 29, 2005, as supplemented from time to time (the “Offering Memorandum”) prepared by New York Life Global Funding (the “Issuer”) under the Issuer's global medium-term note program for the issuance of senior secured medium-term notes (the "Notes").
Application has been made to the Irish Financial Services Authority as competent authority for the purposes of Directive 2003/71/EC (the “Prospectus Directive”) for this Supplement to be approved.
This document constitutes a Base Prospectus Supplement for the purposes of the Prospectus Directive. References herein to this document are to this Base Prospectus Supplement incorporating Annex 1 hereto.
On March 31, 2006 New York Life published its annual audited statutory statements (including any notes thereto, the “2005 and 2004 Statutory Financial Statements”) and on April 20, 2006 made available New York Life's Management Discussion and Analysis of Financial Condition and Results of Operations, Statutory Capitalization and Selected Historical Statutory Financial Information (collectively, the “Additional Financial Information”). The text of the 2005 and 2004 Statutory Financial Statements and the Additional Financial Information is set out in Annex 1 to this document. Copies of such 2005 and 2004 Statutory Financial Statements and the Additional Financial Information will be made available for inspection at the offices of the parties at whose offices documents are to be available for inspection as identified in “General Information” in the Offering Memorandum dated November 29, 2005.
Except as disclosed in this Base Prospectus Supplement, there has been no other significant new factor, material mistake or inaccuracy relating to the information included in the Offering Memorandum since the publication of the Offering Memorandum.
Each of the Issuer and New York Life accepts responsibility that, having taken all reasonable care to ensure that such is the case, the information contained in this Base Prospectus Supplement is, to the best of their knowledge, in accordance with the facts and does not omit anything likely to affect the import of such information.
Base Prospectus Supplement dated May 3, 2006

ANNEX 1

1
MANAGEMENT'S DISCUSSION AND ANALYSIS OF FINANCIAL CONDITION AND RESULTS OF OPERATIONS OF NEW YORK LIFE
Prospective investors should read the following discussion in conjunction with "Certain Financial and Accounting Matters", "Selected Historical Statutory Financial Information of New York Life" and the audited financial statements of New York Life and the notes thereto contained elsewhere in this Offering Memorandum.
Unless the context otherwise requires, (i) references to “New York Life” are to New York Life Insurance Company on a stand-alone, non consolidated basis and (ii) references to “The Company” are to New York Life Insurance Company, together with its domestic and international subsidiaries.
OVERVIEW
General
Based on data compiled by the National Underwriter Insurance Data Services and analyzed by New York Life, New York Life is one of the largest mutual life insurance companies in the United States in terms of both total assets, of which New York Life had $107,882 million at December 31, 2005, and total life insurance in-force, of which New York Life had $701,493 million at December 31, 2005. The wide range of insurance and investment products and services offered through New York Life and its subsidiaries includes life and health insurance, long term care, annuities (including lifetime income annuities), pension products, mutual funds and other investments, and investment advisory services. The Company owned or had under management $225,223 million in total assets at December 31, 2005.
The Company's four principal lines of business are Life and Annuity, Investment Management, Special Markets and International operations. Life and Annuity operations are conducted primarily through New York Life and its wholly-owned insurance subsidiaries, New York Life Insurance and Annuity Corporation ("NYLIAC") and NYLIFE Insurance Company of Arizona. Investment Management operations are conducted through New York Life and various registered investment advisory subsidiaries of its wholly-owned investment management subsidiary, New York Life Investment Management Holdings LLC ("NYLIM"). Special Markets is a niche business of New York Life that markets group life and health insurance to membership associations, long-term care insurance and is the exclusive provider of life insurance to the American Association of Retired Persons ("AARP"). New York Life markets insurance and investment products in Asia and Latin America through its wholly-owned subsidiary New York Life International, LLC and its affiliates. Operations in China are conducted through New York Life. NYLIFE LLC is a wholly owned subsidiary of New York Life, and is a holding company for certain subsidiaries of New York Life. NYLIFE LLC, through its subsidiaries, offers securities brokerage, financial planning and investment advisory services, trust services and capital financing.
For the year ended December 31, 2005, New York Life had total premiums and annuity considerations of
$9,273 million. Of this total, $5,871 million was attributable to Life and Annuity, $2,074 million to Investment Management and $1,328 million to Special Markets.
Basis of Financial Presentation
The discussion below for the years ended December 31, 2005 and 2004 is based on the 2005 and 2004 audited Statutory Financial Statements. Those financial statements have been prepared on the basis of Statutory Accounting Practices (“SAP”) prescribed or permitted by the New York State Insurance Department. Under SAP, results of subsidiaries are not consolidated with the results of New York Life on a line-by-line basis, but rather are generally recorded at their underlying net equity value as affiliated common stock investments, with the current year change in net equity value, less dividends paid and contributions from New York Life reflected in unrealized capital gains and losses through surplus. Dividends received from subsidiaries are included in New York Life's net investment income. During 2005 and 2004, New York Life received $20 million and $125 million, respectively, in dividends from its subsidiaries.
Financial statements prepared on the basis of SAP vary in certain significant respects from financial statements prepared on the basis of Generally Accepted Accounting Principles (“GAAP”). See "Selected Historical Statutory Financial Information of New York Life."

2
Income, Benefits and Expenses
New York Life derives its income principally from premiums on life contracts and net investment income from general account assets. New York Life’s benefits and expenses consist principally of insurance benefits provided to policyholders and beneficiaries; additions to reserves; and operating expenses, including marketing, administrative and distribution costs. In addition, New York Life has historically focused, and expects to continue to focus, on participating life insurance products, which typically pay annual policyholder dividends. As a result, a significant deduction from income is represented, and likely will continue to be represented, by policyholder dividends. New York Life reflected total policyholder dividends of $1,477 million, $1,413 million and $1,349 million for each of the years ended December 31, 2005, 2004 and 2003.
New York Life’s profitability depends primarily on the adequacy of its product pricing, which is a function of its ability to select underwriting risk, its mortality and persistency experience, its ability to generate earnings on the investments supporting its products and its ability to control expenses in accordance with its pricing assumptions.
Results of Operations – Year Ended December 31, 2005 Compared to Year Ended December 31, 2004
The following line item discussion of New York Life’s financial results is impacted in many instances by a reinsurance agreement New York Life entered into with NYLIAC in December 2004. Under the agreement, New York Life assumed 90% of the risks associated with an inforce block of Universal Life policies issued by NYLIAC prior to 2005. The treaty is on a funds withheld basis for general account policies and on a Modco basis for separate account policies. Although various line items are significantly impacted, the net effect on net gain is not material.
Net Income
Net income represents net gain after taxes plus net realized capital gains, after tax and transfers to the IMR. Net income of $1,198 million for the year ended December 31, 2005 was $214 million, or 21.7%, higher than the $984 million reported for 2004. The increase is primarily associated with the sale of a large real estate property in 2005, which produced an after-tax capital gain of $415 million. This was partly offset by lower realized capital gains on the disposition of equities of $72 million and a $66 million lower net gain from operations.
Net gain from operations of $719 million for the year ended December 31, 2005 was $66 million, or 8.4%, lower than the $785 million reported for 2004. The decrease is primarily due to non-recurring investment results in 2004 (primarily a $114 million dividend received from the sale of a subsidiary) and higher postretirement costs of $70 million which offset tax benefits associated with pension plan contributions in 2005. Excluding these items, 2005 net gain was above 2004 primarily due to continued profitability on in-force business. A detailed explanation of each of these items is discussed in the sections that follow.
Premium Income
Premiums are generated from sales of life and health insurance and annuities. Additionally, Guaranteed Interest Contracts (“GICs”) that include annuity purchase rate guarantees are counted as premium, since they expose the product to mortality risk. Premium income for the year ended December 31, 2005 was $9,273 million, $640 million, or 7.4% higher than the $8,633 million reported for the year ended December 31, 2004.
Premium income in 2005 was favorably impacted by two unusual items (1) $447 million of premium assumed from NYLIAC under a reinsurance treaty, and (2) a $240 million pension plan contribution by New York Life was made into the pension separate accounts and Immediate Participation Guarantee contracts ($47 million was made in 2004).
Positive premium growth was generated from New York Life’s life insurance operations. Premium income for the year ended December 31, 2005 for Individual Life (excluding the NYLIAC reinsurance agreement) was $4,791 million, an increase of $189 million over the prior year. Life insurance premium from Special Markets of $831 million was $108 million higher than the prior year. Premium income from LTC and other health products sold through Special Markets was $497 million in 2005, an increase of $32 million over the prior year.

3
Offsetting the positive premium results, are lower premiums in the Individual Annuity and Guaranteed Products lines. Premiums of spread-based annuity products of $2,462 million (excluding the pension plan contribution) declined $328 million compared with the prior year driven primarily by the continued pricing discipline of immediate annuities (including GICs with annuity purchase rate guarantees) and uneven structured settlement annuity sales in the face of a low interest rate environment.
At December 31, 2005, 57% of premium income was provided from the Individual Life segment, 22% was from the Investment Management segment, 14% was from Special Markets and Individual Annuity contributed the remaining 7%.
Net Investment Income Net investment income for the year ended December 31, 2005 was $4,834 million an increase of $270
million, or 5.9% higher than the $4,564 million reported for the prior year. 2004 results include the positive impact of a non-recurring $114 million dividend distribution associated with the sale of a subsidiary. Excluding this one-time item, net investment income increased by $384 million, or 8.6%, in 2005 primarily due to higher limited partnership distributions ($116 million) and income from growth in invested assets.
Adjustment for Funds Withheld
Adjustment for funds withheld for the year ended December 31, 2005 was $290 million, a decrease of $4,245 million from the $4,535 million reported for the prior year and represents funds withheld by NYLIAC under a reinsurance agreement. The amounts represent the assets NYLIAC is holding in relation to the reserves transferred to New York Life and is reflected in income to offset the increase in reserves on the policies assumed. The large variance results from the initial transfer of liabilities associated with the establishment of the agreement in 2004.
Benefit Payments
Benefit payments of $8,514 million for the year ended December 31, 2005 were $1,602 million, or 23.2% higher than the $6,912 million reported for 2004. The increase is primarily due to (1) an increase in scheduled withdrawals on GICs with annuity purchase rate guarantees ($748 million), (2) an increase in death and surrender benefits ($404 million) on benefits assumed under the NYLIAC reinsurance agreement, (3) normal aging of policyholders and inforce growth ($258 million), and (4) higher interest credited on deposit funds ($230 million).
Reserve Additions Reserve additions of $2,304 million for the year ended December 31, 2005 were $4,949 million, or 68.2%
lower than the $7,253 million reported for the year ended December 31, 2004. This decrease is primarily associated with the establishment of the reinsurance agreement with NYLIAC in 2004, whereby $4,507 million of inforce reserves were assumed by New York Life. The assets supporting these reserves are withheld by NYLIAC and reflected in “Adjustment for Funds Withheld” above.
Operating Expenses
New York Life’s operating expenses primarily include general insurance expenses, taxes, licenses, fees and commissions. For the year ended December 31, 2005, total operating expenses of $1,817 million reflected a $333 million, or 22.4%, increase from the $1,484 million reported for the year ended December 31, 2004. Excluding sales related expenses and expenses assumed from NYLIAC (under the reinsurance treaty), operating expenses increased $138 million. Higher postretirement costs of $70 million, due to reductions in the discount rate and expected return on plan assets, account for 50% of the non sales-related expense increase.
4
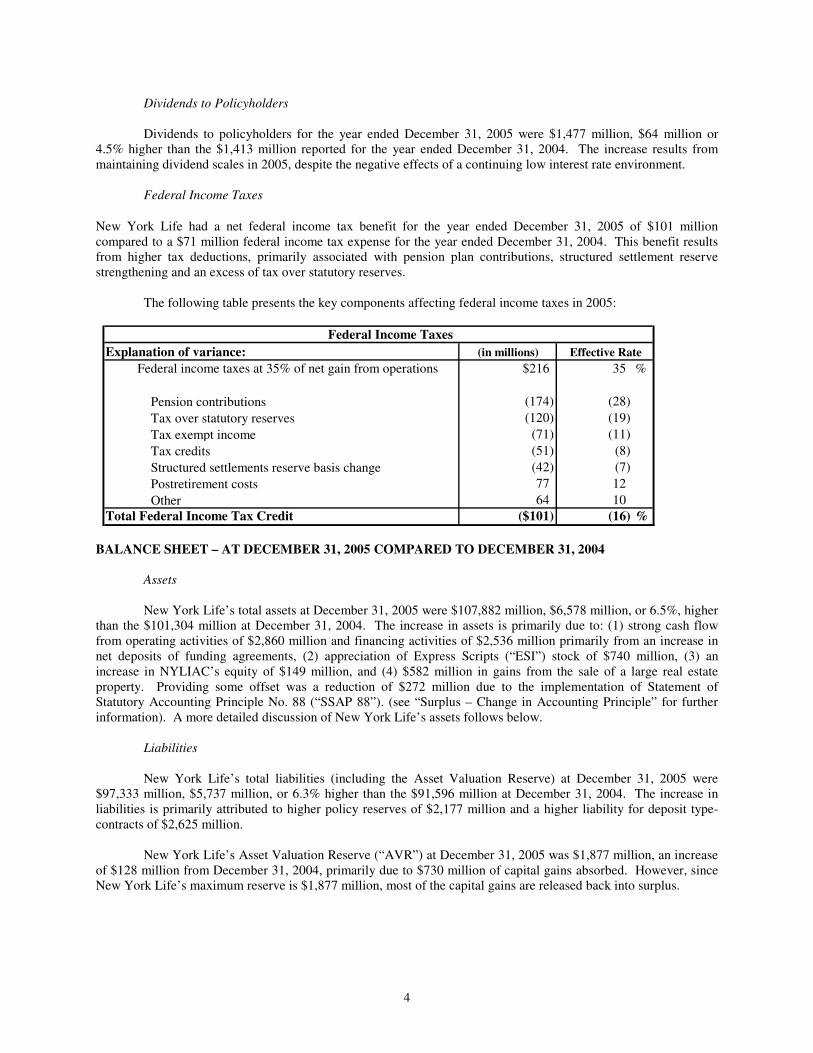
Dividends to Policyholders Dividends to policyholders for the year ended December 31, 2005 were $1,477 million, $64 million or
4.5% higher than the $1,413 million reported for the year ended December 31, 2004. The increase results from maintaining dividend scales in 2005, despite the negative effects of a continuing low interest rate environment.
Federal Income Taxes
New York Life had a net federal income tax benefit for the year ended December 31, 2005 of $101 million compared to a $71 million federal income tax expense for the year ended December 31, 2004. This benefit results from higher tax deductions, primarily associated with pension plan contributions, structured settlement reserve strengthening and an excess of tax over statutory reserves.
The following table presents the key components affecting federal income taxes in 2005:
Federal Income TaxesExplanation of variance: (in millions) Federal income taxes at 35% of net gain from operations $216 35 %
Pension contributions (174) (28) Tax over statutory reserves (120) (19) Tax exempt income (71) (11) Tax credits (51) (8) Structured settlements reserve basis change (42) (7) Postretirement costs 77 12 Other 64 10
Total Federal Income Tax Credit ($101) (16) %
Effective Rate
BALANCE SHEET – AT DECEMBER 31, 2005 COMPARED TO DECEMBER 31, 2004
Assets
New York Life’s total assets at December 31, 2005 were $107,882 million, $6,578 million, or 6.5%, higher than the $101,304 million at December 31, 2004. The increase in assets is primarily due to: (1) strong cash flow from operating activities of $2,860 million and financing activities of $2,536 million primarily from an increase in net deposits of funding agreements, (2) appreciation of Express Scripts (“ESI”) stock of $740 million, (3) an increase in NYLIAC’s equity of $149 million, and (4) $582 million in gains from the sale of a large real estate property. Providing some offset was a reduction of $272 million due to the implementation of Statement of Statutory Accounting Principle No. 88 (“SSAP 88”). (see “Surplus – Change in Accounting Principle” for further information). A more detailed discussion of New York Life’s assets follows below.
Liabilities New York Life’s total liabilities (including the Asset Valuation Reserve) at December 31, 2005 were $97,333 million, $5,737 million, or 6.3% higher than the $91,596 million at December 31, 2004. The increase in liabilities is primarily attributed to higher policy reserves of $2,177 million and a higher liability for deposit type-contracts of $2,625 million.
New York Life’s Asset Valuation Reserve (“AVR”) at December 31, 2005 was $1,877 million, an increase of $128 million from December 31, 2004, primarily due to $730 million of capital gains absorbed. However, since New York Life’s maximum reserve is $1,877 million, most of the capital gains are released back into surplus.

5
Surplus Statutory surplus was $10,549 million at December 31, 2005, an increase of $841 million, or 8.7% from the
$9,708 million at December 31, 2004. The main drivers of surplus are presented in the following table:
(In millions) 2005
Beginning surplus 9,708$ Net income 1,198 Unrealized gains* 491 Change in accounting principle (272) Change in non-admitted assets** (196) Change in asset valuation reserve (128) Change in valuation bases (126) Retirement of surplus note (124) Change in deferred taxes 9 Other (11)
Ending surplus 10,549 Asset Valuation Reserve 1,877 Surplus and Asset Valuation Reserve *** $12,426
* Excludes deferred tax expense on unrealized gains/(losses) of $(101) million reclassified to “Change in deferred taxes”. ** Excludes the decrease in non-admitted deferred taxes of $264 million reclassified to “Change in deferred taxes”. *** Consolidated Statutory Surplus and Asset Valuation Reserve ("AVR "), which includes the AVR of the Company's wholly owned domestic
insurance subsidiaries (New York Life Insurance and Annuity Corporation and NYLIFE Insurance Company of Arizona), totaled $12,853 million at December 31, 2005.
Positive impacts to surplus primarily include net income of $1,198 million (see “Net Income” for a detailed
discussion) and net unrealized gains of $491 million primarily due to appreciation of Express Scripts Inc. (“ESI”) stock of $239 million (net of the forward contract liability described in “Equity Securities”), an increase in NYLIAC’s equity of $149 million and appreciation on unaffiliated equity investments of $113 million.
The following items partly offset the increases in surplus noted above: Change in Accounting Principle. Effective January 1, 2005, the NAIC issued SSAP 88- “Investment in Subsidiaries Controlled and Affiliated (SCA) Entities”, that provides new statutory accounting guidance for the valuation of; (1) foreign insurance subsidiaries, (2) certain non-insurance subsidiaries (domestic and foreign), and (3) limited partnerships where New York Life has a controlling interest. The impact on beginning statutory surplus resulting from implementation of the accounting guidance decreased surplus by $57 million. SSAP 88 also changed the accounting for goodwill on foreign insurance companies and non-insurance companies. However, New York State requires that goodwill held by a subsidiary (insurance and non-insurance) be excluded from the statutory valuation carried by an insurance company. As a result, New York Life non-admitted the remaining goodwill and intangible assets inherent in its statutory valuation of its subsidiaries, which reduced surplus by an additional $215 million.
Change in Non-Admitted Assets. Certain assets are non-admitted under statutory accounting, which reduces statutory capital. Generally these are assets having economic value but cannot be readily used to pay policyholder obligations. An increase in non-admitted assets reduced surplus by $196 million primarily due to an increase in the overfunded pension asset and capitalized furniture and equipment.
Change in Asset Valuation Reserve. The AVR is an investment reserve established to provide for default risk on fixed income assets and market value fluctuation on equity-type investments. In 2005, the AVR increased by $128 million due to the absorption of capital gains, primarily market appreciation on equity investments.

6
Change in Valuation Bases. Changes in reserve valuation bases lowered surplus by $126 million and was primarily associated with reserve strengthening on Structured Settlements due to the lowering of valuation interest rates on 2004 issues.
Surplus Note Retirement. In February 2005, New York Life retired its 30 year, 7.5% surplus note in the amount of $124 million. The note was originally issued in 1993. Change in Deferred Taxes. Change in deferred taxes of $9 million represents the net positive impact on surplus in 2005. The following table details the components of the change in deferred taxes. (In millions) 2005
Deferred taxes on operating results (154)$ Deferred taxes on net unrealized gains/(losses) (101) Decrease in deferred taxes non-admitted 264
Total change in deferred taxes 9$ Liquidity and Capital Resources
Liquidity Sources and Requirements Liquidity Sources. New York Life’s principal cash inflows from its insurance activities come from life insurance premiums, annuity considerations, GICs and deposit funds.
New York Life’s principal cash inflows from investment activities result from proceeds on repayments of principal and from maturities of invested assets and investment income.
Additional sources of liquidity to meet unexpected cash outflows are available from New York Life’s portfolio of liquid assets. These liquid assets include cash equivalents, short-term investments, U.S. Treasury and Agency securities, marketable fixed-income securities, publicly traded common stocks as well as investments in the New York Life Short Term Investment Fund, LP an affiliate (see “Limited Partnerships including Limited Liability Companies and other Long-Term Investments” section). New York Life’s available portfolio of liquid assets was approximately $53,552 million and $49,128 million at December 31, 2005 and 2004, respectively. The primary liquidity concern with respect to these assets is the potential illiquidity of certain invested assets due to unfavorable market conditions. New York Life closely monitors and manages these risks.
New York Life’s insurance subsidiaries are subject to certain insurance department regulatory restrictions as to the payment of dividends to New York Life. In general, a dividend may be paid without prior approval from the domiciliary state insurance department provided that the subsidiary’s statutory earned surplus is positive. Additionally, dividends paid in any twelve month period cannot exceed the greater of (1) 10% of the subsidiary's surplus, or (2) the subsidiary's net gain from operations, both based on the preceding December 31st statutory financial statements. These restrictions pose no short-term or long-term liquidity concerns for New York Life as it does not rely on subsidiary dividends as a primary source of liquidity.
Sources of liquidity also include a facility for short-term borrowing arranged through New York Life’s subsidiary New York Life Capital Corp. (“NYLCC”). (See “Financing” below for a comprehensive discussion.)
Liquidity Uses. New York Life’s principal cash outflows primarily relate to the payment of liabilities
associated with its various life insurance, annuity and group pension products, GICs and funding agreements, operating expenses and income taxes. Liabilities arising from its insurance activities primarily relate to benefit payments, policy surrenders, withdrawals associated with GICs and funding agreements, loans and dividends.
A primary liquidity concern with respect to life insurance and annuity products is the risk of early policyholder and contractholder withdrawals. New York Life includes provisions in certain of its contracts that are designed to limit withdrawals from general account institutional pension products (group annuities, GICs and certain deposit fund liabilities) sold to employee benefit plan sponsors. New York Life closely monitors its liquidity
7
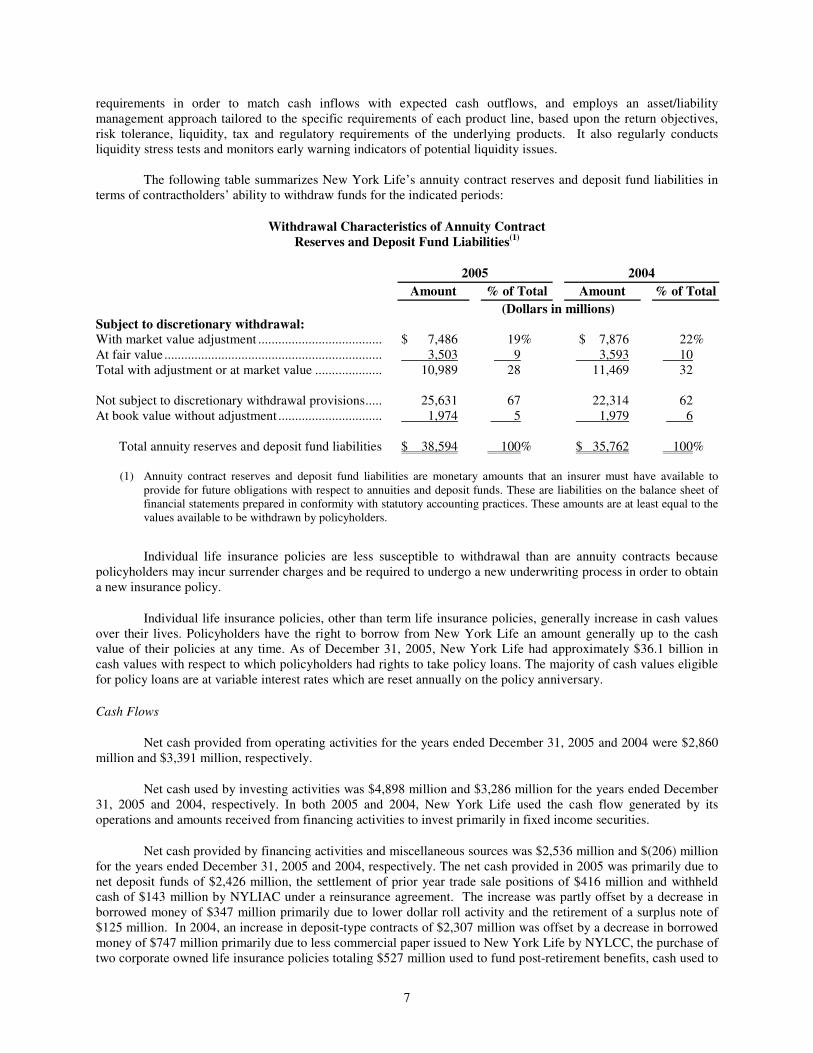
requirements in order to match cash inflows with expected cash outflows, and employs an asset/liability management approach tailored to the specific requirements of each product line, based upon the return objectives, risk tolerance, liquidity, tax and regulatory requirements of the underlying products. It also regularly conducts liquidity stress tests and monitors early warning indicators of potential liquidity issues.
The following table summarizes New York Life’s annuity contract reserves and deposit fund liabilities in
terms of contractholders’ ability to withdraw funds for the indicated periods:
Withdrawal Characteristics of Annuity Contract Reserves and Deposit Fund Liabilities(1)
2005 2004 Amount % of Total Amount % of Total (Dollars in millions) Subject to discretionary withdrawal: With market value adjustment ..................................... $ 7,486 19% $ 7,876 22% At fair value ................................................................. 3,503 9 3,593 10 Total with adjustment or at market value .................... 10,989 28 11,469 32 Not subject to discretionary withdrawal provisions..... 25,631 67 22,314 62 At book value without adjustment ............................... 1,974 5 1,979 6 Total annuity reserves and deposit fund liabilities $ 38,594 100% $ 35,762 100%
(1) Annuity contract reserves and deposit fund liabilities are monetary amounts that an insurer must have available to provide for future obligations with respect to annuities and deposit funds. These are liabilities on the balance sheet of financial statements prepared in conformity with statutory accounting practices. These amounts are at least equal to the values available to be withdrawn by policyholders.
Individual life insurance policies are less susceptible to withdrawal than are annuity contracts because policyholders may incur surrender charges and be required to undergo a new underwriting process in order to obtain a new insurance policy.
Individual life insurance policies, other than term life insurance policies, generally increase in cash values over their lives. Policyholders have the right to borrow from New York Life an amount generally up to the cash value of their policies at any time. As of December 31, 2005, New York Life had approximately $36.1 billion in cash values with respect to which policyholders had rights to take policy loans. The majority of cash values eligible for policy loans are at variable interest rates which are reset annually on the policy anniversary.
Cash Flows Net cash provided from operating activities for the years ended December 31, 2005 and 2004 were $2,860 million and $3,391 million, respectively.
Net cash used by investing activities was $4,898 million and $3,286 million for the years ended December 31, 2005 and 2004, respectively. In both 2005 and 2004, New York Life used the cash flow generated by its operations and amounts received from financing activities to invest primarily in fixed income securities.
Net cash provided by financing activities and miscellaneous sources was $2,536 million and $(206) million for the years ended December 31, 2005 and 2004, respectively. The net cash provided in 2005 was primarily due to net deposit funds of $2,426 million, the settlement of prior year trade sale positions of $416 million and withheld cash of $143 million by NYLIAC under a reinsurance agreement. The increase was partly offset by a decrease in borrowed money of $347 million primarily due to lower dollar roll activity and the retirement of a surplus note of $125 million. In 2004, an increase in deposit-type contracts of $2,307 million was offset by a decrease in borrowed money of $747 million primarily due to less commercial paper issued to New York Life by NYLCC, the purchase of two corporate owned life insurance policies totaling $527 million used to fund post-retirement benefits, cash used to

8
settle security lending transactions of $492 million, and an increase in outstanding receivables of $465 million related to unsettled trade positions.
New York Life is committed to maintaining surplus levels for its insurance and non-insurance subsidiaries to fund growth opportunities, support new products, reduce surplus strain or maintain targeted RBC levels, among other reasons. New York Life believes it is unlikely that any required contributions to subsidiaries would have a material effect on either short-term or long-term liquidity.
Liquidity Risks. Liquidity risk is the risk that New York Life will not have access to sufficient funds to meet its liabilities when due. New York Life’s liquidity management consists of policies and procedures designed to ensure that liquidity is available at all times. The liquidity position is assessed and managed under various scenarios, encompassing both normal market conditions and stressed conditions. Any theoretical liquidity gap under these stress scenarios is assessed to confirm New York Life’s ability to bridge the gap.
New York Life believes it has sufficient liquidity and financial strength to provide for its foreseeable capital requirements, including any unanticipated cash outflows.
Financing
NYLCC serves as a conduit for New York Life to the credit markets by issuing commercial paper. Although authorized to issue up to $3 billion, NYLCC had approximately $500 million outstanding at December 31, 2005 and December 31, 2004, which is sufficient to maintain a credible presence in the market. The proceeds are loaned to New York Life and invested in the Short Term Investment Fund, LP. The proceeds may also be loaned to NYLIAC for short-term liquidity needs.
New York Life and NYLCC are party to a committed 5 year credit agreement, expiring July 27, 2010, with a consortium of banks. The banks’ commitments under this facility total $1.5 billion. The facility serves as back up for NYLCC’s commercial paper program and for general corporate purposes. The credit facility has never been utilized. Surplus Notes. New York Life issues Surplus Notes as a source of financing. On May 5, 2003, New York Life issued Surplus Notes (“Notes”) with a principal balance of $1 billion, bearing interest at 5.875%, and a maturity date of May 15, 2033. Proceeds from the issuance of the Notes were $990 million, net of discount. The Notes were issued pursuant to Rule 144A under the Securities Act of 1933, as amended, and are administered by CitiBank as registrar/paying agent. Interest on the 5.875% Note is scheduled to be paid semiannually on May 15 and November 15 of each year with the approval of the Superintendent of Insurance of the State of New York. At December 31, 2004, New York Life also had a $125 million, 7.5% note outstanding from a prior issuance in 1993, which was called under the terms of the Purchase Agreement and related Offering Circular in February 2005 after obtaining the approval of the Superintendent of Insurance of the State of New York. Commitments and Contingencies.
New York Life, in the ordinary course of its business, has numerous agreements with respect to its
affiliates, related parties and other third parties. In connection with such agreements, there may be related commitments or contingent liabilities which may take the form of guarantees.
New York Life, as lessee, enters into various operating lease agreements primarily associated with real property (including leases of office spaces) and data processing and other equipment. The approximate future minimum rental payments required under these operating leases is $533 million.
New York Life has a revolving loan agreement with Madison Capital Funding (“MCF”) dated April 16, 2001, as amended, to provide funding to MCF in an amount up to $1,800 million. The amount loaned cannot exceed 3% of New York Life’s admitted assets of December 31 of the prior year. At December 31, 2005, New York Life had outstanding loans receivable from MCF of $1,163 million.

9
At December 31, 2005 contractual commitments to extend credit under commercial and residential mortgage loan agreements totaled $373 million. These commitments are diversified by property type and geographic location. At December 31, 2005, New York Life had outstanding contractual obligations to acquire additional private placement securities amounting to $166 million. Unfunded commitments on limited partnerships and limited liability companies, excluding MCF amounted to $1,918 million at December 31, 2005. In connection with structured settlement agreements issued to its subsidiary, NYLIAC, New York Life has guaranteed the payments due to unaffiliated third parties in the event of NYLIAC’s insolvency. New York Life’s estimated maximum exposure under such agreements is approximately $4,609 million at December 31, 2005. New York Life believes the likelihood that payments will be required under these agreements is remote. On August 22, 2001, NYLIFE LLC entered into a ten-year Shared Appreciation Income Linked Securities ("SAILS") transaction with Credit Suisse First Boston International (“CSFBI”). The transaction allows NYLIFE LLC to protect its downside risk on 9 million shares of ESI while maintaining the ability to share in a portion of its future appreciation during a ten-year period. Under the terms of the transaction, NYLIFE LLC is liable to deliver up to 9 million ESI shares or settle in cash with a value determined based on the average market price of the ESI shares during the 20 trading days beginning 30 exchange business days immediately prior to the August 22, 2011 delivery date. According to the terms of the agreement, NYLIFE LLC receives a minimum value of $27.03 per share and 100% of the appreciation in the shares up to $35.14 per share. CSFBI will receive approximately 77% of the appreciation of ESI stock in excess of $35.14 per share. New York Life has guaranteed the obligations of NYLIFE LLC under the agreement with CSFBI. The price per share and number of shares in the foregoing paragraph have been adjusted for a two for one stock split effective June 24, 2005. New York Life believes that the likelihood of non-performance is remote since NYLIFE LLC owns the underlying ESI shares.
Information About Market Risk
New York Life has exposure to market risk arising from its insurance operations and investment activities. For purposes of this discussion, market risk is defined as the risk of potential fluctuations in earnings, cash flows and fair value of its assets and liabilities due to changes in the level of market rates and prices. New York Life has established comprehensive policies and procedures at both the corporate and business level to minimize the effects of potential market volatility. New York Life’s primary market risk exposures are to changes in interest rates and equity prices.
Interest Rate Risk New York Life’s exposure to interest rate changes results from its significant holdings of fixed rate
investments, as well as its commitment to fund interest-sensitive insurance liabilities. New York Life manages interest rate risk as part of its asset/liability management process and product design procedures. Asset/liability strategies include the segmentation of investments by product line and the construction of investment portfolios designed to specifically satisfy the projected cash needs of the underlying product liability. New York Life manages the interest rate risk inherent in its assets relative to the interest rate risk inherent in its insurance and annuity products.
Equity Risk
New York Life’s exposure to changes in equity prices primarily results from its holdings of public and
private equity securities and limited partnership investments. New York Life manages this risk on an integrated basis with other risks through its asset/liability management strategies. New York Life also has exposure to equity price risk on the separate account assets and other managed assets from which it derives asset fee revenues and on equities held in separate accounts in connection with its employee pension plans and agent retirement plans. For its separate accounts, New York Life manages equity price risk through industry and issue diversification and asset allocation techniques.
Foreign Exchange Risk New York Life is exposed to foreign currency exchange rate risk through its international operations. New
York Life generally matches the currency of its assets with the currency of the related liabilities. New York Life

10
uses cross-currency interest rate swaps to hedge exposure to foreign currency risk from its net investments in international operations when it makes economic sense to do so. Also, in conjunction with New York Life's Medium Term Note (“MTN”) program, New York Life Funding issues liabilities denominated in foreign currency. New York Life has entered into currency swap agreements to hedge the exchange risk inherent in the MTNs.
New York Life's Investment Portfolio
New York Life’s general account investment portfolio totaled $91,860 million at December 31, 2005, an
increase of $5,913 million, or 6.9%, over the $85,947 million reported at December 31, 2004. Invested assets are managed to support the liabilities of New York Life’s lines of business. In all sectors of the portfolio, quality and diversification have long been the primary security selection criteria. New York Life emphasizes asset/liability management and liquidity management across all product lines.
Changes in interest rates can have significant effects on New York Life’s profitability. Under certain
circumstances of interest rate volatility, New York Life is exposed to disintermediation risk and reduction in net interest spread or profit margins. The fair value of New York Life’s invested assets fluctuates depending on market and other general economic conditions and the interest rate environment. In addition, mortgage prepayments, life insurance and annuity surrenders and bond calls are affected by interest rate fluctuations. Although management of New York Life employs a number of asset/liability management strategies to minimize the effects of interest rate volatility, no assurance can be given that New York Life will continue to be successful in managing the effects of such volatility and that such volatility will not have a material adverse impact on New York Life’s business, financial condition and results of operations.
Over the course of 2005, the U.S. Treasury yield curve flattened dramatically as a series of Federal Reserve increases drove up short term rates, but had little impact on the longer end of the curve. The continuing low level of Treasury rates, especially for longer term maturities, and the generally tight credit spreads on corporate bonds combine to depress the investment earnings associated with new money and reinvested assets. With short-term rates close to long-term rates, bank products such as CDs are offering interest rates that are competitive with our longer-duration fixed annuity products and may affect future sales.

11
General Account Investments
December 31, 2005 2004
Carrying
Value % of Total
Carrying Value
% of Total
(Dollars in millions)
Cash & Cash Equivalents(1).......................................... $ 3,088 3.4% $2,590 3.0% Bonds(2)
Public .................................................................... 44,894 48.9% 42,332 49.2% Private................................................................... 16,339 17.8% 13,636 15.9% Subtotal ................................................................. 61,233 66.7% 55,968 65.1%
Mortgage loans(3) ......................................................... 7,735 8.4% 7,709 9.0% Real Estate
Equity.................................................................... 164 0.2% 202 0.2% Foreclosures.......................................................... 46 -% 13 -%
Company Occupied............................................... 280 0.3% 247 0.3% Subtotal ................................................................. 490 0.5% 462 0.5%
Stocks Affiliates ............................................................... 4,590 5.0% 3,760 4.4% Non-affiliates ........................................................ 3,443 3.7% 3,248 3.8% Subtotal ................................................................. 8,033 8.7% 7,008 8.2%
Policy loans.................................................................. 5,957 6.5% 5,794 6.7% Limited Partnership and Other Long-term investments 5,324 5.8% 6,416 7.5%
Total investments.................................................. $ 91,860 100.0% $ 85,947 100.0%
_______________ (1) Includes short-term investments of $1,150 million and $797 million as of December 31, 2005 and 2004,
respectively.
(2) As of December 31, 2005 and 2004, respectively, the estimated fair value of New York Life's bonds was $63,987 million and $60,044 million.
(3) Includes residential mortgage loans of $214 million and $212 million as of December 31, 2005 and 2004, respectively.
The yield on general account cash and invested assets, excluding net realized investment gains and losses, was 5.7% and 5.6% for the years ended December 31, 2005 and 2004, respectively.
Bonds
Long-term bonds totaled $61,233 million and $55,968 million at December 31, 2005 and 2004, respectively, and increased $5,265 million, or 9.4% from the prior year. The increase largely resulted from cash flow generated by operating activities and an increase in deposit-type contracts. Bonds represent 66.7% and 65.1% of total cash and invested assets at December 31, 2005 and 2004, respectively, and consist of publicly traded and private placement debt securities. At December 31, 2005 and 2004, publicly traded bonds comprised 73.3% and 75.6%, respectively, of the total bond portfolio.
Most of the public and private placement bonds held by New York Life are evaluated by the NAIC's Securities Valuation Office, or SVO. The SVO evaluates the investments of insurers for regulatory reporting purposes and assigns securities to one of six investment categories called "NAIC Designations." The NAIC Designations closely mirror the ratings of marketable bonds used by the nationally recognized securities rating organizations. NAIC Designations 1 and 2 include bonds considered investment grade (e.g., rated BBB– or higher by S&P) by the nationally recognized securities ratings organizations. Designations 3 through 6 are referred to as below investment grade (e.g., rated BB+ or lower by S&P).

12
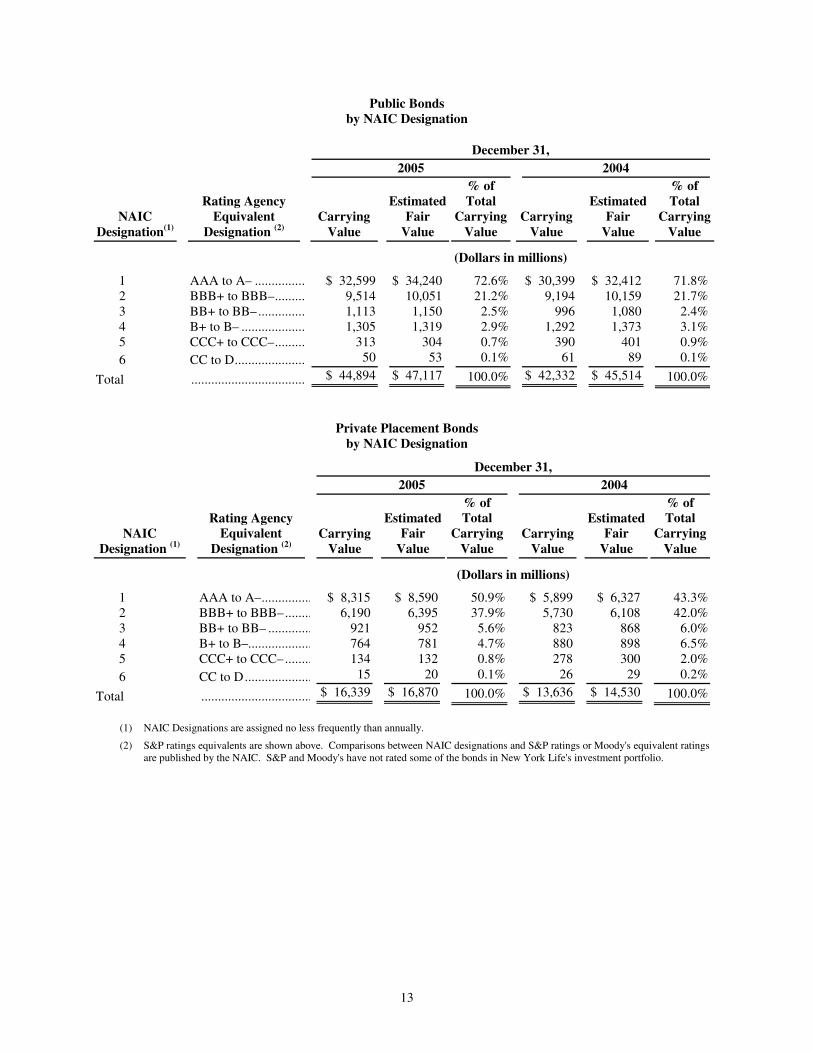
It is New York Life's objective to maintain a high quality, well-diversified, bond portfolio. The bond portfolio consists primarily of high-grade corporate bonds, asset-backed and mortgage-backed securities and U.S. Treasuries and Agency obligations. An analysis of the credit quality, as determined by NAIC Designation, of the total bond portfolio and, separately, the public and private placement bond portfolios, at December 31, 2005 and 2004, is set forth in the following tables.
Total Bonds – Public and Private Placement by NAIC Designation
December 31, 2005 2004
NAIC Designation (1)
Rating Agency Equivalent
Designation(2) Carrying
Value Estimated Fair Value
% of Total Carrying
Value Carrying
Value Estimated Fair Value
% of Total Carrying
Value
(Dollars in millions)
1 AAA to A– ................... $40,914 $ 42,830 66.8% $ 36,298 $ 38,739 64.8%
2 BBB+ to BBB–............. 15,704 16,446 25.7% 14,924 16,267 26.7%
Investment Grade 56,618 59,276 92.5% 51,222 55,006 91.5%
3 BB+ to BB–.................. 2,035 2,101 3.3% 1,819 1,948 3.2%
4 B+ to B– ....................... 2,069 2,101 3.4% 2,172 2,271 3.9%
5 CCC+ to CCC–............. 447 436 0.7% 668 701 1.2%
6 CC to D......................... 64 73 0.1% 87 118 0.2%
Below Investment Grade 4,615 4,711 7.5% 4,746 5,038 8.5% Total $61,233 $63,987 100.0% $55,968 $60,044 100.0%
New York Life has investment grade bonds of $56,618 million and $51,222 million that represent 92.5% and 91.5% of total bond holdings at December 31, 2005 and 2004, respectively. Below investment grade bonds of $4,615 million and $4,746 million represent approximately 7.5% and 8.5% of total bond holdings at December 31, 2005 and 2004, respectively. Below investment grade bonds are comprised of investments in medium and lower grade obligations that are part of New York Life’s high yield investment objective to enhance overall portfolio yield and income. Additionally, investments that have been downgraded (i.e., fallen angels) from investment grade are included in this category. New York Life applies the same prudent principles in managing its high yield portfolio, emphasizing diversification standards (such as limits on issuer, industry and geographic locations to minimize concentration risks), credit quality and liquidity. New York Life manages its aggregate risk exposure to investment risks against an approved risk budget and other internal limits and guidelines.
13
Public Bonds by NAIC Designation
December 31, 2005 2004
NAIC Designation(1)
Rating Agency Equivalent
Designation (2) Carrying
Value
Estimated Fair
Value
% of Total
Carrying Value
Carrying Value
Estimated Fair
Value
% of Total
Carrying Value
(Dollars in millions)
1 AAA to A– ............... $ 32,599 $ 34,240 72.6% $ 30,399 $ 32,412 71.8% 2 BBB+ to BBB–......... 9,514 10,051 21.2% 9,194 10,159 21.7% 3 BB+ to BB–.............. 1,113 1,150 2.5% 996 1,080 2.4% 4 B+ to B– ................... 1,305 1,319 2.9% 1,292 1,373 3.1% 5 CCC+ to CCC–......... 313 304 0.7% 390 401 0.9% 6 CC to D..................... 50 53 0.1% 61 89 0.1%
Total .................................. $ 44,894 $ 47,117 100.0% $ 42,332 $ 45,514 100.0%
Private Placement Bonds by NAIC Designation
December 31, 2005 2004
NAIC Designation (1)
Rating Agency Equivalent
Designation (2) Carrying
Value
Estimated Fair
Value
% of Total
Carrying Value
Carrying Value
Estimated Fair
Value
% of Total
Carrying Value
(Dollars in millions)
1 AAA to A–................ $ 8,315 $ 8,590 50.9% $ 5,899 $ 6,327 43.3% 2 BBB+ to BBB–......... 6,190 6,395 37.9% 5,730 6,108 42.0% 3 BB+ to BB– .............. 921 952 5.6% 823 868 6.0% 4 B+ to B–.................... 764 781 4.7% 880 898 6.5% 5 CCC+ to CCC–......... 134 132 0.8% 278 300 2.0% 6 CC to D..................... 15 20 0.1% 26 29 0.2%
Total .................................. $ 16,339 $ 16,870 100.0% $ 13,636 $ 14,530 100.0%
(1) NAIC Designations are assigned no less frequently than annually.
(2) S&P ratings equivalents are shown above. Comparisons between NAIC designations and S&P ratings or Moody's equivalent ratings are published by the NAIC. S&P and Moody's have not rated some of the bonds in New York Life's investment portfolio.

14
The following table presents the estimated fair value of New York Life's total bond portfolio classified as performing, problem and potential problem bonds at December 31, 2005 and 2004. Problem securities are defined as securities for which other than temporary impairment write-downs have been taken. Potential problem securities are defined as securities for which fair value is below carrying value by more than 20% as of the balance sheet date, but which continue to meet all their contractual obligations.
Performing, Problem and Potential Problem Bonds
December 31, 2005 2004
Carrying
Value
Estimated Fair
Value
% of Total
Carrying Value
Carrying Value
Estimated Fair
Value
% of Total
Carrying Value
(Dollars in millions)
Performing.......................................... $ 61,001 $63,751 99.6% $ 55,803 $59,835 99.7% Problem............................................... 168 188 0.3% 81 134 0.1% Potential problem................................ 64 48 0.1% 84 75 0.2%
Total ............................................ $ 61,233 $ 63,987 100.0% $ 55,968 $ 60,044 100.0%
The following table identifies the aging and amount of unrealized losses associated with securities that have a fair value 20% or more below carrying value. The issuers of these securities continue to meet all their contractual obligations. Factors considered in evaluating whether a decline in value is other than temporary include: 1) whether the decline is substantial; 2) the financial condition and near-term prospects of the issuer; 3) the amount of time that the fair value has been less than cost; and 4) New York Life's ability and intent to retain the investment for the period of time sufficient to allow for an anticipated recovery in value.
Potential Problem Bonds
December 31, 2005 2004
Carrying
Value
Estimated Fair
Value Unrealized
Loss Carrying
Value
Estimated Fair
Value Unrealized
Loss (Dollars in millions) Less than 6 months .............................. $ 57 $ 43 $ (14) $ 73 $ 65 $ ( 8) Between 6-9 months ............................ 7 5 (2) 3 2 ( 1 ) Between 9-12 months .......................... – – – – – – Greater than 12 months ……………... – – – 8 8 –
Total ............................................. $ 64 $ 48 $ (16) $84 $ 75 $ ( 9 )
Bonds are carried at amortized cost, or the lower of amortized cost or fair value, if in default (as defined by an NAIC Designation of 6). Unrealized losses were $16 million and $9 million on potential problem bonds at December 31, 2005 and 2004, respectively, of which $0.4 million and $4.4 million of the unrealized losses, respectively, were reported as a reduction in statutory surplus for the same periods. Net unrealized gains of the bond portfolio were $2,754 million and $4,076 million at December 31, 2005 and 2004, respectively; however, since these bonds are held at amortized cost, these unrealized gains and losses are not inherent in the statutory financial statements.

15
Bonds were diversified by industry type as set forth in the following table:
December 31, 2005 2004 Carrying
Value % of Total
Carrying Value
% of Total
(Dollars in millions) Mortgage-Backed $9,369 15% $7,772 14%Bank and Finance 8,159 13% 8,277 15%Utilities 7,636 13% 7,197 13%Consumer Goods 7,245 12% 6,970 12%Capital Goods 7,146 12% 6,777 12%Asset-Backed 6,505 11% 6,142 11%U.S. & State Governments 6,852 11% 5,326 10%Energy 3,346 5% 3,220 6%Media 1,813 3% 1,852 3%Transportation 1,141 2% 1,131 2%Other * 2,021 3% 1,304 2%Total Bonds $61,233 100% $55,968 100%
* Other category is made up of industry concentrations of less than 3%.
Mortgage and Asset-Backed Securities
New York Life's mortgage-backed securities investment portfolio consists of pass-through securities, which are pools of mortgage loans collateralized by single-family residences and primarily issued by government sponsored entities (e.g., GNMA, FNMA, FHLMC), and structured pass-through securities, such as collateralized debt obligations, that may have specific prepayment and maturity profiles, are primarily AAA rated, and may be issued by either government sponsored entities or "private label" issuers.
New York Life also holds commercial mortgage-backed securities that may be originated by single or multiple issuers, which are collateralized by mortgage loans secured by income producing commercial properties such as office buildings, multi-family dwellings, industrial, retail, hotels and other property types.

16
The following table shows the types of mortgage-backed securities held at December 31, 2005 and 2004.
Mortgage-Backed Securities
December 31, 2005 2004
Carrying
Value % of Total
Carrying Value
% of Total
(Dollars in millions)
Pass-through securities ................................................ $ 1,543 16.5% $ 1,829 23.5% CMO – Planned amortization class ............................. 1,342 14.3% 1,518 19.5% CMO - Sequential pay class ........................................ 1,579 16.8% 1,077 13.9% CMO – Other ............................................................... 1,291 13.8% 506 6.5%
Subtotal................................................................. $ 5,755 61.4% $ 4,930 63.4% Commercial mortgage-backed Securities .................... 3,614 38.6% 2,842 36.6%
Total .............................................................. $ 9,369 100.0% $ 7,772 100.0%
New York Life's asset-backed securities investment portfolio consists of securities collateralized by the
cash flows of consumer loans or receivables relating to credit cards, automobiles, home equity and other asset classes (such as residential mortgage backed securities, reduction rate bonds, equipment, collateralized debt and other trade receivables). At each of the years ended December 31, 2005 and 2004, the percentage of New York Life's asset-backed securities that were rated AAA was 79%.
The following table below shows the types of asset-backed securities held at December 31, 2005 and 2004.
Asset-Backed Securities
December 31, 2005 2004
Carrying
Value % of Total
Carrying Value
% of Total
(Dollars in millions)
Automobile receivables ............................................... $ 1,485 22.8% $ 1,349 22.0% Credit card receivables ................................................ 1,258 19.4% 1,083 17.6% Home equity loans ....................................................... 1,082 16.6% 1,022 16.6% Residential mortgage backed securities ....................... 662 10.2% 818 13.3% Equipment.................................................................... 415 6.4% 336 5.5% Reduction rate bonds ................................................... 312 4.8% 336 5.5% Collateralized debt obligations .................................... 171 2.6% 222 3.6% Other ............................................................................ 1,120 17.2% 976 15.9%
Total............................................................................. $ 6,505 100.0% $ 6,142 100.0%
Management of Bonds
New York Life follows a fundamental approach to credit analysis supporting bond purchase or sale decisions. Key factors include the stability and adequacy of cash flow in relation to debt service requirements and the outlook for growth in operating earnings. Issuers of below investment grade bonds generally have relatively high levels of indebtedness and are thus more sensitive than issuers of investment grade bonds to adverse economic conditions or to increasing interest rates. Although private placements are relatively less liquid, they benefit from more comprehensive financial covenants and are more likely to be secured or senior in structure.

17
New York Life actively manages and monitors its credit risk exposure. New York Life, through its subsidiary, NYLIM, manages credit risk on an individual issuer and portfolio basis in accordance with New York Life’s investment policy guidelines. Individual issuer limits are set based on the issuer's credit rating. Credit ratings for issuers used to monitor credit risk are either public rating agency credit ratings, or internal ratings. The internal ratings are maintained and monitored by an experienced group of credit analysts specialized by industry and asset type. Factors involved in determining credit rating include financial and operating ratios, industry outlook and priority of claim. Credit limits at a portfolio level, such as country and industry exposures, are also established and reviewed periodically. The bond portfolio is continuously examined to identify any potential problems or events that would result in the issuer not being able to comply with the contractual terms. These are included on a “watchlist” that is routinely monitored. Mortgage Loans
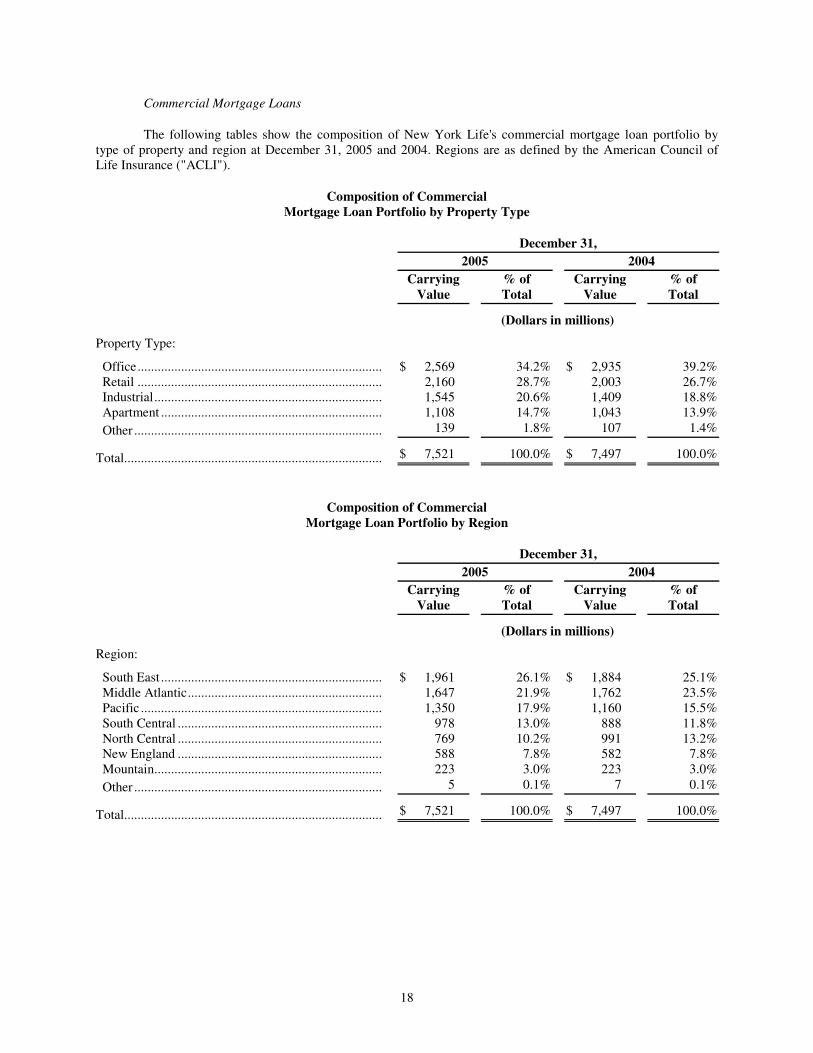
New York Life underwrites commercial mortgages on general purpose income producing properties including office buildings, retail facilities, apartments, industrial and hotel properties and purchases single family mortgage pools on the secondary market. Geographic and property type diversification is considered in analyzing investment opportunities, as well as property valuation and cash flow. At December 31, 2005, approximately 33.2% of New York Life's mortgage loan portfolio was office buildings, 27.9% retail buildings, 20.0% industrial, 14.3% apartment complex, 2.8% residential and 1.8% other types.
The mortgage loan portfolio, including both commercial and residential loans, was $7,735 and $7,709 million at December 31, 2005 and 2004, respectively. The mortgage loan portfolio comprised 8.4% and 9.0% of New York Life’s total invested assets at December 31, 2005 and December 31, 2004, respectively. Approximately 33.6% of the portfolio was secured by properties located in the states of New York, California and Texas. At December 31, 2005, mortgages with principal balances of $75 million or greater accounted for 5.4% of the aggregate principal balance of the commercial mortgage portfolio.
New York Life evaluates its mortgage loan portfolio for impairments. A loan is impaired when, based on current facts and circumstances, it is probable that it will be unable to collect all amounts due according to the contractual terms of the loan agreement. The impairment is measured based upon the fair value of the collateral and a valuation allowance is established with a corresponding charge to unrealized loss. Declines in fair value and subsequent changes in impairment (increase/decrease) are charged to/against the valuation allowance with the offset to unrealized gains and losses.
18
Commercial Mortgage Loans
The following tables show the composition of New York Life's commercial mortgage loan portfolio by type of property and region at December 31, 2005 and 2004. Regions are as defined by the American Council of Life Insurance ("ACLI").
Composition of Commercial Mortgage Loan Portfolio by Property Type
December 31, 2005 2004
Carrying
Value % of Total
Carrying Value
% of Total
(Dollars in millions)
Property Type:
Office......................................................................... $ 2,569 34.2% $ 2,935 39.2% Retail ......................................................................... 2,160 28.7% 2,003 26.7% Industrial.................................................................... 1,545 20.6% 1,409 18.8% Apartment .................................................................. 1,108 14.7% 1,043 13.9% Other .......................................................................... 139 1.8% 107 1.4%
Total............................................................................. $ 7,521 100.0% $ 7,497 100.0%
Composition of Commercial Mortgage Loan Portfolio by Region
December 31, 2005 2004
Carrying
Value % of Total
Carrying Value
% of Total
(Dollars in millions)
Region:
South East .................................................................. $ 1,961 26.1% $ 1,884 25.1% Middle Atlantic.......................................................... 1,647 21.9% 1,762 23.5% Pacific ........................................................................ 1,350 17.9% 1,160 15.5% South Central ............................................................. 978 13.0% 888 11.8% North Central ............................................................. 769 10.2% 991 13.2% New England ............................................................. 588 7.8% 582 7.8% Mountain.................................................................... 223 3.0% 223 3.0% Other .......................................................................... 5 0.1% 7 0.1%
Total............................................................................. $ 7,521 100.0% $ 7,497 100.0%

19
Commercial Mortgage Problem Loan Experience as a Percentage of Mortgage Loan Portfolio Principal Balance
December 31, 2005 2004
Principal Balance
% of Total
Principal Balance
% of Total
(Dollars in millions) Delinquent and in process of foreclosure (1)................................$ - - $ - - Restructured (2) ................................................................................................- - 44.8 0.59%
Subtotal ................................................................................................- - 44.8 0.59% Foreclosed — Period to date ................................................................43.9 0.58% - -
Total................................................................................................$ 43.9 0.58% $ 44.8 0.59% ________________
(1) A commercial mortgage is classified as delinquent when it is 60 days or more past due as to the payment of interest or principal. At December 31, 2005, New York Life had no delinquent mortgages.
(2) A restructured commercial mortgage is a mortgage in good standing whose basic terms, such as interest rate or maturity date, have been modified as a result of an actual or anticipated delinquency.
Management of Mortgage Loans
New York Life actively monitors and manages its mortgage loan portfolio; substantially all of the mortgage loan portfolio is serviced directly by New York Life’s subsidiary, NYLIM. All aspects of loan origination and loan management are performed and/or reviewed by NYLIM personnel, including lease analysis, economic and financial reviews, tenant analysis, and oversight of delinquency and bankruptcy proceedings. Properties securing loans of $5 million or more are generally reinspected and revalued on a regularly scheduled basis. Problem or potential problem loans are reinspected and revalued as often as required.
If any mortgage loan analysis or other information that is obtained indicates a potential problem (likelihood of the borrower not being able to comply with the present loan repayment terms), the loan will be placed on an internal watchlist and routinely monitored. Among the criteria that would indicate a potential problem are: borrower bankruptcies; major tenant bankruptcies; loan relief/restructuring requests; delinquent tax payments; late payments; low loan to value or debt service coverage ratios; and vacancy levels. No single factor necessarily requires a loan to be included on the watchlist, as such determination is subject to the judgment of management as to whether circumstances call for inclusion.
Losses on commercial mortgage loans are a result of foreclosures, sales of loans and write-downs in anticipation of losses. Losses for 2005 and 2004 amounted to $10 million and $23 million or 0.1% and 0.3%, respectively, of the principal balance of commercial mortgages in New York Life’s investment portfolio.
Restructured Mortgage Loans
Restructured mortgage loans are loans whose current payment terms have been modified to less than
current market rates and which are currently performing pursuant to such modified terms. Loans on which maturities have been extended but on which current payments are being made at or above market interest rates are not classified as restructured loans. At December 31, 2005 New York Life had no restructured mortgage loans. At December 31, 2004 New York Life had one restructured mortgage loan with a principal balance of $45 million.

20
Equity Investments
Equity Securities
At December 31, 2005, the total carrying value of New York Life’s unaffiliated equity portfolios was $3,443 million, comprised of $2,750 million in direct investments in common stocks, $337 million in mutual funds and $356 million in preferred stock. The carrying value increased by $194 million from the $3,249 million reported at December 31, 2004.
Investments in affiliated common stock totaled $4,590 million at December 31, 2005, an increase of $830 million from the $3,760 million reported at December 31, 2004. This increase was primarily due to appreciation of ESI, a publicly traded affiliated company, of $740 million. However, $501 million of this increase is offset by a corresponding liability associated with a forward contract, which New York Life entered into with CSFBI, of certain shares of ESI to protect itself against downside risk associated with New York Life’s investment in ESI. Under the agreement, CSFBI is entitled to the appreciation above a certain threshold share price for these shares of ESI, which during 2005 resulted in an increase in the liability of $501 million.
In addition, an increase in NYLIAC’s equity of $149 million contributed to the increase. Equity Real Estate
The carrying value of New York Life’s real estate portfolio, which includes properties held for the
production of income, properties held for sale and home office properties, was $490 million and $462 million, at December 31, 2005 and 2004, respectively, an increase of $28 million, or 6.1%. Excluding its home office properties and foreclosed properties, the real estate portfolio was $164 million, a decrease of $38 million from the $202 million held in the portfolio at December 31, 2004. The decrease was primarily due to the sale of three real estate properties in 2005, including the sale of a large apartment building in New York City, which generated a $582 million pre-tax realized gain on sale.
NYLIM manages the real estate investment portfolio, which consists primarily of industrial properties. Each property in the portfolio is reappraised every two years and a surveillance system, based on a cash flow model, is employed to monitor the properties’ financial position in order to identify potential problems.
New York Life owned two foreclosed properties at December 31, 2005 and one foreclosed property at
December 31, 2004, which were commercial properties, with a carrying value of $46 million and $13 million, respectively. Foreclosed properties generated net operating income of $1 million in each of the years ended December 31, 2005 and 2004.
Limited Partnerships, including Limited Liability Companies and Other Long-term Investments
Limited partnerships including limited liability companies (“LLCs”) and other long-term investments were
$5,212 million and $5,455 million at December 31, 2005 and 2004, respectively, and consisted of: $2,129 million and $2,043 million, respectively, in limited partnership interests and limited liability companies; $1,896 million and $2,344 million, respectively, in the New York Life Short Term Investment Fund, LP; and $1,187 million and $1,068 million, respectively, in loans to MCF, an indirect wholly owned subsidiary.
Limited partnership interests and LLCs primarily consist of domestic and international leveraged buyout funds, venture capital, real estate, oil and gas, and other equity investments. The limited partnership portfolio is well seasoned and diversified. The New York Life Short Term Investment Fund, LP, an affiliate, primarily invests in short-term U.S. government and agency securities, CDs, bankers acceptance notes, commercial paper and medium term floating rate notes. Loans to MCF are used to make capital available to middle market companies, generally in the form of revolving lines of credit.
Policy Loans
Loans on policies are permitted to the extent of such policies' contractual limits. At December 31, 2005 and 2004, approximately 66% and 63% of the policy loans of $5,957 million and $5,794 million, respectively, were

21
at variable interest rates. The average variable rate was 5.88% and 6.44% as of December 31, 2005 and 2004. The remainder of the policy loans was at various fixed interest rates, ranging from 5.0% to 8.0%.
Separate Accounts
New York Life has established both non-guaranteed and guaranteed separate accounts with varying investment objectives which are segregated from New York Life’s general account and are maintained for the benefit of separate account contractholders.
At December 31, 2005, New York Life’s separate account assets totaled $5,921 million, an increase of $166 million, or 2.9%, from the $5,755 million held at December 31, 2004. This increase is primarily attributable to premium income of $952 million, reinvested investment income of $222 million and capital gains of $74 million. These increases were partially offset by withdrawals of $1,051 million.
CERTAIN FINANCIAL AND ACCOUNTING MATTERS
Accounting Policies and Principles
Statutory Accounting Practices
The financial statements of New York Life included in this Offering Memorandum have been prepared on the basis of SAP prescribed or permitted by insurance regulatory authorities. SAP differs from GAAP in that SAP is primarily designed to reflect the ability of the insurer to satisfy its obligations to policyowners, contractholders and beneficiaries, whereas GAAP is primarily oriented toward the allocation of revenues, expenses and costs to financial reporting periods. For example, under SAP, commissions and other costs incurred in connection with acquiring new business are charged to operations in the year incurred; whereas under GAAP, expenses and costs are accrued on a basis to match them against appropriate revenues.
Under SAP, New York Life's financial statements are not consolidated on a line-by-line basis and investments in subsidiaries are generally shown at net equity value. Accordingly, the assets, liabilities and results of operations of New York Life's subsidiaries are not consolidated with the assets, liabilities and results of operations, respectively, of New York Life. However, New York Life's financial statements do reflect, in New York Life's assets, the net equity value of New York Life's subsidiaries and, in New York Life's surplus, the current year change in net equity value, less dividends paid and contributions from New York Life, of subsidiaries as an unrealized gain or loss on investments. Dividends paid by subsidiaries to New York Life are included in New York Life's net investment income.
For more information about the differences between SAP and GAAP, see "Selected Historical Statutory Financial Information of New York Life."
Adjustments for Impaired Investments
The cost basis of fixed maturities and equity securities are adjusted for impairments in value deemed to be other than temporary, with the associated realized loss reported in net income. Factors considered in evaluating whether a decline in value is other than temporary include: 1) whether the decline is substantial; 2) the financial condition and near-term prospects of the issuer; 3) the amount of time that the fair value has been less than cost; and 4) New York Life's ability and intent to retain the investment for the period of time sufficient to allow for an anticipated recovery in value.
Statutory Investment Reserves
SAP requires a life insurance company to maintain both an asset valuation reserve ("AVR"), and an interest maintenance reserve ("IMR"), to absorb both realized and unrealized gains and losses on a portion of New York Life's investments. The AVR is a statutory reserve for fixed maturity securities, equity securities, mortgage loans, equity real estate and other invested assets. The level of the AVR is based on both the type of investment and its credit rating. In addition, the reserves required for similar investments, for example fixed maturity securities, differ according to the credit ratings of the investments, which are based upon ratings established periodically by the

22
Securities Valuation Office of the NAIC. New York Life, in keeping with the New York Insurance Law and SAP, includes this reserve when determining its total adjusted capital for risk-based capital purposes. Changes in the AVR are accounted for as direct increases or decreases in surplus.
The IMR applies to all types of fixed maturity securities, including bonds, preferred stocks, mortgage-backed securities, asset-backed securities and mortgage loans. The IMR is designed to capture the after-tax capital gains or losses which are realized upon the sale of such investments and which result from changes in the overall level of interest rates. The captured after-tax net realized gains or losses are then amortized into income over the remaining period to the stated maturity of the investment sold. The IMR is not treated under SAP as part of total adjusted capital for risk-based capital purposes. New York Life's IMR was $390 million at December 31, 2005.
Dividends
New York Life annually determines the amount of dividends payable to eligible policyowners. These dividends have the effect of reducing the cost of insurance to policyowners and should be distinguished from the dividends paid on shares of capital stock by other types of business corporations or by stock life insurance companies. Policies on which such dividends may be payable are referred to as participating policies; policies on which such dividends are not payable are referred to as non-participating policies. As of December 31, 2005, its dividend liability, which relates to dividends to be paid in 2006, was $1,429 million.
Surplus in excess of what New York Life's Board of Directors determines to be necessary to meet its future policy obligations, maintain reserves, and operate its business is distributed annually in the form of dividends on New York Life's participating policies in accordance with actuarially determined dividend scales adopted annually by New York Life's Board of Directors. New York Life has the discretion, subject to statutory requirements, to vary the amount of dividends payable to policyowners, even many years after the issuance of a particular policy. To the extent authorized by New York Life's Board of Directors, New York Life has the right to continue to declare policyowner dividends and to make dividend payments on its participating policies, which dividends are paid out of surplus funds.
Policy Reserves
Life insurance companies price their insurance products based upon assumptions regarding certain future events, including investment income, expenses incurred and mortality. SAP prescribes methods for providing for future benefits to be paid on a conservative basis, primarily by charging current operations with amounts necessary to establish appropriate reserves for anticipated future claims. Thus, under applicable state law, New York Life must maintain reserves in amounts, which are actuarially calculated to be sufficient to meet its various policy and contract obligations as they become due. Such reserves appear as liabilities on New York Life's financial statements.
New York Life is required under the New York Insurance Law to conduct annually an analysis of the sufficiency of interest-sensitive life and annuity reserves.
Reinsurance
New York Life uses a variety of reinsurance agreements with insurers to control its loss exposure and improve the competitiveness of its life insurance products. Generally, these agreements are structured either on an automatic basis, where all risks meeting prescribed criteria are automatically covered, or on a facultative basis, where the reinsurer must accept the specific reinsurance risk before it becomes liable. The amount of each risk retained by New York Life depends on its evaluation of the specific risk, subject, in certain circumstances, to maximum limits based on characteristics of coverages.
Under the terms of the reinsurance agreements, the reinsurer will be liable to reimburse New York Life for the ceded amount in the event the claim is paid. New York Life remains primarily liable for all reinsurance ceded even if the reinsurer fails to meet such obligations. In recent years, New York Life has collected amounts due from its reinsurers.

23
Separate Accounts
Under state insurance laws, insurers are permitted to establish separate investment accounts in which assets backing certain policies, including certain group annuity contracts, are held. The investments in each separate account (which may be pooled or customer specific) are maintained separately from those in other separate accounts and the general account. The investment results of the separate account assets pass through directly to separate account policyowners and contractholders, so that an insurer derives management and other fees from, but bears no investment risk on, these assets, except the risk on certain products that the investment results of the separate account assets will not meet the minimum rate guaranteed on these products. Under the terms of the contracts of certain guaranteed separate accounts, New York Life will share in the excess investment performance of the separate account over an established benchmark.

24
STATUTORY CAPITALIZATION OF NEW YORK LIFE
New York Life is a mutual insurance company incorporated under the laws of the State of New York, United States. New York Life was incorporated on May 21, 1841 under the name Nautilus Insurance Company, was licensed to transact business in the State of New York on April 17, 1845 and changed its name to New York Life Insurance Company on April 5, 1849. The U.S. federal employer identification number of New York Life is 13-5582869. The registered office of New York Life is 51 Madison Avenue New York, New York 10010. The telephone number of New York Life is +1 (800) 692-3086.
As a mutual company, New York Life has no capital stock and no shareholders. Its participating policyowners generally have certain rights to receive policy dividends, and they and certain other policyowners may have rights to receive distributions in a proceeding for its rehabilitation, liquidation or dissolution. Policyowners also have certain rights to vote in the election of directors as provided by New York law.
New York Life's balance sheet includes its surplus and an AVR. The amount by which the admitted assets of New York Life exceed its liabilities is referred to as surplus. The AVR helps to mitigate surplus fluctuations that result from changes in the value of the investment portfolio (other than fluctuations in the value of certain fixed income investments due to interest rate changes) of New York Life. See "Certain Financial and Accounting Matters—Statutory Investment Reserves."
The following table sets forth the capitalization of New York Life at December 31, 2005. The AVR is included in the following table even though such reserve is shown as a liability on New York Life's balance sheet. This treatment is consistent with the general view of the insurance industry. In addition, such reserve is included as part of total adjusted capital for risk-based capital purposes.
December 31, 2005
(Dollars in millions) Debt Short-Term Debt (less than 1 year) (a) .............................................................. $ 649 Medium-Term Debt (1-10 years) (b)................................................................. 1,087 Long-Term Debt (greater than 10 years) ......................................................... – Asset Valuation Reserve................................................................................ 1,877 Surplus
Surplus notes ................................................................................................ 991 Unassigned funds ......................................................................................... 9,558
Surplus and Asset Valuation Reserve (c) ...................................................... $ 12,426
_______________
(a) Includes repurchase agreements of $89 million, and affiliated loans of $560 million.
(b) Includes affiliated loans of $242 million and liabilities held under forward contracts that are economically hedged of $845 million.
(c) Consolidated Statutory Surplus and Asset Valuation Reserve ("AVR "), which includes the AVR of the Company's wholly owned domestic insurance subsidiaries (New York Life Insurance and Annuity Corporation and NYLIFE Insurance Company of Arizona), totaled $12,853 million at December 31, 2005.

25
SELECTED HISTORICAL STATUTORY FINANCIAL INFORMATION OF NEW YORK LIFE
The following tables set forth selected historical financial information for New York Life. Prospective investors should read it in conjunction with "Certain Financial and Accounting Matters", "Management's Discussion and Analysis of Financial Condition and Results of Operations of New York Life" and New York Life's financial statements and related notes. The selected financial information for New York Life at and for each of the years ended December 31, 2005, 2004 and 2003 has been derived from the 2005, 2004 and 2003 Statutory Financial Statements. The preparation of financial statements requires management to make estimates and assumptions that affect the reported amounts of assets and liabilities at the date of the financial statements. Actual results may differ from estimates.
Discussion of Certain Differences between SAP and GAAP
The financial information of New York Life included in this Offering Memorandum is presented in accordance with SAP. Statutory accounting is used by state insurance regulators to monitor the operations of insurance companies.
Financial statements prepared under SAP as determined under New York State Law vary from those prepared under GAAP in certain significant respects, primarily as follows:
• non-public majority owned subsidiaries are generally carried at net equity value, whereas under GAAP they would be consolidated; earnings of such subsidiaries are recognized in net investment income only when dividends are declared whereas under GAAP net income from such subsidiaries would be recognized when earned and dividends would be eliminated in consolidation. In addition, New York Life’s publicly-traded subsidiary, Express Scripts, Inc. (“ESI”) is carried at market value, less a haircut, as defined in NAIC SAP, whereas under GAAP, publicly-traded subsidiaries are recorded on the equity basis where New York Life exercises significant influence;
• the costs related to acquiring business, principally commissions and certain policy issue expenses and sales inducements, are charged to income in the year incurred, whereas under GAAP they would be deferred and amortized over the periods benefited;
• life insurance reserves are based on different assumptions than they are under GAAP and dividends on participating policies are provided for when approved by the Board of Directors, whereas under GAAP, they are provided when earned;
• life insurance companies are required to establish an AVR by a direct charge to surplus to offset potential investment losses, whereas under GAAP, the AVR is not recognized and any losses on investments would be deducted from the assets to which they relate and would be charged to income;
• investments in bonds are generally carried at amortized cost or values as prescribed by the New York State Insurance Department; under GAAP, investments in bonds that are classified as available for sale or trading, are generally carried at fair value, with changes in fair value charged or credited to equity or reflected in earnings, respectively;
• realized gains and losses resulting from changes in interest rates on fixed income investments are deferred in the IMR and amortized into investment income over the remaining life of the investment sold, whereas under GAAP, the gains and losses are recognized in income at the time of sale;
• deferred income taxes exclude state income taxes and are admitted to the extent they can be realized within one year subject to a 10% limitation of capital and surplus with changes in the net deferred tax reflected as a component of surplus; under GAAP, deferred income taxes include federal and state income taxes and a valuation allowance is recorded to reduce a deferred tax asset to that portion that is expected to more likely than not be realized and changes in the deferred tax are generally reflected in earnings;
26
• certain reinsurance transactions are accounted for as reinsurance for SAP and as financing transactions under GAAP, and assets and liabilities are reported net of reinsurance for SAP and gross of reinsurance for GAAP;
• certain assets, such as intangible assets, furniture and equipment, deferred taxes that are not realizable within one year and unsecured receivables, are considered non-admitted and excluded from assets in the statutory statements of financial position, whereas they are included under GAAP, subject to a valuation allowance as appropriate;
• contracts that have any mortality or morbidity risk, regardless of significance, and contracts with life contingent annuity purchase rate guarantees are classified as insurance contracts; whereas under GAAP, contracts that do not subject New York Life to significant risks arising from policyholder mortality or morbidity are accounted for in a manner consistent with the accounting for interest bearing or other financial instrument;
• goodwill is not permitted to be carried as an admitted asset, whereas under GAAP, goodwill, which is considered to have an indefinite useful life, is tested for impairment and a loss recorded, where appropriate;
• post-retirement obligations are measured for only vested employees and agents, whereas under GAAP, these costs are measured for both vested and non-vested employees and agents;
• surplus notes are included as a component of surplus, whereas under GAAP, they are presented as a liability; and
• GAAP requires that for certain reinsurance arrangements whereby assets are retained by the ceding insurer (such as funds withheld of modified coinsurance) and a return is paid based on the performance of underlying investments, then the liabilities for these reinsurance arrangements must be adjusted to reflect the fair value of the invested assets. Statutory accounting does not contain a similar requirement.
• contracts that contain an embedded derivative are not bifurcated between components and are accounted for consistent with the host contract, whereas under GAAP, the embedded derivative is bifurcated from the host contract and accounted for separately.
The effects on the financial statements of the variances between SAP and GAAP are material to New York Life.
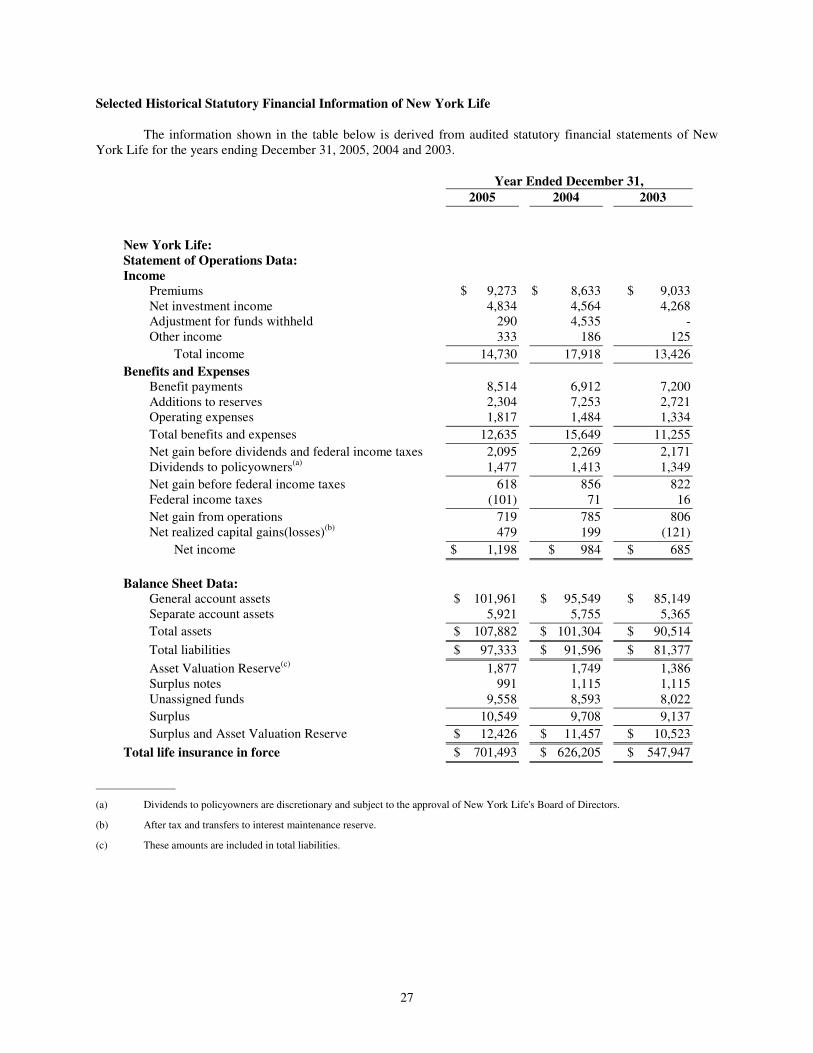
27
Selected Historical Statutory Financial Information of New York Life
The information shown in the table below is derived from audited statutory financial statements of New York Life for the years ending December 31, 2005, 2004 and 2003.
Year Ended December 31, 2005 2004 2003
New York Life: Statement of Operations Data: Income Premiums $ 9,273 $ 8,633 $ 9,033 Net investment income 4,834 4,564 4,268 Adjustment for funds withheld 290 4,535 - Other income 333 186 125 Total income 14,730 17,918 13,426 Benefits and Expenses Benefit payments 8,514 6,912 7,200 Additions to reserves 2,304 7,253 2,721 Operating expenses 1,817 1,484 1,334 Total benefits and expenses 12,635 15,649 11,255 Net gain before dividends and federal income taxes 2,095 2,269 2,171 Dividends to policyowners(a) 1,477 1,413 1,349 Net gain before federal income taxes 618 856 822 Federal income taxes (101) 71 16 Net gain from operations 719 785 806 Net realized capital gains(losses)(b) 479 199 (121) Net income $ 1,198 $ 984 $ 685 Balance Sheet Data: General account assets $ 101,961 $ 95,549 $ 85,149 Separate account assets 5,921 5,755 5,365 Total assets $ 107,882 $ 101,304 $ 90,514 Total liabilities $ 97,333 $ 91,596 $ 81,377 Asset Valuation Reserve(c) 1,877 1,749 1,386 Surplus notes 991 1,115 1,115 Unassigned funds 9,558 8,593 8,022 Surplus 10,549 9,708 9,137 Surplus and Asset Valuation Reserve $ 12,426 $ 11,457 $ 10,523 Total life insurance in force $ 701,493 $ 626,205 $ 547,947
_______________
(a) Dividends to policyowners are discretionary and subject to the approval of New York Life's Board of Directors.
(b) After tax and transfers to interest maintenance reserve.
(c) These amounts are included in total liabilities.

NEW YORK LIFE INSURANCE COMPANY FINANCIAL STATEMENTS (STATUTORY BASIS) DECEMBER 31, 2005 and 2004

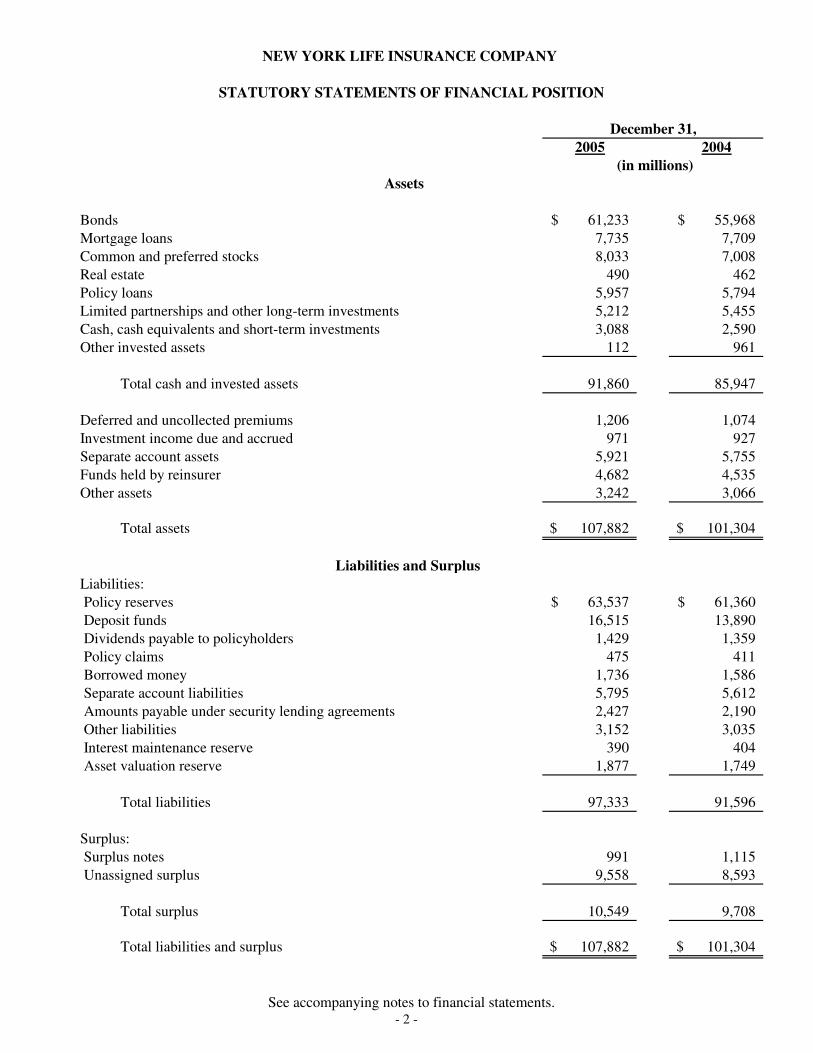
NEW YORK LIFE INSURANCE COMPANY
STATUTORY STATEMENTS OF FINANCIAL POSITION
December 31,2005 2004
(in millions) Assets
Bonds 61,233$ 55,968$ Mortgage loans 7,735 7,709 Common and preferred stocks 8,033 7,008 Real estate 490 462 Policy loans 5,957 5,794 Limited partnerships and other long-term investments 5,212 5,455 Cash, cash equivalents and short-term investments 3,088 2,590 Other invested assets 112 961
Total cash and invested assets 91,860 85,947
Deferred and uncollected premiums 1,206 1,074 Investment income due and accrued 971 927 Separate account assets 5,921 5,755 Funds held by reinsurer 4,682 4,535 Other assets 3,242 3,066
Total assets 107,882$ 101,304$
Liabilities and SurplusLiabilities: Policy reserves 63,537$ 61,360$ Deposit funds 16,515 13,890 Dividends payable to policyholders 1,429 1,359 Policy claims 475 411 Borrowed money 1,736 1,586 Separate account liabilities 5,795 5,612 Amounts payable under security lending agreements 2,427 2,190 Other liabilities 3,152 3,035 Interest maintenance reserve 390 404 Asset valuation reserve 1,877 1,749
Total liabilities 97,333 91,596
Surplus: Surplus notes 991 1,115 Unassigned surplus 9,558 8,593
Total surplus 10,549 9,708
Total liabilities and surplus 107,882$ 101,304$
See accompanying notes to financial statements.- 2 -

NEW YORK LIFE INSURANCE COMPANY
STATUTORY STATEMENTS OF OPERATIONS
2005 2004
Income Premiums 9,273$ 8,633$ Net investment income 4,834 4,564 Adjustment on funds withheld 290 4,535 Other income 333 186
Total income 14,730 17,918
Benefits and expenses Benefit payments: Death benefits 1,943 1,550 Annuity benefits 950 891 Health and disability insurance benefits 340 337 Surrender benefits 1,813 1,644 Payments on matured contracts 2,850 2,102 Other benefit payments 618 388
8,514 6,912
Additions to reserves 2,399 7,408 Net transfers from Separate Accounts (95) (155) Operating expenses 1,817 1,484
Total benefits and expenses 12,635 15,649
Gain from operations before dividends and federal income taxes 2,095 2,269 Dividends to policyholders 1,477 1,413 Gain from operations before federal income taxes 618 856 Federal income taxes (101) 71
Net gain from operations 719 785
Net realized capital gains, after tax and transfers to interest maintenance reserve 479 199
Net income 1,198$ 984$
Years Ended December 31,
(in millions)
See accompanying notes to financial statements.- 3 -
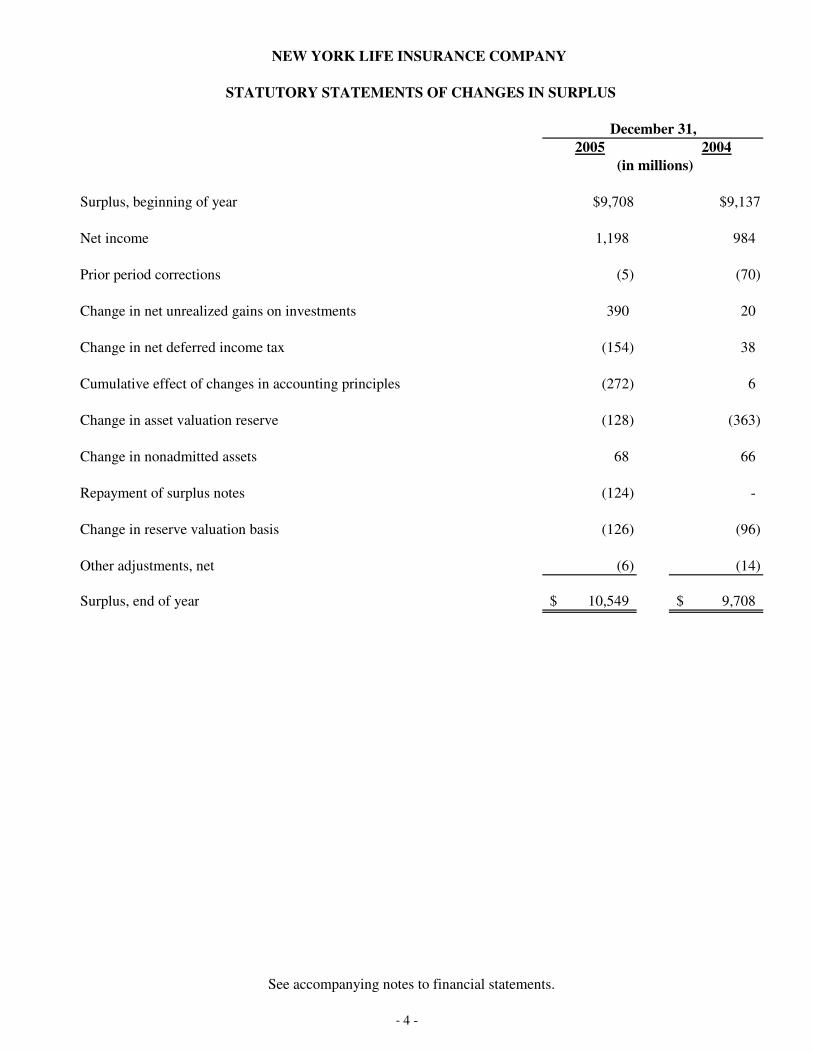
NEW YORK LIFE INSURANCE COMPANY
STATUTORY STATEMENTS OF CHANGES IN SURPLUS
2005 2004
Surplus, beginning of year $9,708 $9,137
Net income 1,198 984
Prior period corrections (5) (70)
Change in net unrealized gains on investments 390 20
Change in net deferred income tax (154) 38
Cumulative effect of changes in accounting principles (272) 6
Change in asset valuation reserve (128) (363)
Change in nonadmitted assets 68 66
Repayment of surplus notes (124) -
Change in reserve valuation basis (126) (96)
Other adjustments, net (6) (14)
Surplus, end of year 10,549$ 9,708$
December 31,
(in millions)
See accompanying notes to financial statements.
- 4 -

NEW YORK LIFE INSURANCE COMPANY
STATUTORY STATEMENTS OF CASH FLOWS
2005 2004
Cash flow from operating activities:
Premiums received 9,160$ 8,536$ Net investment income received 4,568 4,291 Other 298 193
Total received 14,026 13,020
Benefits and other payments 7,966 6,652 Operating expenses 1,840 1,515 Dividends to policyowners 1,406 1,361 Federal income taxes 61 138 Other (107) (37)
Total paid 11,166 9,629
Net cash from operations 2,860 3,391
Cash flow from investing activities:
Proceeds from investments sold 28,652 37,257 Proceeds from investments matured or repaid 19,579 18,039 Cost of investments acquired (52,966) (58,505) Net change in policy loans and premium notes (163) (77)
Net cash from investing activities (4,898) (3,286)
Cash flow from financing and miscellaneous activities:
Net borrowings under repurchase agreements (623) (63) Net borrowings under credit agreements 234 (703) Other changes in borrowed money 42 19 Net proceeds from deposit contracts 2,426 2,307
Repayment of surplus notes (125) - Other miscellaneous sources (uses) 582 (1,766)
Net cash from financing and other activities 2,536 (206)
Net increase (decrease) in cash, cash equivalents and short-term investments 498 (101)
Cash, cash equivalents and short-term investments, beginning of year 2,590 2,691
Cash, cash equivalents and short-term investments, end of year 3,088$ 2,590$
Years Ended December 31,
(in millions)
See accompanying notes to financial statements.
- 5 -

NEW YORK LIFE INSURANCE COMPANY
STATUTORY STATEMENTS OF CASH FLOWS (continued)
2005 2004
Supplemental disclosures of cash flow information:
Non-cash investing and financing activities during the year:
Real estate acquired in satisfaction of debt 35$ -$
Conversion of debt securities to equity securities 16 20
Conversion of preferred stock securities to equity - 14
Total non-cash transactions 51$ 34$
Years Ended December 31,
(in millions)
See accompanying notes to financial statements.
- 6 -

- 7 -
NEW YORK LIFE INSURANCE COMPANY NOTES TO STATUTORY FINANCIAL STATEMENTS
DECEMBER 31, 2005 AND 2004 NOTE 1 - NATURE OF OPERATIONS New York Life Insurance Company (“the Company”), a mutual life insurance company, and its subsidiaries offer a wide range of insurance and investment products and services including life and health insurance, long term care, annuities, pension products, mutual funds (through its broker/dealer subsidiary), and other investments and investment advisory services. The Company, which is domiciled in New York State, is comprised of four primary business segments: Life and Annuity, Investment Management, Special Markets and International operations. Life and Annuity operations are conducted primarily through the Company and its wholly owned insurance subsidiaries New York Life Insurance and Annuity Corporation (“NYLIAC”) and NYLIFE Insurance Company of Arizona (“NYLAZ”). Investment Management operations are conducted through the Company and various registered investment advisory subsidiaries of its wholly owned subsidiary, New York Life Investment Management Holdings LLC (“NYLIM”). Special Markets is a niche business area of the Company that markets group life and health insurance to membership associations, long term care insurance and is the exclusive provider of life insurance to AARP. The Company and its subsidiaries market their products in all 50 of the United States, its territories and the District of Columbia, primarily through its agency force. The Company markets insurance and investment products in Asia and Latin America through New York Life International, LLC (“NYLI”), a wholly owned subsidiary. NYLIFE LLC is a wholly owned subsidiary of the Company, and is a holding company for certain subsidiaries of the Company. NYLIFE LLC, through its subsidiaries, offers securities brokerage, financial planning and investment advisory services, trust services and capital financing. Basis of Presentation The accompanying financial statements have been prepared using accounting practices prescribed or permitted by the New York State Insurance Department (“statutory accounting practices”), which is a comprehensive basis of accounting other than accounting principles generally accepted in the United States of America (“GAAP”). The New York State Insurance Department recognizes only statutory accounting practices prescribed or permitted by the state of New York for determining and reporting the financial position and results of operations of an insurance company and for determining its solvency under New York Insurance Law. The National Association of Insurance Commissioners’ (“NAIC”) Accounting Practices and Procedures Manual (“NAIC SAP”) has been adopted as a component of prescribed or permitted practices by the state of New York. Prescribed statutory accounting practices include state laws and regulations. New York State has certain prescribed accounting practices that differ from those found in NAIC SAP. Permitted statutory accounting practices encompass accounting practices that are not prescribed; such practices differ from state to state, may differ from company to company within a state, and may change in the future. The Company has no permitted practices. Specifically, material differences for the Company include: (1) Electronic Data Processing (“EDP”) equipment and operating software may only be admitted under New York Insurance Law if the individual cost exceeds fifty thousand dollars, whereas NAIC SAP allows these items to be admitted assets, subject to a 3% limitation of a Company’s capital and surplus; (2) the value of aircraft held by a non-insurance subsidiary that has no significant ongoing operations is permitted to be carried as an admitted asset if approved by the Superintendent of Insurance, whereas NAIC SAP requires that it be excluded from the subsidiary’s GAAP equity value carried in surplus; (3) goodwill, whether held directly or by a subsidiary (insurance or non-insurance) is nonadmitted and reduces surplus of the Company, whereas NAIC SAP permits goodwill to be carried as an asset; (4) New York State required the Company to establish an

- 8 -
indemnity reserve equal to 10% of the face value of its surplus note issuance. This reserve is not required under NAIC SAP; and (5) Prepaid real estate taxes may be capitalized and are admissible under New York Insurance Law, whereas NAIC SAP requires that they be capitalized, nonadmitted, and charged against surplus. For the years ended December 31, 2005 and 2004, there were no differences in net income between NAIC SAP and practices prescribed by the state of New York. A reconciliation of the Company’s surplus at December 31, 2005 and 2004 between NAIC SAP and practices prescribed by the state of New York is shown below (in millions):
2005 2004 Statutory Surplus, New York basis
$10,549
$9,708
State Prescribed Practices: 1. EDP equipment, net 2. Aircraft owned by subsidiary, net 3. Goodwill of non-insurance subsidiaries 4. Surplus notes indemnity reserve 5. Prepaid real estate taxes
36
(23) 215 100
1
48
(25) -
100 -
Statutory Surplus, NAIC SAP $10,878 $9,831
The Company has established policy reserves (excluding the effects of reinsurance) on contracts issued January 1, 2001 and later that exceed the minimum amounts determined under Appendix A-820, “Minimum Life and Annuity Reserve Standards” of NAIC SAP by approximately $457 million. These higher direct reserves reduced pre-tax net gain for the year ended December 31, 2005 by approximately $40 million.
Accounting changes adopted to conform to the provisions of NAIC SAP are reported as changes in accounting principles. The cumulative effect of changes in accounting principles is reported as an adjustment to unassigned funds (surplus) in the period of the change in accounting principle. The cumulative effect is the difference between the amount of capital and surplus at the beginning of the year and the amount of capital and surplus that would have been reported at that date if the new accounting principles had been applied retroactively for all prior periods.
Effective January 1, 2005, the NAIC issued SSAP 88 - “Investment in Subsidiaries Controlled and Affiliated (SCA) Entities, a replacement of SSAP 46”, that provides new statutory accounting guidance for the valuation of; (1) foreign insurance subsidiaries, (2) certain non-insurance subsidiaries (domestic and foreign), and (3) limited partnerships where the Company has a controlling interest. The impact on beginning statutory surplus resulting from implementation of the accounting guidance decreased surplus by $57 million. SSAP 88 also changed the accounting for goodwill on foreign insurance companies and non-insurance companies. For foreign insurance companies, goodwill is permitted up to 10% of the underlying audited GAAP equity. For most non-insurance companies, the value is determined using audited U.S. GAAP equity, with all goodwill and intangibles admissible. However, New York State did not adopt SSAP No. 88 in its entirety, in particular as it relates to goodwill. New York State requires that goodwill held by a subsidiary (insurance and non-insurance) be excluded from U.S. GAAP equity when determining its statutory valuation. As a result, the Company non-admitted the remaining goodwill and intangible assets inherent in its statutory valuation of its subsidiaries, which reduced surplus by $215 million.

- 9 -
Financial statements prepared under the statutory basis of accounting as determined under New York State Insurance Law vary from those prepared under GAAP, primarily as follows: (1) non-public majority owned subsidiaries are generally carried at net equity value whereas under GAAP they would be consolidated; earnings of such subsidiaries are recognized in net investment income only when dividends are declared whereas under GAAP net income from such subsidiaries would be recognized when earned and dividends would be eliminated in consolidation. In addition, the Company’s publicly-traded subsidiary, Express Scripts, Inc. (“ESI”) is carried at market value, less a haircut, as defined in NAIC SAP, whereas under GAAP, publicly-traded subsidiaries are recorded on the equity basis where the Company exercises significant influence; (2) the costs related to acquiring business, principally commissions, certain policy issue expenses and sales inducements, are charged to income in the year incurred, whereas under GAAP they would be deferred and amortized over the periods benefited; (3) life insurance reserves are based on different assumptions than they are under GAAP and dividends on participating policies are provided when approved by the Board of Directors, whereas under GAAP, they are provided when credited to the policies; (4) life insurance companies are required to establish an Asset Valuation Reserve (“AVR”) by a direct charge to surplus to offset potential investment losses, whereas under GAAP, the AVR is not recognized and any losses on investments would be deducted from the assets to which they relate and would be charged to income; (5) investments in bonds are generally carried at amortized cost or values as prescribed by the New York State Insurance Department; under GAAP, investments in bonds that are classified as available for sale or trading, are generally carried at fair value, with changes in fair value charged or credited to equity or reflected in earnings, respectively; (6) realized gains and losses resulting from changes in interest rates on fixed income investments are deferred in the Interest Maintenance Reserve (“IMR”) and amortized into investment income over the remaining life of the investment sold, whereas under GAAP, the gains and losses are recognized in income at the time of sale; (7) deferred income taxes excludes state income taxes and are admitted to the extent they can be realized within one year subject to a 10% limitation of capital and surplus with changes in the net deferred tax reflected as a component of surplus; under GAAP, deferred income taxes includes federal and state income taxes and a valuation allowance is recorded to reduce a deferred tax asset to that portion that is expected to more likely than not be realized and changes in the deferred tax are generally reflected in earnings; (8) certain reinsurance transactions are accounted for as reinsurance for statutory purposes and as financing transactions under GAAP, and assets and liabilities are reported net of reinsurance for statutory purposes and gross of reinsurance for GAAP; (9) certain assets, such as intangible assets, furniture and equipment, deferred taxes that are not realizable within one year and unsecured receivables are considered nonadmitted and excluded from assets on the statutory statements of financial position, whereas they are included under GAAP, subject to a valuation allowance, as appropriate; (10) contracts that have any mortality and morbidity risk, regardless of significance, and contracts with life contingent annuity purchase rate guarantees are classified as insurance contracts; whereas under GAAP, contracts that do not subject the Company to significant risks arising from policyholder mortality or morbidity are accounted for in a manner consistent with the accounting for interest bearing or other financial instruments, (11) goodwill is not permitted to be carried as an admitted asset, whereas under GAAP, goodwill, which is considered to have an indefinite useful life, is tested for impairment and a loss recorded, where appropriate; (12) post-retirement obligations are measured for only vested employees and agents, whereas under GAAP, these costs are measured for both vested and non-vested employees and agents; (13) surplus notes are included as a component of surplus, whereas under GAAP, they are presented as a liability; (14) GAAP requires that for certain reinsurance arrangements whereby assets are retained by the ceding insurer (such as funds withheld or modified coinsurance) and a return is paid based on the performance of underlying investments, then the liabilities for these reinsurance arrangements must be adjusted to reflect the fair value of the invested assets; statutory accounting practices do not contain a similar requirement; and (15) contracts that contain an embedded derivative are not bifurcated between components and are accounted for consistent with the host contract, whereas under GAAP the embedded derivative is bifurcated from the host contract and accounted for separately. The effects on the financial statements of the variances between the statutory accounting practices and GAAP are material to the Company.

- 10 -
The following table reconciles the Company’s statutory surplus determined in accordance with
accounting practices prescribed by the New York State Insurance Department with consolidated equity on a GAAP basis (in millions):
Years ended December 31, 2005 2004 Statutory surplus $ 10,549 $ 9,708
Asset valuation reserve 1,877 1,749 Statutory surplus and asset valuation reserve 12,426 11,457 Adjustments:
Inclusion of capitalization of deferred policy acquisition cost asset (“DAC”) 5,189 4,317
Removal of IMR liability 458 480
Policyholder dividends 220 194
Inclusion of net unrealized gains on investments 3,246 5,331
Inclusion of statutory non-admitted assets 1,563 1,342
Removal of deferred tax asset (315) (955)
Inclusion of capitalization of goodwill 543 383
Carrying value of investment in ESI (1,747) (728)
Re-estimation of future policy benefits and policyholder account balances (3,258) (2,965)
Inclusion of non-vested employee/agent benefit liabilities (383) (387)
Removal of surplus notes, net of indemnification reserve (891) (1,015)
Other 459 316
Total adjustments 5,084 6,313
Total GAAP equity $17,510 $17,770
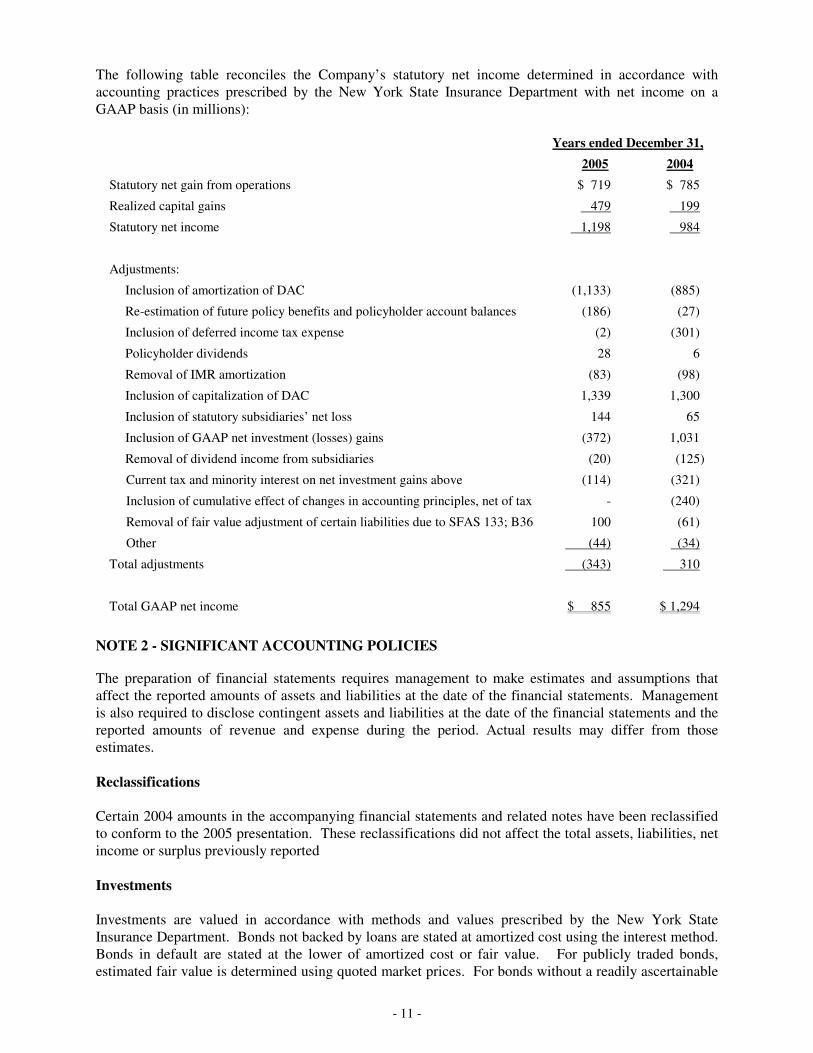
- 11 -
The following table reconciles the Company’s statutory net income determined in accordance with accounting practices prescribed by the New York State Insurance Department with net income on a GAAP basis (in millions):
Years ended December 31, 2005 2004 Statutory net gain from operations $ 719 $ 785
Realized capital gains 479 199
Statutory net income 1,198 984
Adjustments:
Inclusion of amortization of DAC (1,133) (885)
Re-estimation of future policy benefits and policyholder account balances (186) (27)
Inclusion of deferred income tax expense (2) (301)
Policyholder dividends 28 6
Removal of IMR amortization (83) (98)
Inclusion of capitalization of DAC 1,339 1,300
Inclusion of statutory subsidiaries’ net loss 144 65
Inclusion of GAAP net investment (losses) gains (372) 1,031
Removal of dividend income from subsidiaries (20) (125)
Current tax and minority interest on net investment gains above (114) (321)
Inclusion of cumulative effect of changes in accounting principles, net of tax - (240)
Removal of fair value adjustment of certain liabilities due to SFAS 133; B36 100 (61)
Other (44) (34)
Total adjustments (343) 310
Total GAAP net income $ 855 $ 1,294
NOTE 2 - SIGNIFICANT ACCOUNTING POLICIES The preparation of financial statements requires management to make estimates and assumptions that affect the reported amounts of assets and liabilities at the date of the financial statements. Management is also required to disclose contingent assets and liabilities at the date of the financial statements and the reported amounts of revenue and expense during the period. Actual results may differ from those estimates. Reclassifications Certain 2004 amounts in the accompanying financial statements and related notes have been reclassified to conform to the 2005 presentation. These reclassifications did not affect the total assets, liabilities, net income or surplus previously reported Investments Investments are valued in accordance with methods and values prescribed by the New York State Insurance Department. Bonds not backed by loans are stated at amortized cost using the interest method. Bonds in default are stated at the lower of amortized cost or fair value. For publicly traded bonds, estimated fair value is determined using quoted market prices. For bonds without a readily ascertainable

- 12 -
fair value, the Company has determined an estimated fair value using a discounted cash flow approach, broker–dealer quotations or management’s pricing model. Loan-backed bonds and structured securities are valued at amortized cost using the interest method including anticipated prepayments at the date of purchase; changes in prepayment speeds and estimated cash flows from the original purchase assumptions are evaluated quarterly and are accounted for on a retrospective yield adjustment method. Preferred stocks in “good standing” are valued at amortized cost. Preferred stocks “not in good standing” are valued at the lower of amortized cost or fair value. Fair values of preferred stocks are based on published market values, where available. For preferred stocks without a readily ascertainable market value, the Company has determined an estimated fair value using a discounted cash flow approach, broker-dealer quotations, or management’s pricing model. Common stocks include the Company's investments in unaffiliated stocks, mutual funds, ESI and the following direct, wholly owned subsidiaries and membership interests: NYLIAC, NYLAZ, NYLI, NYLIFE LLC, and NYLIM. Unaffiliated common stocks are carried at fair value. Fair value has been determined using quoted market prices for publicly traded securities and broker-dealer quotations or management’s pricing model for private placement securities. Unrealized gains and losses are reflected in surplus, net of deferred taxes. Investments in stocks and membership interests of subsidiaries must have a GAAP audit to be carried as an asset; otherwise the entire investment is nonadmitted. Each of the Company’s subsidiaries has a GAAP audit with the exception of New York Life Haier, J.V. (“HAIER”), which is nonadmitted. The remaining subsidiaries are stated as follows: (1) domestic insurance subsidiaries are stated at the value of their underlying statutory net assets (2) foreign insurance operations are stated at GAAP equity adjusted for certain assets that are disallowed under the statutory basis of accounting; (3) non-insurance subsidiaries are carried at GAAP equity, adjusted for the removal of goodwill, unless they are engaged in certain transactions that are for the benefit of the Company or its affiliates and receive 20% or more of their revenue from the Company or its affiliates. In this case, non-insurance subsidiaries are carried at GAAP equity adjusted for the same items as foreign insurance subsidiaries; (4) the Company’s 16.5% ownership in ESI, a publicly traded company is carried at a 3% discount to market value. Dividends and distributions from subsidiaries are recorded in investment income when declared and changes in the equity of subsidiaries are recorded as unrealized gains or losses. Mortgage loans on real estate are carried at unpaid principal balances, net of discounts/premiums and valuation allowances, and are secured. Specific valuation allowances are established for the excess carrying value of the mortgage loan over its estimated fair value, when it is probable that, based on current information and events, the Company will be unable to collect all amounts due under the contractual terms of the loan agreement. Specific valuation allowances are based on the fair value of the collateral. Fair value is determined by discounting the projected cash flows for each property to determine the current net present value. Real estate held for income production and home office properties are stated at cost less accumulated depreciation and encumbrances. Real estate held for sale is stated at the lower of cost less accumulated depreciation or fair value less encumbrances and estimated cost to sell the property. Real estate joint ventures are recorded based on their underlying GAAP equity. Depreciation of real estate is calculated using the straight-line method over the estimated lives of the assets, generally 40 years. Costs of building improvements are depreciated over their estimated useful lives.

- 13 -
Policy loans are stated at the aggregate balance due, which approximates fair value, since loans on policies have no defined maturity and reduce amounts payable at death or surrender. The excess of the unpaid balance of the policy loan that exceeds the cash surrender value is nonadmitted. Limited partnerships and limited liability companies are carried at the underlying audited GAAP equity of the investee. The Company nonadmits the entire investment where no GAAP audit is performed. Dividends and distributions from limited partnerships and limited liability companies are recorded in investment income. Undistributed earnings are included in unrealized gains and losses and are reflected in surplus, net of deferred taxes. The cost basis of bonds, equity securities, limited partnerships and limited liability companies are adjusted for impairments in value deemed to be other than temporary, with the associated realized loss reported in net income Factors considered in evaluating whether a decline in value is other than temporary include: 1) whether the decline is substantial; 2) the financial condition and near-term prospects of the issuer; 3) the amount of time that the fair value has been less than cost; and 4) the Company’s ability and intent to retain the investment for the period of time sufficient to allow for an anticipated recovery in value. Derivative instruments that are effective hedges are valued consistent with the items being hedged. Investment income is recorded on an accrual basis. Amounts payable or receivable under interest rate and currency swap agreements are recognized as investment income or expense when incurred. Gains and losses related to contracts that are effective hedges on specific assets and liabilities are recognized in income in the same period as a gain and loss on the hedged asset or liability. Realized gains and losses are recognized in net income upon termination or maturity of derivative contracts. Options purchased or written are carried at fair value and are reported as assets or liabilities, as appropriate. Derivative instruments that do not qualify as effective hedges are carried at fair value with unrealized gains and losses reported in surplus, net of deferred taxes. Periodic payments received during the term of the swap are reported in realized gains or losses for hedges that are not highly effective. Short-term investments consist of securities that have original maturities of greater than three months and less than twelve months at date of purchase and are carried at amortized cost, which approximates fair value. Cash and cash equivalents include cash on hand, amounts due from banks and highly liquid debt instruments that have original maturities of three months or less at date of purchase and are carried at amortized cost, which approximates fair value. All securities are recorded in the financial statements on a trade date basis except for the acquisition of private placement bonds, which are recorded on the funding date. The AVR is used to stabilize surplus from fluctuations in the market value of bonds, stocks, mortgage loans, real estate, limited partnerships and other long-term investments. Changes in the reserve are accounted for as direct increases or decreases in surplus. The IMR captures interest related realized gains and losses on sales (net of taxes) of bonds, preferred stocks, mortgage loans and derivative instruments which are amortized into net income over the expected years to maturity of the investments sold using the grouped method. Loaned Securities and Repurchase Agreements Securities loaned are recorded at the amount of cash received. With respect to securities loaned, the Company obtains collateral of at least 102% and 105% of the fair value of the domestic and foreign securities, respectively. The Company monitors the fair value of securities loaned with additional collateral obtained as necessary.

- 14 -
Securities purchased under agreements to resell and securities sold under agreements to repurchase are carried at fair value including accrued interest. It is the Company’s policy to generally take possession or control of the securities purchased under these agreements to resell. Assets to be repurchased or resold are the same or substantially the same as the assets borrowed or sold. The fair value of the securities to be repurchased is monitored and additional collateral is obtained, where appropriate, to protect against credit exposure. Premiums and Related Expenses Life premiums and annuity considerations are taken into income over the premium-paying period of the policies. Commissions and other costs associated with acquiring new business are charged to operations as incurred. Guaranteed investment contracts (“GICs”) with purchase rate guarantees, which introduce an element of mortality risk, are recorded as income when received. Maturation of GICs with purchase rate guarantees are reported as payments on matured contracts. Amounts received or paid under contracts without mortality or morbidity risk are recorded directly on the Statutory Statements of Financial Position as an adjustment to the policyholders’ account balance and not reflected in the Statutory Statements of Operations. Dividends to Policyowners The liability for dividends to policyowners consists principally of dividends expected to be paid during the subsequent year. The allocation of dividends is approved annually by the Board of Directors and is determined by means of formulas, which reflect the relative contribution of each group of policies to divisible surplus. Policy Reserves Policy reserves are based on mortality tables and valuation interest rates, which are consistent with statutory requirements and are designed to be sufficient to provide for contractual benefits. The Company holds reserves greater than those developed under the minimum statutory reserving rules when the Company determines that the minimum statutory reserves are inadequate. Federal Income Taxes Current federal income taxes are charged or credited to operations based upon amounts estimated to be payable or recoverable as a result of taxable operations for the current year and any adjustments to such estimates from prior years. Deferred federal income tax assets (“DTAs”) and liabilities (“DTLs”) are recognized for expected future tax consequences of temporary differences between statutory and taxable income. Temporary differences are identified and measured using a balance sheet approach whereby statutory and tax balance sheets are compared. Net deferred tax assets are admitted to the extent permissible under NAIC SAP. Changes in DTAs and DTLs are recognized as a separate component of surplus. A provision is made for federal income taxes estimated to be payable, including the equity base tax (“EBT”). An estimated Differential Earnings Rate (“DER”) is used to determine the EBT reported in the annual statement as part of net gain from operations for that year. Adjustments to such estimates, including those related to differences between the estimated and final DER, are recorded in net gain from operations when known. The EBT was suspended for the 2001, 2002 and 2003 tax years and reinstated for 2004. Effective with the tax year beginning January 1, 2005, the EBT has been repealed. The Company files a consolidated federal income tax return with certain of its domestic insurance and non-insurance subsidiaries. The consolidated income tax liability is allocated among the members of the group in accordance with a tax allocation agreement. The tax allocation agreement provides that each

- 15 -
member of the group is allocated its share of the consolidated tax provision or benefit, determined generally on a separate company basis, but may, where applicable, recognize the tax benefits of net operating losses or capital losses utilizable in the consolidated group. Intercompany tax balances are settled quarterly on an estimated basis with a final settlement within 30 days of the filing of the consolidated return. Separate Accounts The Company has established both non-guaranteed and guaranteed separate accounts with varying investment objectives which are segregated from the Company’s general account and are maintained for the benefit of separate account contractholders. Separate account assets are primarily invested in bonds and common stocks and are generally stated at market value. Separate account liabilities generally reflect market value. The liability for non-guaranteed separate accounts represents contractholders’ interests in the separate account assets, including accumulated net investment income and realized and unrealized gains and losses on those assets. Guaranteed separate accounts maintained on a market value basis provide a guarantee of principal and interest for contracts held to maturity. Guaranteed separate accounts maintained on an amortized cost/book value basis provide a guarantee of principal and interest during active status, and a book value payout with market value adjustment at discontinuance. Nonadmitted Assets Under statutory accounting practices, certain assets are designated as "nonadmitted assets" and are not included in the accompanying Statutory Statements of Financial Position since these assets are not permitted by the New York State Insurance Department to be taken into account in determining an insurer's financial condition. Nonadmitted assets often include intangible assets, furniture and equipment, agents' debit balances, and receivables over 90 days old. Fair Values of Financial Instruments and Insurance Liabilities Fair values of various assets and liabilities are included throughout the notes to the financial statements. Specifically, fair value disclosure of investments held is reported in Note 3 - Investments. Fair values for derivative financial instruments are included in Note 5 - Derivative Financial Instruments and Risk Management. Fair values for insurance liabilities are reported in Note 8 - Insurance Liabilities. The aggregate fair value of all financial instruments summarized by type, are included in Note 17 – Fair Values of Financial Instruments. Business Risks and Uncertainties The Company’s investment portfolio consists principally of fixed income bonds as well as mortgage loans, policy loans, investments in subsidiaries, limited partnerships, preferred and common stocks and equity real estate. The fair value of the Company’s investments varies depending on economic and market conditions and the interest rate environment. For example, if interest rates rise, the securities in the Company’s fixed-income portfolio generally will decrease in value. If interest rates decline, the securities in the fixed-income portfolio generally will increase in value. For various reasons, the Company may, from time to time, be required to sell certain investments at a price and a time when their fair value is less than their book value. Mortgage loans, many of which have balloon payment maturities, and equity real estate, are generally illiquid and carry a greater risk of investment losses than investment grade bonds.
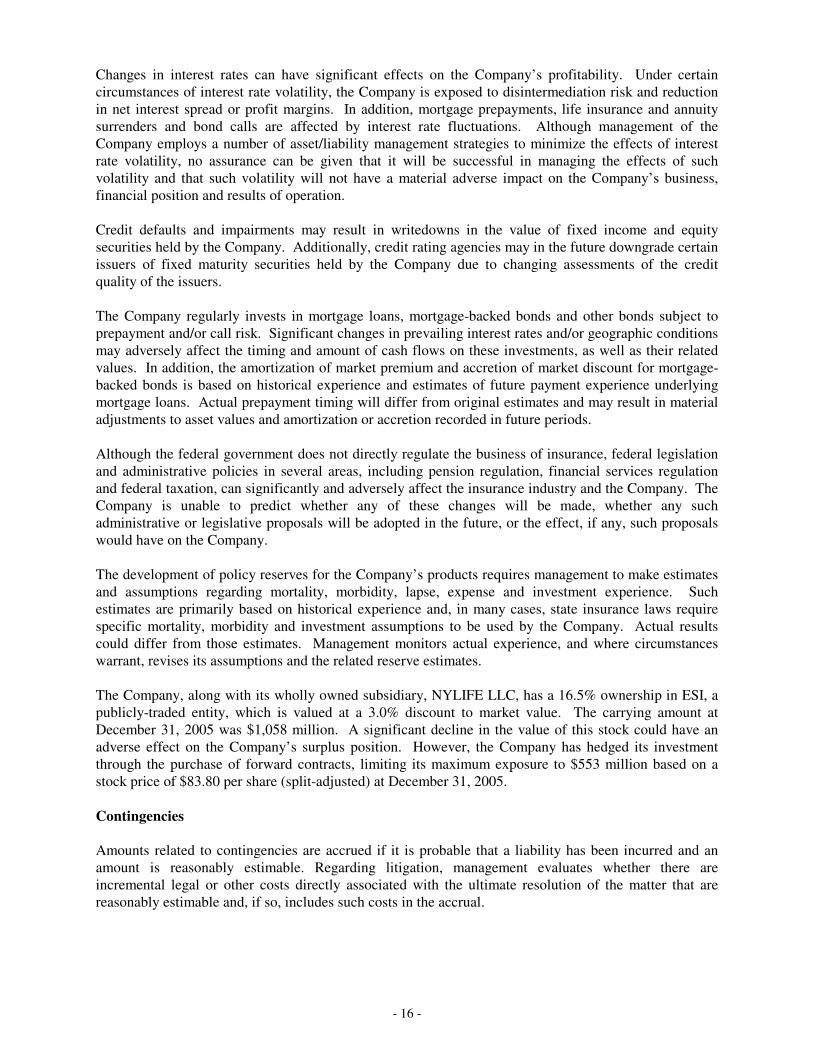
- 16 -
Changes in interest rates can have significant effects on the Company’s profitability. Under certain circumstances of interest rate volatility, the Company is exposed to disintermediation risk and reduction in net interest spread or profit margins. In addition, mortgage prepayments, life insurance and annuity surrenders and bond calls are affected by interest rate fluctuations. Although management of the Company employs a number of asset/liability management strategies to minimize the effects of interest rate volatility, no assurance can be given that it will be successful in managing the effects of such volatility and that such volatility will not have a material adverse impact on the Company’s business, financial position and results of operation. Credit defaults and impairments may result in writedowns in the value of fixed income and equity securities held by the Company. Additionally, credit rating agencies may in the future downgrade certain issuers of fixed maturity securities held by the Company due to changing assessments of the credit quality of the issuers. The Company regularly invests in mortgage loans, mortgage-backed bonds and other bonds subject to prepayment and/or call risk. Significant changes in prevailing interest rates and/or geographic conditions may adversely affect the timing and amount of cash flows on these investments, as well as their related values. In addition, the amortization of market premium and accretion of market discount for mortgage-backed bonds is based on historical experience and estimates of future payment experience underlying mortgage loans. Actual prepayment timing will differ from original estimates and may result in material adjustments to asset values and amortization or accretion recorded in future periods. Although the federal government does not directly regulate the business of insurance, federal legislation and administrative policies in several areas, including pension regulation, financial services regulation and federal taxation, can significantly and adversely affect the insurance industry and the Company. The Company is unable to predict whether any of these changes will be made, whether any such administrative or legislative proposals will be adopted in the future, or the effect, if any, such proposals would have on the Company. The development of policy reserves for the Company’s products requires management to make estimates and assumptions regarding mortality, morbidity, lapse, expense and investment experience. Such estimates are primarily based on historical experience and, in many cases, state insurance laws require specific mortality, morbidity and investment assumptions to be used by the Company. Actual results could differ from those estimates. Management monitors actual experience, and where circumstances warrant, revises its assumptions and the related reserve estimates. The Company, along with its wholly owned subsidiary, NYLIFE LLC, has a 16.5% ownership in ESI, a publicly-traded entity, which is valued at a 3.0% discount to market value. The carrying amount at December 31, 2005 was $1,058 million. A significant decline in the value of this stock could have an adverse effect on the Company’s surplus position. However, the Company has hedged its investment through the purchase of forward contracts, limiting its maximum exposure to $553 million based on a stock price of $83.80 per share (split-adjusted) at December 31, 2005. Contingencies Amounts related to contingencies are accrued if it is probable that a liability has been incurred and an amount is reasonably estimable. Regarding litigation, management evaluates whether there are incremental legal or other costs directly associated with the ultimate resolution of the matter that are reasonably estimable and, if so, includes such costs in the accrual.

- 17 -
Foreign Currency Translation The Company’s Canadian insurance operations are carried in Canadian dollars, with a single foreign currency adjustment of the net value reflected in unrealized gains and losses as a component of surplus. For all other foreign currency items, income and expenses are translated at the average exchange rate for the period while balance sheet items are translated using the spot rate in effect at the balance sheet date. NOTE 3 – INVESTMENTS Bonds The estimated fair value of bonds as shown below are based on published market values, where available. For investments without readily ascertainable market values, fair value has been determined using one of the following sources: broker-dealer quotations, a discounted cash flow approach, or management’s pricing model. At December 31, 2005 and 2004, the maturity distribution of bonds was as follows (in millions):
2005 2004 Estimated Estimated Carrying Fair Carrying Fair Amount Value Amount Value Due in one year or less $ 1,667 $ 1,676 $ 942 $ 957 Due after one year through five years 7,049 7,203 7,025 7,374 Due after five years through ten years 15,126 15,383 13,591 14,494 Due after ten years 20,377 22,602 19,519 21,906 Mortgage and asset backed securities: U.S. government or U.S. government agency 1,140 1,135 977 1,000 Other mortgage backed securities 9,369 9,477 7,772 8,117 Other asset backed securities 6,505 6,511 6,142 6,196 Total $ 61,233 $ 63,987 $ 55,968 $ 60,044

- 18 -
At December 31, 2005 and 2004, the distribution of unrealized gains and losses on bonds was as follows (in millions):
2005 Estimated Carrying Unrealized Unrealized Fair Amount Gains Losses Value
U.S. Treasury and U.S. Government Corporations $ 5,719 $ 760 $ 20 $ 6,459 U.S. agencies, state and municipal 1,133 138 3 1,268 Foreign governments 444 31 1 474 Corporate 38,063 2,111 376 39,798 Other mortgage backed securities 9,369 193 85 9,477 Other asset backed securities 6,505 31 25 6,511 Total $61,233 $ 3,264 $ 510 $ 63,987
2004
Estimated Carrying Unrealized Unrealized Fair Amount Gains Losses Value
U.S. Treasury and U.S. Government Corporations $ 1,715 $ 89 $ 5 $ 1,799 U.S. agencies, state and municipal 3,611 586 1 4,196 Foreign governments 1,097 135 - 1,232 Corporate 35,631 3,015 142 38,504 Other mortgage backed securities 7,772 359 14 8,117 Other asset backed securities 6,142 68 14 6,196 Total $55,968 $ 4,252 $ 176 $60,044
Mortgage Loans The Company’s mortgage loans are diversified by property type, location and borrower, and are collateralized. The maximum and minimum lending rates for mortgage loans funded during 2005 were: commercial loans, 10.40% and 3.68% (12.47% and 2.10% for 2004); residential loans, 5.75% and 4.00% (6.05% and 4.25% for 2004). The maximum percentage of any one commercial loan to the value of the security at the time of the loan, exclusive of insured or guaranteed or purchase money mortgages was 79.7%. The maximum percentage of any residential loan to the value of the security at the time of the loan was 80.0%. The Company has no significant credit risk exposure to individuals.
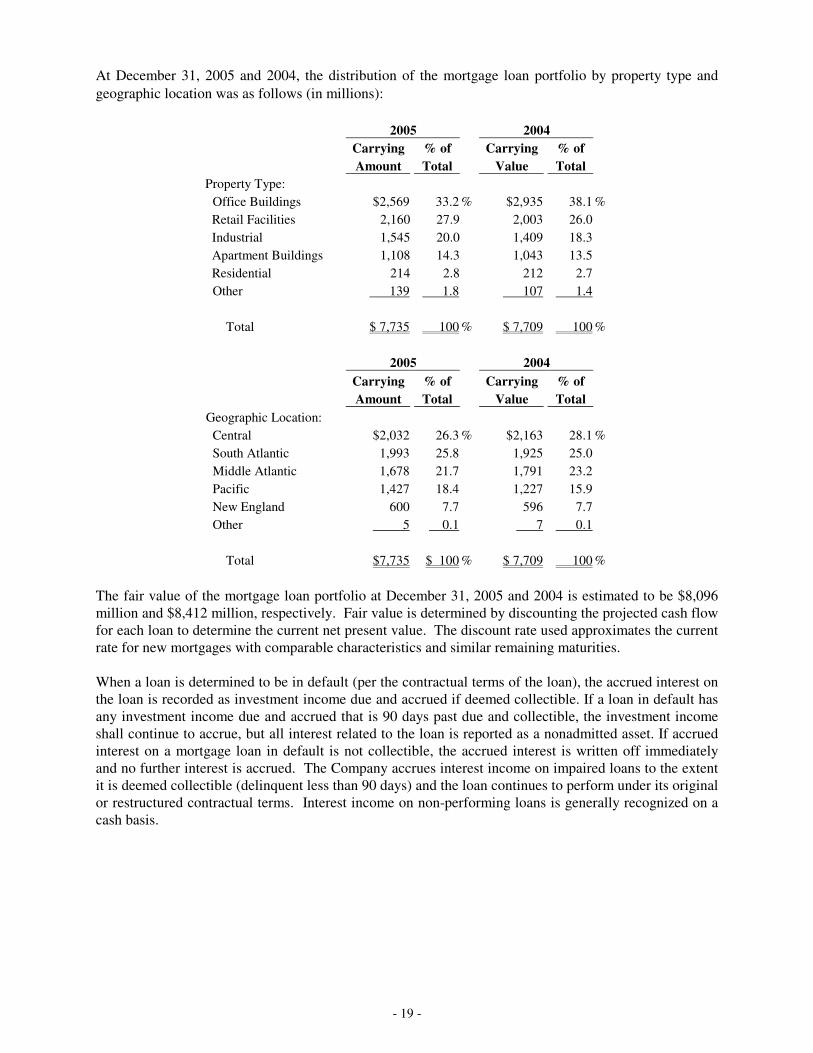
- 19 -
At December 31, 2005 and 2004, the distribution of the mortgage loan portfolio by property type and geographic location was as follows (in millions):
2005 2004 Carrying % of Carrying % of Amount Total Value Total Property Type: Office Buildings $2,569 33.2 % $2,935 38.1 % Retail Facilities 2,160 27.9 2,003 26.0 Industrial 1,545 20.0 1,409 18.3 Apartment Buildings 1,108 14.3 1,043 13.5 Residential 214 2.8 212 2.7 Other 139 1.8 107 1.4 Total $ 7,735 100 % $ 7,709 100 % 2005 2004 Carrying % of Carrying % of Amount Total Value Total Geographic Location: Central $2,032 26.3 % $2,163 28.1 % South Atlantic 1,993 25.8 1,925 25.0 Middle Atlantic 1,678 21.7 1,791 23.2 Pacific 1,427 18.4 1,227 15.9 New England 600 7.7 596 7.7 Other 5 0.1 7 0.1 Total $7,735 $ 100 % $ 7,709 100 %
The fair value of the mortgage loan portfolio at December 31, 2005 and 2004 is estimated to be $8,096
million and $8,412 million, respectively. Fair value is determined by discounting the projected cash flow for each loan to determine the current net present value. The discount rate used approximates the current rate for new mortgages with comparable characteristics and similar remaining maturities.
When a loan is determined to be in default (per the contractual terms of the loan), the accrued interest on
the loan is recorded as investment income due and accrued if deemed collectible. If a loan in default has any investment income due and accrued that is 90 days past due and collectible, the investment income shall continue to accrue, but all interest related to the loan is reported as a nonadmitted asset. If accrued interest on a mortgage loan in default is not collectible, the accrued interest is written off immediately and no further interest is accrued. The Company accrues interest income on impaired loans to the extent it is deemed collectible (delinquent less than 90 days) and the loan continues to perform under its original or restructured contractual terms. Interest income on non-performing loans is generally recognized on a cash basis.

- 20 -
Impaired mortgage loans at December 31, 2005 and 2004 were as follows (in millions):
2005 2004 Current year impaired loans with related allowance for credit losses $ - $ 122 Related allowance for credit losses - (34) Average recorded investment in impaired loans 61 97 Interest income recognized during the period 2 12 Interest income recognized on a cash basis during the period 2 11
The related allowance for credit losses for the years ended December 31, 2005 and 2004 are summarized below (in millions):
2005 2004 Beginning balance $ 34 $ 13 Additions charged to operations 13 30 Direct write-downs charged against the allowance (9) - Recoveries of amounts previously charged off (1) (3) Reduction due to sale (37) (6) Ending balance $ - $ 34
At December 31, 2005, the Company had no investments in restructured mortgage loans. For December 31, 2004, the Company had total investments in restructured mortgage loans of $45 million. Changes in the valuation allowance for mortgage loans are recorded as unrealized gains and losses. If the loan is determined to be other than temporarily impaired, a realized loss is recorded. In 2005 there was a $9 million restructured mortgage that was subsequently foreclosed. For 2004 there were no realized capital losses for restructured loans. During 2005 and 2004, no additional funds were committed to debtors whose terms have been modified. There were no allowances for credit losses on restructured loans for the years ended December 31, 2005 and 2004. Real Estate At December 31, 2005 and 2004, the Company's real estate portfolio, at carrying amount, consisted of the following (in millions):
2005 2004 Commercial:
Investment $ 164 $ 202 Acquired through foreclosure 46 13 Properties for Company use 280 247
Total real estate $ 490 $ 462
Accumulated depreciation on real estate at December 31, 2005 and 2004 was $232 million and $287 million, respectively. Depreciation expense for 2005 and 2004 totaled $19 million and $20 million, respectively, and was recorded as an investment expense, a component of net investment income in the accompanying Statutory Statements of Operations. The Company had losses due to changes in valuation allowances for real estate held for sale of $0 million and $13 million for 2005 and 2004, respectively.

- 21 -
Limited Partnerships and Other Long-Term Investments
Limited partnerships and other long-term investments primarily consist of limited partnership interests in venture capital, leveraged buy-out funds, limited liability companies and other equity investments. The underlying net equity of these investments amounted to $5,212 million and $5,455 million at December 31, 2005 and 2004, respectively. Net unrealized gains (losses) of $71 million and $(96) million for the years ended December 31, 2005 and 2004, respectively, were recorded on these investments. The Company recognized $24 million and $12 million in impairment write-downs on its investment in partnerships and limited liability companies at December 31, 2005 and 2004, respectively. At December 31, 2005, $151 million of investments in limited partnerships and limited liability companies were nonadmitted and charged to surplus in accordance with SSAP No. 88 since they did not obtain a GAAP audit. During 2000, the Company and its affiliates formed the New York Life Short Term Investment Fund, LP to improve short-term returns through greater flexibility to choose attractive maturities and enhanced portfolio diversification. The Company’s share of investments in the fund totaled $1,896 million and $2,344 million at December 31, 2005 and 2004, respectively, and are primarily invested in short-term U.S. government and agency securities, CDs, bankers acceptance notes and medium term floating rate notes, which maintained a weighted average maturity of thirty days. Included in Other Long-Term Investments is a loan agreement the Company has with Madison Capital Funding LLC ("MCF"). Under the agreement, the Company provides funding to MCF that is used to acquire third party loans and equity investments. See Note 6 “Related Party Transactions” for a more detailed discussion. Common and Preferred Stocks
Investments in subsidiaries and membership interests totaled $4,590 million and $3,760 million at December 31, 2005 and 2004, respectively. The Company records its share of gains or losses from subsidiaries, as unrealized gains or losses. In 2005 and 2004, the Company recorded net unrealized gains of $870 million and $101 million, respectively, which includes net unrealized gains attributable to ESI, from both direct and indirect holdings, of $741 million and $96 million. As discussed in Note 14 – Commitments and Contingencies – Borrowed Money, the Company has entered into a forward contract that obligates the Company to transfer a portion of these net unrealized gains to a third party. At December 31, 2005 and 2004, $501 million and $55 million were reflected as reductions to net unrealized capital gains under the forward contract. Investments in unaffiliated common stocks totaled $3,087 million and $3,081 million at December 31, 2005 and 2004, respectively. In 2005 and 2004, the Company recorded net unrealized gains of $34 million and $245 million, respectively. The carrying amount and fair value of preferred stocks at December 31, 2005 was $356 million and $383 million, respectively. The carrying amount and fair value of preferred stock at December 31, 2004 was $167 million and $191 million, respectively. Assets on Deposit or Pledged as Collateral Assets with a carrying value of $254 million and $235 million at December 31, 2005 and 2004, respectively, were on deposit with government authorities or trustees as required by certain state insurance laws and are included within related invested assets in the accompanying Statutory Statements of Financial Position. ESI common stock valued at $894 million and $410 million, at December 31, 2005

- 22 -
and 2004, respectively, were maintained as compensating balances or pledged as collateral for bank loans and other financing agreements. NOTE 4 - INVESTMENT INCOME AND CAPITAL GAINS AND LOSSES
The components of net investment income for the years ended December 31, 2005 and 2004 were as follows (in millions):
2005 2004 Bonds $ 3,452 $ 3,225 Mortgage loans 562 590 Affiliated common stocks 20 125 Unaffiliated common and preferred stocks 117 89 Real estate 86 99 Limited partnerships 277 161 Policy loans 349 366 Other long-term investments 146 89 Short-term investments 98 38 Derivatives 21 9 Other 17 19 Gross investment income 5,145 4,810 Investment expenses (394) (344) Net investment income 4,751 4,466 Amortization of IMR 83 98 Net investment income, including IMR $ 4,834 $ 4,564

- 23 -
For the years ended December 31, 2005 and 2004, realized capital gains and losses on sales computed under the specific identification method were as follows (in millions):
2005 2004 Gains Losses Gains Losses Bonds $ 288 $ 229 $ 406 $ 188 Mortgage loans 2 46 3 6 Unaffiliated common and preferred stocks 289 107 381 70 Real estate 586 1 87 13 Other long-term investments 42 45 11 12 Derivative instruments 55 56 35 44 Other 1 5 1 19 $ 1,263 $ 489 $ 924 $ 352 Net realized capital gains before tax and transfers to the IMR $ 774 $ 572 Less: Capital gains tax (223) (208) Net realized capital gains after tax transferred to the IMR (72)
(165)
Net realized capital gains after tax and transfers to the IMR $ 479 $ 199
In October 2005, the Company sold its investment in an apartment complex (known as “Manhattan House”) for $623 million, which generated a $582 million pre-tax realized capital gain. The following table provides a summary of other than temporary impairment losses included as realized capital losses (in millions):
2005 2004 Bonds $ (60) $ (76) Mortgage loans (9) - Unaffiliated common and preferred stocks (31) (16) Other long-term investments (24) (12)
$ (124) $ (104)
Proceeds from investments in bonds sold were $16,286 million and $22,014 million for the years ended December 31, 2005 and 2004, respectively.

- 24 -
The following table presents the Company’s gross unrealized losses and fair values for bonds and equities with unrealized losses that are not deemed to be other-than-temporarily impaired, aggregated by investment category and length of time that individual securities have been in an unrealized loss position, at December 31, 2005 and 2004 (in millions): 2005 Less than 12 months Greater than 12 months Total
Estimated Estimated EstimatedFair Unrealized Fair Unrealized Fair Unrealized
Value Losses Value Losses Value LossesBondsU.S. Treasury and U.S. Government Corporations $ 929 $ 13 $ 197 $ 7 $ 1,126 $ 20 U.S. agencies, state, and municipal 201 3 - - 201 3 Foreign governments 27 - 15 1 42 1 Corporate 9,797 235 2,533 141 12,330 376 Other mortgage-backed bonds 4,065 69 422 16 4,487 85 Other asset-backed bonds 2,365 15 531 10 2,896 25 Total Bonds 17,384 335 3,698 175 21,082 510
Equity Securities (Unaffiliated)Common Stock 369 21 - - 369 21 Preferred Stock 7 - - - 7 - Total Equity Securities 376 21 - - 376 21
Total temporarily impaired securities $ 17,760 $ 356 $ 3,698 $ 175 $ 21,458 $ 531
2004 Less than 12 months Greater than 12 months Total
Estimated Estimated EstimatedFair Unrealized Fair Unrealized Fair Unrealized
Value Losses Value Losses Value LossesBondsU.S. Treasury and U.S. Government Corporations $ 422 $ 5 $ 7 $ - $ 429 $ 5 U.S. agencies, state, and municipal 130 1 1 - 131 1 Foreign governments 9 - 15 - 24 - Corporate 3,716 51 1,835 91 5,551 142 Other mortgage-backed bonds 1,018 8 152 6 1,170 14 Other asset-backed bonds 1,646 7 148 7 1,794 14 Total Bonds 6,941 72 2,158 104 9,099 176
Equity Securities (Unaffiliated)Common Stock 273 13 - - 273 13 Preferred Stock 15 1 - - 15 1 Total Equity Securities 288 14 - - 288 14
Total temporarily impaired securities $ 7,229 $ 86 $ 2,158 $ 104 $ 9,387 $ 190
At December 31, 2005, bonds represented approximately 96% of the Company’s total unrealized loss amount, which was comprised of approximately 2,800 different securities. Equity securities comprised the remaining 4%, consisting of 185 securities.
- 25 -
Bonds that were in an unrealized loss position less than twelve months at December 31, 2005, represent $335 million or 63% of the Company’s total unrealized loss, and bonds in an unrealized loss position greater than twelve months represent $175 million or 33% of the Company’s total unrealized loss. Of the total amount of bond unrealized losses, $450 million or 85% is related to unrealized losses on investment grade securities. Investment grade is defined as a security having a credit rating from the NAIC of 1 or 2; a rating of Aaa, Aa, A or Baa from Moody’s or a rating of AAA, AA, A or BBB from Standard & Poor’s (‘‘S&P’’); or a comparable internal rating if an externally provided rating is not available. Unrealized losses on bonds with a rating below investment grade represent $81 million or 15% of the Company’s total unrealized losses. Unrealized losses on investment grade securities are principally related to changes in interest rates or changes in sector spreads from date of purchase. The continued rise in interest rates in 2005 over 2004 levels has contributed to the decline in value of our bond investments as follows: U.S. Treasury and Government Corporations and Agencies. The unrealized losses on the company’s investments in U.S. Treasury obligations and direct obligations of U.S. corporations and agencies were $23 million or 4% of the Company’s unrealized losses. These were spread across 126 securities and the decline in value was caused by interest rate increases. The contractual terms of these investments are guaranteed by the full faith and credit of the U.S. Government. Because the Company has the ability and intent to retain the investment for the period of time sufficient to allow for an anticipated recovery in value, the Company did not consider these investments to be other than temporarily impaired. Corporate Bonds. Unrealized losses on corporate bonds were $376 million or 74% percent of the total bond unrealized losses. The amount of unrealized losses on the Company’s investment in corporate bonds is spread over 1,503 individual securities with varying interest rates and maturities. Corporate securities that were priced below 95% of the security’s amortized cost represented $159 million or 31% of the total bond unrealized losses. These unrealized losses are principally due to changes in interest rates and were spread across all industry sectors with no one sector experiencing a disproportionate amount of losses over other sectors. The industry sectors with the largest unrealized losses on securities that were priced below 95% of the security’s amortized cost were Canadian paper products ($13 million), auto parts and supply industry ($11 million) and electric utilities ($9 million). Because the securities continue to meet their contractual payments and the Company has the ability and intent to retain the investment for the period of time sufficient to allow for an anticipated recovery in value, the Company did not consider these investments to be other than temporarily impaired. Mortgage-Backed Securities. Unrealized losses on mortgage-backed securities were $85 million or 17% percent of the total bond unrealized losses. The amount of unrealized losses on the Company’s investment in mortgage-backed securities was due to increases in interest rates. These losses are spread across approximately 570 fixed and variable rate investment grade securities. Mortgage-backed securities that were priced below 95% of the security’s amortized cost represented $6 million or 7% of the total unrealized losses for mortgage-backed securities. Because the decline in market value is attributable to changes in interest rates and all contractual payments remain current, the Company has the ability and intent to retain the investment for the period of time sufficient to allow for an anticipated recovery in value. Asset-Backed Securities. Unrealized losses on asset-backed securities were $25 million or 5% percent of the total bond unrealized losses. The unrealized losses on these investments are due to changes in interest rates. These losses are spread across approximately 392 securities. The Company measures its asset-backed portfolio for impairments based on the security’s credit rating and whether the security has an unrealized loss. When the fair value of the securities are below amortized cost and there are negative changes in estimated future cash flows, the securities are deemed impaired and a realized loss is recognized in net income in the accompanying Statutory Statement of Operations. The Company also evaluates these securities for impairments based on facts and circumstances, even if there has been no
- 26 -
negative change in estimated future cash flows. These securities are investment grade and are priced at or greater than 95% of amortized cost. NOTE 5 - DERIVATIVE FINANCIAL INSTRUMENTS AND RISK MANAGEMENT The Company uses derivative financial instruments to manage interest rate, currency, and market risk. These derivative financial instruments include foreign exchange forward contracts, commodity and interest rate and equity put options, equity total return swaps, interest rate swaps, credit default swaps and currency swaps. The Company does not engage in derivative financial instrument transactions for speculative purposes. The Company deals with highly rated counterparties and does not expect the counterparties to fail to meet their obligations under the contracts. The Company has controls in place to monitor credit exposures by limiting transactions with specific counterparties within specified dollar limits and assessing the creditworthiness of counterparties. The Company uses master netting agreements and adjusts transaction levels, when appropriate, to minimize risk. To further minimize risk, credit support annexes are negotiated as part of swap documentation entered into by the Company with counterparties. The credit support annex requires that a swap counterparty post collateral to secure that portion of its anticipated swap obligation in excess of a specified threshold. The threshold declines with a decline in the counterparties’ rating. Collateral received is invested in short-term investments. Notional or contractual amounts of derivative financial instruments provide a measure of involvement in these types of transactions and do not represent the amounts exchanged between the parties engaged in the transaction. The amounts exchanged are determined by reference to the notional amounts and other terms of the derivative financial instruments, which relate to interest rates, exchange rates, or other financial indices. The Company is exposed to credit-related losses in the event that a counterparty fails to perform its obligations under contractual terms. For contracts with counterparties where no master netting arrangements exist, in the event of default on the part of the counterparty, credit exposure is defined as the fair value of contracts in a gain position at the reporting date. Credit exposure to counterparties where a master netting arrangement is in place, in the event of default, is defined as the net fair value, if positive, of all outstanding contracts with each specific counterparty. Hedge Effectiveness To qualify as a hedge, the hedge relationship is designated and formally documented at inception detailing the particular risk management objective and strategy for the hedge which includes the item and risk that is being hedged, the derivative that is being used, as well as how effectiveness is being assessed. A derivative must be highly effective in accomplishing the objective of offsetting either changes in fair value or cash flows for the risk being hedged. The Company formally measures effectiveness of its hedging relationships both at the hedge inception and on an ongoing basis in accordance with its risk management policy. The hedging relationship is considered highly effective if the changes in fair value or discounted cash flows of the hedging instrument is within 80-125% of the inverse changes in the fair value of or discounted cash flows of the hedged item. The Company discontinues hedge accounting prospectively if; (i) it is determined that the derivative is no longer effective in offsetting changes in the fair value or cash flows of a hedged item, (ii) the derivative expires or is sold, terminated, or exercised, (iii) it is probable that the forecasted transaction will not occur, or (iv) management determines that designation of the derivative as a hedge instrument is no longer appropriate.

- 27 -
Cash flow hedges hedge the variability of cash flows related to floating rate securities, securities that are exposed to foreign exchange risk, and liabilities that are exposed to foreign exchange risk. The Company’s cash flow hedges primarily include hedges of floating rate securities and foreign currency denominated assets and liabilities. The assessment of hedge effectiveness for cash flow hedges of interest rate risk excludes amounts relating to risks other than exposure to the benchmark interest rate. Derivative instruments used in cash flow hedges that meet the criteria of a highly effective hedge are valued and reported in a manner that is consistent with the hedged asset or liability. The Company hedges the forecasted purchases of fixed rate securities. For 2005 and 2004, there were no gains and losses related to cash flow hedges of forecasted transactions that have been discontinued because it was no longer probable that the original forecasted transactions would occur by the end of the originally specified time period. For fair value hedges, in which derivatives hedge the fair value of assets and liabilities, changes in the fair value of derivatives are reported based on how the change in the fair value of the underlying asset or liability being hedged is reported. For derivative instruments which hedge the foreign currency exposure of a net investment in a foreign operation that meet the criteria of an effective hedge, the change in the fair value is reflected in unrealized gains and losses as part of the foreign currency translation adjustment. Derivatives that do not meet the criteria of an effective hedge that are hedging the net investment of a foreign operation are carried at fair value with changes in fair value reflected in unrealized gains and losses. Unrealized losses for derivatives hedging foreign currency exposure on foreign operations of $32 million and $14 million were reported for the years ended December 31, 2005 and 2004, respectively. Derivative instruments that do not meet the criteria of an effective hedge are accounted for at fair value and the changes in the fair value recorded in surplus as unrealized gains or losses, net of deferred tax. Interest Rate Risk Management The Company enters into various types of interest rate contracts primarily to minimize exposure of specific assets and liabilities held by the Company to fluctuations in interest rates. Interest rate swaps are agreements with other parties to exchange, at specified intervals, the difference between fixed-rate and floating-rate interest amounts calculated by reference to an agreed notional amount. Generally, no cash is exchanged at the onset of the contract and no principal payments are made by either party. A single net payment is usually made by one counterparty at each interest due date. Swap contracts outstanding at December 31, 2005 are between 2 years and 30 years to maturity. At December 31, 2004, such contracts were between 5 years and 30 years to maturity. The Company does not act as an intermediary or broker in interest rate swaps. Fair values of interest rate swaps were $92 million and $87 million at December 31, 2005 and 2004, respectively, based on the net present value of cash flows discounted at current rates. At December 31, 2005 and 2004, the carrying value of interest rate swaps was $16 million and $0, respectively. Interest rate option contracts entered into by the Company hedge the risk of increasing interest rates on policyholder liability obligations. The Company will receive payments from counterparties should an agreed upon interest rate level be reached. Payments will continue to increase under the option contract until an agreed upon interest rate ceiling. Changes in market values of open contracts are recognized in surplus as unrealized gains or losses, net of deferred taxes. At December 31, 2005, the Company had 1 open contract at a notional amount of $920 million with a fair value and carrying value of $5 million. The Company did not have any interest rate option contracts at December 31, 2004.

- 28 -
The following table summarizes the notional amounts and credit exposures of interest rate related derivative transactions (in millions):
2005 2004 Notional Credit Notional Credit Amount Exposure Amount Exposure
Interest Rate Swaps $2,049 $92 $1,042 $87 Interest Rate Options $ 920 $ 5 $ - $ -
Currency Risk Management The Company enters into foreign currency swaps and foreign exchange forward contracts primarily as a hedge against foreign currency fluctuations. The primary purpose of the Company's foreign currency hedging activities is to protect it from the risk that the value of foreign currency denominated assets and liabilities and net investments in foreign subsidiaries will be adversely affected by changes in exchange rates. At December 31, 2005 the Company had 40 open contracts for foreign currency swaps in 7 currencies at a notional amount of $4,346 million, with a fair value of $58 million and a carrying value of $(20) million. At December 31, 2004 the Company had 29 open contracts for foreign currency swaps in 6 currencies at a notional amount of $3,131 million, with a carrying value of $446 million and a fair value of $500 million. The Company’s foreign exchange forward contracts involve the exchange of 5 currencies at a specified future date and at a specified price. The average term of the contracts is three to six months. No cash is exchanged at the time the agreement is entered into. At December 31, 2005, the Company had 18 open foreign exchange forward contracts at a notional amount of $166 million, with a fair value and carrying value of $(1) million, which has been recorded as a liability in the accompanying Statutory Statements of Financial Position. At December 31, 2004, the Company had 24 open foreign exchange forward contracts at a notional amount of $236 million, with a carrying value and a fair value of $(6) million. The Company did not have any outstanding purchased or written foreign currency options as of December 31, 2005 and December 31, 2004. Market Risk Management The Company enters into total return equity swaps and equity put options to minimize exposure to the market risk associated with underlying equities, mutual funds and liabilities. In addition, the Company uses commodity options to hedge the impact of higher oil prices on limited partnership investments. At December 31, 2005, the Company had 1 open contract of total return equity swaps at a notional amount of $39 million and a fair value and a carrying value of $(214) thousand and 12 open contracts of commodity options at a notional amount of $2,384 million, and a fair value and carrying value of $40 million. At December 31, 2005, the Company had 13 open contracts of equity put options at a notional value of $6 million and a fair value and carrying value of $23 thousand. Replication Transactions The Company entered into derivative transactions as part of replicated synthetic asset transactions. As part of the replications, the Company entered into credit default swaps to reproduce otherwise permissible investments. At December 31, 2005, the Company had 17 open derivative contracts at a notional amount of $170 million, with a fair value of $(1) million and a carrying value of $0. At December 31, 2004, the Company had 18 open derivative contracts at a notional amount of $216 million, with a fair value of $4 million and a carrying value of $4 million.

- 29 -
NOTE 6 – RELATED PARTY TRANSACTIONS For the years ended December 31, 2005 and 2004, the Company made the following capital contributions to its insurance and holding company subsidiaries (in millions):
2005 2004 NYLIAC $ - $ - NYLAZ - - NYLIFE LLC - 39 NYLIM 6 7 NYLI 96 104 HAIER 4 2 Total
$106
$152
Pursuant to the plan of liquidation adopted in 2001, New York Life International, Inc. was dissolved effective December 31, 2005. Effective December 31, 2005, New York Life International, Inc.’s Taiwan and Argentina subsidiaries were transferred to New York Life International, LLC. On April 27, 2005, NYLI and the Company entered into a Participation Agreement related to NYLI’s direct investment in Class C shares of the New York Life International India Fund (Mauritius) LLC. In accordance with the Participation Agreement, the Company advanced $4 million to NYLI towards the partial purchase price of the Class C shares for the right to receive a 52.63% beneficial interest in such shares. In addition, the Company agreed to fund expenses attributable to such beneficial interest in such Class C shares and also agreed to receive any distribution annually through NYLI and participate in any capital call relating to the payment of management fees and other fund expenses by funding payment directly to NYLI on a pro-rata annual basis. On August 24, 2004, NYLIFE LLC distributed a dividend of $115 million to the Company. The dividend results from the sale of NYLIFE LLC’s indirect ownership interest in Life Assurance Holding Corporation to Swiss Re GB plc (Swiss Re). The Company received dividend distributions from NYLIM of $20 million during 2005 and $10 million during 2004, respectively, which is included in Net Investment Income on the Statutory Statements of Operations. During 2004, the Company made a contribution to NYLIFE LLC in the amount of $25 million for the purchase of an aircraft from Bombardier Aerospace Corporation. As discussed in Note 14, the Company has a lease agreement with NYLIFE LLC for the use of this aircraft. The Company has a loan agreement with NYLI associated with proceeds deposited with the Company from capital contributions. NYLI did not have an immediate need for the cash and as a result, loaned the proceeds to the Company to earn a return based on the general account investments. Interest is credited quarterly at an effective annual interest rate of 5% less an investment management fee of 5.5 basis points. The investment income earned on the loan balance is capitalized to the loan. The effective termination date of this arrangement is March 31, 2006, but either party may also terminate this arrangement with a minimum 3 months notice. During 2005 and 2004, interest expense of $2 million and $1 million, respectively, was capitalized to the loan resulting in an outstanding payable to NYLI of $60 million at December 31, 2005. During 2004, the Company received $1 million each from NYLIFE LLC and NYLI, respectively, as returns of capital. On April 15, 2004, the Company issued a Funding Agreement to NYLIM, whereby NYLIM purchased guaranteed interest contracts in the amount of $80 million from the Company.

- 30 -
During August 2003, the Company transferred without recourse several private placement debt securities to Madison Capital Funding (“MCF”). MCF is a wholly-owned subsidiary of NYLIM Holdings LLC, which is in turn a wholly-owned subsidiary of the Company. MCF paid for the purchase price of the securities transferred by delivering to the Company promissory notes with terms identical to the securities transferred. At December 31, 2005 and 2004, the outstanding balance payable to the Company totaled $24 million and $25 million, respectively. During 2005 and 2004, the Company received interest payments from MCF totaling $2 million each year, which is included in Net Investment Income on the accompanying Statutory Statements of Operations. In March 2005, the Company formed five entities in which the Company has a controlling interest: Tribeca Holdings I LLC (“Tribeca I”), Bluewater Holdings I LLC (“Bluewater I”), Gramercy Holdings I LLC (“Gramercy I”), Union Investments I LP (“Union I”) and 29 Park Investments No. 1 Limited (“29 Park No. 1”). These entities were formed to facilitate 29 Park No. 1’s 65% participation, in an aggregate purchase of a $364 million par value pool of investment grade, US dollar denominated medium term notes (“MTNs”) issued by ten foreign issuers and arranged on behalf of 29 Park No. 1 by Barclays Bank plc (”Barclays”). To fund the purchase of the MTNs, on May 26, 2005, the Company purchased ten credit-linked notes issued by Tribeca I for a total purchase price of $356 million, which amount was simultaneously loaned by Tribeca I to Union I, who in turn contributed such funds to 29 Park No. 1, for its purchase of ten MTNs with a total principal value of $364 million. The other entities, Bluewater I and Gramercy I, each had ancillary roles in these investment arrangements. The Company has a revolving loan agreement dated April 16, 2001, as amended, with MCF to provide funding to MCF in an amount up to $1,800 million. The amount loaned cannot exceed 3% of the Company’s admitted assets of December 31 the prior year. Terms of the loan specify that quarterly interest be paid on 85% of the outstanding balance in cash based on the 90 day LIBOR rate plus a spread based on an agreed formula, with interest on the remaining 15% compounded quarterly. Effective June 1, 2003, the MCF loan agreement was amended to provide that a portion of the loan used to acquire equity investments would earn interest at 10% per annum, payable quarterly. The principal balance and compounded interest is not due until maturity in April 2011. The Company recorded $72 million and $46 million in interest income for the years ended December 31, 2005 and 2004, respectively. At December 31, 2005 and 2004, the Company had outstanding loans receivable from MCF of $1,163 million and $1,057 million, respectively. These amounts are included with Other Long-Term Investments on the accompanying Statutory Statements of Financial Position. The Company executed a promissory note with NYLIFE LLC, dated August 22, 2001, whereby NYLIFE LLC loaned the Company $239 million. The note has a par value of $243 million and an interest rate of 3.3% per annum. Interest on the note is payable quarterly until maturity on August 21, 2011. During 2005 and 2004, the Company made $8 million in coupon interest payments each year. At December 31, 2005 and 2004, the amount due under this note, which is included with Borrowed Money on the accompanying Statutory Statements of Financial Position, totaled $242 million and $241 million, respectively, and included $1 million of accrued interest for each year. New York Life Capital Corporation (“NYLCC”), a wholly-owned subsidiary of NYLIFE, LLC, entered into a credit agreement with the Company dated October 1, 1997, as amended, whereby NYLCC has agreed to make loans to the Company in an amount up to, but not exceeding, $2 billion from the issuance of commercial paper. During 2005 and 2004, the Company recorded interest expense of $14 million and $9 million, respectively. At December 31, 2005 and 2004, the Company had a loan payable to NYLCC of $500 million and $266 million, respectively, which is included with Borrowed Money on the accompanying Statutory Statements of Financial Position.
The Company has entered into Investment Advisory and Administrative Services Agreements with its affiliate, New York Life Investment Management LLC, to provide investment advisory and

- 31 -
administrative services to the Company. At December 31, 2005 and 2004, the total cost to the Company for these services amounted to $103 million and $83 million, respectively. The Company has agreed to provide certain of its direct and indirect subsidiaries with certain services and facilities including but not limited to the following: accounting, tax and auditing services, legal services, actuarial services, electronic data processing operations, and communications operations. The Company is reimbursed for the identified costs associated with these services and facilities. Such costs amounting to $963 million and $917 million for the years ended December 31, 2005 and 2004, respectively, were incurred by the Company and billed to its subsidiaries. At December 31, 2005 and 2004, the Company reported a net amount of $168 million and $224 million, respectively, due from subsidiaries and affiliates. Generally, the terms of the settlement require that these amounts be settled in cash within ninety days. As of December 31, 2005, an executive and a retired executive of the Company were also directors of ESI. ESI is a pharmacy benefit management company that performs services for the Company that are not material to the Company’s financial condition or results of operations. The Company has purchased various Corporate Owned Life Insurance policies from affiliated entities, including two purchases totaling $527 million made during 2004, for the purpose of informally funding certain benefits for the Company’s employees and agents. These policies were issued to the Company on the same basis as policies sold to unrelated customers. For the years ended December 31, 2005 and 2004, the cash surrender value of these policies amounted to $2,261 million and $2,078 million, respectively, and is included with Other Assets on the accompanying Statutory Statements of Financial Position. The Company owns all rights, title, interest in, and to certain structured settlement annuity contracts issued by its subsidiary NYLIAC. The carrying value of the annuity contracts is based upon the actuarially determined value of the obligations under the structured settlement contracts (noted below), which generally have some life contingent benefits. The Company is the assumed obligor for certain structured settlement agreements with unaffiliated insurance companies, beneficiaries and other non-affiliated entities. To satisfy its obligations under these agreements, the Company owns single premium annuities issued by NYLIAC. The obligations are based upon the actuarially determined present value of expected future payments. Interest rates used in establishing such obligations range from 5.50% to 8.75%. The Company has directed NYLIAC to make the payments under the annuity contracts directly to the beneficiaries under the structured settlement agreements. At December 31, 2005 and 2004, the carrying value of the annuity contracts and the corresponding obligations amounted to $153 million and $151 million, respectively. The Company compensates NYLIAC for policy credits associated with converting the Company’s term policies and term riders to universal life policies that are issued by NYLIAC without any additional underwriting. For the years ended December 31, 2005 and 2004, $17 million and $15 million, respectively, was paid to NYLIAC.

- 32 -
NOTE 7 – SIGNIFICANT SUBSIDIARY NYLIAC is engaged in the life and annuity businesses. A summary of NYLIAC's statutory basis statement of financial position at December 31, 2005 and 2004 and results of operations for the years then ended are as follows (in millions):
2005 2004 Assets:
Bonds $ 34,942 $ 32,152 Mortgage loans and real estate 3,552 3,038 Separate account assets 14,800 13,486
Other 7,022 7,607 Total assets $ 60,316 $ 56,283
Liabilities and Surplus:
Policy reserves $ 32,096 $ 28,536 Separate account liabilities 14,729 13,420 Other liabilities 11,334 12,318 Capital and surplus 2,157 2,009
Total liabilities and surplus $ 60,316 $ 56,283 Results of Operations:
Net gain from operations $ 229 $ 228 Net realized capital gain (losses) 2 (4)
Net income $ 231 $ 224
NOTE 8 - INSURANCE LIABILITIES Policy Reserves And Deposit Funds Liabilities Reserves for life insurance policies are maintained principally using the 1941, 1958, and 1980 Commissioners' Standard Ordinary (“CSO”) Mortality Tables under the net level premium method or the Commissioners' Reserve Valuation Method (“CRVM”) with valuation interest rates ranging from 2.0% to 6.0%. Reserves for supplementary contracts involving life contingencies and annuities involving current mortality risks are based principally on 1951, 1971, 1983 Group Annuity Mortality (“GAM”), 1960 Mod. a-49, 1971 Individual Annuity Mortality (“IAM”), 1983 Table A, A2000 and the Commissioners’ Annuity Reserve Valuation Method (“CARVM”) with assumed interest rates ranging from 2.5% to 11.25%. Generally, owners of annuities in payout status are not able to withdraw funds from their policies at their discretion. Reserves for accident and health policies are valued consistent with interest rate and morbidity tables, where applicable. The Company waives deductions of deferred fractional premiums upon death of the insured and returns a portion of the final premium beyond the date of death. No surrender values are promised in excess of the total reserves. Certain substandard policies are valued on tables that are multiples of the standard table. Other substandard policies are valued as equivalent to standard lives on the basis of insurance age. Additional reserves are held on account of anticipated extra mortality for policies subject to extra premiums. Tabular Interest credited to policy reserves for all other lines of business, except group annuities has been determined by formula as described in the NAIC instructions. For group annuities, tabular interest has been determined from the basic data for the calculation of policy reserves. The Tabular less Actual Reserve Released has been determined by formula as described in the NAIC instructions for all lines of

- 33 -
business. The Tabular Cost for Individual Life Insurance for 7 Year Term, for certain Survivorship Whole Life policies, and for ancillary coverages has been determined by formula as described in the NAIC instructions. For all other coverages, including the bulk of Individual Life, the Tabular Cost has been determined from the basic data for the calculation of policy reserves. The Tabular Interest on funds not involving life contingencies is generally the interest actually credited to or accrued on such funds.
At December 31, 2005 and 2004, the Company had $8,065 million and $7,626 million respectively, of insurance in force for which the gross premiums are less than the net premiums according to the standard of valuation set by the state of New York.
GICs with life contingencies totaled $4,390 million and $5,129 million with a weighted average interest rate of 4.76% and 5.04% at December 31, 2005 and 2004, respectively. The weighted average remaining maturity was 2 years, 2 months and 2 years, 3 months at December 31, 2005 and 2004, respectively. Withdrawal prior to maturity is generally subject to 60 days deferral of payment and involves penalties if interest rates increased since contract issuance. Deposit fund liabilities include GICs without life contingencies (i.e. funding agreements) issued by the Company, including those funding agreements issued to special purpose entities (“SPE”) and totaled $13,676 million and $11,026 million at December 31, 2005 and 2004 respectively. The weighted average interest rate was 4.47% and 3.35% at December 31, 2005 and 2004, respectively. The weighted average remaining maturity was 2 years, 7 months and 2 years, 8 months at December 31, 2005 and 2004, respectively. Withdrawal prior to maturity is generally not permitted. Included with funding agreements are amounts sold to SPEs which purchase the funding agreements with the proceeds of medium term notes having payment terms substantially identical to the funding agreements issued to the SPE. At December 31, 2005 and 2004, the balance under funding agreements sold by the Company to the SPEs was $7,525 million and $5,284 million, respectively. The weighted average interest rate for all GICs was 4.54% and 3.89% at December 31, 2005 and 2004, respectively. Similarly, the combined weighted average remaining maturity was 2 years, 6 months and 2 years, 6 months, at December 31, 2005 and 2004, respectively. For GICs and annuities certain, fair values are estimated using discounted cash flow calculations, based on interest rates currently being offered for similar contracts with maturities consistent with those remaining for the contracts being valued. For dividend accumulations and other deposit contracts, fair value is equal to account value. The fair value of the Company's deposit fund liabilities at December 31, 2005 and 2004 were $16,594 million and $14,062 million, respectively. In 2005, AARP Group Life reserves were strengthened for two blocks of business by $7 million to provide additional reserve adequacy. Reserves for guaranteed acceptance products, which were valued using the 1980 CSO Table without adjustment, were increased to reflect the use of mortality rates to a level consistent with experience. Also, reserves on major plans previously valued at a 4.5% interest rate were strengthened by reducing the valuation interest rate to 4%. During 2005 and 2004, in light of the low interest rate environment, the Company lowered the valuation interest rates on structured settlement contracts with a 2004 and 2003 years of issue, resulting in an increase in statutory reserves. The change in reserve valuation basis resulted in a $119 million and $96 million charge to surplus for the years ended December 31, 2005 and 2004, respectively. The Company has a $16 million liability at December 31, 2005 ($43 million at December 31, 2004) relating to Guaranteed Separate Accounts and Synthetic GICs valued under New York State Regulation 128, which generally requires that a liability be accrued when the market value of the guaranteed separate

- 34 -
accounts is less than the minimum value of contractual liabilities. The Company records the change in this liability as a component of surplus. Accordingly, $27 million of gains and $9 million of losses were recorded in surplus for the years ended December 31, 2005 and 2004, respectively.
The following table reflects the withdrawal characteristics of annuity reserves and deposit fund liabilities (in millions):
2005 2004 % of % of Amount Total Amount Total
Subject to discretionary withdrawal: With market value adjustment $7,486 19 % $7,876 22 % At market value 3,503 9 3,593 10 Total with adjustment or at market value 10,989 28 11,469 32 At book value without adjustment 1,974 5 1,979 6 Not subject to discretionary withdrawal provisions 25,631 67 22,314 62 Total annuity reserves and deposit fund liabilities $38,594 100 % $35,762 100 %
- 35 -
NOTE 9 - SEPARATE ACCOUNTS Guaranteed Separate Accounts The Company currently maintains guaranteed separate accounts with assets of $3,646 million and $3,612 million at December 31, 2005 and 2004, respectively. Of these amounts, $3 million was maintained each year in supplemental separate accounts. The Company has market value separate accounts and separate accounts maintained on a book value basis where assets are carried at amortized cost. These assets are invested primarily in investment grade mortgage-backed securities and short-term securities. The supplemental separate account assets are used to fund the excess of the actuarial liability for future guaranteed payments over the market value of the assets for these contracts. Market value separate accounts funding guaranteed benefits provide either a guarantee tied to an index or a guarantee of principal and interest. For accounts where the guarantee is tied to an index, at contract discontinuance, the contract holder is entitled to the guaranteed amount plus one-half of the excess performance. If the market value of the assets is less than the guaranteed amount, the contract holder is entitled to an immediate payout of market value, or an installment payout of the guaranteed amount. For the market value separate accounts that provides a minimum guaranteed interest rate, at contract discontinuance, the contract holder is entitled to an immediate payout of market value, or an installment payout of the guaranteed amount. A book value separate account guarantees principal and interest. At contract discontinuance, the contract holder is entitled to the guaranteed amount, if the market value of the assets exceeds the guaranteed amount. If the market value of the assets is less than the guaranteed amount, the contract holder is entitled to an immediate payout of market value, or an installment payout of the guaranteed amount. Certain guaranteed market value separate accounts are tied to an index, if the return on the contract exceeds the index, the contract holder shares the excess performance equally with the Company. The excess performance is retained in the Separate Accounts, until the contract is terminated, and the Company reflects the amount in surplus. For the years ended December 31, 2005 and 2004, the Company reflected changes of $(5) million and $13 million related to undistributed gains and losses on these contracts. Non-Guaranteed Separate Accounts The Company currently maintains non-guaranteed separate accounts with assets of $2,274 million and $2,143 million at December 31, 2005 and 2004, respectively. These separate accounts primarily include the Company's retirement and pension plans assets and are invested in common stock, long-term bonds, limited partnerships and short-term securities.
Separate Accounts funding non-guaranteed benefits provide no guarantee of principal or interest, and payout is at market value at contract discontinuance.

- 36 -
Information regarding separate accounts of the Company for the years ended December 31, 2005 and 2004 is as follows (in millions):
2005 Non-indexed Non-indexed Non-guaranteed Guarantee Less Guarantee Separate
Indexed than/Equal to
4% More
than 4% Accounts Total Premiums and considerations $ - $ 853 $ - $ 98 $ 951 Reserves:
For accounts with assets at: Market value $ 1,179 $ 82 $ - $ 2,242 $ 3,503 Amortized cost - 2,129 - - 2,129 Total reserves $ 1,179 $ 2,211 $ - $ 2,242 $ 5,632 By withdrawal characteristics: With market value adjustment $ - $ 2,129 $ - $ - $ 2,129 At market value 1,179 82 - 2,242 3,503 Total reserves $ 1,179 $ 2,211 $ - $ 2,242 $ 5,632
2004 Non-indexed Non-indexed Non-guaranteed Guarantee Less Guarantee Separate
Indexed than/Equal to
4% More
than 4% Accounts Total Premiums and considerations $ - $ 785 $ - $ 91 $ 876 Reserves: For accounts with assets at: Market value $ 1,408 $ 79 $ - $ 2,107 $ 3,594 Amortized cost - 1,851 - - 1,851 Total reserves $ 1,408 $ 1,930 $ - $ 2,107 $ 5,445 By withdrawal characteristics: With market value adjustment $ - $ 1,851 $ - $ - $ 1,851 At market value 1,408 79 - 2,107 3,594 Total reserves $ 1,408 $ 1,930 $ - $ 2,107 $ 5,445
The following is a reconciliation of net transfers to or (from) the Company to the Separate Accounts (in millions):
2005 2004 Transfers as reported in the Separate Accounts Statement: Transfers to Separate Accounts $ 952 $ 876 Transfers from Separate Accounts (1,058) (907) Reinsurance Assumed 11 ( 124) Net transfers from the Separate Accounts $ (95) $ (155)

- 37 -
NOTE 10 - FEDERAL INCOME TAXES Significant components of current federal income taxes incurred for the years ended December 31, 2005 and 2004 were as follows (in millions):
2005 2004 Current income tax expense: Current year U.S. income tax $ (102) $ 70 Current year foreign income tax 1 1 Current income tax incurred (101) 71 Capital gains tax incurred 223 208 Total current income taxes incurred $ 122 $ 279
The components of the net deferred tax asset are as follows (in millions):
December 31, 2005
December 31, 2004
Gross deferred tax assets (DTAs) $ 2,003 $ 2,027 Gross deferred tax liabilities (DTLs) (865) (634) Net deferred tax asset $ 1,138 $ 1,393 Net deferred tax assets non-admitted $ 648 $ 912 Net admitted deferred tax asset $ 490 $ 481
Decrease in net deferred taxes nonadmitted $ (264) $ (128)
- 38 -
Net deferred tax assets are nonadmitted primarily because they are not expected to be realized within one year of the balance sheet date. The admitted portion of the net deferred tax asset is included in Other Assets on the accompanying Statutory Statements of Financial Position.
December 31, 2005
December 31, 2004
Increase/ (Decrease)
DTAs resulting from book/tax differences in:
Policy reserves $ 552 $ 639 $ (87) Deferred acquisition costs 425 416 9 Employee and agent benefits 504 462 42 Nonadmitted assets 63 48 15 Dividend provision 350 336 14 Investments 94 103 (9) Other 15 23 (8)
Gross deferred tax asset $ 2,003 $ 2,027 $ (24)
DTLs resulting from book/tax differences in:
Investments $ 865 $ 634 $ 231
Gross deferred tax liability $ 865 $ 634 $ 231
Net deferred tax asset $ 1,138 $ 1,393 $ (255)
Deferred tax on unrealized gains (losses) $ 101 Change in deferred income tax
$ (154)

- 39 -
The Company’s income tax expense/(credit) for the years ended December 31, 2005 and 2004, differs from the amount obtained by applying the statutory rate of 35% to net gain from operations after dividends to policyholders and before federal income taxes for the following reasons (in millions):
2005 2004 Net Gain From Operations after Dividends to Policyholders And Before Federal Income Taxes at 35% $ 216 $ 300 Net realized capital gains at 35% 270 200 Amortization of IMR (29) (34) Tax exempt income (36) (39) Dividends from subsidiaries (7) (44) Changes in reserve on account of change in valuation basis (44) (34)
Prior period corrections (34) (25)
Change in nonadmitted assets (15) (21)
Tax credits (net) (50) (46)
Contiguous country branch income (7) (3)
Accruals in surplus (11) (11)
Audit liability provision 21 18
Other 2 (20)
Income Tax Incurred and Change in Net Deferred Tax Asset During Period $ 276 $ 241 Federal income taxes reported on the Statutory Statements of Operations $ (101) $ 71 Capital gains tax incurred 223 208 Change in net deferred income tax 154 (38) Total statutory income taxes $ 276 $ 241
The Company’s federal income tax returns are routinely audited by the Internal Revenue Service (“IRS”) and provisions are made in the financial statements in anticipation of the results of these audits. The IRS has completed audits through 1998 and is auditing tax years 1999 through 2001. There were no material effects on the Company’s Statutory Statements of Operations as a result of these audits. The Company believes that its recorded income tax liabilities are adequate for all open years. The Company has no net operating loss carryforwards. The total income taxes incurred in current and prior years that will be available for recoupment in the event of future net losses are $186 million, $200 million and $101 million at December 31, 2005, 2004 and 2003, respectively. As discussed in Note 2-Significant Accounting Policies-Federal Income Taxes, the Company’s federal income tax return is consolidated with NYLIAC, NYLAZ, NYLIFE LLC, NYLI and NYLIM. At December 31, 2005 and 2004 the Company recorded a current income tax payable of $190 million and $128 million, respectively, which was included in Other Liabilities in the accompanying Statutory Statements of Financial Position.

- 40 -
NOTE 11 – REINSURANCE The Company enters into reinsurance agreements in the normal course of its insurance business to reduce overall risk. The Company remains liable for reinsurance ceded if the reinsurer fails to meet its obligation on the business it has assumed. The Company evaluates the financial condition of its reinsurers to minimize its exposure to significant losses from reinsurer insolvencies. Life insurance reinsured was 18% and 20% of total life insurance in-force at December 31, 2005 and 2004, respectively. The reserve reductions taken for life insurance reinsured at December 31, 2005 and 2004 were $295 million and $328 million, respectively. In December 2004, the Company assumed 90% of a block of inforce life insurance business from its wholly-owned subsidiary, NYLIAC. A total reserve of $5,656 million consisting of Universal Life, Variable Universal Life, Target Life and Asset Preserver products was assumed using a combination of coinsurance with funds withheld for the fixed portion maintained in the General Account and modified coinsurance (“MODCO”) for policies in the Separate Accounts. Under both the MODCO and Funds Withheld treaties, NYLIAC will retain the assets held in relation to the reserves. A $25 million ceding commission was paid by the Company at the inception of the treaty. An experience refund will be paid to NYLIAC at the end of each accounting period for 100% of profits in excess of $5 million. During 2004, the Company recaptured policies it had reinsured with Generali USA Life Reassurance (Generali). The amounts associated with the recapture are shown below (in millions):
Amount
Premiums $ 14 Commissions and expense allowance on reinsurance ceded (3) Increase in reserves (34) Impact of Generali recapture (pre-tax)
$(23)
On January 19, 2000, the Company entered into a modified coinsurance reinsurance agreement with Paul Revere Life Insurance Company (“Paul Revere”) whereby Paul Revere reinsures 100% of the Company’s individual disability income business with an effective date of January 1, 2000. The Company received consideration of $88 million, resulting in a deferred gain of $54 million after taxes that is amortized into net gain over a twenty-year period. During 2005 and 2004, $3 million was amortized each year into net gain leaving $37 million at December 31, 2005 to be amortized in future years. The Company has reinsurance agreements with NYLARC. NYLARC is a life insurance company wholly owned by NYLARC Holding Company, Inc., whose shareholders consist of the Company’s top agents who meet certain criteria and who may also be agents of NYLIAC or NYLAZ. NYLARC reinsures a portion of certain life insurance products sold by its shareholders. NYLARC’s purpose is to retain high production agents, and increase the volume and quality of the business that they submit to the Company, NYLIAC and NYLAZ. The Company has reinsured certain policies with unauthorized companies that prevent it from recognizing full reinsurance credit. Since these reinsurers are not recognized in the state of New York, and the receivable owed to the Company is not secured by cash, securities or other permissible collateral, the Company established a liability equal to the net credit received. At December 31, 2005 and 2004, $6 million and $2 million was held as a liability to offset the net reinsurance credit. The change in the

- 41 -
liability is reflected as a direct adjustment to surplus and totaled $(4) million and $(1) million for the years ended December 31, 2005 and 2004, respectively. NOTE 12 – SURPLUS Surplus Notes On May 5, 2003, the Company issued Surplus Notes (“Notes”) with a principal balance of $1 billion, bearing interest at 5.875%, and a maturity date of May 15, 2033. Proceeds from the issuance of the Notes were $990 million, net of discount. The Notes were issued pursuant to Rule 144A under the Securities Act of 1933, as amended, and are administered by CitiBank as registrar/paying agent. Interest on these Notes is scheduled to be paid semiannually on May 15 and November 15 of each year. Cumulative interest paid through December 31, 2005 totaled $148 million. As part of the Notes offering, the New York State Insurance Department required the Company to establish a special reserve in the amount of 10% of the face amount of the Notes, or $100 million. This reserve (reported in Other Liabilities on the accompanying Statutory Statements of Financial Position) was required for the payment of post closing amounts, including any amounts the Company may have to pay as a result of its agreement to indemnify the underwriters for certain potential claims arising out of the issuance of the Notes. To date, there have been no claims. The reserve can be reduced in equal increments of 1/9 of the initial reserve amount, or $11 million, on May 15, 2006, May 15, 2007 and May 15, 2008, and be completely eliminated after six years (on May 15, 2009), if no claims arise. No reduction to the reserve can be made prior to May 15, 2006. Drawdowns of the reserve will be reflected as increases to surplus.
Previously, on December 15, 1993, the Company issued Notes with a principal balance of $300 million, bearing interest at 7.50% and a maturity date of December 2023. These Notes were also issued pursuant to Rule 144A under the Securities Act of 1933, as amended, and were administered by U.S. Bank as registrar/paying agent. Proceeds from the issuance of the Notes were $297 million, net of related issuance costs. In 2001, $175 million of the 7.50% Surplus Note was repaid, resulting in an outstanding balance of $125 million. On January 13, 2005, the Company received approval from the Superintendent of Insurance of the State of New York ("Superintendent") to redeem the entire remaining outstanding par value of $125 million in Surplus Notes. The total redemption price paid on February 22, 2005 was $130 million consisting of the par value of the Surplus Notes, a premium of $4 million and accrued interest of $1 million. The Notes are unsecured and subordinated to all present and future indebtedness, policy claims and other creditor claims of the Company. Under New York Insurance Law, the Notes are not part of the legal liabilities of the Company. The Notes do not repay principal prior to maturity. Each payment of interest or principal may be made only with the prior approval of the Superintendent and only out of surplus funds, which the Superintendent determines to be available for such payments under New York Insurance Law. Provided that approval is granted by the Superintendent, the 5.875% Notes may be redeemed at the option of the Company at any time at the “make-whole” redemption price equal to the greater of the principal amount of the Notes to be redeemed, or the sum of the present values of the remaining scheduled interest and principal payments, excluding accrued interest as of the date on which the Notes are to be redeemed, discounted to a semi-annual basis at the adjusted treasury rate plus 20 basis points.
At December 31, 2005 and 2004, there were no affiliates that held any portion of the Notes. In addition, at December 31, 2005 and 2004 there were no entities which held 10% or more of the 5.875% Notes.

- 42 -
Other Surplus Adjustments As part of the disposal of the Company’s NYLCare operations to Aetna in 1998, a receivable was established for reimbursement of the Cost Stabilization Reserve (CSR) the Company was entitled to receive. The CSR represented the excess premiums previously paid to NYLCare to cover potential adverse experience or to reduce future premium levels. However, the receivable was inadvertently recorded twice resulting in an overstatement to assets and surplus of $5 million. Therefore, in 2005, one of the accruals was released and recorded as a prior period correction in surplus. During 2004, the Company discovered an error in the method used to estimate losses associated with collaterally assigned life insurance policies, whereby the Company agrees to pay all premiums due on behalf of the policyholder. The Company can recover the cost of the premiums paid from any death benefit exceeding the face amount, or if the policy is surrendered, the Company can recover the entire premium paid from any proceeds payable to the policyholder. An asset is established for the gross amount of premiums paid and represents the interest the Company has in the policy. Prior to 2004, a valuation loss was recorded against the carrying value of the asset for the portion of the asset that the Company deemed unrecoverable. In addition, the Company nonadmitted any amount of the collateral assignment that was unsecured by policy values. In 2004, the Company determined that the valuation loss held was insufficient since it did not fully consider losses from investment earnings. The collateral asset and surplus has been reduced $30 million to correct for this item in 2004.
The Company provides certain life insurance benefits to executive officers during employment and after
retirement. Prior to 2004, the Company underaccrued the cost associated with providing this benefit. As a result of correcting for this item, the postretirement obligation has been increased $38 million. Under the cost sharing arrangement the Company has with its subsidiaries, $14 million of this adjustment has been billed to subsidiaries, resulting in a net surplus adjustment to the Company of $(24) million in 2004.
Prior to 2004, the Company expensed postemployment benefits on a pay-as-you go basis instead of establishing an accrual over the participant's service period. As a result of correcting for this item, the postemployment obligation has been increased $23 million. Under the cost sharing arrangement the Company has with its subsidiaries, $7 million of this adjustment has been billed to subsidiaries, resulting in a net surplus adjustment to the Company of $(16) million in 2004. Other increases or (decreases) in the Statutory Statements of Changes in Surplus includes the effects of the following (in millions):
2005 2004 Regulation 128 reserve – Note 8 $ 27 $ (9) Ceding commission – Note 11 (3) (3) Additional minimum liability – Note 13 (21) (14) Separate account surplus – Note 9 (5) 13 Reinsurance in unauthorized companies – Note 11 (4) (1) Total $ (6) $ (14)
Cumulative unrealized gains, gross of deferred taxes, recognized in unassigned surplus was $1,317 million and $927 million, respectively, as of December 31, 2005 and 2004. Nonadmitted Assets Under statutory accounting rules, a nonadmitted asset is defined as an asset having economic value other than that which can be used to fulfill policyholder obligations, or those assets which are unavailable due to encumbrances or other third party interests. In addition, some assets are nonadmitted because they do not conform to the laws and regulations of New York. These assets are not recognized on the Statutory
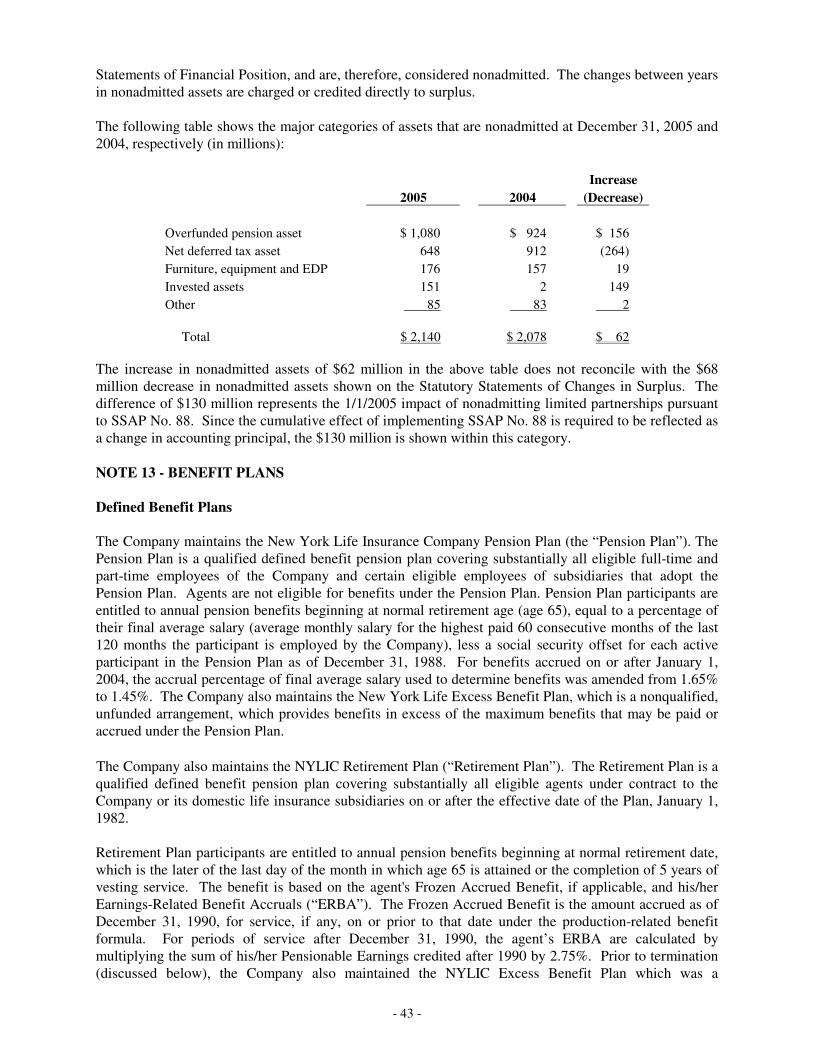
- 43 -
Statements of Financial Position, and are, therefore, considered nonadmitted. The changes between years in nonadmitted assets are charged or credited directly to surplus.
The following table shows the major categories of assets that are nonadmitted at December 31, 2005 and 2004, respectively (in millions):
Increase 2005 2004 (Decrease) Overfunded pension asset $ 1,080 $ 924 $ 156 Net deferred tax asset 648 912 (264) Furniture, equipment and EDP 176 157 19 Invested assets 151 2 149 Other 85 83 2 Total $ 2,140 $ 2,078 $ 62
The increase in nonadmitted assets of $62 million in the above table does not reconcile with the $68 million decrease in nonadmitted assets shown on the Statutory Statements of Changes in Surplus. The difference of $130 million represents the 1/1/2005 impact of nonadmitting limited partnerships pursuant to SSAP No. 88. Since the cumulative effect of implementing SSAP No. 88 is required to be reflected as a change in accounting principal, the $130 million is shown within this category. NOTE 13 - BENEFIT PLANS Defined Benefit Plans The Company maintains the New York Life Insurance Company Pension Plan (the “Pension Plan”). The Pension Plan is a qualified defined benefit pension plan covering substantially all eligible full-time and part-time employees of the Company and certain eligible employees of subsidiaries that adopt the Pension Plan. Agents are not eligible for benefits under the Pension Plan. Pension Plan participants are entitled to annual pension benefits beginning at normal retirement age (age 65), equal to a percentage of their final average salary (average monthly salary for the highest paid 60 consecutive months of the last 120 months the participant is employed by the Company), less a social security offset for each active participant in the Pension Plan as of December 31, 1988. For benefits accrued on or after January 1, 2004, the accrual percentage of final average salary used to determine benefits was amended from 1.65% to 1.45%. The Company also maintains the New York Life Excess Benefit Plan, which is a nonqualified, unfunded arrangement, which provides benefits in excess of the maximum benefits that may be paid or accrued under the Pension Plan.
The Company also maintains the NYLIC Retirement Plan (“Retirement Plan”). The Retirement Plan is a qualified defined benefit pension plan covering substantially all eligible agents under contract to the Company or its domestic life insurance subsidiaries on or after the effective date of the Plan, January 1, 1982. Retirement Plan participants are entitled to annual pension benefits beginning at normal retirement date, which is the later of the last day of the month in which age 65 is attained or the completion of 5 years of vesting service. The benefit is based on the agent's Frozen Accrued Benefit, if applicable, and his/her Earnings-Related Benefit Accruals (“ERBA”). The Frozen Accrued Benefit is the amount accrued as of December 31, 1990, for service, if any, on or prior to that date under the production-related benefit formula. For periods of service after December 31, 1990, the agent’s ERBA are calculated by multiplying the sum of his/her Pensionable Earnings credited after 1990 by 2.75%. Prior to termination (discussed below), the Company also maintained the NYLIC Excess Benefit Plan which was a

- 44 -
nonqualified, unfunded arrangement that provided (i) benefits in excess of the maximum benefits that may be paid or accrued under the NYLIC Retirement Plan and (ii) amounts to certain eligible agents whose retirement benefit under the NYLIC Retirement Plan is less than their Senior NYLIC Income so that the total of their retirement benefit under the NYLIC Retirement Plan and the additional amount is equivalent to their Senior NYLIC Income. Further, the Company has entered into a settlement agreement in Lucich v. New York Life Insurance Co., No. 01-CIV-1747 (S.D.N.Y.). Pursuant to the settlement agreement, (i) the NYLIC Retirement Plan’s benefit formula was amended and prospectively changed for certain participants resulting in certain non-qualified payments becoming payable from the Plan on a prospective basis; (ii) the NYLIC Excess Benefit Plan was terminated; and (iii) the Company established new nonqualified, unfunded arrangements to provide benefits in excess of the maximum benefits that may be paid or accrued under the NYLIC Retirement Plan. The Pension Plan and the Retirement Plan are funded solely by Company contributions. The Company's funding policy for each of these Plans is to make annual contributions that are no less than the minimum amount needed to comply with the requirements of the Employee Retirement Income Security Act of 1974, as amended (“ERISA”), and no greater than the maximum amount deductible for federal income tax purposes. The Company made contributions to the Pension Plan in 2005 and 2004 of $145 million and $52 million, respectively. Contributions to the Retirement Plan in 2005 and 2004 were $95 million and $0 million. The assets of the Pension Plan and Retirement Plan are maintained in separate trusts issued to each plan. Each plan currently invests in two group annuity contracts: one contract is an immediate participation guarantee contract relating to the Company’s general account (“GA Contract”), and the other contract relates to pooled separate accounts (“SA Contract”). Each plan's investments in the GA Contract and the SA Contract are held in the separate trust established under each Plan. The Company is the issuer of the GA and SA Contracts and NYLIM is the investment manager of the pooled separate accounts under the SA Contract. The GA Contract provides for the payment of an annual administrative charge based on a percentage of the assets maintained in the fixed account under the contract. The SA Contract provides for the payment of separate annual fees for the management of each separate account. Grantor Trusts The Company has established separate irrevocable grantor trusts covering certain of the Company’s separate nonqualified arrangements for agents and employees to help protect nonqualified payments thereunder in the event of a change in control of the Company. The grantor trusts are not subject to ERISA. Other Postretirement Benefits
The Company’s Group Plan for New York Life Employees provides certain health and life insurance benefits for eligible retired employees and their eligible dependents. Employees who retired prior to January 1, 1993 do not make contributions toward retiree health and life coverages. Employees who retired on or after January 1, 1993 may be required to contribute towards medical (other than certain prescription drug coverage) and dental coverage. The Company’s Group Plan for New York Life Agents provides certain health and life insurance benefits for eligible retired agents and their eligible dependents. The Company pays the entire non-contributory and contributory life insurance costs for retired agents. For active agents, the contribution towards contributory life insurance is based on the agent class (current, first prior, second prior or third prior), age, level of benefits and location of residence.

- 45 -
Agents who retired under the Nylic Retirement Plan prior to January 1, 1993 and agents who retired under the Nylic Retirement Plan after December 31, 1992 but either had completed 30 or more years of service or at least age 70 as of that date, are not required to make contributions for health care coverage. Eligible agents who retire on or after January 1, 1993, but did not have 30 or more years of service with the Company or reach age 70 as of December 31, 1992 may be required to contribute towards medical (other than certain prescription drug coverage) and dental coverage.
The Company has established a Voluntary Employees Beneficiary Association Trust (“VEBA Trust”) in connection with medical and life benefits for eligible retired employees (“Retired Employee VEBA Trust”) and a VEBA Trust in connection with medical and life benefits for eligible retired agents (“Retired Agent VEBA Trust”; the “Retired Employee VEBA Trust” and the “Retired Agent VEBA Trust” are collectively referred as the “VEBA Trusts”). A portion of the cost of the medical (other than certain prescription drug coverage), dental coverage and life premiums for eligible retired individuals and their eligible dependents is paid by a combination of the VEBA Trusts’ assets and contributions by the eligible retired individuals. The remaining balance of these costs is paid by the Company. It has been the Company's practice to prefund postretirement benefits to the extent allowable for federal income tax purposes. Prefunding contributions are made to the Retired Employee VEBA Trust and the Retired Agent VEBA Trust, which is used to partially fund postretirement health and life benefits other than pensions. Prefunding contributions to the Retired Employee VEBA Trust totaling $1.5 million and $1.3 million were made in 2005 and 2004, respectively. Prefunding contributions to the Retired Agent VEBA Trust totaling $0.7 million and $1.4 million were made in 2005 and 2004, respectively. The assets of each VEBA Trust are invested in the mutual funds issued by Eclipse Funds, Inc., in Trust Owned Life Insurance (“TOLI”) and in government securities. NYLIM is the investment advisor of these Eclipse Funds. These TOLI policies are Corporate Sponsored Universal Life (“CSUL”) and Corporate Sponsored Variable Universal Life (“CSVUL”) issued by NYLIAC. CSVUL policy premiums are invested in variable products of mutual funds managed by NYLIM. The Company shares the cost of certain postretirement life and health benefits for retired employees and agents including their eligible dependents with its subsidiaries. The expenses for these plans are allocated to each subsidiary in accordance with an intercompany cost sharing arrangement. The liabilities for these plans are included with the liabilities for the corresponding plan of the Company. On December 8, 2003, President Bush signed the Medicare Prescription Drug, Improvement, and Modernization Act of 2003 (the Act) into law. The Act introduces a prescription drug benefit under Medicare beginning in 2006. Under the Act, employers who sponsor postretirement plans that provide prescription drug benefits that are actuarially equivalent to Medicare Part D qualify to receive subsidy payments.
In 2004, the NAIC issued INT 04-17, which adopts the conclusions reached in the FASB’s GAAP guidance FSP 106-2, Accounting and Disclosure Requirements Related to the Medicare Prescription Drug, Improvement, and Modernization Act of 2003, with some modifications. In accordance with INT 04-17, the Company remeasured its plan assets and Accumulated Postretirement Benefit Obligation (“APBO”) as of January 1, 2004 to account for the subsidy and other effects of the Act. The reduction in the APBO for the subsidy related to past service was $56 million. The reduction in postretirement benefit costs for the impact of the Act was $6 million and has been reflected as an increase to surplus in 2004.

- 46 -
The tables below are for financial reporting purposes only and do not reflect the status of the assets of each of the Pension Plan and the Retirement Plan under applicable law. Also, the pension information presented in the accompanying tables has not been remeasured to reflect the Lucich settlement, which occurred after the 9/30/2005 measurement date since it did not have a material impact to the funding status or pension expense (in millions):
Other Pension Plan Benefits Postretirement Plan Benefits 2005 2004 2005 2004 Change in projected benefit obligation: Projected benefit obligation at beginning of year $ 3,617 $ 3,317 $ 819 $ 788 Service cost 96 87 29 27 Interest cost 212 204 47 50 Contributions by plan participants - - 2 2 Actuarial (gains)/losses 322 164 86 26 Benefits paid (170) (155) (51) (50) Plan amendments 8 - (12) - Impact of Medicare subsidy (at 1/1/04) N/A N/A - (56) Executive life insurance liability N/A N/A - 32 Projected benefit obligation at end of year1 $4,085 $3,617 $ 920 $ 819
Change in plan assets: Fair value of plan assets at beginning of year $2,746 $2,536 $ 395 $ 388 Actual return on plan assets 370 301 34 31 Contributions by employer 264 64 32 24 Contributions by plan participants - - 2 2 Benefits paid (170) (155) (51) (50) Fair value of plan assets at end of year1 $3,210 $2,746 $ 412 $ 395
Funded status $ (875) $ (871) $ (508) $ (424) Unamortized prior service cost 42 40 1 3 Unrecognized net (gain)/loss 1,445 1,327 277 192 Remaining net obligation at transition - - 62 82 Contributions by employer 2 5 10 9 Intangible asset2 (5) (2) - - Accumulated charge to surplus (53) (32) - - Prepaid (accrued) benefit cost $ 556 $ 467 $ (158) $ (138) 3 Impact of Medicare reform on Statutory Surplus N/A N/A - 6 Prepaid (accrued) benefit cost $ 5562 $ 4672 $ (158) $ (132) Benefit obligation for non-vested participants4 $ - $ - $ 278 $ 228 Accumulated Benefit obligation for all defined pension plans at December 311 $ 3,598 $ 3,167
1 For both 2005 and 2004, a September 30th measurement date was used. 2 Prepaid (accrued) benefit cost and the intangible asset are nonadmitted assets and are therefore, not included in total assets on the Statutory Statements of Financial Position. 3 The postretirement benefit obligation shown is the amount before reduction for the Medicare subsidy received effective January 1, 2004. 4 The benefit obligation for non-vested participants shown above is not accrued in the accompanying financial statements of the Company consistent with statutory guidance and is presented for informational purposes only.

- 47 -
An additional minimum liability adjustment is required when the accumulated benefit obligation exceeds plan assets or accrued pension liabilities. The additional minimum pension liability, less allowable intangible assets, net of tax benefit, is reported as a reduction to surplus. At December 31, 2005, the Company reflected an additional net minimum liability (“AML”) of $48 million ($32 million in 2004) for the New York Life Excess Benefit Plan and $5 million for the NYLIC Excess Benefit Plan ($0 in 2004). The increase in the AML during 2005 was $21 million and has been reflected as a direct reduction to surplus. The components of net periodic benefit costs were as follows (in millions):
Pension Other Postretirement Plan Benefits Plan Benefits 2005 2004 2005 2004 Components of net periodic benefit cost: Service cost $ 96 $ 87 $ 29 $ 27 Interest cost 212 204 47 50 Expected return on plan assets (236) (243) (31) (33) Amortization of net asset at transition - - 10 10 Amortization of (gains)/losses 69 51 5 6 Amortization of prior service cost/(credit) 7 7 - 1
Executive life insurance N/A N/A - (6) Net periodic benefit cost $ 148 $ 106 $ 60* $ 55*
* Includes postretirement costs billed to subsidiaries $25 million for each of the years ended December 31, 2005 and 2004. Weighted-average assumptions used to determine benefit obligations at: Other Pension Postretirement Plan Benefits Plan Benefits 2005 2004 2005 2004 Weighted-average assumptions used to determine benefit obligations*:
Discount rate 5.40% 6.00% 5.40% 6.00% Expected return on plan assets 8.25% 8.25% 7.25%/7.75%** 7.25%/7.75%** Rate of compensation increase: Employees 5.40% 5.42% 5.40% 5.42% Agents 5.60% 6.77% N/A N/A *For both 2005 and 2004, a September 30 measurement date was used. **Expected return on plan assets is 7.25% for health benefits and 7.75% for life benefits

- 48 -
Weighted-average assumptions used to determine net periodic benefit cost for the years ended December 31:
Other Pension Postretirement Plan Benefits Plan Benefits 2005 2004 2005 2004 Weighted-average assumption used to determine net periodic benefit cost:
Discount rate 6.00% 6.25% 6.00% 6.25% Expected return on plan assets 8.25% 8.50% 7.25%/7.75%** 7.50% Rate of compensation increase: Employees 5.42% 5.42% 5.42% 5.42% Agents 6.77% 6.77% N/A N/A **Expected return on plan assets is 7.25% for health benefits and 7.75% for life benefits
The discount rates used for the Company’s defined benefit and other post retirement plans are selected by reference to the Moody's Corporate Aa rate which has a similar duration to the duration of the benefit obligations of the Company’s plans. The determination of the annual rate of increase in the per capita cost of covered health care benefits for medical and prescription drug plans is determined separately for participants under age 65 and for those age 65 and older. For dental plans, the annual rate of increase in the per capita cost utilizes a single rate for all participants. In 2005, the annual rate of increase in the per capita cost of covered health care medical benefits was assumed to be 9.00% for all participants. The annual rate of increase in the per capita cost of covered health care prescription drug benefits was assumed to be 13.00% for all participants. For the 2005 measurements, the rate was assumed to decline to 5.00% by 2010 for medical benefits and to 5.00% by 2014 for prescription drug benefits and remain at that level thereafter. For dental plans, the annual rate of increase in the per capita cost of covered health care benefits is assumed to be 5.00% for all participants and remain at that level thereafter. In 2004, the annual rate of increase in the per capita cost of covered health care medical and prescription drug benefits was assumed to be 8.00% for those under age 65 and 10.00% for those age 65 and older. For the 2004 measurements, the rate was assumed to decline gradually to 5.00% by 2008 for those under age 65 and by 2010 for those age 65 and older and remain at that level thereafter. For dental plans, the annual rate of increase in the per capita cost of covered health care benefits is assumed to be 5.00% for all participants and remain at that level thereafter.

- 49 -
Assumed health care cost trend rates have a significant effect on the amounts reported for the health plan. A one percentage point increase or decrease in assumed health care cost trend rates would have the following effects (in millions):
2005 One Percent
Increase
2005 One Percent
Decrease Effect on total of service and interest cost components $ 11 $ (9) Effect on accumulated postretirement obligations 99 (81)
The weighted-average asset allocation for the agent and employee defined benefit pension plans at September 30, 2005 and 2004, and target allocations by asset category are as follows:
Target Allocation
Percentage Of Plan Assets
2005 2005 2004 Fixed Income
40%
45%
45%
Equity Securities 60 55 55 Total 100% 100% 100%
Equity securities, including common stock, amount to $1,779 million (55% of total assets of the plans) and $1,520 million (55% of total assets of the plans) at September 30, 2005 and 2004 respectively.
The Investment Committees of the Agent and Employee Defined Benefit Pension Plans have established a broad investment strategy targeting an asset allocation of 60% equity and 40% fixed income. Diversifying each asset class by style and type further enhances this allocation. In developing this asset allocation strategy, the Committees took into account, among other factors, the information provided to it by the plans’ actuary, information relating to the historical investment returns of each asset class, the correlations of those returns and input from the plans’ investment consultant. The Committees regularly review the plans’ asset allocation vs. the targets and makes adjustments as appropriate. The Committees regularly review the investment performance of each of the sub portfolios to insure the assets are meeting each plan’s objectives. The Company’s weighted-average asset allocation for the other postretirement benefit plan at September 30, 2005 and 2004, and target allocations by asset category under the VEBA Trusts are as follows:
Target Allocation Percentage Percentage of VEBA Trust Assets
2005 2005 2004 Health Life Health Life Health Life Fixed Income Securities 30% 30% 43% 28% 48% 30% Equity Securities 70 70 57 72 52 70 Total 100% 100% 100% 100% 100% 100%
Equity securities, including common stock, amount to $245 million (61% of total VEBA Trust Life and Health assets) and $219 million (57% of total VEBA Trust Life and Health assets) at September 30, 2005 and 2004, respectively.
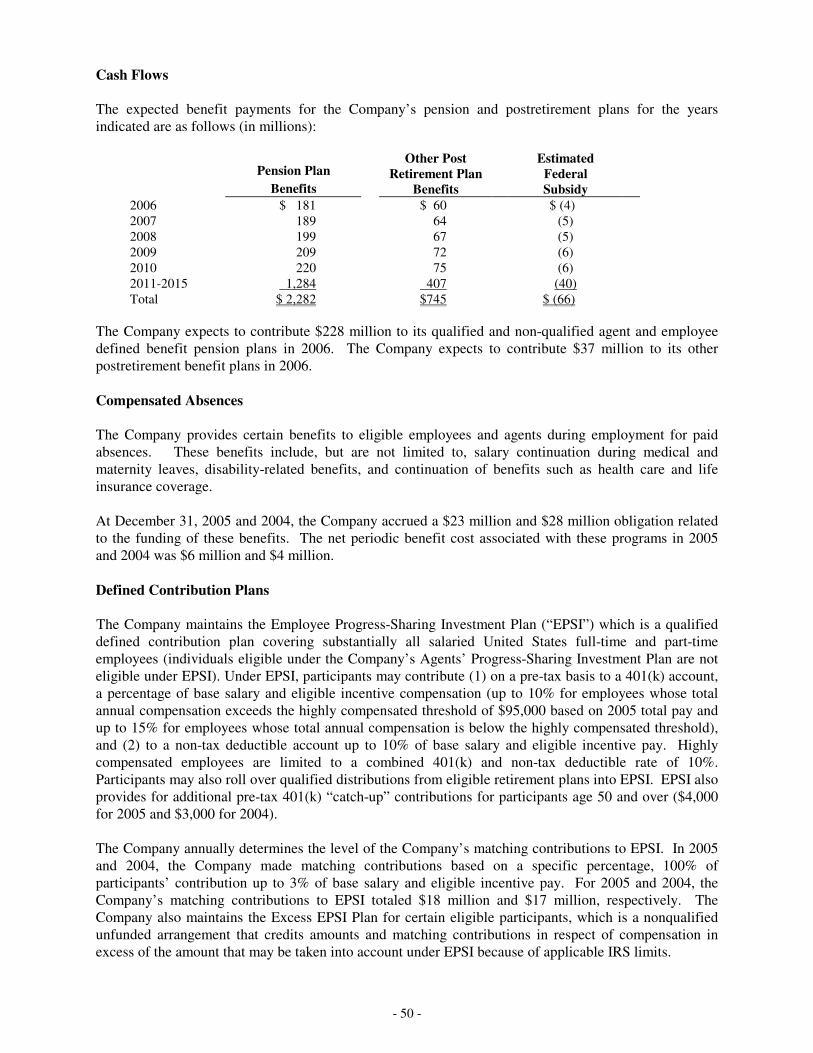
- 50 -
Cash Flows The expected benefit payments for the Company’s pension and postretirement plans for the years indicated are as follows (in millions):
Pension Plan Benefits
Other Post
Retirement Plan Benefits
Estimated
Federal Subsidy
2006 $ 181 $ 60 $ (4) 2007 189 64 (5) 2008 199 67 (5) 2009 209 72 (6) 2010 220 75 (6) 2011-2015 1,284 407 (40) Total $ 2,282 $745 $ (66)
The Company expects to contribute $228 million to its qualified and non-qualified agent and employee defined benefit pension plans in 2006. The Company expects to contribute $37 million to its other postretirement benefit plans in 2006. Compensated Absences The Company provides certain benefits to eligible employees and agents during employment for paid absences. These benefits include, but are not limited to, salary continuation during medical and maternity leaves, disability-related benefits, and continuation of benefits such as health care and life insurance coverage. At December 31, 2005 and 2004, the Company accrued a $23 million and $28 million obligation related to the funding of these benefits. The net periodic benefit cost associated with these programs in 2005 and 2004 was $6 million and $4 million. Defined Contribution Plans The Company maintains the Employee Progress-Sharing Investment Plan (“EPSI”) which is a qualified defined contribution plan covering substantially all salaried United States full-time and part-time employees (individuals eligible under the Company’s Agents’ Progress-Sharing Investment Plan are not eligible under EPSI). Under EPSI, participants may contribute (1) on a pre-tax basis to a 401(k) account, a percentage of base salary and eligible incentive compensation (up to 10% for employees whose total annual compensation exceeds the highly compensated threshold of $95,000 based on 2005 total pay and up to 15% for employees whose total annual compensation is below the highly compensated threshold), and (2) to a non-tax deductible account up to 10% of base salary and eligible incentive pay. Highly compensated employees are limited to a combined 401(k) and non-tax deductible rate of 10%. Participants may also roll over qualified distributions from eligible retirement plans into EPSI. EPSI also provides for additional pre-tax 401(k) “catch-up” contributions for participants age 50 and over ($4,000 for 2005 and $3,000 for 2004). The Company annually determines the level of the Company’s matching contributions to EPSI. In 2005 and 2004, the Company made matching contributions based on a specific percentage, 100% of participants’ contribution up to 3% of base salary and eligible incentive pay. For 2005 and 2004, the Company’s matching contributions to EPSI totaled $18 million and $17 million, respectively. The Company also maintains the Excess EPSI Plan for certain eligible participants, which is a nonqualified unfunded arrangement that credits amounts and matching contributions in respect of compensation in excess of the amount that may be taken into account under EPSI because of applicable IRS limits.

- 51 -
The Company also maintains the Agents’ Progress-Sharing Investment Plan (“APSI”) which is a defined contribution plan covering substantially all contracted United States full-time agents (individuals eligible under the EPSI are not eligible under APSI). Under APSI, participants make contributions by entering into commission reduction agreements with the Company whereby a percentage of their compensation (for the 2005 plan year up to 7% for agents whose total annual compensation exceeds the highly compensated threshold of $95,000 based on 2005 total pay and up to 15% for agents whose total compensation is below the highly compensated threshold) may be contributed to a 401(k) account. Participants may also roll over qualified distributions from eligible retirement plans into APSI. APSI also provides for additional pre-tax 401(k) “catch-up” contributions for participants age 50 and over ($4,000 for 2005 and $3,000 for 2004). The Company annually determines the level of the Company’s contributions to APSI. Contributions are based on the participants' net renewal commissions, net renewal premiums and cash values for the plan year on policies for which the participant is the original writing agent. In 2005 and 2004, the Company’s contributions to APSI totaled $2 million in each year. The Company also maintains the Excess APSI Plan, which is a nonqualified, unfunded arrangement that credits Company contributions in excess of the maximum Company contributions that may be made under APSI because of certain applicable IRS limits. NOTE 14 - COMMITMENTS AND CONTINGENCIES Support and Credit Agreements The Company has a revolving loan agreement dated April 16, 2001, as amended, with MCF to provide funding to MCF in an amount up to $1,800 million. The amount loaned cannot exceed 3% of the Company's admitted assets of December 31 of the prior year. Refer to Note 6 for details regarding loans extended to MCF under this agreement. The Company has a support agreement dated September 28, 1995, with its wholly owned affiliate NYLCC to maintain NYLCC’s tangible net worth in the amount of at least $1. NYLCC serves as a conduit to the credit markets for the Company and its affiliates, and is authorized to issue commercial paper in an aggregate principal amount not to exceed $2 billion. The Company has a Credit Agreement dated January 1, 1995 with NYLIFE LLC. The maximum amount available to NYLIFE LLC is $200 million. During 2005, the credit facility was not used, no interest was paid and there was no outstanding balance was due. On August 11, 2004, the Company entered into a Credit Agreement with NYLAZ, whereby NYLAZ is able to borrow up to $10 million from the Company for short-term liquidity needs. During 2005, the credit facility was not used, no interest was paid and there was no outstanding balance due.
The Company has a Credit Agreement with NYLIAC, dated September 30, 1993, as amended, whereby NYLIAC may borrow from the Company up to $490 million. During 2005, the credit facility was not used, no interest was paid and there was no outstanding balance due.
In addition, the Company has a Credit Agreement with NYLIAC, dated April 1, 1999, as amended, in which the Company may borrow from NYLIAC up to $490 million. During 2005, the credit facility was not used, no interest was paid and there was no outstanding balance due. In connection with structured settlement agreements issued to its subsidiary, NYLIAC, the Company has guaranteed the payments due to unaffiliated third parties in the event of NYLIAC’s insolvency. The Company’s estimated maximum exposure under such agreements is approximately $4,609 million and $4,193 million at December 31, 2005 and 2004, respectively.

- 52 -
On August 22, 2001, NYLIFE LLC entered into a ten-year Shared Appreciation Income Linked Securities ("SAILS") transaction with Credit Suisse First Boston International (“CSFBI”). The transaction allows NYLIFE LLC to protect its downside risk on 9 million shares of ESI while maintaining the ability to share in a portion of its future appreciation during a ten-year period. Under the terms of the transaction, NYLIFE LLC is liable to deliver up to 9 million ESI shares or settle in cash with a value determined based on the average market price of the ESI shares during the 20 trading days beginning 30 exchange business days immediately prior to the August 22, 2011 delivery date. According to the terms of the agreement, NYLIFE LLC receives a minimum value of $27.03 per share and 100% of the appreciation in the shares up to $35.14 per share. CSFBI will receive approximately 77% of the appreciation of ESI stock in excess of $35.14 per share. The Company has guaranteed the obligations of NYLIFE LLC under the agreement with CSFBI. The price per share and number of shares in the foregoing paragraph have been adjusted for a two for one stock split effective June 24, 2005. In 2003, following the entering into of the SAILS II agreement with CSFBI described in Note 14 – Borrowed Money, the Company agreed to lend CSFBI up to 11,000,000 shares of ESI common stock. As of December 31, 2005, CSFBI had borrowed 10,941,000 shares with a market value of $917 million. These transactions were fully collateralized with the right of offset against the Company’s liability to CSFBI according to the collateral agreement. At December 31, 2005, the carrying amount of the lent shares was $889 million. At December 31, 2005 and 2004, contractual commitments to extend credit under commercial and residential mortgage loan agreements totaled $373 million and $233 million, respectively. These commitments are diversified by property type and geographic location. At December 31, 2005 and 2004, the Company had outstanding contractual obligations to acquire additional private placement securities amounting to $166 million and $115 million, respectively. Unfunded commitments on limited partnerships and limited liability corporations, excluding MCF amounted to $1,918 million and $1,360 million at December 31, 2005 and 2004, respectively. Litigation The Company and/or its subsidiaries are defendants in individual and/or alleged class action suits arising from their agency sales force, insurance (including variable contracts registered under the federal securities law), investment, retail securities, employment and and/or other operations, including actions involving retail sales practices. The Company is also a defendant in a suit regarding employee and agent benefits where a portion of the case, specifically the breach of fiduciary claims, has been certified as a class by agreement of the parties. The remainder of the claims in that suit have not been certified. Most of the actions seek substantial or unspecified compensatory and punitive damages. The Company and/or its subsidiaries are also from time to time involved in various governmental, administrative and investigative proceedings and inquiries. Notwithstanding the uncertain nature of litigation and regulatory inquiries, the outcome of which cannot be predicted, the Company believes that, after provisions made in the financial statements, the ultimate liability that could result from litigation and proceedings would not have a material adverse effect on the Company’s financial position; however, it is possible that settlements or adverse determinations in one or more actions or other proceedings in the future could have a material adverse effect on the Company’s operating results for a given year.
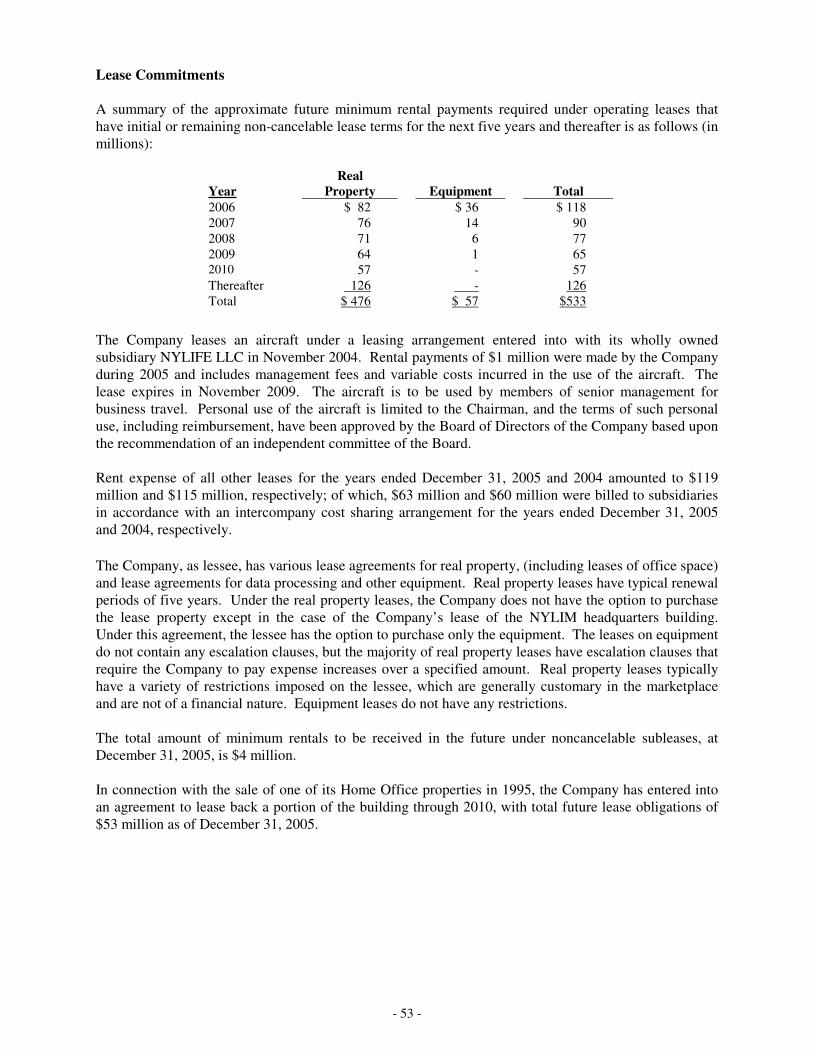
- 53 -
Lease Commitments A summary of the approximate future minimum rental payments required under operating leases that have initial or remaining non-cancelable lease terms for the next five years and thereafter is as follows (in millions):
Year
Real Property
Equipment
Total
2006 $ 82 $ 36 $ 118 2007 76 14 90 2008 71 6 77 2009 64 1 65 2010 57 - 57 Thereafter 126 - 126 Total $ 476 $ 57 $533
The Company leases an aircraft under a leasing arrangement entered into with its wholly owned subsidiary NYLIFE LLC in November 2004. Rental payments of $1 million were made by the Company during 2005 and includes management fees and variable costs incurred in the use of the aircraft. The lease expires in November 2009. The aircraft is to be used by members of senior management for business travel. Personal use of the aircraft is limited to the Chairman, and the terms of such personal use, including reimbursement, have been approved by the Board of Directors of the Company based upon the recommendation of an independent committee of the Board. Rent expense of all other leases for the years ended December 31, 2005 and 2004 amounted to $119 million and $115 million, respectively; of which, $63 million and $60 million were billed to subsidiaries in accordance with an intercompany cost sharing arrangement for the years ended December 31, 2005 and 2004, respectively. The Company, as lessee, has various lease agreements for real property, (including leases of office space) and lease agreements for data processing and other equipment. Real property leases have typical renewal periods of five years. Under the real property leases, the Company does not have the option to purchase the lease property except in the case of the Company’s lease of the NYLIM headquarters building. Under this agreement, the lessee has the option to purchase only the equipment. The leases on equipment do not contain any escalation clauses, but the majority of real property leases have escalation clauses that require the Company to pay expense increases over a specified amount. Real property leases typically have a variety of restrictions imposed on the lessee, which are generally customary in the marketplace and are not of a financial nature. Equipment leases do not have any restrictions.
The total amount of minimum rentals to be received in the future under noncancelable subleases, at December 31, 2005, is $4 million. In connection with the sale of one of its Home Office properties in 1995, the Company has entered into an agreement to lease back a portion of the building through 2010, with total future lease obligations of $53 million as of December 31, 2005.

- 54 -
Borrowed Money At December 31, 2005 and 2004 the carrying value of borrowed money reported in the Statement of Financial Position was $1,736 million and $1,586 million, respectively. Borrowed money, generally carried at the unpaid principal balance and any interest payable, consisted of the following at December 31, 2005 and 2004 (in millions):
2005
2004
Loan Payable to New York Life Capital Corporation, various maturities, latest being February 15, 2006 (weighted average interest rate of 4.27 % and 2.34% for 2005 and 2004, respectively) See Note 6, “Related Party Transactions”
$500
$ 266
Loan payable to Shared Appreciation Income Linked Securities II, due April 28, 2008 (implicit rate of 2.27% on principal and appreciation above 33.26 per share on underlying ESI shares)
845
338
Loan payable to NYLIFE, LLC, due August 22, 2011 (coupon rate of 3.3%). See Note 6, “Related Party Transactions”
242
241
Repurchase agreements (average coupon rate of 5.18% and 5.21% for 2005 and 2004 respectively), See Note 14, “Commitments & Contingencies – Repurchase Agreements”
89
712 Loan Payable to NYLI, expires March 31, 2006 (coupon rate of 5% less management fee of 5.5
basis points) – See Note 6, “Related Party Transactions”
60
25
Accrued interest on surplus notes (coupon rate of 7.50%), see Note 12, “Surplus – Surplus Notes”
-
4
Total borrowed money $1,736 $1,586 In April 2003, the Company entered into a five year Shared Appreciation Income Linked Securities (“SAILS II”) transaction with Credit Suisse First Boston (“CSFB”). The transaction allows the Company to protect its downside risk on 11 million shares of ESI while maintaining the ability to share in a portion of its future appreciation during a five-year period. Under the terms of the transaction, the Company is liable to deliver up to 11 million ESI shares or settle in cash with a value determined based on the average market price of the ESI shares during the 10 trading days beginning 13 exchange business days immediately prior to the April 28, 2008 delivery date. Upon entering into the transaction, the Company received $27.72 per share, or $305 million, less prepaid interest, bringing net proceeds to $273 million. The Company is entitled to 100% of the appreciation up to $33.26 per share. Any appreciation in excess of $33.26 per share will be due to CSFBI upon settlement. At December 31, 2005, the outstanding balance payable by the Company was $845 million, including a liability of $556 million related to the appreciation in the stock’s market value above $33.26 per share. The price per share and number of shares in the foregoing paragraph have been adjusted for a two for one stock split effective June 24, 2005. Securities Lending Program The Company participates in securities lending programs whereby securities, which are included in the accompanying Statutory Statements of Financial Position, are loaned to third parties for the purpose of enhancing income on securities held. At December 31, 2005 and 2004, $2,418 million and $2,191 million, respectively, of the Company's bonds and stocks were on loan to others. The Company requires as collateral, a stated minimum percentage of the fair value of the securities on loan. If the securities being loaned are domestic, a minimum of 102% of its fair value is required. If foreign denominated, the requirement is a minimum of 105% of its fair value. Such assets reflect the extent of the Company's involvement in securities lending, not the Company's risk of loss. At December 31, 2005 and 2004, the Company recorded cash collateral received under these agreements of $2,421 million and $2,188 million, respectively, and established a corresponding liability for the same

- 55 -
amount. The Company also holds collateral in the form of securities having a market value of $60 million and $47 million at December 31, 2005 and 2004, respectively. Repurchase Agreements The Company enters into agreements to sell and repurchase securities for the purpose of enhancing income on securities held. Under these agreements, the Company obtains the use of funds from a broker for generally one month. Cash collateral received is invested in short-term investments and the offsetting collateral liability recorded is considered fair value. At December 31, 2005 and 2004, the Company had repurchase agreements totaling $89 million at an average coupon rate of 5.18% and $712 million at an average coupon rate of 5.21%, respectively. For reverse repurchase agreements, the Company has a minimum collateral threshold of $250 thousand to cover its exposure in the fair value of the investment. At December 31, 2005 and 2004, the Company did not have any reverse repurchase agreements outstanding. Assessments Most of the jurisdictions in which the Company is licensed to transact business require life insurers to participate in guaranty associations which are organized to pay contractual benefits pursuant to insurance policies issued by impaired, insolvent or failed life insurers. These associations levy assessments, up to prescribed limits, on all member insurers in a particular state on the basis of the proportionate share of the premiums written by member insurers in the line of business in which the impaired, insolvent or failed life insurer is engaged. Some states permit member insurers to recover assessments through full or partial premium tax offsets.
The Company has received notification of the insolvency of various life insurers. It is expected that these insolvencies will result in remaining guaranty fund assessments against the Company of approximately $6 million, which have been accrued in Other Liabilities on the accompanying Statutory Statements of Financial Position. NOTE 15 – PROPERTY AND EQUIPMENT Property and equipment are stated at cost less accumulated depreciation. Under New York State Insurance Law, the Company is required to nonadmit all furniture and EDP equipment where the individual cost is less than fifty thousand dollars. Depreciation is determined using the straight-line method over the estimated useful lives of the assets, generally no more than five years.
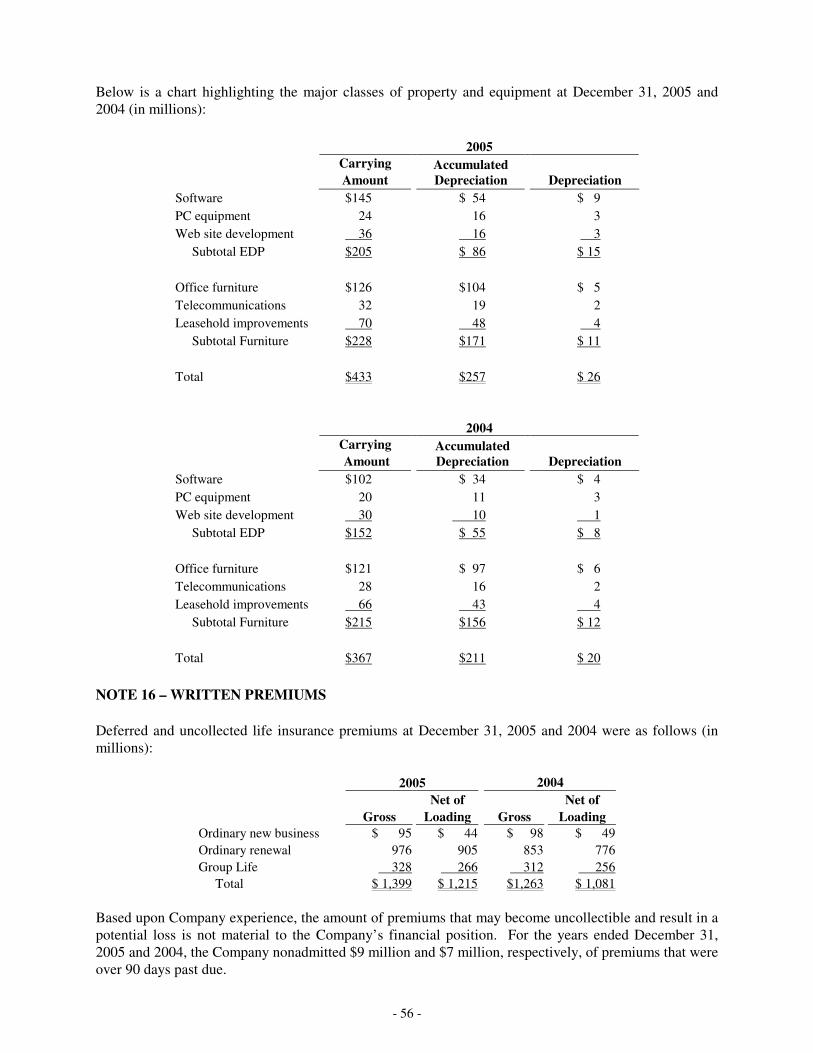
- 56 -
Below is a chart highlighting the major classes of property and equipment at December 31, 2005 and 2004 (in millions):
2005 Carrying Accumulated Amount Depreciation Depreciation Software $145 $ 54 $ 9 PC equipment 24 16 3 Web site development 36 16 3 Subtotal EDP $205 $ 86 $ 15 Office furniture $126 $104 $ 5 Telecommunications 32 19 2 Leasehold improvements 70 48 4 Subtotal Furniture $228 $171 $ 11 Total $433 $257 $ 26
2004 Carrying Accumulated Amount Depreciation Depreciation Software $102 $ 34 $ 4 PC equipment 20 11 3 Web site development 30 10 1 Subtotal EDP $152 $ 55 $ 8 Office furniture $121 $ 97 $ 6 Telecommunications 28 16 2 Leasehold improvements 66 43 4 Subtotal Furniture $215 $156 $ 12 Total $367 $211 $ 20
NOTE 16 – WRITTEN PREMIUMS Deferred and uncollected life insurance premiums at December 31, 2005 and 2004 were as follows (in millions):
2005 2004 Net of Net of Gross Loading Gross Loading
Ordinary new business $ 95 $ 44 $ 98 $ 49 Ordinary renewal 976 905 853 776 Group Life 328 266 312 256 Total $ 1,399 $ 1,215 $1,263 $ 1,081
Based upon Company experience, the amount of premiums that may become uncollectible and result in a potential loss is not material to the Company’s financial position. For the years ended December 31, 2005 and 2004, the Company nonadmitted $9 million and $7 million, respectively, of premiums that were over 90 days past due.
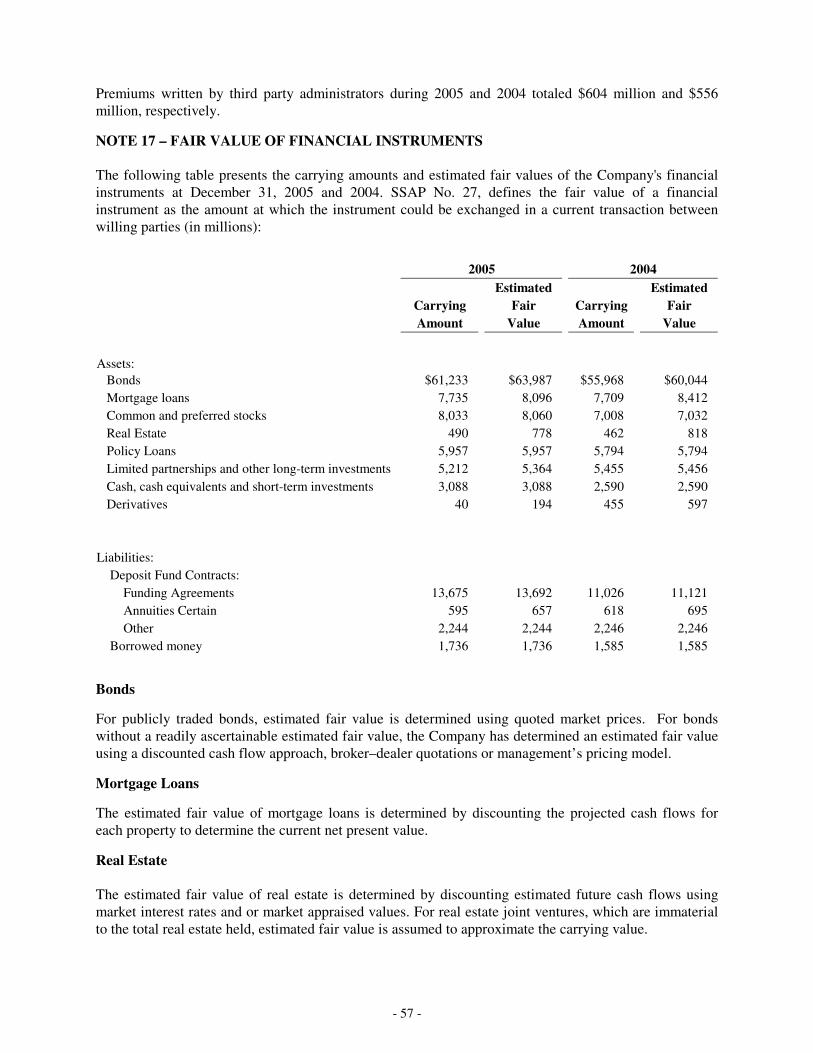
- 57 -
Premiums written by third party administrators during 2005 and 2004 totaled $604 million and $556 million, respectively.
NOTE 17 – FAIR VALUE OF FINANCIAL INSTRUMENTS The following table presents the carrying amounts and estimated fair values of the Company's financial instruments at December 31, 2005 and 2004. SSAP No. 27, defines the fair value of a financial instrument as the amount at which the instrument could be exchanged in a current transaction between willing parties (in millions): 2005 2004 Estimated Estimated Carrying Fair Carrying Fair Amount Value Amount Value
Assets: Bonds $61,233 $63,987 $55,968 $60,044 Mortgage loans 7,735 8,096 7,709 8,412 Common and preferred stocks 8,033 8,060 7,008 7,032 Real Estate 490 778 462 818 Policy Loans 5,957 5,957 5,794 5,794 Limited partnerships and other long-term investments 5,212 5,364 5,455 5,456 Cash, cash equivalents and short-term investments 3,088 3,088 2,590 2,590 Derivatives 40 194 455 597 Liabilities: Deposit Fund Contracts: Funding Agreements 13,675 13,692 11,026 11,121 Annuities Certain 595 657 618 695 Other 2,244 2,244 2,246 2,246 Borrowed money 1,736 1,736 1,585 1,585
Bonds
For publicly traded bonds, estimated fair value is determined using quoted market prices. For bonds without a readily ascertainable estimated fair value, the Company has determined an estimated fair value using a discounted cash flow approach, broker–dealer quotations or management’s pricing model.
Mortgage Loans
The estimated fair value of mortgage loans is determined by discounting the projected cash flows for each property to determine the current net present value.
Real Estate The estimated fair value of real estate is determined by discounting estimated future cash flows using market interest rates and or market appraised values. For real estate joint ventures, which are immaterial to the total real estate held, estimated fair value is assumed to approximate the carrying value.

- 58 -
Policy Loans Policy loans are stated at the aggregate balance due, which approximates estimated fair value, since loans on policies have no defined maturity and reduce amounts payable at death or surrender.
Equity Securities
Estimated fair values of preferred stocks are based on published market values, where available. For preferred stocks without readily ascertainable market values, the Company has determined an estimated fair value using a discounted cash flow approach, broker-dealer quotations, or management’s pricing model.
The estimated fair value of unaffiliated common stocks has been determined using quoted market prices for publicly traded securities and broker-dealer quotations or management’s pricing model for private placement securities. The estimated fair value of affiliated common stock, excluding the Company’s investment in ESI, is equal to the carrying value since these entities are not publicly traded and a reliable value cannot be determined. Limited Partnerships and Other Long-Term Investments The estimated fair value of limited partnerships and limited liability companies is presumed to be equal to the underlying net equity of the investee since the underlying investments held by the partnerships are generally at fair value. Estimated fair value includes the underlying unaudited GAAP equity of limited partnerships that have been excluded from the carrying value since they are unaudited.
Cash, Cash Equivalents and Short-Term Investments
Due to the short-term maturities, the estimated fair value of short-term investments, cash and cash equivalents is presumed to approximate carrying value.
Derivatives Estimated fair values are based on the net present value of cash flows discounted at current rates. Deposit Fund Contracts For GICs and annuities certain, estimated fair values are estimated using discounted cash flow calculations, based on interest rates currently being offered for similar contracts with maturities consistent with those remaining for the contracts being valued. For all other deposit funds, primarily dividend accumulations and supplemental contracts, estimated fair value is equal to account value. Borrowed Money Borrowed money consists of repurchase agreements and intercompany borrowings. Due to the short term nature of these instruments, statement value approximates estimated fair value.