Embed Size (px)
Citation preview
New York State HIV/AIDS Surveillance Semiannual Report
For Cases Diagnosed
through December 2005
____________________________________________________________________
Bureau of HIV/AIDS Epidemiology New York State Department of Health
April 2007
Notice to Readers
On June 1, 2000, the New York State Department of Health (NYSDOH) implemented the HIV Reporting and Partner Notification Law. This law enhanced the existing AIDS case reporting by including reporting of HIV and HIV-related illness by health care providers and laboratories to the New York State Commissioner of Health.
The HIV/AIDS case data used in this Semiannual Report has undergone both inter- and intra-state deduplication.
In 2004 the Centers for Disease Control and Prevention (CDC) completed the Interstate Duplication Evaluation Project (IDEP) in which all states were required to participate. The purpose of the project was to identify duplicate cases of HIV/AIDS that have been reported to the National HIV/AIDS Surveillance System by one or more states and assure that the cases are only counted once. If a case was reported by two or more states, the earliest date of diagnosis was used to determine which state the case was assigned to. CDC estimated that 30,000 of the AIDS cases in the national surveillance system were duplicates, representing less than 5% of the almost 1 million cases that were reported to CDC over the history of the epidemic through 2002.
The percent of AIDS cases that were removed from the New York State (NYS) registry through this process was approximately 3%. Please note that this “loss” of AIDS cases will most likely not affect New York’s Ryan White funding or other funding based on the AIDS case count because New York’s estimated 3% decrease in AIDS cases was less than the average loss of cases for the nation, which was a little less than 5%. The data presented in this report series since June 2004 reflect this change in the AIDS case count for NYS. The December 2003, 2002 and 2001 reports were also updated to reflect this change. The interstate deduplication of cases is now conducted on an ongoing basis.
The Semiannual Report case data has also been deduplicated between New York City (NYC) and the rest of NYS. In all areas of NYS excluding NYC, HIV/AIDS surveillance is conducted by the NYSDOH's Bureau of HIV/AIDS Epidemiology (BHAE). In NYC, HIV/AIDS surveillance is conducted by the NYC Department of Health's HIV Surveillance and Epidemiology Unit. Often, a case will be reported to both jurisdictions. NYC and NYS departments of health report HIV/AIDS data separately to CDC, and the combined file can contain certain cases twice. CDC deduplicates the data between the two jurisdictions for its own use. A case is only counted once and it is assigned to the county of residence at the time of the earliest report. This deduplicated count provides the basis for Ryan White and other federal funding to NYS. The data used in this report have been deduplicated by BHAE following the algorithm used by CDC.
Counts of prisoners and pediatric diagnoses in this report may be slightly higher than in previous reports due to minor changes in processing the input data files.
More finely delineated breakouts or tables based on data that has not been deduplicated may be obtained through our data request unit by calling 518-474-4284.
To familiarize yourself with the report’s format and the definitions used please read the following section, Technical Notes on HIV/AIDS Surveillance Data.
Page 2
Technical Notes on HIV/AIDS Surveillance Data
Introduction
This is the HIV/AIDS Surveillance Semiannual Report, which is produced by the BHAE at the New York State Department of Health (NYSDOH). Access to this publication is available through the Internet at the following address: http://www.nyhealth.gov/diseases/aids/statistics/index.htm.
Printed copies can be obtained by those without internet access by writing to:
Bureau of HIV/AIDS Epidemiology P.O. Box 2073 ESP Station Albany, New York 12220-0073
Information presented in this report is generated from data collected and maintained by BHAE and the NYC Department of Health's HIV Surveillance and Epidemiology Unit.
Reporting Procedures
As of June 1, 2000, the NYS HIV Reporting and Partner Notification Law (Chapter 163 of the Laws of 1998, PHL 21 Title III) requires health care providers to report all initial determinations of HIV infection, diagnosis of HIV-related illness and diagnosis of AIDS to the NYS Commissioner of Health.* Until June 2005 laboratories were required to report all confirmatory HIV antibody tests, all detectable viral loads and all CD4<500 or 29% of total lymphocytes. As of June 2005, all viral load and CD4 tests are reportable, as well as confirmatory HIV antibody tests.
Laboratories conducting HIV-related testing must report directly to the NYSDOH either electronically or on paper. For more information call 518-474-4284.
All NYS providers should report using the NYS Confidential Medical Provider HIV/AIDS and Partner/Contact Report Form (PRF) DOH-4189 Revised 8/05. Copies can be obtained by calling 518-474-4284.
NYS providers outside of NYC should mail the completed PRF to:
Division of Epidemiology P.O. Box 2073 ESP Station Albany, New York 12220-0073
NYC providers should call (212) 442-3388 to arrange pickup of the completed PRF.
* Please note that HIV-infected patients diagnosed with tuberculosis (TB) are also reportable to the local TB control program. Questions regarding TB reporting should be directed to your local program or the NYS TB Control Program at (518) 474-4845.
Page 3
Definition of Terms Used in this Report
Case: Case refers to a report for which confirmatory clinical and demographic data required by the national Centers for Disease Control and Prevention (CDC) have been obtained. Reports received without sufficient information to confirm the case or a confirmed case reported without risk are investigated by NYS or NYC public health representatives who examine medical records to obtain demographic information, clinical status and reported HIV exposure (risk).
In June 2006, NYSDOH's HIV surveillance system was modified to implement CDC's National Data Processing Initiative (NDPI). NDPI rules for counting HIV and AIDS cases are stricter than those previously in effect. A small number of cases in upstate New York that were countable for reporting purposes under old rules lacked required data elements and were no longer countable. BHAE is working to acquire the information needed to restore these cases. New York City cases are still reported using pre-NDPI rules. (See Record Updates below). HIV/AIDS Case Categories: This report classifies cases into the four categories listed below. HIV and AIDS cases are mutually exclusive. The newly diagnosed HIV and AIDS cases are subsets of the living HIV and AIDS categories.
• Living HIV Cases - This category includes all reported individuals living with HIV infection who have not developed AIDS. This category includes HIV cases reported by a provider indicating an initial HIV diagnosis or an HIV illness and/or by a laboratory reporting a positive western blot or a detectable viral load.
• Newly Diagnosed HIV Cases - This is the subset of all living HIV cases that have been
reported for the first time by a laboratory reporting a positive western blot or by a physician reporting an initial HIV diagnosis, and have not been reported with AIDS through the end of the reported time period. Please note that HIV reporting began in 2000 and that cases diagnosed prior to this time by a provider other than the current provider reporting the case may be misclassified as newly diagnosed.
• Living AIDS Cases - This category includes all reported individuals living with AIDS.
• Newly Diagnosed AIDS Cases - This is the subset of all living AIDS cases that are
diagnosed and reported with AIDS for the first time. This includes cases that have never been reported before and cases initially reported with HIV infection that have subsequently developed AIDS.
• Cumulative AIDS Cases - This category includes all AIDS cases reported since 1983,
both living and deceased.
Diagnosis date: The diagnosis date refers to the earliest date on which a clinical or laboratory diagnosis of HIV and AIDS is documented on a provider report form, laboratory report or in the patient's medical chart. This date may be months, or even years, earlier than the date the case was reported to the health department. In cases of HIV infection diagnosed before June 2000 that have not been investigated, the diagnosis date is the test date of the first laboratory report received.
Page 4
Report date: The date that the case was confirmed.
HIV Exposure Category: Information on possible mode(s) of HIV exposure is typically provided to health care providers during routine medical history taking, and is obtained from review of the patient's medical records. An individual may potentially have been exposed to HIV through more than one route. However, for the purpose of surveillance, only one exposure mechanism is considered. (The category of "men who have sex with men and inject drugs" is the only exception to this). Persons identified with more than one potential exposure route are classified in accordance with the following CDC-defined hierarchy of exposure category:
Adults: • Men who have sex with men and inject drugs • Men who have sex with men (includes bisexual men) • Injection drug users • Hemophiliacs or persons with other clotting disorders • Heterosexual contact with an injection drug user, a bisexual man, a hemophiliac,
an HIV-positive blood product recipient, or a person with documented HIV or AIDS
• Transfusion or transplant recipient • Confirmed other risk • Adult with undetermined mode of exposure
Children:
• Hemophiliacs or children with other clotting disorder • Mother is an injection drug user • Mother had sex with an injection drug user, a bisexual man, a hemophiliac, an
HIV-positive blood transfusion recipient, an individual with documented HIV or AIDS
• Mother received a transfusion or blood products • Mother had AIDS or is HIV-positive • Transfusion or transplant recipient • Pediatric other risk • Child with undetermined mode of exposure
Based on this hierarchy, for example, a woman who may have been exposed to HIV through both injection drug use and through heterosexual contact with an HIV-infected partner would be classified only as an injection drug user, since that mode of exposure precedes heterosexual contact on the hierarchy.
An individual with HIV/AIDS for whom all but heterosexual HIV risk has been ruled out can be classified as heterosexually exposed only if s/he knows the partner's risk and/or HIV status. In the absence of such information, the case is classified as having an undetermined exposure category. In contrast, men who have sex with men and injection drug users need only be behaviorally identified in one of these groups, with no additional documentation required. As a result of the more rigorous standards for identifying heterosexually exposed individuals, it is
Page 5
likely that many heterosexually exposed cases fail to meet these standards. Thus, a proportion of cases with an undetermined exposure category may be heterosexually exposed individuals.
Individuals with an undetermined mode of exposure may fall into one of several categories: persons currently under investigation by public health representatives, persons for whom no mode of exposure was identified because the individual died or was lost to follow-up, persons with lack of exposure information in his/her medical chart, and persons for whom adequate follow-up information revealed no identifiable exposure mechanism.
Changes in the AIDS Surveillance Case Definition: A uniform surveillance case definition for AIDS was established by CDC in the early 1980s, and has since been modified three times, each time expanding the range of AIDS-indicator diseases and conditions and incorporating HIV diagnostic tests to improve the sensitivity and specificity of the definition. The first modification occurred in 1985, the second in 1987 and the most recent in 1993. The 1993 expansion of the AIDS case definition for adults and adolescent includes HIV-infected individuals with CD4+ T-lymphocyte counts below 200 cells/mm3 or below 14 percent of total lymphocytes, and individuals diagnosed with pulmonary tuberculosis, recurrent pneumonia or invasive cervical cancer.
Particularly due to the new immunologic criterion of the expanded case definition, the number of cases reported to the NYSDOH and NYCDOH grew immensely following the 1993 modification. The immunologic criterion permitted a substantial number of AIDS diagnoses to be made before the occurrence of the first opportunistic condition. These cases were effectively diagnosed earlier in the spectrum of HIV disease than other AIDS cases diagnosed under the old case definition. The effect of this new criterion was to create a large and sudden increase in the number of AIDS cases confirmed around 1993, producing the false impression of a dramatic increase in AIDS cases during that period.
Record Updates: When additional surveillance information is received on a confirmed case subsequent to the initial confirmation, data for that case may be updated, resulting in changes in the data reported to the public. Therefore, month to month totals in some data elements (such as mode of exposure and diagnosis date) may change over time. With the implementation of HIV reporting, the number of prevalent HIV and AIDS cases for a specified period of time may change, as individuals initially reported with HIV develop AIDS and are moved from the "HIV" to the "AIDS" category.
Age at diagnosis: In this report, age designates age at time of diagnosis. This refers to the individual's age at the earliest, documented diagnosis of the condition in question. The CDC categorizes a case as "pediatric" if the diagnosis was made before age 13.
Mortality Information: Vital status of cases is determined from updated case reports, death certificate files maintained by the NYSDOH and NYCDOH Vital Records, and the National Death Index. Unless known to be deceased from these sources, cases are presumed to be alive.
Prisoners: Cases categorized as "Prisoners" have been diagnosed and/or reported while incarcerated in city or county jails or one of the NYS Department of Corrections (DOCS) facilities throughout NYS. Most prisoner reports come from a NYSDOCS facility. Prison cases are often presented separately from general population data because, if diagnosed while
Page 6
incarcerated, residence reflects the address of the correctional facility, rather than their home address.
Regional Groupings: For this report, cases are assigned to the county of residence at time of diagnosis. In NYC, data include all individuals who were residents of one of the five New York City boroughs at the time of initial diagnosis. NYS, excluding NYC, include all individuals whose residence was anywhere in NYS outside of NYC at the time of initial diagnosis.
Page 7
TABLE OF CONTENTS:
STATEWIDE
Table 1 AIDS cases by Region and Year of Diagnosis............................................. Page 10Table 2A Living and Cumulative HIV/AIDS cases by Gender,
Age, Race/Ethnicity and Risk...................................................................... Page 11 Table 2B Newly Diagnosed HIV/AIDS cases by Gender,
Age, Race/Ethnicity and Risk...................................................................... Page 12
REGIONAL
Table 3A NYC - Living and Cumulative HIV/AIDS cases by Gender, Age, Race/Ethnicity and Risk.........................................................Page 13
Table 3B NYC - Newly Diagnosed HIV/AIDS cases by Gender, Age, Race/Ethnicity and Risk.........................................................Page 14
Table 4A NYS excluding NYC - Living and Cumulative HIV/AIDS cases by Gender, Age, Race/Ethnicity and Risk........................Page 15
Table 4B NYS excluding NYC - Newly Diagnosed HIV/AIDS cases by Gender, Age, Race/Ethnicity and Risk.......................................... Page 16
NYS Excluding NYC – COUNTY
Table 5A Living and Cumulative HIV/AIDS by County......................................Pages 17-18 Table 5B Newly Diagnosed HIV/AIDS cases by County.....................................Pages 19-20
NYC BY GENDER
Table 6A Males - Living HIV/AIDS cases by Age, Race/Ethnicity and Risk.............Page 21 Table 6B Males - Newly Diagnosed HIV/AIDS cases by Age,
Race/Ethnicity and Risk...............................................................................Page 22 Table 6C Females - Living HIV/AIDS cases by Age, Race/Ethnicity and Risk.........Page 23 Table 6D Females - Newly Diagnosed HIV/AIDS cases by Age,
Race/Ethnicity and Risk...............................................................................Page 24
NYS Excluding NYC by GENDER (excludes Prisoners)
Table 7A Males - Living HIV/AIDS cases by Age, Race/Ethnicity and Risk.............Page 25 Table 7B Males - Newly Diagnosed HIV/AIDS cases by Age,
Race/Ethnicity and Risk................................................................................Page 26 Table 7C Females - Living HIV/AIDS cases by Age, Race/Ethnicity and Risk..........Page 27 Table 7D Females - Newly Diagnosed HIV/AIDS cases by Age,
Race/Ethnicity and Risk................................................................................Page 28
PRISONERS - (NYS Excluding NYC)
Table 8A Living HIV/AIDS cases by Gender, Age and Race/Ethnicity......................Page 29 Table 8B Newly Diagnosed HIV/AIDS cases by Gender, Age
and Race/Ethnicity........................................................................................Page 30
Page 8
NYS Excluding NYC
Table 9A Living and Cumulative HIV/AIDS cases by Ryan White Region................Page 31 Table 9B Newly Diagnosed HIV/AIDS cases by Ryan White Region........................Page 32
NYS Excluding NYC - Ryan White Regions
The following two tables have been generated for each of the Ryan White Regions:
A - Living and Cumulative HIV/AIDS cases by Gender, Age, Race/Ethnicity and Risk B - Newly Diagnosed HIV/AIDS cases by Gender, Age, Race/Ethnicity and Risk
Table 10 - A,B Albany Ryan White Region ..........................................………Pages 33-34 Table 11 - A,B Binghamton Ryan White Region ..............................………...Pages 35-36 Table 12 - A,B Buffalo Ryan White Region…………………………………...Pages 37-38 Table 13 - A,B Lower Hudson Ryan White Region ...........................………..Pages 39-40 Table 14 - A,B Mid Hudson Ryan White Region ..............................………...Pages 41-42 Table 15 - A,B Nassau/Suffolk Ryan White Region .........................…………Pages 43-44 Table 16 - A,B Rochester Ryan White Region ..................................…………Pages 45-46 Table 17 - A,B Syracuse Ryan White Region ....................................…………Pages 47-48
NYC – Boroughs
Table 18A HIV/AIDS Cases Diagnosed through June 2004……………………………Page 49 Table 18B Newly Diagnosed HIV/AIDS Cases, Diagnosed July 2003-June 2004……..Page 50
The following two tables have been generated for each of the Boroughs:
A - Living and Cumulative HIV/AIDS cases by Gender, Age, Race/Ethnicity and Risk B - Newly Diagnosed HIV/AIDS cases by Gender, Age, Race/Ethnicity and Risk
Table 19 - A,B Bronx..........................................................................………...Pages 51-52 Table 20 - A,B Brooklyn.....................................................................………...Pages 53-54 Table 21 - A,B Manhattan..................................................................………...Pages 55-56 Table 22 - A,B Queens........................................................................………... Pages 57-58 Table 23 - A,B Staten Island..............................................................………... Pages 59-60
Page 9
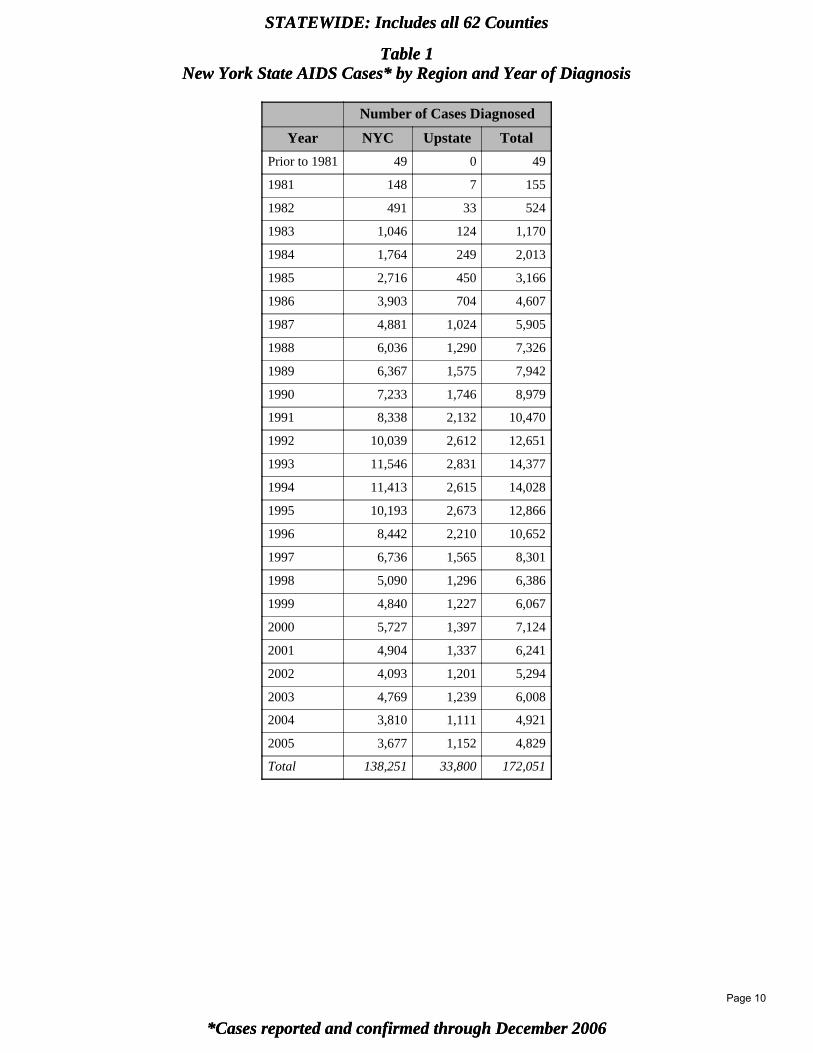
*Cases reported and confirmed through December 2006
STATEWIDE: Includes all 62 Counties
Table 1New York State AIDS Cases* by Region and Year of Diagnosis
*Cases reported and confirmed through December 2006
STATEWIDE: Includes all 62 Counties
Table 1New York State AIDS Cases* by Region and Year of Diagnosis
Number of Cases Diagnosed
Year NYC Upstate Total
Prior to 1981 49 0 49
1981 148 7 155
1982 491 33 524
1983 1,046 124 1,170
1984 1,764 249 2,013
1985 2,716 450 3,166
1986 3,903 704 4,607
1987 4,881 1,024 5,905
1988 6,036 1,290 7,326
1989 6,367 1,575 7,942
1990 7,233 1,746 8,979
1991 8,338 2,132 10,470
1992 10,039 2,612 12,651
1993 11,546 2,831 14,377
1994 11,413 2,615 14,028
1995 10,193 2,673 12,866
1996 8,442 2,210 10,652
1997 6,736 1,565 8,301
1998 5,090 1,296 6,386
1999 4,840 1,227 6,067
2000 5,727 1,397 7,124
2001 4,904 1,337 6,241
2002 4,093 1,201 5,294
2003 4,769 1,239 6,008
2004 3,810 1,111 4,921
2005 3,677 1,152 4,829
Total 138,251 33,800 172,051
Page 10
**All cases reported and confirmed from 1983 - December 2006*All cases reported and confirmed from June 2000 - December 2006
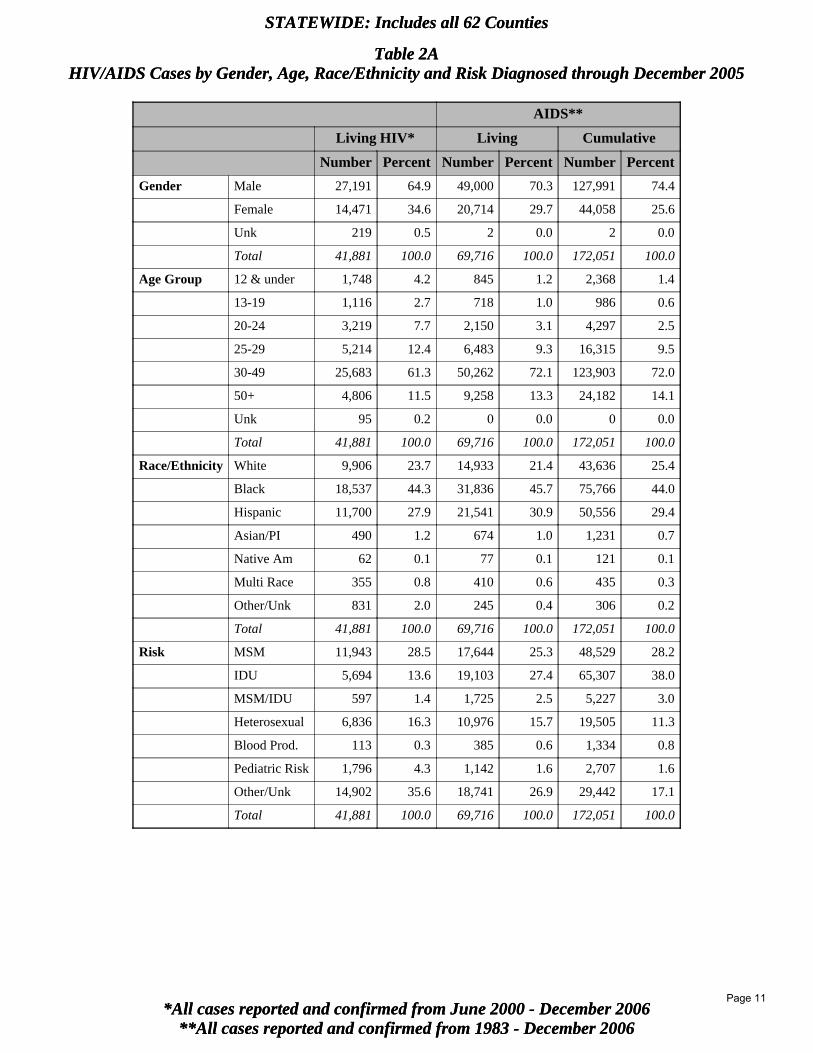
STATEWIDE: Includes all 62 Counties
Table 2AHIV/AIDS Cases by Gender, Age, Race/Ethnicity and Risk Diagnosed through December 2005
**All cases reported and confirmed from 1983 - December 2006*All cases reported and confirmed from June 2000 - December 2006
STATEWIDE: Includes all 62 Counties
Table 2AHIV/AIDS Cases by Gender, Age, Race/Ethnicity and Risk Diagnosed through December 2005
AIDS**
Living HIV* Living Cumulative
Number Percent Number Percent Number Percent
Gender Male 27,191 64.9 49,000 70.3 127,991 74.4
Female 14,471 34.6 20,714 29.7 44,058 25.6
Unk 219 0.5 2 0.0 2 0.0
Total 41,881 100.0 69,716 100.0 172,051 100.0
Age Group 12 & under 1,748 4.2 845 1.2 2,368 1.4
13-19 1,116 2.7 718 1.0 986 0.6
20-24 3,219 7.7 2,150 3.1 4,297 2.5
25-29 5,214 12.4 6,483 9.3 16,315 9.5
30-49 25,683 61.3 50,262 72.1 123,903 72.0
50+ 4,806 11.5 9,258 13.3 24,182 14.1
Unk 95 0.2 0 0.0 0 0.0
Total 41,881 100.0 69,716 100.0 172,051 100.0
Race/Ethnicity White 9,906 23.7 14,933 21.4 43,636 25.4
Black 18,537 44.3 31,836 45.7 75,766 44.0
Hispanic 11,700 27.9 21,541 30.9 50,556 29.4
Asian/PI 490 1.2 674 1.0 1,231 0.7
Native Am 62 0.1 77 0.1 121 0.1
Multi Race 355 0.8 410 0.6 435 0.3
Other/Unk 831 2.0 245 0.4 306 0.2
Total 41,881 100.0 69,716 100.0 172,051 100.0
Risk MSM 11,943 28.5 17,644 25.3 48,529 28.2
IDU 5,694 13.6 19,103 27.4 65,307 38.0
MSM/IDU 597 1.4 1,725 2.5 5,227 3.0
Heterosexual 6,836 16.3 10,976 15.7 19,505 11.3
Blood Prod. 113 0.3 385 0.6 1,334 0.8
Pediatric Risk 1,796 4.3 1,142 1.6 2,707 1.6
Other/Unk 14,902 35.6 18,741 26.9 29,442 17.1
Total 41,881 100.0 69,716 100.0 172,051 100.0
Page 11

*Cases reported and confirmed through December 2006
STATEWIDE: Includes all 62 Counties
Table 2BNewly Diagnosed HIV/AIDS Cases* by Gender, Age, Race/Ethnicity and Risk
Diagnosed January 2005 - December 2005
*Cases reported and confirmed through December 2006
STATEWIDE: Includes all 62 Counties
Table 2BNewly Diagnosed HIV/AIDS Cases* by Gender, Age, Race/Ethnicity and Risk
Diagnosed January 2005 - December 2005
Initial HIV Initial AIDS
Number Percent Number Percent
Gender Male 2,112 70.7 3,276 67.8
Female 876 29.3 1,553 32.2
Total 2,988 100.0 4,829 100.0
Age Group 12 & under 17 0.6 11 0.2
13-19 133 4.5 86 1.8
20-24 345 11.5 196 4.1
25-29 434 14.5 307 6.4
30-49 1,650 55.2 3,114 64.5
50+ 409 13.7 1,115 23.1
Total 2,988 100.0 4,829 100.0
Race/Ethnicity White 615 20.6 882 18.3
Black 1,458 48.8 2,407 49.8
Hispanic 739 24.7 1,408 29.2
Asian/PI 70 2.3 58 1.2
Native Am 7 0.2 9 0.2
Multi Race 94 3.1 63 1.3
Other/Unk 5 0.2 2 0.0
Total 2,988 100.0 4,829 100.0
Risk MSM 1,147 38.4 1,249 25.9
IDU 198 6.6 723 15.0
MSM/IDU 29 1.0 90 1.9
Heterosexual 470 15.7 792 16.4
Blood Prod. 4 0.1 16 0.3
Pediatric Risk 17 0.6 49 1.0
Other/Unk 1,123 37.6 1,910 39.6
Total 2,988 100.0 4,829 100.0
Page 12
**All cases reported and confirmed from 1983 - December 2006*All cases reported and confirmed from June 2000 - December 2006
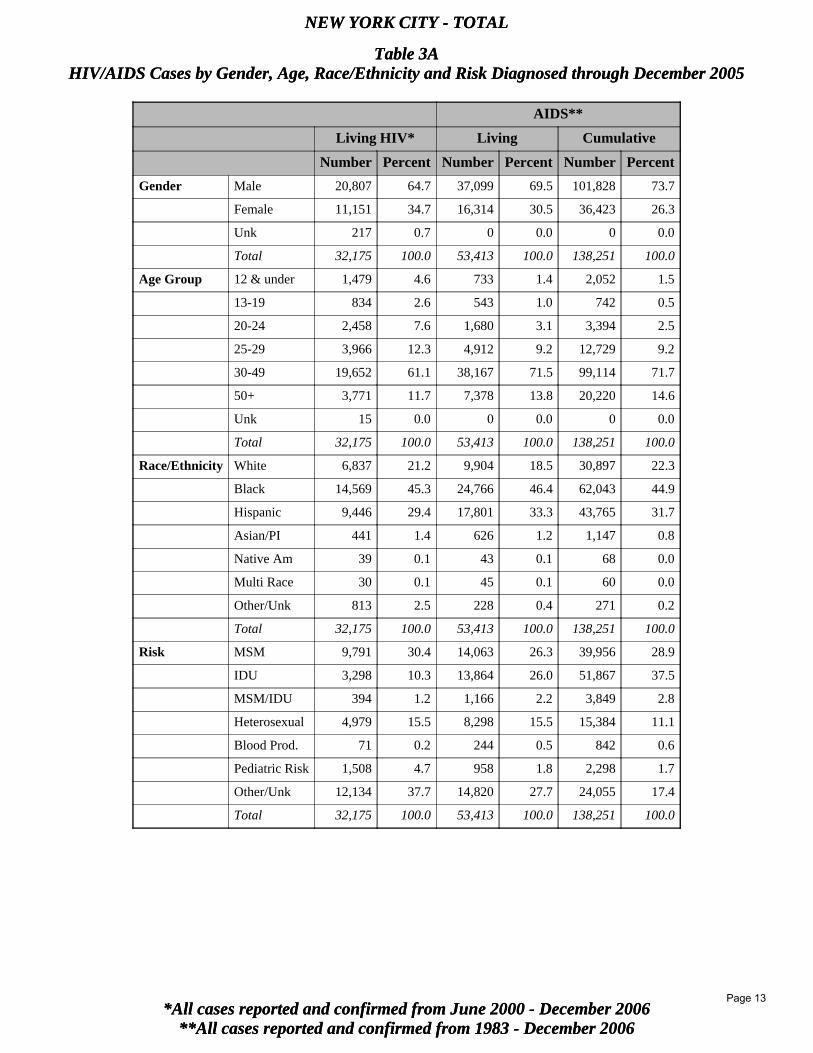
NEW YORK CITY - TOTAL
Table 3AHIV/AIDS Cases by Gender, Age, Race/Ethnicity and Risk Diagnosed through December 2005
**All cases reported and confirmed from 1983 - December 2006*All cases reported and confirmed from June 2000 - December 2006
NEW YORK CITY - TOTAL
Table 3AHIV/AIDS Cases by Gender, Age, Race/Ethnicity and Risk Diagnosed through December 2005
AIDS**
Living HIV* Living Cumulative
Number Percent Number Percent Number Percent
Gender Male 20,807 64.7 37,099 69.5 101,828 73.7
Female 11,151 34.7 16,314 30.5 36,423 26.3
Unk 217 0.7 0 0.0 0 0.0
Total 32,175 100.0 53,413 100.0 138,251 100.0
Age Group 12 & under 1,479 4.6 733 1.4 2,052 1.5
13-19 834 2.6 543 1.0 742 0.5
20-24 2,458 7.6 1,680 3.1 3,394 2.5
25-29 3,966 12.3 4,912 9.2 12,729 9.2
30-49 19,652 61.1 38,167 71.5 99,114 71.7
50+ 3,771 11.7 7,378 13.8 20,220 14.6
Unk 15 0.0 0 0.0 0 0.0
Total 32,175 100.0 53,413 100.0 138,251 100.0
Race/Ethnicity White 6,837 21.2 9,904 18.5 30,897 22.3
Black 14,569 45.3 24,766 46.4 62,043 44.9
Hispanic 9,446 29.4 17,801 33.3 43,765 31.7
Asian/PI 441 1.4 626 1.2 1,147 0.8
Native Am 39 0.1 43 0.1 68 0.0
Multi Race 30 0.1 45 0.1 60 0.0
Other/Unk 813 2.5 228 0.4 271 0.2
Total 32,175 100.0 53,413 100.0 138,251 100.0
Risk MSM 9,791 30.4 14,063 26.3 39,956 28.9
IDU 3,298 10.3 13,864 26.0 51,867 37.5
MSM/IDU 394 1.2 1,166 2.2 3,849 2.8
Heterosexual 4,979 15.5 8,298 15.5 15,384 11.1
Blood Prod. 71 0.2 244 0.5 842 0.6
Pediatric Risk 1,508 4.7 958 1.8 2,298 1.7
Other/Unk 12,134 37.7 14,820 27.7 24,055 17.4
Total 32,175 100.0 53,413 100.0 138,251 100.0
Page 13

*Cases reported and confirmed through December 2006
NEW YORK CITY - TOTAL
Table 3BNewly Diagnosed HIV/AIDS Cases* by Gender, Age, Race/Ethnicity and Risk
Diagnosed January 2005 - December 2005
*Cases reported and confirmed through December 2006
NEW YORK CITY - TOTAL
Table 3BNewly Diagnosed HIV/AIDS Cases* by Gender, Age, Race/Ethnicity and Risk
Diagnosed January 2005 - December 2005
Initial HIV Initial AIDS
Number Percent Number Percent
Gender Male 1,717 71.7 2,460 66.9
Female 677 28.3 1,217 33.1
Total 2,394 100.0 3,677 100.0
Age Group 12 & under 12 0.5 10 0.3
13-19 101 4.2 65 1.8
20-24 265 11.1 160 4.4
25-29 367 15.3 246 6.7
30-49 1,321 55.2 2,344 63.7
50+ 328 13.7 852 23.2
Total 2,394 100.0 3,677 100.0
Race/Ethnicity White 423 17.7 539 14.7
Black 1,261 52.7 1,916 52.1
Hispanic 632 26.4 1,153 31.4
Asian/PI 63 2.6 55 1.5
Native Am 4 0.2 7 0.2
Multi Race 7 0.3 5 0.1
Other/Unk 4 0.2 2 0.1
Total 2,394 100.0 3,677 100.0
Risk MSM 962 40.2 1,007 27.4
IDU 148 6.2 468 12.7
MSM/IDU 17 0.7 69 1.9
Heterosexual 365 15.2 577 15.7
Blood Prod. 1 0.0 9 0.2
Pediatric Risk 11 0.5 40 1.1
Other/Unk 890 37.2 1,507 41.0
Total 2,394 100.0 3,677 100.0
Page 14
**All cases reported and confirmed from 1983 - December 2006*All cases reported and confirmed from June 2000 - December 2006
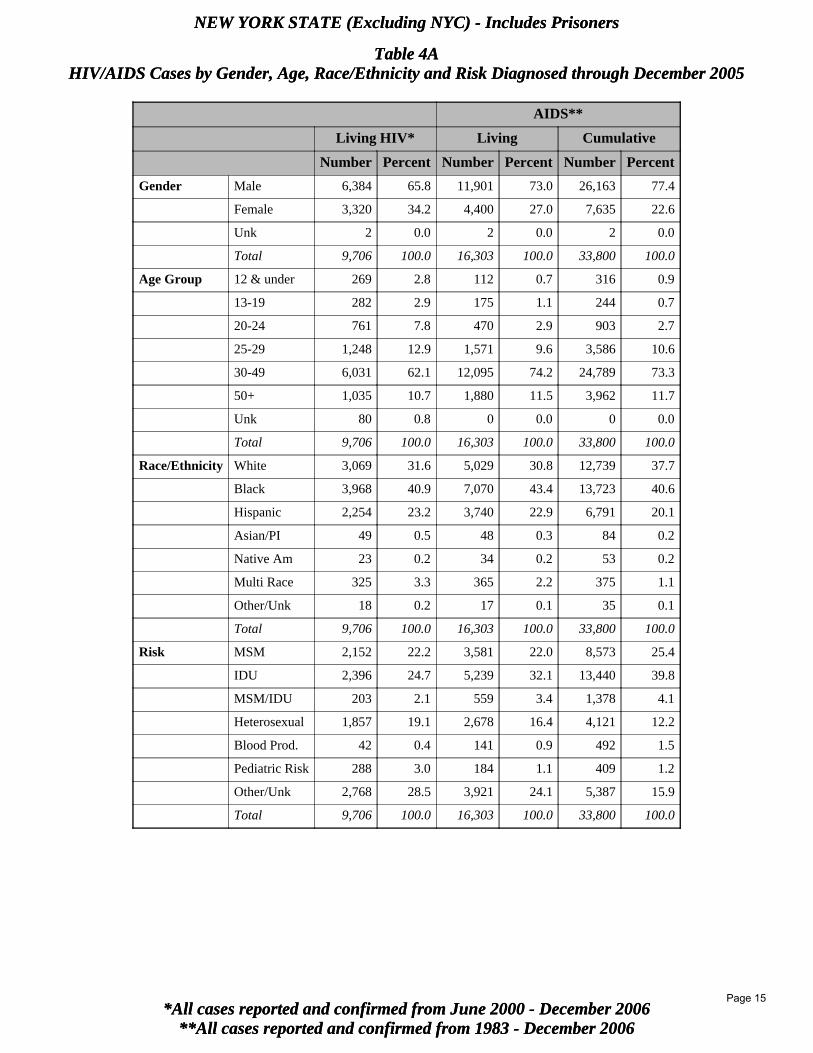
NEW YORK STATE (Excluding NYC) - Includes Prisoners
Table 4AHIV/AIDS Cases by Gender, Age, Race/Ethnicity and Risk Diagnosed through December 2005
**All cases reported and confirmed from 1983 - December 2006*All cases reported and confirmed from June 2000 - December 2006
NEW YORK STATE (Excluding NYC) - Includes Prisoners
Table 4AHIV/AIDS Cases by Gender, Age, Race/Ethnicity and Risk Diagnosed through December 2005
AIDS**
Living HIV* Living Cumulative
Number Percent Number Percent Number Percent
Gender Male 6,384 65.8 11,901 73.0 26,163 77.4
Female 3,320 34.2 4,400 27.0 7,635 22.6
Unk 2 0.0 2 0.0 2 0.0
Total 9,706 100.0 16,303 100.0 33,800 100.0
Age Group 12 & under 269 2.8 112 0.7 316 0.9
13-19 282 2.9 175 1.1 244 0.7
20-24 761 7.8 470 2.9 903 2.7
25-29 1,248 12.9 1,571 9.6 3,586 10.6
30-49 6,031 62.1 12,095 74.2 24,789 73.3
50+ 1,035 10.7 1,880 11.5 3,962 11.7
Unk 80 0.8 0 0.0 0 0.0
Total 9,706 100.0 16,303 100.0 33,800 100.0
Race/Ethnicity White 3,069 31.6 5,029 30.8 12,739 37.7
Black 3,968 40.9 7,070 43.4 13,723 40.6
Hispanic 2,254 23.2 3,740 22.9 6,791 20.1
Asian/PI 49 0.5 48 0.3 84 0.2
Native Am 23 0.2 34 0.2 53 0.2
Multi Race 325 3.3 365 2.2 375 1.1
Other/Unk 18 0.2 17 0.1 35 0.1
Total 9,706 100.0 16,303 100.0 33,800 100.0
Risk MSM 2,152 22.2 3,581 22.0 8,573 25.4
IDU 2,396 24.7 5,239 32.1 13,440 39.8
MSM/IDU 203 2.1 559 3.4 1,378 4.1
Heterosexual 1,857 19.1 2,678 16.4 4,121 12.2
Blood Prod. 42 0.4 141 0.9 492 1.5
Pediatric Risk 288 3.0 184 1.1 409 1.2
Other/Unk 2,768 28.5 3,921 24.1 5,387 15.9
Total 9,706 100.0 16,303 100.0 33,800 100.0
Page 15
*Cases reported and confirmed through December 2006
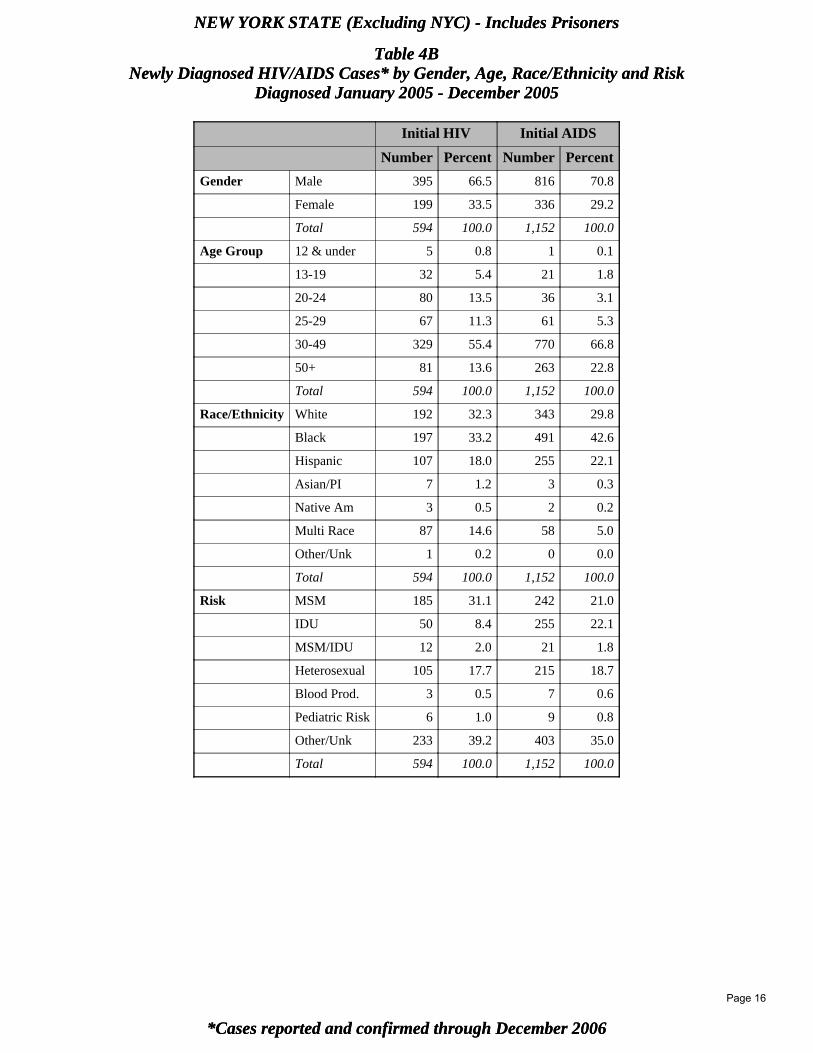
NEW YORK STATE (Excluding NYC) - Includes Prisoners
Table 4BNewly Diagnosed HIV/AIDS Cases* by Gender, Age, Race/Ethnicity and Risk
Diagnosed January 2005 - December 2005
*Cases reported and confirmed through December 2006
NEW YORK STATE (Excluding NYC) - Includes Prisoners
Table 4BNewly Diagnosed HIV/AIDS Cases* by Gender, Age, Race/Ethnicity and Risk
Diagnosed January 2005 - December 2005
Initial HIV Initial AIDS
Number Percent Number Percent
Gender Male 395 66.5 816 70.8
Female 199 33.5 336 29.2
Total 594 100.0 1,152 100.0
Age Group 12 & under 5 0.8 1 0.1
13-19 32 5.4 21 1.8
20-24 80 13.5 36 3.1
25-29 67 11.3 61 5.3
30-49 329 55.4 770 66.8
50+ 81 13.6 263 22.8
Total 594 100.0 1,152 100.0
Race/Ethnicity White 192 32.3 343 29.8
Black 197 33.2 491 42.6
Hispanic 107 18.0 255 22.1
Asian/PI 7 1.2 3 0.3
Native Am 3 0.5 2 0.2
Multi Race 87 14.6 58 5.0
Other/Unk 1 0.2 0 0.0
Total 594 100.0 1,152 100.0
Risk MSM 185 31.1 242 21.0
IDU 50 8.4 255 22.1
MSM/IDU 12 2.0 21 1.8
Heterosexual 105 17.7 215 18.7
Blood Prod. 3 0.5 7 0.6
Pediatric Risk 6 1.0 9 0.8
Other/Unk 233 39.2 403 35.0
Total 594 100.0 1,152 100.0
Page 16
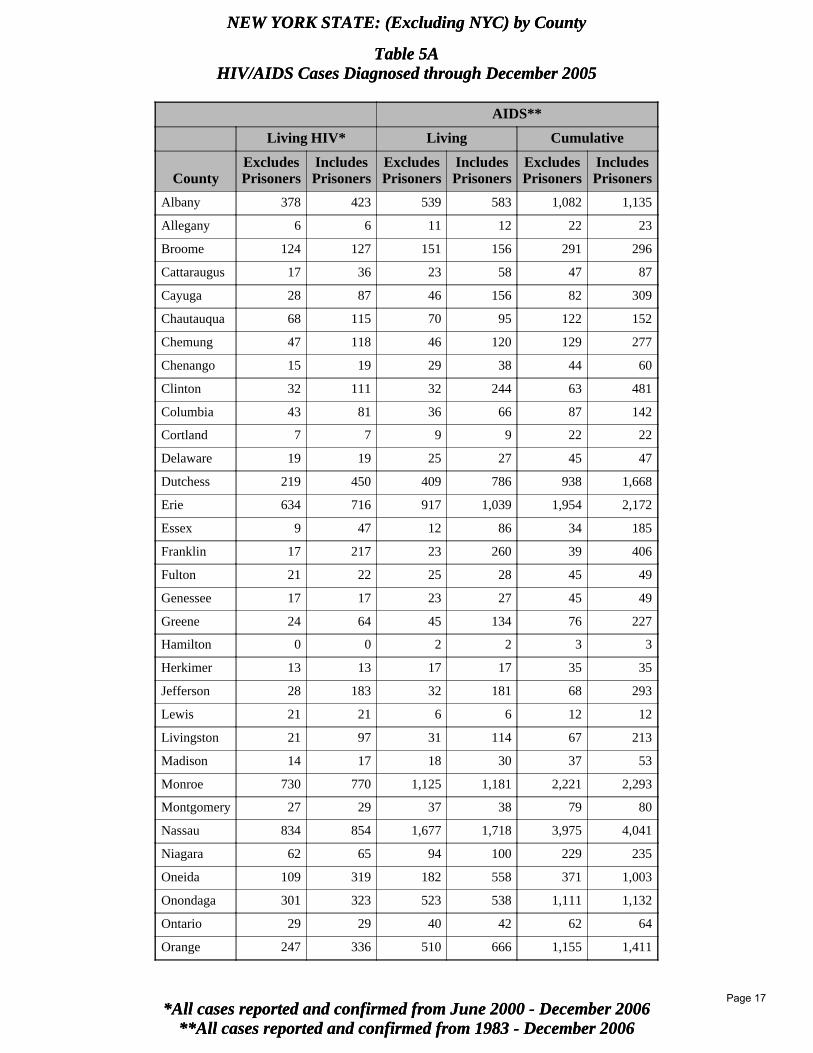
**All cases reported and confirmed from 1983 - December 2006*All cases reported and confirmed from June 2000 - December 2006
NEW YORK STATE: (Excluding NYC) by County
Table 5AHIV/AIDS Cases Diagnosed through December 2005
**All cases reported and confirmed from 1983 - December 2006*All cases reported and confirmed from June 2000 - December 2006
NEW YORK STATE: (Excluding NYC) by County
Table 5AHIV/AIDS Cases Diagnosed through December 2005
AIDS**
Living HIV* Living Cumulative
CountyExcludesPrisoners
IncludesPrisoners
ExcludesPrisoners
IncludesPrisoners
ExcludesPrisoners
IncludesPrisoners
Albany 378 423 539 583 1,082 1,135
Allegany 6 6 11 12 22 23
Broome 124 127 151 156 291 296
Cattaraugus 17 36 23 58 47 87
Cayuga 28 87 46 156 82 309
Chautauqua 68 115 70 95 122 152
Chemung 47 118 46 120 129 277
Chenango 15 19 29 38 44 60
Clinton 32 111 32 244 63 481
Columbia 43 81 36 66 87 142
Cortland 7 7 9 9 22 22
Delaware 19 19 25 27 45 47
Dutchess 219 450 409 786 938 1,668
Erie 634 716 917 1,039 1,954 2,172
Essex 9 47 12 86 34 185
Franklin 17 217 23 260 39 406
Fulton 21 22 25 28 45 49
Genessee 17 17 23 27 45 49
Greene 24 64 45 134 76 227
Hamilton 0 0 2 2 3 3
Herkimer 13 13 17 17 35 35
Jefferson 28 183 32 181 68 293
Lewis 21 21 6 6 12 12
Livingston 21 97 31 114 67 213
Madison 14 17 18 30 37 53
Monroe 730 770 1,125 1,181 2,221 2,293
Montgomery 27 29 37 38 79 80
Nassau 834 854 1,677 1,718 3,975 4,041
Niagara 62 65 94 100 229 235
Oneida 109 319 182 558 371 1,003
Onondaga 301 323 523 538 1,111 1,132
Ontario 29 29 40 42 62 64
Orange 247 336 510 666 1,155 1,411
Page 17
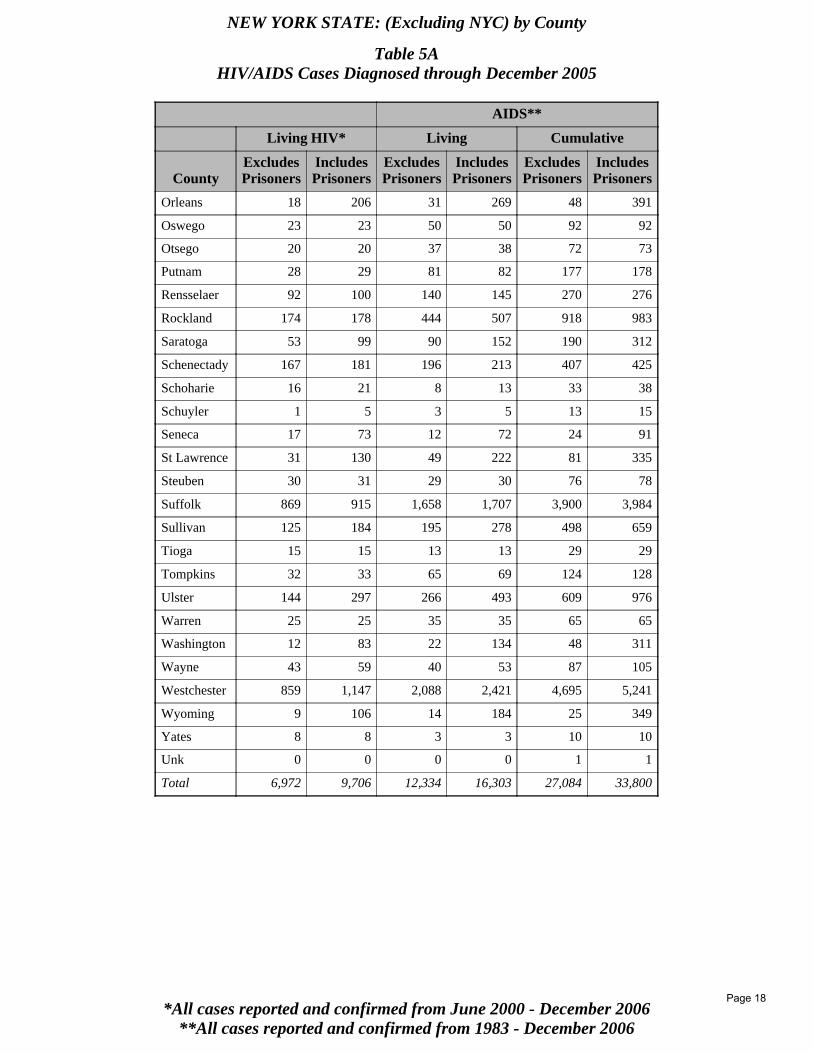
**All cases reported and confirmed from 1983 - December 2006*All cases reported and confirmed from June 2000 - December 2006
NEW YORK STATE: (Excluding NYC) by County
Table 5AHIV/AIDS Cases Diagnosed through December 2005
AIDS**
Living HIV* Living Cumulative
CountyExcludesPrisoners
IncludesPrisoners
ExcludesPrisoners
IncludesPrisoners
ExcludesPrisoners
IncludesPrisoners
Orleans 18 206 31 269 48 391
Oswego 23 23 50 50 92 92
Otsego 20 20 37 38 72 73
Putnam 28 29 81 82 177 178
Rensselaer 92 100 140 145 270 276
Rockland 174 178 444 507 918 983
Saratoga 53 99 90 152 190 312
Schenectady 167 181 196 213 407 425
Schoharie 16 21 8 13 33 38
Schuyler 1 5 3 5 13 15
Seneca 17 73 12 72 24 91
St Lawrence 31 130 49 222 81 335
Steuben 30 31 29 30 76 78
Suffolk 869 915 1,658 1,707 3,900 3,984
Sullivan 125 184 195 278 498 659
Tioga 15 15 13 13 29 29
Tompkins 32 33 65 69 124 128
Ulster 144 297 266 493 609 976
Warren 25 25 35 35 65 65
Washington 12 83 22 134 48 311
Wayne 43 59 40 53 87 105
Westchester 859 1,147 2,088 2,421 4,695 5,241
Wyoming 9 106 14 184 25 349
Yates 8 8 3 3 10 10
Unk 0 0 0 0 1 1
Total 6,972 9,706 12,334 16,303 27,084 33,800
Page 18
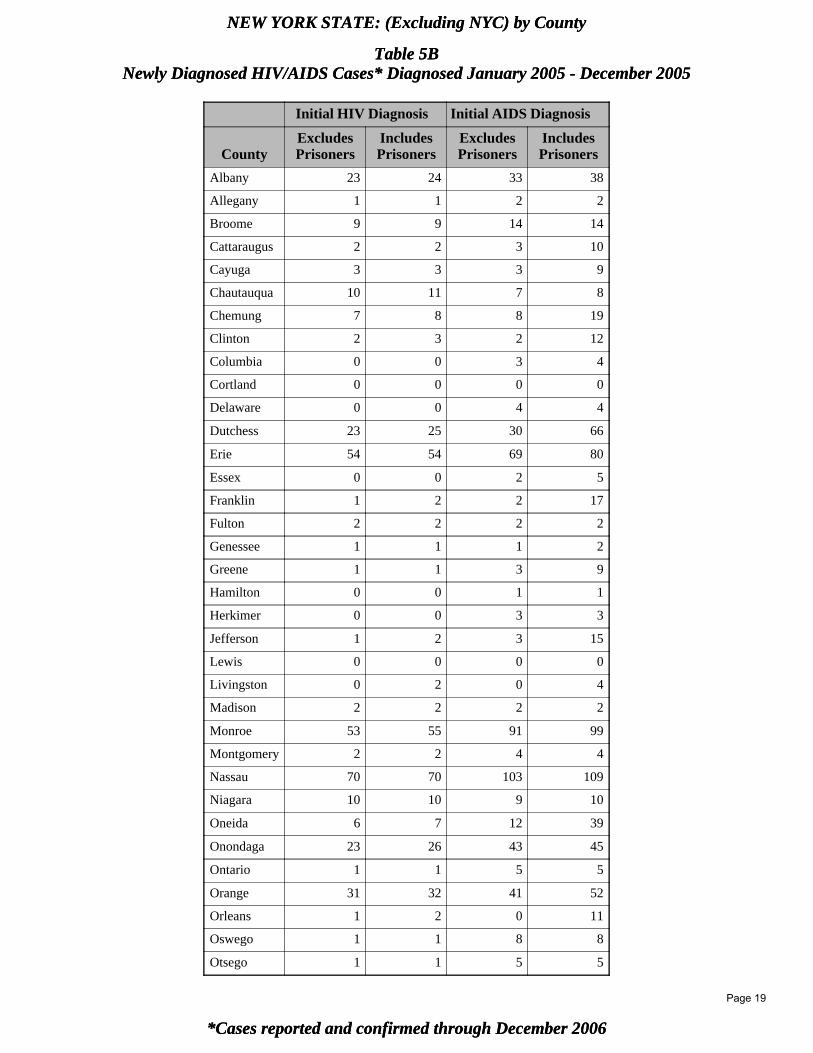
*Cases reported and confirmed through December 2006
NEW YORK STATE: (Excluding NYC) by County
Table 5BNewly Diagnosed HIV/AIDS Cases* Diagnosed January 2005 - December 2005
*Cases reported and confirmed through December 2006
NEW YORK STATE: (Excluding NYC) by County
Table 5BNewly Diagnosed HIV/AIDS Cases* Diagnosed January 2005 - December 2005
Initial HIV Diagnosis Initial AIDS Diagnosis
CountyExcludesPrisoners
IncludesPrisoners
ExcludesPrisoners
IncludesPrisoners
Albany 23 24 33 38
Allegany 1 1 2 2
Broome 9 9 14 14
Cattaraugus 2 2 3 10
Cayuga 3 3 3 9
Chautauqua 10 11 7 8
Chemung 7 8 8 19
Clinton 2 3 2 12
Columbia 0 0 3 4
Cortland 0 0 0 0
Delaware 0 0 4 4
Dutchess 23 25 30 66
Erie 54 54 69 80
Essex 0 0 2 5
Franklin 1 2 2 17
Fulton 2 2 2 2
Genessee 1 1 1 2
Greene 1 1 3 9
Hamilton 0 0 1 1
Herkimer 0 0 3 3
Jefferson 1 2 3 15
Lewis 0 0 0 0
Livingston 0 2 0 4
Madison 2 2 2 2
Monroe 53 55 91 99
Montgomery 2 2 4 4
Nassau 70 70 103 109
Niagara 10 10 9 10
Oneida 6 7 12 39
Onondaga 23 26 43 45
Ontario 1 1 5 5
Orange 31 32 41 52
Orleans 1 2 0 11
Oswego 1 1 8 8
Otsego 1 1 5 5
Page 19
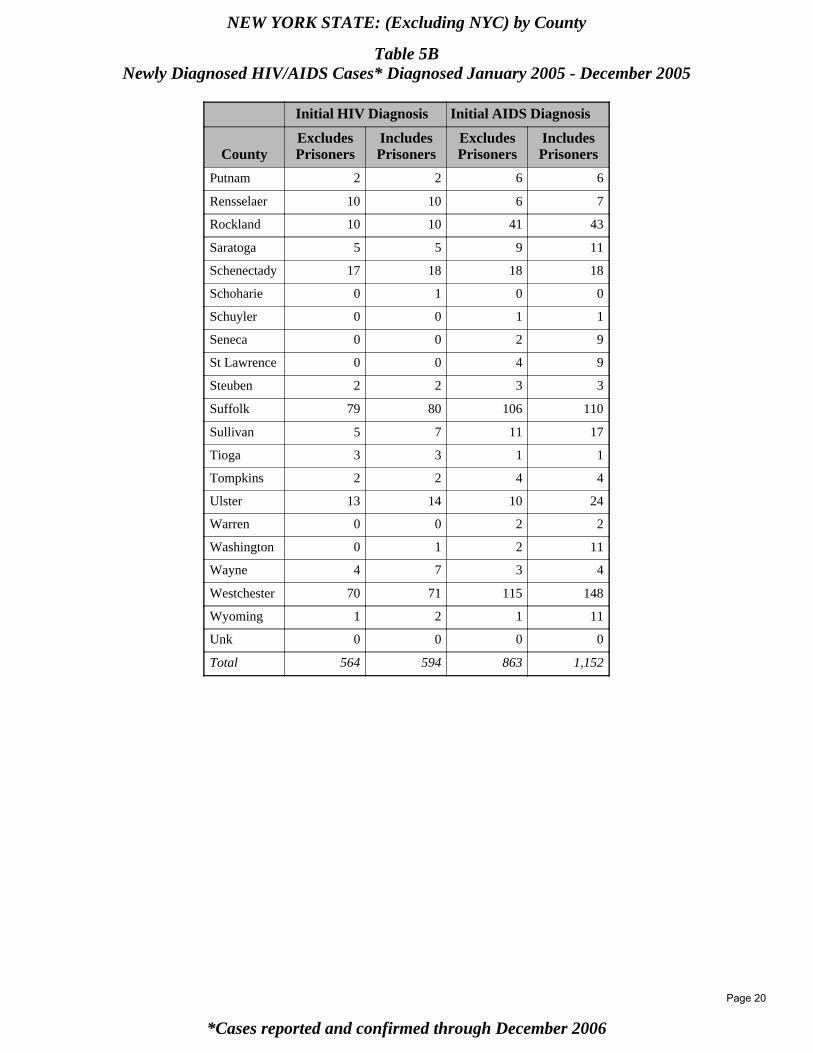
*Cases reported and confirmed through December 2006
NEW YORK STATE: (Excluding NYC) by County
Table 5BNewly Diagnosed HIV/AIDS Cases* Diagnosed January 2005 - December 2005
Initial HIV Diagnosis Initial AIDS Diagnosis
CountyExcludesPrisoners
IncludesPrisoners
ExcludesPrisoners
IncludesPrisoners
Putnam 2 2 6 6
Rensselaer 10 10 6 7
Rockland 10 10 41 43
Saratoga 5 5 9 11
Schenectady 17 18 18 18
Schoharie 0 1 0 0
Schuyler 0 0 1 1
Seneca 0 0 2 9
St Lawrence 0 0 4 9
Steuben 2 2 3 3
Suffolk 79 80 106 110
Sullivan 5 7 11 17
Tioga 3 3 1 1
Tompkins 2 2 4 4
Ulster 13 14 10 24
Warren 0 0 2 2
Washington 0 1 2 11
Wayne 4 7 3 4
Westchester 70 71 115 148
Wyoming 1 2 1 11
Unk 0 0 0 0
Total 564 594 863 1,152
Page 20

*Cases reported and confirmed through December 2006
NEW YORK CITY - Males
Table 6ALiving HIV/AIDS Cases (including prisoners) by Age, Race/Ethnicity and Risk
Diagnosed through December 2005*
*Cases reported and confirmed through December 2006
NEW YORK CITY - Males
Table 6ALiving HIV/AIDS Cases (including prisoners) by Age, Race/Ethnicity and Risk
Diagnosed through December 2005*
Living HIV Living AIDS
Number Percent Number Percent
Age Group 12 & under 712 3.4 366 1.0
13-19 463 2.2 283 0.8
20-24 1,519 7.3 1,023 2.8
25-29 2,589 12.4 3,190 8.6
30-49 13,022 62.6 26,793 72.2
50+ 2,492 12.0 5,444 14.7
Unk 10 0.0 0 0.0
Total 20,807 100.0 37,099 100.0
Race/Ethnicity White 6,002 28.8 8,478 22.9
Black 7,838 37.7 15,352 41.4
Hispanic 6,160 29.6 12,515 33.7
Asian/PI 339 1.6 517 1.4
Native Am 25 0.1 34 0.1
Multi Race 20 0.1 31 0.1
Other/Unk 423 2.0 172 0.5
Total 20,807 100.0 37,099 100.0
Risk MSM 9,791 47.1 14,063 37.9
IDU 2,045 9.8 9,397 25.3
MSM/IDU 394 1.9 1,166 3.1
Heterosexual 1,484 7.1 2,769 7.5
Blood Prod. 26 0.1 105 0.3
Pediatric Risk 729 3.5 481 1.3
Other/Unk 6,338 30.5 9,118 24.6
Total 20,807 100.0 37,099 100.0
Page 21

*Cases reported and confirmed through December 2006
NEW YORK CITY - Males
Table 6BNewly Diagnosed HIV/AIDS Cases (including prisoners) by Age, Race/Ethnicity and Risk
Diagnosed January 2005 - December 2005*
*Cases reported and confirmed through December 2006
NEW YORK CITY - Males
Table 6BNewly Diagnosed HIV/AIDS Cases (including prisoners) by Age, Race/Ethnicity and Risk
Diagnosed January 2005 - December 2005*
Initial HIV Initial AIDS
Number Percent Number Percent
Age Group 12 & under 4 0.2 3 0.1
13-19 73 4.3 40 1.6
20-24 189 11.0 114 4.6
25-29 274 16.0 169 6.9
30-49 964 56.1 1,570 63.8
50+ 213 12.4 564 22.9
Total 1,717 100.0 2,460 100.0
Race/Ethnicity White 382 22.2 464 18.9
Black 793 46.2 1,139 46.3
Hispanic 478 27.8 806 32.8
Asian/PI 55 3.2 42 1.7
Native Am 3 0.2 5 0.2
Multi Race 3 0.2 2 0.1
Other/Unk 3 0.2 2 0.1
Total 1,717 100.0 2,460 100.0
Risk MSM 962 56.0 1,007 40.9
IDU 97 5.6 299 12.2
MSM/IDU 17 1.0 69 2.8
Heterosexual 118 6.9 232 9.4
Blood Prod. 0 0.0 3 0.1
Pediatric Risk 3 0.2 17 0.7
Other/Unk 520 30.3 833 33.9
Total 1,717 100.0 2,460 100.0
Page 22
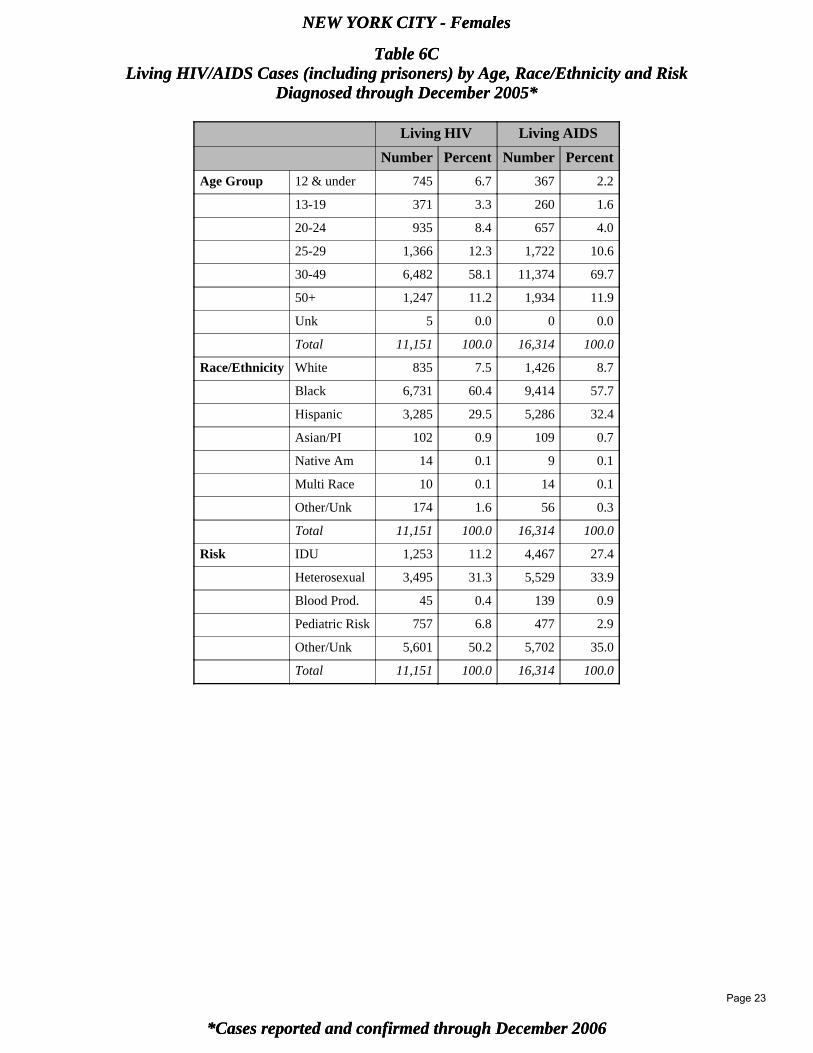
*Cases reported and confirmed through December 2006
NEW YORK CITY - Females
Table 6CLiving HIV/AIDS Cases (including prisoners) by Age, Race/Ethnicity and Risk
Diagnosed through December 2005*
*Cases reported and confirmed through December 2006
NEW YORK CITY - Females
Table 6CLiving HIV/AIDS Cases (including prisoners) by Age, Race/Ethnicity and Risk
Diagnosed through December 2005*
Living HIV Living AIDS
Number Percent Number Percent
Age Group 12 & under 745 6.7 367 2.2
13-19 371 3.3 260 1.6
20-24 935 8.4 657 4.0
25-29 1,366 12.3 1,722 10.6
30-49 6,482 58.1 11,374 69.7
50+ 1,247 11.2 1,934 11.9
Unk 5 0.0 0 0.0
Total 11,151 100.0 16,314 100.0
Race/Ethnicity White 835 7.5 1,426 8.7
Black 6,731 60.4 9,414 57.7
Hispanic 3,285 29.5 5,286 32.4
Asian/PI 102 0.9 109 0.7
Native Am 14 0.1 9 0.1
Multi Race 10 0.1 14 0.1
Other/Unk 174 1.6 56 0.3
Total 11,151 100.0 16,314 100.0
Risk IDU 1,253 11.2 4,467 27.4
Heterosexual 3,495 31.3 5,529 33.9
Blood Prod. 45 0.4 139 0.9
Pediatric Risk 757 6.8 477 2.9
Other/Unk 5,601 50.2 5,702 35.0
Total 11,151 100.0 16,314 100.0
Page 23
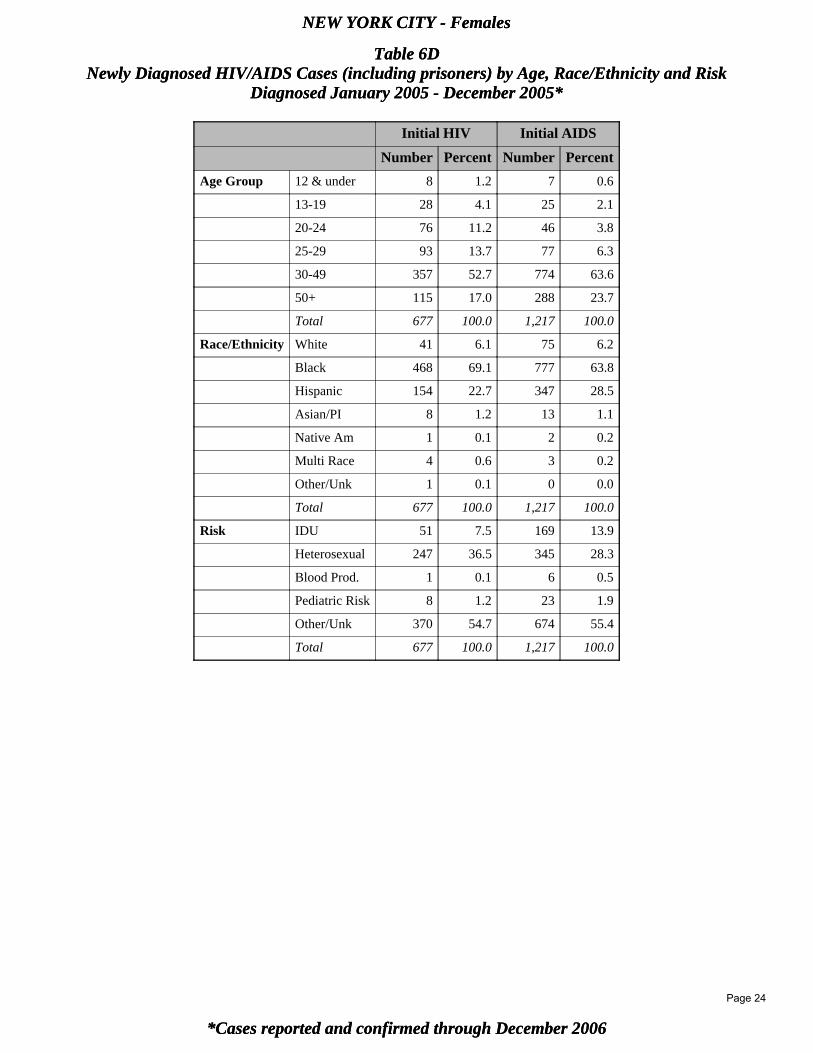
*Cases reported and confirmed through December 2006
NEW YORK CITY - Females
Table 6DNewly Diagnosed HIV/AIDS Cases (including prisoners) by Age, Race/Ethnicity and Risk
Diagnosed January 2005 - December 2005*
*Cases reported and confirmed through December 2006
NEW YORK CITY - Females
Table 6DNewly Diagnosed HIV/AIDS Cases (including prisoners) by Age, Race/Ethnicity and Risk
Diagnosed January 2005 - December 2005*
Initial HIV Initial AIDS
Number Percent Number Percent
Age Group 12 & under 8 1.2 7 0.6
13-19 28 4.1 25 2.1
20-24 76 11.2 46 3.8
25-29 93 13.7 77 6.3
30-49 357 52.7 774 63.6
50+ 115 17.0 288 23.7
Total 677 100.0 1,217 100.0
Race/Ethnicity White 41 6.1 75 6.2
Black 468 69.1 777 63.8
Hispanic 154 22.7 347 28.5
Asian/PI 8 1.2 13 1.1
Native Am 1 0.1 2 0.2
Multi Race 4 0.6 3 0.2
Other/Unk 1 0.1 0 0.0
Total 677 100.0 1,217 100.0
Risk IDU 51 7.5 169 13.9
Heterosexual 247 36.5 345 28.3
Blood Prod. 1 0.1 6 0.5
Pediatric Risk 8 1.2 23 1.9
Other/Unk 370 54.7 674 55.4
Total 677 100.0 1,217 100.0
Page 24
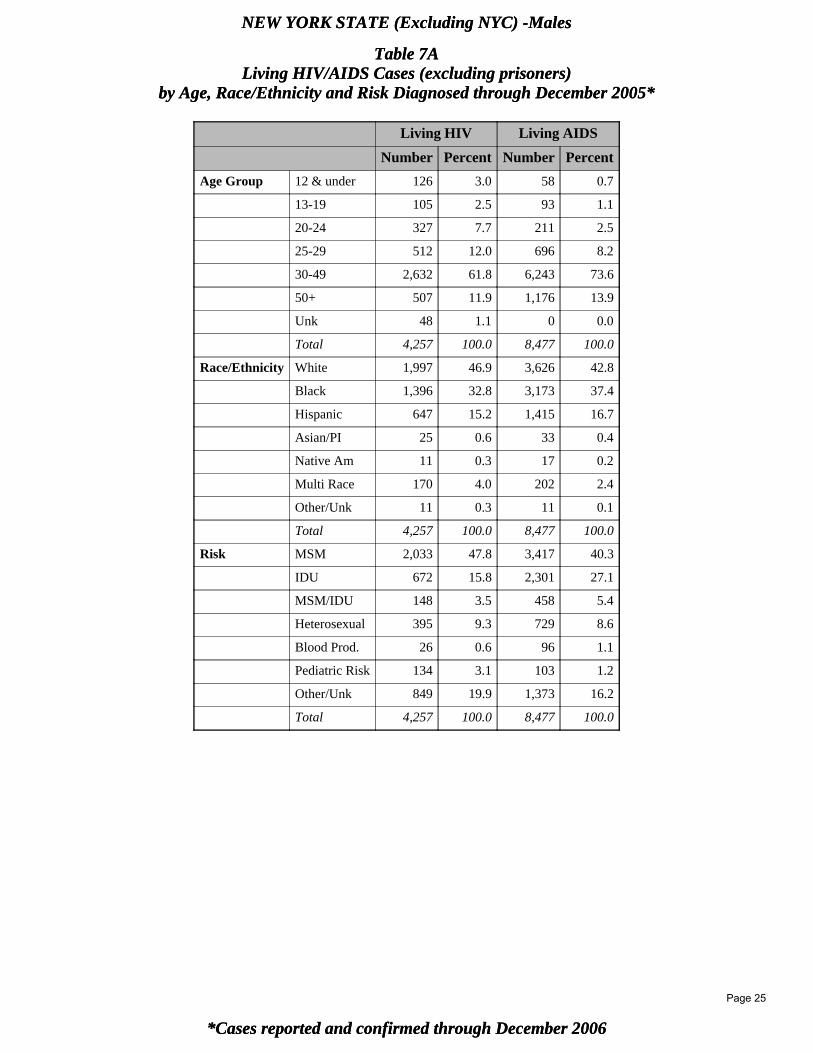
*Cases reported and confirmed through December 2006
NEW YORK STATE (Excluding NYC) -Males
Table 7ALiving HIV/AIDS Cases (excluding prisoners)
by Age, Race/Ethnicity and Risk Diagnosed through December 2005*
*Cases reported and confirmed through December 2006
NEW YORK STATE (Excluding NYC) -Males
Table 7ALiving HIV/AIDS Cases (excluding prisoners)
by Age, Race/Ethnicity and Risk Diagnosed through December 2005*
Living HIV Living AIDS
Number Percent Number Percent
Age Group 12 & under 126 3.0 58 0.7
13-19 105 2.5 93 1.1
20-24 327 7.7 211 2.5
25-29 512 12.0 696 8.2
30-49 2,632 61.8 6,243 73.6
50+ 507 11.9 1,176 13.9
Unk 48 1.1 0 0.0
Total 4,257 100.0 8,477 100.0
Race/Ethnicity White 1,997 46.9 3,626 42.8
Black 1,396 32.8 3,173 37.4
Hispanic 647 15.2 1,415 16.7
Asian/PI 25 0.6 33 0.4
Native Am 11 0.3 17 0.2
Multi Race 170 4.0 202 2.4
Other/Unk 11 0.3 11 0.1
Total 4,257 100.0 8,477 100.0
Risk MSM 2,033 47.8 3,417 40.3
IDU 672 15.8 2,301 27.1
MSM/IDU 148 3.5 458 5.4
Heterosexual 395 9.3 729 8.6
Blood Prod. 26 0.6 96 1.1
Pediatric Risk 134 3.1 103 1.2
Other/Unk 849 19.9 1,373 16.2
Total 4,257 100.0 8,477 100.0
Page 25
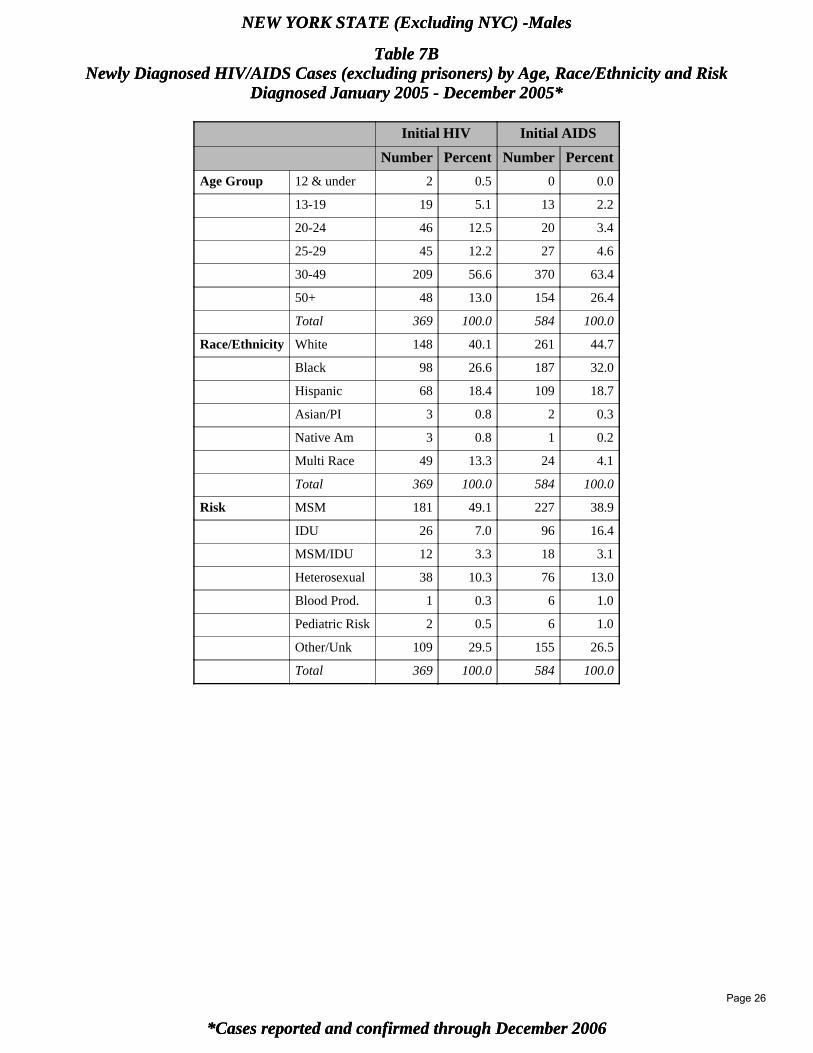
*Cases reported and confirmed through December 2006
NEW YORK STATE (Excluding NYC) -Males
Table 7BNewly Diagnosed HIV/AIDS Cases (excluding prisoners) by Age, Race/Ethnicity and Risk
Diagnosed January 2005 - December 2005*
*Cases reported and confirmed through December 2006
NEW YORK STATE (Excluding NYC) -Males
Table 7BNewly Diagnosed HIV/AIDS Cases (excluding prisoners) by Age, Race/Ethnicity and Risk
Diagnosed January 2005 - December 2005*
Initial HIV Initial AIDS
Number Percent Number Percent
Age Group 12 & under 2 0.5 0 0.0
13-19 19 5.1 13 2.2
20-24 46 12.5 20 3.4
25-29 45 12.2 27 4.6
30-49 209 56.6 370 63.4
50+ 48 13.0 154 26.4
Total 369 100.0 584 100.0
Race/Ethnicity White 148 40.1 261 44.7
Black 98 26.6 187 32.0
Hispanic 68 18.4 109 18.7
Asian/PI 3 0.8 2 0.3
Native Am 3 0.8 1 0.2
Multi Race 49 13.3 24 4.1
Total 369 100.0 584 100.0
Risk MSM 181 49.1 227 38.9
IDU 26 7.0 96 16.4
MSM/IDU 12 3.3 18 3.1
Heterosexual 38 10.3 76 13.0
Blood Prod. 1 0.3 6 1.0
Pediatric Risk 2 0.5 6 1.0
Other/Unk 109 29.5 155 26.5
Total 369 100.0 584 100.0
Page 26
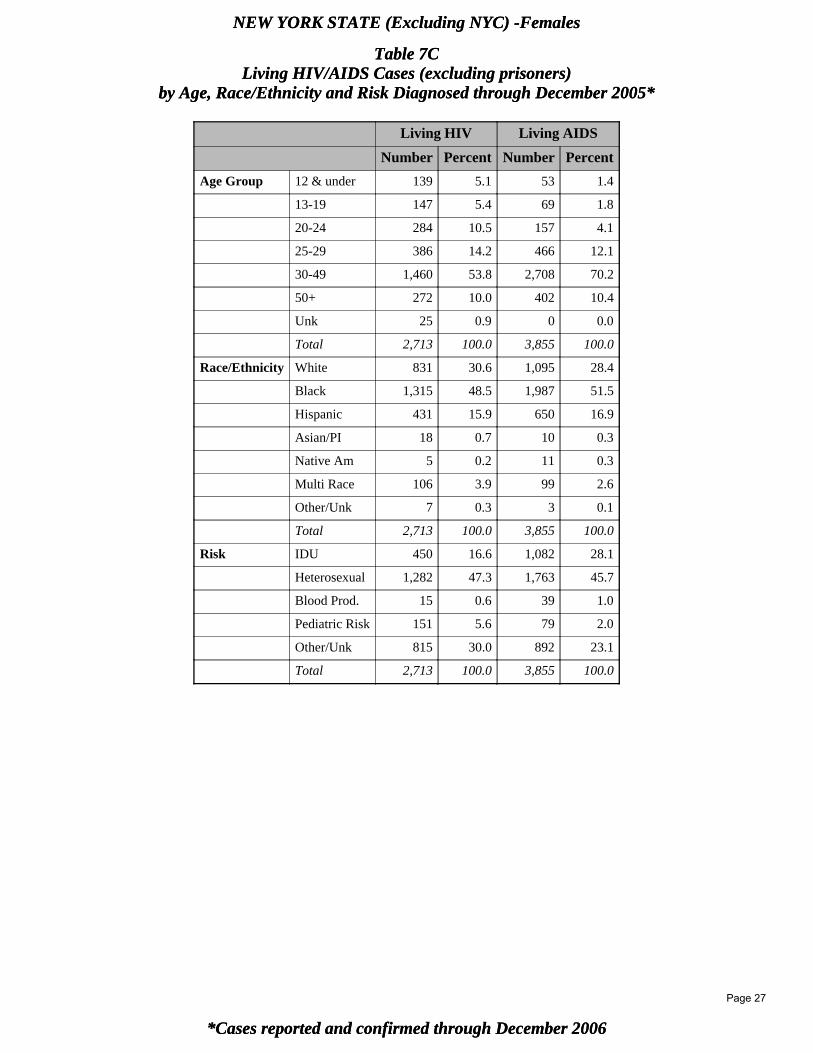
*Cases reported and confirmed through December 2006
NEW YORK STATE (Excluding NYC) -Females
Table 7CLiving HIV/AIDS Cases (excluding prisoners)
by Age, Race/Ethnicity and Risk Diagnosed through December 2005*
*Cases reported and confirmed through December 2006
NEW YORK STATE (Excluding NYC) -Females
Table 7CLiving HIV/AIDS Cases (excluding prisoners)
by Age, Race/Ethnicity and Risk Diagnosed through December 2005*
Living HIV Living AIDS
Number Percent Number Percent
Age Group 12 & under 139 5.1 53 1.4
13-19 147 5.4 69 1.8
20-24 284 10.5 157 4.1
25-29 386 14.2 466 12.1
30-49 1,460 53.8 2,708 70.2
50+ 272 10.0 402 10.4
Unk 25 0.9 0 0.0
Total 2,713 100.0 3,855 100.0
Race/Ethnicity White 831 30.6 1,095 28.4
Black 1,315 48.5 1,987 51.5
Hispanic 431 15.9 650 16.9
Asian/PI 18 0.7 10 0.3
Native Am 5 0.2 11 0.3
Multi Race 106 3.9 99 2.6
Other/Unk 7 0.3 3 0.1
Total 2,713 100.0 3,855 100.0
Risk IDU 450 16.6 1,082 28.1
Heterosexual 1,282 47.3 1,763 45.7
Blood Prod. 15 0.6 39 1.0
Pediatric Risk 151 5.6 79 2.0
Other/Unk 815 30.0 892 23.1
Total 2,713 100.0 3,855 100.0
Page 27
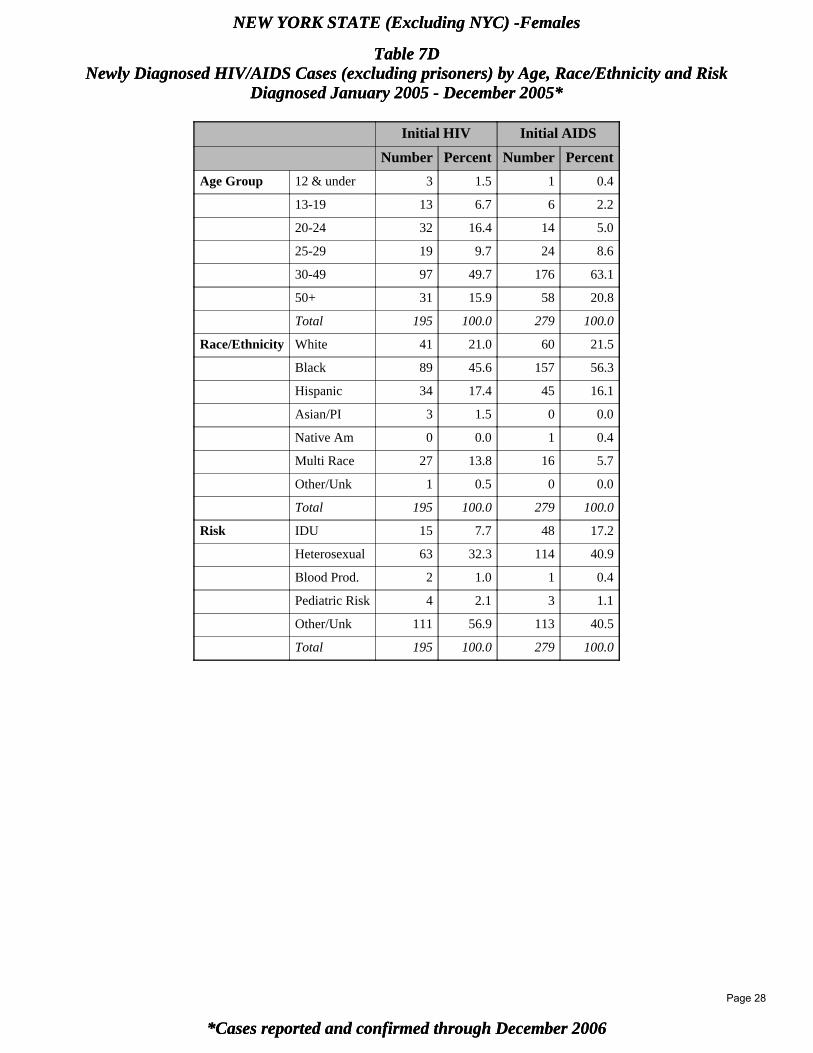
*Cases reported and confirmed through December 2006
NEW YORK STATE (Excluding NYC) -Females
Table 7DNewly Diagnosed HIV/AIDS Cases (excluding prisoners) by Age, Race/Ethnicity and Risk
Diagnosed January 2005 - December 2005*
*Cases reported and confirmed through December 2006
NEW YORK STATE (Excluding NYC) -Females
Table 7DNewly Diagnosed HIV/AIDS Cases (excluding prisoners) by Age, Race/Ethnicity and Risk
Diagnosed January 2005 - December 2005*
Initial HIV Initial AIDS
Number Percent Number Percent
Age Group 12 & under 3 1.5 1 0.4
13-19 13 6.7 6 2.2
20-24 32 16.4 14 5.0
25-29 19 9.7 24 8.6
30-49 97 49.7 176 63.1
50+ 31 15.9 58 20.8
Total 195 100.0 279 100.0
Race/Ethnicity White 41 21.0 60 21.5
Black 89 45.6 157 56.3
Hispanic 34 17.4 45 16.1
Asian/PI 3 1.5 0 0.0
Native Am 0 0.0 1 0.4
Multi Race 27 13.8 16 5.7
Other/Unk 1 0.5 0 0.0
Total 195 100.0 279 100.0
Risk IDU 15 7.7 48 17.2
Heterosexual 63 32.3 114 40.9
Blood Prod. 2 1.0 1 0.4
Pediatric Risk 4 2.1 3 1.1
Other/Unk 111 56.9 113 40.5
Total 195 100.0 279 100.0
Page 28
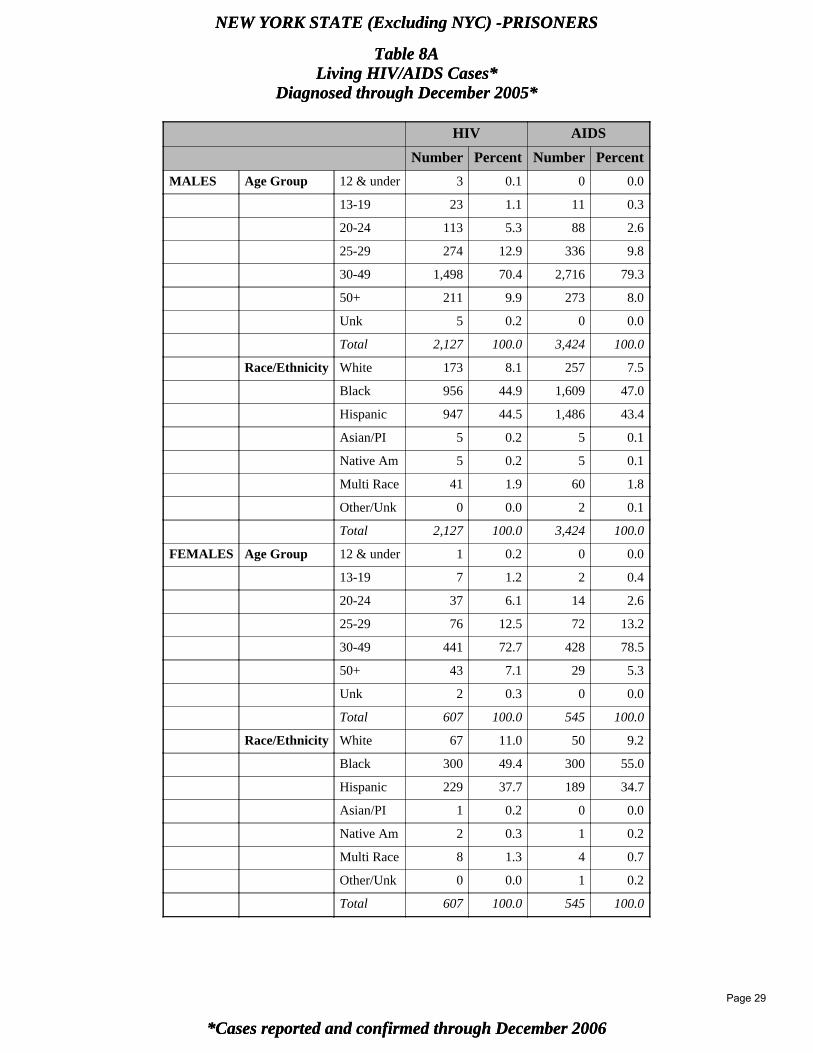
*Cases reported and confirmed through December 2006
NEW YORK STATE (Excluding NYC) -PRISONERS
Table 8ALiving HIV/AIDS Cases*
Diagnosed through December 2005*
*Cases reported and confirmed through December 2006
NEW YORK STATE (Excluding NYC) -PRISONERS
Table 8ALiving HIV/AIDS Cases*
Diagnosed through December 2005*
HIV AIDS
Number Percent Number Percent
MALES Age Group 12 & under 3 0.1 0 0.0
13-19 23 1.1 11 0.3
20-24 113 5.3 88 2.6
25-29 274 12.9 336 9.8
30-49 1,498 70.4 2,716 79.3
50+ 211 9.9 273 8.0
Unk 5 0.2 0 0.0
Total 2,127 100.0 3,424 100.0
Race/Ethnicity White 173 8.1 257 7.5
Black 956 44.9 1,609 47.0
Hispanic 947 44.5 1,486 43.4
Asian/PI 5 0.2 5 0.1
Native Am 5 0.2 5 0.1
Multi Race 41 1.9 60 1.8
Other/Unk 0 0.0 2 0.1
Total 2,127 100.0 3,424 100.0
FEMALES Age Group 12 & under 1 0.2 0 0.0
13-19 7 1.2 2 0.4
20-24 37 6.1 14 2.6
25-29 76 12.5 72 13.2
30-49 441 72.7 428 78.5
50+ 43 7.1 29 5.3
Unk 2 0.3 0 0.0
Total 607 100.0 545 100.0
Race/Ethnicity White 67 11.0 50 9.2
Black 300 49.4 300 55.0
Hispanic 229 37.7 189 34.7
Asian/PI 1 0.2 0 0.0
Native Am 2 0.3 1 0.2
Multi Race 8 1.3 4 0.7
Other/Unk 0 0.0 1 0.2
Total 607 100.0 545 100.0
Page 29
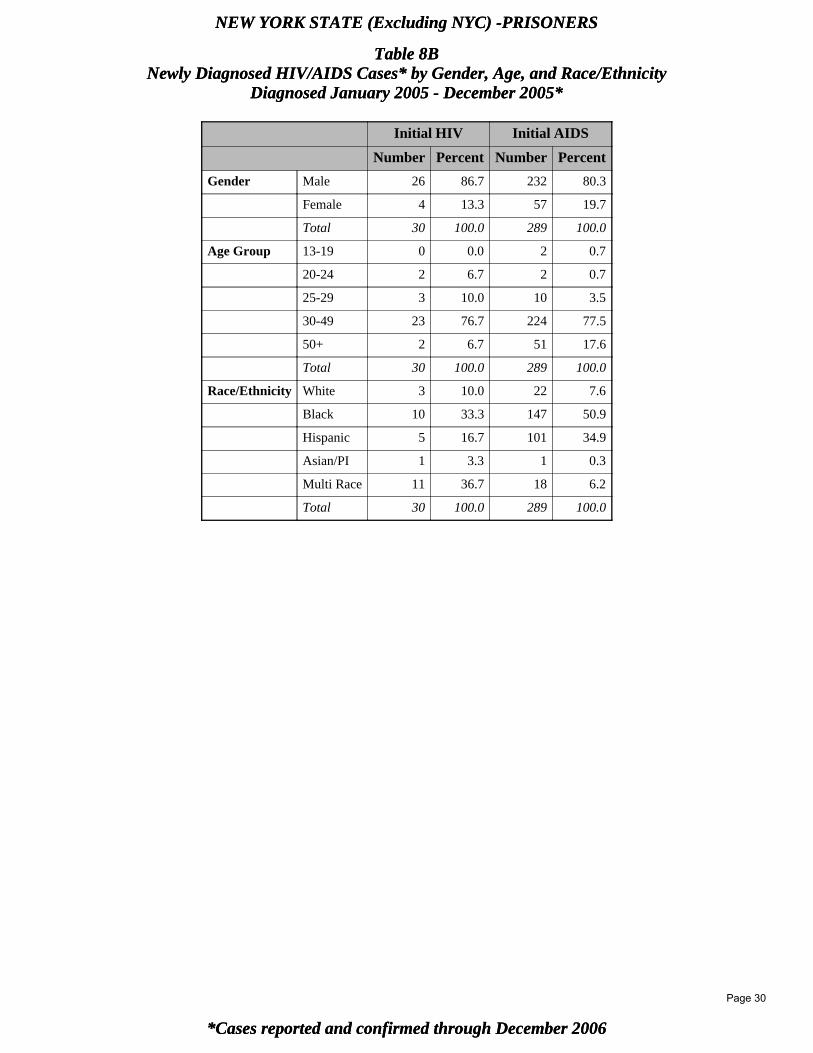
*Cases reported and confirmed through December 2006
NEW YORK STATE (Excluding NYC) -PRISONERS
Table 8BNewly Diagnosed HIV/AIDS Cases* by Gender, Age, and Race/Ethnicity
Diagnosed January 2005 - December 2005*
*Cases reported and confirmed through December 2006
NEW YORK STATE (Excluding NYC) -PRISONERS
Table 8BNewly Diagnosed HIV/AIDS Cases* by Gender, Age, and Race/Ethnicity
Diagnosed January 2005 - December 2005*
Initial HIV Initial AIDS
Number Percent Number Percent
Gender Male 26 86.7 232 80.3
Female 4 13.3 57 19.7
Total 30 100.0 289 100.0
Age Group 13-19 0 0.0 2 0.7
20-24 2 6.7 2 0.7
25-29 3 10.0 10 3.5
30-49 23 76.7 224 77.5
50+ 2 6.7 51 17.6
Total 30 100.0 289 100.0
Race/Ethnicity White 3 10.0 22 7.6
Black 10 33.3 147 50.9
Hispanic 5 16.7 101 34.9
Asian/PI 1 3.3 1 0.3
Multi Race 11 36.7 18 6.2
Total 30 100.0 289 100.0
Page 30
*Cases reported and confirmed through December 2006
NEW YORK STATE (Excluding NYC) by Ryan White Region
Table 9ALiving HIV/AIDS Cases* Diagnosed through December 2005
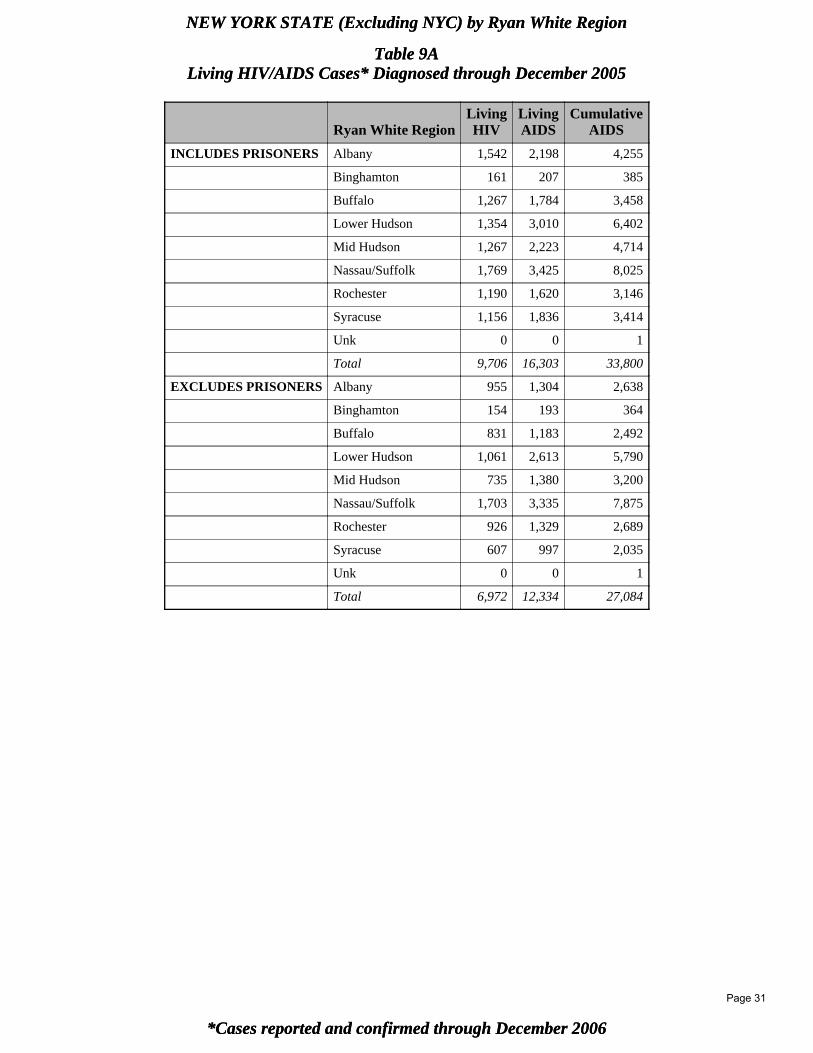
*Cases reported and confirmed through December 2006
NEW YORK STATE (Excluding NYC) by Ryan White Region
Table 9ALiving HIV/AIDS Cases* Diagnosed through December 2005
Ryan White RegionLivingHIV
LivingAIDS
CumulativeAIDS
INCLUDES PRISONERS Albany 1,542 2,198 4,255
Binghamton 161 207 385
Buffalo 1,267 1,784 3,458
Lower Hudson 1,354 3,010 6,402
Mid Hudson 1,267 2,223 4,714
Nassau/Suffolk 1,769 3,425 8,025
Rochester 1,190 1,620 3,146
Syracuse 1,156 1,836 3,414
Unk 0 0 1
Total 9,706 16,303 33,800
EXCLUDES PRISONERS Albany 955 1,304 2,638
Binghamton 154 193 364
Buffalo 831 1,183 2,492
Lower Hudson 1,061 2,613 5,790
Mid Hudson 735 1,380 3,200
Nassau/Suffolk 1,703 3,335 7,875
Rochester 926 1,329 2,689
Syracuse 607 997 2,035
Unk 0 0 1
Total 6,972 12,334 27,084
Page 31
*Cases reported and confirmed through December 2006
NEW YORK STATE (Excluding NYC) by Ryan White Region
Table 9BNewly Diagnosed HIV/AIDS Cases*
Diagnosed January 2005 - December 2005
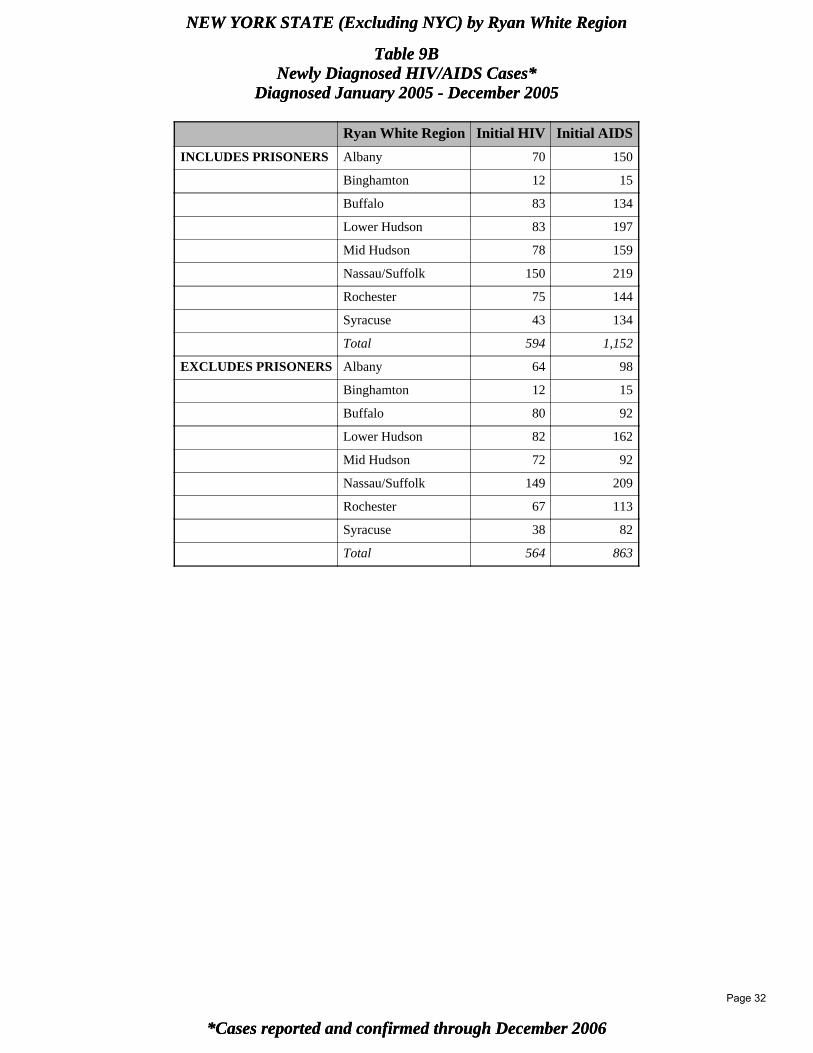
*Cases reported and confirmed through December 2006
NEW YORK STATE (Excluding NYC) by Ryan White Region
Table 9BNewly Diagnosed HIV/AIDS Cases*
Diagnosed January 2005 - December 2005
Ryan White Region Initial HIV Initial AIDS
INCLUDES PRISONERS Albany 70 150
Binghamton 12 15
Buffalo 83 134
Lower Hudson 83 197
Mid Hudson 78 159
Nassau/Suffolk 150 219
Rochester 75 144
Syracuse 43 134
Total 594 1,152
EXCLUDES PRISONERS Albany 64 98
Binghamton 12 15
Buffalo 80 92
Lower Hudson 82 162
Mid Hudson 72 92
Nassau/Suffolk 149 209
Rochester 67 113
Syracuse 38 82
Total 564 863
Page 32
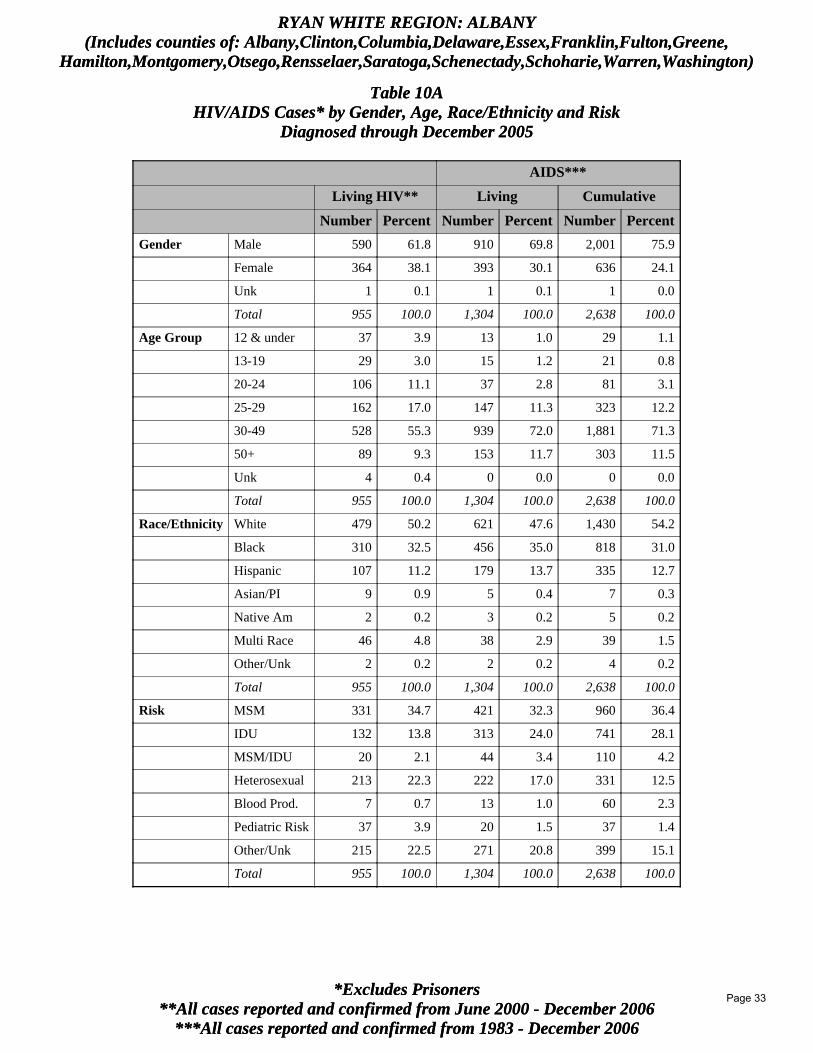
***All cases reported and confirmed from 1983 - December 2006**All cases reported and confirmed from June 2000 - December 2006
*Excludes Prisoners
RYAN WHITE REGION: ALBANY(Includes counties of: Albany,Clinton,Columbia,Delaware,Essex,Franklin,Fulton,Greene,
Hamilton,Montgomery,Otsego,Rensselaer,Saratoga,Schenectady,Schoharie,Warren,Washington)
Table 10AHIV/AIDS Cases* by Gender, Age, Race/Ethnicity and Risk
Diagnosed through December 2005
AIDS***
Living HIV** Living Cumulative
Number Percent Number Percent Number Percent
Gender Male 590 61.8 910 69.8 2,001 75.9
Female 364 38.1 393 30.1 636 24.1
Unk 1 0.1 1 0.1 1 0.0
Total 955 100.0 1,304 100.0 2,638 100.0
Age Group 12 & under 37 3.9 13 1.0 29 1.1
13-19 29 3.0 15 1.2 21 0.8
20-24 106 11.1 37 2.8 81 3.1
25-29 162 17.0 147 11.3 323 12.2
30-49 528 55.3 939 72.0 1,881 71.3
50+ 89 9.3 153 11.7 303 11.5
Unk 4 0.4 0 0.0 0 0.0
Total 955 100.0 1,304 100.0 2,638 100.0
Race/Ethnicity White 479 50.2 621 47.6 1,430 54.2
Black 310 32.5 456 35.0 818 31.0
Hispanic 107 11.2 179 13.7 335 12.7
Asian/PI 9 0.9 5 0.4 7 0.3
Native Am 2 0.2 3 0.2 5 0.2
Multi Race 46 4.8 38 2.9 39 1.5
Other/Unk 2 0.2 2 0.2 4 0.2
Total 955 100.0 1,304 100.0 2,638 100.0
Risk MSM 331 34.7 421 32.3 960 36.4
IDU 132 13.8 313 24.0 741 28.1
MSM/IDU 20 2.1 44 3.4 110 4.2
Heterosexual 213 22.3 222 17.0 331 12.5
Blood Prod. 7 0.7 13 1.0 60 2.3
Pediatric Risk 37 3.9 20 1.5 37 1.4
Other/Unk 215 22.5 271 20.8 399 15.1
Total 955 100.0 1,304 100.0 2,638 100.0
Page 33
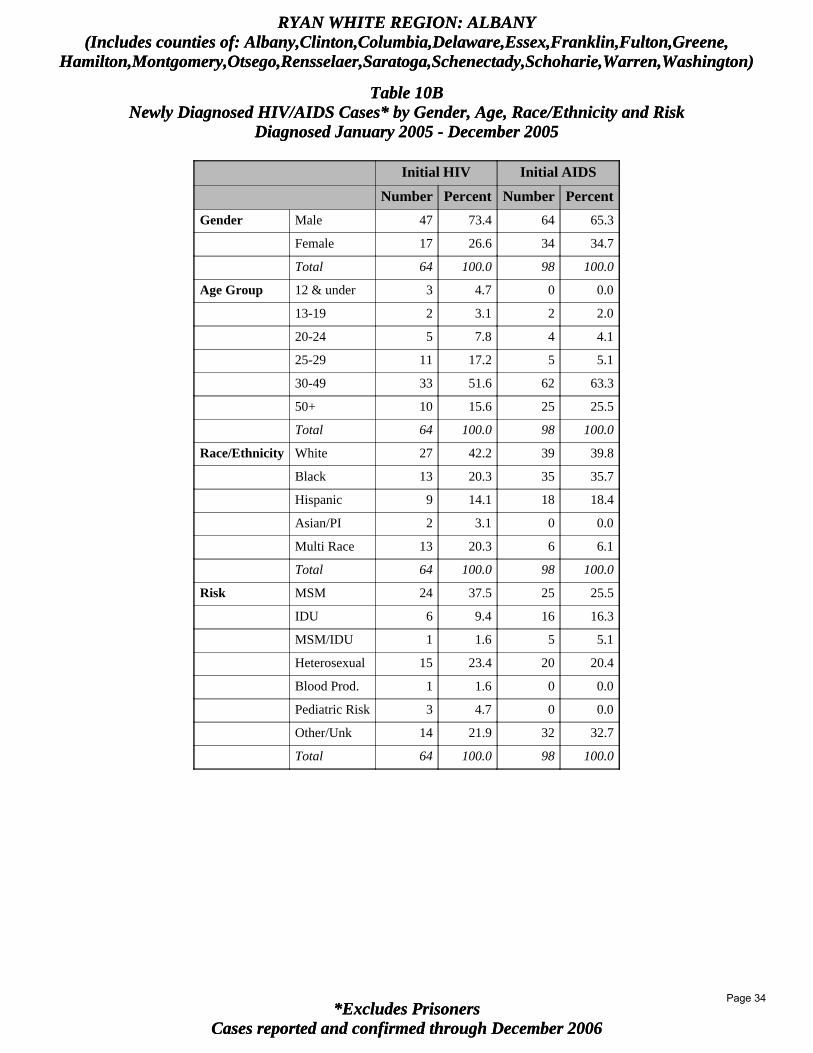
Cases reported and confirmed through December 2006*Excludes Prisoners
RYAN WHITE REGION: ALBANY(Includes counties of: Albany,Clinton,Columbia,Delaware,Essex,Franklin,Fulton,Greene,
Hamilton,Montgomery,Otsego,Rensselaer,Saratoga,Schenectady,Schoharie,Warren,Washington)
Table 10BNewly Diagnosed HIV/AIDS Cases* by Gender, Age, Race/Ethnicity and Risk
Diagnosed January 2005 - December 2005
Initial HIV Initial AIDS
Number Percent Number Percent
Gender Male 47 73.4 64 65.3
Female 17 26.6 34 34.7
Total 64 100.0 98 100.0
Age Group 12 & under 3 4.7 0 0.0
13-19 2 3.1 2 2.0
20-24 5 7.8 4 4.1
25-29 11 17.2 5 5.1
30-49 33 51.6 62 63.3
50+ 10 15.6 25 25.5
Total 64 100.0 98 100.0
Race/Ethnicity White 27 42.2 39 39.8
Black 13 20.3 35 35.7
Hispanic 9 14.1 18 18.4
Asian/PI 2 3.1 0 0.0
Multi Race 13 20.3 6 6.1
Total 64 100.0 98 100.0
Risk MSM 24 37.5 25 25.5
IDU 6 9.4 16 16.3
MSM/IDU 1 1.6 5 5.1
Heterosexual 15 23.4 20 20.4
Blood Prod. 1 1.6 0 0.0
Pediatric Risk 3 4.7 0 0.0
Other/Unk 14 21.9 32 32.7
Total 64 100.0 98 100.0
Page 34
***All cases reported and confirmed from 1983 - December 2006**All cases reported and confirmed from June 2000 - December 2006
*Excludes Prisoners
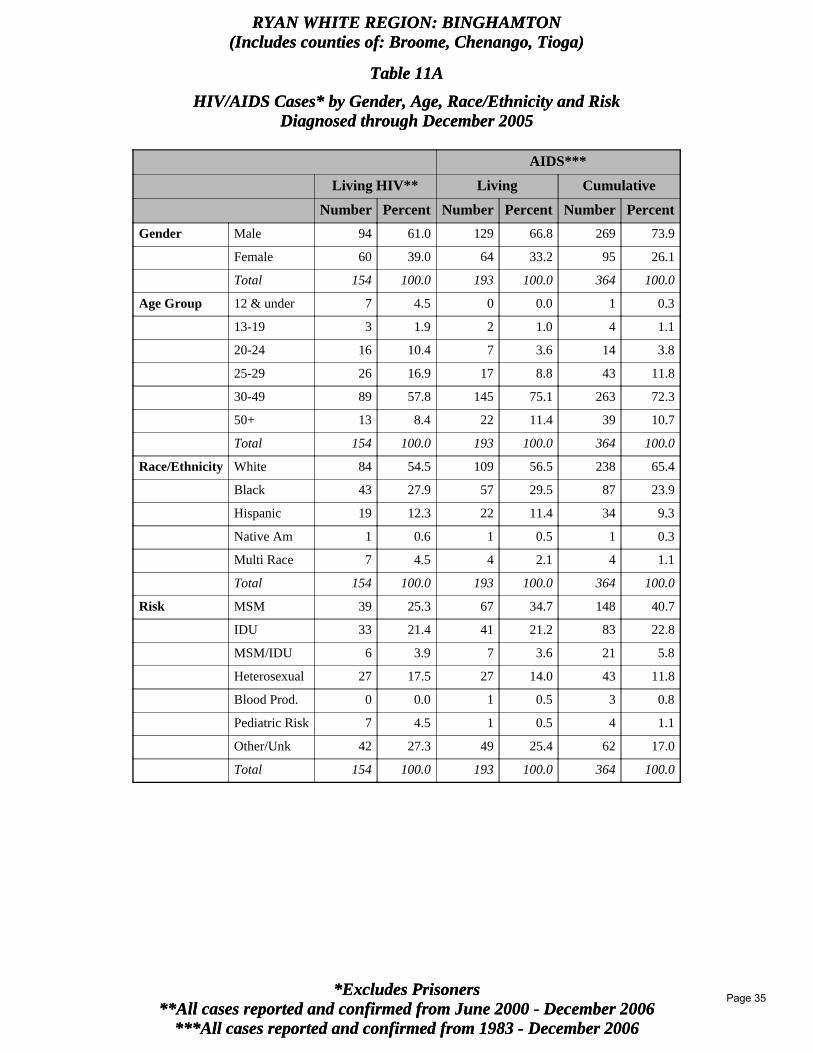
RYAN WHITE REGION: BINGHAMTON(Includes counties of: Broome, Chenango, Tioga)
Table 11A
HIV/AIDS Cases* by Gender, Age, Race/Ethnicity and RiskDiagnosed through December 2005
***All cases reported and confirmed from 1983 - December 2006**All cases reported and confirmed from June 2000 - December 2006
*Excludes Prisoners
RYAN WHITE REGION: BINGHAMTON(Includes counties of: Broome, Chenango, Tioga)
Table 11A
HIV/AIDS Cases* by Gender, Age, Race/Ethnicity and RiskDiagnosed through December 2005
AIDS***
Living HIV** Living Cumulative
Number Percent Number Percent Number Percent
Gender Male 94 61.0 129 66.8 269 73.9
Female 60 39.0 64 33.2 95 26.1
Total 154 100.0 193 100.0 364 100.0
Age Group 12 & under 7 4.5 0 0.0 1 0.3
13-19 3 1.9 2 1.0 4 1.1
20-24 16 10.4 7 3.6 14 3.8
25-29 26 16.9 17 8.8 43 11.8
30-49 89 57.8 145 75.1 263 72.3
50+ 13 8.4 22 11.4 39 10.7
Total 154 100.0 193 100.0 364 100.0
Race/Ethnicity White 84 54.5 109 56.5 238 65.4
Black 43 27.9 57 29.5 87 23.9
Hispanic 19 12.3 22 11.4 34 9.3
Native Am 1 0.6 1 0.5 1 0.3
Multi Race 7 4.5 4 2.1 4 1.1
Total 154 100.0 193 100.0 364 100.0
Risk MSM 39 25.3 67 34.7 148 40.7
IDU 33 21.4 41 21.2 83 22.8
MSM/IDU 6 3.9 7 3.6 21 5.8
Heterosexual 27 17.5 27 14.0 43 11.8
Blood Prod. 0 0.0 1 0.5 3 0.8
Pediatric Risk 7 4.5 1 0.5 4 1.1
Other/Unk 42 27.3 49 25.4 62 17.0
Total 154 100.0 193 100.0 364 100.0
Page 35
Cases reported and confirmed through December 2006*Excludes Prisoners
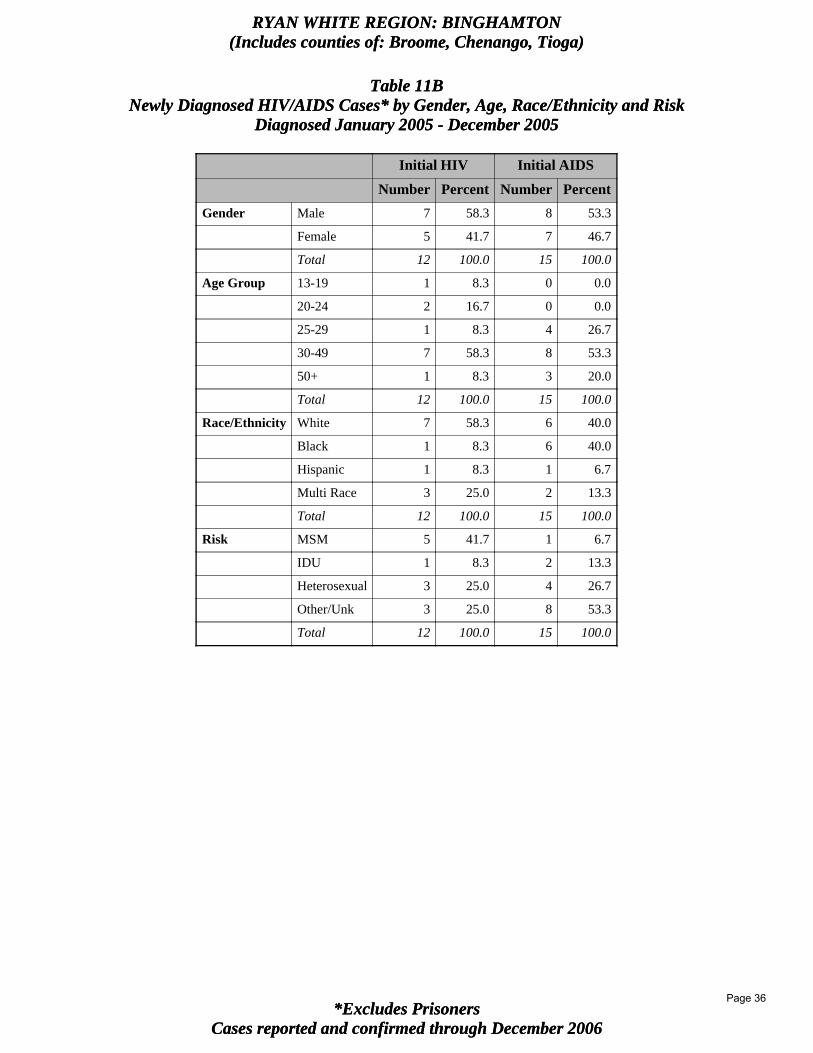
RYAN WHITE REGION: BINGHAMTON(Includes counties of: Broome, Chenango, Tioga)
Table 11BNewly Diagnosed HIV/AIDS Cases* by Gender, Age, Race/Ethnicity and Risk
Diagnosed January 2005 - December 2005
Cases reported and confirmed through December 2006*Excludes Prisoners
RYAN WHITE REGION: BINGHAMTON(Includes counties of: Broome, Chenango, Tioga)
Table 11BNewly Diagnosed HIV/AIDS Cases* by Gender, Age, Race/Ethnicity and Risk
Diagnosed January 2005 - December 2005
Initial HIV Initial AIDS
Number Percent Number Percent
Gender Male 7 58.3 8 53.3
Female 5 41.7 7 46.7
Total 12 100.0 15 100.0
Age Group 13-19 1 8.3 0 0.0
20-24 2 16.7 0 0.0
25-29 1 8.3 4 26.7
30-49 7 58.3 8 53.3
50+ 1 8.3 3 20.0
Total 12 100.0 15 100.0
Race/Ethnicity White 7 58.3 6 40.0
Black 1 8.3 6 40.0
Hispanic 1 8.3 1 6.7
Multi Race 3 25.0 2 13.3
Total 12 100.0 15 100.0
Risk MSM 5 41.7 1 6.7
IDU 1 8.3 2 13.3
Heterosexual 3 25.0 4 26.7
Other/Unk 3 25.0 8 53.3
Total 12 100.0 15 100.0
Page 36
***All cases reported and confirmed from 1983 - December 2006**All cases reported and confirmed from June 2000 - December 2006
*Excludes Prisoners
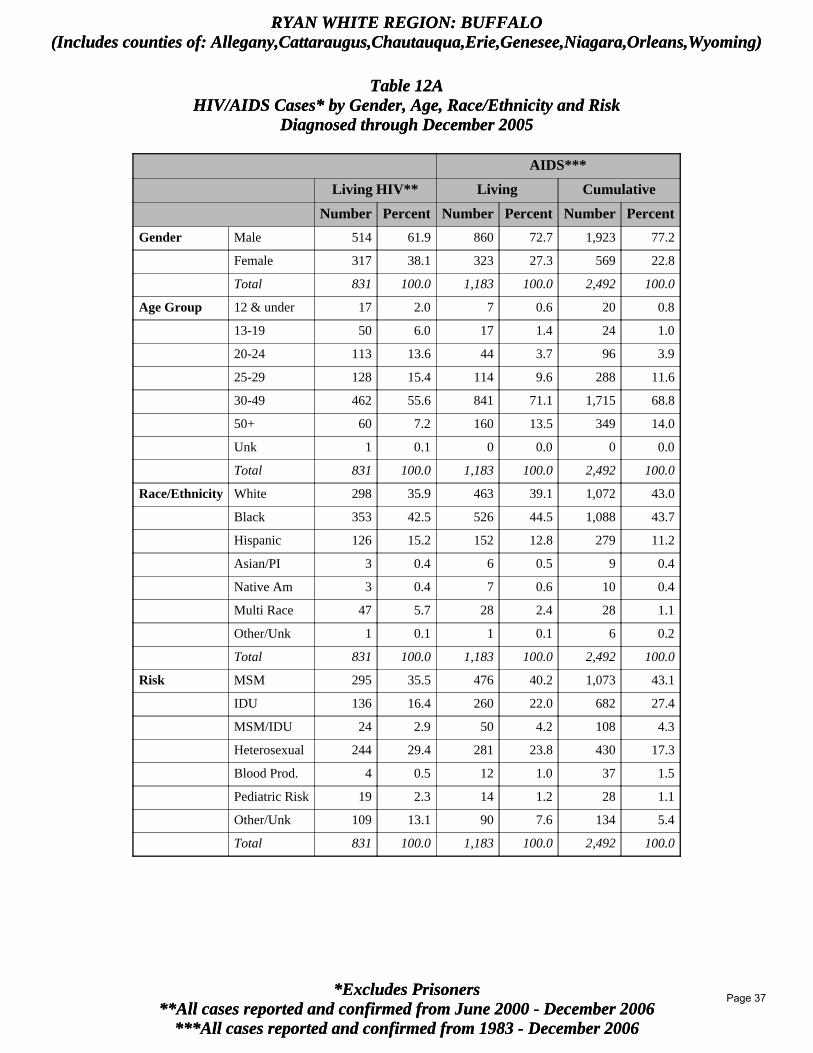
RYAN WHITE REGION: BUFFALO(Includes counties of: Allegany,Cattaraugus,Chautauqua,Erie,Genesee,Niagara,Orleans,Wyoming)
Table 12AHIV/AIDS Cases* by Gender, Age, Race/Ethnicity and Risk
Diagnosed through December 2005
***All cases reported and confirmed from 1983 - December 2006**All cases reported and confirmed from June 2000 - December 2006
*Excludes Prisoners
RYAN WHITE REGION: BUFFALO(Includes counties of: Allegany,Cattaraugus,Chautauqua,Erie,Genesee,Niagara,Orleans,Wyoming)
Table 12AHIV/AIDS Cases* by Gender, Age, Race/Ethnicity and Risk
Diagnosed through December 2005
AIDS***
Living HIV** Living Cumulative
Number Percent Number Percent Number Percent
Gender Male 514 61.9 860 72.7 1,923 77.2
Female 317 38.1 323 27.3 569 22.8
Total 831 100.0 1,183 100.0 2,492 100.0
Age Group 12 & under 17 2.0 7 0.6 20 0.8
13-19 50 6.0 17 1.4 24 1.0
20-24 113 13.6 44 3.7 96 3.9
25-29 128 15.4 114 9.6 288 11.6
30-49 462 55.6 841 71.1 1,715 68.8
50+ 60 7.2 160 13.5 349 14.0
Unk 1 0.1 0 0.0 0 0.0
Total 831 100.0 1,183 100.0 2,492 100.0
Race/Ethnicity White 298 35.9 463 39.1 1,072 43.0
Black 353 42.5 526 44.5 1,088 43.7
Hispanic 126 15.2 152 12.8 279 11.2
Asian/PI 3 0.4 6 0.5 9 0.4
Native Am 3 0.4 7 0.6 10 0.4
Multi Race 47 5.7 28 2.4 28 1.1
Other/Unk 1 0.1 1 0.1 6 0.2
Total 831 100.0 1,183 100.0 2,492 100.0
Risk MSM 295 35.5 476 40.2 1,073 43.1
IDU 136 16.4 260 22.0 682 27.4
MSM/IDU 24 2.9 50 4.2 108 4.3
Heterosexual 244 29.4 281 23.8 430 17.3
Blood Prod. 4 0.5 12 1.0 37 1.5
Pediatric Risk 19 2.3 14 1.2 28 1.1
Other/Unk 109 13.1 90 7.6 134 5.4
Total 831 100.0 1,183 100.0 2,492 100.0
Page 37

Cases reported and confirmed through December 2006*Excludes Prisoners
RYAN WHITE REGION: BUFFALO(Includes counties of: Allegany,Cattaraugus,Chautauqua,Erie,Genesee,Niagara,Orleans,Wyoming)
Table 12BNewly Diagnosed HIV/AIDS Cases* by Gender, Age, Race/Ethnicity and Risk
Diagnosed January 2005 - December 2005
Initial HIV Initial AIDS
Number Percent Number Percent
Gender Male 51 63.8 64 69.6
Female 29 36.3 28 30.4
Total 80 100.0 92 100.0
Age Group 13-19 7 8.8 1 1.1
20-24 17 21.3 3 3.3
25-29 7 8.8 4 4.3
30-49 40 50.0 61 66.3
50+ 9 11.3 23 25.0
Total 80 100.0 92 100.0
Race/Ethnicity White 23 28.8 36 39.1
Black 26 32.5 41 44.6
Hispanic 13 16.3 11 12.0
Native Am 2 2.5 0 0.0
Multi Race 16 20.0 4 4.3
Total 80 100.0 92 100.0
Risk MSM 28 35.0 27 29.3
IDU 8 10.0 20 21.7
MSM/IDU 2 2.5 2 2.2
Heterosexual 13 16.3 22 23.9
Blood Prod. 0 0.0 1 1.1
Pediatric Risk 0 0.0 1 1.1
Other/Unk 29 36.3 19 20.7
Total 80 100.0 92 100.0
Page 38
***All cases reported and confirmed from 1983 - December 2006**All cases reported and confirmed from June 2000 - December 2006
*Excludes Prisoners
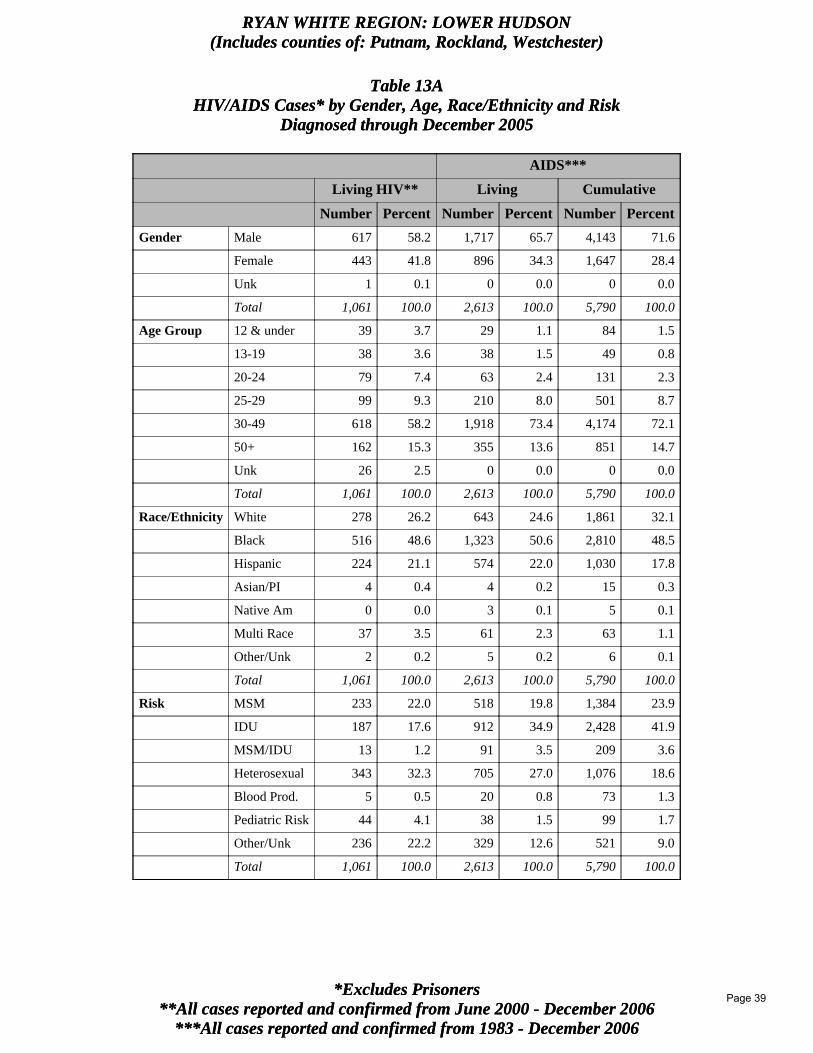
RYAN WHITE REGION: LOWER HUDSON(Includes counties of: Putnam, Rockland, Westchester)
Table 13AHIV/AIDS Cases* by Gender, Age, Race/Ethnicity and Risk
Diagnosed through December 2005
***All cases reported and confirmed from 1983 - December 2006**All cases reported and confirmed from June 2000 - December 2006
*Excludes Prisoners
RYAN WHITE REGION: LOWER HUDSON(Includes counties of: Putnam, Rockland, Westchester)
Table 13AHIV/AIDS Cases* by Gender, Age, Race/Ethnicity and Risk
Diagnosed through December 2005
AIDS***
Living HIV** Living Cumulative
Number Percent Number Percent Number Percent
Gender Male 617 58.2 1,717 65.7 4,143 71.6
Female 443 41.8 896 34.3 1,647 28.4
Unk 1 0.1 0 0.0 0 0.0
Total 1,061 100.0 2,613 100.0 5,790 100.0
Age Group 12 & under 39 3.7 29 1.1 84 1.5
13-19 38 3.6 38 1.5 49 0.8
20-24 79 7.4 63 2.4 131 2.3
25-29 99 9.3 210 8.0 501 8.7
30-49 618 58.2 1,918 73.4 4,174 72.1
50+ 162 15.3 355 13.6 851 14.7
Unk 26 2.5 0 0.0 0 0.0
Total 1,061 100.0 2,613 100.0 5,790 100.0
Race/Ethnicity White 278 26.2 643 24.6 1,861 32.1
Black 516 48.6 1,323 50.6 2,810 48.5
Hispanic 224 21.1 574 22.0 1,030 17.8
Asian/PI 4 0.4 4 0.2 15 0.3
Native Am 0 0.0 3 0.1 5 0.1
Multi Race 37 3.5 61 2.3 63 1.1
Other/Unk 2 0.2 5 0.2 6 0.1
Total 1,061 100.0 2,613 100.0 5,790 100.0
Risk MSM 233 22.0 518 19.8 1,384 23.9
IDU 187 17.6 912 34.9 2,428 41.9
MSM/IDU 13 1.2 91 3.5 209 3.6
Heterosexual 343 32.3 705 27.0 1,076 18.6
Blood Prod. 5 0.5 20 0.8 73 1.3
Pediatric Risk 44 4.1 38 1.5 99 1.7
Other/Unk 236 22.2 329 12.6 521 9.0
Total 1,061 100.0 2,613 100.0 5,790 100.0
Page 39
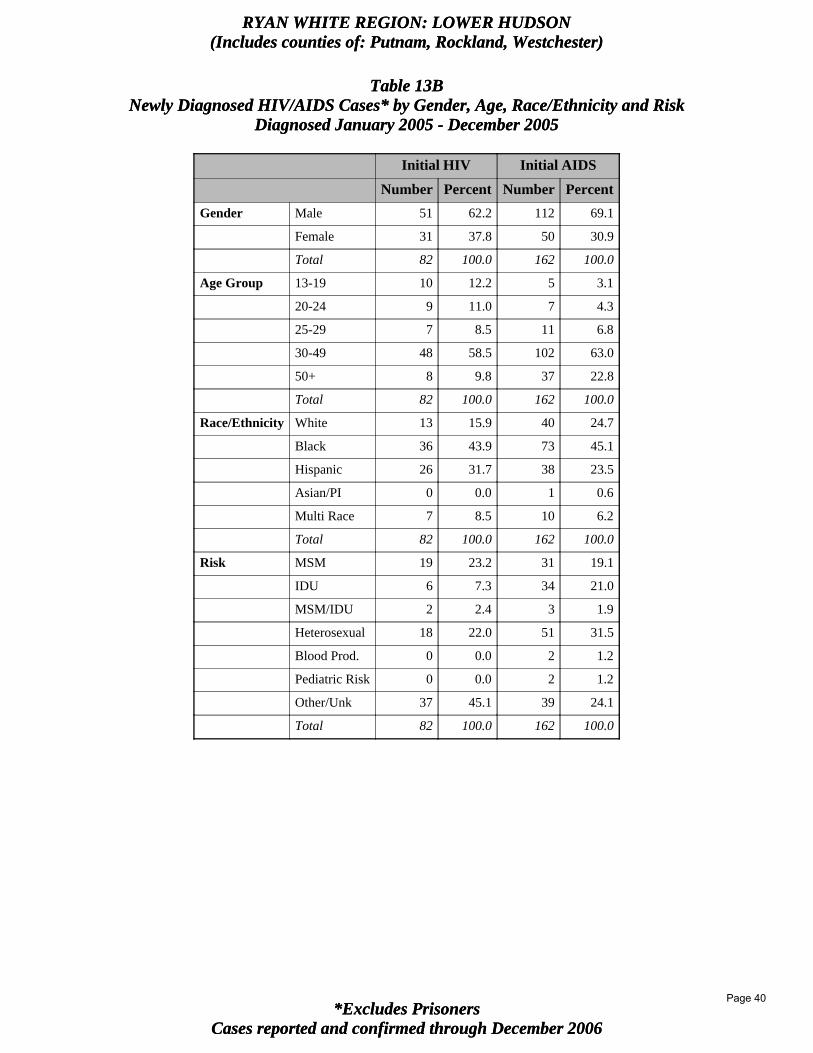
Cases reported and confirmed through December 2006*Excludes Prisoners
RYAN WHITE REGION: LOWER HUDSON(Includes counties of: Putnam, Rockland, Westchester)
Table 13BNewly Diagnosed HIV/AIDS Cases* by Gender, Age, Race/Ethnicity and Risk
Diagnosed January 2005 - December 2005
Cases reported and confirmed through December 2006*Excludes Prisoners
RYAN WHITE REGION: LOWER HUDSON(Includes counties of: Putnam, Rockland, Westchester)
Table 13BNewly Diagnosed HIV/AIDS Cases* by Gender, Age, Race/Ethnicity and Risk
Diagnosed January 2005 - December 2005
Initial HIV Initial AIDS
Number Percent Number Percent
Gender Male 51 62.2 112 69.1
Female 31 37.8 50 30.9
Total 82 100.0 162 100.0
Age Group 13-19 10 12.2 5 3.1
20-24 9 11.0 7 4.3
25-29 7 8.5 11 6.8
30-49 48 58.5 102 63.0
50+ 8 9.8 37 22.8
Total 82 100.0 162 100.0
Race/Ethnicity White 13 15.9 40 24.7
Black 36 43.9 73 45.1
Hispanic 26 31.7 38 23.5
Asian/PI 0 0.0 1 0.6
Multi Race 7 8.5 10 6.2
Total 82 100.0 162 100.0
Risk MSM 19 23.2 31 19.1
IDU 6 7.3 34 21.0
MSM/IDU 2 2.4 3 1.9
Heterosexual 18 22.0 51 31.5
Blood Prod. 0 0.0 2 1.2
Pediatric Risk 0 0.0 2 1.2
Other/Unk 37 45.1 39 24.1
Total 82 100.0 162 100.0
Page 40
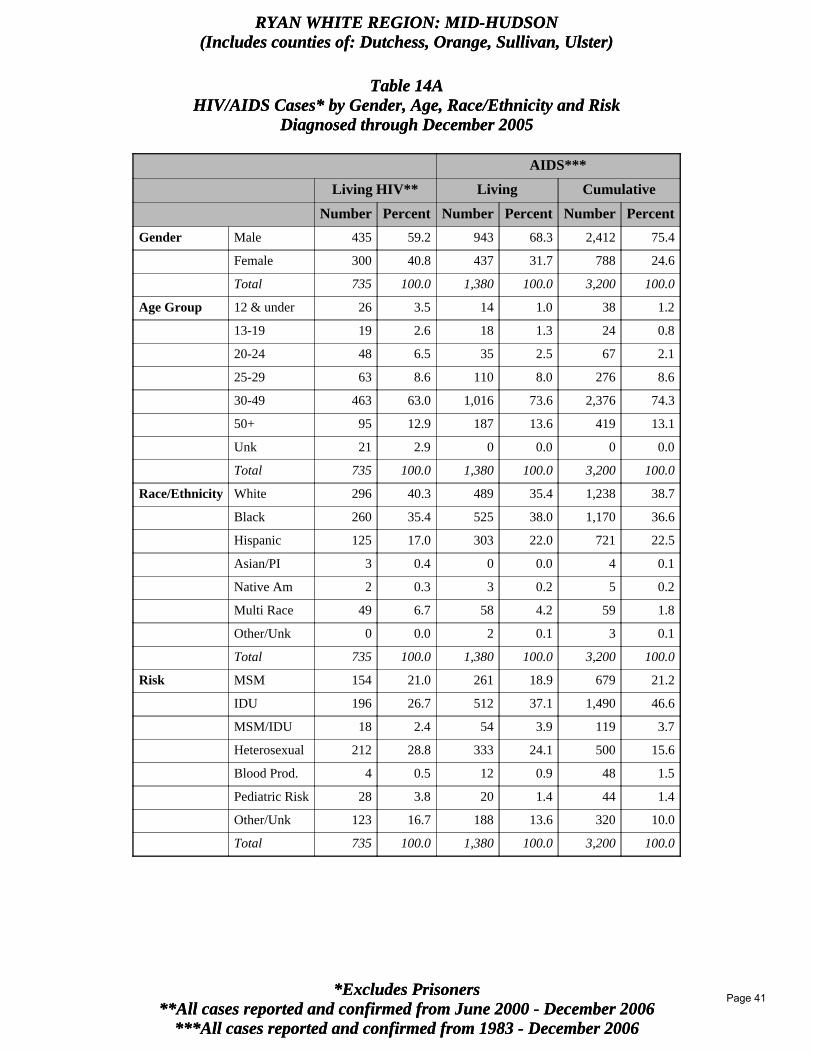
***All cases reported and confirmed from 1983 - December 2006**All cases reported and confirmed from June 2000 - December 2006
*Excludes Prisoners
RYAN WHITE REGION: MID-HUDSON(Includes counties of: Dutchess, Orange, Sullivan, Ulster)
Table 14AHIV/AIDS Cases* by Gender, Age, Race/Ethnicity and Risk
Diagnosed through December 2005
AIDS***
Living HIV** Living Cumulative
Number Percent Number Percent Number Percent
Gender Male 435 59.2 943 68.3 2,412 75.4
Female 300 40.8 437 31.7 788 24.6
Total 735 100.0 1,380 100.0 3,200 100.0
Age Group 12 & under 26 3.5 14 1.0 38 1.2
13-19 19 2.6 18 1.3 24 0.8
20-24 48 6.5 35 2.5 67 2.1
25-29 63 8.6 110 8.0 276 8.6
30-49 463 63.0 1,016 73.6 2,376 74.3
50+ 95 12.9 187 13.6 419 13.1
Unk 21 2.9 0 0.0 0 0.0
Total 735 100.0 1,380 100.0 3,200 100.0
Race/Ethnicity White 296 40.3 489 35.4 1,238 38.7
Black 260 35.4 525 38.0 1,170 36.6
Hispanic 125 17.0 303 22.0 721 22.5
Asian/PI 3 0.4 0 0.0 4 0.1
Native Am 2 0.3 3 0.2 5 0.2
Multi Race 49 6.7 58 4.2 59 1.8
Other/Unk 0 0.0 2 0.1 3 0.1
Total 735 100.0 1,380 100.0 3,200 100.0
Risk MSM 154 21.0 261 18.9 679 21.2
IDU 196 26.7 512 37.1 1,490 46.6
MSM/IDU 18 2.4 54 3.9 119 3.7
Heterosexual 212 28.8 333 24.1 500 15.6
Blood Prod. 4 0.5 12 0.9 48 1.5
Pediatric Risk 28 3.8 20 1.4 44 1.4
Other/Unk 123 16.7 188 13.6 320 10.0
Total 735 100.0 1,380 100.0 3,200 100.0
Page 41

Cases reported and confirmed through December 2006*Excludes Prisoners
RYAN WHITE REGION: MID-HUDSON(Includes counties of: Dutchess, Orange, Sullivan, Ulster)
Table 14BNewly Diagnosed HIV/AIDS Cases* by Gender, Age, Race/Ethnicity and Risk
Diagnosed January 2005 - December 2005
Cases reported and confirmed through December 2006*Excludes Prisoners
RYAN WHITE REGION: MID-HUDSON(Includes counties of: Dutchess, Orange, Sullivan, Ulster)
Table 14BNewly Diagnosed HIV/AIDS Cases* by Gender, Age, Race/Ethnicity and Risk
Diagnosed January 2005 - December 2005
Initial HIV Initial AIDS
Number Percent Number Percent
Gender Male 48 66.7 60 65.2
Female 24 33.3 32 34.8
Total 72 100.0 92 100.0
Age Group 12 & under 1 1.4 0 0.0
13-19 1 1.4 3 3.3
20-24 8 11.1 3 3.3
25-29 7 9.7 3 3.3
30-49 42 58.3 61 66.3
50+ 13 18.1 22 23.9
Total 72 100.0 92 100.0
Race/Ethnicity White 23 31.9 28 30.4
Black 21 29.2 30 32.6
Hispanic 17 23.6 24 26.1
Native Am 0 0.0 1 1.1
Multi Race 11 15.3 9 9.8
Total 72 100.0 92 100.0
Risk MSM 19 26.4 15 16.3
IDU 11 15.3 23 25.0
MSM/IDU 1 1.4 2 2.2
Heterosexual 14 19.4 23 25.0
Pediatric Risk 1 1.4 1 1.1
Other/Unk 26 36.1 28 30.4
Total 72 100.0 92 100.0
Page 42
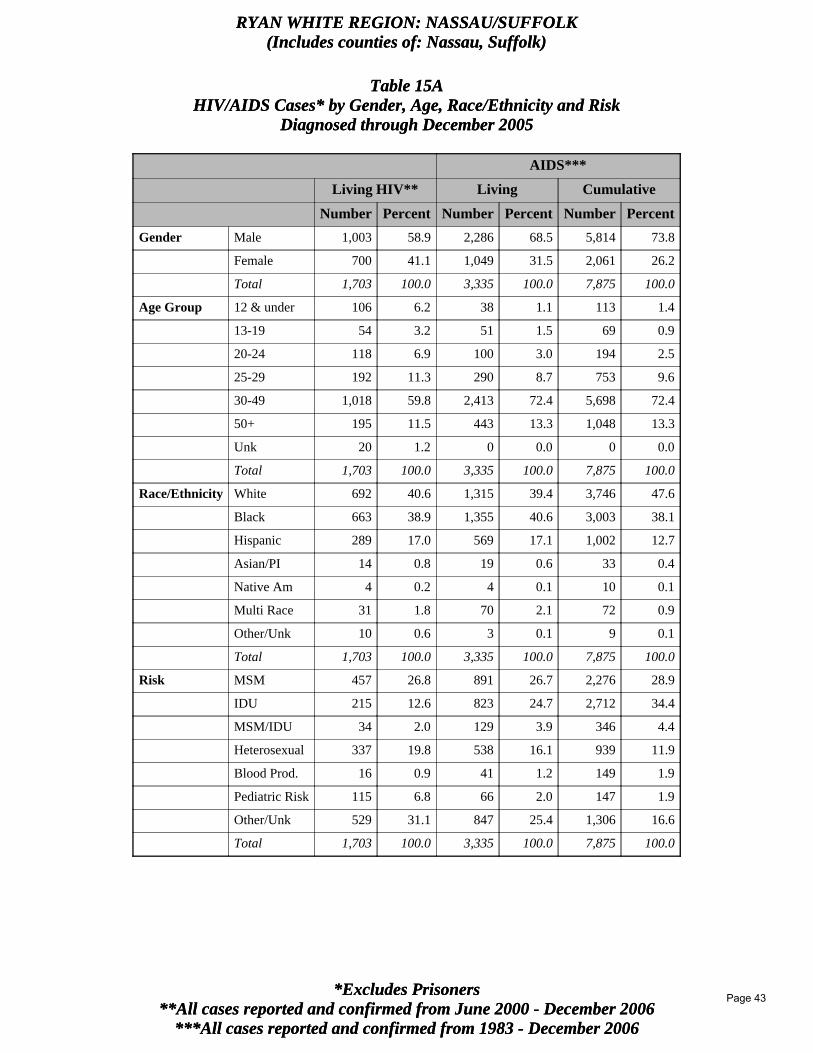
***All cases reported and confirmed from 1983 - December 2006**All cases reported and confirmed from June 2000 - December 2006
*Excludes Prisoners
RYAN WHITE REGION: NASSAU/SUFFOLK(Includes counties of: Nassau, Suffolk)
Table 15AHIV/AIDS Cases* by Gender, Age, Race/Ethnicity and Risk
Diagnosed through December 2005
AIDS***
Living HIV** Living Cumulative
Number Percent Number Percent Number Percent
Gender Male 1,003 58.9 2,286 68.5 5,814 73.8
Female 700 41.1 1,049 31.5 2,061 26.2
Total 1,703 100.0 3,335 100.0 7,875 100.0
Age Group 12 & under 106 6.2 38 1.1 113 1.4
13-19 54 3.2 51 1.5 69 0.9
20-24 118 6.9 100 3.0 194 2.5
25-29 192 11.3 290 8.7 753 9.6
30-49 1,018 59.8 2,413 72.4 5,698 72.4
50+ 195 11.5 443 13.3 1,048 13.3
Unk 20 1.2 0 0.0 0 0.0
Total 1,703 100.0 3,335 100.0 7,875 100.0
Race/Ethnicity White 692 40.6 1,315 39.4 3,746 47.6
Black 663 38.9 1,355 40.6 3,003 38.1
Hispanic 289 17.0 569 17.1 1,002 12.7
Asian/PI 14 0.8 19 0.6 33 0.4
Native Am 4 0.2 4 0.1 10 0.1
Multi Race 31 1.8 70 2.1 72 0.9
Other/Unk 10 0.6 3 0.1 9 0.1
Total 1,703 100.0 3,335 100.0 7,875 100.0
Risk MSM 457 26.8 891 26.7 2,276 28.9
IDU 215 12.6 823 24.7 2,712 34.4
MSM/IDU 34 2.0 129 3.9 346 4.4
Heterosexual 337 19.8 538 16.1 939 11.9
Blood Prod. 16 0.9 41 1.2 149 1.9
Pediatric Risk 115 6.8 66 2.0 147 1.9
Other/Unk 529 31.1 847 25.4 1,306 16.6
Total 1,703 100.0 3,335 100.0 7,875 100.0
Page 43
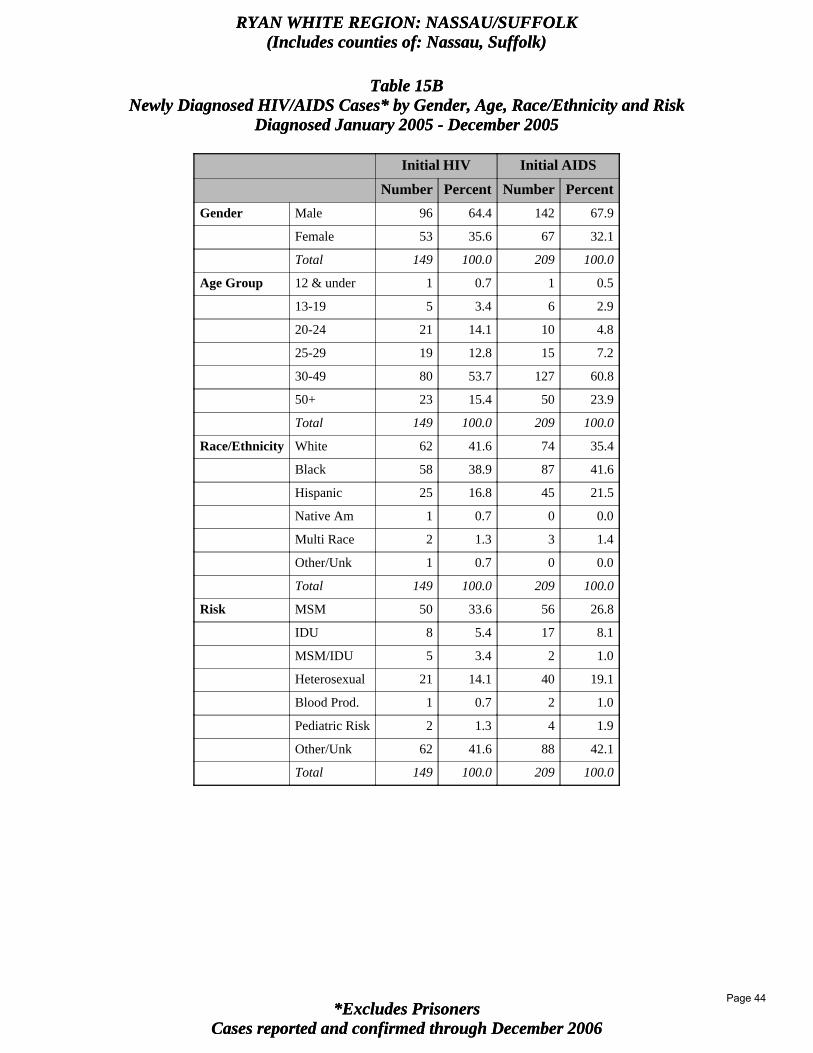
Cases reported and confirmed through December 2006*Excludes Prisoners
RYAN WHITE REGION: NASSAU/SUFFOLK(Includes counties of: Nassau, Suffolk)
Table 15BNewly Diagnosed HIV/AIDS Cases* by Gender, Age, Race/Ethnicity and Risk
Diagnosed January 2005 - December 2005
Cases reported and confirmed through December 2006*Excludes Prisoners
RYAN WHITE REGION: NASSAU/SUFFOLK(Includes counties of: Nassau, Suffolk)
Table 15BNewly Diagnosed HIV/AIDS Cases* by Gender, Age, Race/Ethnicity and Risk
Diagnosed January 2005 - December 2005
Initial HIV Initial AIDS
Number Percent Number Percent
Gender Male 96 64.4 142 67.9
Female 53 35.6 67 32.1
Total 149 100.0 209 100.0
Age Group 12 & under 1 0.7 1 0.5
13-19 5 3.4 6 2.9
20-24 21 14.1 10 4.8
25-29 19 12.8 15 7.2
30-49 80 53.7 127 60.8
50+ 23 15.4 50 23.9
Total 149 100.0 209 100.0
Race/Ethnicity White 62 41.6 74 35.4
Black 58 38.9 87 41.6
Hispanic 25 16.8 45 21.5
Native Am 1 0.7 0 0.0
Multi Race 2 1.3 3 1.4
Other/Unk 1 0.7 0 0.0
Total 149 100.0 209 100.0
Risk MSM 50 33.6 56 26.8
IDU 8 5.4 17 8.1
MSM/IDU 5 3.4 2 1.0
Heterosexual 21 14.1 40 19.1
Blood Prod. 1 0.7 2 1.0
Pediatric Risk 2 1.3 4 1.9
Other/Unk 62 41.6 88 42.1
Total 149 100.0 209 100.0
Page 44
***All cases reported and confirmed from 1983 - December 2006**All cases reported and confirmed from June 2000 - December 2006
*Excludes Prisoners
RYAN WHITE REGION: ROCHESTER(Includes counties of: Chemung,Livingston,Monroe,Ontario,Schuyler,Seneca,Steuben,Wayne,Yates)
Table 16AHIV/AIDS Cases* by Gender, Age, Race/Ethnicity and Risk
Diagnosed through December 2005
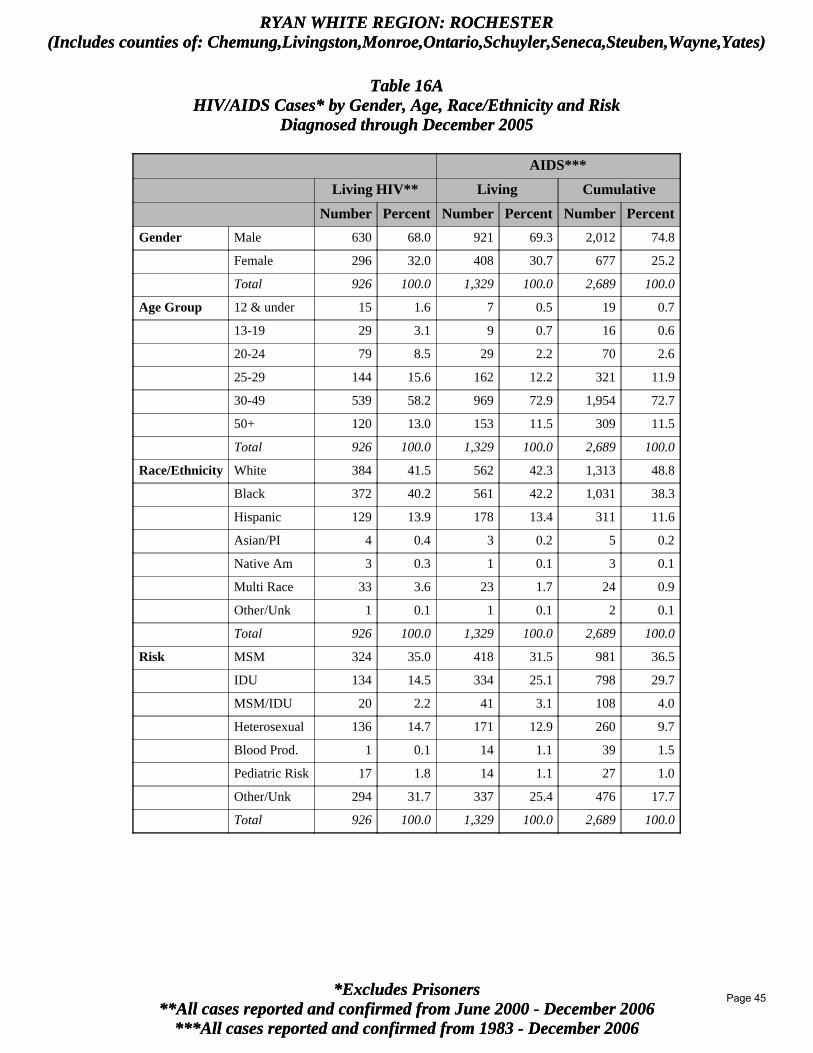
AIDS***
Living HIV** Living Cumulative
Number Percent Number Percent Number Percent
Gender Male 630 68.0 921 69.3 2,012 74.8
Female 296 32.0 408 30.7 677 25.2
Total 926 100.0 1,329 100.0 2,689 100.0
Age Group 12 & under 15 1.6 7 0.5 19 0.7
13-19 29 3.1 9 0.7 16 0.6
20-24 79 8.5 29 2.2 70 2.6
25-29 144 15.6 162 12.2 321 11.9
30-49 539 58.2 969 72.9 1,954 72.7
50+ 120 13.0 153 11.5 309 11.5
Total 926 100.0 1,329 100.0 2,689 100.0
Race/Ethnicity White 384 41.5 562 42.3 1,313 48.8
Black 372 40.2 561 42.2 1,031 38.3
Hispanic 129 13.9 178 13.4 311 11.6
Asian/PI 4 0.4 3 0.2 5 0.2
Native Am 3 0.3 1 0.1 3 0.1
Multi Race 33 3.6 23 1.7 24 0.9
Other/Unk 1 0.1 1 0.1 2 0.1
Total 926 100.0 1,329 100.0 2,689 100.0
Risk MSM 324 35.0 418 31.5 981 36.5
IDU 134 14.5 334 25.1 798 29.7
MSM/IDU 20 2.2 41 3.1 108 4.0
Heterosexual 136 14.7 171 12.9 260 9.7
Blood Prod. 1 0.1 14 1.1 39 1.5
Pediatric Risk 17 1.8 14 1.1 27 1.0
Other/Unk 294 31.7 337 25.4 476 17.7
Total 926 100.0 1,329 100.0 2,689 100.0
Page 45
Cases reported and confirmed through December 2006*Excludes Prisoners
RYAN WHITE REGION: ROCHESTER(Includes counties of: Chemung,Livingston,Monroe,Ontario,Schuyler,Seneca,Steuben,Wayne,Yates)
Table 16BNewly Diagnosed HIV/AIDS Cases* by Gender, Age, Race/Ethnicity and Risk
Diagnosed January 2005 - December 2005
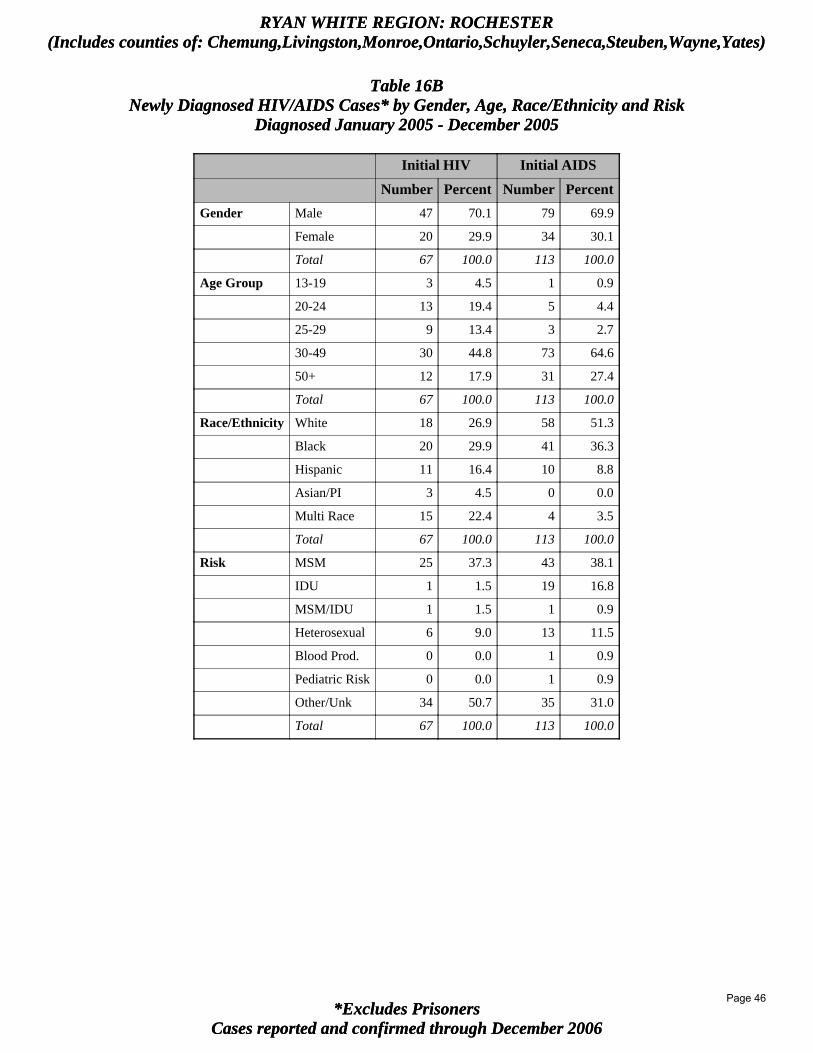
Initial HIV Initial AIDS
Number Percent Number Percent
Gender Male 47 70.1 79 69.9
Female 20 29.9 34 30.1
Total 67 100.0 113 100.0
Age Group 13-19 3 4.5 1 0.9
20-24 13 19.4 5 4.4
25-29 9 13.4 3 2.7
30-49 30 44.8 73 64.6
50+ 12 17.9 31 27.4
Total 67 100.0 113 100.0
Race/Ethnicity White 18 26.9 58 51.3
Black 20 29.9 41 36.3
Hispanic 11 16.4 10 8.8
Asian/PI 3 4.5 0 0.0
Multi Race 15 22.4 4 3.5
Total 67 100.0 113 100.0
Risk MSM 25 37.3 43 38.1
IDU 1 1.5 19 16.8
MSM/IDU 1 1.5 1 0.9
Heterosexual 6 9.0 13 11.5
Blood Prod. 0 0.0 1 0.9
Pediatric Risk 0 0.0 1 0.9
Other/Unk 34 50.7 35 31.0
Total 67 100.0 113 100.0
Page 46
***All cases reported and confirmed from 1983 - December 2006**All cases reported and confirmed from June 2000 - December 2006
*Excludes Prisoners
RYAN WHITE REGION: SYRACUSE(Includes counties of: Cayuga, Cortland, Herkimer, Jefferson, Lewis, Madison,
Oneida, Onondaga, Oswego, St. Lawrence, Tompkins)
Table 17AHIV/AIDS Cases* by Gender, Age, Race/Ethnicity and Risk
Diagnosed through December 2005
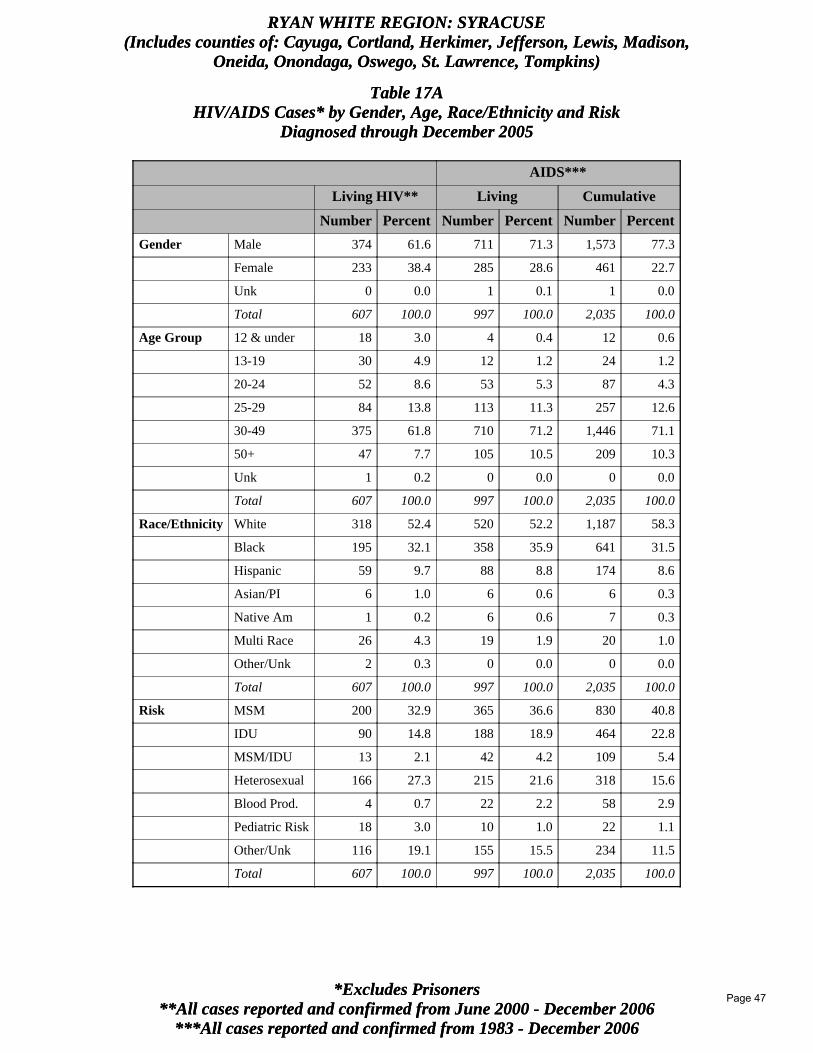
AIDS***
Living HIV** Living Cumulative
Number Percent Number Percent Number Percent
Gender Male 374 61.6 711 71.3 1,573 77.3
Female 233 38.4 285 28.6 461 22.7
Unk 0 0.0 1 0.1 1 0.0
Total 607 100.0 997 100.0 2,035 100.0
Age Group 12 & under 18 3.0 4 0.4 12 0.6
13-19 30 4.9 12 1.2 24 1.2
20-24 52 8.6 53 5.3 87 4.3
25-29 84 13.8 113 11.3 257 12.6
30-49 375 61.8 710 71.2 1,446 71.1
50+ 47 7.7 105 10.5 209 10.3
Unk 1 0.2 0 0.0 0 0.0
Total 607 100.0 997 100.0 2,035 100.0
Race/Ethnicity White 318 52.4 520 52.2 1,187 58.3
Black 195 32.1 358 35.9 641 31.5
Hispanic 59 9.7 88 8.8 174 8.6
Asian/PI 6 1.0 6 0.6 6 0.3
Native Am 1 0.2 6 0.6 7 0.3
Multi Race 26 4.3 19 1.9 20 1.0
Other/Unk 2 0.3 0 0.0 0 0.0
Total 607 100.0 997 100.0 2,035 100.0
Risk MSM 200 32.9 365 36.6 830 40.8
IDU 90 14.8 188 18.9 464 22.8
MSM/IDU 13 2.1 42 4.2 109 5.4
Heterosexual 166 27.3 215 21.6 318 15.6
Blood Prod. 4 0.7 22 2.2 58 2.9
Pediatric Risk 18 3.0 10 1.0 22 1.1
Other/Unk 116 19.1 155 15.5 234 11.5
Total 607 100.0 997 100.0 2,035 100.0
Page 47
Cases reported and confirmed through December 2006*Excludes Prisoners
RYAN WHITE REGION: SYRACUSE(Includes counties of: Cayuga, Cortland, Herkimer, Jefferson, Lewis, Madison,
Oneida, Onondaga, Oswego, St. Lawrence, Tompkins)
Table 17BNewly Diagnosed HIV/AIDS Cases* by Gender, Age, Race/Ethnicity and Risk
Diagnosed January 2005 - December 2005
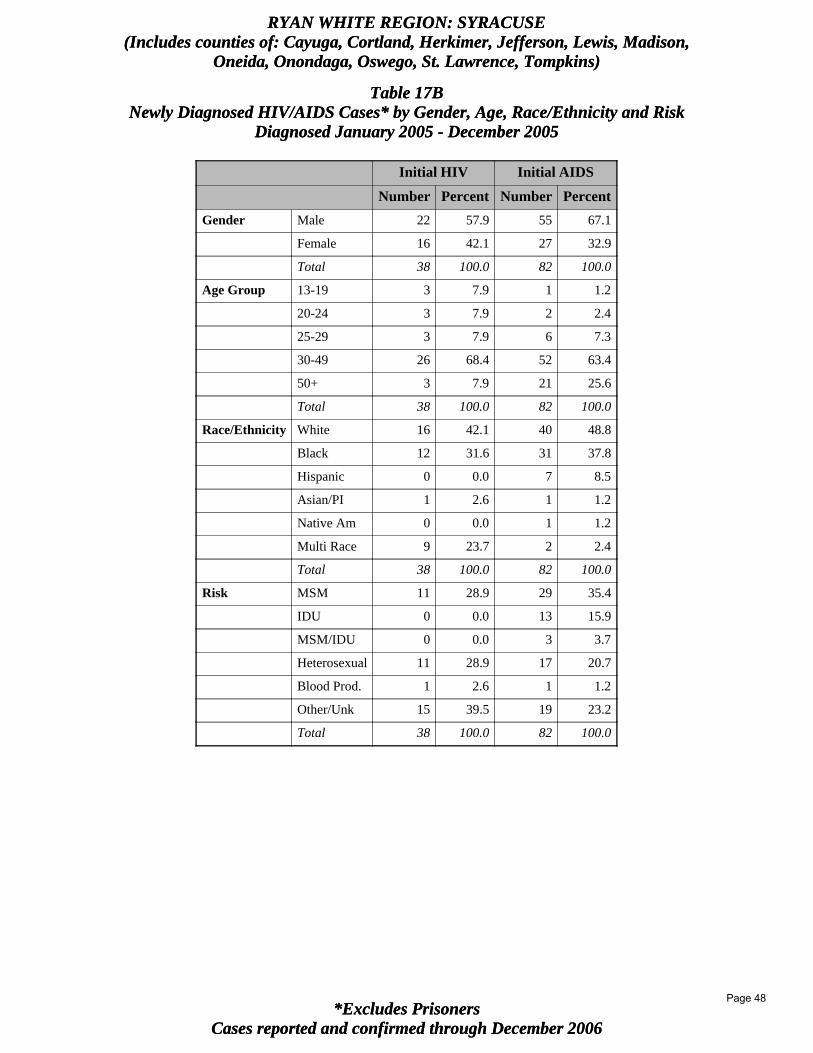
Initial HIV Initial AIDS
Number Percent Number Percent
Gender Male 22 57.9 55 67.1
Female 16 42.1 27 32.9
Total 38 100.0 82 100.0
Age Group 13-19 3 7.9 1 1.2
20-24 3 7.9 2 2.4
25-29 3 7.9 6 7.3
30-49 26 68.4 52 63.4
50+ 3 7.9 21 25.6
Total 38 100.0 82 100.0
Race/Ethnicity White 16 42.1 40 48.8
Black 12 31.6 31 37.8
Hispanic 0 0.0 7 8.5
Asian/PI 1 2.6 1 1.2
Native Am 0 0.0 1 1.2
Multi Race 9 23.7 2 2.4
Total 38 100.0 82 100.0
Risk MSM 11 28.9 29 35.4
IDU 0 0.0 13 15.9
MSM/IDU 0 0.0 3 3.7
Heterosexual 11 28.9 17 20.7
Blood Prod. 1 2.6 1 1.2
Other/Unk 15 39.5 19 23.2
Total 38 100.0 82 100.0
Page 48
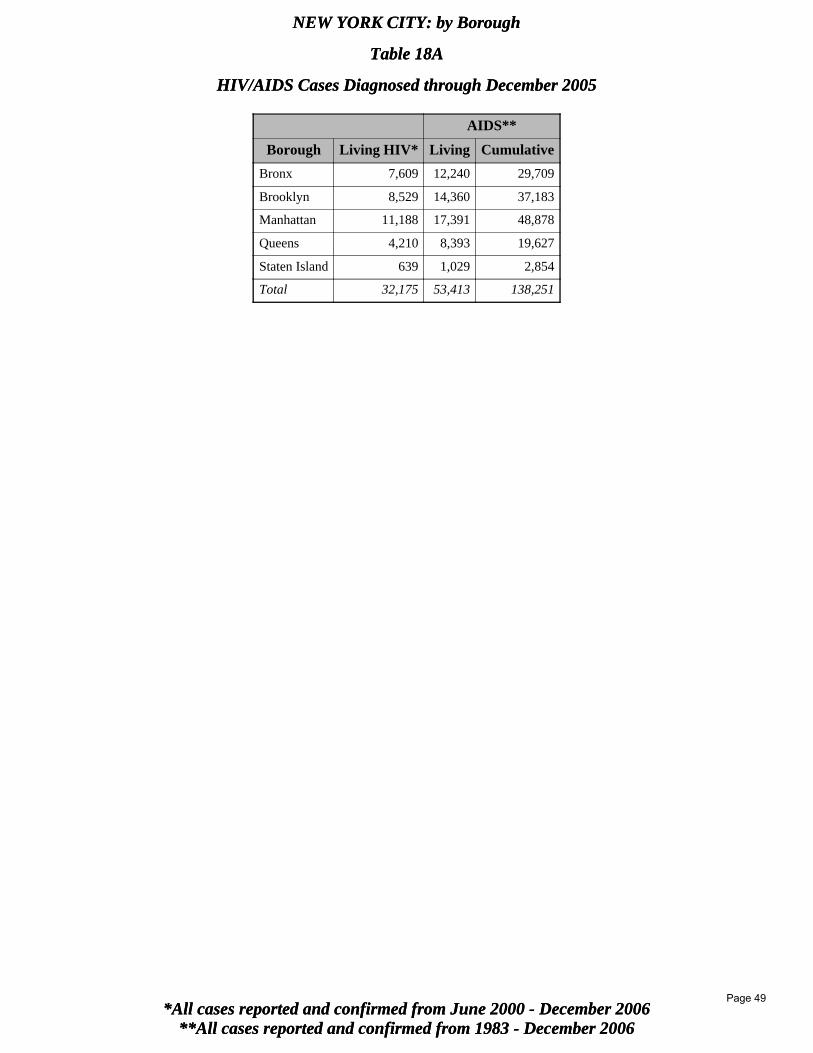
**All cases reported and confirmed from 1983 - December 2006*All cases reported and confirmed from June 2000 - December 2006
NEW YORK CITY: by Borough
Table 18A
HIV/AIDS Cases Diagnosed through December 2005
**All cases reported and confirmed from 1983 - December 2006*All cases reported and confirmed from June 2000 - December 2006
NEW YORK CITY: by Borough
Table 18A
HIV/AIDS Cases Diagnosed through December 2005
AIDS**
Borough Living HIV* Living Cumulative
Bronx 7,609 12,240 29,709
Brooklyn 8,529 14,360 37,183
Manhattan 11,188 17,391 48,878
Queens 4,210 8,393 19,627
Staten Island 639 1,029 2,854
Total 32,175 53,413 138,251
Page 49
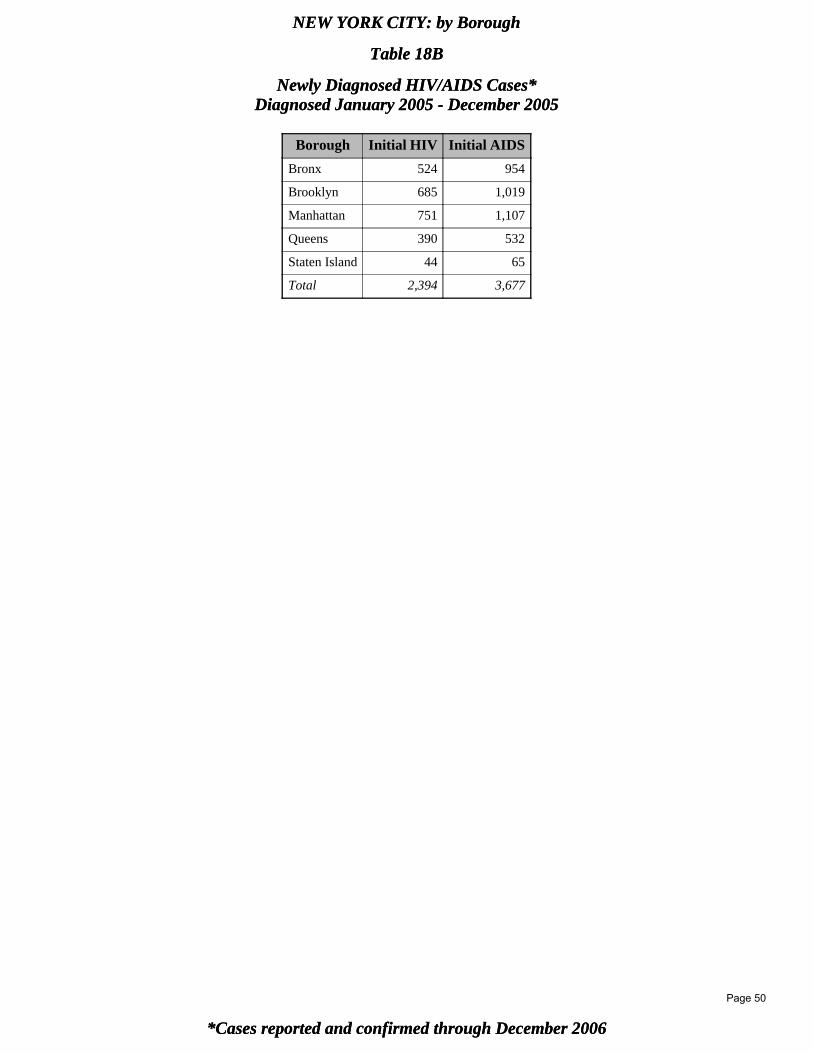
*Cases reported and confirmed through December 2006
NEW YORK CITY: by Borough
Table 18B
Newly Diagnosed HIV/AIDS Cases*Diagnosed January 2005 - December 2005
*Cases reported and confirmed through December 2006
NEW YORK CITY: by Borough
Table 18B
Newly Diagnosed HIV/AIDS Cases*Diagnosed January 2005 - December 2005
Borough Initial HIV Initial AIDS
Bronx 524 954
Brooklyn 685 1,019
Manhattan 751 1,107
Queens 390 532
Staten Island 44 65
Total 2,394 3,677
Page 50
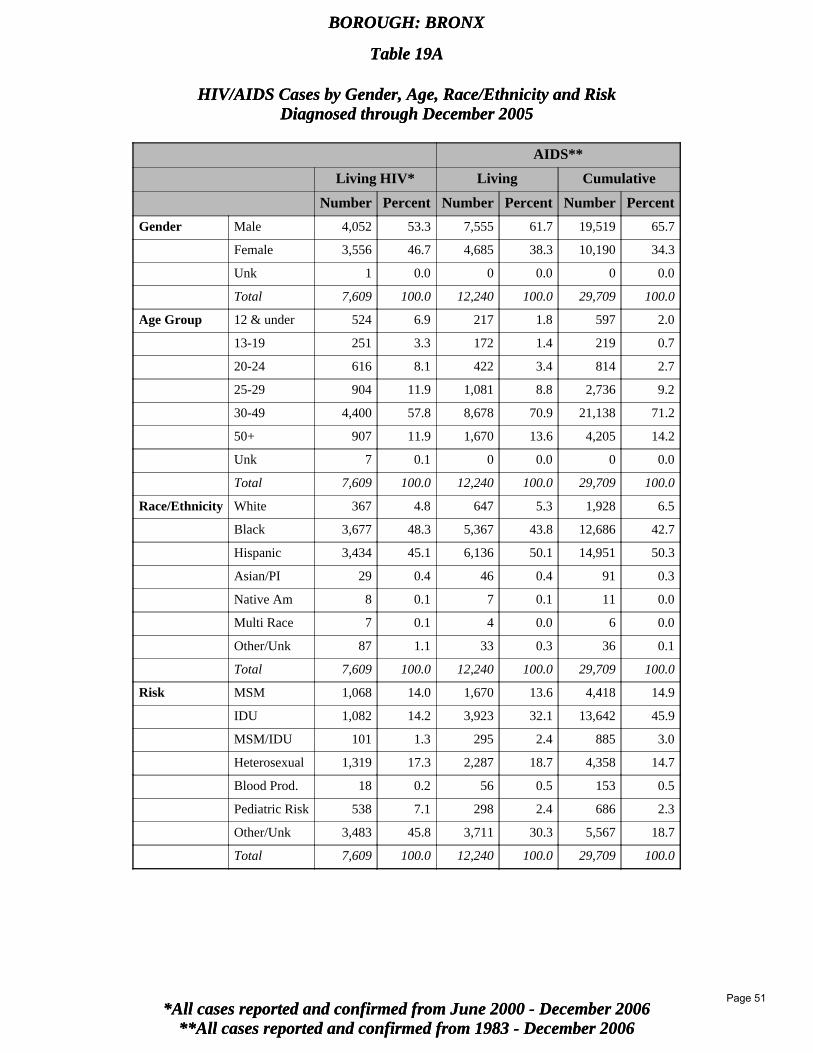
**All cases reported and confirmed from 1983 - December 2006*All cases reported and confirmed from June 2000 - December 2006
BOROUGH: BRONX
Table 19A
HIV/AIDS Cases by Gender, Age, Race/Ethnicity and RiskDiagnosed through December 2005
**All cases reported and confirmed from 1983 - December 2006*All cases reported and confirmed from June 2000 - December 2006
BOROUGH: BRONX
Table 19A
HIV/AIDS Cases by Gender, Age, Race/Ethnicity and RiskDiagnosed through December 2005
AIDS**
Living HIV* Living Cumulative
Number Percent Number Percent Number Percent
Gender Male 4,052 53.3 7,555 61.7 19,519 65.7
Female 3,556 46.7 4,685 38.3 10,190 34.3
Unk 1 0.0 0 0.0 0 0.0
Total 7,609 100.0 12,240 100.0 29,709 100.0
Age Group 12 & under 524 6.9 217 1.8 597 2.0
13-19 251 3.3 172 1.4 219 0.7
20-24 616 8.1 422 3.4 814 2.7
25-29 904 11.9 1,081 8.8 2,736 9.2
30-49 4,400 57.8 8,678 70.9 21,138 71.2
50+ 907 11.9 1,670 13.6 4,205 14.2
Unk 7 0.1 0 0.0 0 0.0
Total 7,609 100.0 12,240 100.0 29,709 100.0
Race/Ethnicity White 367 4.8 647 5.3 1,928 6.5
Black 3,677 48.3 5,367 43.8 12,686 42.7
Hispanic 3,434 45.1 6,136 50.1 14,951 50.3
Asian/PI 29 0.4 46 0.4 91 0.3
Native Am 8 0.1 7 0.1 11 0.0
Multi Race 7 0.1 4 0.0 6 0.0
Other/Unk 87 1.1 33 0.3 36 0.1
Total 7,609 100.0 12,240 100.0 29,709 100.0
Risk MSM 1,068 14.0 1,670 13.6 4,418 14.9
IDU 1,082 14.2 3,923 32.1 13,642 45.9
MSM/IDU 101 1.3 295 2.4 885 3.0
Heterosexual 1,319 17.3 2,287 18.7 4,358 14.7
Blood Prod. 18 0.2 56 0.5 153 0.5
Pediatric Risk 538 7.1 298 2.4 686 2.3
Other/Unk 3,483 45.8 3,711 30.3 5,567 18.7
Total 7,609 100.0 12,240 100.0 29,709 100.0
Page 51
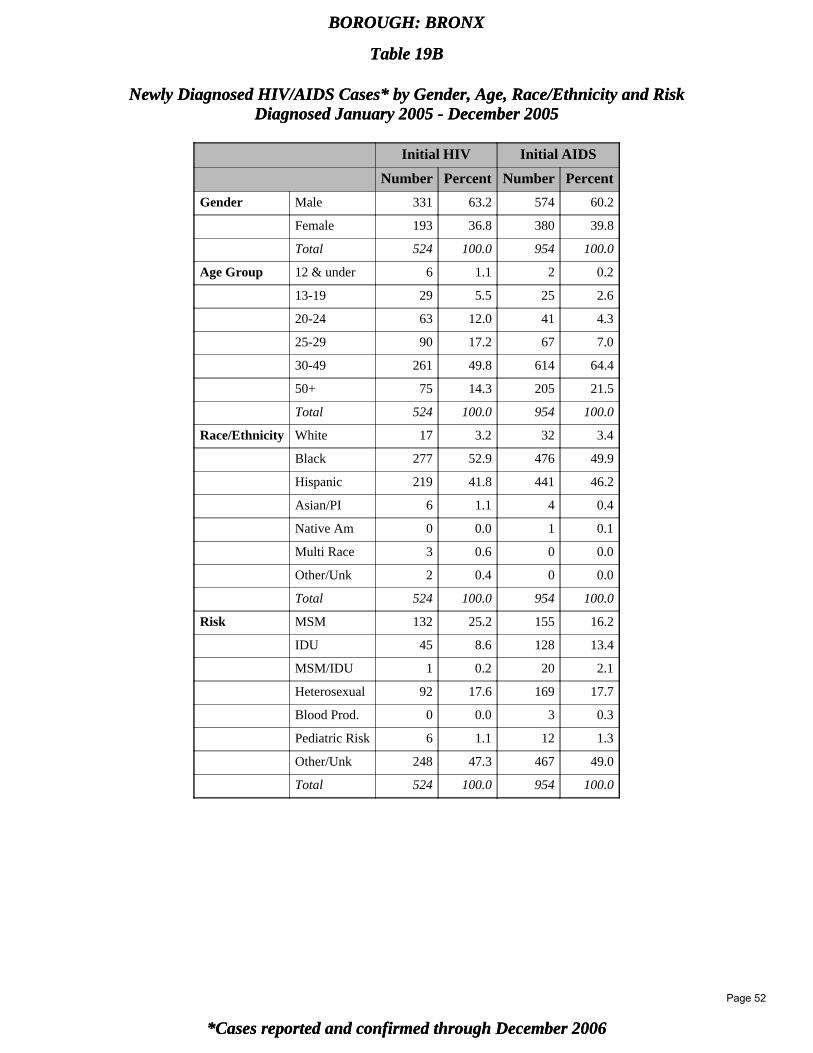
*Cases reported and confirmed through December 2006
BOROUGH: BRONX
Table 19B
Newly Diagnosed HIV/AIDS Cases* by Gender, Age, Race/Ethnicity and RiskDiagnosed January 2005 - December 2005
*Cases reported and confirmed through December 2006
BOROUGH: BRONX
Table 19B
Newly Diagnosed HIV/AIDS Cases* by Gender, Age, Race/Ethnicity and RiskDiagnosed January 2005 - December 2005
Initial HIV Initial AIDS
Number Percent Number Percent
Gender Male 331 63.2 574 60.2
Female 193 36.8 380 39.8
Total 524 100.0 954 100.0
Age Group 12 & under 6 1.1 2 0.2
13-19 29 5.5 25 2.6
20-24 63 12.0 41 4.3
25-29 90 17.2 67 7.0
30-49 261 49.8 614 64.4
50+ 75 14.3 205 21.5
Total 524 100.0 954 100.0
Race/Ethnicity White 17 3.2 32 3.4
Black 277 52.9 476 49.9
Hispanic 219 41.8 441 46.2
Asian/PI 6 1.1 4 0.4
Native Am 0 0.0 1 0.1
Multi Race 3 0.6 0 0.0
Other/Unk 2 0.4 0 0.0
Total 524 100.0 954 100.0
Risk MSM 132 25.2 155 16.2
IDU 45 8.6 128 13.4
MSM/IDU 1 0.2 20 2.1
Heterosexual 92 17.6 169 17.7
Blood Prod. 0 0.0 3 0.3
Pediatric Risk 6 1.1 12 1.3
Other/Unk 248 47.3 467 49.0
Total 524 100.0 954 100.0
Page 52

**All cases reported and confirmed from 1983 - December 2006*All cases reported and confirmed from June 2000 - December 2006
BOROUGH: BROOKLYN
Table 20A
HIV/AIDS Cases by Gender, Age, Race/Ethnicity and RiskDiagnosed through December 2005
**All cases reported and confirmed from 1983 - December 2006*All cases reported and confirmed from June 2000 - December 2006
BOROUGH: BROOKLYN
Table 20A
HIV/AIDS Cases by Gender, Age, Race/Ethnicity and RiskDiagnosed through December 2005
AIDS**
Living HIV* Living Cumulative
Number Percent Number Percent Number Percent
Gender Male 4,784 56.1 9,152 63.7 25,284 68.0
Female 3,563 41.8 5,208 36.3 11,899 32.0
Unk 182 2.1 0 0.0 0 0.0
Total 8,529 100.0 14,360 100.0 37,183 100.0
Age Group 12 & under 435 5.1 256 1.8 720 1.9
13-19 277 3.2 167 1.2 250 0.7
20-24 757 8.9 512 3.6 1,065 2.9
25-29 1,057 12.4 1,346 9.4 3,634 9.8
30-49 4,971 58.3 10,045 70.0 26,195 70.4
50+ 1,031 12.1 2,034 14.2 5,319 14.3
Unk 1 0.0 0 0.0 0 0.0
Total 8,529 100.0 14,360 100.0 37,183 100.0
Race/Ethnicity White 1,101 12.9 1,592 11.1 4,991 13.4
Black 5,258 61.6 8,959 62.4 22,397 60.2
Hispanic 1,784 20.9 3,624 25.2 9,514 25.6
Asian/PI 89 1.0 120 0.8 202 0.5
Native Am 8 0.1 8 0.1 11 0.0
Multi Race 8 0.1 10 0.1 13 0.0
Other/Unk 281 3.3 47 0.3 55 0.1
Total 8,529 100.0 14,360 100.0 37,183 100.0
Risk MSM 1,861 21.8 2,668 18.6 7,080 19.0
IDU 946 11.1 3,722 25.9 14,882 40.0
MSM/IDU 89 1.0 270 1.9 834 2.2
Heterosexual 1,589 18.6 2,602 18.1 4,918 13.2
Blood Prod. 20 0.2 79 0.6 270 0.7
Pediatric Risk 441 5.2 311 2.2 783 2.1
Other/Unk 3,583 42.0 4,708 32.8 8,416 22.6
Total 8,529 100.0 14,360 100.0 37,183 100.0
Page 53
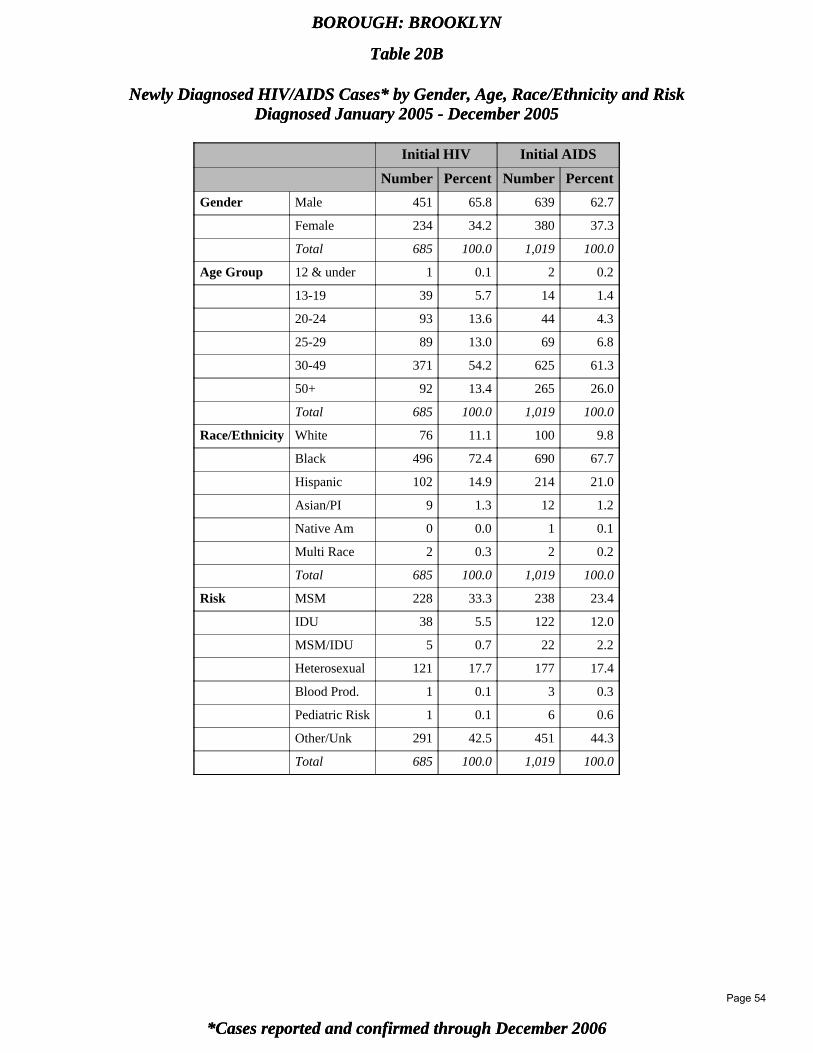
*Cases reported and confirmed through December 2006
BOROUGH: BROOKLYN
Table 20B
Newly Diagnosed HIV/AIDS Cases* by Gender, Age, Race/Ethnicity and RiskDiagnosed January 2005 - December 2005
*Cases reported and confirmed through December 2006
BOROUGH: BROOKLYN
Table 20B
Newly Diagnosed HIV/AIDS Cases* by Gender, Age, Race/Ethnicity and RiskDiagnosed January 2005 - December 2005
Initial HIV Initial AIDS
Number Percent Number Percent
Gender Male 451 65.8 639 62.7
Female 234 34.2 380 37.3
Total 685 100.0 1,019 100.0
Age Group 12 & under 1 0.1 2 0.2
13-19 39 5.7 14 1.4
20-24 93 13.6 44 4.3
25-29 89 13.0 69 6.8
30-49 371 54.2 625 61.3
50+ 92 13.4 265 26.0
Total 685 100.0 1,019 100.0
Race/Ethnicity White 76 11.1 100 9.8
Black 496 72.4 690 67.7
Hispanic 102 14.9 214 21.0
Asian/PI 9 1.3 12 1.2
Native Am 0 0.0 1 0.1
Multi Race 2 0.3 2 0.2
Total 685 100.0 1,019 100.0
Risk MSM 228 33.3 238 23.4
IDU 38 5.5 122 12.0
MSM/IDU 5 0.7 22 2.2
Heterosexual 121 17.7 177 17.4
Blood Prod. 1 0.1 3 0.3
Pediatric Risk 1 0.1 6 0.6
Other/Unk 291 42.5 451 44.3
Total 685 100.0 1,019 100.0
Page 54

**All cases reported and confirmed from 1983 - December 2006*All cases reported and confirmed from June 2000 - December 2006
BOROUGH: MANHATTAN
Table 21A
HIV/AIDS Cases by Gender, Age, Race/Ethnicity and RiskDiagnosed through December 2005
**All cases reported and confirmed from 1983 - December 2006*All cases reported and confirmed from June 2000 - December 2006
BOROUGH: MANHATTAN
Table 21A
HIV/AIDS Cases by Gender, Age, Race/Ethnicity and RiskDiagnosed through December 2005
AIDS**
Living HIV* Living Cumulative
Number Percent Number Percent Number Percent
Gender Male 8,841 79.0 13,819 79.5 40,348 82.5
Female 2,314 20.7 3,572 20.5 8,530 17.5
Unk 33 0.3 0 0.0 0 0.0
Total 11,188 100.0 17,391 100.0 48,878 100.0
Age Group 12 & under 320 2.9 146 0.8 411 0.8
13-19 189 1.7 105 0.6 143 0.3
20-24 700 6.3 411 2.4 890 1.8
25-29 1,377 12.3 1,525 8.8 4,226 8.6
30-49 7,252 64.8 12,649 72.7 35,346 72.3
50+ 1,347 12.0 2,555 14.7 7,862 16.1
Unk 3 0.0 0 0.0 0 0.0
Total 11,188 100.0 17,391 100.0 48,878 100.0
Race/Ethnicity White 4,325 38.7 5,744 33.0 17,991 36.8
Black 3,577 32.0 6,430 37.0 17,446 35.7
Hispanic 2,725 24.4 4,857 27.9 12,812 26.2
Asian/PI 180 1.6 226 1.3 459 0.9
Native Am 14 0.1 11 0.1 23 0.0
Multi Race 5 0.0 10 0.1 14 0.0
Other/Unk 362 3.2 113 0.6 133 0.3
Total 11,188 100.0 17,391 100.0 48,878 100.0
Risk MSM 5,371 48.0 7,299 42.0 22,459 45.9
IDU 827 7.4 3,879 22.3 15,036 30.8
MSM/IDU 168 1.5 422 2.4 1,564 3.2
Heterosexual 1,090 9.7 1,744 10.0 3,318 6.8
Blood Prod. 18 0.2 49 0.3 202 0.4
Pediatric Risk 328 2.9 189 1.1 455 0.9
Other/Unk 3,386 30.3 3,809 21.9 5,844 12.0
Total 11,188 100.0 17,391 100.0 48,878 100.0
Page 55

*Cases reported and confirmed through December 2006
BOROUGH: MANHATTAN
Table 21B
Newly Diagnosed HIV/AIDS Cases* by Gender, Age, Race/Ethnicity and RiskDiagnosed January 2005 - December 2005
*Cases reported and confirmed through December 2006
BOROUGH: MANHATTAN
Table 21B
Newly Diagnosed HIV/AIDS Cases* by Gender, Age, Race/Ethnicity and RiskDiagnosed January 2005 - December 2005
Initial HIV Initial AIDS
Number Percent Number Percent
Gender Male 611 81.4 828 74.8
Female 140 18.6 279 25.2
Total 751 100.0 1,107 100.0
Age Group 12 & under 2 0.3 4 0.4
13-19 16 2.1 12 1.1
20-24 62 8.3 44 4.0
25-29 125 16.6 70 6.3
30-49 442 58.9 712 64.3
50+ 104 13.8 265 23.9
Total 751 100.0 1,107 100.0
Race/Ethnicity White 258 34.4 301 27.2
Black 295 39.3 482 43.5
Hispanic 175 23.3 298 26.9
Asian/PI 20 2.7 22 2.0
Native Am 1 0.1 2 0.2
Multi Race 1 0.1 1 0.1
Other/Unk 1 0.1 1 0.1
Total 751 100.0 1,107 100.0
Risk MSM 428 57.0 431 38.9
IDU 36 4.8 141 12.7
MSM/IDU 10 1.3 13 1.2
Heterosexual 85 11.3 139 12.6
Blood Prod. 0 0.0 1 0.1
Pediatric Risk 2 0.3 12 1.1
Other/Unk 190 25.3 370 33.4
Total 751 100.0 1,107 100.0
Page 56

**All cases reported and confirmed from 1983 - December 2006*All cases reported and confirmed from June 2000 - December 2006
BOROUGH: QUEENS
Table 22A
HIV/AIDS Cases by Gender, Age, Race/Ethnicity and RiskDiagnosed through December 2005
**All cases reported and confirmed from 1983 - December 2006*All cases reported and confirmed from June 2000 - December 2006
BOROUGH: QUEENS
Table 22A
HIV/AIDS Cases by Gender, Age, Race/Ethnicity and RiskDiagnosed through December 2005
AIDS**
Living HIV* Living Cumulative
Number Percent Number Percent Number Percent
Gender Male 2,757 65.5 5,912 70.4 14,645 74.6
Female 1,452 34.5 2,481 29.6 4,982 25.4
Unk 1 0.0 0 0.0 0 0.0
Total 4,210 100.0 8,393 100.0 19,627 100.0
Age Group 12 & under 169 4.0 101 1.2 282 1.4
13-19 100 2.4 87 1.0 114 0.6
20-24 339 8.1 301 3.6 552 2.8
25-29 574 13.6 886 10.6 1,916 9.8
30-49 2,606 61.9 6,016 71.7 14,277 72.7
50+ 418 9.9 1,002 11.9 2,486 12.7
Unk 4 0.1 0 0.0 0 0.0
Total 4,210 100.0 8,393 100.0 19,627 100.0
Race/Ethnicity White 840 20.0 1,541 18.4 4,705 24.0
Black 1,790 42.5 3,618 43.1 8,548 43.6
Hispanic 1,360 32.3 2,941 35.0 5,912 30.1
Asian/PI 133 3.2 231 2.8 383 2.0
Native Am 7 0.2 14 0.2 19 0.1
Multi Race 9 0.2 17 0.2 20 0.1
Other/Unk 71 1.7 31 0.4 40 0.2
Total 4,210 100.0 8,393 100.0 19,627 100.0
Risk MSM 1,367 32.5 2,278 27.1 5,473 27.9
IDU 364 8.6 2,017 24.0 6,975 35.5
MSM/IDU 30 0.7 159 1.9 499 2.5
Heterosexual 883 21.0 1,471 17.5 2,437 12.4
Blood Prod. 13 0.3 49 0.6 171 0.9
Pediatric Risk 170 4.0 140 1.7 324 1.7
Other/Unk 1,383 32.9 2,279 27.2 3,748 19.1
Total 4,210 100.0 8,393 100.0 19,627 100.0
Page 57
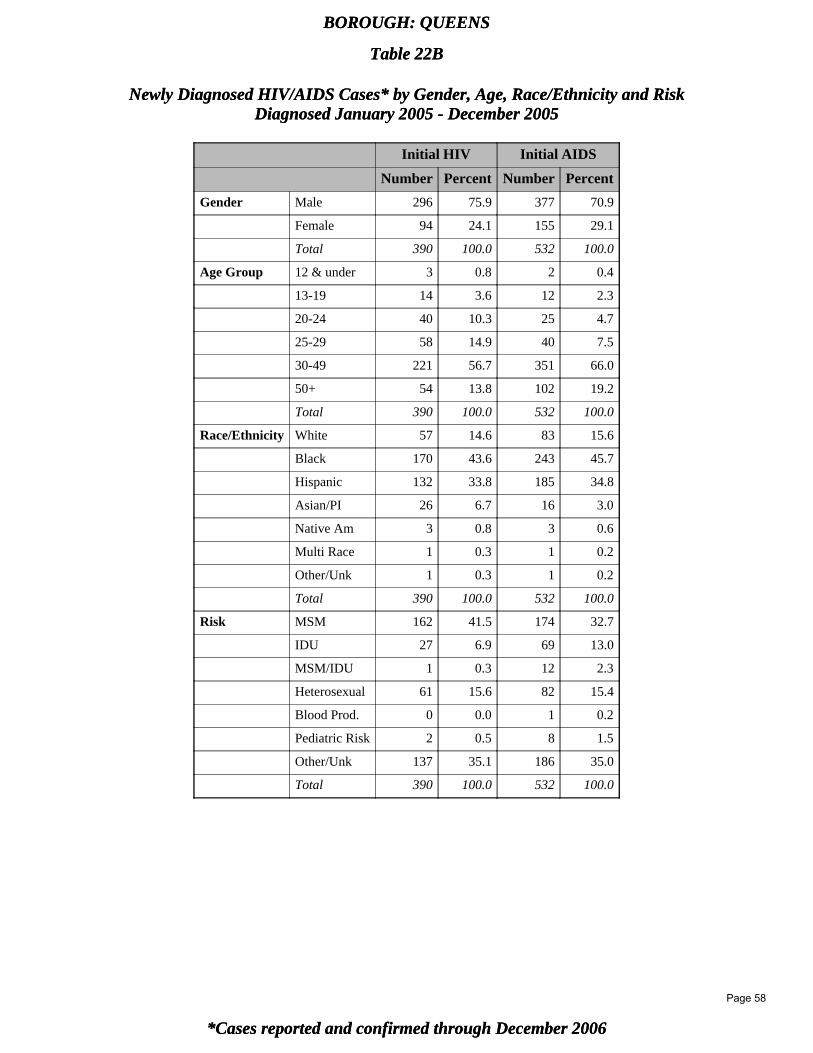
*Cases reported and confirmed through December 2006
BOROUGH: QUEENS
Table 22B
Newly Diagnosed HIV/AIDS Cases* by Gender, Age, Race/Ethnicity and RiskDiagnosed January 2005 - December 2005
*Cases reported and confirmed through December 2006
BOROUGH: QUEENS
Table 22B
Newly Diagnosed HIV/AIDS Cases* by Gender, Age, Race/Ethnicity and RiskDiagnosed January 2005 - December 2005
Initial HIV Initial AIDS
Number Percent Number Percent
Gender Male 296 75.9 377 70.9
Female 94 24.1 155 29.1
Total 390 100.0 532 100.0
Age Group 12 & under 3 0.8 2 0.4
13-19 14 3.6 12 2.3
20-24 40 10.3 25 4.7
25-29 58 14.9 40 7.5
30-49 221 56.7 351 66.0
50+ 54 13.8 102 19.2
Total 390 100.0 532 100.0
Race/Ethnicity White 57 14.6 83 15.6
Black 170 43.6 243 45.7
Hispanic 132 33.8 185 34.8
Asian/PI 26 6.7 16 3.0
Native Am 3 0.8 3 0.6
Multi Race 1 0.3 1 0.2
Other/Unk 1 0.3 1 0.2
Total 390 100.0 532 100.0
Risk MSM 162 41.5 174 32.7
IDU 27 6.9 69 13.0
MSM/IDU 1 0.3 12 2.3
Heterosexual 61 15.6 82 15.4
Blood Prod. 0 0.0 1 0.2
Pediatric Risk 2 0.5 8 1.5
Other/Unk 137 35.1 186 35.0
Total 390 100.0 532 100.0
Page 58
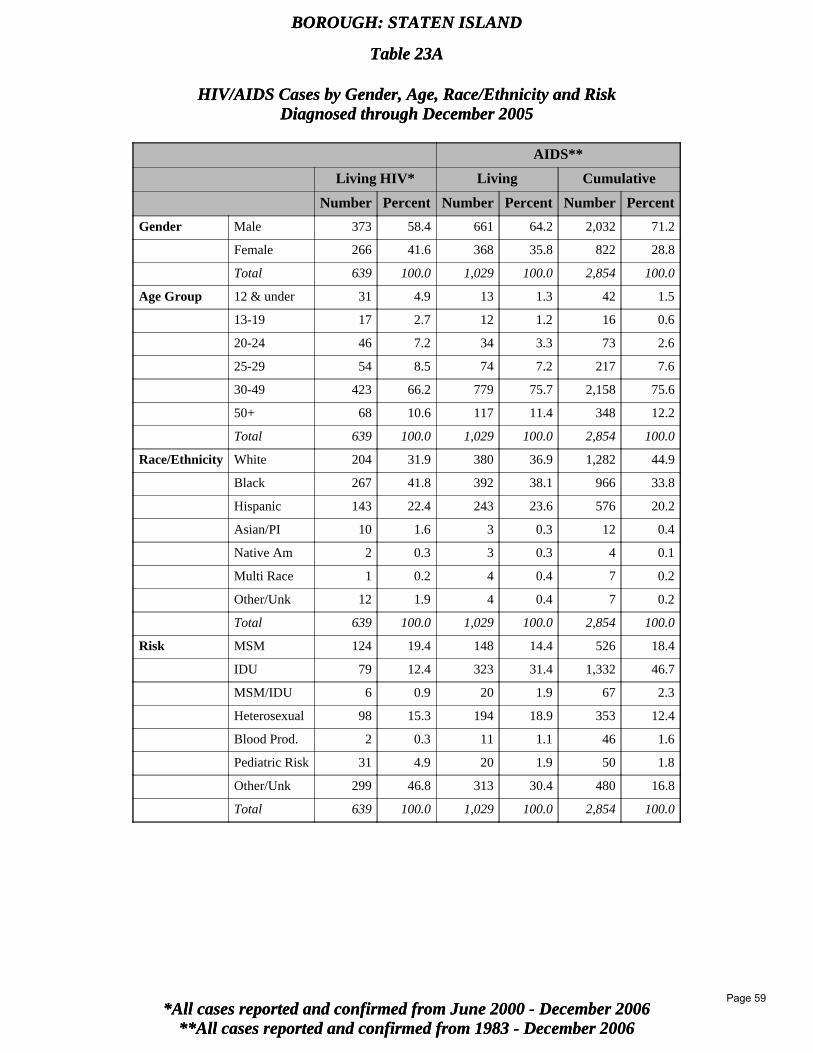
**All cases reported and confirmed from 1983 - December 2006*All cases reported and confirmed from June 2000 - December 2006
BOROUGH: STATEN ISLAND
Table 23A
HIV/AIDS Cases by Gender, Age, Race/Ethnicity and RiskDiagnosed through December 2005
**All cases reported and confirmed from 1983 - December 2006*All cases reported and confirmed from June 2000 - December 2006
BOROUGH: STATEN ISLAND
Table 23A
HIV/AIDS Cases by Gender, Age, Race/Ethnicity and RiskDiagnosed through December 2005
AIDS**
Living HIV* Living Cumulative
Number Percent Number Percent Number Percent
Gender Male 373 58.4 661 64.2 2,032 71.2
Female 266 41.6 368 35.8 822 28.8
Total 639 100.0 1,029 100.0 2,854 100.0
Age Group 12 & under 31 4.9 13 1.3 42 1.5
13-19 17 2.7 12 1.2 16 0.6
20-24 46 7.2 34 3.3 73 2.6
25-29 54 8.5 74 7.2 217 7.6
30-49 423 66.2 779 75.7 2,158 75.6
50+ 68 10.6 117 11.4 348 12.2
Total 639 100.0 1,029 100.0 2,854 100.0
Race/Ethnicity White 204 31.9 380 36.9 1,282 44.9
Black 267 41.8 392 38.1 966 33.8
Hispanic 143 22.4 243 23.6 576 20.2
Asian/PI 10 1.6 3 0.3 12 0.4
Native Am 2 0.3 3 0.3 4 0.1
Multi Race 1 0.2 4 0.4 7 0.2
Other/Unk 12 1.9 4 0.4 7 0.2
Total 639 100.0 1,029 100.0 2,854 100.0
Risk MSM 124 19.4 148 14.4 526 18.4
IDU 79 12.4 323 31.4 1,332 46.7
MSM/IDU 6 0.9 20 1.9 67 2.3
Heterosexual 98 15.3 194 18.9 353 12.4
Blood Prod. 2 0.3 11 1.1 46 1.6
Pediatric Risk 31 4.9 20 1.9 50 1.8
Other/Unk 299 46.8 313 30.4 480 16.8
Total 639 100.0 1,029 100.0 2,854 100.0
Page 59
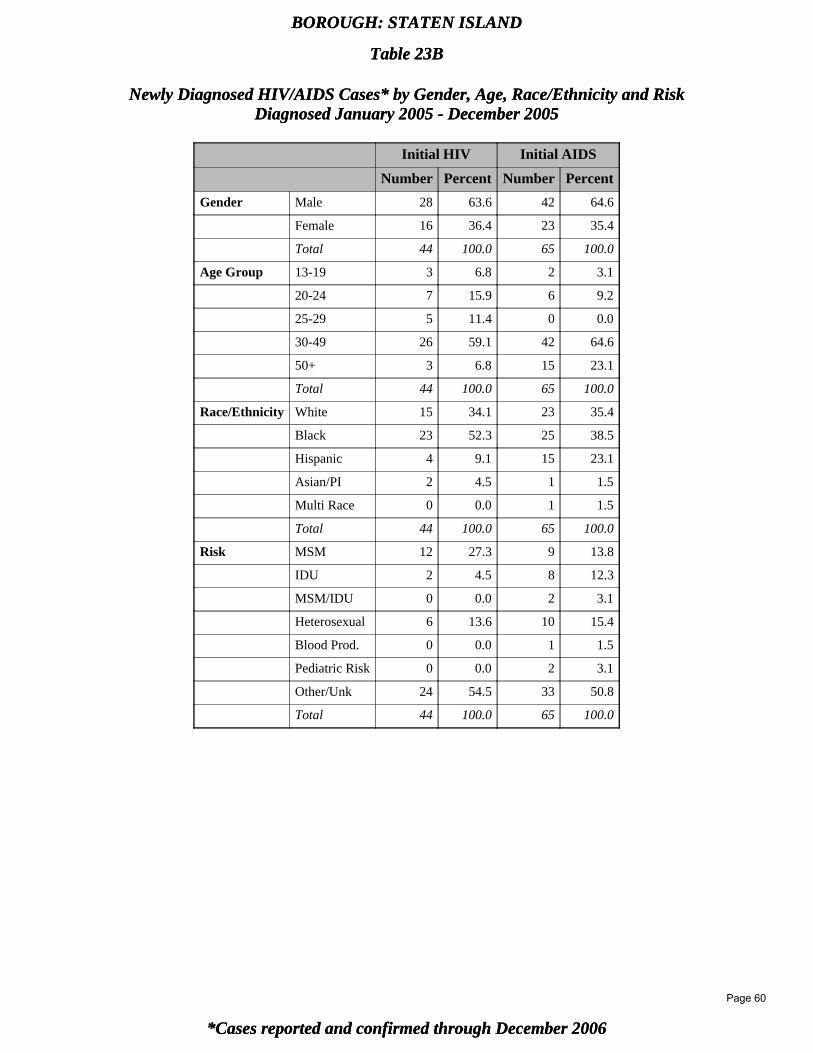
*Cases reported and confirmed through December 2006
BOROUGH: STATEN ISLAND
Table 23B
Newly Diagnosed HIV/AIDS Cases* by Gender, Age, Race/Ethnicity and RiskDiagnosed January 2005 - December 2005
*Cases reported and confirmed through December 2006
BOROUGH: STATEN ISLAND
Table 23B
Newly Diagnosed HIV/AIDS Cases* by Gender, Age, Race/Ethnicity and RiskDiagnosed January 2005 - December 2005
Initial HIV Initial AIDS
Number Percent Number Percent
Gender Male 28 63.6 42 64.6
Female 16 36.4 23 35.4
Total 44 100.0 65 100.0
Age Group 13-19 3 6.8 2 3.1
20-24 7 15.9 6 9.2
25-29 5 11.4 0 0.0
30-49 26 59.1 42 64.6
50+ 3 6.8 15 23.1
Total 44 100.0 65 100.0
Race/Ethnicity White 15 34.1 23 35.4
Black 23 52.3 25 38.5
Hispanic 4 9.1 15 23.1
Asian/PI 2 4.5 1 1.5
Multi Race 0 0.0 1 1.5
Total 44 100.0 65 100.0
Risk MSM 12 27.3 9 13.8
IDU 2 4.5 8 12.3
MSM/IDU 0 0.0 2 3.1
Heterosexual 6 13.6 10 15.4
Blood Prod. 0 0.0 1 1.5
Pediatric Risk 0 0.0 2 3.1
Other/Unk 24 54.5 33 50.8
Total 44 100.0 65 100.0
Page 60