Embed Size (px)
Citation preview
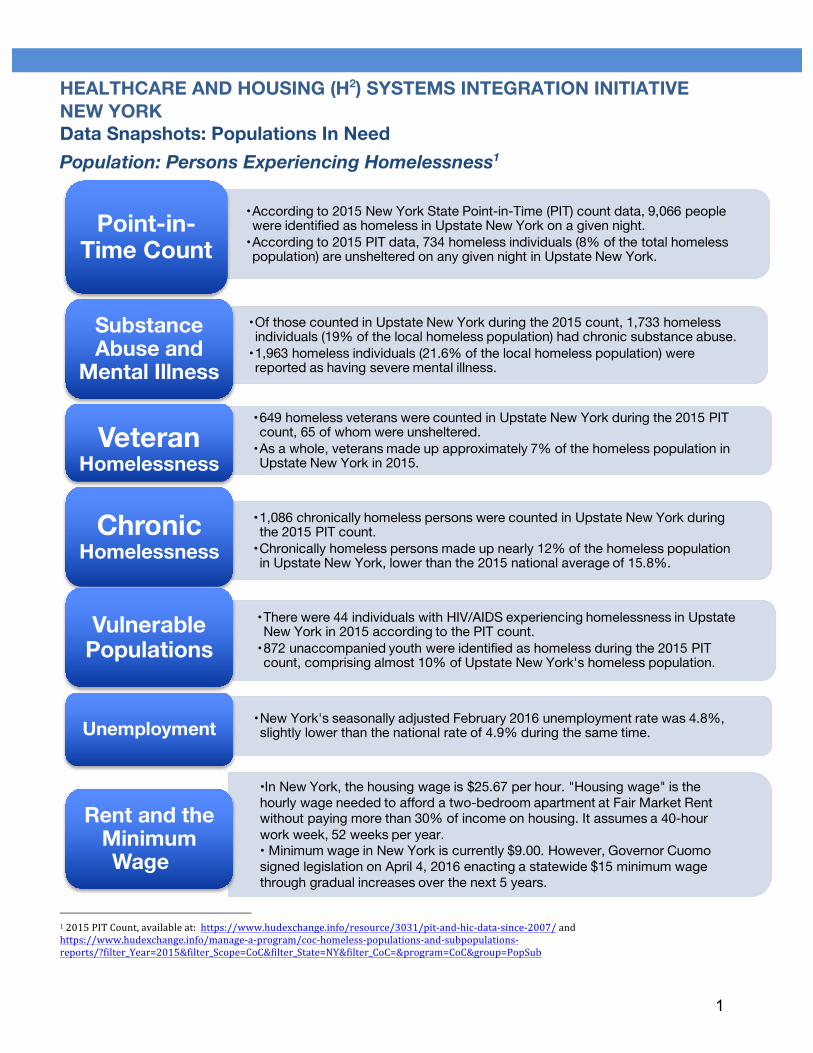
HEALTHCARE AND HOUSING (H2) SYSTEMS INTEGRATION INITIATIVE NEW YORK Data Snapshots: Populations In Need Population: Persons Experiencing Homelessness1
1
Point-in-Time Count
Substance Abuse and
Mental Illness
Veteran Homelessness
Chronic Homelessness
Vulnerable Populations
Unemployment
Rent and the Minimum Wage
•According to 2015 New York State Point-in-Time (PIT) count data, 9,066 people were identified as homeless in Upstate New York on a given night.•According to 2015 PIT data, 734 homeless individuals (8% of the total homeless population) are unsheltered on any given night in Upstate New York.
•Of those counted in Upstate New York during the 2015 count, 1,733 homeless individuals (19% of the local homeless population) had chronic substance abuse. •1,963 homeless individuals (21.6% of the local homeless population) were reported as having severe mental illness.
•649 homeless veterans were counted in Upstate New York during the 2015 PIT count, 65 of whom were unsheltered. •As a whole, veterans made up approximately 7% of the homeless population inUpstate New York in 2015.
•1,086 chronically homeless persons were counted in Upstate New York during the 2015 PIT count.•Chronically homeless persons made up nearly 12% of the homeless population in Upstate New York, lower than the 2015 national average of 15.8%.
•There were 44 individuals with HIV/AIDS experiencing homelessness in Upstate New York in 2015 according to the PIT count. •872 unaccompanied youth were identified as homeless during the 2015 PIT count, comprising almost 10% of Upstate New York's homeless population.
•New York's seasonally adjusted February 2016 unemployment rate was 4.8%, slightly lower than the national rate of 4.9% during the same time.
•In New York, the housing wage is $25.67 per hour. "Housing wage" is the hourly wage needed to afford a two-bedroom apartment at Fair Market Rent without paying more than 30% of income on housing. It assumes a 40-hour work week, 52 weeks per year. • Minimum wage in New York is currently $9.00. However, Governor Cuomo signed legislation on April 4, 2016 enacting a statewide $15 minimum wage through gradual increases over the next 5 years.
12015PITCount,availableat:https://www.hudexchange.info/resource/3031/pit-and-hic-data-since-2007/andhttps://www.hudexchange.info/manage-a-program/coc-homeless-populations-and-subpopulations-reports/?filter_Year=2015&filter_Scope=CoC&filter_State=NY&filter_CoC=&program=CoC&group=PopSub
HEALTHCARE AND HOUSING (H2) SYSTEMS INTEGRATION INITIATIVE NEW YORK Data Snapshots: Populations In Need
2
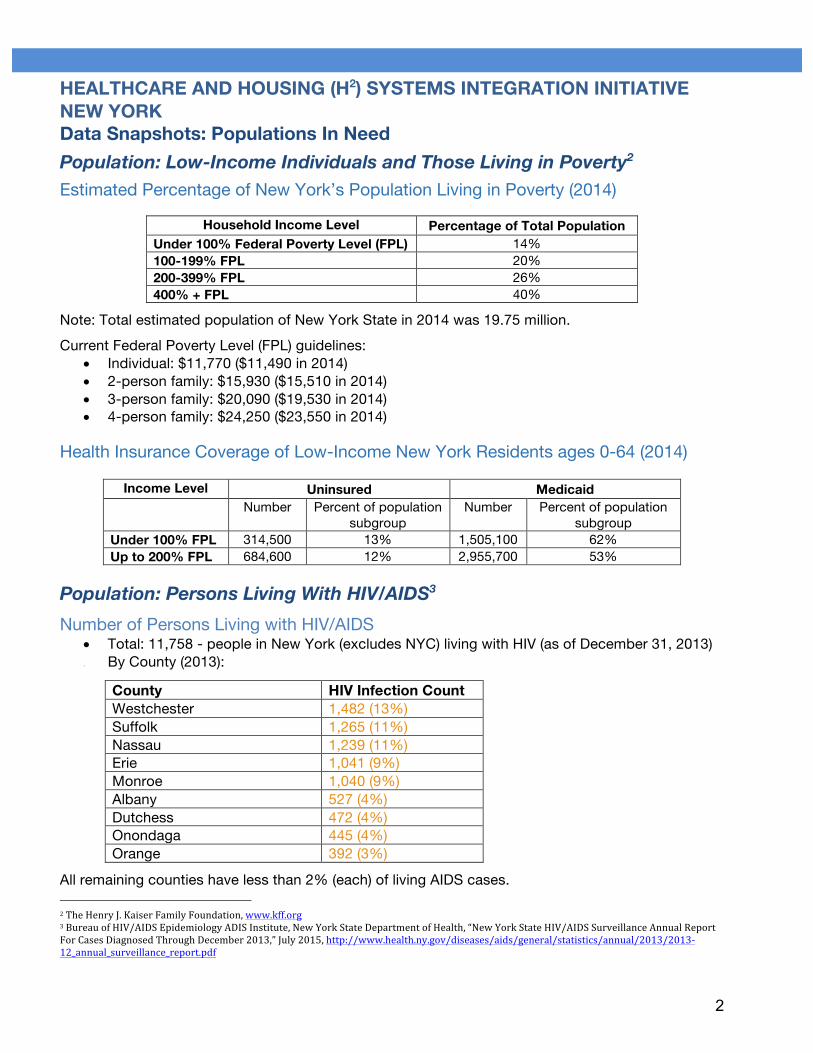
Population: Low-Income Individuals and Those Living in Poverty2
Estimated Percentage of New York’s Population Living in Poverty (2014)
Household Income Level
Percentage of Total Population Under 100% Federal Poverty Level (FPL) 14% 100-199% FPL 20% 200-399% FPL 26% 400% + FPL 40%
Note: Total estimated population of New York State in 2014 was 19.75 million. Current Federal Poverty Level (FPL) guidelines:
• Individual: $11,770 ($11,490 in 2014) • 2-person family: $15,930 ($15,510 in 2014) • 3-person family: $20,090 ($19,530 in 2014) • 4-person family: $24,250 ($23,550 in 2014)
Health Insurance Coverage of Low-Income New York Residents ages 0-64 (2014)
Income Level
Uninsured Medicaid
Number Percent of population subgroup
Number Percent of population subgroup
Under 100% FPL 314,500 13% 1,505,100 62% Up to 200% FPL 684,600 12% 2,955,700 53%
Population: Persons Living With HIV/AIDS3 Number of Persons Living with HIV/AIDS
• •
Total: 11,758 - people in New York (excludes NYC) living with HIV (as of December 31, 2013) By County (2013):
County HIV Infection Count Westchester 1,482 (13%) Suffolk 1,265 (11%) Nassau 1,239 (11%) Erie 1,041 (9%) Monroe 1,040 (9%) Albany 527 (4%) Dutchess 472 (4%) Onondaga 445 (4%) Orange 392 (3%)
All remaining counties have less than 2% (each) of living AIDS cases. 2TheHenryJ.KaiserFamilyFoundation,www.kff.org3BureauofHIV/AIDSEpidemiologyADISInstitute,NewYorkStateDepartmentofHealth,“NewYorkStateHIV/AIDSSurveillanceAnnualReportForCasesDiagnosedThroughDecember2013,”July2015,http://www.health.ny.gov/diseases/aids/general/statistics/annual/2013/2013-12_annual_surveillance_report.pdf
HEALTHCARE AND HOUSING (H2) SYSTEMS INTEGRATION INITIATIVE NEW YORK Data Snapshots: Populations In Need
3
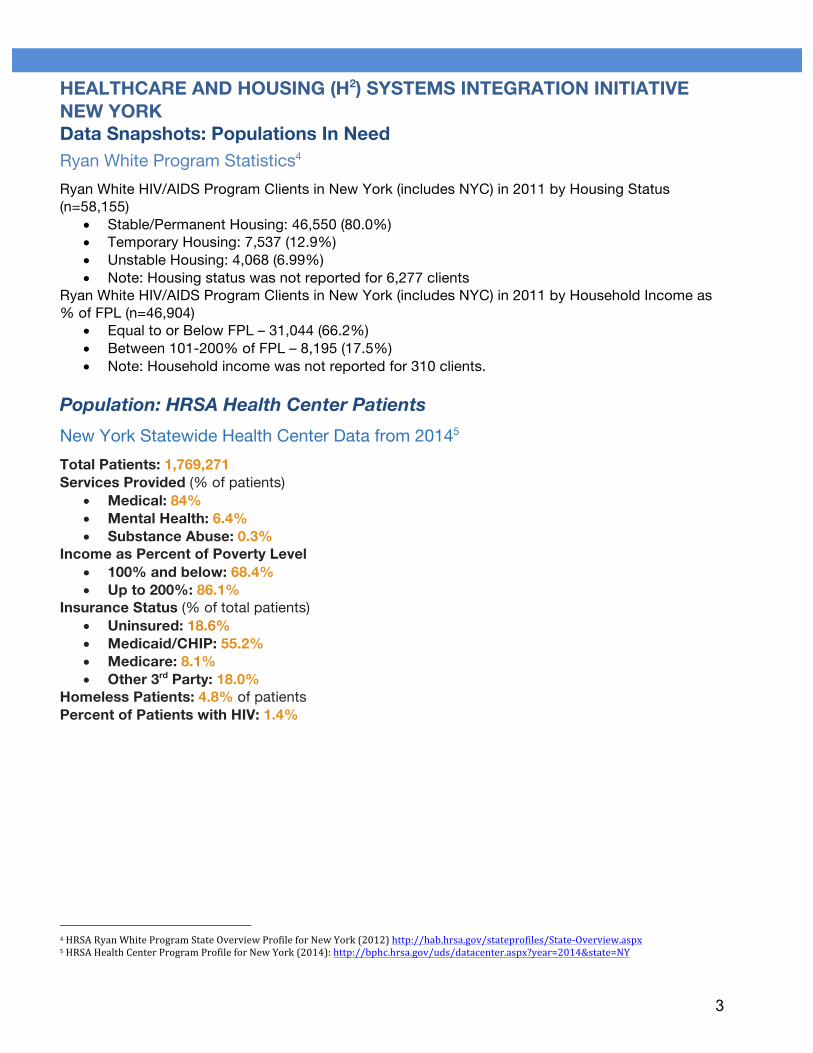
Ryan White Program Statistics4 Ryan White HIV/AIDS Program Clients in New York (includes NYC) (n=58,155)
• Stable/Permanent Housing: 46,550 (80.0%) • Temporary Housing: 7,537 (12.9%) • Unstable Housing: 4,068 (6.99%) • Note: Housing status was not reported for 6,277 clients
Ryan White HIV/AIDS Program Clients in New York (includes NYC) % of FPL (n=46,904)
• Equal to or Below FPL – 31,044 (66.2%) • Between 101-200% of FPL – 8,195 (17.5%) • Note: Household income was not reported for 310 clients.
in
in
2011
2011
by
by
Housing Status
Household Income as
Population: HRSA Health Center Patients
New York Statewide Health Center Data from 20145
Total Patients: 1,769,271 Services Provided (% of patients)
• Medical: 84% • Mental Health: 6.4% • Substance Abuse: 0.3%
Income as Percent of Poverty Level • 100% and below: 68.4% • Up to 200%: 86.1%
Insurance Status (% of total patients) • Uninsured: 18.6% • Medicaid/CHIP: 55.2% • Medicare: 8.1%
3rd• Other Party: 18.0% Homeless Patients: 4.8% of patients Percent of Patients with HIV: 1.4%
4HRSARyanWhiteProgramStateOverviewProfileforNewYork(2012)http://hab.hrsa.gov/stateprofiles/State-Overview.aspx5HRSAHealthCenterProgramProfileforNewYork(2014):http://bphc.hrsa.gov/uds/datacenter.aspx?year=2014&state=NY
HEALTHCARE AND HOUSING (H2) SYSTEMS INTEGRATION INITIATIVE NEW YORK Data Snapshots: Populations In Need
4
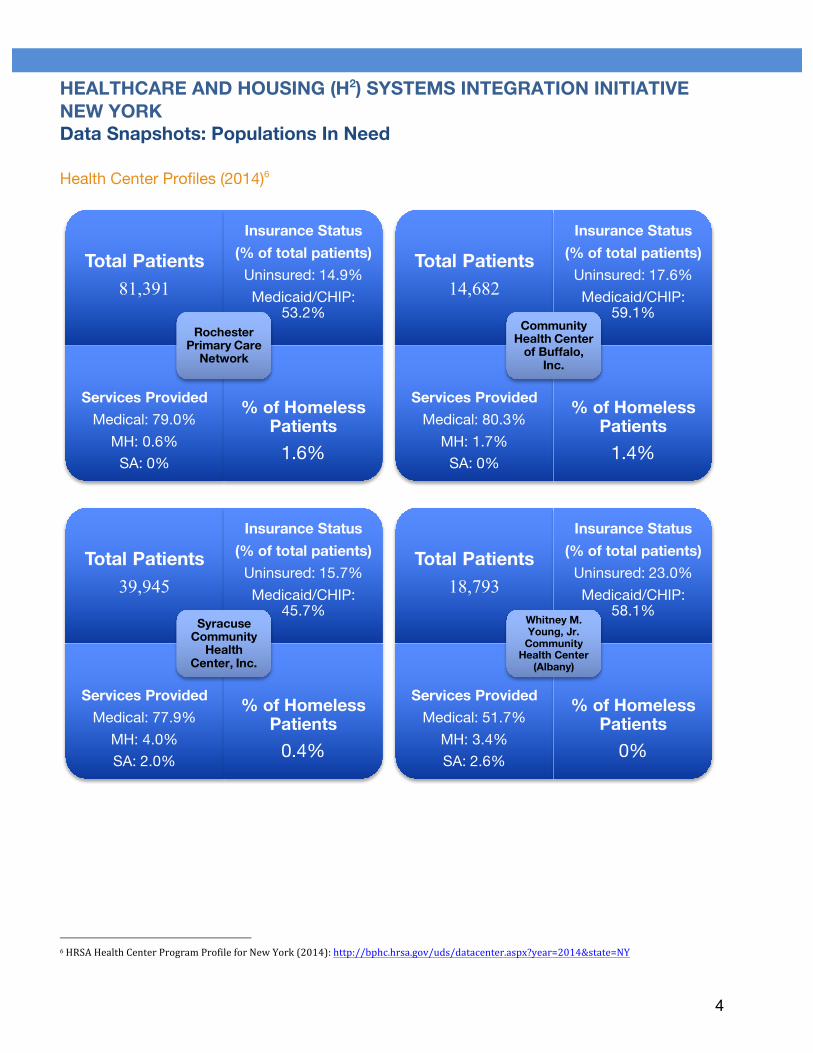
Health Center Profiles (2014)6
Total Patients 14,682
Insurance Status (% of total patients)
Uninsured: 17.6%Medicaid/CHIP:
59.1%
Services ProvidedMedical: 80.3%
MH: 1.7%SA: 0%
% of Homeless Patients
1.4%
Community Health Center
of Buffalo, Inc.
Total Patients 18,793
Insurance Status (% of total patients)
Uninsured: 23.0%Medicaid/CHIP:
58.1%
Services ProvidedMedical: 51.7%
MH: 3.4%SA: 2.6%
% of Homeless Patients
0%
Whitney M. Young, Jr.
Community Health Center
(Albany)
Total Patients 81,391
Insurance Status (% of total patients)
Uninsured: 14.9%Medicaid/CHIP:
53.2%
Services ProvidedMedical: 79.0%
MH: 0.6%SA: 0%
% of Homeless Patients
1.6%
Rochester Primary Care
Network
Total Patients 39,945
Insurance Status (% of total patients)
Uninsured: 15.7%Medicaid/CHIP:
45.7%
Services ProvidedMedical: 77.9%
MH: 4.0%SA: 2.0%
% of Homeless Patients
0.4%
Syracuse Community
Health Center, Inc.
6HRSAHealthCenterProgramProfileforNewYork(2014):http://bphc.hrsa.gov/uds/datacenter.aspx?year=2014&state=NY
HEALTHCARE AND HOUSING (H2) SYSTEMS INTEGRATION INITIATIVE NEW YORK Data Snapshots: Populations In Need
5
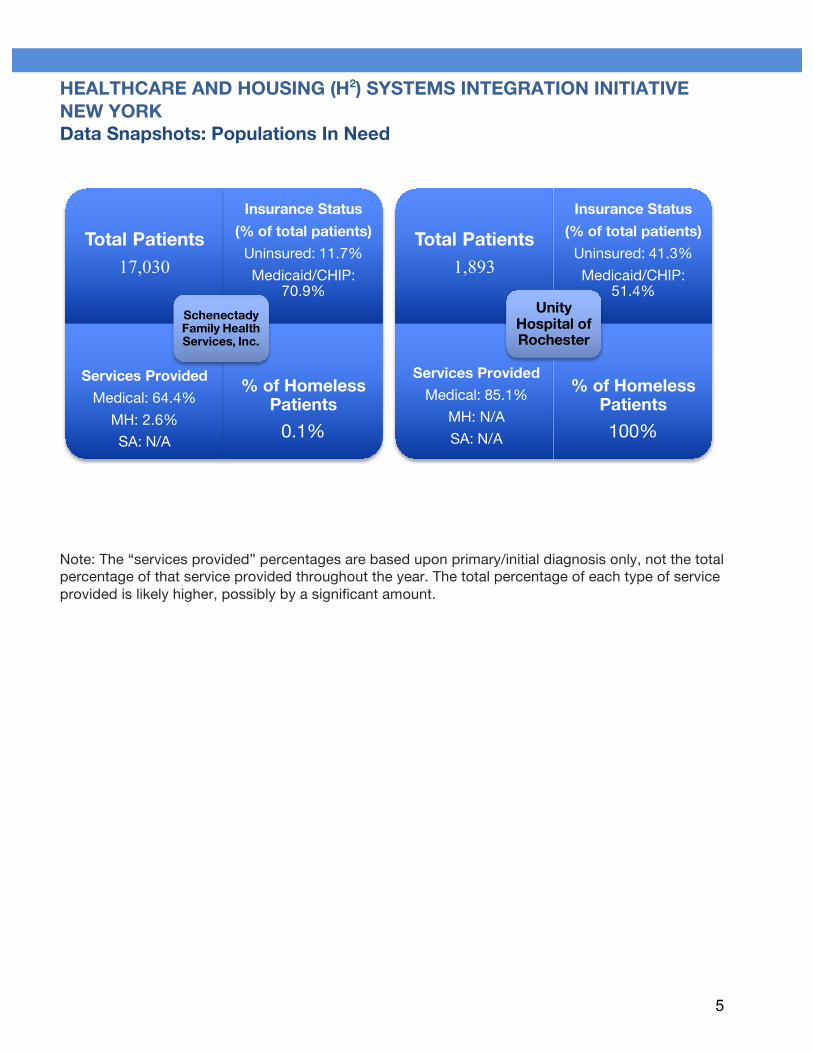
Total Patients 1,893
Insurance Status (% of total patients)
Uninsured: 41.3%Medicaid/CHIP:
51.4%
Services Provided Medical: 85.1%
MH: N/ASA: N/A
% of Homeless Patients 100%
Unity Hospital of Rochester
Total Patients 17,030
Insurance Status (% of total patients)
Uninsured: 11.7%Medicaid/CHIP:
70.9%
Services ProvidedMedical: 64.4%
MH: 2.6%SA: N/A
% of Homeless Patients
0.1%
Schenectady Family Health Services, Inc.
Note: The “services provided” percentages are based upon primary/initial diagnosis only, not percentage of that service provided throughout the year. The total percentage of each type ofprovided is likely higher, possibly by a significant amount.
the total service