Embed Size (px)
Citation preview

TDB Advisory Ltd tdb.co.nz New Zealand Dairy Companies Review 1
New Zealand Dairy Companies Review
April 2017
tdb.co.nz

TDB Advisory Ltd tdb.co.nz New Zealand Dairy Companies Review 2
Table of contents
Overview The New Zealand dairy industry Industry market shares and growth Competitors to Fonterra Financial performance Organisational form and capital structure Strategic direction Outlook and growth prospectsOpen Country Dairy Limited Organisation Market position and growth Strategy Financial performance Capital StructureSynlait Milk Limited Organisation Market position and growth Strategy Financial performance Capital StructureTatua Co-operative Dairy Company Organisation Market position and growth Strategy Financial performance Capital StructureWestland Co-operative Dairy Company Organisation Market position and growth Strategy Financial performance Capital StructureConclusions
44457891112121212121214141414141416161616161618181818181820
22 23
4578
Appendices
Appendix 1: The development of DIRAAppendix 2: Proposed changes to the DIRA regulatory regime
List of Figures:
Figure 1: Market shares, 2016Figure 2: Milk volumes, 2016Figure 3: Return on Assets (ROA), 2016Figure 4: Adjusted ROA, 2016
TDB Advisory Ltd tdb.co.nz New Zealand Dairy Companies Review 3
TDB Advisory LimitedLevel 5, Wakefield House90 The TerraceWellington, New Zealand
Geoff Taylor, [email protected] 465 0024
Nigel Atherfold, [email protected] 4650 057
Principal contacts for this report:
Disclosure and disclaimer
This report has been prepared by TDB Advisory Limited (TDB) with care and diligence. The statements and opinions given by TDB in this report are given in good faith and in the belief on reasonable grounds that such statements and opinions are correct and not misleading. However, no responsibility is accepted by TDB or any of its officers, employees or agents for errors or omissions however arising in the preparation of this report, or for any consequences of reliance on its content, conclusions or any material, correspondence of any form or discussions arising out of or associated with its preparation.
Statement of independence
TDB confirms that it has no conflict of interest that could affect its ability to provide an unbiased report. For completeness, it is disclosed that in the last 24 months, TDB has advised on:
• the sale of shares in Open Country Dairy Limited; • the sale of shares in Miraka Limited; • the valuation of water rights for large-scale dairy farming; and • the proposed changes to the Dairy Industry Restructuring Act for Goodman Fielder.
The principal contacts for this report, as noted above, are:
• investors in Fonterra (FSF) shares; • investors in and former directors of Open Country Dairy Limited; and • directors of other dairy farming businesses that are Fonterra Co-operative Group Limited suppliers and shareholders or Synlait Milk Limited suppliers or MyMilk suppliers.
List of tables
Table 1: Summary features of the dairy companiesTable 2: Company milk volume growth rates and leverageTable 3: Capital required for high-value processing assets
61120
Figure 5: Debt to Total AssetsFigure 6: Revenue/KgMS, 2016Figure 7: Fixed Assets/KgMS, 2016Figure 8: Breakdown of revenue per KgMS, 2016Figure 9: Total NZ Milk Production and Fonterra’s market share
99101121

TDB Advisory Ltd tdb.co.nz New Zealand Dairy Companies Review 4
This report reviews the performance of Fonterra Co-operative Group Limited’s (Fonterra’s) milk processing competitors in NZ. We estimate that the combined value of the assets of these competitors is above $2b and their revenue exceeds $2.5b. We have focused on the four companies that produce public financial reports – Open Country Dairy Limited (OCD), Synlait Milk Limited (Synlait), Tatua Co-operative Dairy Company Limited (Tatua) and Westland Co-operative Dairy Company Limited (Westland). Each of these companies is a major company in its own right and, with combined annual sales of around $2.3b (for 2016), the four companies collectively account for 90% (by milk volume) of the milk processed by Fonterra’s competitors in NZ.
The New Zealand dairy industry
The NZ dairy industry is dominated by the very high proportion of production that is exported. Only 4% of the milk produced in NZ is consumed domestically with 96% being processed into export products. Very little liquid milk is exported. The processors in NZ collect the liquid milk and transport it to manufacturing sites where water is extracted (milk is about 90% water) to produce a product that can be stored and shipped to export markets. These dried products are mainly base bulk commodities such as whole milk powder and skim milk powder. With so much production exported, the milk price paid to NZ farmers is a function of international commodity prices.
Industry market shares and growth
Fonterra was established in 2002 when the major processing companies merged with the jointly-owned export sales and marketing company, the New Zealand Dairy Board (NZDB). While all of the NZ processing companies were invited to merge, two elected not to and established their own export sales channels. Those two companies (Westland and Tatua) then processed approximately 4% of NZ’s milk. Fonterra therefore began life with 96% of the farmgate market. The dominant market position of Fonterra has been regulated by the Dairy Industry Restructuring Act, 2001 (DIRA)1. The DIRA includes milk-price regulations that govern the milk price (referred to as the farmgate milk price or FGMP) that Fonterra pays its NZ farmer-suppliers2.
Over the 15 years to 2017, Fonterra’s market share has fallen steadily to its current 84%. Westland and Tatua’s market share remains much the same at 4% while new processors have grown to a combined 12% share.
The current market shares of the NZ milk-processing companies are:
1 Refer to Appendix 1 – The development of DIRA.
2 The milk-price regulations result in Fonterra having to unbundle its distributions to farmer shareholders into a com modity milk-price payment for milk and a separate profit component from earnings above that commodity milk price. The commodity milk price is referred to as the farmgate milk price and is calculated notionally by using predominantly Global Dairy Trade prices for revenue and then deducting costs that are an estimate of those that a hypothetical effi cient large-scale processor would incur..
Overview
Figure 1: Market shares, 2016
TDB Advisory Ltd tdb.co.nz New Zealand Dairy Companies Review 5
Competitors to Fonterra
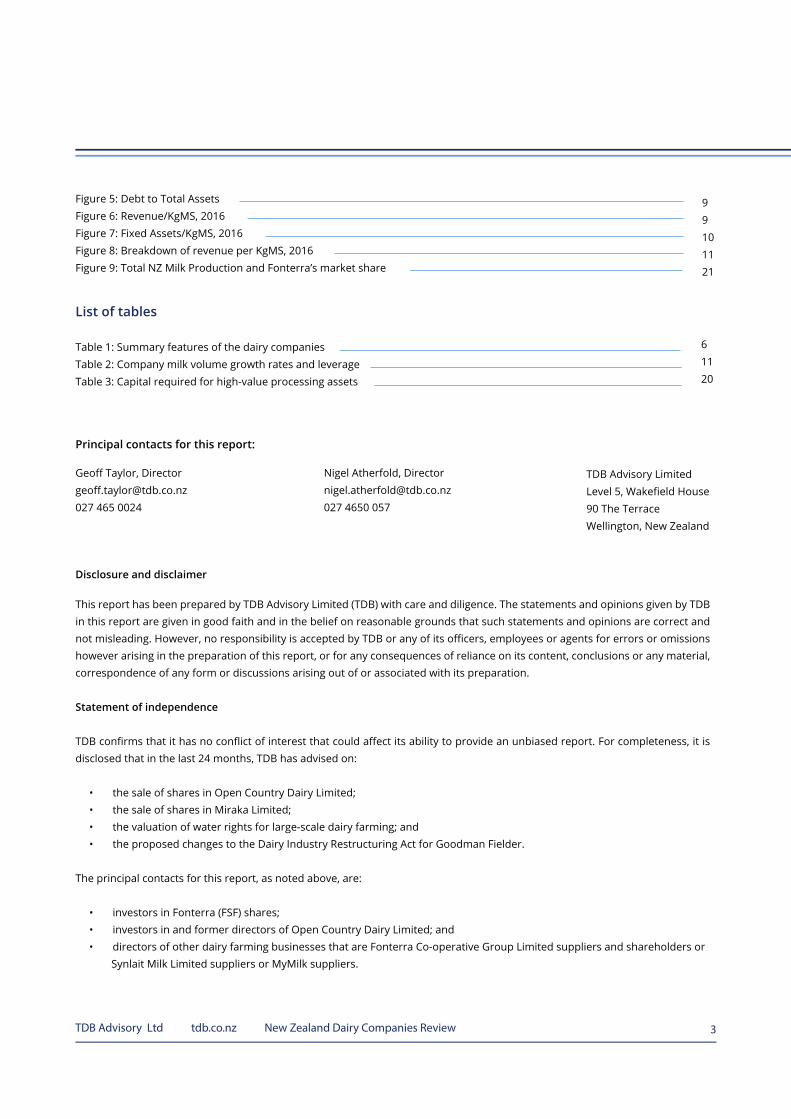
The collective size of Fonterra’s competitors is significant. Their combined sales are over $2.5b, EBIT is over $200m and asset value is approximately $2.5b. If their aggregate revenue is compared with NZX-listed food companies it would be similar to the combined revenues of Sanford Limited, Scales Corporation Limited, Delegat Group Limited and Comvita Limited. On a milk volume basis, Fonterra’s competitors now process approximately 3b litres of milk annually compared with Fonterra’s NZ milk volumes of over 18b litres and Fonterra’s Australian milk volumes of 1.7b litres. Fonterra is the second largest Australian processor.
While Fonterra remains the dominant processor in NZ, its share of “new” milk is estimated to be two thirds. Their respective amounts of new committed processing investment and access to capital indicate the competing companies are likely to continue to grow faster than Fonterra.
The Commerce Commission reviewed the state of competition in NZ’s dairy markets and released its findings in March 2016. The Commission concluded that without DIRA and its associated regulations, Fonterra would still have substantial market power. The Commission recommended the relaxation of those parts of the existing industry regulations that contribute least to the efficiency of the industry. After consultation with the industry, the government has since introduced a Bill amending DIRA3.
The milk volumes of Fonterra’s competitors are shown below:
A summary of the key features of the competing companies is provided in Table 1 on the following page.
1 Refer to Appendix 1 – The development of DIRA.2 The milk-price regulations result in Fonterra having to unbundle its distributions to farmer shareholders into a com modity milk-price payment for milk and a separate profit component from earnings above that commodity milk price. The commodity milk price is referred to as the farmgate milk price and is calculated notionally by using predominantly Global Dairy Trade prices for revenue and then deducting costs that are an estimate of those that a hypothetical efficient large-scale processor would incur.3 Refer to Appendix 2.
Figure 2: Milk volumes, 2016
TDB Advisory Ltd tdb.co.nz New Zealand Dairy Companies Review 6
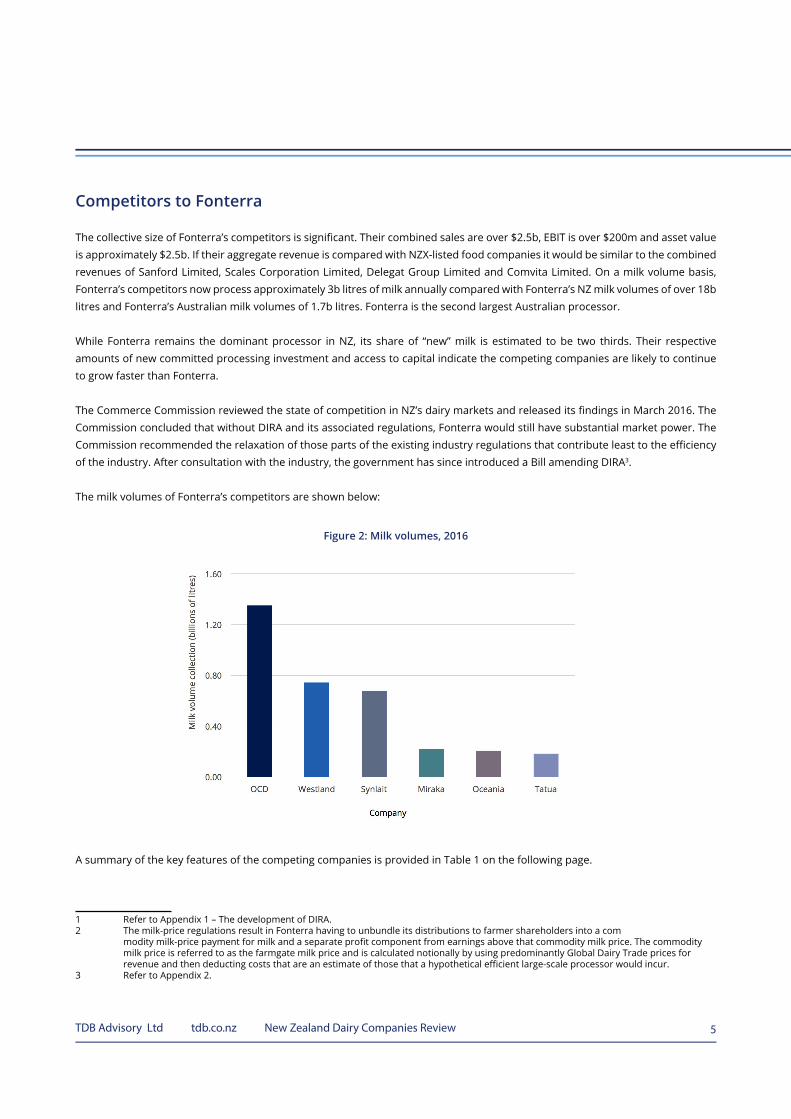
Table 1: Summary features of the dairy companies
Company Year Established
2016 Revenue
Revenue per KgMS Product positioning Sales channels Ownership
Open Country Dairy 2002 $833m $7.26
Commodity powders and cheese, with some movement recently into higher value ingredients (mozzarella curd, mature cheddar, whey protein concentrate).
100% exports to over 64 countriesSells direct to trade customers.
20% of sales though OLAM (a 15% shareholder).
NZ public unlisted company, Talley’s 76%, OLAM 15%, sixty others 9%.
Synlait 2007 $547m $9.47
Ingredient powders, infant formulas, cream, UHT and specialty ingredients.
Sells direct to busi-ness partners and trade buyers.
2% of sales to Bright Dairy (a 39% share-holder).
Publicly owned and listed on NZX and ASX.
Bright Dairy 39%, A2 Milk 8%, Mitsui 5%.
Westland 1938 $588m $9.31
Base commodities through to branded consumer products, powders, UHT milk, butter, and yoghurt.
Export to 60+ countries.
Co-op owned by 429 farmer suppliers.
Tatua 1914 $293m $18.58
High value speciality ingredients, caseinate, whey protein and anhydrous milk.
Progressively established offshore offices once separated from NZDB/Fonterra.
Co-op owned by 113 farmer suppliers.
Miraka 2011
$125m + (estimate based on plant capacity).
n/a Whole milk powder, UHT milk.
100% exports to over 23 countries. Sells through broker, Vinamilk, and Shang-hai Pengxin.
Owned by 29 mainly Maori incorporations. The two largest shareholders are Wairarapa Moana and Tuaropaki each with 29%. Vinamilk is a dairy products enterprise in Vietnam and has a 21% stake.
Oceania 2013
$200m + (estimate based on plant capacity).
n/aWhole milk powder, infant powders, UHT milk.
Exported through Yili (100% owner) sales channels.
100% Yili Industrial Group.
Yashili 2013
$200m + (estimate based on plant capacity).
n/a
Yashili does not collect any milk directly from farmers, it purchases ingredients from other processors and then manufactures infant powders.
Exported though Yashili and Danone sales channels.
100%Yashili Group (25% owned by Danone).

TDB Advisory Ltd tdb.co.nz New Zealand Dairy Companies Review 7
Oceania, Yashili and Miraka have not been covered in detail in this report. The first two companies are privately-owned by Chinese milk companies and are in their start-up phases where plant capacity utilisation is low. In addition, most of their product goes through their respective owner’s offshore distribution channels, which might distort the comparability of their NZ numbers. We have not included Miraka because its financial statements are not public. We note that Miraka was profitable by its second year from start-up and paid dividends to shareholders in its third year.
The revenue per unit of milk (KgMS4) in Table 1 above indicates the product positioning of each of the companies. Some companies (most notably Tatua and Synlait) have invested more in processing assets than the minimum required for a commodity product mix. We expand on the discussion of investment strategy in the following sections where the trade-off between risk and return is explored.
Financial performance
The financial performance (unadjusted Return on Assets or RoA5) of the four companies that this report focuses on ranged in 2016 from -2% to 16% (as per Figure 3). The RoA of the two newer entrants (OCD and Synlait) significantly exceeded the regulator’s estimate of the weighted average cost of capital (pre-tax WACC) of 7.9% for the sector6.
The unadjusted RoA numbers presented above do not provide a neutral basis for comparing the returns of the four companies. The milk price paid by the farmer-owned co-ops has historically been referred to as “payout”. The milk-price payout includes both a cost-of-milk portion and a portion of the co-op’s profit. Therefore, to assess the respective financial performances of the different dairy companies on a comparable basis, we have to adjust the EBIT results by standardising the cost of milk to the regulated FGMP. The FGMP is Fonterra’s cost of milk and it can be regarded as the industry benchmark. When this adjustment is made, the average EBIT return is as illustrated in Figure 4 on the following page.
4 NZ dairy farmers are paid on a kilograms of milk solids (KgMS) basis compared with the price-per-litre basis used in most countries. The NZ approach reflects the very small size of the liquid milk market and that most NZ milk has the water extracted to leave the residual being protein and fat and referred to as milk solids.5 ROA=Earnings before interest and tax (EBIT)/Average total assets.6 As with other regulated industries, an important input into the capital charges within the milk price regulations is WACC.
Figure 3: Return on Assets (ROA), 2016

TDB Advisory Ltd tdb.co.nz New Zealand Dairy Companies Review 8
The adjustment has the greatest effect on Tatua, which distributes a large amount of its surplus through its payout (on average its payouts have been $1.90 per KgMS higher than the FGMP over the past three years).
The new entrants, including Miraka, Oceania, OCD and Synlait, were largely unprofitable in their early years, having to invest in large-scale assets without committed milk supply or end customers. The new companies paid higher milk prices than Fonterra to build up milk supply and to compensate farmers for the higher-risk decision of switching from Fonterra. Generally, this risk has been rewarding for farmers with the exception of one case, New Zealand Dairies Limited, where the company failed. New Zealand Dairies was put into receivership by its Russian owner Nutritek and was purchased by Fonterra in 2011, with Fonterra making good the amounts owed to farmers.
The milk-price premium currently being paid by the new companies may disappear over time. The new companies are also reducing their risk (and the milk suppliers’ risks) by changing the basis of milk payments, including:
• OCD and Oceania offering fixed-price payments to farmers; • OCD paying the full value of milk more regularly than the annual deferred payments of Fonterra7; • Miraka making “farming-excellence” payments of up to 20c KgMS above the base milk price; and • Synlait paying differentiated milk prices for quality and grass-fed attributes.
Organisational form and capital structure
The corporate structures of the four dairy companies vary considerably. The different corporate forms include:
• two wholly farmer-owned co-operatives (Tatua and Westland); • a publicly-owned but unlisted NZ code company (OCD); • a NZX and ASX listed company (Synlait) with 40% owned by offshore trade investors; • a privately-owned company (Miraka) with an offshore trade investor with offshore distribution channels; and • two privately-owned subsidiaries of offshore food companies (Oceania and Yashili) with significant offshore distribution channels.
7 We have estimated this as being worth between 5 and 10c KgMS per year to the OCD supplier.
Figure 4: Adjusted ROA, 2016
TDB Advisory Ltd tdb.co.nz New Zealand Dairy Companies Review 9
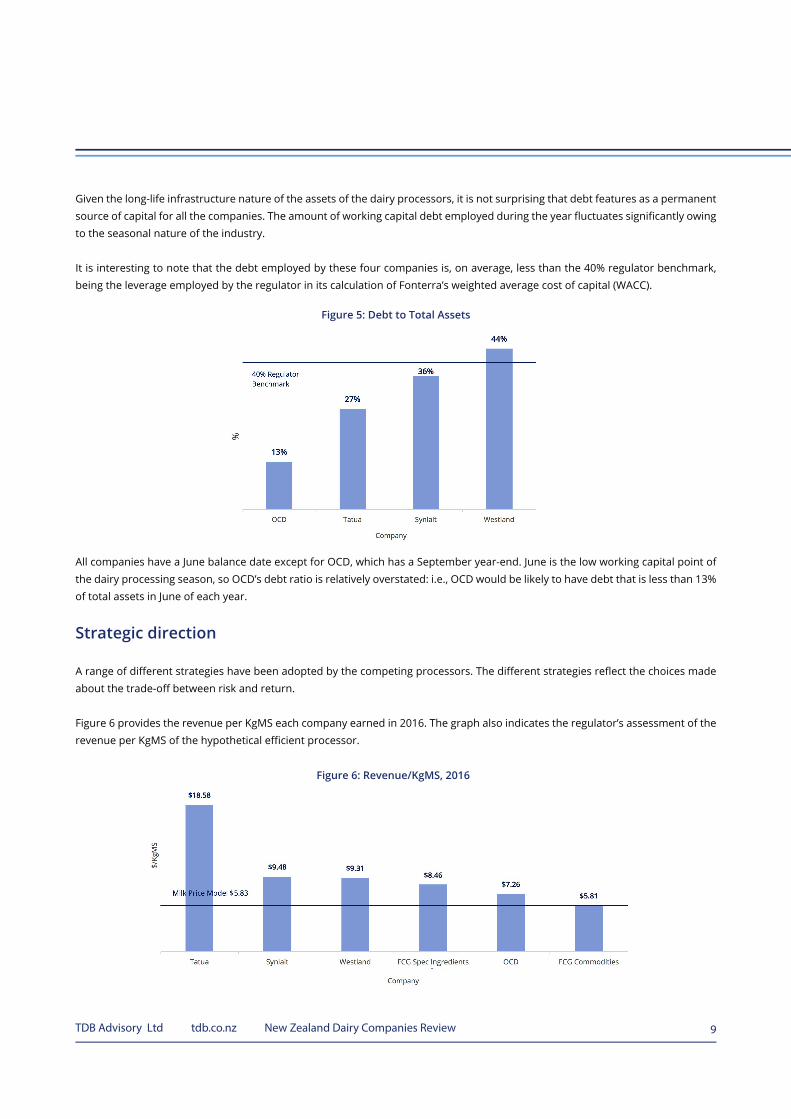
Given the long-life infrastructure nature of the assets of the dairy processors, it is not surprising that debt features as a permanent source of capital for all the companies. The amount of working capital debt employed during the year fluctuates significantly owing to the seasonal nature of the industry.
It is interesting to note that the debt employed by these four companies is, on average, less than the 40% regulator benchmark, being the leverage employed by the regulator in its calculation of Fonterra’s weighted average cost of capital (WACC).
All companies have a June balance date except for OCD, which has a September year-end. June is the low working capital point of the dairy processing season, so OCD’s debt ratio is relatively overstated: i.e., OCD would be likely to have debt that is less than 13% of total assets in June of each year.
Strategic direction
A range of different strategies have been adopted by the competing processors. The different strategies reflect the choices made about the trade-off between risk and return.
Figure 6 provides the revenue per KgMS each company earned in 2016. The graph also indicates the regulator’s assessment of the revenue per KgMS of the hypothetical efficient processor.
Figure 5: Debt to Total Assets
Figure 6: Revenue/KgMS, 2016
TDB Advisory Ltd tdb.co.nz New Zealand Dairy Companies Review 10
The range for revenue per KgMS is wide, from Tatua’s $18.58 to Fonterra’s commodity return of $5.818. The range reflects the differing strategies of the companies. Tatua is recognised as having a strong focus on high-value ingredient products while OCD has a strong focus on commodity products. In between, there is Synlait, which has a specialty ingredient business-to-business strategy and Westland, which produces both commodity products and consumer products.
If their aim was to generate as much revenue per KgMS processed as possible, then all competitors would take the Tatua (and Synlait) approach. However, the revenue generated per KgMS is only part of the consideration and it doesn’t reconcile with the profitability (RoA) information in Figure 4 where Tatua and OCD have the highest returns on assets.
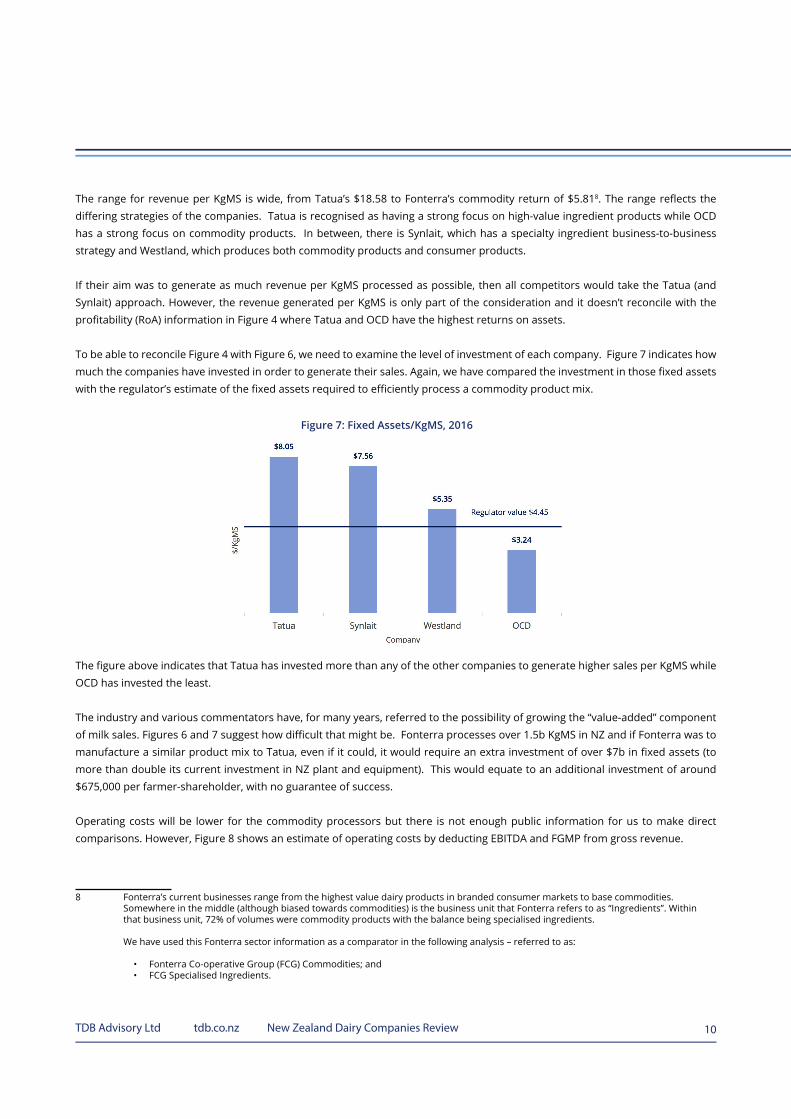
To be able to reconcile Figure 4 with Figure 6, we need to examine the level of investment of each company. Figure 7 indicates how much the companies have invested in order to generate their sales. Again, we have compared the investment in those fixed assets with the regulator’s estimate of the fixed assets required to efficiently process a commodity product mix.
The figure above indicates that Tatua has invested more than any of the other companies to generate higher sales per KgMS while OCD has invested the least.
The industry and various commentators have, for many years, referred to the possibility of growing the “value-added” component of milk sales. Figures 6 and 7 suggest how difficult that might be. Fonterra processes over 1.5b KgMS in NZ and if Fonterra was to manufacture a similar product mix to Tatua, even if it could, it would require an extra investment of over $7b in fixed assets (to more than double its current investment in NZ plant and equipment). This would equate to an additional investment of around $675,000 per farmer-shareholder, with no guarantee of success.
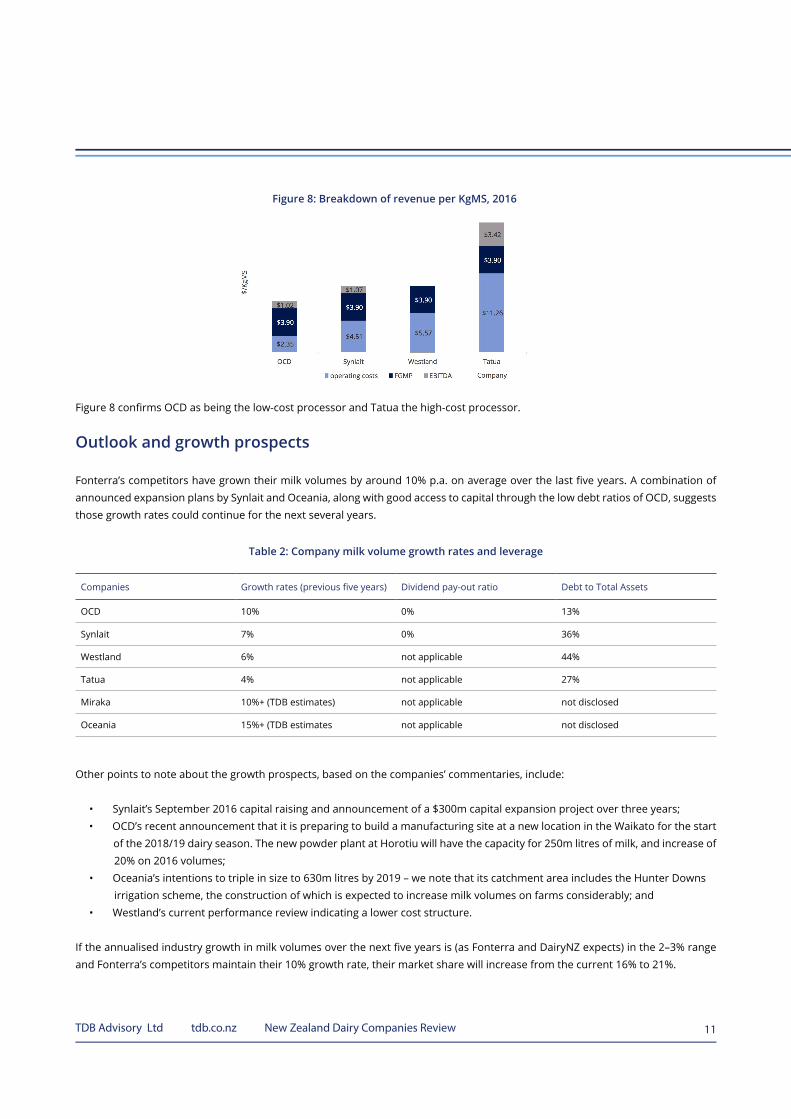
Operating costs will be lower for the commodity processors but there is not enough public information for us to make direct comparisons. However, Figure 8 shows an estimate of operating costs by deducting EBITDA and FGMP from gross revenue.
8 Fonterra’s current businesses range from the highest value dairy products in branded consumer markets to base commodities. Somewhere in the middle (although biased towards commodities) is the business unit that Fonterra refers to as “Ingredients”. Within that business unit, 72% of volumes were commodity products with the balance being specialised ingredients.
We have used this Fonterra sector information as a comparator in the following analysis – referred to as:
• Fonterra Co-operative Group (FCG) Commodities; and • FCG Specialised Ingredients.
Figure 7: Fixed Assets/KgMS, 2016
TDB Advisory Ltd tdb.co.nz New Zealand Dairy Companies Review 11
Figure 8 confirms OCD as being the low-cost processor and Tatua the high-cost processor.
Outlook and growth prospects
Fonterra’s competitors have grown their milk volumes by around 10% p.a. on average over the last five years. A combination of announced expansion plans by Synlait and Oceania, along with good access to capital through the low debt ratios of OCD, suggests those growth rates could continue for the next several years.
Other points to note about the growth prospects, based on the companies’ commentaries, include:
• Synlait’s September 2016 capital raising and announcement of a $300m capital expansion project over three years; • OCD’s recent announcement that it is preparing to build a manufacturing site at a new location in the Waikato for the start of the 2018/19 dairy season. The new powder plant at Horotiu will have the capacity for 250m litres of milk, and increase of 20% on 2016 volumes; • Oceania’s intentions to triple in size to 630m litres by 2019 – we note that its catchment area includes the Hunter Downs irrigation scheme, the construction of which is expected to increase milk volumes on farms considerably; and • Westland’s current performance review indicating a lower cost structure.
If the annualised industry growth in milk volumes over the next five years is (as Fonterra and DairyNZ expects) in the 2–3% range and Fonterra’s competitors maintain their 10% growth rate, their market share will increase from the current 16% to 21%.
Companies Growth rates (previous five years) Dividend pay-out ratio Debt to Total Assets
OCD 10% 0% 13%
Synlait 7% 0% 36%
Westland 6% not applicable 44%
Tatua 4% not applicable 27%
Miraka 10%+ (TDB estimates) not applicable not disclosed
Oceania 15%+ (TDB estimates not applicable not disclosed
Figure 8: Breakdown of revenue per KgMS, 2016
Table 2: Company milk volume growth rates and leverage

TDB Advisory Ltd tdb.co.nz New Zealand Dairy Companies Review 12
Open Country Dairy Limited (OCD)
Growth in assets and volumes collectedOrganisation
OCD began with a commodity cheese manufacturing plant in the Waikato in 2002. In 2005, OCD raised equity and added powder capacity to its Waikato manufacturing site. After a partial takeover (50.1%) by the Talley family in 2007, OCD expanded with powder plants in Southland and Taranaki. It is now the second largest milk processor in NZ and the second largest global supplier of whole milk powder (Fonterra being the largest).
Market position and growth
OCD is the only one of the new processing companies to have grown its milk collection and processing presence across a number of regions – Waikato, Taranaki and Southland. OCD is preparing for a second site in Waikato, at Horotiu, for a start date in the 2018/19 dairy season. In all of these regions, its only competitor is Fonterra. OCD has had an average milk volume growth rate of 10% over the last five years.
OCD collects from over 500 farmers and has, on average, paid farmers a premium above the farmgate milk price. In 2012, OCD moved to a different payment system and divided the milk-year into three. It pays the full milk price for each period. Compared with the deferred payments system that is standard across the sector, we estimate OCD’s approach is worth an additional 5 to 10c / KgMS annually to each farmer.
OCD is now owned 76% by the Talley family and 15% by Olam (a commodities trader headquartered in Singapore), with the balance of shares spread across sixty shareholders.
Strategy
OCD is a high-growth processor that focusses on sales of commodities supported by low capital and operating costs. However, its revenues achieve a small premium to the reference price in the regulated farmgate milk price calculation. We assume OCD’s ability to pay a price premium indicates both a move by OCD into higher-value ingredient products and its established customers paying a premium for committed supply. OCD continues to be able to build capacity at a cost less than the rest of the industry and, with (assumed) low operating costs, that has translated into above average returns on assets. These returns have been reinvested in new plants.
Actual milk payout less FGMP
Sales revenue per KgMS
TDB Advisory Ltd tdb.co.nz New Zealand Dairy Companies Review 13
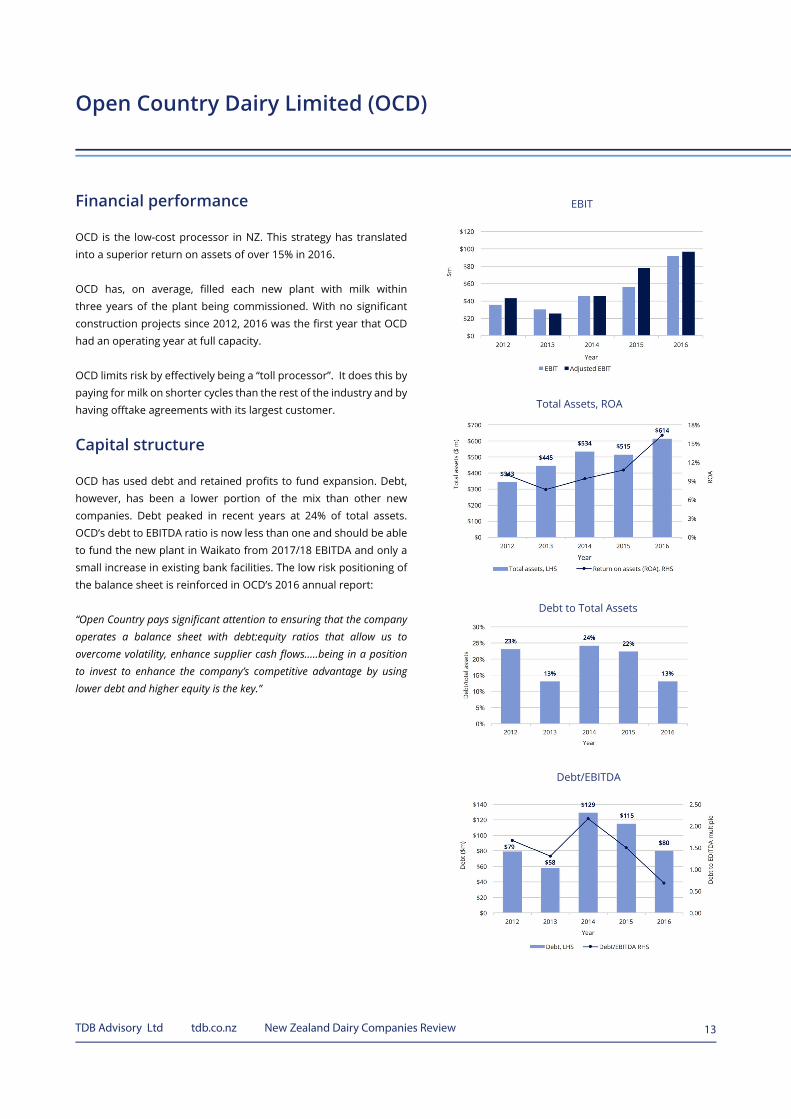
EBITFinancial performance
OCD is the low-cost processor in NZ. This strategy has translated into a superior return on assets of over 15% in 2016.
OCD has, on average, filled each new plant with milk within three years of the plant being commissioned. With no significant construction projects since 2012, 2016 was the first year that OCD had an operating year at full capacity.
OCD limits risk by effectively being a “toll processor”. It does this by paying for milk on shorter cycles than the rest of the industry and by having offtake agreements with its largest customer.
Capital structure
OCD has used debt and retained profits to fund expansion. Debt, however, has been a lower portion of the mix than other new companies. Debt peaked in recent years at 24% of total assets. OCD’s debt to EBITDA ratio is now less than one and should be able to fund the new plant in Waikato from 2017/18 EBITDA and only a small increase in existing bank facilities. The low risk positioning of the balance sheet is reinforced in OCD’s 2016 annual report:
“Open Country pays significant attention to ensuring that the company operates a balance sheet with debt:equity ratios that allow us to overcome volatility, enhance supplier cash flows…..being in a position to invest to enhance the company’s competitive advantage by using lower debt and higher equity is the key.”
Open Country Dairy Limited (OCD)
Total Assets, ROA
Debt to Total Assets
Debt/EBITDA
TDB Advisory Ltd tdb.co.nz New Zealand Dairy Companies Review 14
Synlait Milk Limited
Organisation
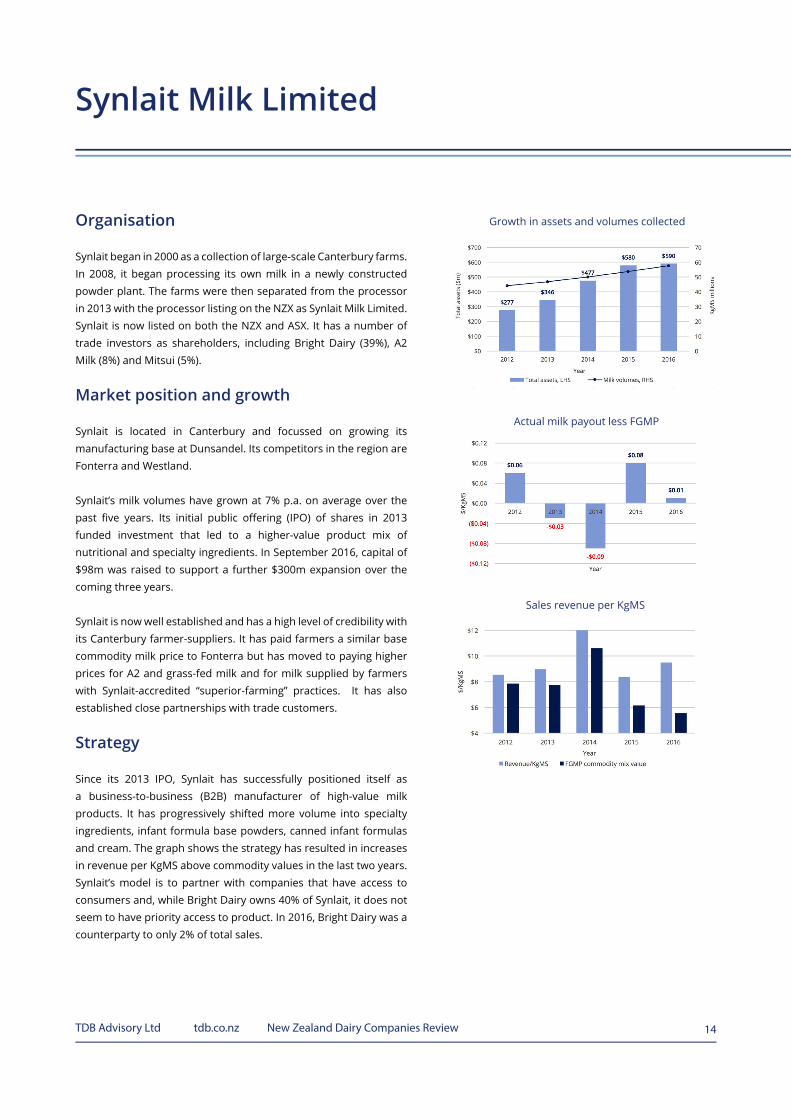
Synlait began in 2000 as a collection of large-scale Canterbury farms. In 2008, it began processing its own milk in a newly constructed powder plant. The farms were then separated from the processor in 2013 with the processor listing on the NZX as Synlait Milk Limited. Synlait is now listed on both the NZX and ASX. It has a number of trade investors as shareholders, including Bright Dairy (39%), A2 Milk (8%) and Mitsui (5%).
Market position and growth
Synlait is located in Canterbury and focussed on growing its manufacturing base at Dunsandel. Its competitors in the region are Fonterra and Westland.
Synlait’s milk volumes have grown at 7% p.a. on average over the past five years. Its initial public offering (IPO) of shares in 2013 funded investment that led to a higher-value product mix of nutritional and specialty ingredients. In September 2016, capital of $98m was raised to support a further $300m expansion over the coming three years.
Synlait is now well established and has a high level of credibility with its Canterbury farmer-suppliers. It has paid farmers a similar base commodity milk price to Fonterra but has moved to paying higher prices for A2 and grass-fed milk and for milk supplied by farmers with Synlait-accredited “superior-farming” practices. It has also established close partnerships with trade customers.
Strategy
Since its 2013 IPO, Synlait has successfully positioned itself as a business-to-business (B2B) manufacturer of high-value milk products. It has progressively shifted more volume into specialty ingredients, infant formula base powders, canned infant formulas and cream. The graph shows the strategy has resulted in increases in revenue per KgMS above commodity values in the last two years. Synlait’s model is to partner with companies that have access to consumers and, while Bright Dairy owns 40% of Synlait, it does not seem to have priority access to product. In 2016, Bright Dairy was a counterparty to only 2% of total sales.
Growth in assets and volumes collected
Actual milk payout less FGMP
Sales revenue per KgMS
TDB Advisory Ltd tdb.co.nz New Zealand Dairy Companies Review 15
Financial performance
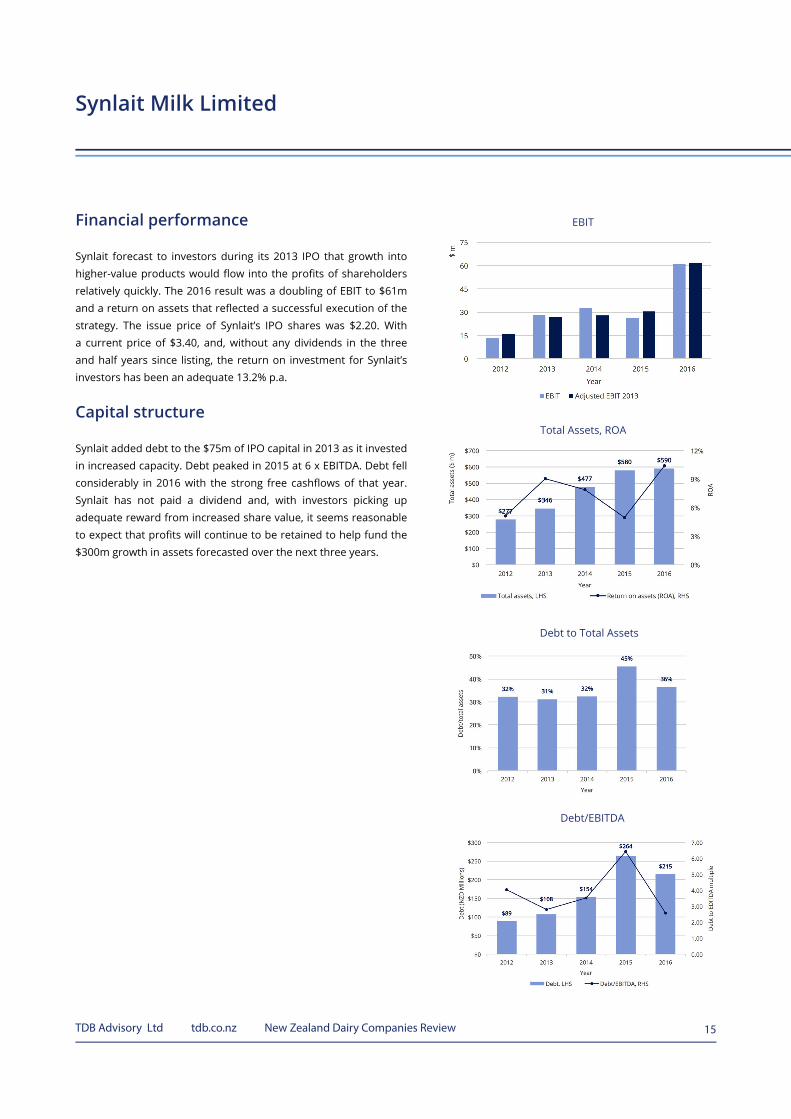
Synlait forecast to investors during its 2013 IPO that growth into higher-value products would flow into the profits of shareholders relatively quickly. The 2016 result was a doubling of EBIT to $61m and a return on assets that reflected a successful execution of the strategy. The issue price of Synlait’s IPO shares was $2.20. With a current price of $3.40, and, without any dividends in the three and half years since listing, the return on investment for Synlait’s investors has been an adequate 13.2% p.a.
Capital structure
Synlait added debt to the $75m of IPO capital in 2013 as it invested in increased capacity. Debt peaked in 2015 at 6 x EBITDA. Debt fell considerably in 2016 with the strong free cashflows of that year. Synlait has not paid a dividend and, with investors picking up adequate reward from increased share value, it seems reasonable to expect that profits will continue to be retained to help fund the $300m growth in assets forecasted over the next three years.
Synlait Milk Limited
EBIT
Total Assets, ROA
Debt to Total Assets
Debt/EBITDA
TDB Advisory Ltd tdb.co.nz New Zealand Dairy Companies Review 16
Tatua Co-operative Dairy Company
Organisation
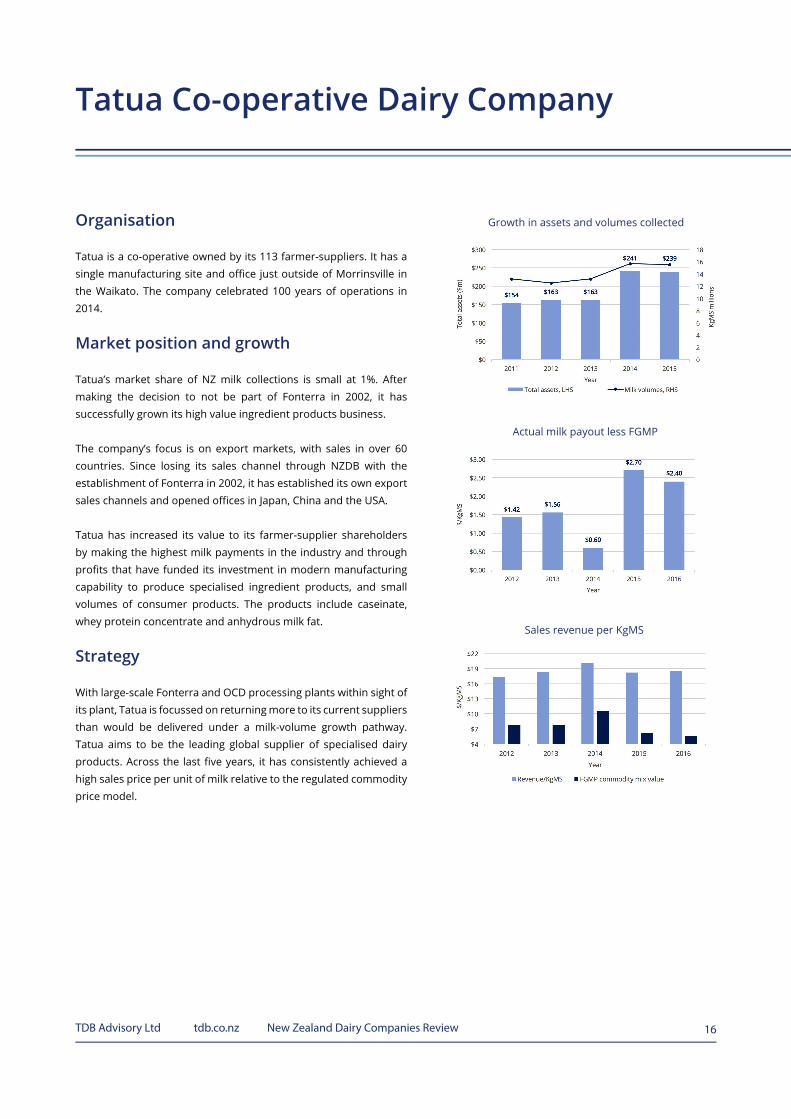
Tatua is a co-operative owned by its 113 farmer-suppliers. It has a single manufacturing site and office just outside of Morrinsville in the Waikato. The company celebrated 100 years of operations in 2014.
Market position and growth
Tatua’s market share of NZ milk collections is small at 1%. After making the decision to not be part of Fonterra in 2002, it has successfully grown its high value ingredient products business.
The company’s focus is on export markets, with sales in over 60 countries. Since losing its sales channel through NZDB with the establishment of Fonterra in 2002, it has established its own export sales channels and opened offices in Japan, China and the USA.
Tatua has increased its value to its farmer-supplier shareholders by making the highest milk payments in the industry and through profits that have funded its investment in modern manufacturing capability to produce specialised ingredient products, and small volumes of consumer products. The products include caseinate, whey protein concentrate and anhydrous milk fat.
Strategy
With large-scale Fonterra and OCD processing plants within sight of its plant, Tatua is focussed on returning more to its current suppliers than would be delivered under a milk-volume growth pathway. Tatua aims to be the leading global supplier of specialised dairy products. Across the last five years, it has consistently achieved a high sales price per unit of milk relative to the regulated commodity price model.
Growth in assets and volumes collected
Actual milk payout less FGMP
Sales revenue per KgMS

TDB Advisory Ltd tdb.co.nz New Zealand Dairy Companies Review 17
Financial performance
Tatua’s financial performance has been outstanding. Its revenue per unit of milk is the highest in the industry. This has translated into high returns on its $238m of assets. These returns are partially distributed via a higher milk price than the rest of the industry and partially retained to service debt and fund investment into speciality product development and manufacturing.
To compare Tatua’s performance with the other processors, we have adjusted its financial results by changing its milk price to the farmgate milk price. This change has significantly increased its EBIT from $16m to $53m for 2016. The adjustment more correctly shows Tatua’s return on assets as 22% in 2016.
Capital structure
As a co-operative, Tatua has a limited base of equity from its farmer-supplier shareholders and has used debt to help fund fixed asset investment. As an example, debt increased significantly in 2015 to fund the purchase of a specialised powder dryer. However, at 2.5 times EDITDA, debt is at reasonable levels.
Tatua Co-operative Dairy Company
EBIT
Total Assets, ROA
Debt to Total Assets
Debt/EBITDA
TDB Advisory Ltd tdb.co.nz New Zealand Dairy Companies Review 18
Westland Co-operative Dairy Company
Organisation
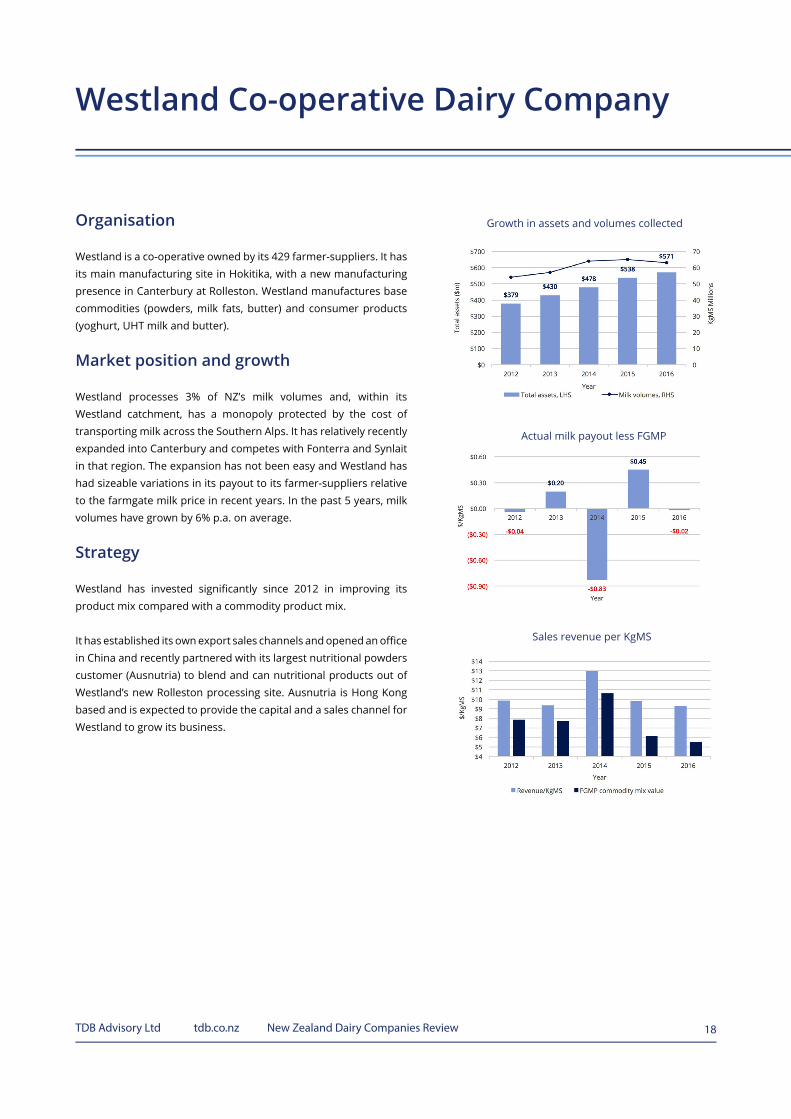
Westland is a co-operative owned by its 429 farmer-suppliers. It has its main manufacturing site in Hokitika, with a new manufacturing presence in Canterbury at Rolleston. Westland manufactures base commodities (powders, milk fats, butter) and consumer products (yoghurt, UHT milk and butter).
Market position and growth
Westland processes 3% of NZ’s milk volumes and, within its Westland catchment, has a monopoly protected by the cost of transporting milk across the Southern Alps. It has relatively recently expanded into Canterbury and competes with Fonterra and Synlait in that region. The expansion has not been easy and Westland has had sizeable variations in its payout to its farmer-suppliers relative to the farmgate milk price in recent years. In the past 5 years, milk volumes have grown by 6% p.a. on average.
Strategy
Westland has invested significantly since 2012 in improving its product mix compared with a commodity product mix.
It has established its own export sales channels and opened an office in China and recently partnered with its largest nutritional powders customer (Ausnutria) to blend and can nutritional products out of Westland’s new Rolleston processing site. Ausnutria is Hong Kong based and is expected to provide the capital and a sales channel for Westland to grow its business.
Growth in assets and volumes collected
Actual milk payout less FGMP
Sales revenue per KgMS
TDB Advisory Ltd tdb.co.nz New Zealand Dairy Companies Review 19
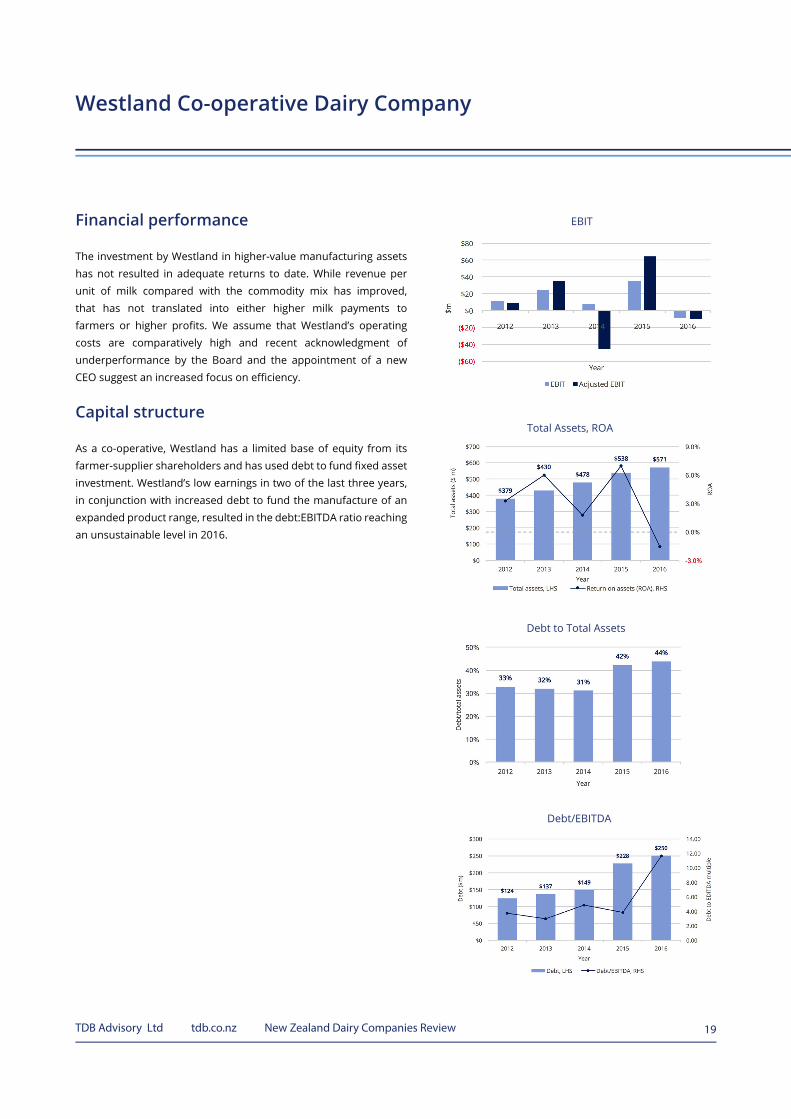
Financial performance
The investment by Westland in higher-value manufacturing assets has not resulted in adequate returns to date. While revenue per unit of milk compared with the commodity mix has improved, that has not translated into either higher milk payments to farmers or higher profits. We assume that Westland’s operating costs are comparatively high and recent acknowledgment of underperformance by the Board and the appointment of a new CEO suggest an increased focus on efficiency.
Capital structure
As a co-operative, Westland has a limited base of equity from its farmer-supplier shareholders and has used debt to fund fixed asset investment. Westland’s low earnings in two of the last three years, in conjunction with increased debt to fund the manufacture of an expanded product range, resulted in the debt:EBITDA ratio reaching an unsustainable level in 2016.
Westland Co-operative Dairy Company
EBIT
Total Assets, ROA
Debt to Total Assets
Debt/EBITDA

TDB Advisory Ltd tdb.co.nz New Zealand Dairy Companies Review 20
Conclusions
Fonterra’s NZ milk-processing competitors are now well established. The competitors’ milk volumes have grown from 600m litres when Fonterra was established in 2002, to 2.9b litres in 2016. They now have a combined profitability (EBIT) of over $200m. Interestingly, Fonterra has grown its Australian milk-processing volumes to 1.7b litres over the same period and in 2016 delivered a normalised EBIT on its Australian operations of $63m9.
OCD is the benchmark commodity processor and Tatua the benchmark value-added processor. Both are focussed on their core businesses and delivering higher than expected risk-weighted returns to their shareholders and farmers. Both are paying some of the excess return to farmer-suppliers. When we normalise their cost of milk to Fonterra’s FGMP, their returns on assets in 2016 were 22% (Tatua) and 17% (OCD).
Synlait is successfully shifting more of its milk into higher margin returns and has the access to capital and confidence from recent returns on assets of above 10% to invest in higher-value manufacturing assets that will continue its growth in volume and margin. Westland is the underperforming Fonterra competitor, and it is difficult to see that it could get shareholder support to invest more capital in higher-value processing assets.
Westland has acknowledged its underperformance and we would expect little milk volume growth until it reduces its costs and regains the confidence of its shareholders.
The balance sheets of Tatua and OCD show how significantly different their investment in long-term fixed-processing assets is. Tatua invests two and a half times more than OCD for every unit of milk processed. This additional investment is an indicator of the increased risk attached to a value-add strategy and underscores that a higher value-add strategy is not as simple as it sounds. It takes investment in long-term trusted customer relationships and investment in manufacturing assets that cost a lot more than is required for a commodity processor. If Tatua’s investment in manufacturing per unit of milk is applied to the other NZ dairy processors (including Fonterra’s NZ milk volumes), an additional $8b in capital would be required across the sector, as presented in Table 3 below.
9 Fonterra’s annual results presentation, 2016.
Table 3: Capital required for high-value processing assets
Companies KgMS (billions)Existing investment in fixed assetsper KgMS
Tatua's investment in fixed assetsper KgMS
Difference in investmentper KgMS
Capital needed (billions)
Fonterra 1.57 $3.52 $8.05 $4.53 $7.09
OCD 0.12 $3.24 $8.05 $4.81 $0.55
Westland 0.06 $5.35 $8.05 $2.70 $0.17
Synlait 0.06 $7.56 $8.05 $0.49 $0.03
Other 0.06 $3.52 $8.05 $4.53 $0.26
Total 1.86 $8.10

TDB Advisory Ltd tdb.co.nz New Zealand Dairy Companies Review 21
Given comments from the companies, we think it is reasonable to assume the current strategic positioning of the companies will remain the same over the coming few years:
• OCD is likely to grow volumes a further 20%, with the investment in the new Horotiu powder plant for a 2018/19 start date; • Synlait is likely to continue to grow its margins as more milk is processed into higher value ingredient products for its business partners. It has commented on growing its milk supply beyond the current one site; • Tatua is likely to continue to invest in high-value manufacturing assets and add margin to existing milk volumes; and • Westland is likely to lower costs and become more focussed on being either a commodity or consumer-products processor.
The decline in Fonterra’s market share from 96% in 2002 to the current 84% has been steady.
It seems likely that Fonterra’s competitors, with now well-established relationships with farmer-suppliers and offshore customers and profitable operations, will have access to capital to permit them to continue growing at rates in the 10% p.a. region. If, as we assume to be the case, Fonterra grows by 2.5% p.a, Fonterra’s market share will fall from 84% to 79% over the next five years.
The NZ milk processing industry remains predominantly low risk with the large majority of volumes in commodities. Competitors to Fonterra have improved the transparency of the sector’s risks and returns. The higher-risk strategies (Tatua and Synlait) are being adequately rewarded while at the other end of the spectrum, OCD is generating returns materially above its (low-risk) cost of capital.
Figure 9: Total NZ milk production and Fonterra’s market share
TDB Advisory Ltd tdb.co.nz New Zealand Dairy Companies Review 22
Appendix 1: The development of DIRA
NZ’s largest dairy processor, the co-operative company Fonterra, was established in 2002 from an amalgamation of the two largest dairy co-operatives: New Zealand Co-Operative Dairy Group Limited (NZDG) and Kiwi Co-Operative Dairies Limited (Kiwi), with the New Zealand Dairy Board. Through the merger, the industry sought to realise efficiencies of scale and scope in the collection and processing of farmers’ milk and to compete in international dairy markets to the overall benefit of New Zealand.
At the time, the value of the estimated benefits to New Zealand farmers from the merger was $300 million per annum or around $3 billion on a capitalised present value basis.
Upon its creation, Fonterra collected approximately 96 percent of New Zealand’s raw milk production. Allowing the creation of such a dominant firm had competition policy implications. In particular, a dominant firm could have:
• the incentives and ability to create barriers for farmer-suppliers to prevent them switching to potential competitors; • the incentives and ability to impede entry into the farmgate market by new dairy processors; • the incentives and ability to set wholesale prices in downstream domestic dairy markets; and • fewer incentives to drive cost efficiencies and invest in innovation, as it could use its market position to retain farmer- suppliers even if they were dissatisfied with the company’s performance.
The Dairy Industry Restructuring Act 2001 (DIRA) authorised the amalgamation after the Commerce Commission’s draft determination was that the merger would result in a strengthening of a dominant position in each of the relevant markets.
As the amalgamation resulted in an entity with a substantial degree of market power in a number of key domestic New Zealand dairy markets, DIRA was designed and implemented to mitigate the risks of Fonterra’s market power. DIRA allows for contestability in the New Zealand raw milk market and provides for access to other dairy goods or services supplied by Fonterra to be regulated if necessary.
Regulations made under the Dairy Industry Restructuring (Raw Milk) Regulations 2001 (and as amended and re-enacted in 2012) contain further provisions to facilitate the entrance of independent processors to New Zealand dairy markets and enable them to obtain the raw milk necessary to compete in dairy markets.
Those original regulations required Fonterra to supply, at a regulated price, up to 50 million litres of raw milk per season to any independent processor and up to 250 million litres per season to Goodman Fielder. The price of regulated raw milk was the farmgate milk price (FGMP) for that season plus reasonable transport costs.
The DIRA provisions work in parallel with and are supplementary to the general competition provisions of the Commerce Act 1986.
TDB Advisory Ltd tdb.co.nz New Zealand Dairy Companies Review 23
Appendix 2: Proposed changes to the DIRA regulatory regime
The statutory review of the state of competition in the dairy industry undertaken by the Commerce Commission in 2016 found that the current state of competition is not yet sufficient to ensure the efficient and contestable operation of the dairy market in the absence of the DIRA regulatory regime.
The Commerce Commission also recommended that any transition pathway to deregulation should take a staged approach and initially involve removing elements of the regulatory regime that contribute least to efficiency and contestability.
As a consequence of the recommendations made by the Commerce Commission, the Government has introduced to the House the Dairy Industry Restructuring Amendment Bill. Amongst other things, the Bill proposes:
• removing the default expiry provisions and the market share thresholds in the North and South Islands that trigger a review of the state of competition; • requiring a review of the state of competition to commence during the 2020/21 dairy season; • requiring a review at five-year intervals thereafter if competition has not yet been considered to be sufficient; • allowing Fonterra the discretion to refuse supply from new dairy conversions; • reducing the total volume of raw milk that Fonterra must supply to independent processors from 795 million litres to 600 million litres per season; and • removing the requirement for Fonterra to supply DIRA milk to large export-focused processors from the beginning of the 2019/20 season. The definition of a large, export-focused processor is one that has the capacity to process more than 100 million litres of milk per season and exports more than 50% of its production by volume.
The espoused key benefits of removing the requirement for Fonterra to supply DIRA milk to large export-focused processors are that:
• it clearly signals to existing and future processors that the current regulatory regime is not permanent and encourages them to find ways of operating without it; and • it incentivises different entry points into New Zealand’s factory-gate market and a focus on higher-value products rather than incentivising primary processing of raw milk at a time when the industry has excess capacity.
The Government considers that there is little risk of this amendment preventing the entry of new competitors.

TDB Advisory Ltd tdb.co.nz New Zealand Dairy Companies Review 24