Embed Size (px)
Citation preview

Newbury Racecourse Plc
Company number 80774

Newbury Racecourse PLC
Contents Officers and Professional Advisers 1 Chairman’s Statement 2 Strategic Report 3 Report of the Directors 8 Directors’ Responsibilities Statement 11 Independent Auditors’ Report 12 Consolidated Profit and Loss Account 13 Consolidated Statement of Total Recognised Gains and Losses 13 Consolidated Balance Sheet 14 Company Balance Sheet 15 Consolidated Cash Flow Statement 16 Notes to the Consolidated Cash Flow Statement 17 Accounting Policies 18 Notes to the Financial Statements 19

1
Officers and Professional Advisers DIRECTORS
D J Burke (Chairman) C E Spencer
J Dodds B T Stewart-Brown
The Hon H M Herbert Lady Lloyd-Webber
J Thick R L Todd
N W E Penser
C J Spence
SECRETARY C E Spencer REGISTERED OFFICE The Racecourse Newbury Berkshire
RG14 7NZ AUDITORS Deloitte LLP Reading BANKERS HSBC Bank PLC Allied Irish Bank (GB) 6 Northbrook Street 4 Tenterden Street Newbury London Berkshire W15 1TE
RG14 1DJ Weatherbys Bank Royal Bank of Scotland
Sanders Road Abbey Gardens Wellingborough 4 Abbey Street Northamptonshire Reading NN8 4BX RG1 3BA
SOLICITORS Burges Salmon LLP One Glass Wharf Bristol BS2 0ZX REGISTRARS Capita Registrars Shareholder Services The Registry 3-4 Beckenham Road Beckenham Kent
BR3 4TU CORPORATE ADVISERS Strata Technology Partners LLP Kingsbury House 15-17 King Street London
SE1Y 6QU

Newbury Racecourse PLC
2
Chairman’s Statement 2014 was a year of positive growth and improved underlying financial performance for Newbury Racecourse. The full year profit after tax of £2.0m compared to £1.1m in 2013 reflects an overall improvement in the underlying trading of £0.15m, together with exceptional profits in the property business of £1.9m and the release in 2014 of a £0.46m tax provision booked in 2013 in respect of the property transaction. The £1.9m exceptional profits relates to the recognition of the value of the completion of the refurbished stables block and head lads’ accommodation, together with the refurbished horsebox parking, all funded as part of the property agreement with David Wilson Homes. Improved trading performance helped turn the prior year trading operating loss of (£0.4m) into a profit of £0.3m in 2014, an improvement of £0.7m. We saw overall raceday attendances increase 6% year on year to 196,000, with more than 30,000 attending the bet365 Hennessy Festival in November (a 7% increase on the previous year). Once again, we played host to some spectacular racing, with the performances of Kingman in April, Olympic Glory in May, Tiggy Wiggy in July and Many Clouds in November demonstrating the quality and appeal of our racing throughout the year. To underpin this, a 7% increase in our prizemoney to £3.9m, was evidence of our continued commitment to investing in our race programme. David Wilson Homes has continued to make good progress with the residential property development and we are pleased with the continued high demand for properties at the Racecourse, which benefitted the Group’s cashflows by a further £3.29m in 2014. Following Julian Thick’s appointment in December 2013, he and the Board have been considering the future investment strategy for the Racecourse itself. This review has identified a number of key areas of infrastructure and facilities around the site that require improvement and investment, in order to underpin the long term trading performance of the business. We are currently working through the feasibility and design considerations, together with the financial aspects of the proposals and we look forward to being in a position to update shareholders further once these exciting plans are sufficiently progressed.
During the year we successfully completed the rebranding to Newbury Racecourse and also invested in the quality and experience of our management team, with a number of senior appointments during 2014. We are confident that with the right team in place the business will continue to grow and show improved financial returns over the coming years. On behalf of the board, I would like to thank all of our staff for their continued hard work and commitment during the year. In addition, we are incredibly grateful to all our sponsors for their support and the owners, trainers, all horsemen and racegoers for their continued support and patronage during this period of transformation for the Racecourse. DOMINIC J BURKE Chairman 22 April 2015

Newbury Racecourse PLC
3
STRATEGIC REPORT STRATEGY AND OBJECTIVES The Board’s long term strategy is to continue the profitable development of Newbury Racecourse as a leading racecourse, entertainment and events business with racing at its core. Significant progress towards this aim has been made in 2014, with improved financial results, reinvestment in prize money and facilities, successful completion of the rebranding to Newbury Racecourse and a restructuring of the management team to position the business for future growth. THE BUSINESS MODEL Newbury Racecourse PLC is the parent of a group of companies which own Newbury Racecourse and engage in racing, hospitality and catering retail activities. In addition the group operates a conference and events business, and a children’s nursery. PERFORMANCE REVIEW Consolidated group profit on ordinary activities before tax in the year ended 31 December 2014 was £1.5m (2013: £1.5m) which includes £1.9m of exceptional profits (2013: £1.8m exceptional profits). The trading business’ improved performance resulted in a profit before tax of £0.05m (2013: loss (£0.7m)). Turnover for the trading business increased by 7% (£0.8m) to £12.4m (2013: £11.6m). Racing revenues increased by c.9% (£0.9m) on prior year, primarily as a result of increased public attendances and food and beverage revenues, together with an increase in media income. Conference and Events income was in line with prior year at £0.9m. The Rocking Horse Nursery suffered a decline in revenues of 8% (£0.05m), during what proved to be another difficult year of trading, as a result of reduced child numbers. The improvement in overall trading performance resulted in an increase in trading operating profit before operating exceptional items to £0.30m (2013: £0.15m). The operating loss for the property business before operating exceptional items was £0.075m (2013: loss £0.052m), reflecting the modest costs of managing the ongoing relationship with David Wilson Homes (DWH), our development partner. Exceptional operating items of (£0.8m) have been accounted for (2013: (£0.6m)), being an impairment in respect of the write off of historic design and planning costs in connection with the racecourse redevelopment plans. The overall operating loss on ordinary activities before interest and non-operating exceptional items was £0.6m (2013: loss (£0.5m)). Exceptional items during 2014 relate to a profit on disposal of fixed assets of £1.9m being the recognition of the newly refurbished stables complex, head lads’ accommodation and horsebox parking
provided by DWH as part of the consideration for the land sale. Interest receivable of £0.4m reflects the partial unwinding of the DWH debtor discount charge relating to the year ended 31 December 2014. Profit on ordinary activities after tax was £2.01m (2013: £1.11m). The increase in cash reserves of £3.43m in the period (2013: £1.56m decrease) includes £3.29m of cash receipts from DWH in respect of properties sold in the period. Racing The accounts include a total of 28 days racing (2013: 28) comprising 11 days National Hunt racing (2013: 11) and 17 days flat racing (2013: 17). The Racecourse hosted some very high quality racing during 2014, with no meetings abandoned (2013: one meeting abandoned). Our highest profile flat races produced championship level performances from Kingman in the AON Greenham Stakes, Olympic Glory in the JLT Lockinge Stakes and Tiggy Wiggy in the Weatherbys Super Sprint. Our keynote jump meeting, the three day bet365 Hennessy Festival, continued to make progress and we were delighted with attendances of more than 30,000, an improvement of 7% on 2013. The emotional victory of Many Clouds in the Hennessy Gold Cup, trained locally by the hugely popular Oliver Sherwood, provided a fitting climax to the meeting. We remain committed to developing this meeting to make it a cornerstone of the jumping season. Overall raceday attendances in 2014 increased by 6% to 196,000 (2013: 185,000). This was, in the main, due to increased attendances at a number of key fixtures, in particular the bet365 Hennessy Festival in November and to a lesser extent a prior year abandonment of one fixture. We are grateful to have received continued significant support from all of our sponsors, with particular thanks to bet365, Betfair, Betfred, JLT and Dubai Duty Free for their investment in 2014. This support has allowed us to continue to invest in our prize money and we are pleased to report that prize money increased by 7% in 2014 to £3.9m. In November, we were delighted to announce a five year sponsorship deal with Al Shaqab Racing for the Lockinge Stakes race meeting commencing from 2015. This five year deal will increase the total prize money available on the day by 125%, with the feature race of the day, the Group 1 Al Shaqab Lockinge Stakes, increasing in value from £214,000 in 2014 to £350,000 in 2015, a 64% increase. We took a more selective approach to our music events in 2014 and were pleased with the outcome of the two Party in The Paddock events held this year,

Newbury Racecourse PLC
4
namely the Beach Boys in July and international DJs Pete Tong and Annie Mac in August, both attracting crowds in excess of 15,000 and producing improved financial returns compared to the 2013 events of Rita Ora and Meat Loaf. Media revenues increased by c. £0.2m, to £2.8m for the twelve months to 31 December 2014, reflecting the first full year of the new media rights agreement with Turf TV, which came into effect in April 2013. Hospitality and Retail Total catering revenues increased by £0.5m (15%) on 2013, to £3.6m. In September 2014 we welcomed Martin Wales to the team as our new Head of Catering. Martin brings with him a wealth of experience in venue catering and has already introduced a number of initiatives as we continue to strive to improve our food and beverage retail offer to customers and the financial returns that this part of the business delivers. This is being achieved through flexibility and innovation in our product offering, investment in the appearance of the retail outlets and staff training. Leisure, Conference and Events Conference and Events revenues were level with 2013, which was in line with our expectations given the loss of some major one off events, although gross operating profit was 23% (£0.05m) behind. However, we were pleased to host successful events for a number of blue chip clients, including Thames Water, KPMG, Skandia, Tesco, Taylor Wimpey, Hewlett Packard, Boots and SSE. Performance in the second half of the year improved markedly and we are pleased to report that we sold almost 3,000 Christmas party covers, a 173% increase on the previous year. We remain focussed on growing this area of our business and to this end we have restructured our sales team and recruited Tracy Skinner as our new Head of Sales in November. Tracy is currently reviewing the C&E sales and marketing activity and product offer in order to position the business for future growth. We will continue to review the business during the course of the property development and anticipate that as the redeveloped racecourse facilities come on stream, the Conference and Events business performance will continue to improve. The Rocking Horse Nursery The Rocking Horse Nursery experienced another difficult trading year, with reduced headcount, attributable to increased competition in the local market and ageing facilities. Turnover decreased by 7% (£0.05m) from the prior year and operating profits were down 13%. We have undertaken a number of marketing initiatives in recent months and are starting to see occupancy levels improving steadily. Looking forward, construction of the new Nursery facility on
the site is progressing well and this is due to be completed in late summer 2015. We are confident that the move to a new state of the art facility will help us grow this business in the coming years and the recent enquiry levels suggest demand will be strong once this is complete. Property Redevelopment We continue to be very pleased with the response to the DWH residential development with more than 170 homes now occupied. The Group’s cash flows were enhanced by an additional £3.29m of payments received from DWH during the year to December 2014. A number of the racecourse’s own development works are now completed (including the refurbished stables, head lads accommodation and horsebox parking), with others well underway (including the new nursery, the new hostel and the new estates yard, together with improved public car parking facilities). Construction work is also progressing well on the new access bridge from the North, which will significantly improve access to the racecourse for all our customers. All of these facilities are due for completion in 2015. In the short term our customers are continuing to experience some inconvenience on our busier days and we are hugely grateful for their continued support and patience during this time. FUTURE DEVELOPMENTS In order to ensure that the group achieves its long term strategy of developing the Racecourse as a profitable racecourse, entertainment and events business with racing at its core, the Board is continuing to review a number of options for the refurbishment of the racing and events facilities. It is anticipated that a revised proposal for facility upgrades will be submitted for planning permission during 2015 with work likely to commence during 2016. These works will be timed to follow on from the DWH residential development completing in the Western portion of the site, to minimise disruption to all of our customer groups. Once the board has approved the plan for these facilities, shareholders will be updated. The redevelopment continues to provide operational challenges that the Racecourse team is managing proactively with our partners DWH. However despite these disruptions we are confident that the delivery of the enhanced racecourse will enable us to create a profitable business which rewards shareholders in the long term.

Newbury Racecourse PLC
5
KEY PERFORMANCE INDICATORS The group uses raceday attendance and trading operating profit/loss as the primary performance indicators. Total attendance was 196,000 (2013: 185,000). Operating profit/loss is shown within the profit and loss account on page 13. PRINCIPAL RISKS AND UNCERTAINTIES Cashflow Risk The main cash flow risks are the vulnerability of race meetings to abandonment due to adverse weather conditions and fluctuating attendances particularly for the Party in the Paddock events, together with the impact of reduced conference and event sales in the current economic climate and delayed property receipts from David Wilson Homes. The practice of covering the racetrack to protect it from frost and investment in improved drainage, as well as insuring key racedays, mitigates the raceday risk. Regular review of variable conferencing costs reduces the impact of a decline in conference sales. The timing and amount of receipts from David Wilson Homes is dependent upon the rate of sales of residential plots. The risk of delayed receipts is mitigated to some extent by the long stop dates in the sale agreement, in respect of the minimum guaranteed land value. Short term cash flow risk is mitigated by regular review of the expected timing of receipts and by ensuring that the group has committed facilities in place in order to manage its working capital and investment requirements. Credit Risk The group’s principal financial assets are trade and other receivables. The group’s credit risk is primarily attributable to its trade receivables. The amounts in the balance sheet are net of allowances for doubtful receivables. Payment is required in advance for ticket, hospitality, sponsorship, and conference and event sales, reducing the risk of bad debt. The David Wilson Homes debtor is backed by a parent company guarantee from Barratt Homes Plc. Liquidity Risk In order to maintain liquidity to ensure that sufficient funds are available for both ongoing operations and the property redevelopment, the group uses a mixture of long-term and short-term debt finance which is secured on the property assets of the group. The Board regularly review the facilities available to the group to ensure that there is sufficient working capital available. Price Risk The group operates within the leisure sector and regularly benchmarks its prices to ensure that it remains competitive. Cost Risk The group has had a historically stable cost base. The key risks are unforeseen maintenance liabilities, movement in utility costs and additional regulatory costs for the racing business. A programme of regular maintenance is in place to manage the risk of failure in the infrastructure, while utility contracts are professionally managed.
The group is a member of the Racecourse Association, a trade association which actively seeks to manage increases in regulatory risk. Interest Rate Risk The group manages its exposure to interest rates through an appropriate mixture of interest rate caps and swaps, where necessary. Going Concern The Board has undertaken a full and thorough review of the group’s forecasts and associated risks and sensitivities, over the next three years. The extent of this review reflects the current uncertain economic climate as well as specific financial circumstances of the group. The Board identified that the group’s cash flow forecasts are sensitive to fluctuating revenue streams from ticket sales, corporate hospitality, conference and event income and the timing of receipts and payments in respect of the property redevelopment. A system of regular reviews of forecast business and expected property receipts has been implemented to ensure all variable costs are flexed to match anticipated revenues. In addition a number of race meetings have been insured for adverse weather conditions, reducing the levels of risk carried by the group. The Board has reviewed the cash flow and working capital requirements in detail. The Group currently has committed credit facilities in place through to December 2015. Following this review the Board has concluded that it has a reasonable expectation that the group has adequate resources in place to continue in operational existence for the foreseeable future and on that basis the going concern basis has been adopted in preparing the financial statements. CORPORATE AND SOCIAL RESPONSIBILITY Employee Consultation The group places considerable value on the involvement of its employees and has continued to keep them informed on matters affecting them as employees and on the various factors affecting the performance of the group and the company. This is achieved through formal and informal meetings, and distribution of the annual financial statements. Employee representatives are consulted regularly on a wide range of matters affecting their current and future interests. Policy on Payments to Suppliers Although no specific code is followed, it is the group’s and company’s policy, unless otherwise agreed with suppliers, to pay suppliers within 30 days of the receipt of an invoice, subject to satisfactory performance by the supplier. The amount owed to trade creditors at 31 December 2014 is 6.2% (2013: 9.2%) of the amounts invoiced by suppliers during the year. This percentage, expressed as a proportion of the number of days in the year, is 23 days (2013: 34 days).

Newbury Racecourse PLC
6
Disabled Employees Applications for employment by disabled persons are always fully considered, bearing in mind the abilities of the applicant concerned. In the event of members of staff becoming disabled every effort is made to ensure that their employment with the group continues and the appropriate training is arranged. It is the policy of the group and the company that the training, career development and promotion of disabled persons should, as far as possible, be identical to that of other employees. Charitable Donations During the year the group made charitable contributions totalling £3,972 to national charities (2013: £1,955). By order of the Board
JULIAN THICK Chief Executive 22 April 2015

7
Sponsors in the year for 31 December 2014
We would like to thank our leading sponsors for their significant support in 2014 Al Basti Equiworld Bet365 Betfred Betfair British European Breeders Fund Dubai Duty Free JLT Moët Hennessy UK Thoroughbred Breeders Association Weatherbys Worthington's We also received much appreciated support from the following sponsors Academy Insurance Agetur UK AJC Premier Aon Limited Ballymacoll Stud Bathwick Tyres Berry Bros & Rudd Bewiser Insurance BJP Insurance Brokers Blackmore Building Contractors Ltd Bloomsbury Auctions Buffalo Pictures Ltd Burges Salmon LLP Carter Jonas Chris Beek Racing Christal Construction Management Ltd Christopher Smith Associates LLP Compton Beauchamp Estates Ltd Coln Valley Stud Coolmation Ltd Crossland Employment Solicitors CSP Denford Stud Doom Bar Doncaster Bloodstock Sales Emma Lavelle Racing Ltd Fuller Smith & Turner PLC Greatwood Grundon Haynes Hanson & Clark HBLB Heatherwold Stud Highclere Thoroughbred Racing Hildon Hot to Trot Racing Club Inkerman
KKA Kentford Racing Luck Greayor Bloodstock Oakley Coachbuilders Pertemps Group Powersolve Electronics Premier Food Courts Pump Technology Ltd Punter Southall Q Associates Ltd Racing UK Rayner Bosch Car Services Relyon Cleaning Services R & M Electrical Smith & Williamson Starlight Swegon Group Swettenham Stud The Hawk Inn The Kids Company The Pheasant Inn TKP Surfacing Ultima Business Solutions Vodafone Group PLC Wedgewood Estates West Berkshire Mencap West Berkshire Racing Club Whitley Stud There were also 5 races sponsored for birthdays, retirement or in memoriam.

8
Report of the Directors The Directors have pleasure in submitting their annual report and the audited financial statements for the year ended 31 December 2014. RESULTS AND DIVIDEND The profit on ordinary activities after taxation was £2,014,000 (2013: £1,106,000). Further details of the major influences on this year’s result are given in the Strategic Review. The Directors have recommended that no final dividend be paid (2013: none). MARKET VALUE OF LAND The completion of the development agreement with David Wilson Homes (DWH) in September 2012 enhances the potential value of the land owned by the group. Under the contract the racecourse can exercise a put option requiring DWH to purchase the land at the Eastern Residential Site for a minimum land value of £26.1m which would be received over the life of the contract. Payments in respect of this transaction would arise on completion. The balance of the racecourse operational site was valued by a third party on 29 October 2012 at £14.5m. As at 31 December the total market value of land held was £40.6m, the net book value of the land held in the balance sheet is £1.5m. DIRECTORS The Directors who served during the year and held office at the year end and their interests, including family interests, in the ordinary shares of the Company at the beginning and end of the financial year under review were as follows:- Beneficial interest Beneficial interest 2014 2013 D J Burke 23,000 23,000 J Dodds - - The Hon H M Herbert 12,924 12,924 Lady Lloyd-Webber 319,656 319,656 N W E Penser 1,370,400 1,370,400 C J Spence 2,250 2,250 C E Spencer (appointed 26 February 2014) - - B T Stewart-Brown 13,332 13,332 J Thick - - R L Todd - - No Directors held any other non-beneficial interest in the shares of the group at any time during the year. No Directors held shares in any other group company. The Directors are shown on page 1. DIRECTORS’ COMMITTEES Directors serve on the following Committees: Audit R L Todd (Chair) D J Burke J Dodds C J Spence Remuneration C J Spence (Chair) D J Burke B T Stewart-Brown Nomination B T Stewart-Brown (Chair) D J Burke N W E Penser R L Todd

9
Report of the Directors (continued)
Directors’ particulars are set out below:- Dominic J Burke Dominic Burke is Group Chief Executive of Jardine Lloyd Thompson Group PLC (JLT), one of the world’s leading providers of insurance, reinsurance and employee benefits related advice, brokerage and associated services. JLT employs more than 9,100 staff across 39 countries and is the largest quoted Company of its type in the UK. Dominic owns Whitley Stud, Gloucestershire and is a keen owner and breeder with horses in training on the flat and over jumps. John Dodds John Dodds was Chief Executive of Kier Group PLC, the international construction Group, until March 2010, when he retired after nearly 40 years with the company. John’s extensive experience in the construction and house building industry sector will be an important asset as Newbury Racecourse continues its major property development. He is also Non Executive Chairman of Severfield PLC, Non Executive Chairman of Sweet Group PLC and Non Executive Chairman of Lagan Construction Holdings Ltd. The Hon H M Herbert Harry Herbert is the Chairman and Managing Director of Highclere Thoroughbred Racing Limited, a racehorse syndication company with over 50 horses in training. The company has enjoyed many successes and has been responsible for the Vodafone Derby winner, Motivator, as well as six other European champions; Lake Coniston, Tamarisk, Delilah, Petrushka, Memory and Harbinger. He is also Racing Advisor to Sheikh Joaan bin Hamad Al Thani and to Al Shaqab Racing, and is a member of the Jockey Club. Lady Lloyd-Webber Madeleine Lloyd-Webber is a former international three day eventer and owns Watership Down Stud near Newbury and Kiltinan Castle Stud in Tipperary. She has horses in training both on the flat and National Hunt. She is a member of the Jockey Club. She is also a Director and Vice Chairman of Really Useful Group and Really Useful Theatres. Erik Penser Erik Penser is the owner of a bank in Stockholm. He has owned racehorses in Sweden since 1964 and in England since 1972. He has also been a breeder since 1985. He is a member of the Jockey Club and lives and farms at Compton Beauchamp, near Lambourn.
Christopher Spence Christopher Spence returned to the Board in 2003 having been Senior Steward of The Jockey Club for five years prior to which he was Chairman of Jockey Club Racecourses. He lives at Chieveley and has been an owner-breeder since 1968. Claire Spencer Claire Spencer was appointed Finance Director in February 2014, having previously been Group Financial Controller at the Company. She joined the Company in 2010. She is a Chartered Accountant and a member of the Institute of Chartered Accountants in England and Wales. She previously worked for the bloodstock departments of PricewaterhouseCoopers and James Cowper LLP. Brian Stewart-Brown Brian Stewart-Brown specialised in the aviation reinsurance business at Lloyds during his career. He has had many successes as an owner, including Riverside Theatre, Ryanair Chase winner 2012, Arctic Call who won the 1990 Hennessy Cognac Gold Cup and Large Action who won the Tote Gold Trophy at Newbury. He lives at Speen, near Newbury. Laurie Todd Laurie Todd has held senior finance positions in listed companies for 25 years, most recently as Chief Financial Officer of Guinness Peat Group plc. Prior to joining GPG he was Finance Director, then Chief Executive, of Staveley Industries plc. Previous experience includes companies in the retail, publishing and distribution sectors. He is a Fellow of the Institute of Chartered Accountants in England and Wales. Julian Thick Over the last 20 years Julian Thick has held a number of senior roles in the racing industry having been Managing Director of Aintree, Sandown and Kempton Park racecourses as well as a board member of Jockey Club Racecourses.

10
Report of the Directors (continued)
Shareholdings As at 31 December 2014 the group was aware of the following interests amounting to 3% or more in the shares of Newbury Racecourse PLC Number of shares Percentage holding
Compton Beauchamp Estates Ltd* 1,068,073 31.90% Lady Lloyd-Webber 319,656 9.50% N W E Penser 302,327 9.03% * N W E Penser is a director and a shareholder of Compton Beauchamp Estates Ltd Auditor Each of the persons who is a Director at the date of approval of this report confirms that:-
• As far as the Director is aware, there is no relevant audit information of which the company’s auditor is unaware of; and
• The Director has taken all the steps that he/she ought to have taken as a Director in order to make himself/herself aware of any relevant audit information and to establish that the group’s auditor is aware of that information.
This confirmation is given and should be interpreted in accordance with the provisions of S418 of the Companies Act 2006.
In line with S487 of the Companies Act 2006, Deloitte LLP has indicated its willingness to remain in office as the group’s auditor and a resolution to reappoint them will be proposed at the forthcoming Annual General Meeting. By order of the Board C SPENCER Secretary Newbury 22 April 2015

11
Director’s Responsibilities Statement The Directors are responsible for preparing the Annual Report and the financial statements in accordance with applicable law and regulations. Company law requires the Directors to prepare financial statements for each financial year. Under that law the Directors have elected to prepare the financial statements in accordance with United Kingdom Generally Accepted Accounting Practice (United Kingdom Accounting Standards and applicable law). Under Company law the Directors must not approve the financial statements unless they are satisfied that they give a true and fair view of the state of affairs of the group and of the profit or loss of the group for that period. In preparing these financial statements, the Directors are required to:
• select suitable accounting policies and then apply them consistently;
• make judgements and accounting estimates that
are reasonable and prudent;
• state whether applicable UK Accounting Standards have been followed; and
• prepare the financial statements on the going concern basis unless it is inappropriate to presume that the group will continue in business.
The Directors are responsible for keeping adequate accounting records that are sufficient to show and explain the group’s transactions and disclose with reasonable accuracy at any time the financial position of the group and enable them to ensure that the financial statements comply with the Companies Act 2006. They are also responsible for safeguarding the assets of the group and hence for taking reasonable steps for the prevention and detection of fraud and other irregularities. The Directors are responsible for the maintenance and integrity of the corporate and financial information included on the group’s website. Legislation in the United Kingdom governing the preparation and dissemination of financial statements may differ from legislation in other jurisdictions.

12
Independent Auditor’s Report to the members of Newbury Racecourse PLC
We have audited the financial statements of Newbury Racecourse PLC for the year ended 31 December 2014, which comprise the Consolidated Profit and Loss Account, the Consolidated Statement of Total Recognised Gains and Losses, the Consolidated and Company Balance Sheets, the Consolidated Cash Flow Statement, and the related notes 1 to 23. The financial reporting framework that has been applied in their preparation is applicable law and United Kingdom Accounting Standards (United Kingdom Generally Accepted Accounting Practice). This report is made solely to the Company’s members, as a body, in accordance with Chapter 3 of Part 16 of the Companies Act 2006. Our audit work has been undertaken so that we might state to the Company’s members those matters we are required to state to them in an auditor’s report and for no other purpose. To the fullest extent permitted by law, we do not accept or assume responsibility to anyone other than the Company and the Company’s members as a body, for our audit work, for this report, or for the opinions we have formed. Respective responsibilities of Directors and auditors As explained more fully in the Directors’ Responsibilities Statement, the Directors are responsible for the preparation of the financial statements and for being satisfied that they give a true and fair view. Our responsibility is to audit and express an opinion on the financial statements in accordance with applicable law and International Standards on Auditing (UK and Ireland). Those standards require us to comply with the Auditing Practices Board’s Ethical Standards for Auditors. Scope of the audit of the financial statements An audit involves obtaining evidence about the amounts and disclosures in the financial statements sufficient to give reasonable assurance that the financial statements are free from material misstatement, whether caused by fraud or error. This includes an assessment of: whether the accounting policies are appropriate to the group’s and the parent Company’s circumstances and have been consistently applied and adequately disclosed; the reasonableness of significant accounting estimates made by the Directors; and the overall presentation of the financial statements. In addition, we read all the financial and non-financial information in the annual report to identify material inconsistencies with the audited financial statements and to identify any information that is apparently materially incorrect based on, or materially inconsistent with, the knowledge acquired by us in the course of performing the audit. If we become aware of any apparent material inconsistencies we consider the implications for our report.
Opinion on financial statements In our opinion the financial statements:
• give a true and fair view of the state of the group’s and the parent company’s affairs as at 31 December 2014 and of the group’s profit for the year then ended;
• have been properly prepared in accordance
with United Kingdom Generally Accepted Accounting Practice, and
• have been prepared in accordance with the requirements of the Companies Act 2006.
Opinion on other matter prescribed by the Companies Act 2006 In our opinion the information given in the Strategic Report and Directors’ Report for the financial year for which the financial statements are prepared is consistent with the financial statements. Matters on which we are required to report by exception We have nothing to report in respect of the following matters where the Companies Act 2006 requires us to report to you if, in our opinion:
• adequate accounting records have not been kept or returns adequate for our audit have not been received from branches not visited by us; or
• the financial statements are not in agreement
with the accounting records and returns; or
• certain disclosures of Directors’ remuneration specified by law are not made; or
• we have not received all the information and explanations we require for our audit
Andrew Bond FCA (Senior Statutory Auditor) For and on behalf of Deloitte LLP Chartered Accountants and Statutory Auditor Reading, United Kingdom 22 April 2015

13
Consolidated Profit and Loss Account Year ended 31 December 2014 N
ote
2014 Trading
£’000
2014 Property
£’000
2014 Total £’000
2013 Trading
£’000
2013 Property
£’000
2013 Total
£’000 Turnover 1 12,383 31 12,414 11,585 30 11,615 Cost of sales (10,016) - (10,016) (9,506) - (9,506) Gross profit 1 2,367 31 2,398 2,079 30 2,109 Administrative expenses (2,068) (882) (2,950) (2,453) (127) (2,580) Operating profit/(loss) 3 299 (851) (552) (374) (97) (471)
Operating profit/(loss) before 1 299 (75) 224 149 (52) 97 exceptional operating items Asset impairment 2 - (776) (776) (6) (45) (51) Restructuring and redundancy costs 2 - - - (517) - (517) 299 (851) (552) (374) (97) (471)
Profit/(loss) on ordinary activities before interest and non- operating exceptional items 299 (851) (552) (374) (97) (471) Exceptional Items Profit on disposal of fixed assets 2 2 1,900 1,902 - 1,820 1,820 Profit/(loss) on ordinary activities before interest 301 1,049 1,350 (374) 1,723 1,349 Interest receivable and similar income 5 4 449 453 - 549 549 Interest payable and similar charges 6 (256) (38) (294) (292) (60) (352) Profit/(loss) on ordinary activities before taxation 49 1,460 1,509 (666) 2,212 1,546 Tax credit/(charge) 7 48 457 505 10 (450) (440) Profit/(loss) on ordinary activities after taxation being profit for the financial year 97 1,917 2,014 (656) 1,762 1,106 Profit per share (basic and diluted) (Note 9) 60p 33p All amounts derive from continuing operations
Consolidated Statement of Total Recognised Gains and Losses Year ended 31 December 2014
2014 £’000
2013 £’000
Profit for the financial year 2,014 1,106 Actuarial (loss)/gain relating to pension scheme (410) 28 Deferred tax on actuarial loss/(gain) 31 (7) Total recognised profit in the year 1,635 1,127

14
Consolidated Balance Sheet Year ended 31 December 2014
Note 2014
£’000 2013 £’000
Fixed assets Tangible assets 10 17,894 17,052 Investment 11 117 117 18,011 17,169 Current assets Stocks 12 187 179 Debtors - due within one year 13 16,887 13,593 - due in more than one year 13 2,277 9,727 Cash at bank and in hand 2,402 878 Cash Investment 2,030 121 23,783 24,498 Creditors: amounts falling due within one year 14 (12,562) (11,126) Net current assets 11,221 13,372 Total assets less current liabilities 29,232 30,541 Creditors: amounts falling due after more than one year 15 (7,000) (10,174) Provisions for liabilities 17 (293) (341) Net assets before pension deficit 21,939 20,026 Pension deficit (704) (316) Net assets after pension deficit 21,235 19,710 Accruals and deferred income Deferred capital grants 18 4,023 4,133 Capital and reserves Called up share capital 19 335 335 Share premium account 20 10,202 10,202 Revaluation reserve 20 75 75 Capital redemption reserve 20 143 143 Profit and loss account surplus 20 6,457 4,822 Shareholders’ funds 17,212 15,577 21,235 19,710 The financial statements of Newbury Racecourse PLC, Company registration 00080774, were approved by the Board of Directors on 22 April 2015 and signed on its behalf by: D J BURKE (Chairman) J THICK (Chief Executive)

15
Company Balance Sheet Year ended 31 December 2014
Note 2014
£’000 2013 £’000
Fixed assets Tangible assets 10 16,776 15,935 Investment 11 7,820 7,820 24,596 23,755 Current assets Stocks 12 187 179 Debtors - due within one year 13 17,992 14,587 - due in more than one year 13 2,277 9,727 Cash at bank and in hand 2,252 833 Cash Investment 2,030 121 24,738 25,447 Creditors: amounts falling due within one year 14 (12,562) (11,126) Net current assets 12,176 14,321 Total assets less current liabilities 36,772 38,076 Creditors: amounts falling due after more than one year 15 (14,500) (17,674) Provisions for liabilities 17 (293) (341) Net assets before pension deficit 21,979 20,061 Pension deficit (704) (316) Net assets after pension deficit 21,275 19,745 Accruals and deferred income Deferred capital grants 18 4,023 4,133 Capital and reserves Called up share capital 19 335 335 Share premium account 20 10,202 10,202 Revaluation reserve 20 75 75 Capital redemption reserve 20 143 143 Other reserve 20 198 198 Profit and loss account surplus 20 6,299 4,659 Shareholders’ funds 17,252 15,612 21,275 19,745 The financial statements of Newbury Racecourse PLC, Company registration 00080774, were approved by the Board of Directors on 22 April 2015 and signed on its behalf by: D J BURKE (Chairman) J THICK (Chief Executive)

16
Consolidated Cash Flow Statement Year ended 31 December 2014
Note 2014
£’000 2014
£’000 2013
£’000 2013
£’000 Net cash inflow/(outflow) from operating activities 1 1,417 (115) Returns on investments and servicing of finance Interest received and other investment income - - Interest paid (78) (128) Net cash outflow from returns on investments and servicing of finance
(78)
(128)
Taxation UK corporation tax paid - (1,550) Total tax paid - (1,550)
Capital expenditure
Payments to acquire tangible fixed assets (600) (640) Receipts from exceptional sale of fixed assets 3,293 983 Sale of fixed assets expenses - (180) Net cash inflow from capital expenditure 2,693 163 Net cash inflow/(outflow) before financing 4,032 (1,630) Financing Loan finance received - 75 Loan repayment (599) - Net cash inflow/(outflow) from financing (599) 75 Increase/(Decrease) in cash in the year 3,433 (1,555)

17
Notes to the Consolidated Cash Flow Statement Year ended 31 December 2014
1. Reconciliation of operating loss to net cash inflow from operating activities 2014
£’000 2013 £’000
Operating profit/(loss) 224 (471) Depreciation charges 1,008 965 Amortisation of capital grants Disposal of fixed asset
(110)
(4) (144)
- Impairment of fixed asset - 51 (Increase)/decrease in stock (8) 37 (Increase)/decrease in debtors and prepayments (81) (197) Increase/(decrease) in creditors and accruals 388 (356) Net cash outflow from operating activities 1,417 (115)
2. Reconciliation of net cash flow to movement in net debt
2014 £’000
2013 £’000
Increase/(decrease) in cash in the year 3,433 (1,555) Cash outflow from debt and lease financing - 32 Loans repaid 599 - Change in net debt resulting from cash flows 4,032 (1,523) Non cash movements (217) (381) Net debt at 1 January (6,383) (4,480) Net debt at 31 December (2,568) (6,384)
3. Analysis of change in net debt
At 1 Jan
2014 £’000
Cash flow £’000
Non cash changes
£’000
At 31 Dec
2014 £’000
Cash at bank and in hand 999 3,433 - 4,432 Debt due within one year - Loan - - - - Debt due after one year - Loan (7,382) 577 (195) (7,000) - Loan arrangement fees - 22 (22) -
(6,383) 4,032 (217) (2,568)

18
Accounting Policies Year ended 31 December 2014 The financial statements have been prepared in accordance with applicable United Kingdom accounting standards. The particular accounting policies adopted in the current and preceding year are described below. Accounting convention The financial statements are prepared under the historical cost convention, as modified by the revaluation of freehold land. Going concern The Board has undertaken a full and thorough review of the group’s forecasts and associated risks and sensitivities. The extent of this review reflects the current uncertain economic climate as well as specific financial circumstances of the group. The Board identified that the group’s cash flow forecasts are sensitive to fluctuating revenue streams from ticket sales, corporate hospitality, conference and event income and the timing of receipts and payments in respect of the property redevelopment. A system of regular reviews of forecast business and expected property receipts has been implemented to ensure all variable costs are flexed to match anticipated revenues. In addition a number of race meetings have been insured for adverse weather conditions, reducing the levels of risk carried by the group. The Board has reviewed the cash flow and working capital requirements in detail. At the balance sheet date the company has adequate cash reserves, together with revolving credit facilities which are currently in place through to December 2015. Following this review the Board has concluded that it has a reasonable expectation that the group has adequate resources in place to continue in operational existence for the foreseeable future and on that basis the going concern basis has been adopted in preparing the financial statements. Basis of consolidation The consolidated financial statements incorporate the financial statements of the company and its subsidiaries Newbury Racecourse Enterprises Limited and Newbury Racecourse Management Limited. Revenue recognition Raceday income including licence fee income and sponsorship, is recognised on the relevant raceday and membership income is recognised over the period of the membership. Other income streams are also recognised over the period for which they relate, for example, conference income is recognised on the day of the conference and nursery income is recognised as the child attends the nursery. Property receipts are recognised in accordance the substance of the transaction being that of a disposal of land. The minimum guaranteed sum, as set out in the agreement with David Wilson Homes, is recognised at the point of sale, sums receivable in excess of the minimum guarantee are only recognised once actually received.
Estimation techniques Significant estimation techniques include; the estimation of the useful economic life of fixed assets which is determined with reference to, expected usage, experience of rate of physical deterioration or technological obsolescence and maintenance programmes, or any relevant fixed legal terms. Also the determination of the discount rate applied to the long term debtor balance in respect of the minimum guaranteed land value from David Wilson Homes, which is determined with reference to current market conditions and to reflect the risks specific to the balance due. Repairs and renewals Expenditure on repairs and renewals and costs of temporary facilities during construction works are written off against profits in the year in which they are incurred. Investments Investments are stated at cost less provision for any impairment. Dividends Where dividends are declared, appropriately authorised (and hence no longer at the discretion of the group) after the balance sheet date but before the relevant financial statements are authorised for issue, dividends are not recognised as a liability at the balance sheet date because they do not meet the criteria of a present obligation in FRS 12. Tangible fixed assets Tangible fixed assets are stated at cost or valuation, net depreciation and any provision for impairment. Depreciation is not provided on freehold land. On other assets it is provided on cost or re-valued amounts over the estimated lives of the assets as below:- Freehold land and buildings and outdoor fixtures
• 2% - 5% straight line Fixtures and fittings and equipment
• 5% - 25% straight line Tractors and motor vehicles
• 5% - 20% straight line Leases Assets held under finance leases and the related lease obligations are recorded in the balance sheet at the cost of the leased assets at the inception of the leases. The amounts by which the lease payments exceed the recorded lease obligations are treated as finance charges which are amortised over each lease term to give a constant rate of charge on the remaining balance of the obligation. Operating lease cost is recognised in the profit and loss account in equal amounts over the lease term. Investment income Dividends and other investment income receivable are included in the profit and loss account inclusive of the attributable tax credit. Stocks Stocks are valued at the lower of cost and net realisable value. Provision is made for obsolete, slow moving or defective items where appropriate.

19
Accounting Policies (continued) Year ended 31 December 2014 Cash investments Cash which is held on deposits that are not accessible with less than 24 hours’ notice, is deemed to not be liquid and is therefore classified as cash investments on the balance sheet. Non GAAP financial information The consolidated profit and loss account includes measures which are not accounting measures under UK GAAP which are used to access the financial performance of the business. These non-GAAP measures are not considered a substitute for, or superior to, the equivalent measures calculated and presented in accordance with UK GAAP. These measures, which are termed ‘non GAAP’ include the separation of property, in relation to the redevelopment of the racecourse, from underlying trading activity. Property turnover includes rental income from residential properties and freehold land, together with any incremental capital receipts, in excess of the minimum guaranteed land value, arising from the sale of residential units, in accordance with the agreement with David Wilson Homes Ltd. Property expenses include those costs which are attributable to the property activities of the group, including rental properties, and in connection with the redevelopment of the racecourse and the on-going relationship with David Wilson Homes. Company only result for the year As permitted by Section 408(3) of the Companies Act 2006, the profit and loss account of Newbury Racecourse Plc is not presented as part of the consolidated accounts. Tax Current tax is provided at amounts expected to be paid (or recovered) using the tax rates and laws that have been enacted or substantially enacted at the balance sheet date. Deferred tax is provided in full on timing differences that result in a obligation at the balance sheet date to pay more tax, or a right to pay less tax, at a future date, at rates expected to apply when they crystallise based on current tax rates and law. Timing differences arise from the inclusion of items of income and expenditure in taxation computations in periods different from those in which they are included in the financial statements. Deferred tax is not provided on timing differences arising from the revaluation of fixed assets where there is no commitment to sell the asset, or on unremitted earnings of subsidiaries and associated where there is no commitment to remit these earnings. Deferred tax assets are recognised to the extent that it is regarded as more likely than not that they will be recovered. Deferred tax assets and liabilities are not discounted. Capital grants Capital grants receivable from the Horserace Betting Levy Board (‘HBLB’) and other bodies in respect of the purchase of fixed assets are credited to a deferred capital grants reserve and are amortised to the profit and loss account over the expected useful life of the relevant asset, i.e. equal annual instalments of 2%-5% straightline
for freehold buildings and 10%-25% straight line for other assets including outdoor fixtures. Pensions For defined benefit schemes the amounts charged to operating profit are the current service costs and gains and losses on settlements and curtailments. They are included as part of staff costs. Past service costs are recognised immediately in the profit and loss account if the benefits have vested. If the benefits have not vested immediately, the costs are recognised over the period until vesting occurs. The interest cost and the expected return on assets are shown as a net amount of other finance costs or credits adjacent to interest. Actuarial gains and losses are recognised immediately in the statement of total recognised gains and losses. Defined benefit schemes are funded, with the assets of the scheme held separately from those of the group, in separate trustee administered funds. Pension scheme assets are measured at fair value and liabilities are measured on an actuarial basis using the projected unit method and discounted at a rate equivalent to the current rate of return on a high quality corporate bond of equivalent currency and term to the scheme liabilities. The actuarial valuations are obtained at least triennially and are updated at each balance sheet date. The resulting defined benefit asset or liability, net of the related deferred tax, is presented separately after other net assets on the face of the balance sheet. For defined contributions schemes the amount charged to the profit and loss account in respect of pension costs and other post-retirement benefits is the contributions payable in the year. Differences between contributions payable in the year and contributions actually paid are shown as either accruals or prepayments in the balance sheet. Finance costs Finance costs of financial liabilities are recognised in the profit and loss account over the term of such instruments at a constant rate on the carrying amount. Financial liabilities and equity Financial liabilities and equity instruments are classified according to the substance of the contractual arrangements entered into. An equity instrument is any contract that evidences a residual interest in the assets of the group after deducting its liabilities. Bank borrowings and other loans Interest bearing bank loans and overdrafts are recorded at the proceeds received, net of direct issue costs. Finance charges, including premiums payable on settlement or redemption and direct issue costs are accounted for an accrual basis in the profit and loss account using the effective interest method and are added to the carrying amount of the instrument to the extent that they are not settled in the period which they arise. Derivative financial instruments The group uses derivative financial instruments to reduce exposure to interest rate movements. The group does not hold or issue derivative financial instruments for speculative purposes.

20
Notes to the Financial Statements Year ended 31 December 2014
1. TURNOVER Trading turnover, which arises solely in the United Kingdom, represents admissions to the racecourse, catering, hospitality sales, sponsorship, media rights licence fees, annual membership fees and all income from the provision of services for race meetings, net of value added tax where applicable. It also includes income from conference and events (shown in racecourse trading) and fees for the Rocking Horse Nursery net of value added tax where applicable. HBLB revenue grants are not included in turnover, instead they are included as a contribution against prize money in cost of sales. Property turnover represents rental income. Segmental Analysis
2014 Turnover
£’000
Gross Profit £’000
Operating Profit/ (loss)
Before Exceptional
Items £’000
Exceptional Operating
Items £’000
Exceptional Items £’000
Profit/ (loss)
Before Tax
£’000
*Net assets
£’000
Racecourse trading 11,693 2,257 189 - - (61) 13,947 Nursery 690 110 110 - - 110 (9) Total trading 12,383 2,367 299 - - 49 13,938 Property 31 31 (75) (776) 1,902 1,460 7,297 Total 12,414 2,398 224 (776) 1,902 1,509 21,235
2013
Turnover £’000
Gross Profit £’000
Operating Profit/ (loss)
Before Exceptional
Items £’000
Exceptional Operating
Items £’000
Exceptional Items £’000
Profit/ (loss)
Before Tax
£’000
*Net assets £’000
Racecourse trading 10,782 1,971 41 (523) - (774) 10,685 Nursery (restated) 746 127 127 - - 127 (14) Golf 57 (19) (19) - - (19) - Total trading 11,585 2,079 149 (523) - (666) 10,671 Property 30 30 (52) (45) 1,820 2,212 9,039 Total 11,615 2109 97 (568) 1,820 1,546 19,710 *Net asset represents fixed assets less deferred income and term loans for property and nursery; all working capital is included within the ‘Racecourse Trading’ segment.
21
Notes to the Financial Statements Year ended 31 December 2014
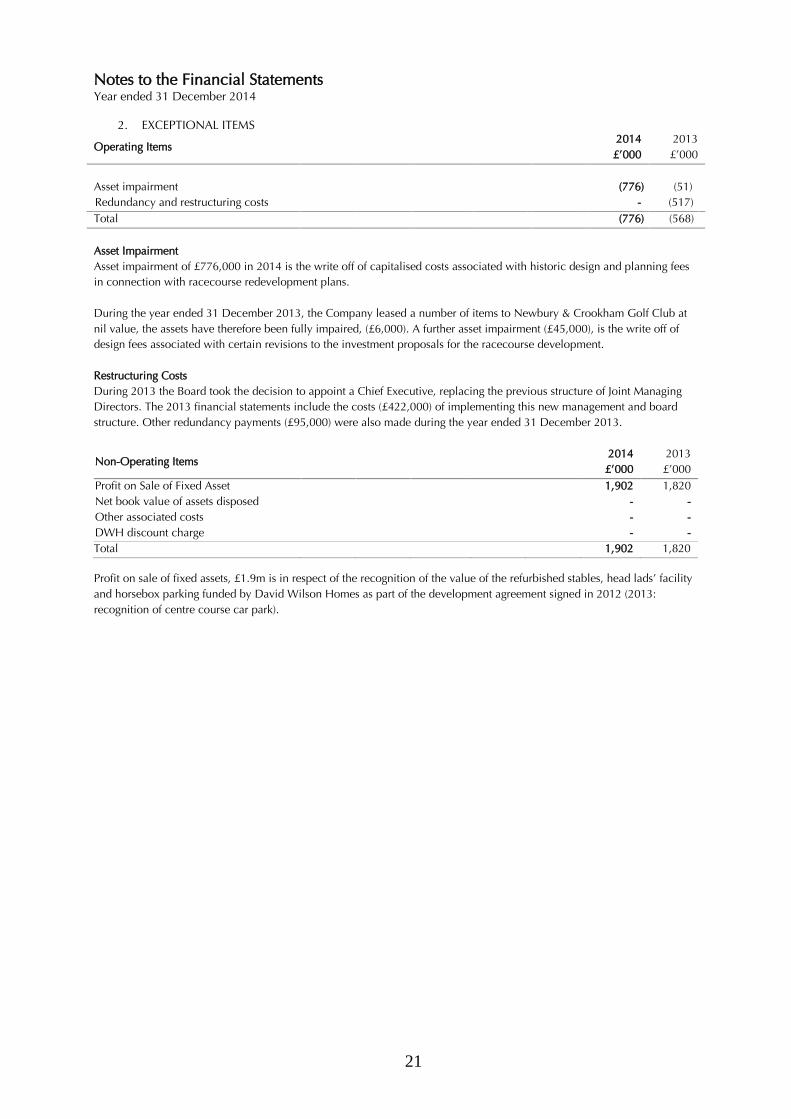
2. EXCEPTIONAL ITEMS
Operating Items
2014 £’000
2013 £’000
Asset impairment (776) (51) Redundancy and restructuring costs - (517) Total (776) (568) Asset Impairment Asset impairment of £776,000 in 2014 is the write off of capitalised costs associated with historic design and planning fees in connection with racecourse redevelopment plans. During the year ended 31 December 2013, the Company leased a number of items to Newbury & Crookham Golf Club at nil value, the assets have therefore been fully impaired, (£6,000). A further asset impairment (£45,000), is the write off of design fees associated with certain revisions to the investment proposals for the racecourse development. Restructuring Costs During 2013 the Board took the decision to appoint a Chief Executive, replacing the previous structure of Joint Managing Directors. The 2013 financial statements include the costs (£422,000) of implementing this new management and board structure. Other redundancy payments (£95,000) were also made during the year ended 31 December 2013.
Non-Operating Items
2014 £’000
2013 £’000
Profit on Sale of Fixed Asset 1,902 1,820 Net book value of assets disposed - - Other associated costs - - DWH discount charge - - Total 1,902 1,820
Profit on sale of fixed assets, £1.9m is in respect of the recognition of the value of the refurbished stables, head lads’ facility and horsebox parking funded by David Wilson Homes as part of the development agreement signed in 2012 (2013: recognition of centre course car park).

22
Notes to the Financial Statements Year ended 31 December 2014
3. OPERATING LOSS
This is stated after charging:
2014 £’000
2013 £’000
Depreciation (note 10) 1,008 965 Impairment 776 51 Auditor’s remuneration Fees payable to the Company’s auditors for the audit of the Company’s annual accounts 32 32 The audit of the Company’s subsidiaries pursuant to legislation 1 1 Total audit fees 33 33 Tax services* 16 23 Other services - 1 Interim review 1 1 Total non audit fees 17 25 Total fees 50 58 And after crediting: HBLB contributions to prize money (1,801) (1,783) Revenue grants waived - - Amortisation of deferred capital grants (110) (144) *Tax services include fees for tax compliance and tax advice.
4. STAFF COSTS
GROUP & COMPANY 2014
£’000 2013 £’000
Employee costs during the year (including Directors): Wages and salaries 2,169 2,176 Social security costs 195 209 Other pension costs 55 78 2,419 2,463 Redundancy payments of £nil were made during the year ended 31 December 2014 ( 2013: £421,000) Number Number Office and management 26 27 Catering 10 10 Ground, maintenance and security staff 13 13 Golf course - 2 Rocking Horse Nursery 20 21 69 73 Directors’ remuneration: emoluments £’000 £’000 Executive Directors 357 590 Non Executive Directors 50 45 407 635
£’000 £’000 Highest paid Director 254 306
Two Directors are members of money purchase pension schemes. Contributions paid by the Company in respect of such Directors were as follows:- £’000 £’000 Directors 23 46

23
Notes to the Financial Statements Year ended 31 December 2014
5. INTEREST RECEIVABLE & SIMILAR INCOME
2014 £’000
2013 £’000
Bank interest 4 - Unwinding of discount * 449 549 453 549 * Unwinding of the discount charge in respect of the net present value of future cashflows arising from the David
Wilson Homes contract, relating to the period.
6. INTEREST PAYABLE & SIMILAR CHARGES
2014 £’000
2013 £’000
Bank overdraft and AIB Loans 90 130 Compton Beauchamp Estates Ltd Loan 195 195 Pension scheme liabilities 9 27 294 352
7. TAXATION
2014 £’000
2013 £’000
(Credit)/charge for the year - 407 Adjustments in respect of prior years (457) 55 Total current tax (457) 462 Deferred taxation: Origination and reversal of timing differences (65) 63 Utilisation of tax losses - (29) Effect of change in rate - (9) Adjustment in respect of prior years 19 (41) (46) (16)
Deferred tax on interest charge on pension scheme (2) (6) Tax (credit)/charge (505) 440 The actual tax charge for the current and previous year differs from the effective rate 21.50%, (2013: 23.75%) for the reasons set out in the following reconciliation.
2014
£’000 2013 £’000
Profit on ordinary activities before tax 1,509 1,546 Tax on profit on ordinary activities at the standard UK rate 324 367 Income not chargeable for tax purposes (29) (117) Expenses not deductible for tax purposes 30 148 Depreciation in excess of capital allowances 5 (8) Permanent difference in respect of exceptional property transaction (251) 34 Short term timing differences - (24) Adjustment in respect of prior years (457) 55 Utilisation of tax losses (79) 7 Total actual amount of current tax (457) 462 Deferred tax has not been provided on revaluations of fixed assets (see note 10). This tax will only become payable if the assets are sold and rollover relief is not obtained. The estimated amount of tax that would become payable in these circumstances is £16,229 (2013: £17,928). Deferred tax has not been provided on the rollover relief claimed in respect of the capital gain which arose in 2003 on the sale of the 8.56 acres of land to the south of the racecourse. The estimated amount of tax that would become payable if the qualifying assets were sold is £1,844,851 (2013: £2,149,281).

24
Notes to the Financial Statements Year ended 31 December 2014
8. PROFIT OF PARENT COMPANY As permitted by section 408 of the Companies Act 2006, the profit and loss account of the parent Company is not presented as part of these accounts. The parent Company’s profit for the financial year amounted to £1,640,000 (2013: £1,101,000)
9. PROFIT PER SHARE
Basic and diluted profit per share is calculated by dividing the profit attributable to ordinary shareholders for the year ended 31 December 2014 of £2,014,000 (2013: £1,106,000) by the weighted average number of ordinary shares during the year of 3,348,326 (2013: 3,348,326)
10. TANGIBLE FIXED ASSETS
GROUP
Freehold land and buildings
and outdoor fixtures £’000
Fixtures fittings
and equipment
£’000
Tractors and
motor vehicles
£’000 Total
£’000 Cost or valuation As at 1 January 2014 24,294 5,424 243 29,961 Additions 2,317 309 - 2,626 Disposals - (4) - (4) As 31 December 2014 26,611 5,729 243 32,583 Depreciation At 1 January 2014 8,791 3,928 189 12,908 Charge for year 516 482 10 1,008 Impairment (note 2) 776 - - 776 Disposals - (3) - (3) At 31 December 2014 10,083 4,407 199 14,689 Net book value at 31 December 2014 16,528 1,322 44 17,894 Net book value at 31 December 2013 15,503 1,495 54 17,052 The transitional rules set out in FRS 15 Tangible Assets have been applied on implementing FRS 15. Accordingly the book values at implementation have been retained. In 1959 a revaluation of part of the freehold land at £117,864 gave rise to an excess of £75,486 over its cost and this sum is included in the total value of this asset. The excess on revaluation is credited to the Revaluation Reserve. The net book value of freehold land and buildings determined by the historical cost convention is £16,452,000 (2013: £15,427,000).
The net book value of £17,894,000 includes the following amounts in respect of assets held under finance leases:
2014
£’000 2013
£’000 Fixtures, fittings and equipment - 35 Finance lease depreciation for the year amounted to £35,261 (2013: £15,860)

25
Notes to the Financial Statements Year ended 31 December 2014
10. TANGIBLE FIXED ASSETS CONTINUED
COMPANY
Freehold land and buildings
and outdoor fixtures £’000
Fixtures fittings
and equipment
£’000
Tractors and
motor vehicles
£’000 Total
£’000 Cost or valuation As at 1 January 2014 23,176 5,424 243 28,843 Additions 2,317 309 - 2,626 Disposals - (4) - (4) As 31 December 2014 25,493 5,729 243 31,465 Depreciation At 1 January 2014 8,791 3,928 189 12,908 Charge for year 516 482 10 1,008 Impairment (note 2) 776 - - 776 Disposals - (3) - (3) At 31 December 2014 10,083 4,407 199 14,689 Net book value at 31 December 2014 15,410 1,322 44 16,776 Net book value at 31 December 2013 14,385 1,496 54 15,935 The net book value of freehold land and buildings determined by the historical cost convention is £15,335,000 (2013: £14,310,000).
11. INVESTMENTS
GROUP 2014
£’000 2013
£’000 Investment in Racecourse Media Group 117 117 117 117
COMPANY
2014 £’000
2013 £’000
Investment in Racecourse Media Group 117 117 Shares in subsidiary undertakings 7,703 7,703 7,820 7,820 The Group has unlisted investments of one ‘A’ share (£100 and 5.6% of the ‘A’ shareholding) together with five hundred and eighty two ‘B’ shares that were issued in 2011 (£116,400 and 5.6% of the ‘B’ shareholding) in Racecourse Media Group Limited which owns 100% of Racing UK Limited; one share (£100 and 5.4% of the shareholding) in Racecourse Media Services Limited (RMS) which owns 50% of Amalgamated Racing Limited (TurfTV); and 12,000 £1 shares in Super 12 Racing Limited, which are fully impaired. The Directors have reviewed the valuation of the investment in Super 12 Racing Limited and they do not consider it to be recoverable. Shares in subsidiary undertakings represent investments in Newbury Racecourse Enterprises Limited, a company registered in England and Wales involved in the holding and renting of land and Newbury Racecourse Management Limited, a company registered in England and Wales involved in residential property management, but which was dormant during the year ended 31 December 2014. As at 31 December 2014, Newbury Racecourse PLC holds 100% of the ordinary share capital and voting rights of both companies.
12. STOCKS AND WORK IN PROGRESS
GROUP AND COMPANY The Group’s stock consists of food and liquor for the catering business and sundry materials held for the purpose of maintaining the racecourse and the Group’s premises.
2014
£’000 2013
£’000 Catering 171 150 Sundry 16 29 187 179 There is no material difference between the balance sheet value of stocks and their replacement cost. Provision is made for obsolete, slow moving or defective items where appropriate.
26
Notes to the Financial Statements Year ended 31 December 2014
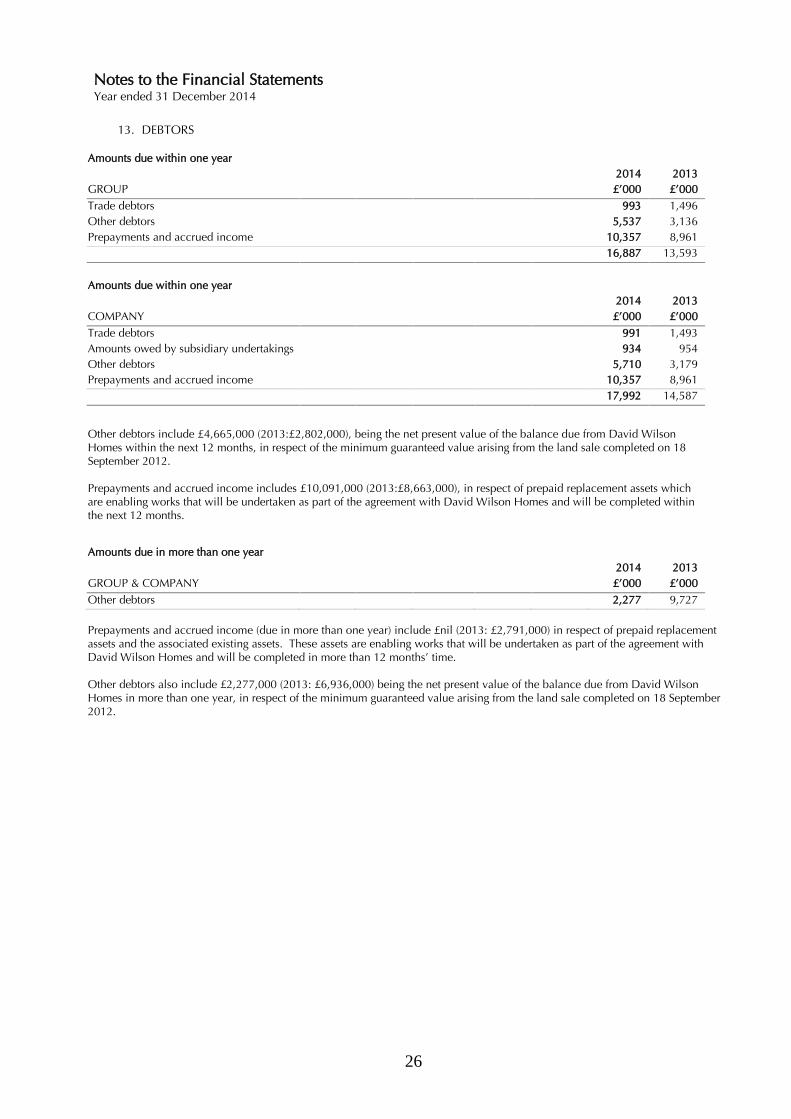
13. DEBTORS
Amounts due within one year
GROUP
2014 £’000
2013 £’000
Trade debtors 993 1,496 Other debtors 5,537 3,136 Prepayments and accrued income 10,357 8,961 16,887 13,593 Amounts due within one year
COMPANY
2014 £’000
2013 £’000
Trade debtors 991 1,493 Amounts owed by subsidiary undertakings 934 954 Other debtors 5,710 3,179 Prepayments and accrued income 10,357 8,961 17,992 14,587
Other debtors include £4,665,000 (2013:£2,802,000), being the net present value of the balance due from David Wilson Homes within the next 12 months, in respect of the minimum guaranteed value arising from the land sale completed on 18 September 2012. Prepayments and accrued income includes £10,091,000 (2013:£8,663,000), in respect of prepaid replacement assets which are enabling works that will be undertaken as part of the agreement with David Wilson Homes and will be completed within the next 12 months.
Amounts due in more than one year
GROUP & COMPANY
2014 £’000
2013 £’000
Other debtors 2,277 9,727
Prepayments and accrued income (due in more than one year) include £nil (2013: £2,791,000) in respect of prepaid replacement assets and the associated existing assets. These assets are enabling works that will be undertaken as part of the agreement with David Wilson Homes and will be completed in more than 12 months’ time. Other debtors also include £2,277,000 (2013: £6,936,000) being the net present value of the balance due from David Wilson Homes in more than one year, in respect of the minimum guaranteed value arising from the land sale completed on 18 September 2012.

27
Notes to the Financial Statements Year ended 31 December 2014
14. CREDITORS: AMOUNTS FALLING DUE WITHIN ONE YEAR
GROUP
2014 £’000
2013 £’000
Trade creditors 615 950 Deferred asset replacement 9,914 8,663 Corporation tax - 462 Other taxes and social security 428 124 Other creditors 491 - Accruals and deferred income (note 18) 1,114 927 12,562 11,126
COMPANY
2014 £’000
2013 £’000
Trade creditors 615 950 Deferred asset replacement 9,914 8,663 Corporation tax - 462 Other taxes and social security 428 124 Other creditors 491 - Accruals and deferred income (note 18) 1,114 927 12,562 11,126
Deferred asset replacement of £9,914,000 (2013: £8,663,000), is the value of the enabling works which will be undertaken as part of the agreement with David Wilson Homes, to be completed within the next 12 months.
15. CREDITORS: AMOUNTS FALLING DUE AFTER MORE THAN ONE YEAR
GROUP
2014 £’000
2013 £’000
CBEL loan (note 16) 7,000 6,805 AIB bank loan - 577 Deferred Asset replacement - 2,792 7,000 10,174 COMPANY CBEL loan (note 16) 7,000 6,805 AIB bank loan - 577 Deferred Asset replacement - 2,792 Amounts owed to subsidiary undertakings 7,500 7,500 14,500 17,674 Deferred asset replacement in 2013 of £2,792,000, was the value of the enabling works which were undertaken as part of the agreement with David Wilson Homes.
Amounts owed to subsidiary undertakings are repayable in more than 5 years are unsecured and are interest free.

28
Notes to the Financial Statements Year ended 31 December 2014
16. LOANS
GROUP & COMPANY
Analysis of loan repayments: 2014
£’000 2013
£’000 Within one year - - Between one and two years - 577 More than five years 7,000 6,805 Loan arrangement fees - - 7,000 7,382 AIB Loans Under an agreement dated 10 December 2009 and amendment dated 31 December 2013, Allied Irish Bank granted the Group the following facilities:
Purpose
Repayment Date Interest
Amount Drawn
£1,000,000 £1,800,000
Revolving credit facility 1 Revolving credit facility 2
31.12.15 31.12.15
MLBR + 3% MLBR + 3%
Nil £94
£2,500,000 Revolving credit facility 3 31.12.15 MLBR + 3% Nil The loans are secured by a charge of the Group’s property subject to a Deed of Priority dated 29 October 2012 between the Allied Irish Bank, Trustees of the Newbury Racecourse PLC Pension and Life Assurance Plan and Compton Beauchamp Estates Limited.
Compton Beauchamp Estates Limited Loan Under an agreement dated 29 October 2012 , Compton Beauchamp Estates Limited granted the Group the following facilities :
Purpose
Repayment Date Interest*
Amount Drawn
£6,500,000 Purchase of own shares 15.11.18 3.0625% £7,000,162 The loan is secured by a charge of the Group’s property to a Deed of Priority dated 29 October 2012 between the Allied Irish Bank, Trustees of the Newbury Racecourse PLC Pension and Life Assurance Plan and Compton Beauchamp Estates Limited. * Under the terms of the loan the interest is rolled up into the loan capital sum. Interest accrued in the period to 31 December 2014 was £195,000 (2013: £195,000). Interest is calculated using the six monthly LGT Bank (Ireland) Limited International Bank Rate plus 2%.

29
Notes to the Financial Statements Year ended 31 December 2014
17. PROVISIONS FOR LIABILITIES
DEFERRED TAX: GROUP AND COMPANY
2014
£’000 2013
£’000 Provision for deferred taxation consists of the following amounts: Capital allowances in excess of depreciation 912 893 Tax losses (619) (552) 293 341
2014
£’000 2013
£’000 At 1 January 341 363 (Credit)/debit for the year (48) (22) At 31 December 293 341 In December 2012, the UK government announced that the corporation tax rate would reduce to 21% with effect from 1 April 2014 before falling to 20% with effect from 1 April 2015. The legislation to reduce the corporation tax rate for both 2014 and 2015 was substantively enacted on 2 July 2013. No further reductions in the rate were enacted or substantively enacted at the balance sheet date. Deferred tax has therefore been calculated at the reduced rate of 20% on the basis that it is unlikely the timing differences giving rise to the asset will reverse to a material extent prior to 1 April 2015.
18. ACCRUALS AND DEFERRED INCOME
GROUP AND COMPANY 2014
£’000 2013
£’000 Deferred capital grants 4,023 4,133 Other accruals and deferred income (included in creditors – amounts falling due within one year note 14) 1,114 927 5,137 5,060
Analysis of movements on capital grants
2014 £’000
Balance as at 1 January 2014 4,133 Capital grants credited to the profit and loss account (110) Balance as at 31 December 2014 4,023

30
Notes to the Financial Statements Year ended 31 December 2014
19. SHARE CAPITAL
2014 £’000
2013 £’000
Authorised Ordinary shares at 10p each 600 600 Total 600 600
Allotted and fully paid
2014 £’000
2013 £’000
Ordinary shares of 10p each 335 335 Total 335 335
20. COMBINED RECONCILIATION OF MOVEMENTS IN SHAREHOLDERS’ FUNDS AND STATEMENT OF MOVEMENT ON RESERVES
GROUP Share Capital
£’000
Share Premium
£’000
Capital redemption
Reserve £’000
Revaluation reserve £’000
Profit and loss
account £’000
Total £’000
At 1 January 2013 335 10,202 143 75 3,695 14,450 Profit for the year to 31 December 2013 - - - - 1,106 1,106 Actuarial gain net of associated deferred tax - - - - 21 21 At 31 December 2013 335 10,202 143 75 4,822 15,577 Profit for the year to 31 December 2014 - - - - 2,014 2,014 Actuarial loss net of associated deferred tax - - - - (379) (379) At 31 December 2014 335 10,202 143 75 6,457 17,212
COMPANY
Share Capital £’000
Share Premium
£’000
Capital redemption
reserve £’000
Other reserve £’000
Revaluation reserve £’000
Profit and loss
account £’000
Total £’000
At 1 January 2013 335 10,202 143 198 75 3,558 14,511 Profit for the year to 31 December 2013 - - - - - 1,080 1,080 Actuarial loss net of associated deferred tax - - - - - 21 21 At 31 December 2013 335 10,202 143 198 75 4,659 15,612 Profit for the year to 31 December 2014 - - - - - 2,019 2,019 Actuarial loss net of associated deferred tax - - - - - (379) (379) At 31 December 2014 335 10,202 143 198 75 6,299 17,252
Unrealised other reserves of £198,000 arose in Newbury Racecourse PLC on disposal of the land south of the racecourse to Newbury Racecourse Enterprises Limited in 2001.

31
Notes to the Financial Statements Year ended 31 December 2014
21. PENSION SCHEMES
Defined Contribution Scheme The Group operates a defined contribution pension scheme. The pension cost charge for the year represents contributions payable by the Group to the fund and amounted to £66,000 (2013: £78,000). There were £9,135 (2013: £7,550) of outstanding contributions at the end of the year. Defined Benefits Scheme Until 1 December 2003 the Group operated a funded non-contributory defined benefit pension scheme covering its permanent employees whose employment commenced prior to 16 July 2001. The scheme was closed to future accrual on 1 December 2003 and employees are not able to accrue any further benefits after this date except that salary linkage is retained. The scheme will continue in existence but no further life assurance cover has been provided after 1 December 2001. A lump sum contribution of £300,000 was made prior to 31 December 2003. Future pension provision for those employees who were accruing benefits under the defined benefit scheme will be made through enhanced contributions to the Stakeholder scheme. For employees joining the Group after 16 July 2001 a Stakeholder scheme has been put in place. The Group paid two lump sum contributions of £50,000 each to the scheme on 1 July 2012 and 1 July 2011. Based on the actuarial valuation dated 1 July 2011 no further funding is required. The defined benefit scheme funds are administered by trustees and are independent of the Group’s finances. The pension cost is assessed in accordance with the advice of a qualified actuary using the projected unit method. The most recent full actuarial valuation was as at 1 July 2011, the most significant assumptions being an investment return of 8% and salary increases of 4% per annum.
As at 1 July 2011, the market value of the scheme assets was £1,350,000 and the actuarial value of the assets was sufficient to fund 91% of the benefits that had accrued to members, after allowing for expected future increases in earnings. The actuarial valuation described above has been updated at 31 December 2014 by a qualified actuary using revised assumptions that are consistent with the requirements of FRS 17. Investments have been valued for this purpose at fair value. The major assumptions used for calculating the liabilities at 31 December 2014 under FRS 17 are as follows:

32
Notes to the Financial Statements Year ended 31 December 2014
21. PENSION SCHEMES (continued)
Disclosure of actuarial assumptions 2014
% 2013
% 2012
% 2011
% 2010
% Rate of increase in salaries 3.0 3.3 3.0 3.8 4.4 Rate of increase in pensions in payment Pre 1 July 1993 pension 3.0 3.0 3.0 3.0 3.0 Post 1 July 1993 pension 3.0 3.3 2.7 2.8 3.4 Discount rate (pre and post retirement) 3.9 4.6 4.3 4.7 5.4 Inflation assumption 3.0 3.3 2.7 2.8 3.4 In 2011 the company changed its method of valuing pensions in deferment from RPI to CPI in accordance with UK government legislation.
Disclosure of fair values of assets and expected rates of return
Expected rate of Return
2014 %
Fair value 2014
£’000
Expected rate of Return
2013 %
Fair value 2013
£’000
Expected rate of Return
2012 %
Fair value 2012
£’000 Group pension contract 3.9 1,547 5.4 1,552 4.0 1,695 Cash - - - - 2.7 - Annuity contracts 3.9 987 4.6 960 4.1 890 Total 2,534 2,512 2,585
Expected rate of Return
2011 %
Fair value 2011
£’000
Expected rate of Return
2010 %
Fair value 2010
£’000 Group pension contract 4.7 1,550 5.5 1,433 Cash 2.8 (5) 4.2 (9) Annuity contracts 4.7 894 5.4 831 Total 2,439 2,255 The yield under the Group Pension contract is paid in the form of a declared rate of interest, which is applied to the amount that stands to the credit of the contract.
Amounts included as other finance charges
2014
£’000 2013
£’000 Expected return on scheme assets 127 100 Interest cost (136) (127) Net finance charge (9) (27)

33
Notes to the Financial Statements Year ended 31 December 2014
21. PENSION SCHEMES (continued)
Amounts included in the Statement of total recognised gains and losses 2014
£’000 2013
£’000 Difference between actual and expected return on scheme assets (54) 22 Experience gains arising on the scheme liabilities - - Effects of change in assumptions underlying the present value of scheme liabilities (356) 6 Total actuarial (loss)/gain recognised in the Statement of Total Recognised Gains and Losses (410) 28 The total cumulative amount of actuarial profit recognised in the statement of total recognised gains and losses since the adoption of FRS17 is a loss of £472,000
Reconciliation of scheme assets and liabilities to the balance sheet date
2014 £’000
2013 £’000
2012 £’000
2011 £’000
2010 £’000
Fair value of scheme assets 2,534 2,512 2,585 2,439 2,255 Present value of scheme liabilities (3,414) (2,973) (3,047) (2,792) (2,797) Actuarial deficit (880) (461) (462) (353) (542) Related deferred tax 176 145 152 115 154 Net pension liability (704) (316) (310) (238) (388)
Movement in the scheme liability during the year 2014
£’000 2013
£’000 Deficit in the scheme at the beginning of the year (461) (462) Movement in the year: Other finance cost (9) (27) Actuarial (loss)/gain (410) 28 Employer contribution - - Deficit in the scheme at the end of the year (880) (461)
Impact of pension scheme deficit
2014 £’000
2013 £’000
Profit and loss reserve excluding pension liability 7,161 5,138 Pension deficit (704) (316) Profit and loss reserve including pension liability 6,457 4,822

34
Notes to the Financial Statements Year ended 31 December 2014
21. PENSION SCHEMES (continued)
Movement in share assets 2014
£’000 Assets in scheme at beginning of the period 2,512 Movement in the period Expected return on assets 127 Employer contribution - Member contributions - Benefits paid (51) Actuarial gain on assets (54) Assets in scheme at end of period 2,534
Movement in scheme liabilities 2014
£’000 Liabilities in scheme at beginning of the period 2,973 Movement in the period Interest costs 136 Member contributions - Benefits paid (51) Actuarial gain on liabilities 356 Liabilities in scheme at end of period 3,414
History of experience gains and losses
2014 £’000
2013 £’000
2012 £’000
2011 £’000
2010 £’000
Difference between the expected and actual return on scheme assets:
- Amount (54) 22 46 71 180 - Percentage of scheme assets (2.1)% 0.9% 1.8% 2.9% 8.0% Experience (losses)/gains arising on the scheme liabilities: - Amount - - - 98 4 - Percentage of scheme liabilities 0% 0% 0% 3.5% 0.2% Effects of changes in assumptions underlying the present value of the scheme liabilities:
- Amount (356) 6 (189) (4) (231) - Percentage of scheme liabilities 10.4% 0.1% (6.2%) (0.1%) (8.3%)

35
Notes to the Financial Statements Year ended 31 December 2014
22. FINANCIAL INSTRUMENTS Fair value of financial instruments A comparison of current and book values of all the Group’s financial instruments as at 31 December 2014 is provided below. Where market prices are not available for a particular instrument, fair values have been calculated by discounting cash flow at prevailing interest rates. The financial risk management section of the Directors’ report provides an explanation of the role that financial instruments have had during the period in creating or changing the risks that the Group faces in its activities. The explanation summarises the objectives and policies for holding and issuing financial instruments and similar contracts, and the strategies for achieving these objectives which have been followed in the period. The numerical disclosures within this note deal with financial assets and financial liabilities as defined in FRS 13 ‘Derivatives and Other Financial Instrument Disclosures’. Certain financial assets, such as investments in subsidiary, are excluded from the scope of these disclosures. As permitted by FRS 13, short term debtors and creditors have been excluded from the disclosure.
Primary financial instruments held to finance the Group’s operations
Book value 2014
£’000
Fair value 2014
£’000
Book value 2013
£’000
Fair value 2013 £’000
Cash at bank and in hand 4,432 4,432 998 998 Borrowings due within one year - - - - Borrowings due after more than one year (7,000) (5,862) (7,382) (5,699) (2,568) (1,430) (6,384) (4,701)
Maturity profile of financial instruments
Variable rate
2014 £’000
Fixed rate 2014
£’000
Interest Free
2014 £’000
Variable rate
2013 £’000
Fixed rate 2013 £’000
Interest Free
2013 £’000
Within one year or less on demand - - - - - - More than one year but not more than two years - - - 577 - - More than five years 7,000 - - 6,805 - - 7,000 - - 7,382 - - Interest rate on profile of financial instruments 2014 2013 AIB Loans 3% over LIBOR and MLBR 3% over LIBOR and MLBR Compton Beauchamp Estates Ltd Loan 2% over LGT (Ireland) International
interbank rate 2% over LGT (Ireland)International Interbank rate
Financial instruments of overdraft and AIB loans have been used in the period to fund working capital requirements. Loan facilities undrawn at year end Maturity Facility 2014 date £’000 £’000
AIB Revolving credit facility 1 Dec 2015
£1,000,000 -
AIB Revolving credit facility 2 Dec 2015 £1,800,000 - AIB Revolving credit facility 3 Dec 2015 £1,500,000 -
As at 31 December 2014 there were no hedging instruments in place.
23. RELATED PARTY TRANSACTIONS Advantage has been taken of the exemption under FRS 8 not to disclose transactions between entities, of whose voting rights are controlled within the Group. The CBEL loan of £7,000,162 is provided by Compton Beauchamp Estates Limited (see note 16). Erik Penser is a director of Compton Beauchamp Estates Limited. This is considered to be an arms length transaction.