Embed Size (px)
Citation preview
NEWFOUNDLAND AND LABRADOR HYDRO CONDENSED CONSOLIDATED INTERIM FINANCIAL STATEMENTS
March 31, 2015 (Unaudited)
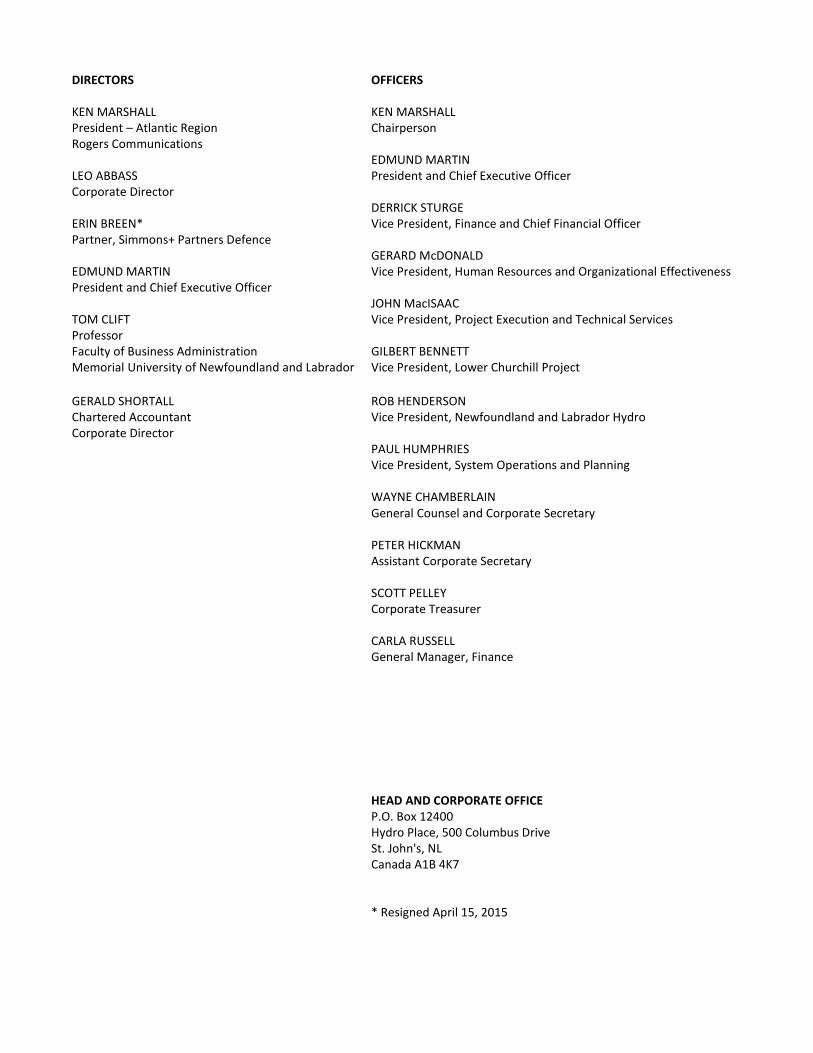
DIRECTORS OFFICERS KEN MARSHALL KEN MARSHALL President – Atlantic Region Chairperson Rogers Communications EDMUND MARTIN LEO ABBASS President and Chief Executive Officer Corporate Director DERRICK STURGE ERIN BREEN* Vice President, Finance and Chief Financial Officer Partner, Simmons+ Partners Defence GERARD McDONALD EDMUND MARTIN Vice President, Human Resources and Organizational Effectiveness President and Chief Executive Officer
JOHN MacISAAC TOM CLIFT Vice President, Project Execution and Technical Services Professor Faculty of Business Administration GILBERT BENNETT Memorial University of Newfoundland and Labrador Vice President, Lower Churchill Project
GERALD SHORTALL ROB HENDERSON Chartered Accountant Vice President, Newfoundland and Labrador Hydro Corporate Director
PAUL HUMPHRIES
Vice President, System Operations and Planning
WAYNE CHAMBERLAIN
General Counsel and Corporate Secretary
PETER HICKMAN
Assistant Corporate Secretary
SCOTT PELLEY
Corporate Treasurer
CARLA RUSSELL
General Manager, Finance
HEAD AND CORPORATE OFFICE
P.O. Box 12400
Hydro Place, 500 Columbus Drive
St. John's, NL
Canada A1B 4K7
* Resigned April 15, 2015
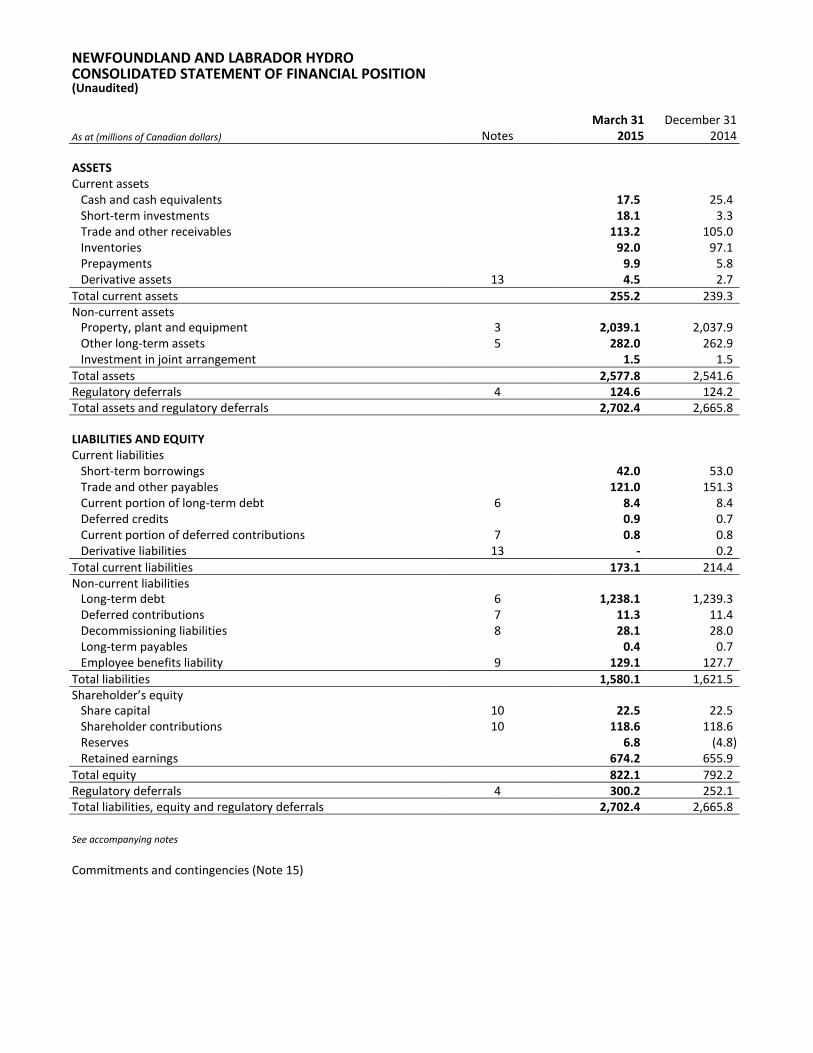
NEWFOUNDLAND AND LABRADOR HYDRO CONSOLIDATED STATEMENT OF FINANCIAL POSITION (Unaudited) March 31 December 31 As at (millions of Canadian dollars) Notes 2015 2014
ASSETS Current assets
Cash and cash equivalents 17.5 25.4 Short-term investments 18.1 3.3 Trade and other receivables 113.2 105.0 Inventories 92.0 97.1 Prepayments 9.9 5.8 Derivative assets 13 4.5 2.7
Total current assets 255.2 239.3 Non-current assets
Property, plant and equipment 3 2,039.1 2,037.9 Other long-term assets 5 282.0 262.9 Investment in joint arrangement 1.5 1.5
Total assets 2,577.8 2,541.6 Regulatory deferrals 4 124.6 124.2 Total assets and regulatory deferrals 2,702.4 2,665.8 LIABILITIES AND EQUITY Current liabilities
Short-term borrowings 42.0 53.0 Trade and other payables 121.0 151.3 Current portion of long-term debt 6 8.4 8.4 Deferred credits 0.9 0.7 Current portion of deferred contributions 7 0.8 0.8 Derivative liabilities 13 - 0.2
Total current liabilities 173.1 214.4 Non-current liabilities
Long-term debt 6 1,238.1 1,239.3 Deferred contributions 7 11.3 11.4 Decommissioning liabilities 8 28.1 28.0 Long-term payables 0.4 0.7 Employee benefits liability 9 129.1 127.7
Total liabilities 1,580.1 1,621.5 Shareholder’s equity
Share capital 10 22.5 22.5 Shareholder contributions 10 118.6 118.6 Reserves 6.8 (4.8) Retained earnings 674.2 655.9
Total equity 822.1 792.2 Regulatory deferrals 4 300.2 252.1 Total liabilities, equity and regulatory deferrals 2,702.4 2,665.8
See accompanying notes Commitments and contingencies (Note 15)
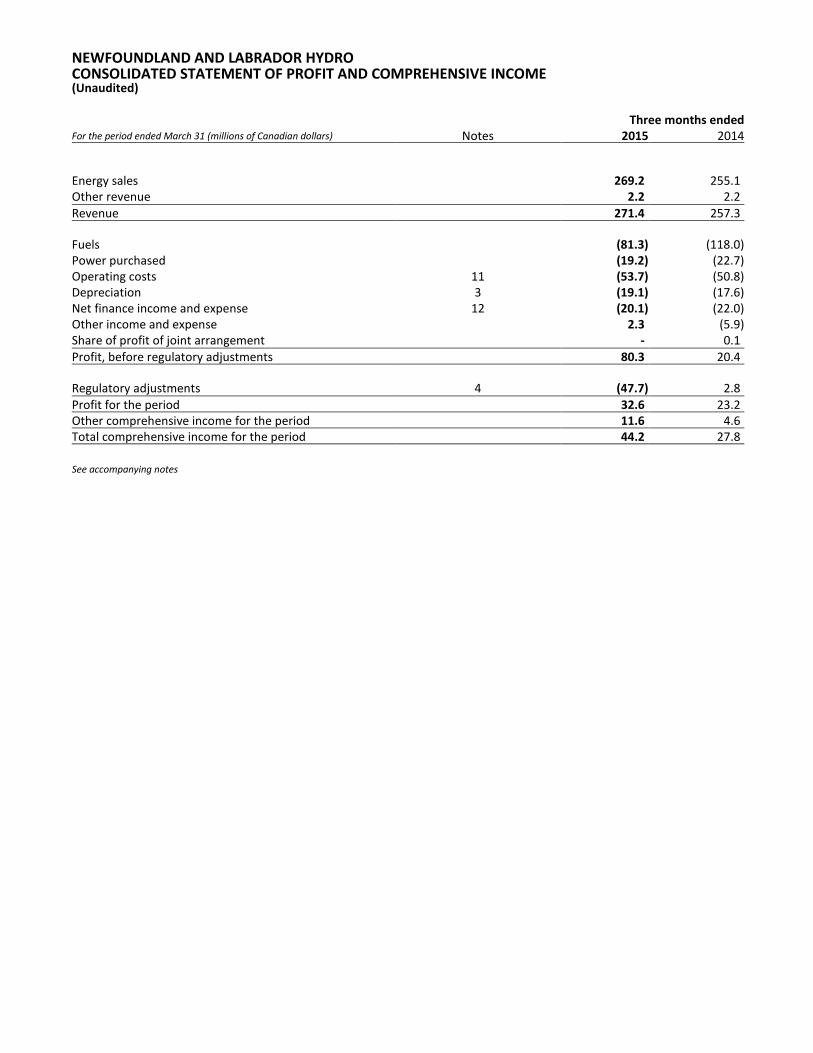
NEWFOUNDLAND AND LABRADOR HYDRO CONSOLIDATED STATEMENT OF PROFIT AND COMPREHENSIVE INCOME (Unaudited) Three months ended For the period ended March 31 (millions of Canadian dollars) Notes 2015 2014
Energy sales 269.2 255.1 Other revenue 2.2 2.2
Revenue 271.4 257.3 Fuels (81.3) (118.0) Power purchased (19.2) (22.7) Operating costs 11 (53.7) (50.8) Depreciation 3 (19.1) (17.6) Net finance income and expense 12 (20.1) (22.0) Other income and expense 2.3 (5.9) Share of profit of joint arrangement - 0.1
Profit, before regulatory adjustments 80.3 20.4 Regulatory adjustments 4 (47.7) 2.8
Profit for the period 32.6 23.2 Other comprehensive income for the period 11.6 4.6 Total comprehensive income for the period 44.2 27.8 See accompanying notes
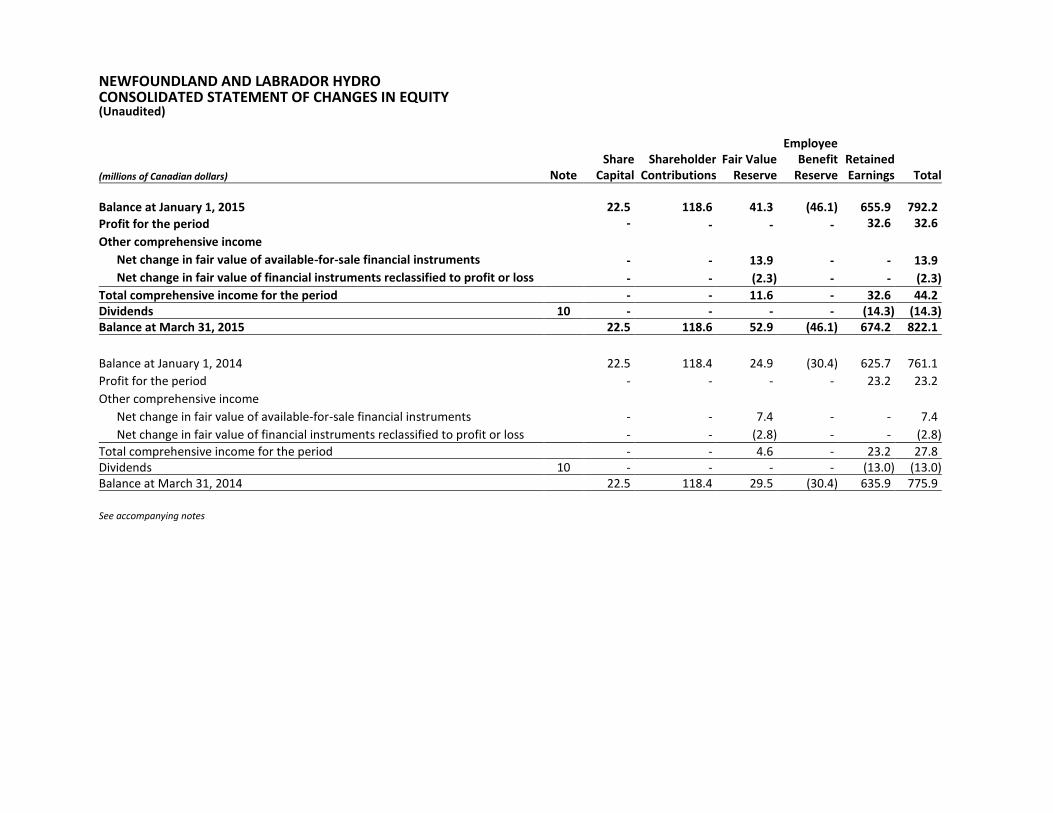
NEWFOUNDLAND AND LABRADOR HYDRO CONSOLIDATED STATEMENT OF CHANGES IN EQUITY (Unaudited) Employee Share Shareholder Fair Value Benefit Retained
(millions of Canadian dollars) Note Capital Contributions Reserve Reserve Earnings Total
Balance at January 1, 2015 22.5 118.6 41.3 (46.1) 655.9 792.2
Profit for the period - - - - 32.6 32.6
Other comprehensive income
Net change in fair value of available-for-sale financial instruments - - 13.9 - - 13.9
Net change in fair value of financial instruments reclassified to profit or loss - - (2.3) - - (2.3)
Total comprehensive income for the period - - 11.6 - 32.6 44.2
Dividends 10 - - - - (14.3) (14.3)
Balance at March 31, 2015 22.5 118.6 52.9 (46.1) 674.2 822.1
Balance at January 1, 2014 22.5 118.4 24.9 (30.4) 625.7 761.1
Profit for the period - - - - 23.2 23.2
Other comprehensive income
Net change in fair value of available-for-sale financial instruments - - 7.4 - - 7.4
Net change in fair value of financial instruments reclassified to profit or loss - - (2.8) - - (2.8)
Total comprehensive income for the period - - 4.6 - 23.2 27.8
Dividends 10 - - - - (13.0) (13.0)
Balance at March 31, 2014 22.5 118.4 29.5 (30.4) 635.9 775.9
See accompanying notes
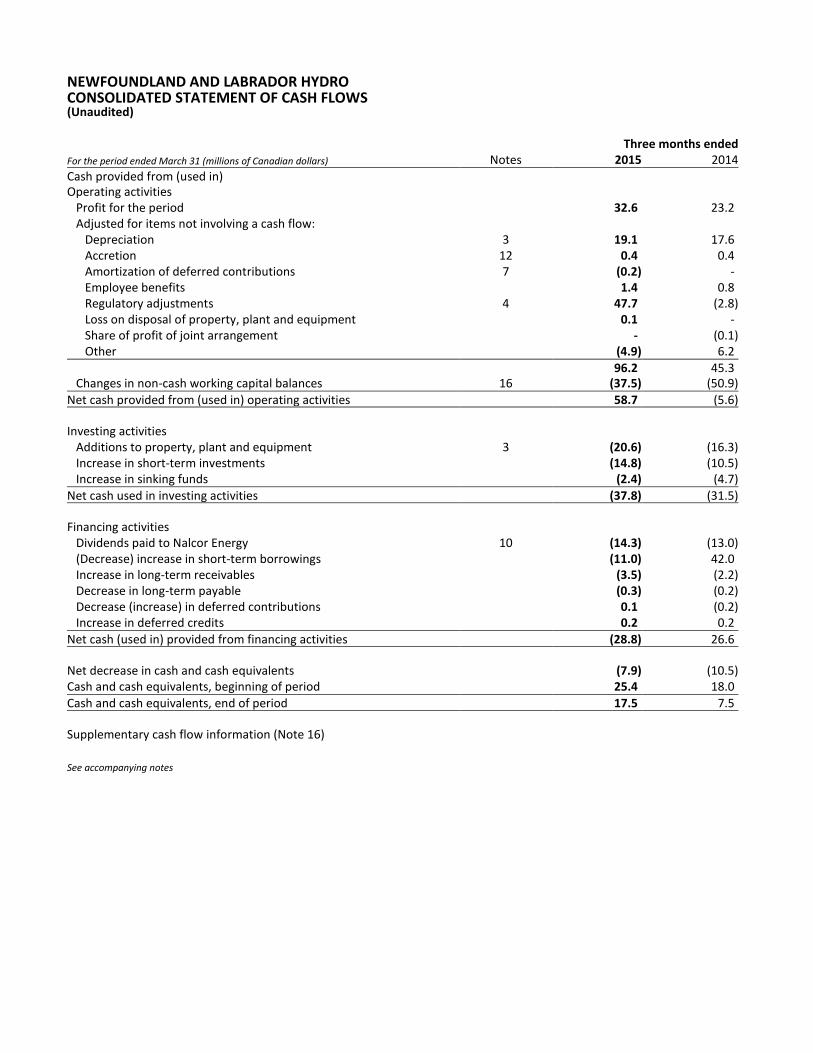
NEWFOUNDLAND AND LABRADOR HYDRO CONSOLIDATED STATEMENT OF CASH FLOWS (Unaudited) Three months ended For the period ended March 31 (millions of Canadian dollars) Notes 2015 2014
Cash provided from (used in) Operating activities
Profit for the period 32.6 23.2 Adjusted for items not involving a cash flow:
Depreciation 3 19.1 17.6 Accretion 12 0.4 0.4 Amortization of deferred contributions 7 (0.2) - Employee benefits 1.4 0.8 Regulatory adjustments 4 47.7 (2.8) Loss on disposal of property, plant and equipment 0.1 - Share of profit of joint arrangement - (0.1) Other (4.9) 6.2
96.2 45.3 Changes in non-cash working capital balances 16 (37.5) (50.9)
Net cash provided from (used in) operating activities 58.7 (5.6) Investing activities
Additions to property, plant and equipment 3 (20.6) (16.3) Increase in short-term investments (14.8) (10.5) Increase in sinking funds (2.4) (4.7)
Net cash used in investing activities (37.8) (31.5) Financing activities
Dividends paid to Nalcor Energy 10 (14.3) (13.0) (Decrease) increase in short-term borrowings (11.0) 42.0 Increase in long-term receivables (3.5) (2.2) Decrease in long-term payable (0.3) (0.2) Decrease (increase) in deferred contributions 0.1 (0.2) Increase in deferred credits 0.2 0.2
Net cash (used in) provided from financing activities (28.8) 26.6 Net decrease in cash and cash equivalents (7.9) (10.5) Cash and cash equivalents, beginning of period 25.4 18.0
Cash and cash equivalents, end of period 17.5 7.5 Supplementary cash flow information (Note 16) See accompanying notes
NEWFOUNDLAND AND LABRADOR HYDRO NOTES TO THE CONDENSED CONSOLIDATED INTERIM FINANCIAL STATEMENTS (Unaudited)
- 1 -
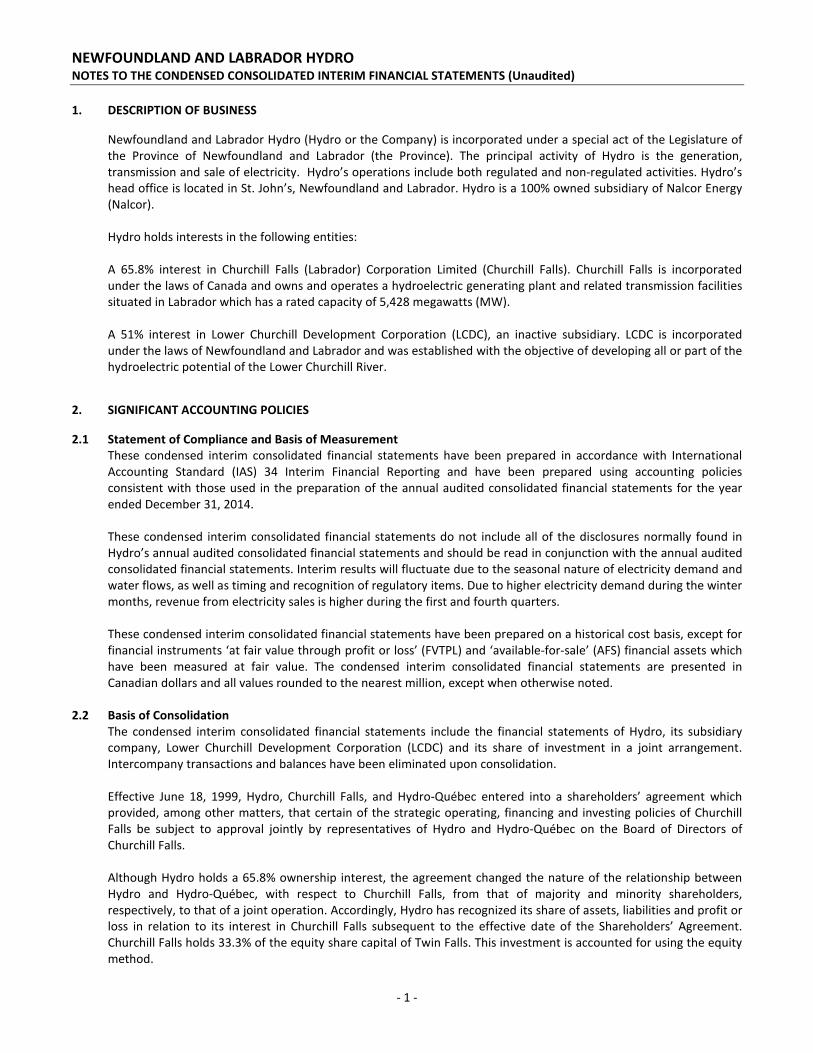
1. DESCRIPTION OF BUSINESS
Newfoundland and Labrador Hydro (Hydro or the Company) is incorporated under a special act of the Legislature of the Province of Newfoundland and Labrador (the Province). The principal activity of Hydro is the generation, transmission and sale of electricity. Hydro’s operations include both regulated and non-regulated activities. Hydro’s head office is located in St. John’s, Newfoundland and Labrador. Hydro is a 100% owned subsidiary of Nalcor Energy (Nalcor). Hydro holds interests in the following entities: A 65.8% interest in Churchill Falls (Labrador) Corporation Limited (Churchill Falls). Churchill Falls is incorporated under the laws of Canada and owns and operates a hydroelectric generating plant and related transmission facilities situated in Labrador which has a rated capacity of 5,428 megawatts (MW). A 51% interest in Lower Churchill Development Corporation (LCDC), an inactive subsidiary. LCDC is incorporated under the laws of Newfoundland and Labrador and was established with the objective of developing all or part of the hydroelectric potential of the Lower Churchill River.
2. SIGNIFICANT ACCOUNTING POLICIES
2.1 Statement of Compliance and Basis of Measurement These condensed interim consolidated financial statements have been prepared in accordance with International Accounting Standard (IAS) 34 Interim Financial Reporting and have been prepared using accounting policies consistent with those used in the preparation of the annual audited consolidated financial statements for the year ended December 31, 2014. These condensed interim consolidated financial statements do not include all of the disclosures normally found in Hydro’s annual audited consolidated financial statements and should be read in conjunction with the annual audited consolidated financial statements. Interim results will fluctuate due to the seasonal nature of electricity demand and water flows, as well as timing and recognition of regulatory items. Due to higher electricity demand during the winter months, revenue from electricity sales is higher during the first and fourth quarters. These condensed interim consolidated financial statements have been prepared on a historical cost basis, except for financial instruments ‘at fair value through profit or loss’ (FVTPL) and ‘available-for-sale’ (AFS) financial assets which have been measured at fair value. The condensed interim consolidated financial statements are presented in Canadian dollars and all values rounded to the nearest million, except when otherwise noted.
2.2 Basis of Consolidation The condensed interim consolidated financial statements include the financial statements of Hydro, its subsidiary
company, Lower Churchill Development Corporation (LCDC) and its share of investment in a joint arrangement. Intercompany transactions and balances have been eliminated upon consolidation.
Effective June 18, 1999, Hydro, Churchill Falls, and Hydro-Québec entered into a shareholders’ agreement which provided, among other matters, that certain of the strategic operating, financing and investing policies of Churchill Falls be subject to approval jointly by representatives of Hydro and Hydro-Québec on the Board of Directors of Churchill Falls.
Although Hydro holds a 65.8% ownership interest, the agreement changed the nature of the relationship between
Hydro and Hydro-Québec, with respect to Churchill Falls, from that of majority and minority shareholders, respectively, to that of a joint operation. Accordingly, Hydro has recognized its share of assets, liabilities and profit or loss in relation to its interest in Churchill Falls subsequent to the effective date of the Shareholders’ Agreement. Churchill Falls holds 33.3% of the equity share capital of Twin Falls. This investment is accounted for using the equity method.
NEWFOUNDLAND AND LABRADOR HYDRO NOTES TO THE CONDENSED CONSOLIDATED INTERIM FINANCIAL STATEMENTS (Unaudited)
- 2 -
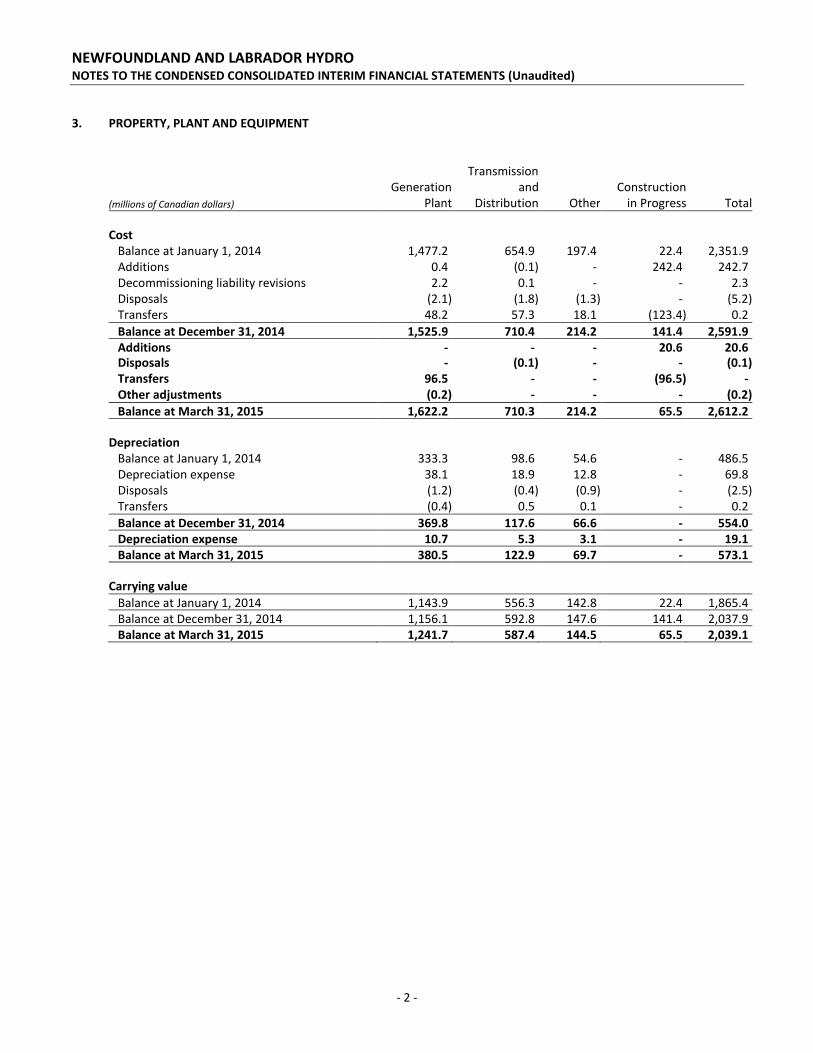
3. PROPERTY, PLANT AND EQUIPMENT
Transmission
Generation and Construction
(millions of Canadian dollars) Plant Distribution Other in Progress Total
Cost
Balance at January 1, 2014 1,477.2 654.9 197.4 22.4 2,351.9
Additions 0.4 (0.1) - 242.4 242.7
Decommissioning liability revisions 2.2 0.1 - - 2.3
Disposals (2.1) (1.8) (1.3) - (5.2)
Transfers 48.2 57.3 18.1 (123.4) 0.2
Balance at December 31, 2014 1,525.9 710.4 214.2 141.4 2,591.9
Additions - - - 20.6 20.6 Disposals - (0.1) - - (0.1)
Transfers 96.5 - - (96.5) -
Other adjustments (0.2) - - - (0.2)
Balance at March 31, 2015 1,622.2 710.3 214.2 65.5 2,612.2
Depreciation
Balance at January 1, 2014 333.3 98.6 54.6 - 486.5
Depreciation expense 38.1 18.9 12.8 - 69.8
Disposals (1.2) (0.4) (0.9) - (2.5)
Transfers (0.4) 0.5 0.1 - 0.2
Balance at December 31, 2014 369.8 117.6 66.6 - 554.0
Depreciation expense 10.7 5.3 3.1 - 19.1
Balance at March 31, 2015 380.5 122.9 69.7 - 573.1
Carrying value
Balance at January 1, 2014 1,143.9 556.3 142.8 22.4 1,865.4
Balance at December 31, 2014 1,156.1 592.8 147.6 141.4 2,037.9
Balance at March 31, 2015 1,241.7 587.4 144.5 65.5 2,039.1
NEWFOUNDLAND AND LABRADOR HYDRO NOTES TO THE CONDENSED CONSOLIDATED INTERIM FINANCIAL STATEMENTS (Unaudited)
- 3 -
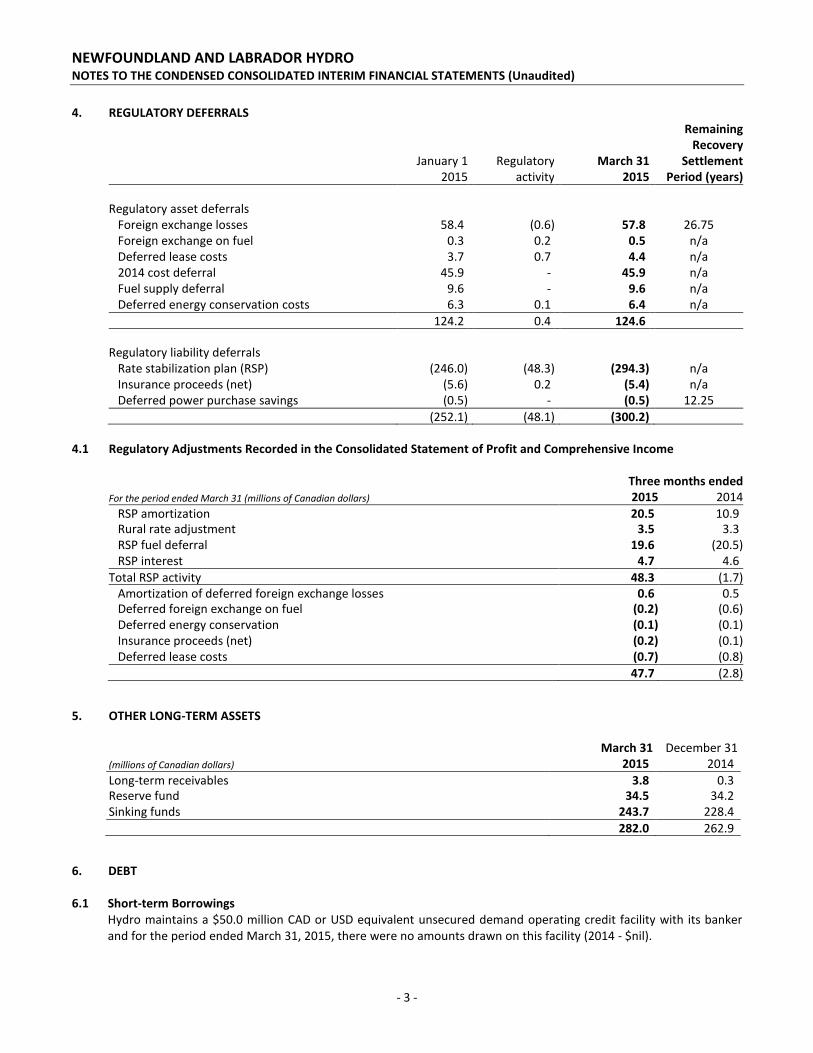
4. REGULATORY DEFERRALS Remaining
Recovery
January 1 Regulatory March 31 Settlement
2015 activity 2015 Period (years)
Regulatory asset deferrals
Foreign exchange losses 58.4 (0.6) 57.8 26.75
Foreign exchange on fuel 0.3 0.2 0.5 n/a
Deferred lease costs 3.7 0.7 4.4 n/a
2014 cost deferral 45.9 - 45.9 n/a
Fuel supply deferral 9.6 - 9.6 n/a
Deferred energy conservation costs 6.3 0.1 6.4 n/a
124.2 0.4 124.6
Regulatory liability deferrals Rate stabilization plan (RSP) (246.0) (48.3) (294.3) n/a
Insurance proceeds (net) (5.6) 0.2 (5.4) n/a
Deferred power purchase savings (0.5) - (0.5) 12.25
(252.1) (48.1) (300.2)
4.1 Regulatory Adjustments Recorded in the Consolidated Statement of Profit and Comprehensive Income Three months ended
For the period ended March 31 (millions of Canadian dollars) 2015 2014
RSP amortization 20.5 10.9 Rural rate adjustment 3.5 3.3
RSP fuel deferral 19.6 (20.5)
RSP interest 4.7 4.6
Total RSP activity 48.3 (1.7)
Amortization of deferred foreign exchange losses 0.6 0.5 Deferred foreign exchange on fuel (0.2) (0.6)
Deferred energy conservation (0.1) (0.1)
Insurance proceeds (net) (0.2) (0.1)
Deferred lease costs (0.7) (0.8)
47.7 (2.8)
5. OTHER LONG-TERM ASSETS March 31 December 31 (millions of Canadian dollars) 2015 2014
Long-term receivables 3.8 0.3 Reserve fund 34.5 34.2 Sinking funds 243.7 228.4
282.0 262.9
6. DEBT 6.1 Short-term Borrowings Hydro maintains a $50.0 million CAD or USD equivalent unsecured demand operating credit facility with its banker
and for the period ended March 31, 2015, there were no amounts drawn on this facility (2014 - $nil).
NEWFOUNDLAND AND LABRADOR HYDRO NOTES TO THE CONDENSED CONSOLIDATED INTERIM FINANCIAL STATEMENTS (Unaudited)
- 4 -
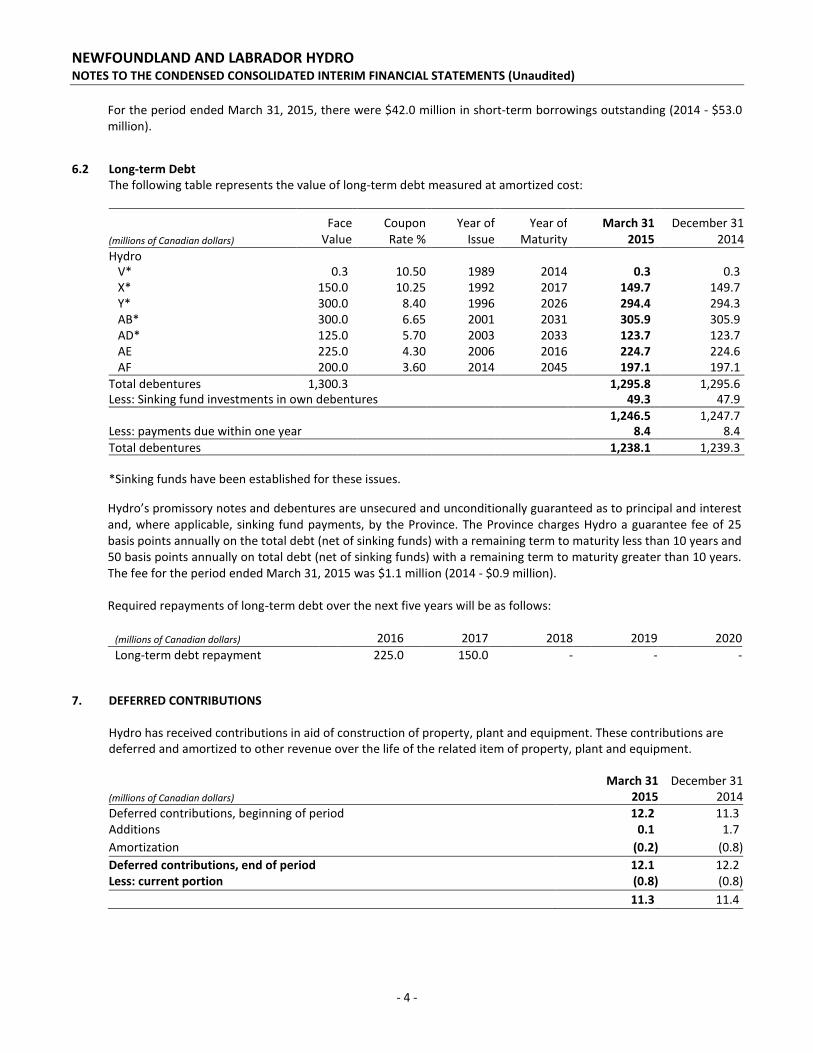
For the period ended March 31, 2015, there were $42.0 million in short-term borrowings outstanding (2014 - $53.0 million).
6.2 Long-term Debt The following table represents the value of long-term debt measured at amortized cost:
(millions of Canadian dollars)
Face Value
Coupon Rate %
Year of Issue
Year of Maturity
March 31 2015
December 31 2014
Hydro V* 0.3 10.50 1989 2014 0.3 0.3
X* 150.0 10.25 1992 2017 149.7 149.7
Y* 300.0 8.40 1996 2026 294.4 294.3
AB* 300.0 6.65 2001 2031 305.9 305.9
AD* 125.0 5.70 2003 2033 123.7 123.7
AE 225.0 4.30 2006 2016 224.7 224.6
AF 200.0 3.60 2014 2045 197.1 197.1
Total debentures 1,300.3 1,295.8 1,295.6 Less: Sinking fund investments in own debentures 49.3 47.9
1,246.5 1,247.7 Less: payments due within one year 8.4 8.4
Total debentures 1,238.1 1,239.3
*Sinking funds have been established for these issues.
Hydro’s promissory notes and debentures are unsecured and unconditionally guaranteed as to principal and interest and, where applicable, sinking fund payments, by the Province. The Province charges Hydro a guarantee fee of 25 basis points annually on the total debt (net of sinking funds) with a remaining term to maturity less than 10 years and 50 basis points annually on total debt (net of sinking funds) with a remaining term to maturity greater than 10 years. The fee for the period ended March 31, 2015 was $1.1 million (2014 - $0.9 million). Required repayments of long-term debt over the next five years will be as follows:
(millions of Canadian dollars) 2016 2017 2018 2019 2020
Long-term debt repayment 225.0 150.0 - - -
7. DEFERRED CONTRIBUTIONS Hydro has received contributions in aid of construction of property, plant and equipment. These contributions are
deferred and amortized to other revenue over the life of the related item of property, plant and equipment.
March 31 December 31
(millions of Canadian dollars) 2015 2014
Deferred contributions, beginning of period 12.2 11.3 Additions 0.1 1.7
Amortization (0.2) (0.8)
Deferred contributions, end of period 12.1 12.2 Less: current portion (0.8) (0.8)
11.3 11.4
NEWFOUNDLAND AND LABRADOR HYDRO NOTES TO THE CONDENSED CONSOLIDATED INTERIM FINANCIAL STATEMENTS (Unaudited)
- 5 -
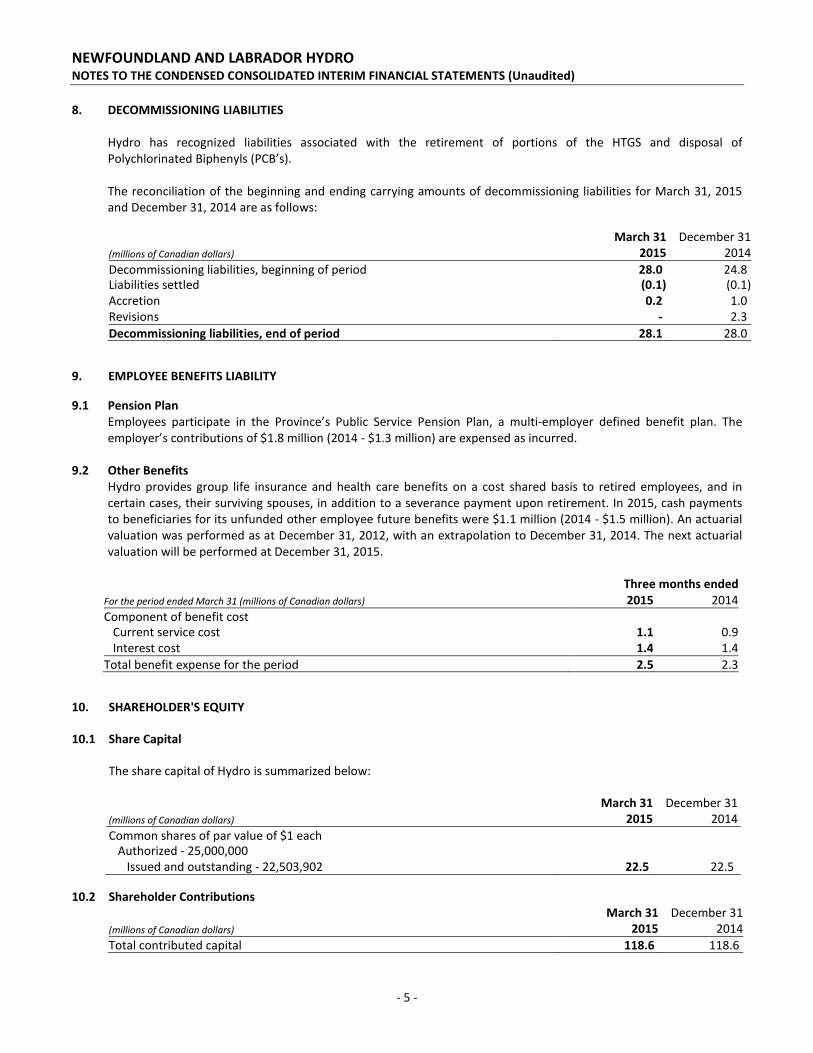
8. DECOMMISSIONING LIABILITIES Hydro has recognized liabilities associated with the retirement of portions of the HTGS and disposal of Polychlorinated Biphenyls (PCB’s). The reconciliation of the beginning and ending carrying amounts of decommissioning liabilities for March 31, 2015 and December 31, 2014 are as follows:
March 31 December 31
(millions of Canadian dollars) 2015 2014
Decommissioning liabilities, beginning of period 28.0 24.8 Liabilities settled (0.1) (0.1)
Accretion 0.2 1.0
Revisions - 2.3
Decommissioning liabilities, end of period 28.1 28.0
9. EMPLOYEE BENEFITS LIABILITY
9.1 Pension Plan Employees participate in the Province’s Public Service Pension Plan, a multi-employer defined benefit plan. The employer’s contributions of $1.8 million (2014 - $1.3 million) are expensed as incurred.
9.2 Other Benefits
Hydro provides group life insurance and health care benefits on a cost shared basis to retired employees, and in certain cases, their surviving spouses, in addition to a severance payment upon retirement. In 2015, cash payments to beneficiaries for its unfunded other employee future benefits were $1.1 million (2014 - $1.5 million). An actuarial valuation was performed as at December 31, 2012, with an extrapolation to December 31, 2014. The next actuarial valuation will be performed at December 31, 2015.
Three months ended
For the period ended March 31 (millions of Canadian dollars) 2015 2014
Component of benefit cost Current service cost 1.1 0.9
Interest cost 1.4 1.4
Total benefit expense for the period 2.5 2.3
10. SHAREHOLDER'S EQUITY 10.1 Share Capital The share capital of Hydro is summarized below: March 31 December 31 (millions of Canadian dollars) 2015 2014
Common shares of par value of $1 each Authorized - 25,000,000 Issued and outstanding - 22,503,902 22.5 22.5
10.2 Shareholder Contributions March 31 December 31 (millions of Canadian dollars) 2015 2014
Total contributed capital 118.6 118.6
NEWFOUNDLAND AND LABRADOR HYDRO NOTES TO THE CONDENSED CONSOLIDATED INTERIM FINANCIAL STATEMENTS (Unaudited)
- 6 -
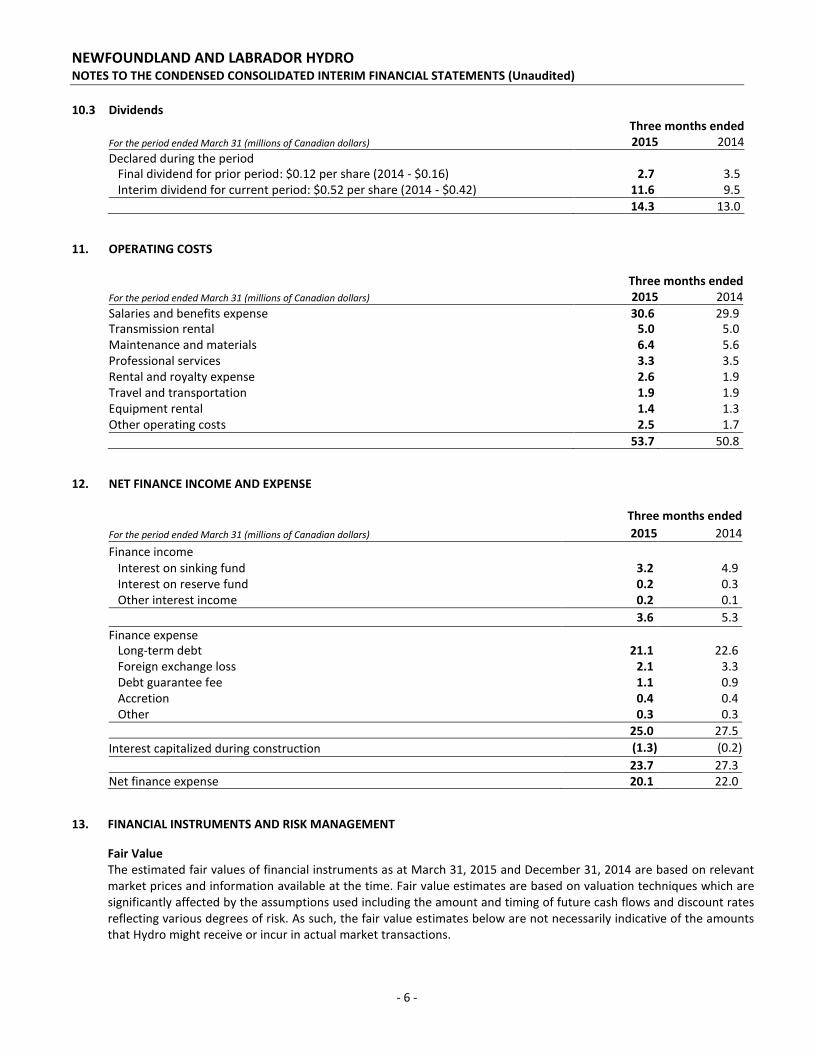
10.3 Dividends
Three months ended
For the period ended March 31 (millions of Canadian dollars) 2015 2014
Declared during the period Final dividend for prior period: $0.12 per share (2014 - $0.16) 2.7 3.5
Interim dividend for current period: $0.52 per share (2014 - $0.42) 11.6 9.5
14.3 13.0
11. OPERATING COSTS Three months ended For the period ended March 31 (millions of Canadian dollars) 2015 2014
Salaries and benefits expense 30.6 29.9 Transmission rental 5.0 5.0 Maintenance and materials 6.4 5.6 Professional services 3.3 3.5 Rental and royalty expense 2.6 1.9 Travel and transportation 1.9 1.9 Equipment rental 1.4 1.3 Other operating costs 2.5 1.7
53.7 50.8
12. NET FINANCE INCOME AND EXPENSE Three months ended
For the period ended March 31 (millions of Canadian dollars) 2015 2014
Finance income Interest on sinking fund 3.2 4.9
Interest on reserve fund 0.2 0.3
Other interest income 0.2 0.1
3.6 5.3
Finance expense Long-term debt 21.1 22.6
Foreign exchange loss 2.1 3.3
Debt guarantee fee 1.1 0.9
Accretion 0.4 0.4
Other 0.3 0.3
25.0 27.5
Interest capitalized during construction (1.3) (0.2)
23.7 27.3
Net finance expense 20.1 22.0
13. FINANCIAL INSTRUMENTS AND RISK MANAGEMENT
Fair Value The estimated fair values of financial instruments as at March 31, 2015 and December 31, 2014 are based on relevant market prices and information available at the time. Fair value estimates are based on valuation techniques which are significantly affected by the assumptions used including the amount and timing of future cash flows and discount rates reflecting various degrees of risk. As such, the fair value estimates below are not necessarily indicative of the amounts that Hydro might receive or incur in actual market transactions.
NEWFOUNDLAND AND LABRADOR HYDRO NOTES TO THE CONDENSED CONSOLIDATED INTERIM FINANCIAL STATEMENTS (Unaudited)
- 7 -
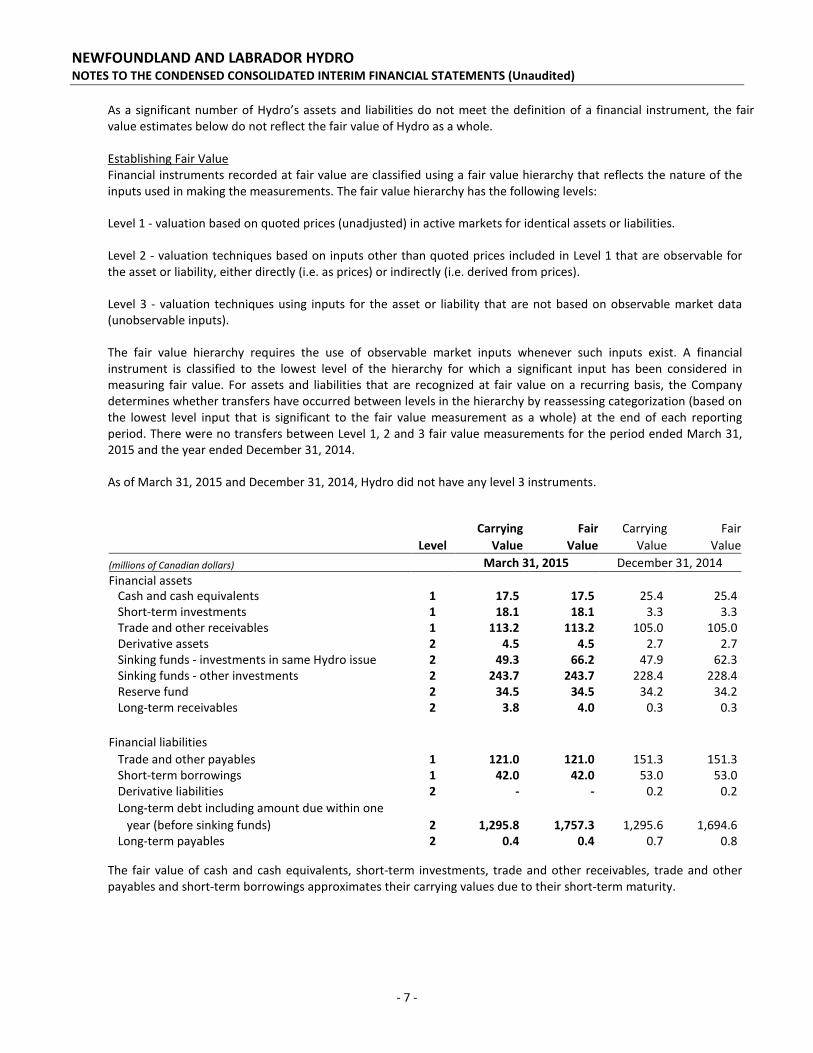
As a significant number of Hydro’s assets and liabilities do not meet the definition of a financial instrument, the fair value estimates below do not reflect the fair value of Hydro as a whole. Establishing Fair Value Financial instruments recorded at fair value are classified using a fair value hierarchy that reflects the nature of the inputs used in making the measurements. The fair value hierarchy has the following levels:
Level 1 - valuation based on quoted prices (unadjusted) in active markets for identical assets or liabilities.
Level 2 - valuation techniques based on inputs other than quoted prices included in Level 1 that are observable for the asset or liability, either directly (i.e. as prices) or indirectly (i.e. derived from prices).
Level 3 - valuation techniques using inputs for the asset or liability that are not based on observable market data (unobservable inputs).
The fair value hierarchy requires the use of observable market inputs whenever such inputs exist. A financial instrument is classified to the lowest level of the hierarchy for which a significant input has been considered in measuring fair value. For assets and liabilities that are recognized at fair value on a recurring basis, the Company determines whether transfers have occurred between levels in the hierarchy by reassessing categorization (based on the lowest level input that is significant to the fair value measurement as a whole) at the end of each reporting period. There were no transfers between Level 1, 2 and 3 fair value measurements for the period ended March 31, 2015 and the year ended December 31, 2014.
As of March 31, 2015 and December 31, 2014, Hydro did not have any level 3 instruments.
Carrying Fair Carrying Fair
Level Value Value Value Value
(millions of Canadian dollars) March 31, 2015 December 31, 2014
Financial assets Cash and cash equivalents 1 17.5
-
17.5 25.4 -
25.4
Short-term investments 1 18.1 -
18.1 3.3 -
3.3
Trade and other receivables 1 113.2 -
113.2 105.0 -
105.0
Derivative assets 2 4.5 -
4.5 2.7 -
2.7
Sinking funds - investments in same Hydro issue 2 49.3 -
66.2 47.9 -
62.3
Sinking funds - other investments 2 243.7 -
243.7 228.4 -
228.4
Reserve fund 2 34.5 -
34.5 34.2 -
34.2
Long-term receivables 2 3.8 -
4.0 0.3 -
0.3
Financial liabilities
Trade and other payables 1 121.0 -
121.0 151.3 -
151.3
Short-term borrowings 1 42.0 -
42.0 53.0 -
53.0
Derivative liabilities 2 - -
- 0.2 -
0.2
Long-term debt including amount due within one
year (before sinking funds) 2 1,295.8 -
1,757.3 1,295.6 -
1,694.6
Long-term payables 2 0.4 -
0.4 0.7 -
0.8
The fair value of cash and cash equivalents, short-term investments, trade and other receivables, trade and other payables and short-term borrowings approximates their carrying values due to their short-term maturity.
NEWFOUNDLAND AND LABRADOR HYDRO NOTES TO THE CONDENSED CONSOLIDATED INTERIM FINANCIAL STATEMENTS (Unaudited)
- 8 -
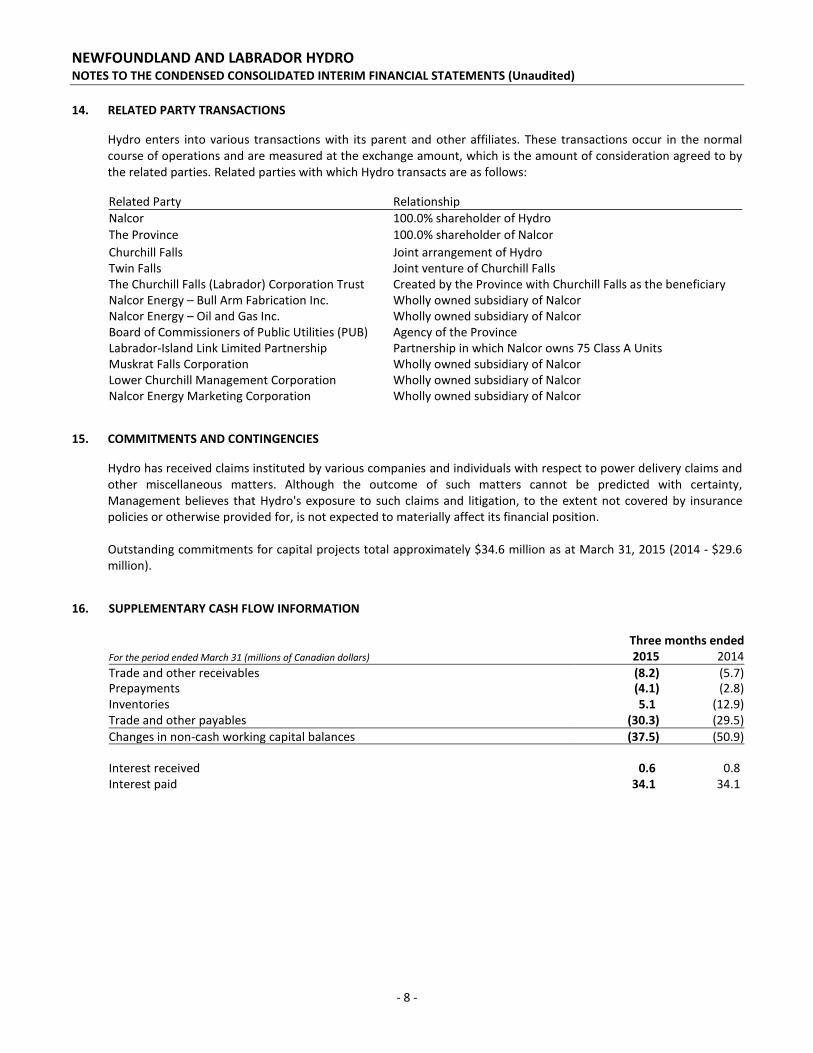
14. RELATED PARTY TRANSACTIONS
Hydro enters into various transactions with its parent and other affiliates. These transactions occur in the normal course of operations and are measured at the exchange amount, which is the amount of consideration agreed to by the related parties. Related parties with which Hydro transacts are as follows:
Related Party Relationship
Nalcor 100.0% shareholder of Hydro
The Province 100.0% shareholder of Nalcor
Churchill Falls Joint arrangement of Hydro Twin Falls Joint venture of Churchill Falls The Churchill Falls (Labrador) Corporation Trust Created by the Province with Churchill Falls as the beneficiary Nalcor Energy – Bull Arm Fabrication Inc. Wholly owned subsidiary of Nalcor Nalcor Energy – Oil and Gas Inc. Wholly owned subsidiary of Nalcor Board of Commissioners of Public Utilities (PUB) Agency of the Province
Labrador-Island Link Limited Partnership Partnership in which Nalcor owns 75 Class A Units
Muskrat Falls Corporation Wholly owned subsidiary of Nalcor
Lower Churchill Management Corporation Wholly owned subsidiary of Nalcor
Nalcor Energy Marketing Corporation Wholly owned subsidiary of Nalcor
15. COMMITMENTS AND CONTINGENCIES
Hydro has received claims instituted by various companies and individuals with respect to power delivery claims and other miscellaneous matters. Although the outcome of such matters cannot be predicted with certainty, Management believes that Hydro's exposure to such claims and litigation, to the extent not covered by insurance policies or otherwise provided for, is not expected to materially affect its financial position.
Outstanding commitments for capital projects total approximately $34.6 million as at March 31, 2015 (2014 - $29.6 million).
16. SUPPLEMENTARY CASH FLOW INFORMATION Three months ended For the period ended March 31 (millions of Canadian dollars) 2015 2014
Trade and other receivables (8.2) (5.7) Prepayments (4.1) (2.8) Inventories 5.1 (12.9) Trade and other payables (30.3) (29.5)
Changes in non-cash working capital balances (37.5) (50.9) Interest received 0.6 0.8
Interest paid 34.1 34.1
NEWFOUNDLAND AND LABRADOR HYDRO NOTES TO THE CONDENSED CONSOLIDATED INTERIM FINANCIAL STATEMENTS (Unaudited)
- 9 -
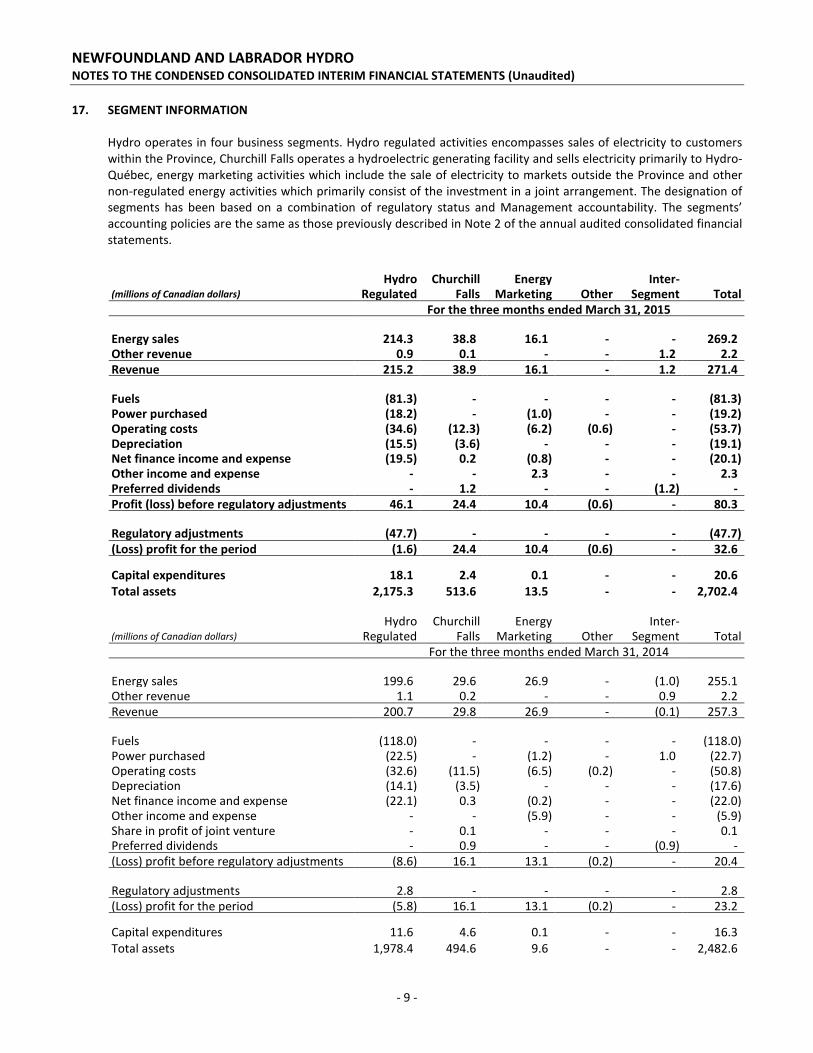
17. SEGMENT INFORMATION
Hydro operates in four business segments. Hydro regulated activities encompasses sales of electricity to customers within the Province, Churchill Falls operates a hydroelectric generating facility and sells electricity primarily to Hydro-Québec, energy marketing activities which include the sale of electricity to markets outside the Province and other non-regulated energy activities which primarily consist of the investment in a joint arrangement. The designation of segments has been based on a combination of regulatory status and Management accountability. The segments’ accounting policies are the same as those previously described in Note 2 of the annual audited consolidated financial statements.
Hydro Churchill Energy Inter- (millions of Canadian dollars) Regulated Falls Marketing Other Segment Total
For the three months ended March 31, 2015
Energy sales 214.3 38.8 16.1 - - 269.2 Other revenue 0.9 0.1 - - 1.2 2.2
Revenue 215.2 38.9 16.1 - 1.2 271.4 Fuels (81.3) - - - - (81.3) Power purchased (18.2) - (1.0) - - (19.2) Operating costs (34.6) (12.3) (6.2) (0.6) - (53.7) Depreciation (15.5) (3.6) - - - (19.1) Net finance income and expense (19.5) 0.2 (0.8) - - (20.1) Other income and expense - - 2.3 - - 2.3 Preferred dividends - 1.2 - - (1.2) -
Profit (loss) before regulatory adjustments 46.1 24.4 10.4 (0.6) - 80.3 Regulatory adjustments (47.7) - - - - (47.7)
(Loss) profit for the period (1.6) 24.4 10.4 (0.6) - 32.6
Capital expenditures 18.1 2.4 0.1 - - 20.6
Total assets 2,175.3 513.6 13.5 - - 2,702.4
Hydro Churchill Energy Inter-
(millions of Canadian dollars) Regulated Falls Marketing Other Segment Total
For the three months ended March 31, 2014 Energy sales 199.6 29.6 26.9 - (1.0) 255.1 Other revenue 1.1 0.2 - - 0.9 2.2
Revenue 200.7 29.8 26.9 - (0.1) 257.3 Fuels (118.0) - - - - (118.0) Power purchased (22.5) - (1.2) - 1.0 (22.7) Operating costs (32.6) (11.5) (6.5) (0.2) - (50.8) Depreciation (14.1) (3.5) - - - (17.6) Net finance income and expense (22.1) 0.3 (0.2) - - (22.0) Other income and expense - - (5.9) - - (5.9) Share in profit of joint venture - 0.1 - - - 0.1 Preferred dividends - 0.9 - - (0.9) -
(Loss) profit before regulatory adjustments (8.6) 16.1 13.1 (0.2) - 20.4 Regulatory adjustments 2.8 - - - - 2.8
(Loss) profit for the period (5.8) 16.1 13.1 (0.2) - 23.2
Capital expenditures 11.6 4.6 0.1 - - 16.3
Total assets 1,978.4 494.6 9.6 - - 2,482.6