Embed Size (px)
Citation preview

12. Marginal Cost Study
Newfoundland Power – 2008 General Rate Application
Newfoundland Power Marginal Cost of Electricity Service Study
Newfoundland Power Marginal Cost of Electricity Service Study
Prepared by
Hethie S. Parmesano Amparo D. Nieto William F. Rankin Veronica Irastorza
Veronica Lambrechts
January 29, 2007
NERA Economic Consulting Suite 1950 777 South Figueroa Street Los Angeles, California 90017 Tel: +1 213 346 3000 Fax: +1 213 346 3030 www.nera.com
NERA Economic Consulting
i
TABLE OF CONTENTS
I. INTRODUCTION...............................................................................................................1
II. SELECTION OF COSTING/PRICING PERIODS ............................................................3
III. MARGINAL DISTRIBUTION COSTS .............................................................................4 A. Distribution Substation and Trunk-line Feeder Costs .........................................................6 B. Local Distribution Facility Investment................................................................................8 C. Meter and Service Drop Investment....................................................................................9 D. Distribution Operation and Maintenance Expenses ..........................................................10
IV. MARGINAL CUSTOMER-RELATED EXPENSES.......................................................14 A. Customer Accounts Expenses ...........................................................................................15 B. Customer Service and Informational Expenses.................................................................16
V. OTHER MARGINAL COST ELEMENTS ......................................................................18 A. Administrative and General Expenses...............................................................................18 B. General Plant .....................................................................................................................19 C. Marginal Losses.................................................................................................................19
VI. ECONOMIC CARRYING CHARGES ............................................................................20
VII. ANNUAL DISTRIBUTION MARGINAL COSTS .........................................................22
VIII. MARGINAL GENERATION AND TRANSMISSION COSTS .....................................28 A. Marginal Generation Costs................................................................................................28 B. Marginal Transmission Costs ............................................................................................31
IX. MARGINAL COST REVENUES.....................................................................................37
NERA Economic Consulting
ii
SCHEDULES
Schedule 1. Distribution Substation and Trunk-line Feeder Investment.........................................7
Schedule 2. Probability of Peak for Distribution Substation by Costing Period.............................7
Schedule 3. Local Distribution Facilities Investment per kVA of Transformer Capacity ..............9
Schedule 4. Investment per Customer in Meters and Services .....................................................10
Schedule 5. Distribution Substation O&M Expense per kW ........................................................11
Schedule 6. Distribution Facilities O&M Expense per kW of Design Demand ...........................12
Schedule 7. Meter O&M Expense per Weighted Customer..........................................................13
Schedule 8. Annual Meter O&M Expense by Customer Class.....................................................13
Schedule 9. Service O&M Expense per Weighted Customer .......................................................14
Schedule 10. Annual Service O&M Expense by Customer Class ................................................14
Schedule 11. Customer Accounts Expense per Weighted Customer ............................................15
Schedule 12. Customer Accounts Expense by Customer Class ....................................................16
Schedule 13. Customer Service and Informational Expense per Weighted Customer .................17
Schedule 14. Customer Service and Informational Expense by Customer Class .........................17
Schedule 15. Plant and Non-Plant A&G Loaders and General Plant Loader ...............................19
Schedule 16. Economic Carrying Charges....................................................................................21
Schedule 17. Derivation of Annual Distribution Substation and Trunkline Feeder Costs............22
Schedule 18. Derivation of Annual Distribution Facilities Costs .................................................23
Schedule 19. Derivation of Annual Meter, Service and Customer-Related Costs........................25
Schedule 20: Average Marginal Energy Cost Forecast for 2007-2011, by Voltage Level (cents per kWh) .................................................................................................................29
Schedule 21. Average Marginal Capacity Cost Forecast for 2007-2011 by Costing Period and Voltage Level ($ per kW-Mo.) ...................................................................................31
NERA Economic Consulting
iii
Schedule 22. Time-Differentiated Marginal Transmission Costs by Costing Period and Voltage Level ($ per kW)..................................................................................................33
Schedule 23. Summary of Marginal Energy Cost ($ per kWh) and Time-Differentiated Marginal Demand-related Costs by Voltage of Service ($ per kW) .................................34
Schedule 24. Summary of Marginal Generation, Transmission and Distribution Substation Costs by Voltage of Service (cents per kWh) ...................................................................35
Schedule 25: Summary of Monthly Marginal Local Distribution Facilities Costs per KW of Design Demand and Per Customer....................................................................................36
Schedule 26. Summary of Monthly Marginal Customer Costs.....................................................36
Schedule 27. Marginal Cost Revenues Compared to Forecast Revenues at Current Rates..........37
NERA Economic Consulting
1
Newfoundland Power Marginal Costs of Electricity Service Study
I. INTRODUCTION
Newfoundland Power (NP) retained NERA Economic Consulting (NERA) to prepare estimates of its marginal costs of providing electricity service to its customers. NP is a regulated investor-owned electric utility that serves approximately 227,000 customers throughout the island portion of the province of Newfoundland and Labrador.
NP’s marginal source of generation (and transmission) is the Crown corporation Newfoundland and Labrador Hydro (NLH). NP purchases about 90 percent of its electricity requirements from NLH under a regulated wholesale tariff, and generates the balance from its own hydro electric stations. NP requested that for purposes of this study, NERA uses estimates of NLH’s marginal costs of generation and transmission, rather than using NP’s financial marginal costs that are dependent on the structure of NLH’s wholesale tariff, which is currently under review.
NLH manages and expands, as required, all transmission at the 230-kV level, including 230-kV transformers. NLH also manages the rural 138-kV and 66-kV transmission system that was developed as part of the rural electrification program. NP is responsible for managing and expanding the remaining 33-, 66-, and 138-kV facilities; these facilities are included in our analysis of NP’s “distribution” marginal costs.1
This report describes the methods used to estimate NP’s distribution marginal costs, and summarizes the results of the analysis. In addition, it presents the results of the average 2007-2011 NLH marginal generation and transmission cost Base Case scenario, as estimated by NERA in its May 2006 study,2 with a brief explanation of the methods and assumptions used in the computation. Using the average 2007-11 estimates of marginal generation and transmission costs developed in that study, the marginal distribution costs arising from the current analysis, and estimated billing determinants for 2007, we computed marginal cost revenues for all the customer classes served by NP, as illustrated in Section IX of this report. All marginal costs and revenues shown in this report are expressed in 2007 Canadian dollars.
1 However, there is zero marginal cost related to these lines because there was no growth-related NP investment
on 33-, 66-, or 138-kV lines in the last five years and no budget for these components for the next five years. 2 “Newfoundland and Labrador Hydro Marginal Costs of Generation and Transmission. Final Report”, May 2006

NERA Economic Consulting
2
Why estimate marginal costs? There are several reasons. First, economic theory indicates that prices that reflect marginal costs lead to the most efficient allocation of society’s scarce resources. Many economists believe that efficient resource allocation should be one of the goals of price setting in a regulated industry. Second, in the increasingly competitive electric utility environment, it is very important to know the marginal costs of providing a wide range of services so a utility can ensure that its own promotional efforts and strategic plans are prudent. Finally, accurate estimates of marginal costs are essential for determining the benefits of load management, distributed generation and conservation programs, for the design of special contracts for individual customers, and for engineering studies such as acceptable loss levels in transformer specifications.
Marginal cost is defined as the change in total cost with respect to a small change in output. To quantify the marginal costs of electricity service one must ask and answer the question: What are all the additional costs that would be incurred with changes in kilowatt-hours of energy, kilowatts of demand, and number of customers of various types? Given the characteristics of electricity supply and demand, the cost of additional consumption may differ depending upon the time of the change in output. As a result, it is important to estimate time-differentiated marginal costs of electricity service. NERA determines the marginal cost of electricity by examining the system planners’ and operators’ response to load changes at different times of the day and year. Our method is not a formula, but a series of guidelines outlining what should be measured and how the measurement can be made.

NERA Economic Consulting
3
II. SELECTION OF COSTING/PRICING PERIODS
In the May 2006 study for NLH, NERA developed hourly marginal cost estimates for generation capacity, energy and transmission. In this study for NP, NERA developed time-differentiated hourly costs of distribution substations and trunkline feeders. These hourly estimates can be aggregated by daily and seasonal periods to meet the requirements of any marginal cost application, including recommendations for improving the cost-reflectiveness of NP’s rates.
NERA develops costing/pricing periods that are efficient (by grouping hours of similar cost), administratively feasible, and likely to be appropriate for a significant number of years. The initial process used to develop the recommended costing/pricing periods was to sum all the time-varying marginal costs (generation capacity and energy, transmission, and distribution substation and trunkline feeder) for each hour, and to use regression analysis to determine a set of seasons and periods within seasons that minimizes the squared differences between the individual hourly costs and the average for the period. After several tests, NERA and NP agreed to use the same periods that NERA had previously developed for NLH. There were other period choices with slightly better R-square, e.g., with three diurnal periods in winter. Those alternatives were capturing variation introduced by NP’s marginal distribution substation costs. However, NP decided that giving up some efficiency was justified by the convenience and simplicity of using periods developed for NLH’s wholesale customers. The resulting costing periods (Newfoundland time) are described below.
Table 1. Costing Periods3
Winter: January – March and December
Peak: Weekdays, 7:00 am to 12:00 pm & 4:00 pm to 8:00 pm.
Off-Peak: All remaining hours.
Non-Winter: April - November
No time-of-day differentiation.
3 Holidays are treated as the day of the week on which they fall. The costing periods analysis developed for both
NLH and NP showed better statistical results when holidays were treated as normal days as opposed to being treated as Sundays.
NERA Economic Consulting
4
III. MARGINAL DISTRIBUTION COSTS
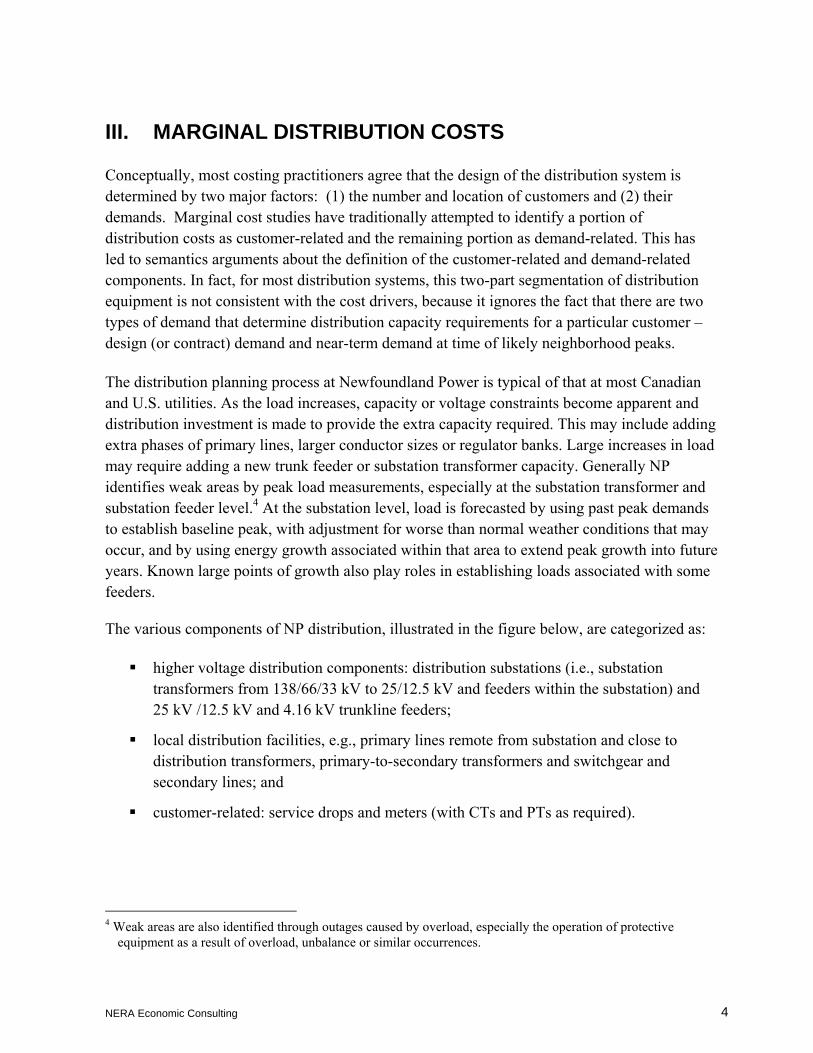
Conceptually, most costing practitioners agree that the design of the distribution system is determined by two major factors: (1) the number and location of customers and (2) their demands. Marginal cost studies have traditionally attempted to identify a portion of distribution costs as customer-related and the remaining portion as demand-related. This has led to semantics arguments about the definition of the customer-related and demand-related components. In fact, for most distribution systems, this two-part segmentation of distribution equipment is not consistent with the cost drivers, because it ignores the fact that there are two types of demand that determine distribution capacity requirements for a particular customer – design (or contract) demand and near-term demand at time of likely neighborhood peaks.
The distribution planning process at Newfoundland Power is typical of that at most Canadian and U.S. utilities. As the load increases, capacity or voltage constraints become apparent and distribution investment is made to provide the extra capacity required. This may include adding extra phases of primary lines, larger conductor sizes or regulator banks. Large increases in load may require adding a new trunk feeder or substation transformer capacity. Generally NP identifies weak areas by peak load measurements, especially at the substation transformer and substation feeder level.4 At the substation level, load is forecasted by using past peak demands to establish baseline peak, with adjustment for worse than normal weather conditions that may occur, and by using energy growth associated within that area to extend peak growth into future years. Known large points of growth also play roles in establishing loads associated with some feeders.
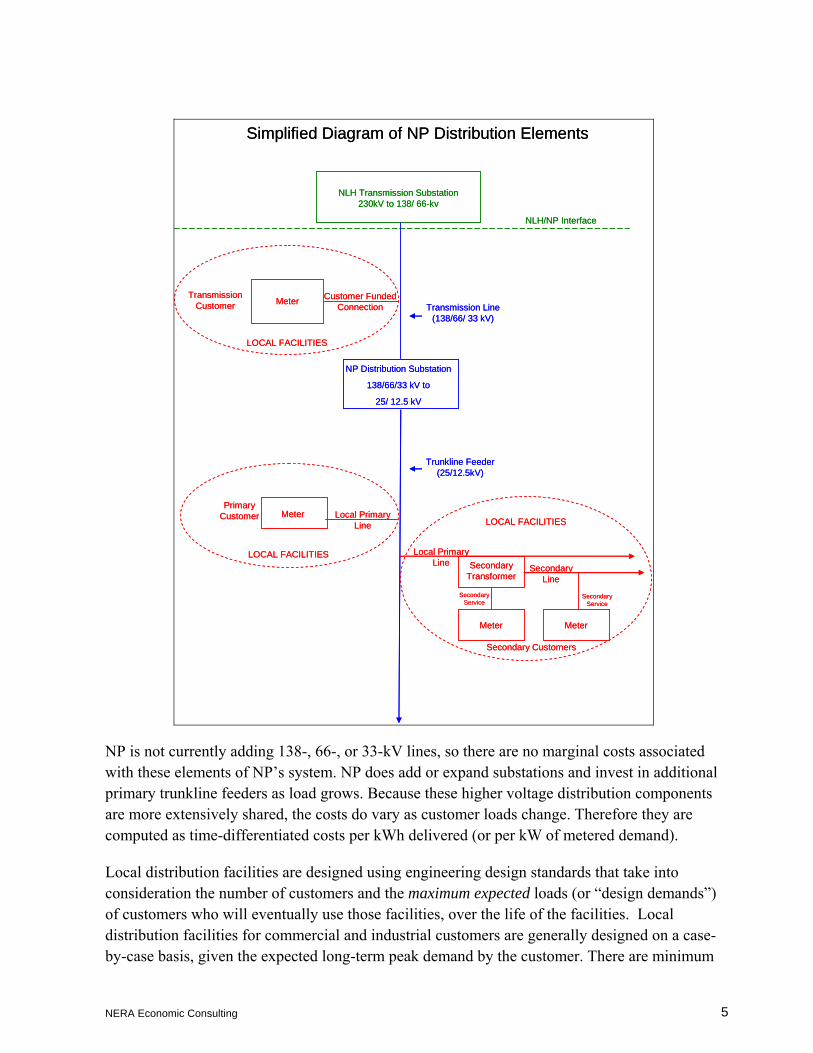
The various components of NP distribution, illustrated in the figure below, are categorized as:
higher voltage distribution components: distribution substations (i.e., substation transformers from 138/66/33 kV to 25/12.5 kV and feeders within the substation) and 25 kV /12.5 kV and 4.16 kV trunkline feeders;
local distribution facilities, e.g., primary lines remote from substation and close to distribution transformers, primary-to-secondary transformers and switchgear and secondary lines; and
customer-related: service drops and meters (with CTs and PTs as required).
4 Weak areas are also identified through outages caused by overload, especially the operation of protective
equipment as a result of overload, unbalance or similar occurrences.
NERA Economic Consulting
5
Simplified Diagram of NP Distribution Elements
NLH Transmission Substation 230kV to 138/ 66-kv
Meter
MeterMeter
Meter
NP Distribution Substation
138/66/33 kV to
25/ 12.5 kV
Secondary Transformer
Customer Funded Connection
Transmission Customer
LOCAL FACILITIES
LOCAL FACILITIES
LOCAL FACILITIES
Transmission Line (138/66/ 33 kV)
Trunkline Feeder (25/12.5kV)
Local Primary Line
Local Primary Line
Secondary Customers
Secondary Line
Primary Customer
NLH/NP Interface
Secondary Service
Secondary Service
NP is not currently adding 138-, 66-, or 33-kV lines, so there are no marginal costs associated with these elements of NP’s system. NP does add or expand substations and invest in additional primary trunkline feeders as load grows. Because these higher voltage distribution components are more extensively shared, the costs do vary as customer loads change. Therefore they are computed as time-differentiated costs per kWh delivered (or per kW of metered demand).
Local distribution facilities are designed using engineering design standards that take into consideration the number of customers and the maximum expected loads (or “design demands”) of customers who will eventually use those facilities, over the life of the facilities. Local distribution facilities for commercial and industrial customers are generally designed on a case-by-case basis, given the expected long-term peak demand by the customer. There are minimum
NERA Economic Consulting
6
conductor sizes specified for primary, with larger sizes specified as required. If a new load is very large, it might require its own feeder. However, in most cases there would be adequate capacity within the trunk feeder system to accommodate the increased load.
Because the marginal cost of local distribution facilities is incurred based on design demand, and does not vary with a customer’s actual peak load from month to month, these costs are computed as a fixed monthly cost per kW of design (or contract) demand. Design demand can be represented by some proxy, such as transformer capacity, contract capacity or actual peak in the past twelve months, in the case where the billing system does not have a record of design demand. Meters and service drops in most cases serve a single customer. The service drop, along with the meter and associated equipment is treated as part of the marginal customer cost for each class.
A. Distribution Substation and Trunk-line Feeder Costs
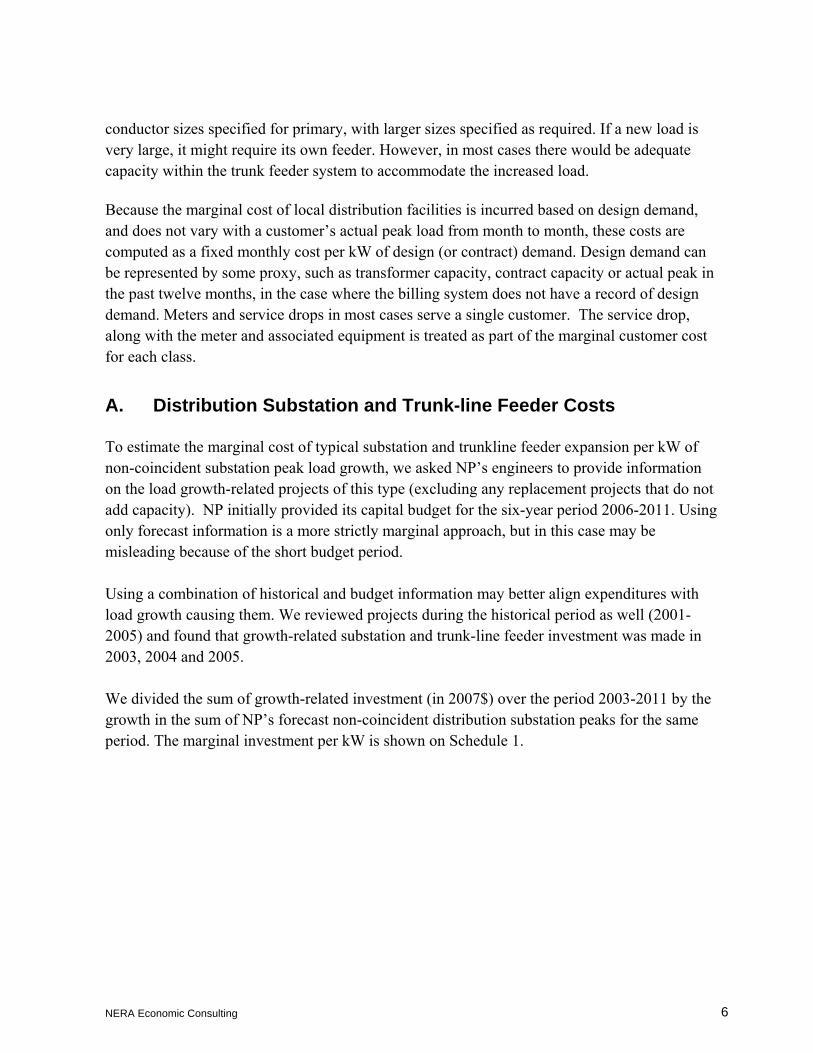
To estimate the marginal cost of typical substation and trunkline feeder expansion per kW of non-coincident substation peak load growth, we asked NP’s engineers to provide information on the load growth-related projects of this type (excluding any replacement projects that do not add capacity). NP initially provided its capital budget for the six-year period 2006-2011. Using only forecast information is a more strictly marginal approach, but in this case may be misleading because of the short budget period. Using a combination of historical and budget information may better align expenditures with load growth causing them. We reviewed projects during the historical period as well (2001-2005) and found that growth-related substation and trunk-line feeder investment was made in 2003, 2004 and 2005. We divided the sum of growth-related investment (in 2007$) over the period 2003-2011 by the growth in the sum of NP’s forecast non-coincident distribution substation peaks for the same period. The marginal investment per kW is shown on Schedule 1.
NERA Economic Consulting
7
Schedule 1. Distribution Substation and Trunk-line Feeder Investment
(1) Investment in Growth-Related Additions toDistribution Substation Plant, 2003-2011(Thousands of 2007 Dollars) $9,227
(2) Estimated Distribution SubstationNon-coincident Peak Load Growth, 2003-2011(MVA) 188.11
(3) Marginal Investment in Growth-RelatedDistribution Substation Facilities perNon-Coincident Kilowatt(2007 Dollars) (1) / (2) $49.05
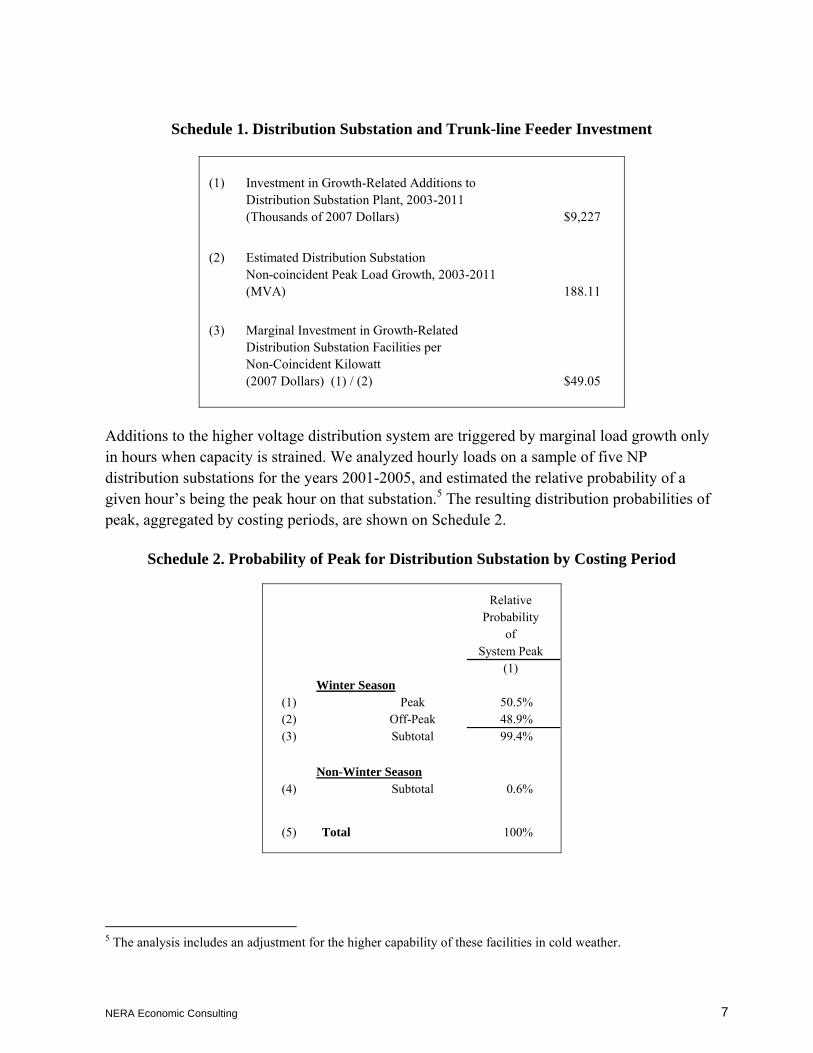
Additions to the higher voltage distribution system are triggered by marginal load growth only in hours when capacity is strained. We analyzed hourly loads on a sample of five NP distribution substations for the years 2001-2005, and estimated the relative probability of a given hour’s being the peak hour on that substation.5 The resulting distribution probabilities of peak, aggregated by costing periods, are shown on Schedule 2.
Schedule 2. Probability of Peak for Distribution Substation by Costing Period
RelativeProbability
ofSystem Peak
(1)Winter Season
(1) Peak 50.5%(2) Off-Peak 48.9%(3) Subtotal 99.4%
Non-Winter Season(4) Subtotal 0.6%
(5) Total 100%
5 The analysis includes an adjustment for the higher capability of these facilities in cold weather.
NERA Economic Consulting
8
B. Local Distribution Facility Investment
NP provided estimates of the typical investment in secondary lines, transformers, and local primary lines for various types and sizes of customers, by looking at recent distribution work orders for each rate class. The rate classes and categories within classes considered in this study are:
(1) Rate 1.1 - Residential (with customer-related cost differentiated for customers with services ≤ 200 Amps and customers with services > 200 Amps, as requested by NP)
(2) Rate 2.1 - General Service 0-10 kW
(3) Rate 2.2 - General Service 10-100 kW (110 kVA)
(4) Rate 2.3 - General Service 110-1000 kVA (transmission, secondary and primary)
(5) Rate 2.4 - General Service 1000 kVA and over (transmission, secondary and primary).
NP provided separate weights for each of the categories within the class, e.g., facilities with single versus three-phase service, as well as rural versus urban facilities. NP also provided costs and weights for specific residential customer types, e.g., apartments and single-family houses. Each sample distribution customer addition identified the size of the transformer and the number of customers expected to be accommodated. We used the average transformer kVA per customer as a measure of the customer’s design demand. With this information it was possible to develop a weighted average distribution facility cost per customer as well as per kVA of design demand, by category within each class.
The distribution facilities investments for residential and non-residential customer categories, stated in 2007 dollars, are shown on Schedule 3. NP’s Primary customers (under rate 2.3 and 2.4) always provide their own step-down transformer (distribution primary voltage to usage voltage) and any necessary secondary equipment, including service drops. Generally NP’s transmission customers provide the facilities they use to tap into NP’s transmission system. Therefore, this study includes no estimate of marginal local facilities costs for them.

NERA Economic Consulting
9
Schedule 3. Local Distribution Facilities Investment per kVA of Transformer Capacity
AverageInvestment
Rate Customer Class per kVa (2007 Dollars)
(1)(1) 1.1 Domestic Service $167.26
(2) 2.1 General Service 0-10 kW $173.62
(3) 2.2 General Service 10-100 kW (110 kVa) $118.77
(4) 2.3 General Service 110 kVa-1000 kVaTransmission -
Primary $16.27Secondary $78.10
(5) 2.4 General Service 1000 kVa and overTransmission -
Primary $5.42Secondary $33.50
C. Meter and Service Drop Investment
The distribution facilities cost samples provided by NP included the installed cost of service drop and meter, including labor and materials. The meter (and associated equipment, including CT and PT when required) and service drop (secondary wiring at 600V or below) costs were weighted by customer numbers of each type whenever aggregation was required. As mentioned before, NP’s Primary and Transmission customers are required to supply and own their service drops and associated equipment. The meter and service drop marginal investments, stated in 2007 dollars, are shown on Schedule 4.

NERA Economic Consulting
10
Schedule 4. Investment per Customer in Meters and Services
Meter ServiceRate Description Investment Investment
(1) (2)
1.1 Domestic Service (average) $58.47 $262.22
200 Amps and below $55.71 $261.95
>200 Amp $757.50 $330.79
2.1 General Service 0-10 kW $81.10 $267.54
2.2 General Service 10-100 kW (110 kVa) $423.61 $278.30
2.3 General Service 110-1000 kVaTransmission $19,383.34 -
Primary $10,355.44 - Secondary $2,545.19 221.07
2.4 General Service 1000 kVa and overTransmission $19,383.34 -
Primary $11,370.25 - Secondary $5,578.82 -
(2007$ per Customer)
D. Distribution Operation and Maintenance Expenses
Distribution O&M expenses depend on the amount of plant in service. The addition of distribution equipment to meet increments in customers or design load or peak substation load gives rise to increased O&M expenses as well. Distribution O&M expenses are, therefore, marginal costs. NP provided a forecast of 2006 and 2007 distribution O&M expenses and we reviewed historical expense for the period 2003-2005.
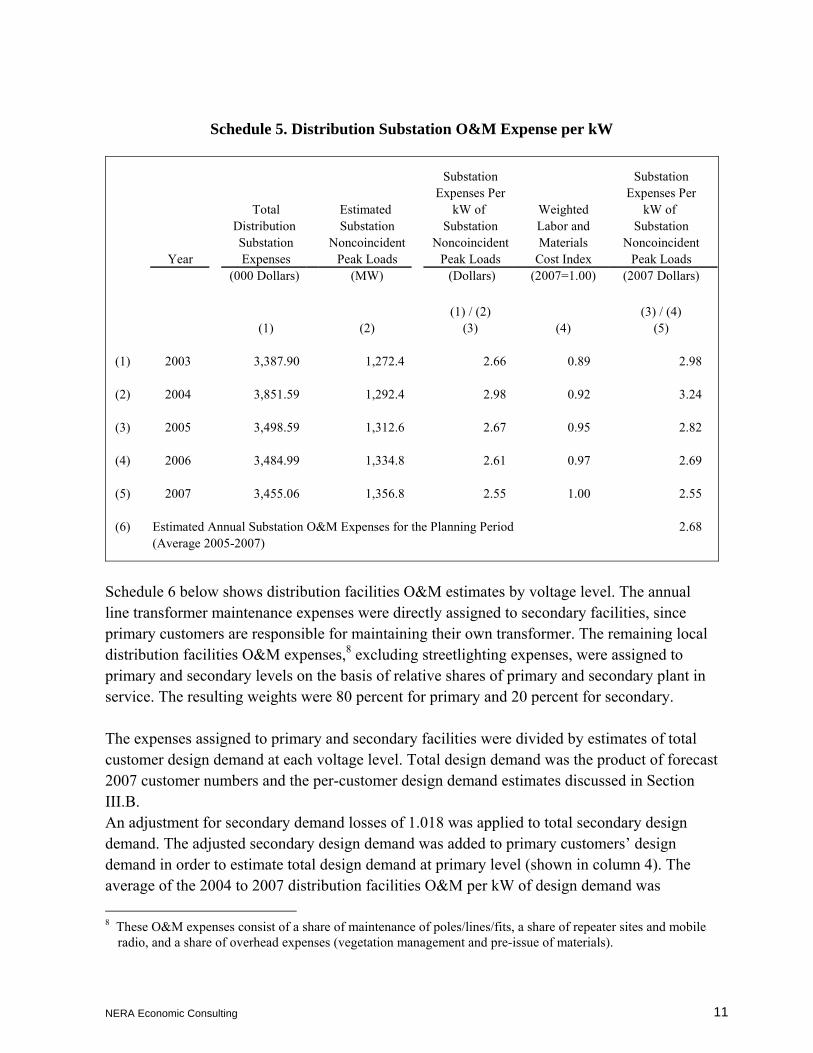
The average distribution substation and trunkline feeder O&M expenses6 for the years 2003 to 2007 were divided by the sum of NP’s weather-normalized non-coincident peak demands at the substations.7 We used the average of these annual values for 2005-2007 as our estimate of marginal expenses because there was a substantial drop after 2004. This approach is based on the assumption that average distribution O&M in 2005-2007 is a reasonable estimate of the marginal level of these expenses. 6 These expenses include distribution substation O&M, SCADA expenses, a share of maintenance of
lines/poles/fits expenses, and a share of overhead expenses (vegetation management and pre-issue of materials). 7 NERA estimated the historical weather-normalized NCPs based on the 2005 forecast NCP (provided by NP) and
the average annual growth rate assumed in the 2005-2010 forecasts provided by NP.
NERA Economic Consulting
11
Schedule 5. Distribution Substation O&M Expense per kW
Substation Substation Expenses Per Expenses Per
Total Estimated kW of Weighted kW of Distribution Substation Substation Labor and Substation Substation Noncoincident Noncoincident Materials Noncoincident
Year Expenses Peak Loads Peak Loads Cost Index Peak Loads(000 Dollars) (MW) (Dollars) (2007=1.00) (2007 Dollars)
(1) / (2) (3) / (4) (1) (2) (3) (4) (5)
(1) 2003 3,387.90 1,272.4 2.66 0.89 2.98
(2) 2004 3,851.59 1,292.4 2.98 0.92 3.24
(3) 2005 3,498.59 1,312.6 2.67 0.95 2.82
(4) 2006 3,484.99 1,334.8 2.61 0.97 2.69
(5) 2007 3,455.06 1,356.8 2.55 1.00 2.55
(6) Estimated Annual Substation O&M Expenses for the Planning Period 2.68(Average 2005-2007)
Schedule 6 below shows distribution facilities O&M estimates by voltage level. The annual line transformer maintenance expenses were directly assigned to secondary facilities, since primary customers are responsible for maintaining their own transformer. The remaining local distribution facilities O&M expenses,8 excluding streetlighting expenses, were assigned to primary and secondary levels on the basis of relative shares of primary and secondary plant in service. The resulting weights were 80 percent for primary and 20 percent for secondary. The expenses assigned to primary and secondary facilities were divided by estimates of total customer design demand at each voltage level. Total design demand was the product of forecast 2007 customer numbers and the per-customer design demand estimates discussed in Section III.B. An adjustment for secondary demand losses of 1.018 was applied to total secondary design demand. The adjusted secondary design demand was added to primary customers’ design demand in order to estimate total design demand at primary level (shown in column 4). The average of the 2004 to 2007 distribution facilities O&M per kW of design demand was 8 These O&M expenses consist of a share of maintenance of poles/lines/fits, a share of repeater sites and mobile
radio, and a share of overhead expenses (vegetation management and pre-issue of materials).

NERA Economic Consulting
12
assumed to be a reasonable estimate of the marginal level of these expenses by voltage level. The marginal distribution facilities O&M expense for a customer served at secondary voltage is calculated as the sum of loss-adjusted primary line O&M expense and secondary line O&M expense.
Schedule 6. Distribution Facilities O&M Expense per kW of Design Demand
Distribution LineLine Transformer
O&M Expenses O&M At Secondary At Primary Secondary Primary('000 Dollars) ('000 Dollars)
[(1) x 0.20 +(2)/ (3)] [(1) x 0.80/ (4)]
(1) (2) (3) (4) (5) (6)
(1) 2003 2,603.28 336.59 2,641.20 2,800.19 $0.32 $0.74
(2) 2004 2,922.30 265.19 2,676.64 2,834.77 $0.32 $0.82
(3) 2005 2,880.57 250.24 2,717.00 2,873.85 $0.30 $0.80
(4) 2006 3,162.55 283.74 2,744.15 2,903.49 $0.33 $0.87
(5) 2007 3,088.50 280.00 2,769.69 2,929.98 $0.32 $0.84
(6) Estimated Distribution Facilities O&M for a Primary CustomerCol. (6), average Years 2004 to 2007 O&M $0.84
(7) Loss Adjustment Factor for Use of Primary Lines by Secondary Customers 1.018
(8) Loss Adjusted Estimated Primary Lines O&M Expenses for Secondary Customers Line (6) * Line (7) $0.85
(9) Estimated Secondary Distribution Facilities O&M per kWCol. (5) Average Years 2004 to 2007 O&M $0.32
(10) Total Estimated Distribution Facilities Line O&M for a Secondary Customer. Line (8) + Line (9) $1.17
Design Demand
(2007$)(MW)
Total Estimated Dist. Facilities O&M Expense
Per kW ofDesign Demand
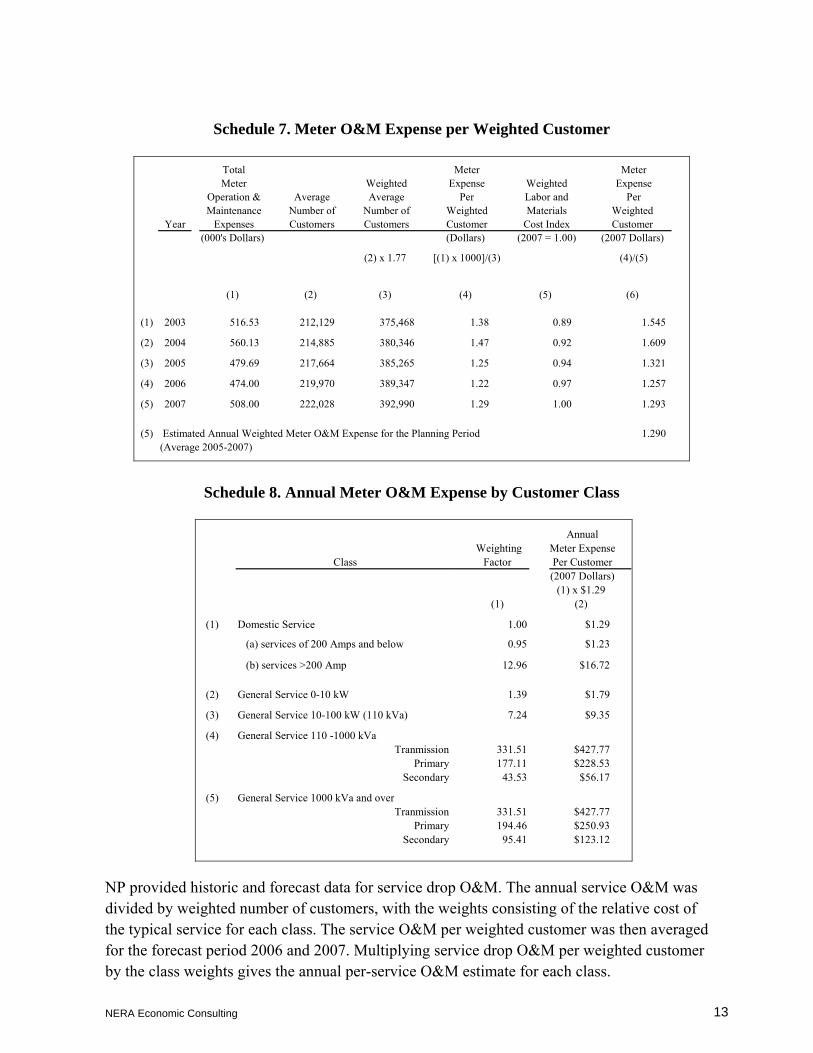
The annual meter O&M was divided by weighted number of customers, with the weights consisting of the relative cost of the typical meter for each class. The average of the 2005 to 2007 O&M per weighted customer was assumed to be a reasonable estimate of the marginal level of these expenses. Multiplying meter O&M per weighted customer by the class weights gives the annual per-meter O&M estimate for each class. Schedules 7 and 8 illustrate these calculations.
NERA Economic Consulting
13
Schedule 7. Meter O&M Expense per Weighted Customer
Total Meter Meter Meter Weighted Expense Weighted Expense
Operation & Average Average Per Labor and Per Maintenance Number of Number of Weighted Materials Weighted
Year Expenses Customers Customers Customer Cost Index Customer(000's Dollars) (Dollars) (2007 = 1.00) (2007 Dollars)
(2) x 1.77 [(1) x 1000]/(3) (4)/(5)
(1) (2) (3) (4) (5) (6)
(1) 2003 516.53 212,129 375,468 1.38 0.89 1.545
(2) 2004 560.13 214,885 380,346 1.47 0.92 1.609
(3) 2005 479.69 217,664 385,265 1.25 0.94 1.321
(4) 2006 474.00 219,970 389,347 1.22 0.97 1.257
(5) 2007 508.00 222,028 392,990 1.29 1.00 1.293
(5) Estimated Annual Weighted Meter O&M Expense for the Planning Period 1.290(Average 2005-2007)
Schedule 8. Annual Meter O&M Expense by Customer Class
Annual Weighting Meter Expense
Class Factor Per Customer (2007 Dollars)
(1) x $1.29(1) (2)
(1) Domestic Service 1.00 $1.29
(a) services of 200 Amps and below 0.95 $1.23
(b) services >200 Amp 12.96 $16.72
(2) General Service 0-10 kW 1.39 $1.79
(3) General Service 10-100 kW (110 kVa) 7.24 $9.35
(4) General Service 110 -1000 kVaTranmission 331.51 $427.77
Primary 177.11 $228.53Secondary 43.53 $56.17
(5) General Service 1000 kVa and overTranmission 331.51 $427.77
Primary 194.46 $250.93Secondary 95.41 $123.12
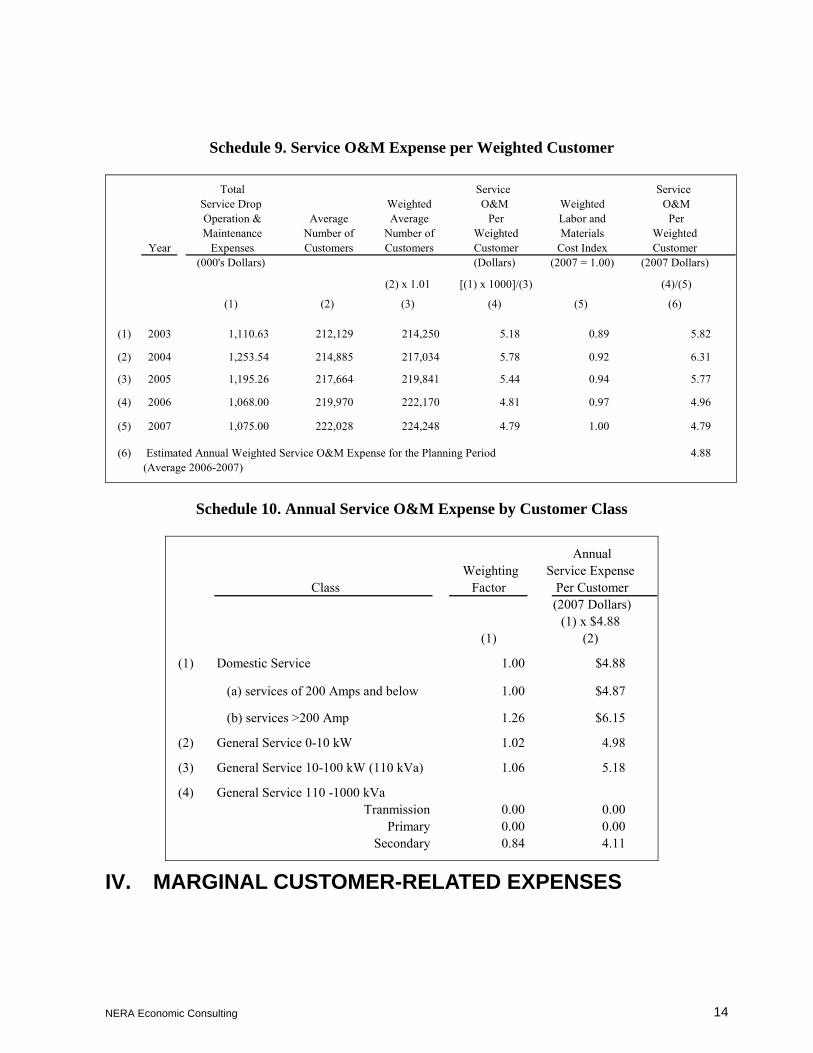
NP provided historic and forecast data for service drop O&M. The annual service O&M was divided by weighted number of customers, with the weights consisting of the relative cost of the typical service for each class. The service O&M per weighted customer was then averaged for the forecast period 2006 and 2007. Multiplying service drop O&M per weighted customer by the class weights gives the annual per-service O&M estimate for each class.
NERA Economic Consulting
14
Schedule 9. Service O&M Expense per Weighted Customer
Total Service Service Service Drop Weighted O&M Weighted O&M Operation & Average Average Per Labor and Per Maintenance Number of Number of Weighted Materials Weighted
Year Expenses Customers Customers Customer Cost Index Customer(000's Dollars) (Dollars) (2007 = 1.00) (2007 Dollars)
(2) x 1.01 [(1) x 1000]/(3) (4)/(5)
(1) (2) (3) (4) (5) (6)
(1) 2003 1,110.63 212,129 214,250 5.18 0.89 5.82
(2) 2004 1,253.54 214,885 217,034 5.78 0.92 6.31
(3) 2005 1,195.26 217,664 219,841 5.44 0.94 5.77
(4) 2006 1,068.00 219,970 222,170 4.81 0.97 4.96
(5) 2007 1,075.00 222,028 224,248 4.79 1.00 4.79
(6) Estimated Annual Weighted Service O&M Expense for the Planning Period 4.88(Average 2006-2007)
Schedule 10. Annual Service O&M Expense by Customer Class
Annual Weighting Service Expense
Class Factor Per Customer (2007 Dollars)
(1) x $4.88(1) (2)
(1) Domestic Service 1.00 $4.88
(a) services of 200 Amps and below 1.00 $4.87
(b) services >200 Amp 1.26 $6.15
(2) General Service 0-10 kW 1.02 4.98
(3) General Service 10-100 kW (110 kVa) 1.06 5.18
(4) General Service 110 -1000 kVaTranmission 0.00 0.00
Primary 0.00 0.00Secondary 0.84 4.11
IV. MARGINAL CUSTOMER-RELATED EXPENSES
NERA Economic Consulting
15
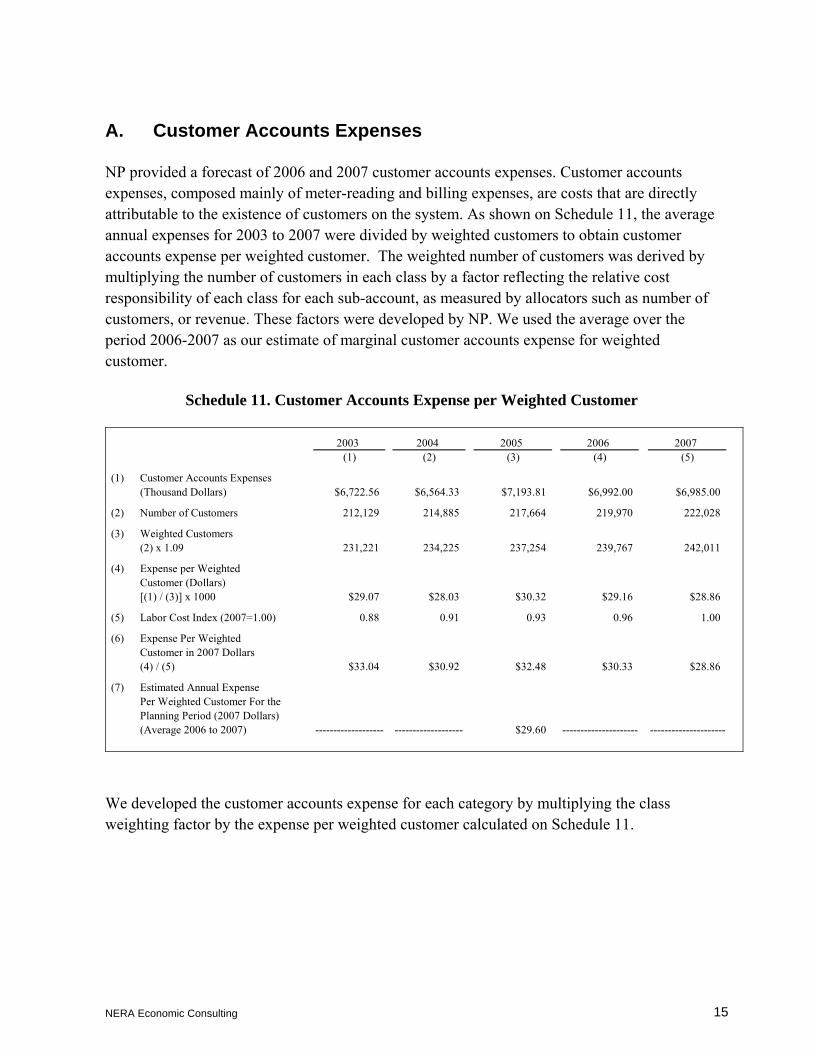
A. Customer Accounts Expenses
NP provided a forecast of 2006 and 2007 customer accounts expenses. Customer accounts expenses, composed mainly of meter-reading and billing expenses, are costs that are directly attributable to the existence of customers on the system. As shown on Schedule 11, the average annual expenses for 2003 to 2007 were divided by weighted customers to obtain customer accounts expense per weighted customer. The weighted number of customers was derived by multiplying the number of customers in each class by a factor reflecting the relative cost responsibility of each class for each sub-account, as measured by allocators such as number of customers, or revenue. These factors were developed by NP. We used the average over the period 2006-2007 as our estimate of marginal customer accounts expense for weighted customer.
Schedule 11. Customer Accounts Expense per Weighted Customer
2003 2004 2005 2006 2007(1) (2) (3) (4) (5)
(1) Customer Accounts Expenses(Thousand Dollars) $6,722.56 $6,564.33 $7,193.81 $6,992.00 $6,985.00
(2) Number of Customers 212,129 214,885 217,664 219,970 222,028
(3) Weighted Customers(2) x 1.09 231,221 234,225 237,254 239,767 242,011
(4) Expense per WeightedCustomer (Dollars)[(1) / (3)] x 1000 $29.07 $28.03 $30.32 $29.16 $28.86
(5) Labor Cost Index (2007=1.00) 0.88 0.91 0.93 0.96 1.00
(6) Expense Per WeightedCustomer in 2007 Dollars(4) / (5) $33.04 $30.92 $32.48 $30.33 $28.86
(7) Estimated Annual ExpensePer Weighted Customer For thePlanning Period (2007 Dollars) (Average 2006 to 2007) ------------------- ------------------- $29.60 --------------------- ---------------------
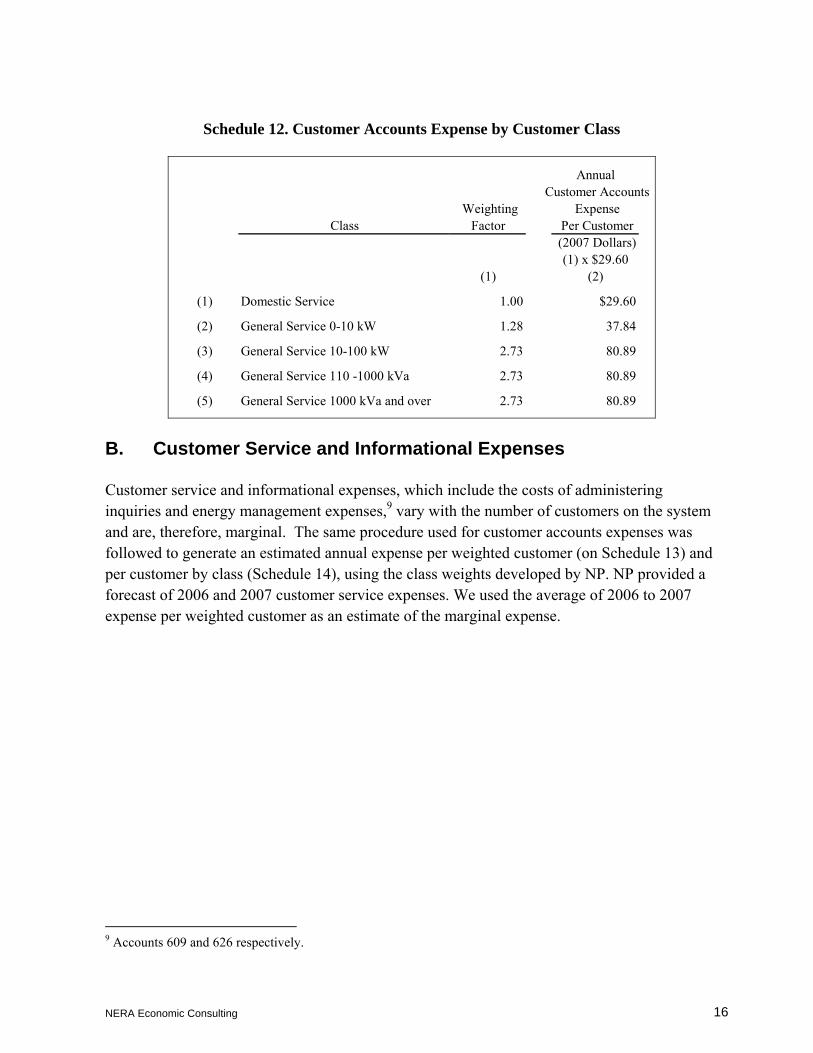
We developed the customer accounts expense for each category by multiplying the class weighting factor by the expense per weighted customer calculated on Schedule 11.
NERA Economic Consulting
16
Schedule 12. Customer Accounts Expense by Customer Class
Annual Customer Accounts
Weighting ExpenseClass Factor Per Customer
(2007 Dollars)(1) x $29.60
(1) (2)
(1) Domestic Service 1.00 $29.60
(2) General Service 0-10 kW 1.28 37.84
(3) General Service 10-100 kW 2.73 80.89
(4) General Service 110 -1000 kVa 2.73 80.89
(5) General Service 1000 kVa and over 2.73 80.89
B. Customer Service and Informational Expenses
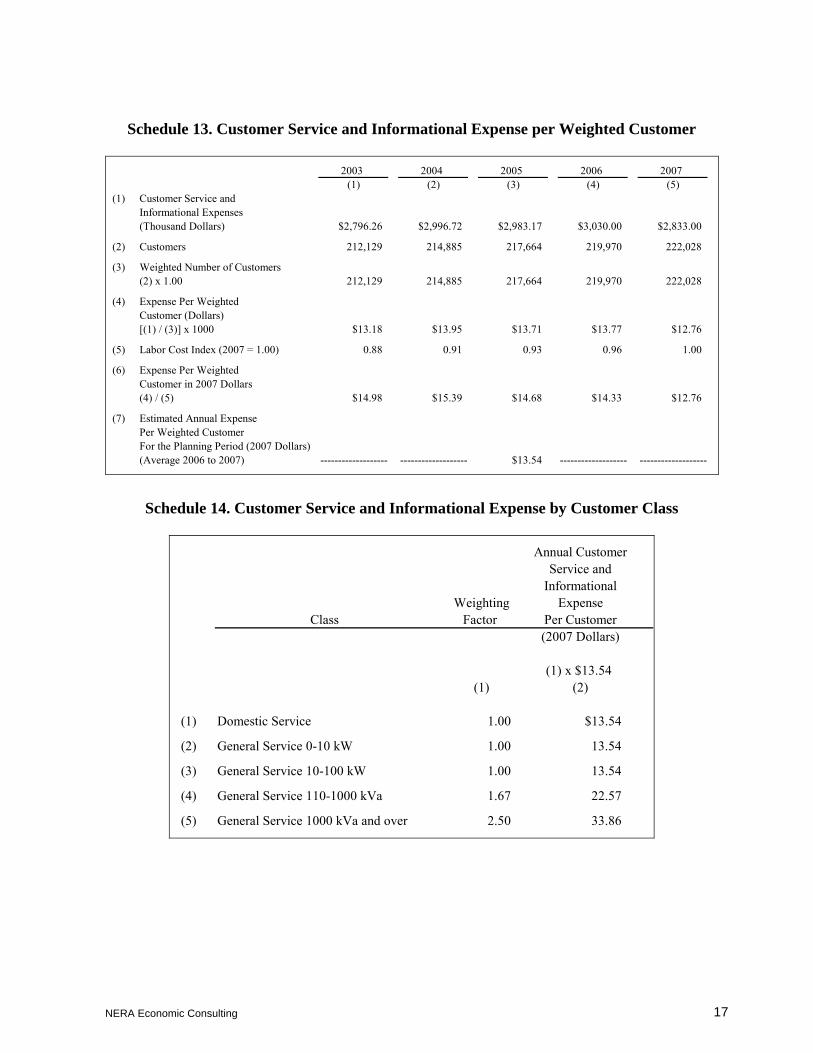
Customer service and informational expenses, which include the costs of administering inquiries and energy management expenses,9 vary with the number of customers on the system and are, therefore, marginal. The same procedure used for customer accounts expenses was followed to generate an estimated annual expense per weighted customer (on Schedule 13) and per customer by class (Schedule 14), using the class weights developed by NP. NP provided a forecast of 2006 and 2007 customer service expenses. We used the average of 2006 to 2007 expense per weighted customer as an estimate of the marginal expense.
9 Accounts 609 and 626 respectively.
NERA Economic Consulting
17
Schedule 13. Customer Service and Informational Expense per Weighted Customer
2003 2004 2005 2006 2007(1) (2) (3) (4) (5)
(1) Customer Service andInformational Expenses(Thousand Dollars) $2,796.26 $2,996.72 $2,983.17 $3,030.00 $2,833.00
(2) Customers 212,129 214,885 217,664 219,970 222,028
(3) Weighted Number of Customers(2) x 1.00 212,129 214,885 217,664 219,970 222,028
(4) Expense Per WeightedCustomer (Dollars)[(1) / (3)] x 1000 $13.18 $13.95 $13.71 $13.77 $12.76
(5) Labor Cost Index (2007 = 1.00) 0.88 0.91 0.93 0.96 1.00
(6) Expense Per WeightedCustomer in 2007 Dollars(4) / (5) $14.98 $15.39 $14.68 $14.33 $12.76
(7) Estimated Annual ExpensePer Weighted Customer For the Planning Period (2007 Dollars) (Average 2006 to 2007) ------------------- ------------------- $13.54 ------------------- -------------------
Schedule 14. Customer Service and Informational Expense by Customer Class
Annual Customer Service and
Informational Weighting Expense
Class Factor Per Customer (2007 Dollars)
(1) x $13.54 (1) (2)
(1) Domestic Service 1.00 $13.54
(2) General Service 0-10 kW 1.00 13.54
(3) General Service 10-100 kW 1.00 13.54
(4) General Service 110-1000 kVa 1.67 22.57
(5) General Service 1000 kVa and over 2.50 33.86
NERA Economic Consulting
18
V. OTHER MARGINAL COST ELEMENTS
A. Administrative and General Expenses
When a utility adds plant and incurs additional O&M expenses, it typically incurs additional overhead expenses as well. Certain administrative and general (A&G) expenses can grow either with plant or with O&M expenses. General plant typically grows with other types of plant. Our marginal cost study includes plant-related and non-plant-related A&G and general plant loaders to capture these elements of marginal cost. Based on our understanding of NP’s classification of costs for administrative and general (A&G) expenses, we divided these expenses into two categories: (1) those associated with other types of expenses and (2) those associated with plant. We excluded accounts not likely to be marginal with respect to other expenses or plant.10
We used a regression analysis of the identified plant-related A&G expenses11 (excluding property insurance) on cumulative gross additions to total plant, all in constant dollars, for the period 1994 to 2005. The coefficient of the explanatory variable represented the additional A&G expenses required per dollar of investment in new plant. A property insurance component of the loader was estimated based on NP’s estimate of the cost of insuring substation plant at replacement cost (7.5 cents of property insurance per $100 of replacement value). Combining the regression result with the property insurance factor yields a plant-related A&G loader applicable to distribution substations of 0.8 percent. The plant-related loader applicable to wires is 0.7 percent.
To estimate the marginal level of non-plant-related A&G expense (e.g., tools and equipment repairs, training and education costs, telephone systems, etc.), we ran a regression of A&G expenses identified as non-plant related and likely to be marginal on total O&M expenses (excluding fuel and purchased power) from 1995 to 2005. The non-plant-related A&G loader was estimated at 69.8 percent. Both plant and non-plant loaders are shown on Schedule 15.
10 We excluded accounts for corporate communications, strategic planning and rates, environmental accounts
(PCB phase out, inspection of PCB storage and environmental policy), which are not marginal. We also considered as non-marginal certain accounts not likely to recur, such as preparation for year 2000 and deferred DSM costs.
11 Environmental spills, WAN, vehicle expenses, planning & maintenance, public liability, insurance, property management as well as total miscellaneous technical and operating costs.
NERA Economic Consulting
19
B. General Plant
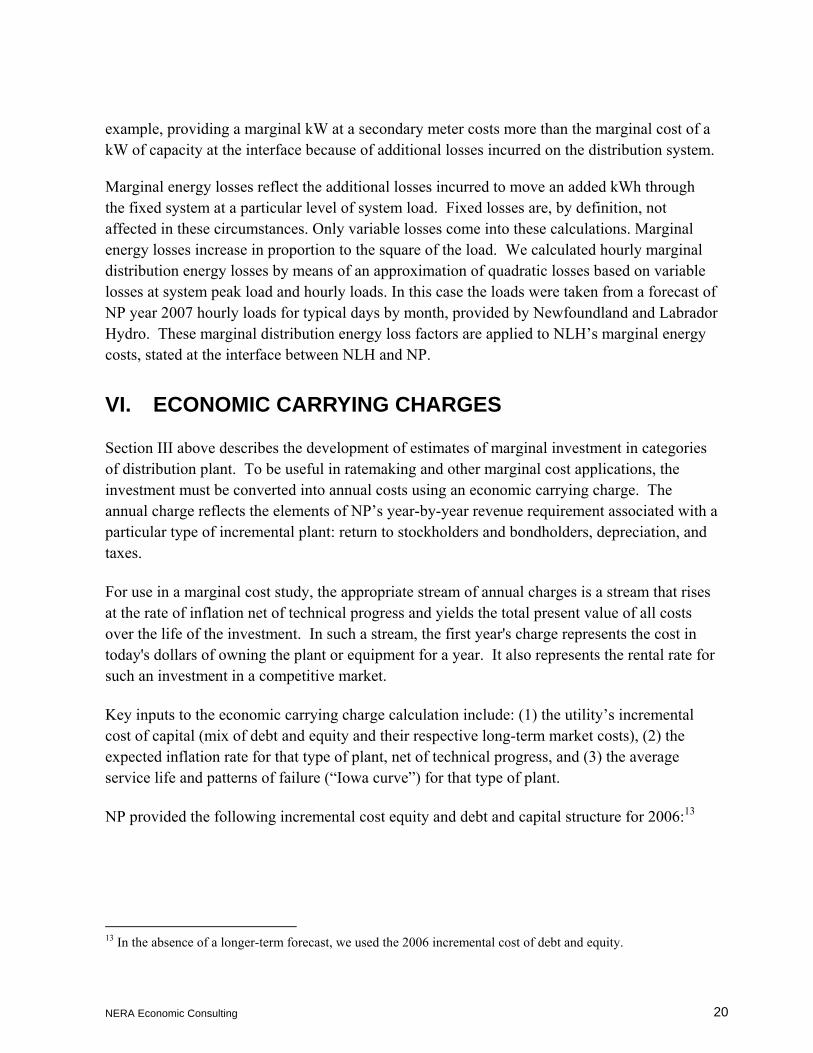
General plant consists of items such as office buildings, warehouses, cars, trucks and other equipment. The need for general plant increases with additions to production, transmission and distribution plant. We used a regression analysis on 15 years of historical and forecast company data (1994 - 2008) to estimate a marginal general plant loader. Cumulative net additions to general plant in service were regressed on cumulative net additions to total plant (less general plant) in service over the period 1994 to 2008, all in constant dollars. The coefficient for the explanatory variable, shown on Schedule 15, is the loader applicable to marginal distribution plant.
Schedule 15. Plant and Non-Plant A&G Loaders and General Plant Loader
Estimate ofLoadingFactor
Administrative and General Expensesand Social Security and Unemployment Taxes
(1) Applicable to Non-Plant-Related Expenses 69.81%
(2) Applicable to Plant-Related Expenses (substations) 0.78%
(3) Applicable to Plant-Related Expenses (wires and poles) 0.70%
(4) General Plant & the Electric Share of Common Plant 7.96%
C. Marginal Losses
The marginal demand-related distribution loss calculations in this study are based on variable and fixed distribution losses at time of system peak at each voltage level of service. Marginal capacity losses reflect the fact that, to accommodate a kW of additional peak load at the customer’s meter, facilities must be expanded by successively more than a kW as you move upstream to accommodate the fixed and variable losses on the system in the peak hour. Peak capacity loss factors were developed from NP’s most recent available loss study.12 The demand-related losses on the distribution system are applied to distribution costs above local facilities as well as to transmission and generation capacity costs stated at the interface between NP and NLH. The latter application is required because these losses are multiplicative; for
12 NP provided the file “System Loss Study 2005”, which contains a detailed breakdown of energy and demand
loss factors at various loads for year 2005.
NERA Economic Consulting
20
example, providing a marginal kW at a secondary meter costs more than the marginal cost of a kW of capacity at the interface because of additional losses incurred on the distribution system.
Marginal energy losses reflect the additional losses incurred to move an added kWh through the fixed system at a particular level of system load. Fixed losses are, by definition, not affected in these circumstances. Only variable losses come into these calculations. Marginal energy losses increase in proportion to the square of the load. We calculated hourly marginal distribution energy losses by means of an approximation of quadratic losses based on variable losses at system peak load and hourly loads. In this case the loads were taken from a forecast of NP year 2007 hourly loads for typical days by month, provided by Newfoundland and Labrador Hydro. These marginal distribution energy loss factors are applied to NLH’s marginal energy costs, stated at the interface between NLH and NP.
VI. ECONOMIC CARRYING CHARGES
Section III above describes the development of estimates of marginal investment in categories of distribution plant. To be useful in ratemaking and other marginal cost applications, the investment must be converted into annual costs using an economic carrying charge. The annual charge reflects the elements of NP’s year-by-year revenue requirement associated with a particular type of incremental plant: return to stockholders and bondholders, depreciation, and taxes.
For use in a marginal cost study, the appropriate stream of annual charges is a stream that rises at the rate of inflation net of technical progress and yields the total present value of all costs over the life of the investment. In such a stream, the first year's charge represents the cost in today's dollars of owning the plant or equipment for a year. It also represents the rental rate for such an investment in a competitive market.
Key inputs to the economic carrying charge calculation include: (1) the utility’s incremental cost of capital (mix of debt and equity and their respective long-term market costs), (2) the expected inflation rate for that type of plant, net of technical progress, and (3) the average service life and patterns of failure (“Iowa curve”) for that type of plant.
NP provided the following incremental cost equity and debt and capital structure for 2006:13
13 In the absence of a longer-term forecast, we used the 2006 incremental cost of debt and equity.
NERA Economic Consulting
21
Share % Cost %
Common Equity 45.00 9.24
Debt 55.00 5.44
Average Incremental Cost of Capital
7.15
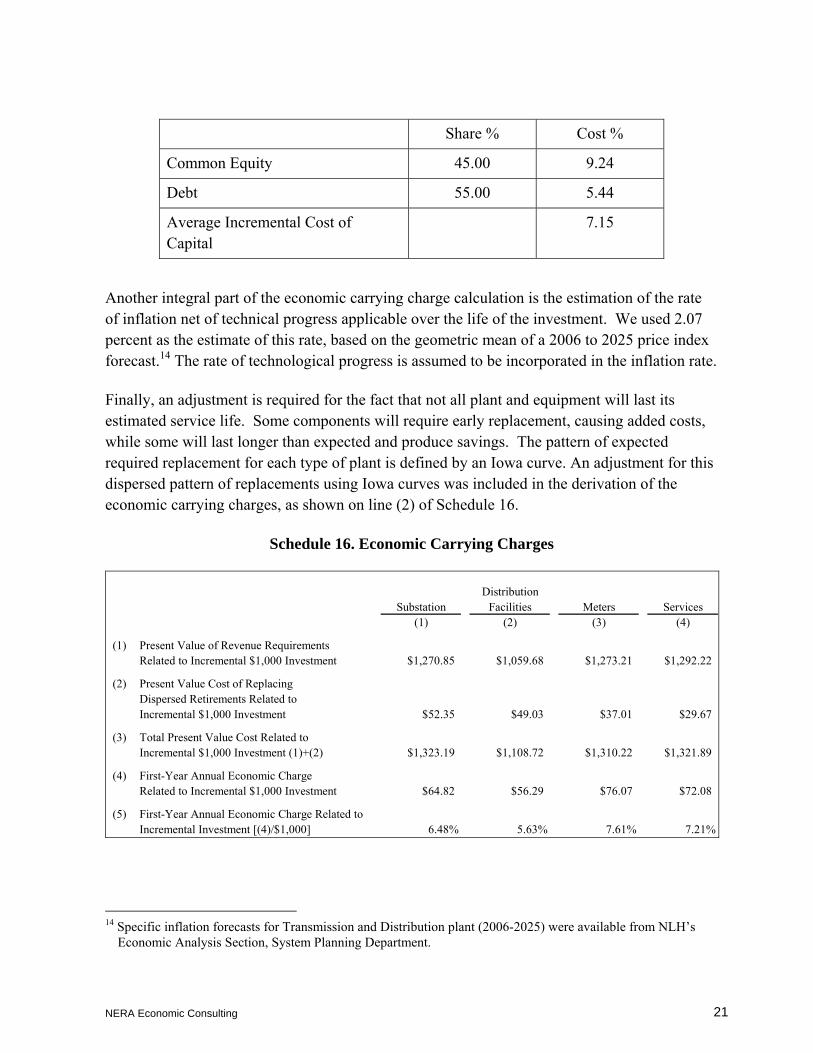
Another integral part of the economic carrying charge calculation is the estimation of the rate of inflation net of technical progress applicable over the life of the investment. We used 2.07 percent as the estimate of this rate, based on the geometric mean of a 2006 to 2025 price index forecast.14 The rate of technological progress is assumed to be incorporated in the inflation rate.
Finally, an adjustment is required for the fact that not all plant and equipment will last its estimated service life. Some components will require early replacement, causing added costs, while some will last longer than expected and produce savings. The pattern of expected required replacement for each type of plant is defined by an Iowa curve. An adjustment for this dispersed pattern of replacements using Iowa curves was included in the derivation of the economic carrying charges, as shown on line (2) of Schedule 16.
Schedule 16. Economic Carrying Charges
DistributionSubstation Facilities Meters Services
(1) (2) (3) (4)
(1) Present Value of Revenue RequirementsRelated to Incremental $1,000 Investment $1,270.85 $1,059.68 $1,273.21 $1,292.22
(2) Present Value Cost of ReplacingDispersed Retirements Related toIncremental $1,000 Investment $52.35 $49.03 $37.01 $29.67
(3) Total Present Value Cost Related toIncremental $1,000 Investment (1)+(2) $1,323.19 $1,108.72 $1,310.22 $1,321.89
(4) First-Year Annual Economic ChargeRelated to Incremental $1,000 Investment $64.82 $56.29 $76.07 $72.08
(5) First-Year Annual Economic Charge Related toIncremental Investment [(4)/$1,000] 6.48% 5.63% 7.61% 7.21%
14 Specific inflation forecasts for Transmission and Distribution plant (2006-2025) were available from NLH’s
Economic Analysis Section, System Planning Department.
NERA Economic Consulting
22
VII. ANNUAL DISTRIBUTION MARGINAL COSTS
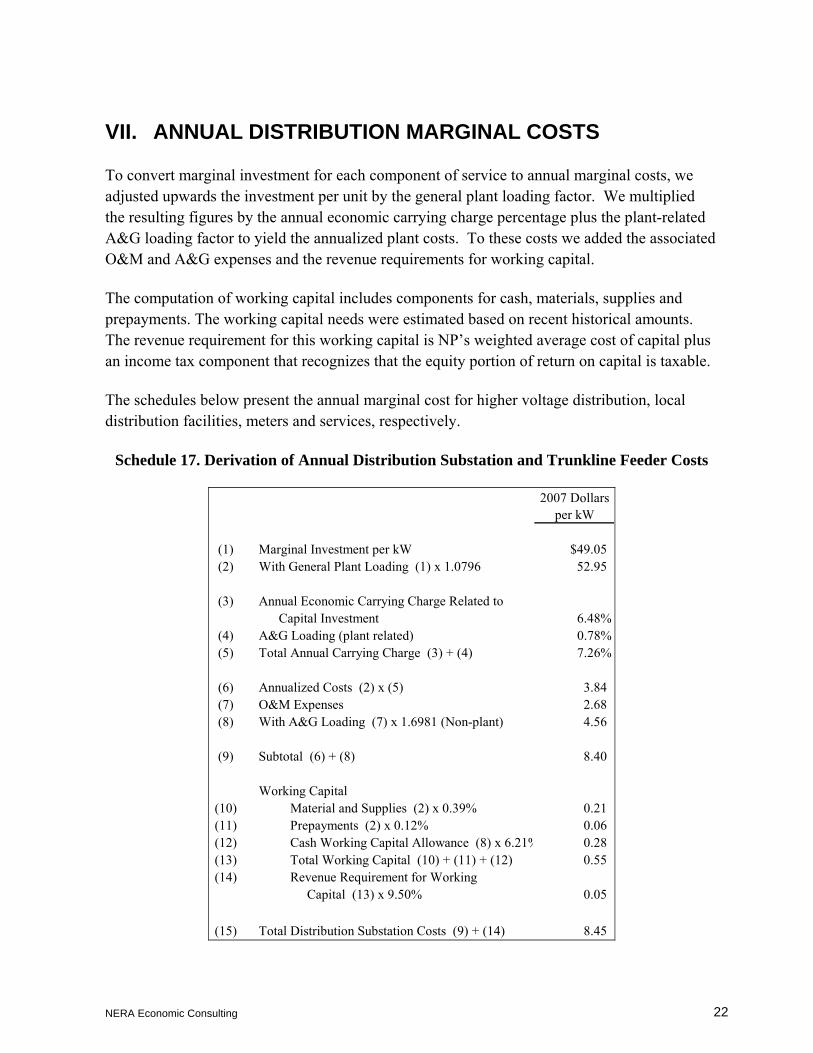
To convert marginal investment for each component of service to annual marginal costs, we adjusted upwards the investment per unit by the general plant loading factor. We multiplied the resulting figures by the annual economic carrying charge percentage plus the plant-related A&G loading factor to yield the annualized plant costs. To these costs we added the associated O&M and A&G expenses and the revenue requirements for working capital.
The computation of working capital includes components for cash, materials, supplies and prepayments. The working capital needs were estimated based on recent historical amounts. The revenue requirement for this working capital is NP’s weighted average cost of capital plus an income tax component that recognizes that the equity portion of return on capital is taxable.
The schedules below present the annual marginal cost for higher voltage distribution, local distribution facilities, meters and services, respectively.
Schedule 17. Derivation of Annual Distribution Substation and Trunkline Feeder Costs
2007 Dollars per kW
(1) Marginal Investment per kW $49.05(2) With General Plant Loading (1) x 1.0796 52.95
(3) Annual Economic Carrying Charge Related toCapital Investment 6.48%
(4) A&G Loading (plant related) 0.78%(5) Total Annual Carrying Charge (3) + (4) 7.26%
(6) Annualized Costs (2) x (5) 3.84(7) O&M Expenses 2.68(8) With A&G Loading (7) x 1.6981 (Non-plant) 4.56
(9) Subtotal (6) + (8) 8.40
Working Capital(10) Material and Supplies (2) x 0.39% 0.21(11) Prepayments (2) x 0.12% 0.06(12) Cash Working Capital Allowance (8) x 6.21% 0.28(13) Total Working Capital (10) + (11) + (12) 0.55(14) Revenue Requirement for Working
Capital (13) x 9.50% 0.05
(15) Total Distribution Substation Costs (9) + (14) 8.45

NERA Economic Consulting
23
Schedule 18. Derivation of Annual Distribution Facilities Costs
Rate 1.1 Rate 2.1 Rate 2.2
Domestic Service
General Service 0-10
kW
General Service 10-
100 kW (110 kVa)
(1) (2) (3)
(1) Marginal Investment per kW $167.26 $173.62 $118.77(2) With General Plant Loading (1) x 1.0796 180.57 187.43 128.22
(3) Annual Economic Carrying Charge Related to Capital Investment 5.63% 5.63% 5.63%
(4) A&G Loading (plant-related) 0.70% 0.70% 0.70%(5) Total Annual Carrying Charge (3) + (4) 6.33% 6.33% 6.33%
(6) Annualized Costs (2) x (5) 11.43 11.87 8.12
(7) O&M Expense per kW 1.17 1.17 1.17(8) With A&G Loading (7) x 1.6981 1.99 1.99 1.99
(non-plant related)(9) Distribution Facilities Related Costs (6) + (8) 13.42 13.86 10.11
Working Capital(10) Material and Supplies (2) x 0.39% 0.70 0.73 0.50(11) Prepayments (2) x 0.12% 0.22 0.22 0.15(12) Cash Working Capital Allowance (8) x 6.21% 0.12 0.12 0.12(13) Total Working Capital (10) + (11) + (12) 1.04 1.08 0.78(14) Revenue Requirement for Working
Capital (13) x 9.50% 0.10 0.10 0.07
(15) Total Annual Marginal Distribution Facilities Related Costs (9) + (14) 13.52 13.96 10.18
------ (2007 Dollars per kVa) ----------

NERA Economic Consulting
24
Schedule 18 (II). Derivation of Annual Distribution Facilities Costs
Primary Secondary Primary Secondary
(1) (2) (3) (4)
(1) Marginal Investment per kW $16.27 $78.10 $5.42 $33.50(2) With General Plant Loading (1) x 1.0796 17.57 84.31 5.86 36.16
(3) Annual Economic Carrying Charge Related to Capital Investment 5.63% 5.63% 5.63% 5.63%
(4) A&G Loading (plant-related) 0.70% 0.70% 0.70% 0.70%(5) Total Annual Carrying Charge (3) + (4) 6.33% 6.33% 6.33% 6.33%
(6) Annualized Costs (2) x (5) 1.11 5.34 0.37 2.29
(7) O&M Expense per Weighted Customer 0.83 1.17 0.83 1.17(8) With A&G Loading (7) x 1.6981 1.40 1.99 1.40 1.99
(non-plant related)(9) Distribution Facilities Related Costs (6) + (8) 2.51 7.33 1.77 4.28
Working Capital(10) Material and Supplies (2) x 0.39% 0.07 0.33 0.02 0.14(11) Prepayments (2) x 0.12% 0.02 0.10 0.01 0.04(12) Cash Working Capital Allowance (8) x 6.21% 0.09 0.12 0.09 0.12(13) Total Working Capital (10) + (11) + (12) 0.18 0.55 0.12 0.31(14) Revenue Requirement for Working
Capital (13) x 9.50% 0.02 0.05 0.01 0.03
(15) Total Annual Marginal Distribution Facilities Related Costs (9) + (14) 2.53 7.38 1.78 4.31
Rate 2.4 - GS 1000 kVa and over
Rate 2.3 - GS 110-1000 kVa
------ (2007 Dollars per kVa) ----------
NERA Economic Consulting
25
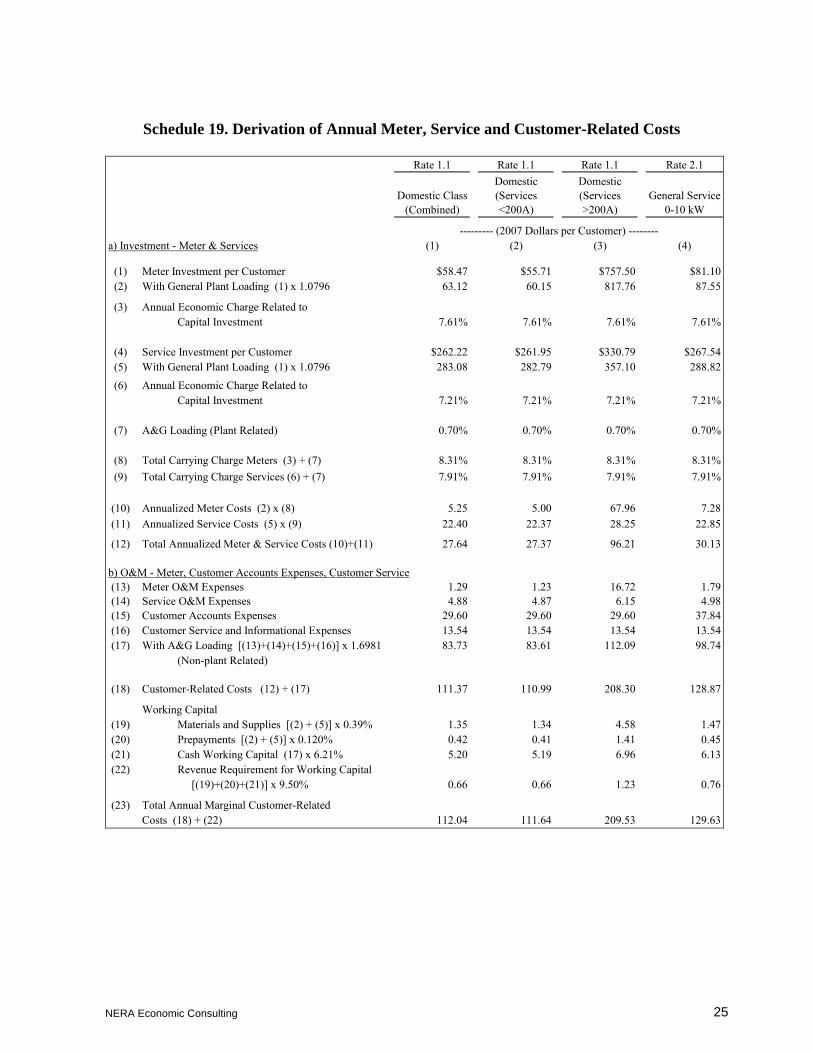
Schedule 19. Derivation of Annual Meter, Service and Customer-Related Costs
Rate 1.1 Rate 1.1 Rate 1.1 Rate 2.1
Domestic Class (Combined)
Domestic (Services <200A)
Domestic (Services >200A)
General Service 0-10 kW
--------- (2007 Dollars per Customer) --------a) Investment - Meter & Services (1) (2) (3) (4)
(1) Meter Investment per Customer $58.47 $55.71 $757.50 $81.10(2) With General Plant Loading (1) x 1.0796 63.12 60.15 817.76 87.55
(3) Annual Economic Charge Related toCapital Investment 7.61% 7.61% 7.61% 7.61%
(4) Service Investment per Customer $262.22 $261.95 $330.79 $267.54(5) With General Plant Loading (1) x 1.0796 283.08 282.79 357.10 288.82(6) Annual Economic Charge Related to
Capital Investment 7.21% 7.21% 7.21% 7.21%
(7) A&G Loading (Plant Related) 0.70% 0.70% 0.70% 0.70%
(8) Total Carrying Charge Meters (3) + (7) 8.31% 8.31% 8.31% 8.31%(9) Total Carrying Charge Services (6) + (7) 7.91% 7.91% 7.91% 7.91%
(10) Annualized Meter Costs (2) x (8) 5.25 5.00 67.96 7.28(11) Annualized Service Costs (5) x (9) 22.40 22.37 28.25 22.85
(12) Total Annualized Meter & Service Costs (10)+(11) 27.64 27.37 96.21 30.13
b) O&M - Meter, Customer Accounts Expenses, Customer Service(13) Meter O&M Expenses 1.29 1.23 16.72 1.79(14) Service O&M Expenses 4.88 4.87 6.15 4.98(15) Customer Accounts Expenses 29.60 29.60 29.60 37.84(16) Customer Service and Informational Expenses 13.54 13.54 13.54 13.54(17) With A&G Loading [(13)+(14)+(15)+(16)] x 1.6981 83.73 83.61 112.09 98.74
(Non-plant Related)
(18) Customer-Related Costs (12) + (17) 111.37 110.99 208.30 128.87
Working Capital(19) Materials and Supplies [(2) + (5)] x 0.39% 1.35 1.34 4.58 1.47(20) Prepayments [(2) + (5)] x 0.120% 0.42 0.41 1.41 0.45(21) Cash Working Capital (17) x 6.21% 5.20 5.19 6.96 6.13(22) Revenue Requirement for Working Capital
[(19)+(20)+(21)] x 9.50% 0.66 0.66 1.23 0.76
(23) Total Annual Marginal Customer-Related Costs (18) + (22) 112.04 111.64 209.53 129.63
NERA Economic Consulting
26
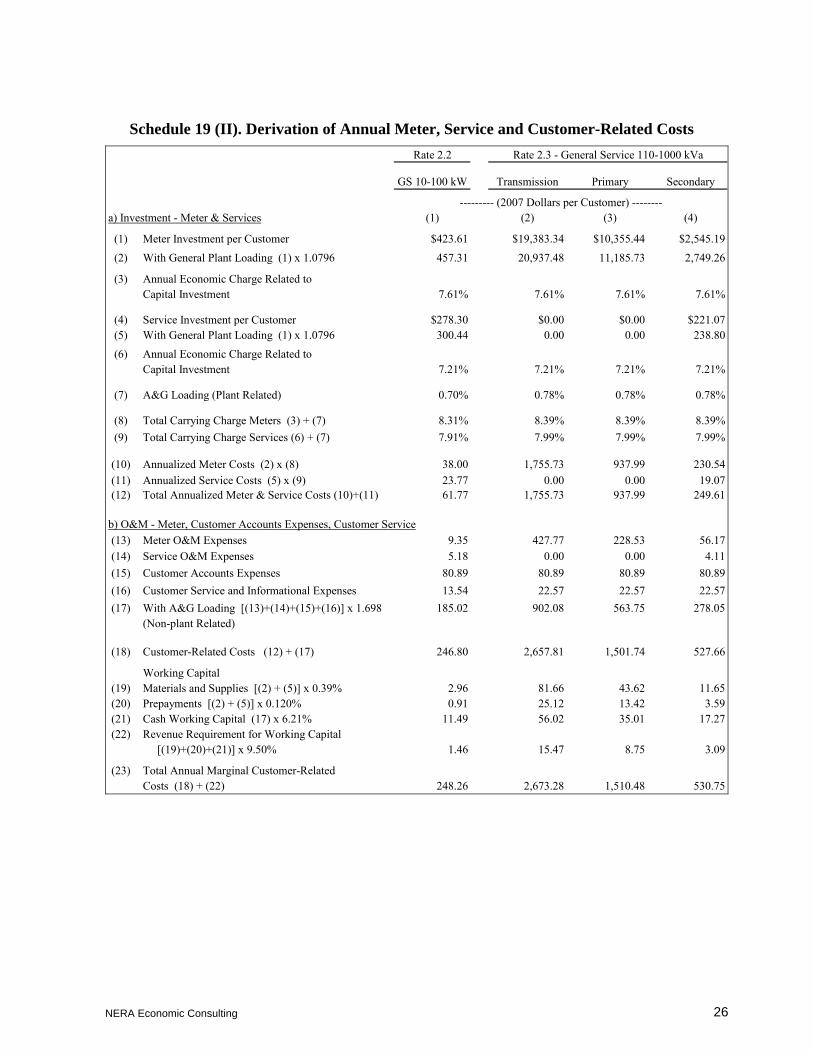
Schedule 19 (II). Derivation of Annual Meter, Service and Customer-Related Costs Rate 2.2
GS 10-100 kW Transmission Primary Secondary
--------- (2007 Dollars per Customer) --------a) Investment - Meter & Services (1) (2) (3) (4)
(1) Meter Investment per Customer $423.61 $19,383.34 $10,355.44 $2,545.19
(2) With General Plant Loading (1) x 1.0796 457.31 20,937.48 11,185.73 2,749.26
(3) Annual Economic Charge Related toCapital Investment 7.61% 7.61% 7.61% 7.61%
(4) Service Investment per Customer $278.30 $0.00 $0.00 $221.07(5) With General Plant Loading (1) x 1.0796 300.44 0.00 0.00 238.80
(6) Annual Economic Charge Related toCapital Investment 7.21% 7.21% 7.21% 7.21%
(7) A&G Loading (Plant Related) 0.70% 0.78% 0.78% 0.78%
(8) Total Carrying Charge Meters (3) + (7) 8.31% 8.39% 8.39% 8.39%(9) Total Carrying Charge Services (6) + (7) 7.91% 7.99% 7.99% 7.99%
(10) Annualized Meter Costs (2) x (8) 38.00 1,755.73 937.99 230.54(11) Annualized Service Costs (5) x (9) 23.77 0.00 0.00 19.07(12) Total Annualized Meter & Service Costs (10)+(11) 61.77 1,755.73 937.99 249.61
b) O&M - Meter, Customer Accounts Expenses, Customer Service(13) Meter O&M Expenses 9.35 427.77 228.53 56.17(14) Service O&M Expenses 5.18 0.00 0.00 4.11(15) Customer Accounts Expenses 80.89 80.89 80.89 80.89(16) Customer Service and Informational Expenses 13.54 22.57 22.57 22.57(17) With A&G Loading [(13)+(14)+(15)+(16)] x 1.698 185.02 902.08 563.75 278.05
(Non-plant Related)
(18) Customer-Related Costs (12) + (17) 246.80 2,657.81 1,501.74 527.66
Working Capital(19) Materials and Supplies [(2) + (5)] x 0.39% 2.96 81.66 43.62 11.65(20) Prepayments [(2) + (5)] x 0.120% 0.91 25.12 13.42 3.59(21) Cash Working Capital (17) x 6.21% 11.49 56.02 35.01 17.27(22) Revenue Requirement for Working Capital
[(19)+(20)+(21)] x 9.50% 1.46 15.47 8.75 3.09
(23) Total Annual Marginal Customer-Related Costs (18) + (22) 248.26 2,673.28 1,510.48 530.75
Rate 2.3 - General Service 110-1000 kVa
NERA Economic Consulting
27
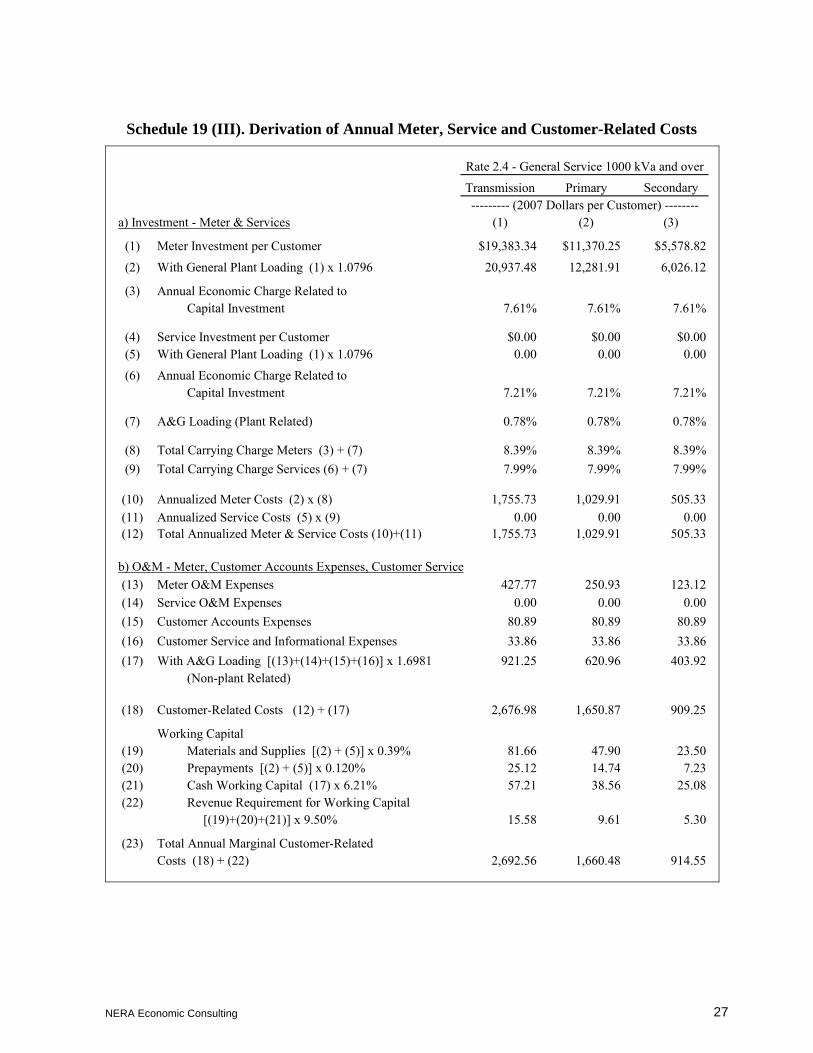
Schedule 19 (III). Derivation of Annual Meter, Service and Customer-Related Costs
Transmission Primary Secondary
a) Investment - Meter & Services (1) (2) (3)
(1) Meter Investment per Customer $19,383.34 $11,370.25 $5,578.82
(2) With General Plant Loading (1) x 1.0796 20,937.48 12,281.91 6,026.12
(3) Annual Economic Charge Related toCapital Investment 7.61% 7.61% 7.61%
(4) Service Investment per Customer $0.00 $0.00 $0.00(5) With General Plant Loading (1) x 1.0796 0.00 0.00 0.00(6) Annual Economic Charge Related to
Capital Investment 7.21% 7.21% 7.21%
(7) A&G Loading (Plant Related) 0.78% 0.78% 0.78%
(8) Total Carrying Charge Meters (3) + (7) 8.39% 8.39% 8.39%(9) Total Carrying Charge Services (6) + (7) 7.99% 7.99% 7.99%
(10) Annualized Meter Costs (2) x (8) 1,755.73 1,029.91 505.33(11) Annualized Service Costs (5) x (9) 0.00 0.00 0.00(12) Total Annualized Meter & Service Costs (10)+(11) 1,755.73 1,029.91 505.33
b) O&M - Meter, Customer Accounts Expenses, Customer Service(13) Meter O&M Expenses 427.77 250.93 123.12(14) Service O&M Expenses 0.00 0.00 0.00(15) Customer Accounts Expenses 80.89 80.89 80.89(16) Customer Service and Informational Expenses 33.86 33.86 33.86(17) With A&G Loading [(13)+(14)+(15)+(16)] x 1.6981 921.25 620.96 403.92
(Non-plant Related)
(18) Customer-Related Costs (12) + (17) 2,676.98 1,650.87 909.25
Working Capital(19) Materials and Supplies [(2) + (5)] x 0.39% 81.66 47.90 23.50(20) Prepayments [(2) + (5)] x 0.120% 25.12 14.74 7.23(21) Cash Working Capital (17) x 6.21% 57.21 38.56 25.08(22) Revenue Requirement for Working Capital
[(19)+(20)+(21)] x 9.50% 15.58 9.61 5.30
(23) Total Annual Marginal Customer-Related Costs (18) + (22) 2,692.56 1,660.48 914.55
--------- (2007 Dollars per Customer) --------
Rate 2.4 - General Service 1000 kVa and over
NERA Economic Consulting
28
VIII. MARGINAL GENERATION AND TRANSMISSION COSTS
A. Marginal Generation Costs
The Island interconnected system is planned and operated by NLH to minimize costs and provide reliable service under a full range of hydrological conditions. Marginal energy cost is a function of the dispatch of generating resources. In years when additional load triggers a capacity addition, the annualized cost of adding capacity, net of any fuel savings the added capacity would provide in other hours by displacing resources with higher operating costs, represents the marginal generation capacity cost. As a result, the marginal generation cost depends upon NLH’s generation expansion plans, and the forecast of system reliability that results from that plan.
While NLH develops its plans using a range of assumptions about hydrological conditions, NERA used the results based on expected water availability. The marginal cost study is a forward-looking exercise intended to provide cost estimates many years into the future. Obviously in real time, hydrological conditions might be better or worse than average, and total short-run marginal demand or energy costs correspondingly lower or higher.
NP’s marginal source of generation is NLH. For purposes of this study for NP, we used estimates of NHL’s marginal generation costs, computed using NLH’s base-case fuel price forecast, and averaged over the period 2007-11.
1. Marginal Energy Costs
NLH dispatches its hydro resources in order to:
Obtain the most energy from hydro production across the year (by minimizing the probability of spill and the need to operate thermal units, while maintaining the firm energy target);
Keep thermal units as close to their efficient operating levels as possible; and
Assist with system frequency and voltage control.
An additional kWh of energy consumed in a given hour generally leads to an additional kWh of hydro production in that hour (plus marginal energy losses), which is then replaced by thermal generation at Holyrood at a later time. Under most hydrological conditions, this replacement energy is produced at times when the thermal units are operating at high levels (when heat rates are the most efficient). As a consequence, NLH marginal energy costs exhibit no daily, weekly or seasonal variation. These estimates include fuel, variable O&M, expense-related overheads
NERA Economic Consulting
29
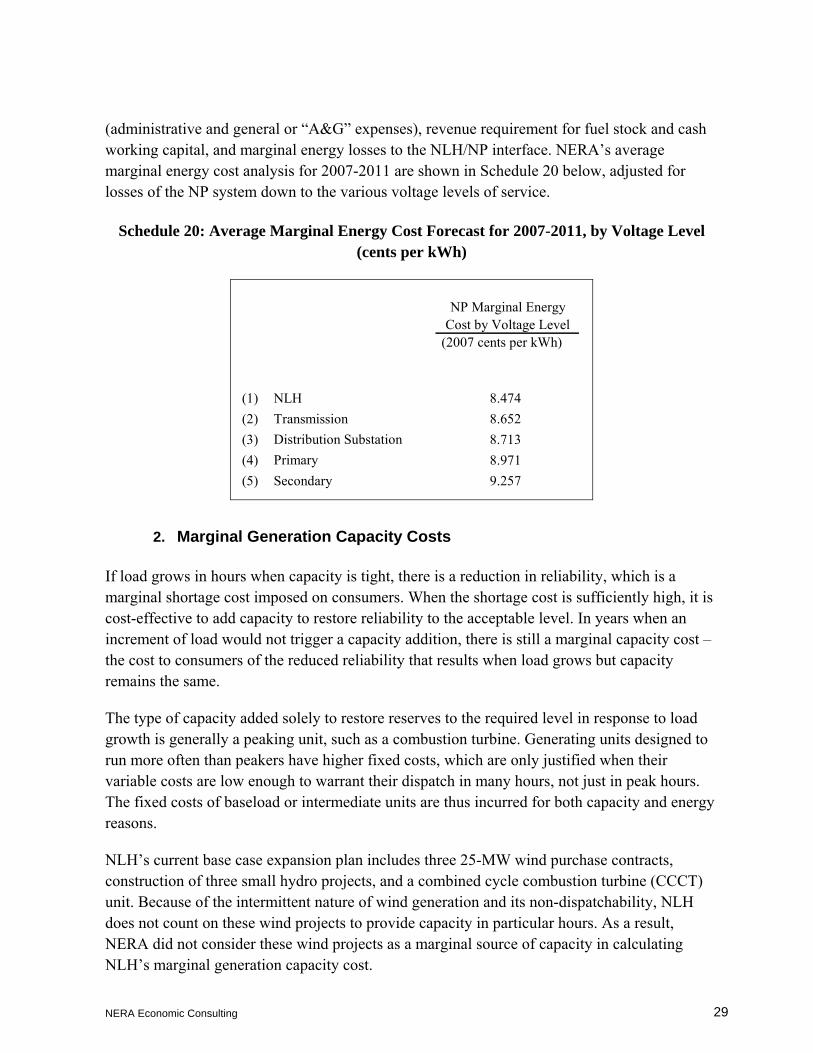
(administrative and general or “A&G” expenses), revenue requirement for fuel stock and cash working capital, and marginal energy losses to the NLH/NP interface. NERA’s average marginal energy cost analysis for 2007-2011 are shown in Schedule 20 below, adjusted for losses of the NP system down to the various voltage levels of service.
Schedule 20: Average Marginal Energy Cost Forecast for 2007-2011, by Voltage Level (cents per kWh)
NP Marginal EnergyCost by Voltage Level
(2007 cents per kWh)
(1) NLH 8.474(2) Transmission 8.652(3) Distribution Substation 8.713(4) Primary 8.971(5) Secondary 9.257
2. Marginal Generation Capacity Costs
If load grows in hours when capacity is tight, there is a reduction in reliability, which is a marginal shortage cost imposed on consumers. When the shortage cost is sufficiently high, it is cost-effective to add capacity to restore reliability to the acceptable level. In years when an increment of load would not trigger a capacity addition, there is still a marginal capacity cost – the cost to consumers of the reduced reliability that results when load grows but capacity remains the same.
The type of capacity added solely to restore reserves to the required level in response to load growth is generally a peaking unit, such as a combustion turbine. Generating units designed to run more often than peakers have higher fixed costs, which are only justified when their variable costs are low enough to warrant their dispatch in many hours, not just in peak hours. The fixed costs of baseload or intermediate units are thus incurred for both capacity and energy reasons.
NLH’s current base case expansion plan includes three 25-MW wind purchase contracts, construction of three small hydro projects, and a combined cycle combustion turbine (CCCT) unit. Because of the intermittent nature of wind generation and its non-dispatchability, NLH does not count on these wind projects to provide capacity in particular hours. As a result, NERA did not consider these wind projects as a marginal source of capacity in calculating NLH’s marginal generation capacity cost.
NERA Economic Consulting
30
We computed the annualized cost of each non-wind resource in the base case expansion plan. The per-kW investment costs of the hydro units and CCCT were adjusted for general plant, and annualized using an economic carrying charge that included an allowance for plant-related A&G. Fixed O&M, including non-plant-related A&G, and an allowance for working capital were added. The working capital factor includes cash, materials and supplies.
To yield a pure capacity cost, the annual costs per kW must be reduced by the annual average operating cost savings expected to be provided by a marginal kW of these non-peaking resources over their lives. The annual operating cost savings were computed, for each resource, by multiplying the expected hours of operation in each full year of operation, by the difference between the expected Holyrood marginal running costs per kWh15 and the running cost per kWh of the capacity addition in that year.16 These annual operating cost savings were then averaged over the expected service life of the unit.17 This crediting of the annual fixed costs of the marginal kW for the average annual operating cost savings recognizes that the last kW added to the system is required to meet marginal load only in a single (or very few) hours of the year.18 If the unit runs in other hours, that is because it displaces a resource with higher running costs.
As an estimate of the net capacity of cost of a generic hydro unit, NERA averaged the results for the three hydro additions, weighting them by installed capacity. In the case of the CCCT, the unit is expected to operate at the margin (in the years included in the study) and thus generates no fuel savings. The cost estimate was adjusted to incorporate marginal demand losses through NLH’s system.
The annual costs must then be time-differentiated. NLH’s system planning model produces estimates of LOLH for each month. NERA used the relative LOLH in each month, aggregated to seasons and averaged over the period 2007-2011, to compute generation capacity costs by the seasonal costing periods.19 Within a month, capacity costs were assigned to hours based on each hour type’s relative probability of being the peak hour of the month.20 These results were also aggregated over the months in a season. Schedule 21 shows the resulting NLH marginal
15 NLH estimates that the Holyrood efficiency in these particular hours is between the average value of 630
kWh/BBL and the marginal value of 688 kWh/BBL. The marginal fuel cost is then fuel cost per BBL divided by efficiency. Variable O&M and working capital were also included in the operating cost savings calculations.
16 The running costs of the hydro units were assumed be to zero. 17 When necessary the 2006 fuel price forecasts and hours run were used in subsequent years. 18 The annual fixed cost is calculated on a real-levelized basis. All calculations are done in 2007 Canadian dollars. 19 The seasonal relative LOLH values are essentially unchanged for the entire period, 2007-2025. 20 The hour types are the 24 hours in weekdays, Saturdays, and Sundays.
NERA Economic Consulting
31
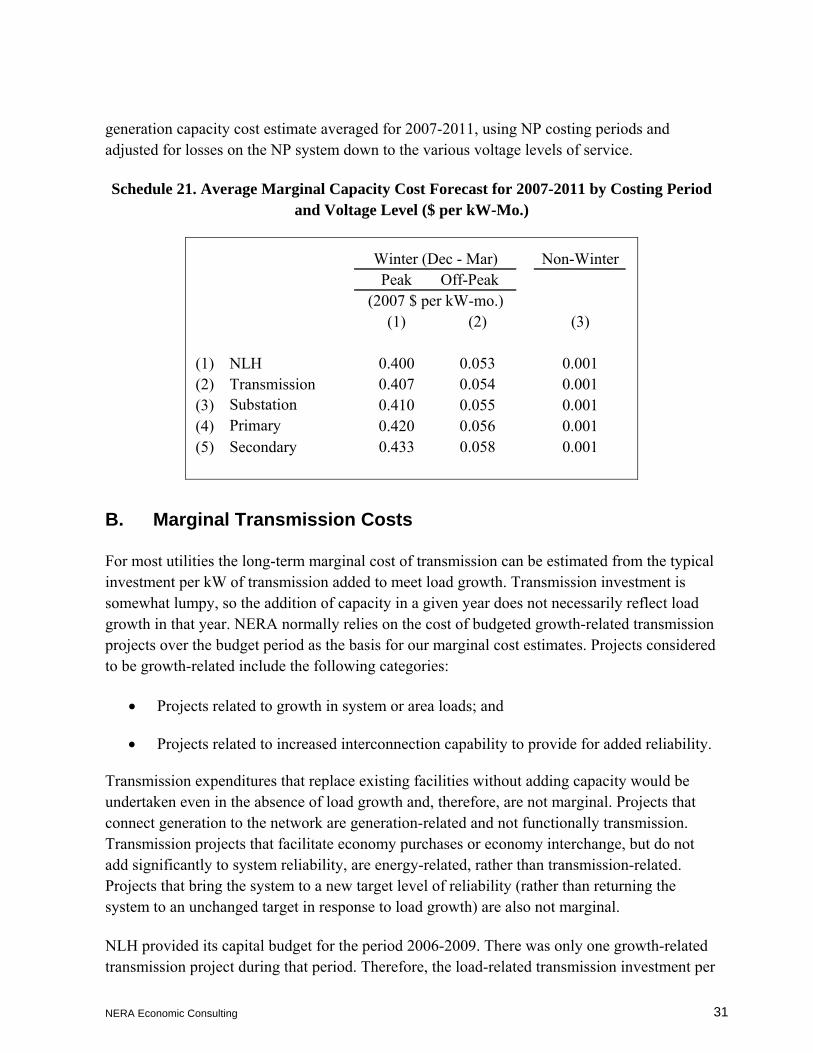
generation capacity cost estimate averaged for 2007-2011, using NP costing periods and adjusted for losses on the NP system down to the various voltage levels of service.
Schedule 21. Average Marginal Capacity Cost Forecast for 2007-2011 by Costing Period and Voltage Level ($ per kW-Mo.)
Winter (Dec - Mar) Non-WinterPeak Off-Peak
(2007 $ per kW-mo.)(1) (2) (3)
(1) NLH 0.400 0.053 0.001(2) Transmission 0.407 0.054 0.001(3) Substation 0.410 0.055 0.001(4) Primary 0.420 0.056 0.001(5) Secondary 0.433 0.058 0.001
B. Marginal Transmission Costs
For most utilities the long-term marginal cost of transmission can be estimated from the typical investment per kW of transmission added to meet load growth. Transmission investment is somewhat lumpy, so the addition of capacity in a given year does not necessarily reflect load growth in that year. NERA normally relies on the cost of budgeted growth-related transmission projects over the budget period as the basis for our marginal cost estimates. Projects considered to be growth-related include the following categories:
• Projects related to growth in system or area loads; and
• Projects related to increased interconnection capability to provide for added reliability.
Transmission expenditures that replace existing facilities without adding capacity would be undertaken even in the absence of load growth and, therefore, are not marginal. Projects that connect generation to the network are generation-related and not functionally transmission. Transmission projects that facilitate economy purchases or economy interchange, but do not add significantly to system reliability, are energy-related, rather than transmission-related. Projects that bring the system to a new target level of reliability (rather than returning the system to an unchanged target in response to load growth) are also not marginal.
NLH provided its capital budget for the period 2006-2009. There was only one growth-related transmission project during that period. Therefore, the load-related transmission investment per

NERA Economic Consulting
32
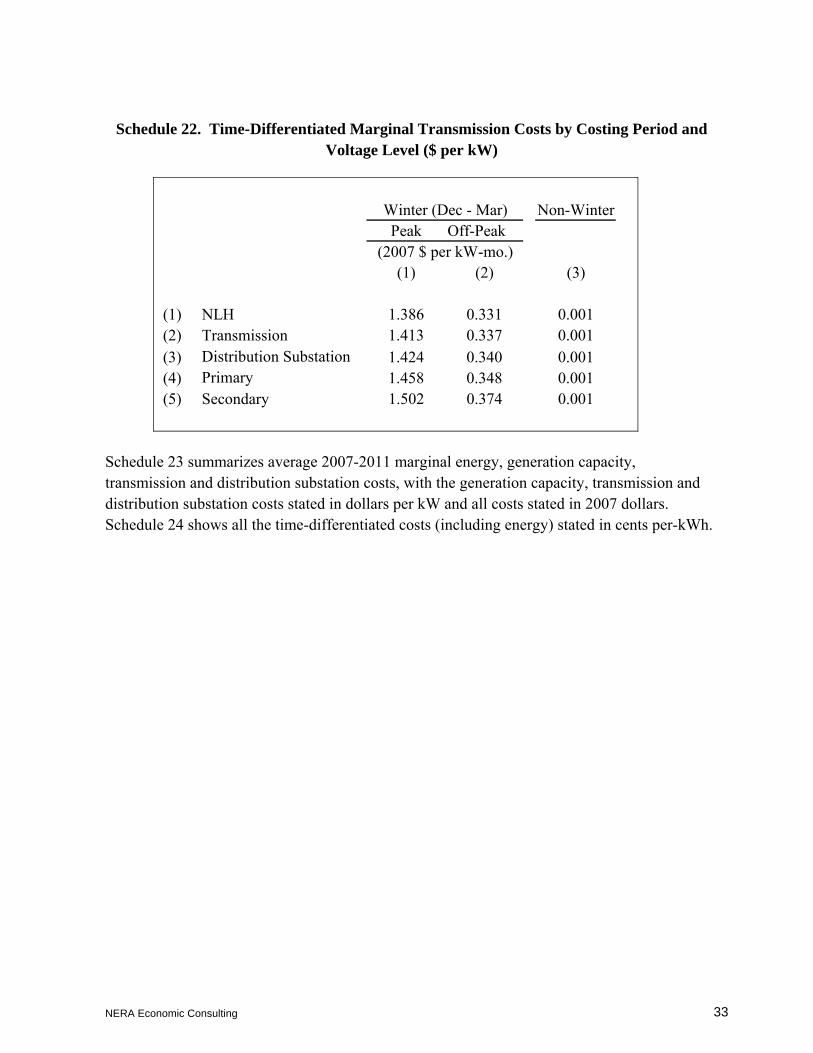
kW of load growth in the budget period might not be representative. We decided that using a combination of historical and budget information better align expenditures with load growth causing them. Therefore we reviewed projects during the historical period as well (2001-2005) and found that growth-related investment was made in 2002 and 2003.21 We estimated the investment in growth-related transmission per kW of load growth over the period 2002-2009. We assumed that this value is representative of marginal transmission investment over the full forecast period, 2006-2025. When load growth requires transmission investment, marginal transmission O&M expenses are also incurred. Because the growth-related projects involve substations rather than lines, we began with an analysis of NLH’s average level of transmission substation O&M expenses in the recent past as a guide for estimating marginal O&M costs. O&M expenses for 2000 to 2004 were first converted into 2007 dollars. These constant dollar values were then divided by kilowatts of weather-normalized peak load at the transmission level. The expenses per kW have declined significantly in recent years, so we used the 2003-2004 average as our estimate of marginal transmission O&M expenses. Transmission capacity is sized to handle annual peak demands on the transmission system. NERA used the estimated relative probability of annual transmission system peak, based on five years of historical hourly transmission loads,22 to time-differentiate transmission marginal costs. The reduced carrying capability of transmission facilities in periods of high ambient temperature is taken into account in these calculations. Schedule 22, line (1) shows marginal transmission costs by NP costing periods and adjusted for distribution losses through the NP system.
21 The bulk of the projects were not growth-related. On the interconnected Island grid, growth-related projects are
very limited because work on the 230 kV bulk system, which was constructed in the late 1960s, is now typically driven by issues other than load growth.
22 From years 2000 to 2004.
NERA Economic Consulting
33
Schedule 22. Time-Differentiated Marginal Transmission Costs by Costing Period and Voltage Level ($ per kW)
Winter (Dec - Mar) Non-WinterPeak Off-Peak
(2007 $ per kW-mo.)(1) (2) (3)
(1) NLH 1.386 0.331 0.001(2) Transmission 1.413 0.337 0.001(3) Distribution Substation 1.424 0.340 0.001(4) Primary 1.458 0.348 0.001(5) Secondary 1.502 0.374 0.001
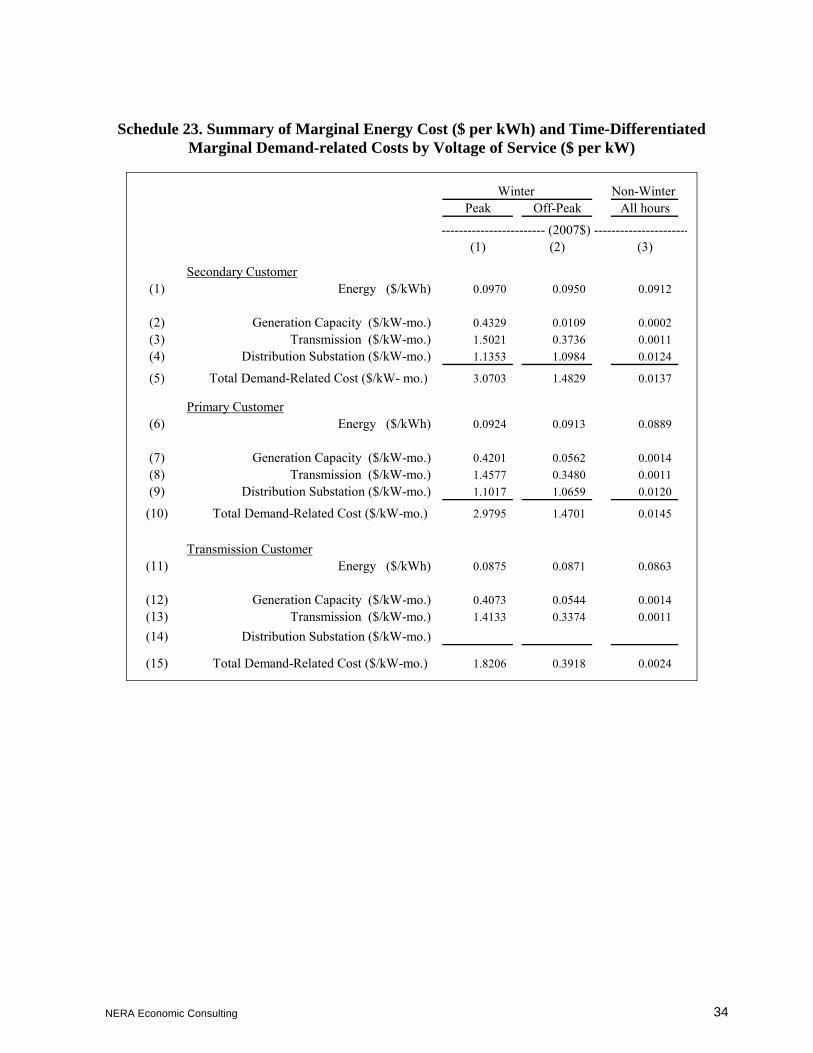
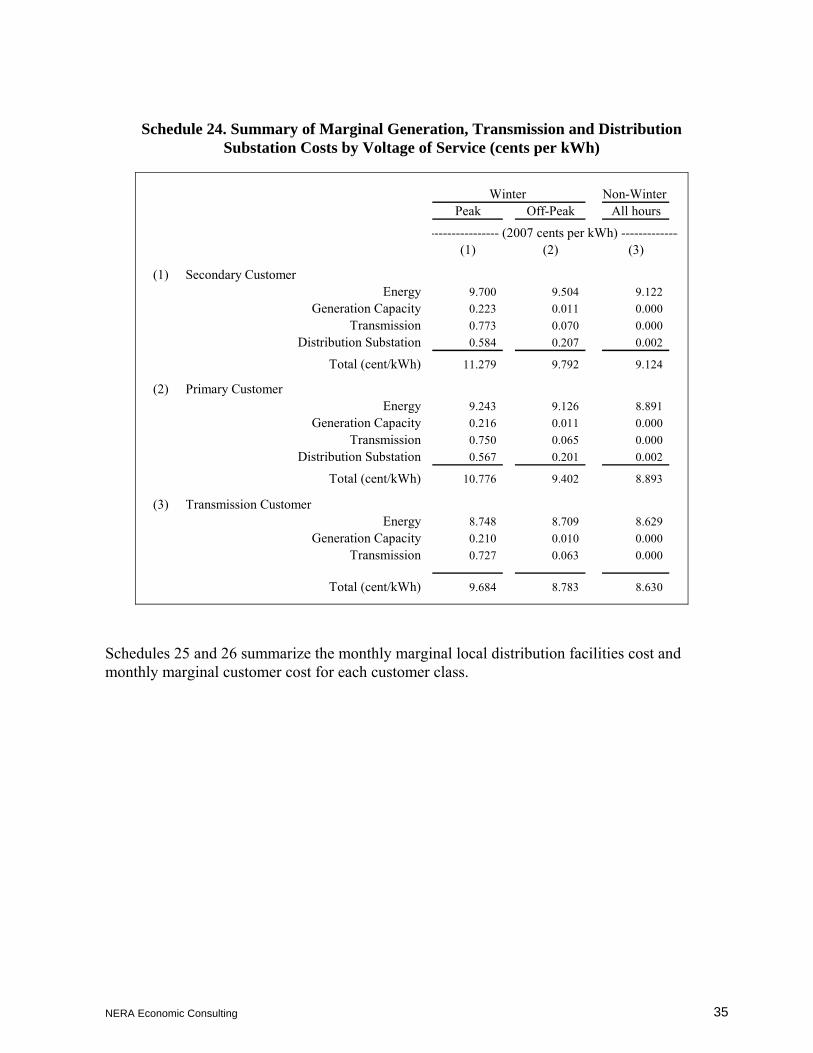
Schedule 23 summarizes average 2007-2011 marginal energy, generation capacity, transmission and distribution substation costs, with the generation capacity, transmission and distribution substation costs stated in dollars per kW and all costs stated in 2007 dollars. Schedule 24 shows all the time-differentiated costs (including energy) stated in cents per-kWh.
NERA Economic Consulting
34
Schedule 23. Summary of Marginal Energy Cost ($ per kWh) and Time-Differentiated Marginal Demand-related Costs by Voltage of Service ($ per kW)
Winter Non-Winter Peak Off-Peak All hours
(1) (2) (3)
Secondary Customer(1) Energy ($/kWh) 0.0970 0.0950 0.0912
(2) Generation Capacity ($/kW-mo.) 0.4329 0.0109 0.0002(3) Transmission ($/kW-mo.) 1.5021 0.3736 0.0011(4) Distribution Substation ($/kW-mo.) 1.1353 1.0984 0.0124
(5) Total Demand-Related Cost ($/kW- mo.) 3.0703 1.4829 0.0137
Primary Customer(6) Energy ($/kWh) 0.0924 0.0913 0.0889
(7) Generation Capacity ($/kW-mo.) 0.4201 0.0562 0.0014(8) Transmission ($/kW-mo.) 1.4577 0.3480 0.0011(9) Distribution Substation ($/kW-mo.) 1.1017 1.0659 0.0120
(10) Total Demand-Related Cost ($/kW-mo.) 2.9795 1.4701 0.0145
Transmission Customer(11) Energy ($/kWh) 0.0875 0.0871 0.0863
(12) Generation Capacity ($/kW-mo.) 0.4073 0.0544 0.0014(13) Transmission ($/kW-mo.) 1.4133 0.3374 0.0011
(14) Distribution Substation ($/kW-mo.)
(15) Total Demand-Related Cost ($/kW-mo.) 1.8206 0.3918 0.0024
------------------------ (2007$) ----------------------
NERA Economic Consulting
35
Schedule 24. Summary of Marginal Generation, Transmission and Distribution Substation Costs by Voltage of Service (cents per kWh)
Winter Non-Winter Peak Off-Peak All hours
(1) (2) (3)
(1) Secondary CustomerEnergy 9.700 9.504 9.122
Generation Capacity 0.223 0.011 0.000Transmission 0.773 0.070 0.000
Distribution Substation 0.584 0.207 0.002
Total (cent/kWh) 11.279 9.792 9.124
(2) Primary CustomerEnergy 9.243 9.126 8.891
Generation Capacity 0.216 0.011 0.000Transmission 0.750 0.065 0.000
Distribution Substation 0.567 0.201 0.002
Total (cent/kWh) 10.776 9.402 8.893
(3) Transmission CustomerEnergy 8.748 8.709 8.629
Generation Capacity 0.210 0.010 0.000Transmission 0.727 0.063 0.000
Total (cent/kWh) 9.684 8.783 8.630
---------------- (2007 cents per kWh) --------------
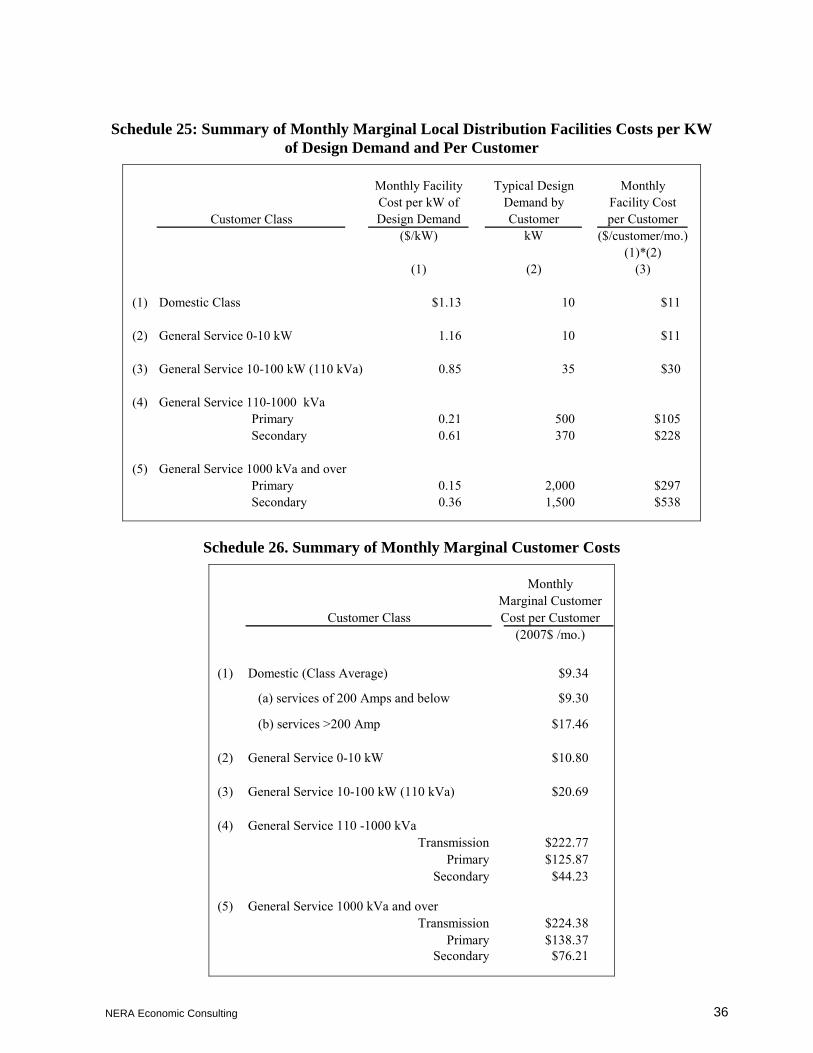
Schedules 25 and 26 summarize the monthly marginal local distribution facilities cost and monthly marginal customer cost for each customer class.
NERA Economic Consulting
36
Schedule 25: Summary of Monthly Marginal Local Distribution Facilities Costs per KW of Design Demand and Per Customer
Customer Class
Monthly Facility Cost per kW of Design Demand
Typical Design Demand by Customer
Monthly Facility Costper Customer
($/kW) kW ($/customer/mo.)(1)*(2)
(1) (2) (3)
(1) Domestic Class $1.13 10 $11
(2) General Service 0-10 kW 1.16 10 $11
(3) General Service 10-100 kW (110 kVa) 0.85 35 $30
(4) General Service 110-1000 kVaPrimary 0.21 500 $105Secondary 0.61 370 $228
(5) General Service 1000 kVa and overPrimary 0.15 2,000 $297Secondary 0.36 1,500 $538
Schedule 26. Summary of Monthly Marginal Customer Costs
MonthlyMarginal Customer
Customer Class Cost per Customer(2007$ /mo.)
(1) Domestic (Class Average) $9.34
(a) services of 200 Amps and below $9.30
(b) services >200 Amp $17.46
(2) General Service 0-10 kW $10.80
(3) General Service 10-100 kW (110 kVa) $20.69
(4) General Service 110 -1000 kVaTransmission $222.77
Primary $125.87Secondary $44.23
(5) General Service 1000 kVa and overTransmission $224.38
Primary $138.37Secondary $76.21
NERA Economic Consulting
37
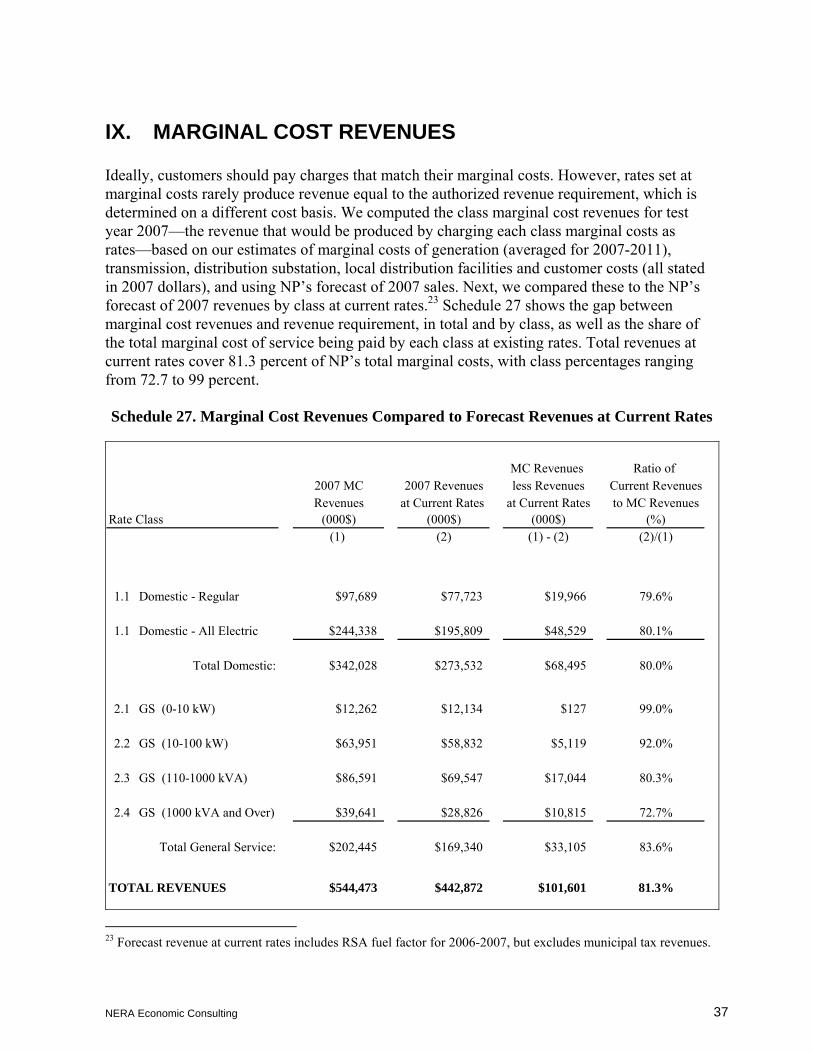
IX. MARGINAL COST REVENUES
Ideally, customers should pay charges that match their marginal costs. However, rates set at marginal costs rarely produce revenue equal to the authorized revenue requirement, which is determined on a different cost basis. We computed the class marginal cost revenues for test year 2007—the revenue that would be produced by charging each class marginal costs as rates—based on our estimates of marginal costs of generation (averaged for 2007-2011), transmission, distribution substation, local distribution facilities and customer costs (all stated in 2007 dollars), and using NP’s forecast of 2007 sales. Next, we compared these to the NP’s forecast of 2007 revenues by class at current rates.23 Schedule 27 shows the gap between marginal cost revenues and revenue requirement, in total and by class, as well as the share of the total marginal cost of service being paid by each class at existing rates. Total revenues at current rates cover 81.3 percent of NP’s total marginal costs, with class percentages ranging from 72.7 to 99 percent.
Schedule 27. Marginal Cost Revenues Compared to Forecast Revenues at Current Rates
MC Revenues Ratio of 2007 MC 2007 Revenues less Revenues Current RevenuesRevenues at Current Rates at Current Rates to MC Revenues
Rate Class (000$) (000$) (000$) (%)(1) (2) (1) - (2) (2)/(1)
1.1 Domestic - Regular $97,689 $77,723 $19,966 79.6%
1.1 Domestic - All Electric $244,338 $195,809 $48,529 80.1%
Total Domestic: $342,028 $273,532 $68,495 80.0%
2.1 GS (0-10 kW) $12,262 $12,134 $127 99.0%
2.2 GS (10-100 kW) $63,951 $58,832 $5,119 92.0%
2.3 GS (110-1000 kVA) $86,591 $69,547 $17,044 80.3%
2.4 GS (1000 kVA and Over) $39,641 $28,826 $10,815 72.7%
Total General Service: $202,445 $169,340 $33,105 83.6%
TOTAL REVENUES $544,473 $442,872 $101,601 81.3%
23 Forecast revenue at current rates includes RSA fuel factor for 2006-2007, but excludes municipal tax revenues.

NERA Economic Consulting
38
Jurisdictions that use marginal costs as the basis for allocation of revenue requirement to classes often use the “equi-proportional marginal cost” (EPMC) approach to close the marginal cost revenue gap. This means setting each class’ revenue requirement at the same percent of its marginal cost revenues (79 percent in Schedule 27). However, it is sometimes more efficient to deviate from the strict EPMC revenue allocations when customers in some classes are more price-responsive than others. The “inverse elasticity” approach makes larger percentage adjustments to marginal cost revenues for classes that are less price-responsive (i.e., have lower demand elasticity) and smaller percentage adjustments for classes that are more price-responsive.